california small hydropower and ocean wave energy resources
TRANSCRIPT
California Small Hydropower and Ocean Wave Energy Resources IN SUPPORT OF THE 2005 INTEGRATED ENERGY POLICY REPORT
Mike Kane PIER Renewables Energy Research and Development Division California Energy Commission Presented at: California Energy Commission Sacramento, California May 9, 2005
ST
AFF
PA
PER
DISCLAIMER
This paper was prepared as the result of work by a member of the staff of the California Energy Commission. It does not necessarily represent the views of the Energy Commission, its employees, or the State of California. The Energy Commission, the State of California, its employees, contractors and subcontractors make no warrant, express or implied, and assume no legal liability for the information in this paper; nor does any party represent that the uses of this information will not infringe upon privately owned rights. This paper has not been approved or disapproved by the California Energy Commission nor has the California Energy Commission passed upon the accuracy or adequacy of the information in this paper.
APRIL 2005
CEC-500-2005-074

i
Table of Contents
List of Tables ................................................................................................................ ii List of Figures ............................................................................................................... ii Abstract ......................................................................................................................... 1 Introduction ................................................................................................................... 2 Impoundments and Natural Waterways..................................................................... 2 Man-Made Conduit Resources ................................................................................... 7
Navigant’s Estimation Methodology ....................................................................... 7 Results....................................................................................................................... 9
Ocean Wave Energy.................................................................................................. 14 Methodology ........................................................................................................... 14 Results..................................................................................................................... 15
Description of Technologies...................................................................................... 20 Hydropower............................................................................................................. 20 Wave Energy Conversion Technology ................................................................. 21
ii
List of Tables Table 1 California Small Hydropower And Ocean Wave Energy Resources Table 2 California Undeveloped Hydropower Potential Table 3 California HES-modeled Small Hydropower Potential Table 4 Estimated Small Hydropower Annual Energy Production Table 5 Small Hydropower Potential by County Table 6 Extrapolated Statewide Conduit Small Hydropower Resources by
Region and Type Table 7 Total Kilowatts and Kilowatt-hours by County Table 8 Raw Wave Power Potential near On-shore Load Centers Table 9 Ocean Wave Energy Generation Potential Table 10 Turbine Technology vs. Head Range List of Figures Figure 1 Potential HES-modeled Hydropower Sites Figure 2 Small Hydropower Potential by Sector Figure 3 Small Hydropower Potential by Region Figure 4 RPS-eligible Small Hydropower Sites Figure 5 Geographic Distribution of Ocean Wave Energy Resources Figure 6 California Wave Energy Potential--Mainland Figure 7 Overtopping Principle Figure 8 Buoyant Moored Devices Figure 9 Oscillating Water Column Principle
1
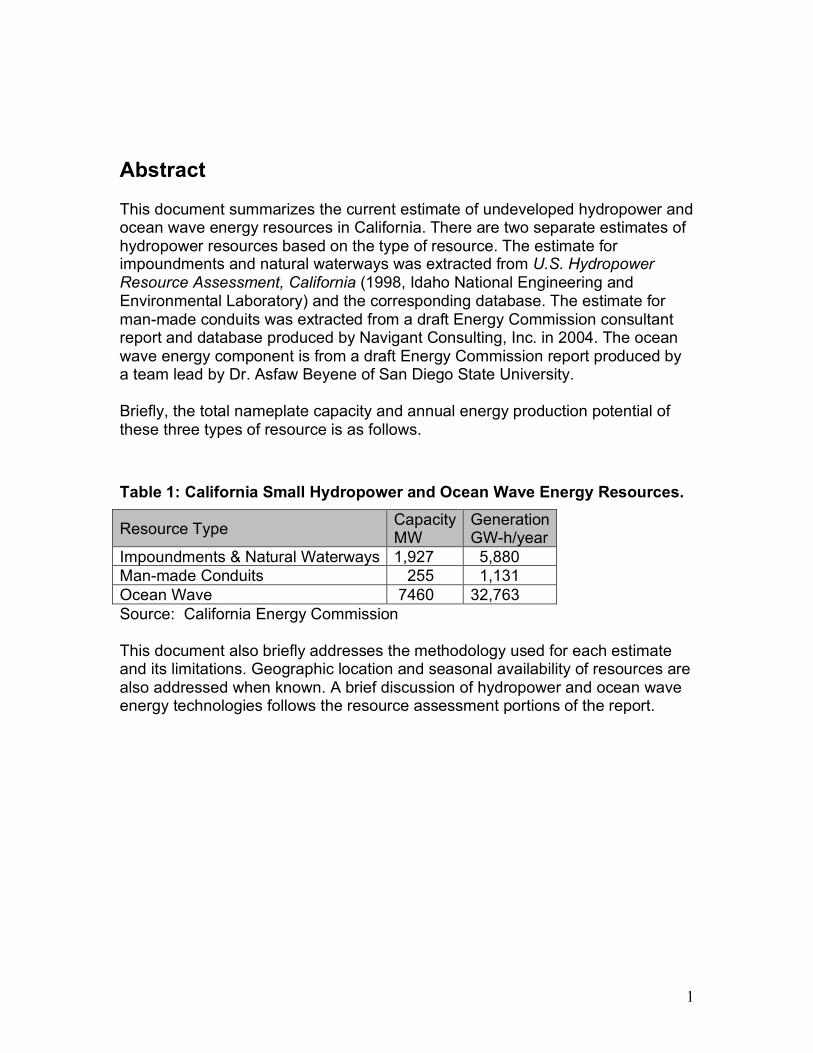
Abstract This document summarizes the current estimate of undeveloped hydropower and ocean wave energy resources in California. There are two separate estimates of hydropower resources based on the type of resource. The estimate for impoundments and natural waterways was extracted from U.S. Hydropower Resource Assessment, California (1998, Idaho National Engineering and Environmental Laboratory) and the corresponding database. The estimate for man-made conduits was extracted from a draft Energy Commission consultant report and database produced by Navigant Consulting, Inc. in 2004. The ocean wave energy component is from a draft Energy Commission report produced by a team lead by Dr. Asfaw Beyene of San Diego State University. Briefly, the total nameplate capacity and annual energy production potential of these three types of resource is as follows. Table 1: California Small Hydropower and Ocean Wave Energy Resources.
Resource Type Capacity MW
Generation GW-h/year
Impoundments & Natural Waterways 1,927 5,880 Man-made Conduits 255 1,131 Ocean Wave 7460 32,763 Source: California Energy Commission This document also briefly addresses the methodology used for each estimate and its limitations. Geographic location and seasonal availability of resources are also addressed when known. A brief discussion of hydropower and ocean wave energy technologies follows the resource assessment portions of the report.
2
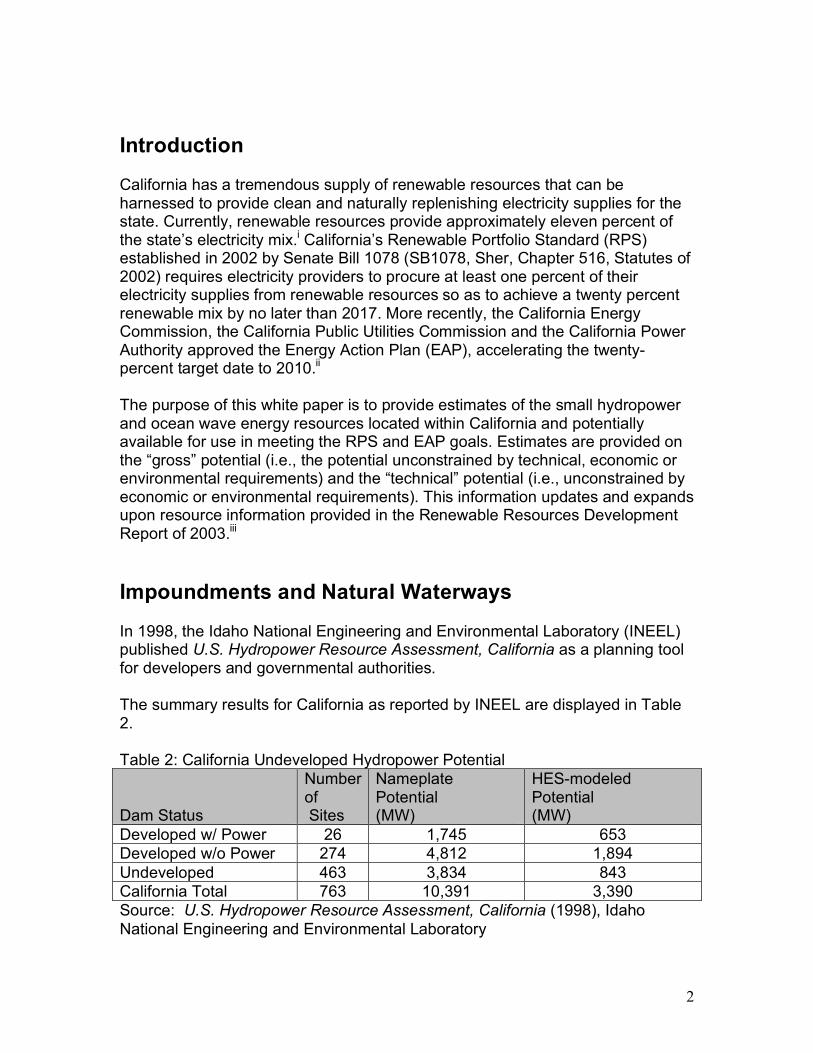
Introduction California has a tremendous supply of renewable resources that can be harnessed to provide clean and naturally replenishing electricity supplies for the state. Currently, renewable resources provide approximately eleven percent of the state’s electricity mix.i California’s Renewable Portfolio Standard (RPS) established in 2002 by Senate Bill 1078 (SB1078, Sher, Chapter 516, Statutes of 2002) requires electricity providers to procure at least one percent of their electricity supplies from renewable resources so as to achieve a twenty percent renewable mix by no later than 2017. More recently, the California Energy Commission, the California Public Utilities Commission and the California Power Authority approved the Energy Action Plan (EAP), accelerating the twenty- percent target date to 2010.ii The purpose of this white paper is to provide estimates of the small hydropower and ocean wave energy resources located within California and potentially available for use in meeting the RPS and EAP goals. Estimates are provided on the “gross” potential (i.e., the potential unconstrained by technical, economic or environmental requirements) and the “technical” potential (i.e., unconstrained by economic or environmental requirements). This information updates and expands upon resource information provided in the Renewable Resources Development Report of 2003.iii Impoundments and Natural Waterways In 1998, the Idaho National Engineering and Environmental Laboratory (INEEL) published U.S. Hydropower Resource Assessment, California as a planning tool for developers and governmental authorities. The summary results for California as reported by INEEL are displayed in Table 2. Table 2: California Undeveloped Hydropower Potential
Dam Status
Number of Sites
Nameplate Potential (MW)
HES-modeled Potential (MW)
Developed w/ Power 26 1,745 653 Developed w/o Power 274 4,812 1,894 Undeveloped 463 3,834 843 California Total 763 10,391 3,390 Source: U.S. Hydropower Resource Assessment, California (1998), Idaho National Engineering and Environmental Laboratory

3
The 763 potential projects identified by the INEEL report are broken down by dam status into three classifications:
• Developed with Power: These sites currently have power generation, but total power potential is not fully developed. Only the undeveloped potential is considered.
• Developed without Power: These sites have either a developed impoundment or a diversion structure, but have no developed generating capacity.
• Undeveloped: These sites have no generating capacity, developed impoundment or diversion structure.
Site data was reduced to a useable estimate using the Hydropower Evaluation Software (HES) model, a combination computer database and probability-factor calculator. The HES was used to reduce the 19 Project Environmental Suitability Factors (PESF) for each site into a single composite value, and then applied it to the gross physical (nameplate) potential to produce the HES-modeled potential. The HES-modeled capacity at any given site does not necessarily correspond to the developable capacity at that site. Indeed, the actual additional capacity available at a site corresponds is its nameplate capacity. The HES-modeled potential reflects the weighted value a site will contribute to an overall estimate of hydropower that can likely be developed on a statewide or region-wide basis given the environmental hurdles it is likely to encounter. For more information regarding the HES model and PESF definition criteria, consult the Hydropower Estimation Software Handbook available on the INEEL website. Table 2 does not distinguish between small and large hydropower sites. The table includes developed sites with more than 30 megawatts (MW) existing generation, developed sites with more than 30 MW combined potential and existing generation, and undeveloped sites with more than 30 MW potential capacity. Because California defines small hydropower as 30 MW or less, to qualify as small hydropower, it was assumed that no site could exceed 30 MW combined existing generation and undeveloped potential. Using that assumption, California’s small hydropower potential was determined as follows:
• Each project in the INEEL database was treated as a separate site. • For undeveloped sites and developed sites without power, the small hydro
potential was the lesser of the HES-modeled potential or 30 MW. • The installed capacity was determined for each of the sites with currently
installed power by cross-referencing to the California power plants database or other sources. If the installed power was greater than or equal to 30 MW, the potential for that site was set to zero and the site was eliminated from the list. Otherwise, the potential was taken to be the lesser of the HES-modeled potential or the residual portion thereof that would bring the total installed capacity to 30 MW at that site.
4
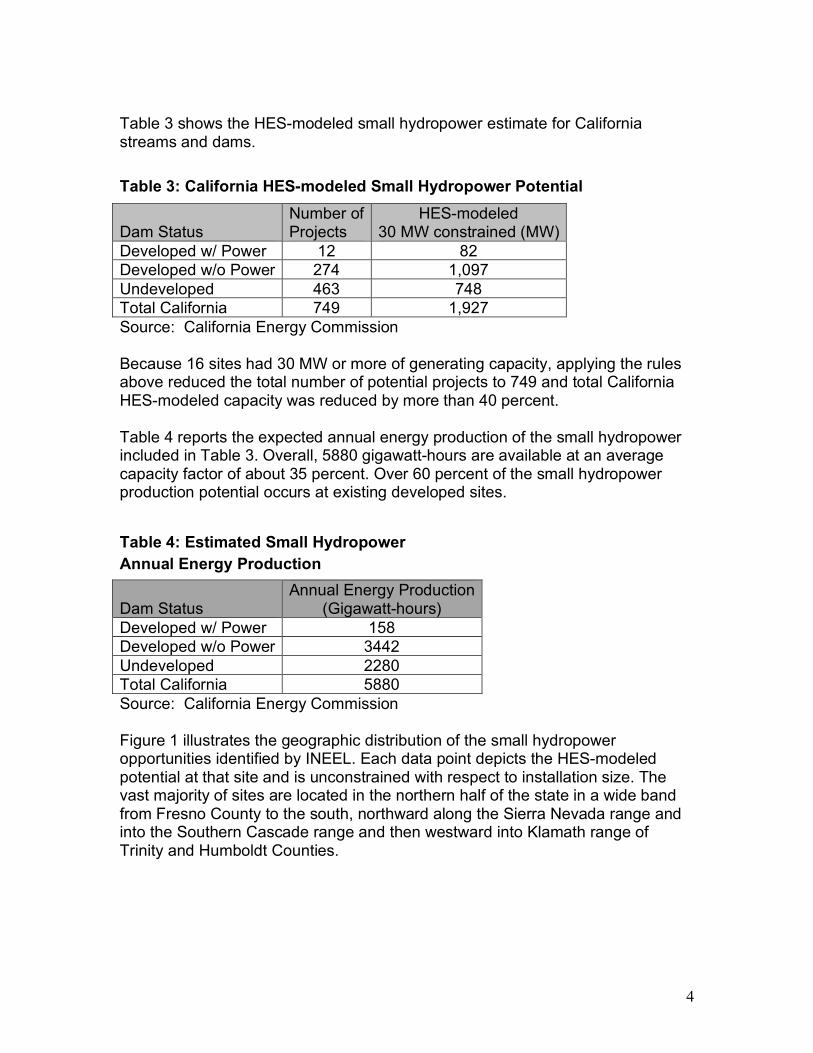
Table 3 shows the HES-modeled small hydropower estimate for California streams and dams. Table 3: California HES-modeled Small Hydropower Potential
Dam Status Number of Projects
HES-modeled 30 MW constrained (MW)
Developed w/ Power 12 82 Developed w/o Power 274 1,097 Undeveloped 463 748 Total California 749 1,927 Source: California Energy Commission Because 16 sites had 30 MW or more of generating capacity, applying the rules above reduced the total number of potential projects to 749 and total California HES-modeled capacity was reduced by more than 40 percent. Table 4 reports the expected annual energy production of the small hydropower included in Table 3. Overall, 5880 gigawatt-hours are available at an average capacity factor of about 35 percent. Over 60 percent of the small hydropower production potential occurs at existing developed sites. Table 4: Estimated Small Hydropower Annual Energy Production
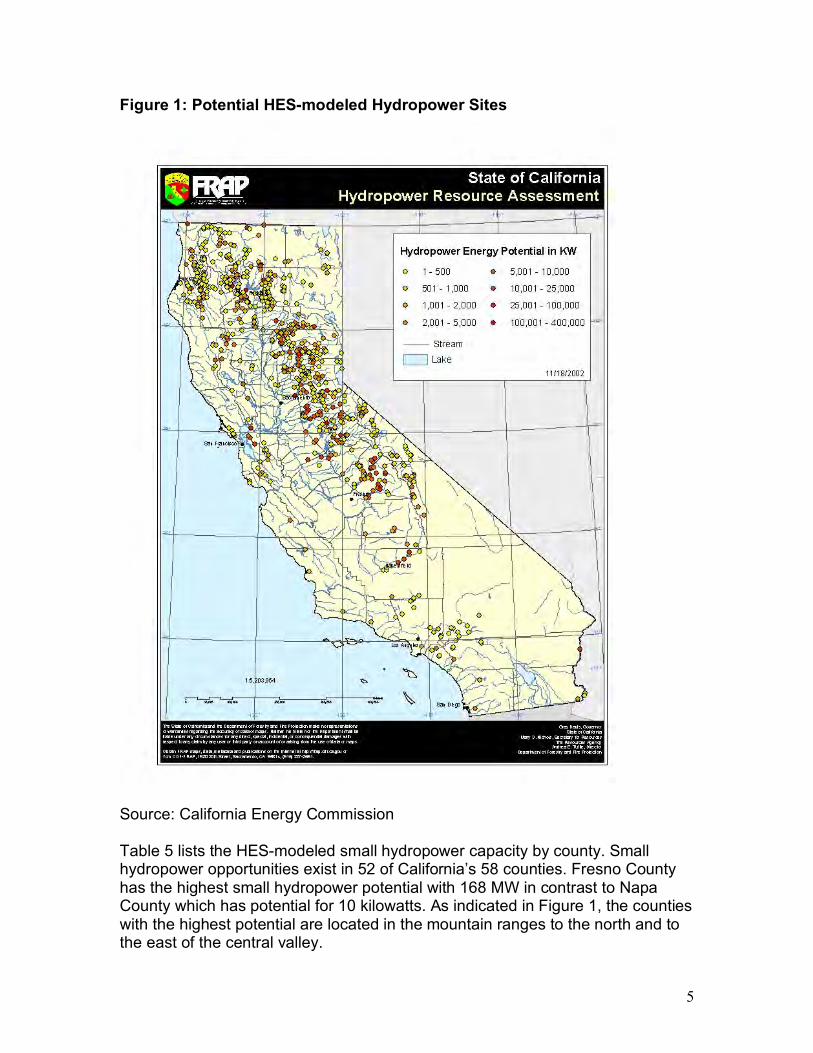
Source: California Energy Commission Figure 1 illustrates the geographic distribution of the small hydropower opportunities identified by INEEL. Each data point depicts the HES-modeled potential at that site and is unconstrained with respect to installation size. The vast majority of sites are located in the northern half of the state in a wide band from Fresno County to the south, northward along the Sierra Nevada range and into the Southern Cascade range and then westward into Klamath range of Trinity and Humboldt Counties.
Dam Status Annual Energy Production
(Gigawatt-hours) Developed w/ Power 158 Developed w/o Power 3442 Undeveloped 2280 Total California 5880
5
Figure 1: Potential HES-modeled Hydropower Sites
Source: California Energy Commission Table 5 lists the HES-modeled small hydropower capacity by county. Small hydropower opportunities exist in 52 of California’s 58 counties. Fresno County has the highest small hydropower potential with 168 MW in contrast to Napa County which has potential for 10 kilowatts. As indicated in Figure 1, the counties with the highest potential are located in the mountain ranges to the north and to the east of the central valley.
6
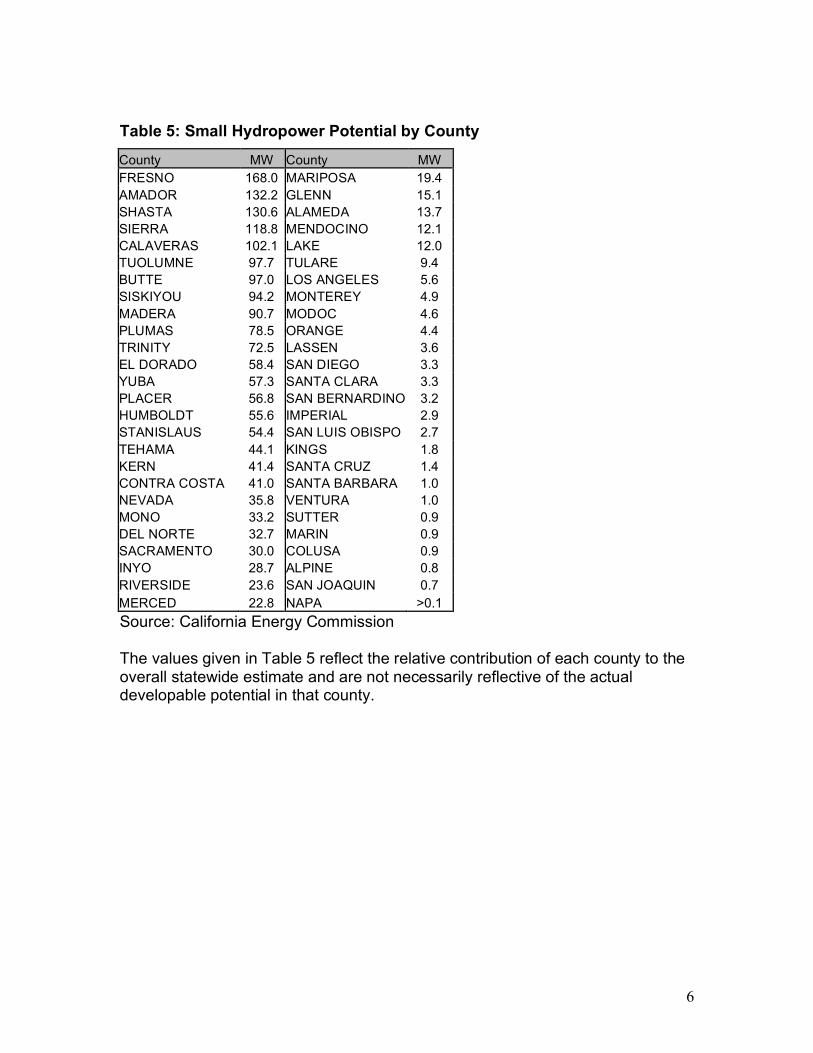
Table 5: Small Hydropower Potential by County
County MW County MW FRESNO 168.0 MARIPOSA 19.4 AMADOR 132.2 GLENN 15.1 SHASTA 130.6 ALAMEDA 13.7 SIERRA 118.8 MENDOCINO 12.1 CALAVERAS 102.1 LAKE 12.0 TUOLUMNE 97.7 TULARE 9.4 BUTTE 97.0 LOS ANGELES 5.6 SISKIYOU 94.2 MONTEREY 4.9 MADERA 90.7 MODOC 4.6 PLUMAS 78.5 ORANGE 4.4 TRINITY 72.5 LASSEN 3.6 EL DORADO 58.4 SAN DIEGO 3.3 YUBA 57.3 SANTA CLARA 3.3 PLACER 56.8 SAN BERNARDINO 3.2 HUMBOLDT 55.6 IMPERIAL 2.9 STANISLAUS 54.4 SAN LUIS OBISPO 2.7 TEHAMA 44.1 KINGS 1.8 KERN 41.4 SANTA CRUZ 1.4 CONTRA COSTA 41.0 SANTA BARBARA 1.0 NEVADA 35.8 VENTURA 1.0 MONO 33.2 SUTTER 0.9 DEL NORTE 32.7 MARIN 0.9 SACRAMENTO 30.0 COLUSA 0.9 INYO 28.7 ALPINE 0.8 RIVERSIDE 23.6 SAN JOAQUIN 0.7 MERCED 22.8 NAPA >0.1 Source: California Energy Commission The values given in Table 5 reflect the relative contribution of each county to the overall statewide estimate and are not necessarily reflective of the actual developable potential in that county.

7
Man-Made Conduit Resources California’s recently enacted Renewables Portfolio Standard (RPS) established eligibility criteria for small hydropower and other renewable energy projects, to determine compliance by investor-owned utilities in meeting their stipulated RPS requirements, and whether a renewable energy project may receive Supplemental Energy Payments (SEP) for utility contracts at above-market prices. Under these criteria, a new small hydropower project is only eligible to the extent that:
• It was placed in service on or after September 12, 2002; • It has less than 30 MW total installed capacity at the site; and • It does not require a new or increased appropriation or diversion of
water. Because the 1998 INEEL hydropower resource assessment concentrated mainly on impoundments and natural waterways. Future development of nearly all of the opportunities outlined in the assessment would fail to meet one or more of the RPS eligibility criteria, closing the door on SEPs. In the near term, the RPS and SEP eligibility are expected to be the primary drivers of renewables development. Without changes in the law or the definition of “appropriation or diversion,” it would seem likely that most of the capacity identified by INEEL would go undeveloped. However, hydropower opportunities in existing canals and pipelines (pre-2002) appear to be eligible for SEPs under the RPS, as long as water appropriations or diversions are not increased in the process. Because the 1998 INEEL assessment did not comprehensively address man-made conduit resources, the California Energy Commission retained Navigant Consultants, Inc. (NCI) to assess the statewide potential in this respect. Navigant’s Estimation Methodology Initially NCI compiled a comprehensive list of 250 water districts from various state and federal listings and determined key attributes that would be used to estimate the statewide RPS-eligible small hydropower resources. Key attributes included water district size, type, and location. Water district size was defined as follows:
• Large—annual water allotment greater than 500 thousand acre-feet (kAF) • Medium—annual water allotment between 50 and 500 kAF • Small—annual water allotment between 20 and 50 kAF • Very small—annual water allotment less than 20 kAF
8
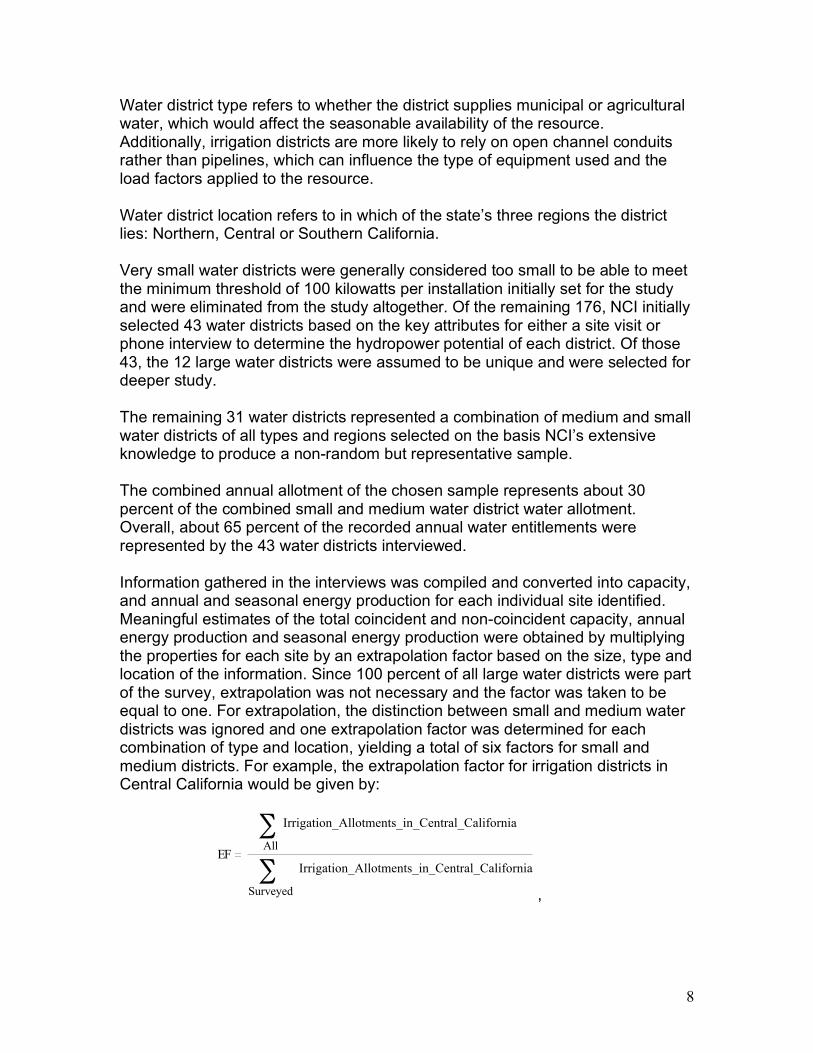
Water district type refers to whether the district supplies municipal or agricultural water, which would affect the seasonable availability of the resource. Additionally, irrigation districts are more likely to rely on open channel conduits rather than pipelines, which can influence the type of equipment used and the load factors applied to the resource. Water district location refers to in which of the state’s three regions the district lies: Northern, Central or Southern California. Very small water districts were generally considered too small to be able to meet the minimum threshold of 100 kilowatts per installation initially set for the study and were eliminated from the study altogether. Of the remaining 176, NCI initially selected 43 water districts based on the key attributes for either a site visit or phone interview to determine the hydropower potential of each district. Of those 43, the 12 large water districts were assumed to be unique and were selected for deeper study. The remaining 31 water districts represented a combination of medium and small water districts of all types and regions selected on the basis NCI’s extensive knowledge to produce a non-random but representative sample. The combined annual allotment of the chosen sample represents about 30 percent of the combined small and medium water district water allotment. Overall, about 65 percent of the recorded annual water entitlements were represented by the 43 water districts interviewed. Information gathered in the interviews was compiled and converted into capacity, and annual and seasonal energy production for each individual site identified. Meaningful estimates of the total coincident and non-coincident capacity, annual energy production and seasonal energy production were obtained by multiplying the properties for each site by an extrapolation factor based on the size, type and location of the information. Since 100 percent of all large water districts were part of the survey, extrapolation was not necessary and the factor was taken to be equal to one. For extrapolation, the distinction between small and medium water districts was ignored and one extrapolation factor was determined for each combination of type and location, yielding a total of six factors for small and medium districts. For example, the extrapolation factor for irrigation districts in Central California would be given by:
EFAll
Irrigation_Allotments_in_Central_California!
Surveyed
Irrigation_Allotments_in_Central_California!,
9
where the irrigation allotments to be summed include only small and medium water districts. Water district responses were entered into a database and converted into monthly capacities using publicly-available software. These results were extended to the remainder of the 176 water districts under consideration using the extrapolation factors as defined above. Monthly energy production was calculated for each site by applying a monthly capacity factor to the product of monthly capacity and time. The capacity factor was assigned according to the type and location of the site as follows:
• For those entities with distinct summer irrigation patterns, a 6.5 month average irrigation season (April through October) was assumed. Since estimated potential was based on average flow data wherever available, a high monthly correction factor of 90 percent was assumed during operating months because maintenance and repair would typically occur during fall and winter.
• For municipal water systems and 12-month irrigators (e.g., Southern
California) with year-round flows, a 70 percent average load factor was assumed during operating months, with one month of scheduled downtime.
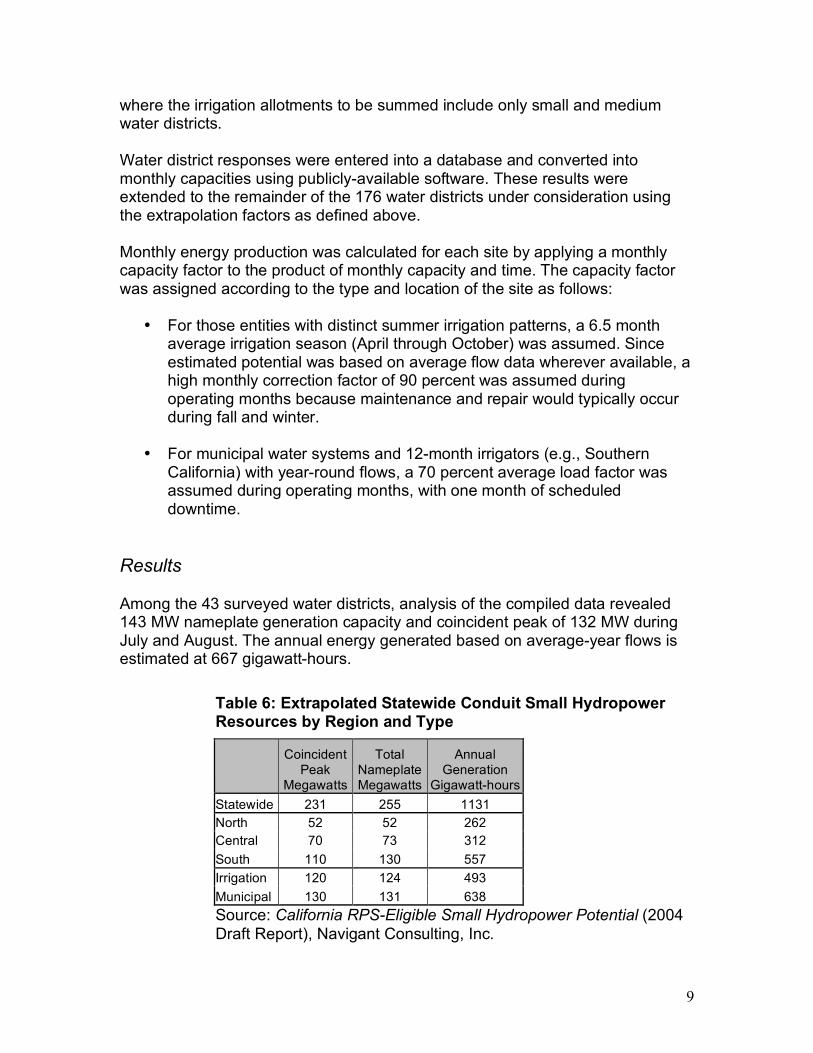
Results Among the 43 surveyed water districts, analysis of the compiled data revealed 143 MW nameplate generation capacity and coincident peak of 132 MW during July and August. The annual energy generated based on average-year flows is estimated at 667 gigawatt-hours.
Table 6: Extrapolated Statewide Conduit Small Hydropower Resources by Region and Type
Coincident Peak
Megawatts
Total Nameplate Megawatts
Annual Generation
Gigawatt-hours Statewide 231 255 1131 North 52 52 262 Central 70 73 312 South 110 130 557 Irrigation 120 124 493 Municipal 130 131 638 Source: California RPS-Eligible Small Hydropower Potential (2004 Draft Report), Navigant Consulting, Inc.
10
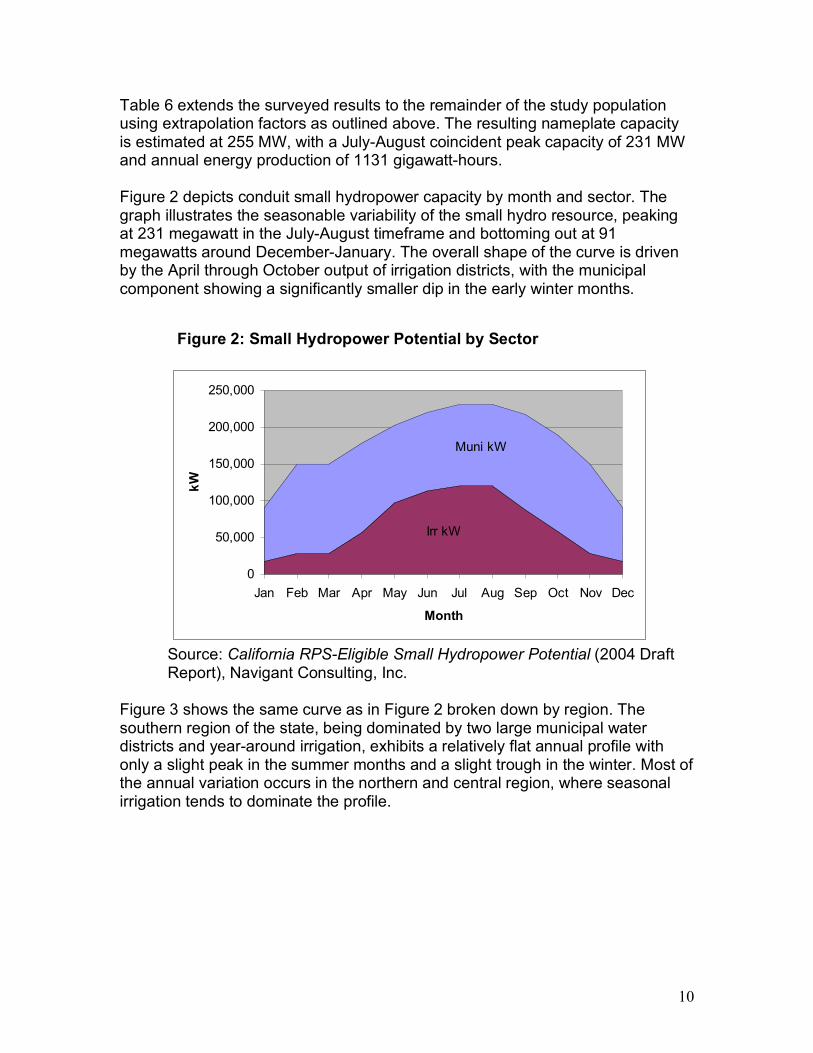
Table 6 extends the surveyed results to the remainder of the study population using extrapolation factors as outlined above. The resulting nameplate capacity is estimated at 255 MW, with a July-August coincident peak capacity of 231 MW and annual energy production of 1131 gigawatt-hours. Figure 2 depicts conduit small hydropower capacity by month and sector. The graph illustrates the seasonable variability of the small hydro resource, peaking at 231 megawatt in the July-August timeframe and bottoming out at 91 megawatts around December-January. The overall shape of the curve is driven by the April through October output of irrigation districts, with the municipal component showing a significantly smaller dip in the early winter months.
Source: California RPS-Eligible Small Hydropower Potential (2004 Draft Report), Navigant Consulting, Inc.
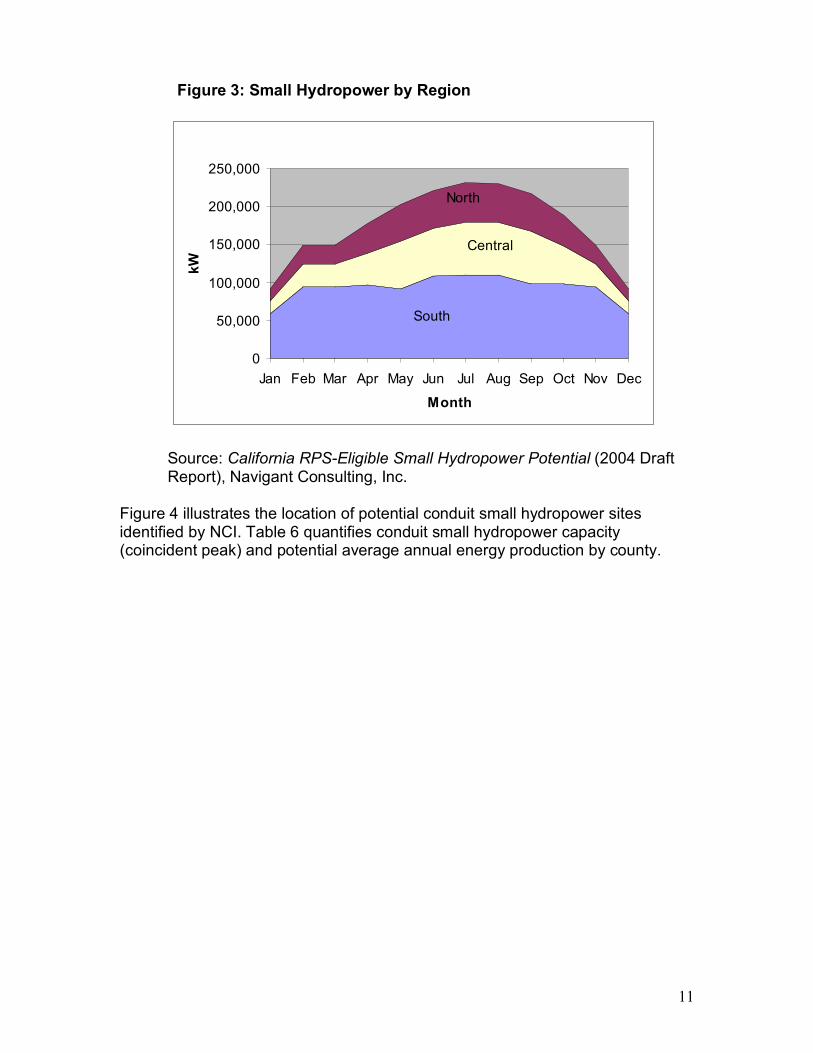
Figure 3 shows the same curve as in Figure 2 broken down by region. The southern region of the state, being dominated by two large municipal water districts and year-around irrigation, exhibits a relatively flat annual profile with only a slight peak in the summer months and a slight trough in the winter. Most of the annual variation occurs in the northern and central region, where seasonal irrigation tends to dominate the profile.
Irr kW
Muni kW
0
50,000
100,000
150,000
200,000
250,000
Jan Feb Mar Apr May Jun Jul Aug Sep Oct Nov Dec
Month
kW
Figure 2: Small Hydropower Potential by Sector
11
Source: California RPS-Eligible Small Hydropower Potential (2004 Draft Report), Navigant Consulting, Inc.
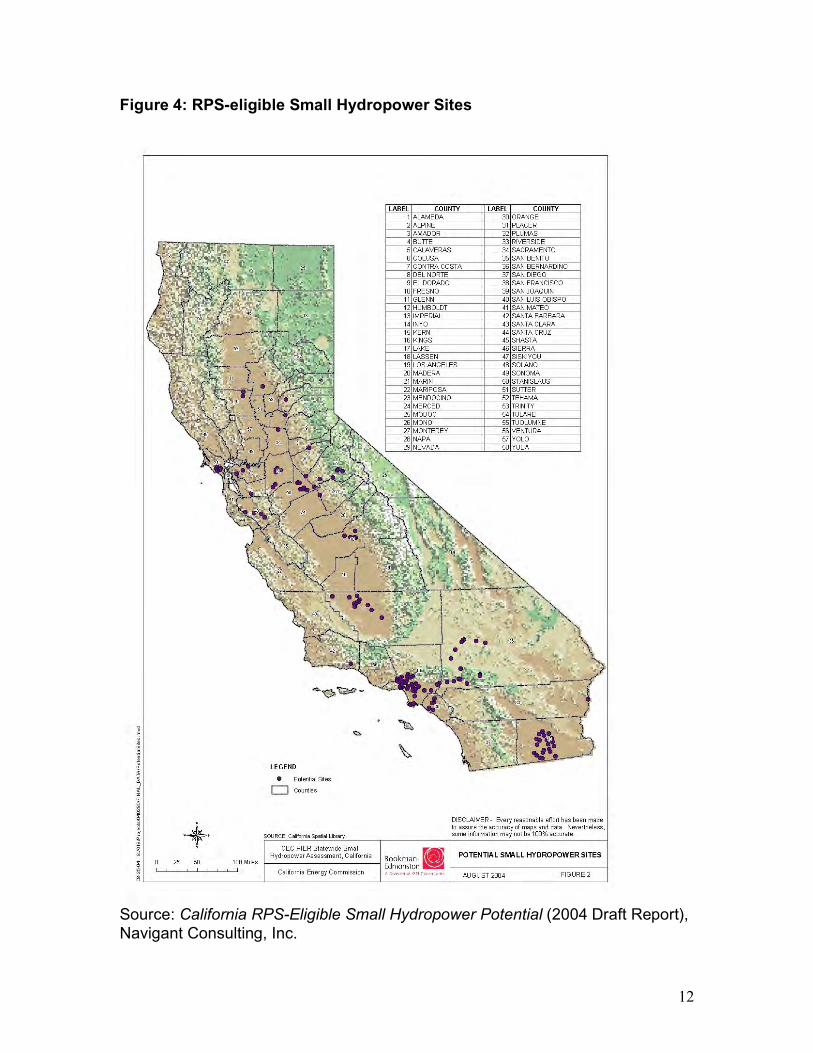
Figure 4 illustrates the location of potential conduit small hydropower sites identified by NCI. Table 6 quantifies conduit small hydropower capacity (coincident peak) and potential average annual energy production by county.
South
Central
North
0
50,000
100,000
150,000
200,000
250,000
Jan Feb Mar Apr May Jun Jul Aug Sep Oct Nov Dec
Month
kW
Figure 3: Small Hydropower by Region
12
Figure 4: RPS-eligible Small Hydropower Sites
Source: California RPS-Eligible Small Hydropower Potential (2004 Draft Report), Navigant Consulting, Inc.

13
Table 7: Total Kilowatts and Kilowatt-hours by County COUNTY TOTAL KW TOTAL KWH COUNTY TOTAL KW TOTAL KWH Los Angeles 56,932 317,024,165 Merced 2,883 13,228,599 Stanislaus 29,940 124,863,195 Yuba 2,464 12,988,371 Kern 19,177 69,074,936 Santa Clara 2,058 7,098,860 San Bernardino 17,728 45,632,188 Modoc 1,921 10,115,554 Tulare 12,258 64,540,149 Sacramento 1,506 7,930,594 Imperial 9,539 68,818,145 Shasta 1,452 7,647,359 San Joaquin 7,406 38,517,860 Yolo 1,345 7,080,888 Madera 6,793 35,768,600 Orange 1,189 5,387,813 Fresno 6,426 30,494,562 Monterey 1,153 6,069,333 Solano 5,425 28,564,423 Placer 778 4,094,776 San Diego 4,874 25,662,959 Santa Barbara 761 4,005,759 Glenn 4,292 18,243,021 Siskiyou 500 2,630,044 Kings 4,054 21,344,143 El Dorado 481 2,534,149 Riverside 3,961 25,656,679 San Benito 337 1,772,245 Colusa 3,929 20,685,904 Calaveras 289 1,145,479 Alameda 3,200 17,955,840 Sonoma 269 1,416,178 Contra Costa 3,144 17,285,200 Napa 204 1,072,249 Inyo 3,074 16,184,887 San Luis Obispo 192 1,011,555 Sutter 3,037 14,302,515 Tehama 177 930,631 Butte 2,974 15,658,878 Ventura 154 809,244 Nevada 2,962 15,934,928 Source: California RPS-Eligible Small Hydropower Potential (2004 Draft Report), Navigant Consulting, Inc. The study’s findings were then reconciled with the California Department of Water Resources’ Bulletin 211 published April 1981 entitled, Small Hydroelectric Potential at Existing Hydraulic Structures in California. After eliminating overlaps with Bulletin 211 and removing projects which are known to have been built since 1980, the unaccounted for potential in Bulletin 211 is 23 megawatts. When added to the findings in this study, the total undeveloped small hydropower potential in man-made conduits is approximately 278 MW (nameplate). Certain types of small hydropower projects are not reflected in the above numbers. These include:
• Incremental RPS-eligible hydropower potential at existing dams; • Hydropower potential from by re-powering and/or re-operations; and • Hydropower potential from industrial processes such as mining,
manufacturing, food processing and wastewater treatment.
14
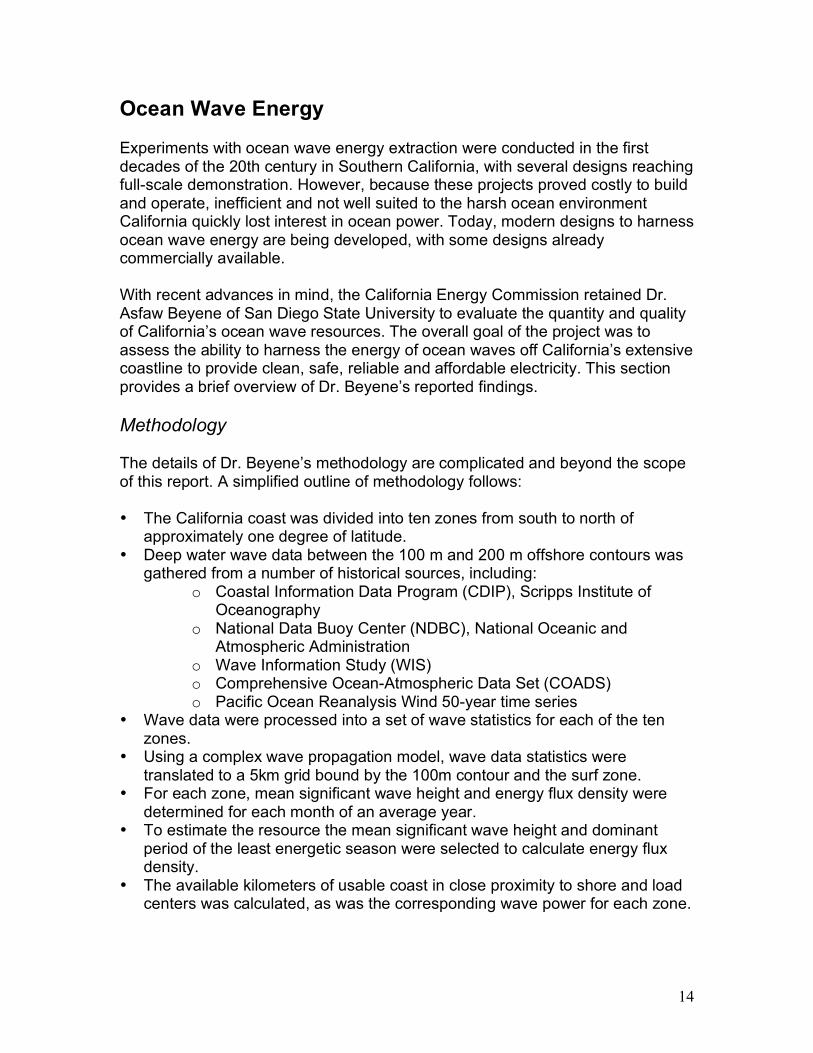
Ocean Wave Energy Experiments with ocean wave energy extraction were conducted in the first decades of the 20th century in Southern California, with several designs reaching full-scale demonstration. However, because these projects proved costly to build and operate, inefficient and not well suited to the harsh ocean environment California quickly lost interest in ocean power. Today, modern designs to harness ocean wave energy are being developed, with some designs already commercially available. With recent advances in mind, the California Energy Commission retained Dr. Asfaw Beyene of San Diego State University to evaluate the quantity and quality of California’s ocean wave resources. The overall goal of the project was to assess the ability to harness the energy of ocean waves off California’s extensive coastline to provide clean, safe, reliable and affordable electricity. This section provides a brief overview of Dr. Beyene’s reported findings. Methodology The details of Dr. Beyene’s methodology are complicated and beyond the scope of this report. A simplified outline of methodology follows: • The California coast was divided into ten zones from south to north of
approximately one degree of latitude. • Deep water wave data between the 100 m and 200 m offshore contours was
gathered from a number of historical sources, including: o Coastal Information Data Program (CDIP), Scripps Institute of
Oceanography o National Data Buoy Center (NDBC), National Oceanic and
Atmospheric Administration o Wave Information Study (WIS) o Comprehensive Ocean-Atmospheric Data Set (COADS) o Pacific Ocean Reanalysis Wind 50-year time series
• Wave data were processed into a set of wave statistics for each of the ten zones.
• Using a complex wave propagation model, wave data statistics were translated to a 5km grid bound by the 100m contour and the surf zone.
• For each zone, mean significant wave height and energy flux density were determined for each month of an average year.
• To estimate the resource the mean significant wave height and dominant period of the least energetic season were selected to calculate energy flux density.
• The available kilometers of usable coast in close proximity to shore and load centers was calculated, as was the corresponding wave power for each zone.
15
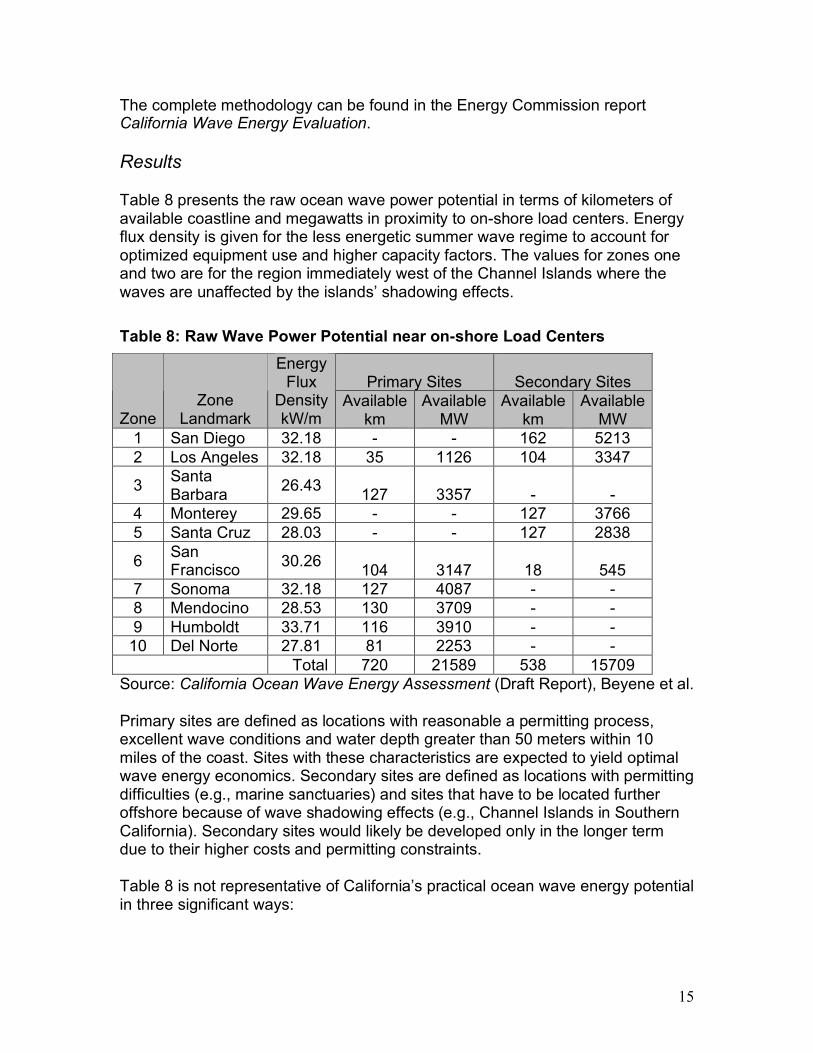
The complete methodology can be found in the Energy Commission report California Wave Energy Evaluation. Results Table 8 presents the raw ocean wave power potential in terms of kilometers of available coastline and megawatts in proximity to on-shore load centers. Energy flux density is given for the less energetic summer wave regime to account for optimized equipment use and higher capacity factors. The values for zones one and two are for the region immediately west of the Channel Islands where the waves are unaffected by the islands’ shadowing effects. Table 8: Raw Wave Power Potential near on-shore Load Centers
Primary Sites
Secondary Sites
Zone Zone
Landmark
Energy Flux
Density kW/m
Available km
Available MW
Available km
Available MW
1 San Diego 32.18 - - 162 5213 2 Los Angeles 32.18 35 1126 104 3347
3 Santa Barbara 26.43 127 3357 - -
4 Monterey 29.65 - - 127 3766 5 Santa Cruz 28.03 - - 127 2838
6 San Francisco 30.26 104 3147 18 545
7 Sonoma 32.18 127 4087 - - 8 Mendocino 28.53 130 3709 - - 9 Humboldt 33.71 116 3910 - -
10 Del Norte 27.81 81 2253 - - Total 720 21589 538 15709 Source: California Ocean Wave Energy Assessment (Draft Report), Beyene et al. Primary sites are defined as locations with reasonable a permitting process, excellent wave conditions and water depth greater than 50 meters within 10 miles of the coast. Sites with these characteristics are expected to yield optimal wave energy economics. Secondary sites are defined as locations with permitting difficulties (e.g., marine sanctuaries) and sites that have to be located further offshore because of wave shadowing effects (e.g., Channel Islands in Southern California). Secondary sites would likely be developed only in the longer term due to their higher costs and permitting constraints. Table 8 is not representative of California’s practical ocean wave energy potential in three significant ways:
16
• It does not correct for the water-to-wire efficiency of WEC devices. Water-to-wire efficiency of WEC devices varies greatly with technology and the height and period (sea state) of waves in which it operates. Efficiencies range to 40+ percent.
• It does not account for the tradeoff between WEC capacity and capacity
factor. All WEC devices must operate in a local spectrum of sea states. Establishing WEC capacity based on the most energetic sea state in the spectrum would maximize energy production but have a very low capacity factor. Conversely, a capacity based on a less energetic sea state would yield much higher capacity factors and less energy production. Optimization with respect to the local sea state spectrum is required to establish a suitable capacity value for a given site and technology.
• It assumes 100 percent availability of California’s 1258 kilometers of
coastline. However, ocean wave development will have to compete with other established uses that may not be compatible with energy development, such as deep-water shipping. Spacing requirements for the wave energy converters will also restrict the actual number of kilometers that can be developed.
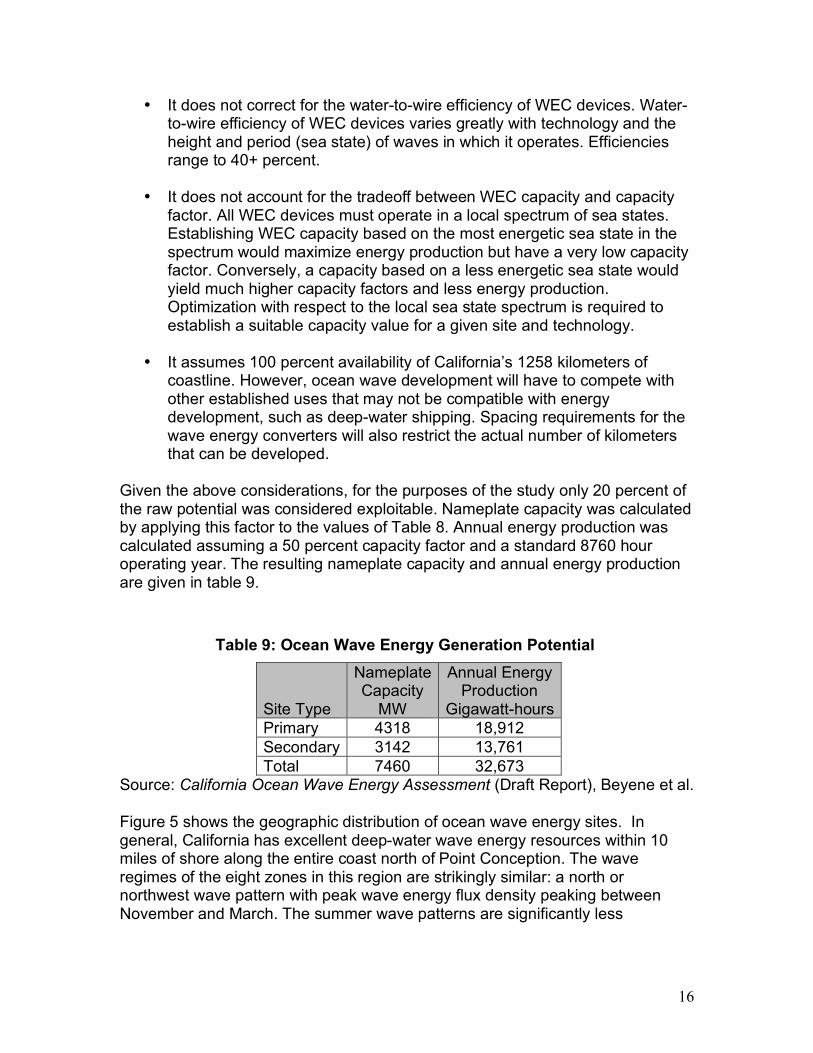
Given the above considerations, for the purposes of the study only 20 percent of the raw potential was considered exploitable. Nameplate capacity was calculated by applying this factor to the values of Table 8. Annual energy production was calculated assuming a 50 percent capacity factor and a standard 8760 hour operating year. The resulting nameplate capacity and annual energy production are given in table 9.
Table 9: Ocean Wave Energy Generation Potential
Site Type
Nameplate Capacity
MW
Annual Energy Production
Gigawatt-hours Primary 4318 18,912 Secondary 3142 13,761 Total 7460 32,673
Source: California Ocean Wave Energy Assessment (Draft Report), Beyene et al.
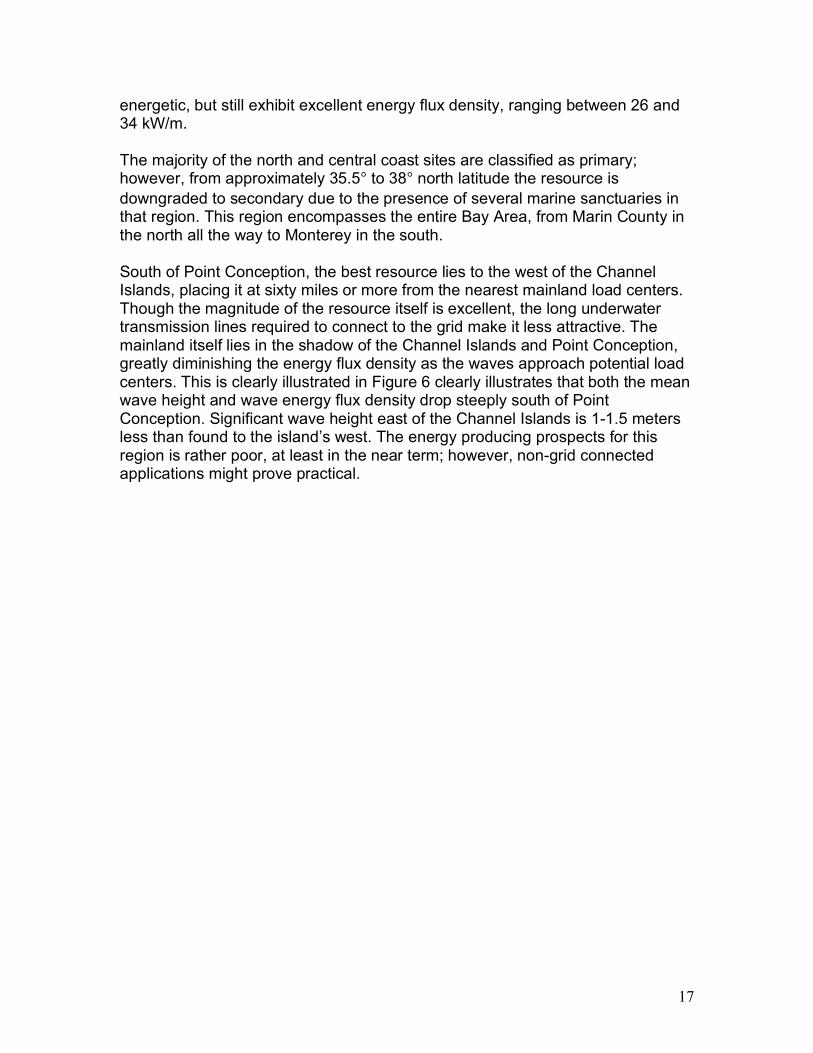
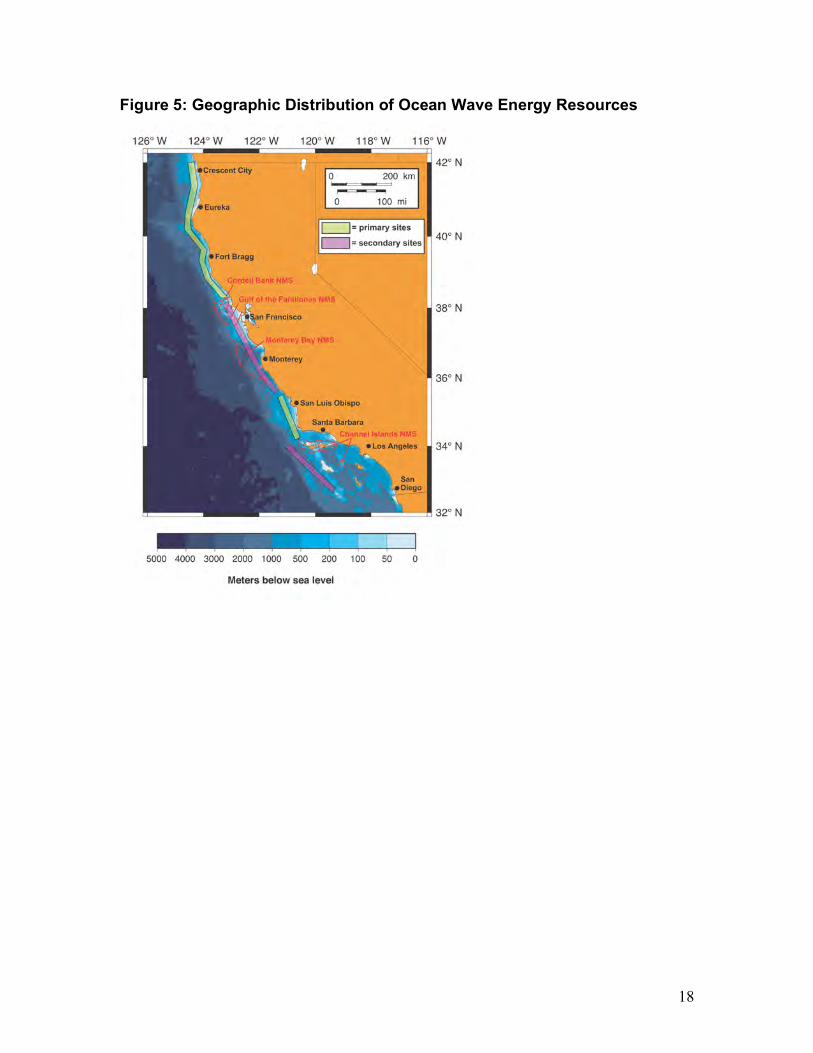
Figure 5 shows the geographic distribution of ocean wave energy sites. In general, California has excellent deep-water wave energy resources within 10 miles of shore along the entire coast north of Point Conception. The wave regimes of the eight zones in this region are strikingly similar: a north or northwest wave pattern with peak wave energy flux density peaking between November and March. The summer wave patterns are significantly less
17
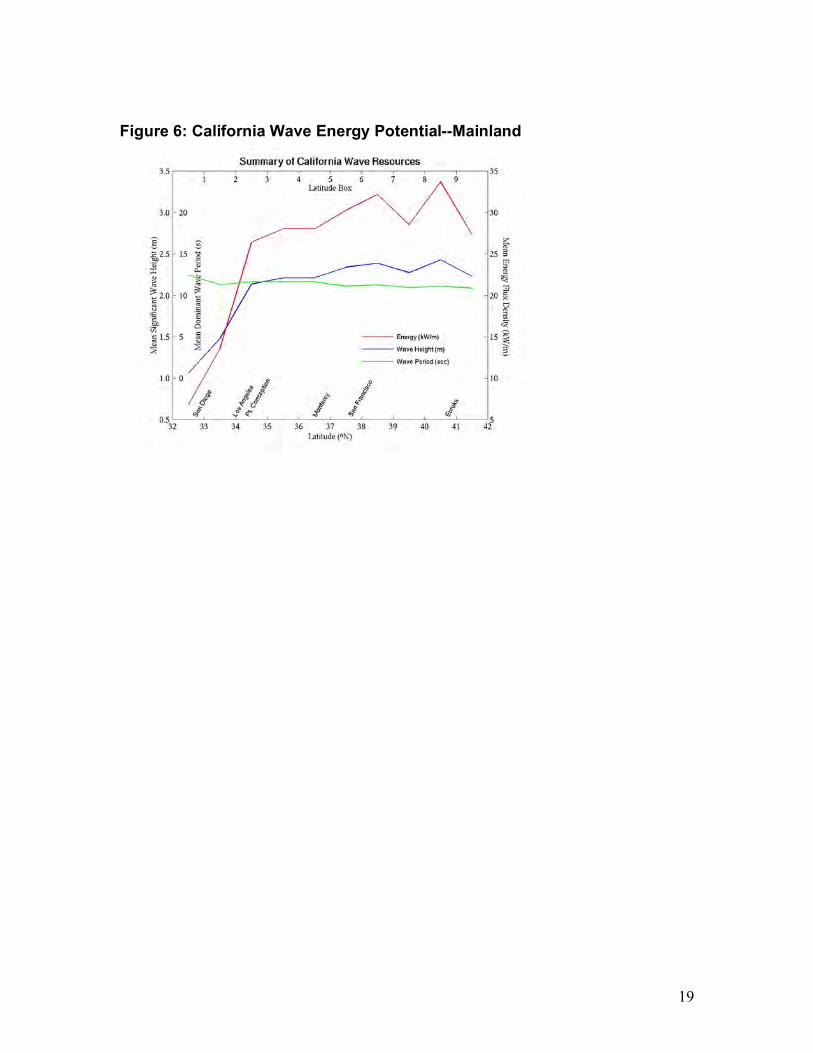
energetic, but still exhibit excellent energy flux density, ranging between 26 and 34 kW/m. The majority of the north and central coast sites are classified as primary; however, from approximately 35.5° to 38° north latitude the resource is downgraded to secondary due to the presence of several marine sanctuaries in that region. This region encompasses the entire Bay Area, from Marin County in the north all the way to Monterey in the south. South of Point Conception, the best resource lies to the west of the Channel Islands, placing it at sixty miles or more from the nearest mainland load centers. Though the magnitude of the resource itself is excellent, the long underwater transmission lines required to connect to the grid make it less attractive. The mainland itself lies in the shadow of the Channel Islands and Point Conception, greatly diminishing the energy flux density as the waves approach potential load centers. This is clearly illustrated in Figure 6 clearly illustrates that both the mean wave height and wave energy flux density drop steeply south of Point Conception. Significant wave height east of the Channel Islands is 1-1.5 meters less than found to the island’s west. The energy producing prospects for this region is rather poor, at least in the near term; however, non-grid connected applications might prove practical.
18
Figure 5: Geographic Distribution of Ocean Wave Energy Resources
19
Figure 6: California Wave Energy Potential--Mainland
20
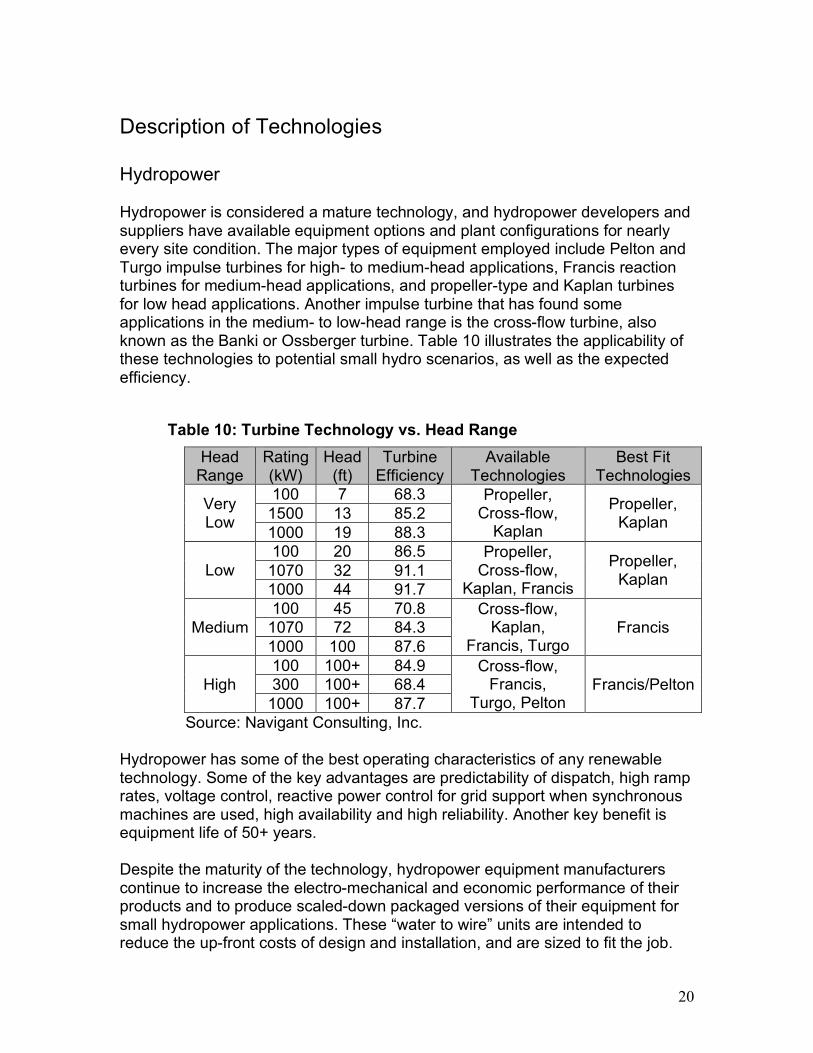
Description of Technologies Hydropower Hydropower is considered a mature technology, and hydropower developers and suppliers have available equipment options and plant configurations for nearly every site condition. The major types of equipment employed include Pelton and Turgo impulse turbines for high- to medium-head applications, Francis reaction turbines for medium-head applications, and propeller-type and Kaplan turbines for low head applications. Another impulse turbine that has found some applications in the medium- to low-head range is the cross-flow turbine, also known as the Banki or Ossberger turbine. Table 10 illustrates the applicability of these technologies to potential small hydro scenarios, as well as the expected efficiency.
Table 10: Turbine Technology vs. Head Range
Head Range
Rating (kW)
Head (ft)
Turbine Efficiency
Available Technologies
Best Fit Technologies
100 7 68.3 1500 13 85.2 Very
Low 1000 19 88.3
Propeller, Cross-flow,
Kaplan
Propeller, Kaplan
100 20 86.5 1070 32 91.1 Low 1000 44 91.7
Propeller, Cross-flow,
Kaplan, Francis
Propeller, Kaplan
100 45 70.8 1070 72 84.3 Medium 1000 100 87.6
Cross-flow, Kaplan,
Francis, Turgo Francis
100 100+ 84.9 300 100+ 68.4 High
1000 100+ 87.7
Cross-flow, Francis,
Turgo, Pelton Francis/Pelton
Source: Navigant Consulting, Inc. Hydropower has some of the best operating characteristics of any renewable technology. Some of the key advantages are predictability of dispatch, high ramp rates, voltage control, reactive power control for grid support when synchronous machines are used, high availability and high reliability. Another key benefit is equipment life of 50+ years. Despite the maturity of the technology, hydropower equipment manufacturers continue to increase the electro-mechanical and economic performance of their products and to produce scaled-down packaged versions of their equipment for small hydropower applications. These “water to wire” units are intended to reduce the up-front costs of design and installation, and are sized to fit the job.

21
Some designs reduce or eliminate the need for costly civil works and powerhouses, and some even need no support structure other than anchorage against the water current. Advances in electronic and computer controls also reduce the installation and operation costs of small hydropower installations. Off-the-shelf Programmable Logic Controls (PLC) can use a single device to monitor, control and provide alarms for all functions of a small hydropower facility. Supervisory Control and Data Acquisition (SCADA) systems allow for easy monitoring of a facility’s operating parameters and are easily adaptable to remote monitoring through the internet or by cell phone. Both PLC and SCADA are easily programmable, allowing for changes in plant operation without large investments in additional equipment. Relatively inexpensive computer-based packages are available that can monitor and trend a plant’s operating parameters and employ algorithms to predict maintenance needs, decreasing the cost of maintenance and increasing the availability of the unit. Currently, there are no large-scale commercial ultra low head plants in operation in the U.S. However, considerable research and testing are currently being conducted on ultra low head turbines for tidal areas and fast-flowing channels in which infrastructure is minimal. Most work in this area is in prototype installation and site testing to determine the viability of operating multiple larger size units. Thus far, several sites have been identified with relatively high velocity current or tidal flows that could be future hosts of larger hydro generating “turbine farms,” much like large wind farms. In particular, potential sites near large population centers such as San Francisco (Golden Gate) hold promise. Other research and development efforts are in progress on reaction-type turbines that use entirely different impeller designs. Much like the pumps used at fish hatcheries to move stock, these new designs can pass local fish through the turbine with minimal harm or injury. Another promising technology is the use of small pumps as turbine units. Unregulated pumps coupled with variable-speed turbine generators can be used at sites with a wide range of heads and flows. Commercially available pumps cost much less than a regulating turbine with the same maximum flow. When using a pump as a turbine, the flow through the units is not easily regulated. Some installations use multiple pumps or throttle the discharge of the pumps to regulate the required plant flow. With increasingly lower costs of inverter technology, the turbine (pump) speed and its resultant discharge can be regulated for optimal flow and head conditions at minimal costs. Wave Energy Conversion Technology Wave Energy Conversion devices convert the slow, pulsing mechanical motion of ocean waves (0.1 Hz) to a steady electric output with a frequency of 50-60 Hz, at
22
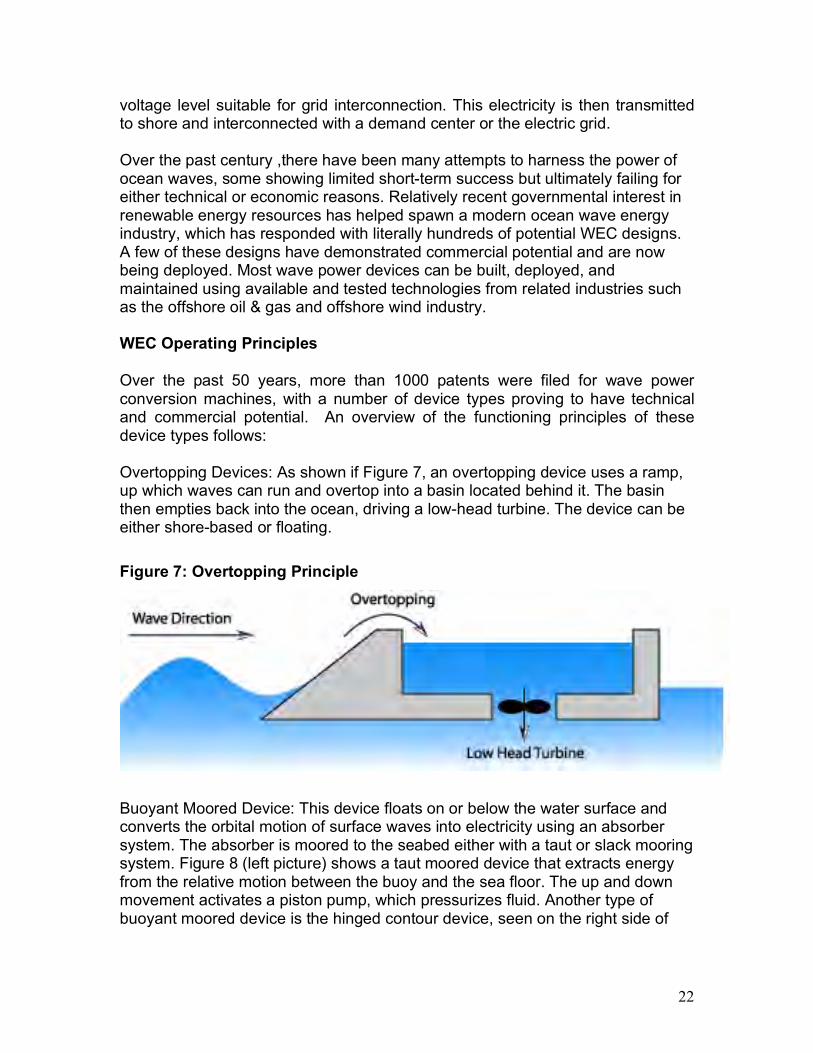
voltage level suitable for grid interconnection. This electricity is then transmitted to shore and interconnected with a demand center or the electric grid. Over the past century ,there have been many attempts to harness the power of ocean waves, some showing limited short-term success but ultimately failing for either technical or economic reasons. Relatively recent governmental interest in renewable energy resources has helped spawn a modern ocean wave energy industry, which has responded with literally hundreds of potential WEC designs. A few of these designs have demonstrated commercial potential and are now being deployed. Most wave power devices can be built, deployed, and maintained using available and tested technologies from related industries such as the offshore oil & gas and offshore wind industry. WEC Operating Principles Over the past 50 years, more than 1000 patents were filed for wave power conversion machines, with a number of device types proving to have technical and commercial potential. An overview of the functioning principles of these device types follows: Overtopping Devices: As shown if Figure 7, an overtopping device uses a ramp, up which waves can run and overtop into a basin located behind it. The basin then empties back into the ocean, driving a low-head turbine. The device can be either shore-based or floating. Figure 7: Overtopping Principle
Buoyant Moored Device: This device floats on or below the water surface and converts the orbital motion of surface waves into electricity using an absorber system. The absorber is moored to the seabed either with a taut or slack mooring system. Figure 8 (left picture) shows a taut moored device that extracts energy from the relative motion between the buoy and the sea floor. The up and down movement activates a piston pump, which pressurizes fluid. Another type of buoyant moored device is the hinged contour device, seen on the right side of
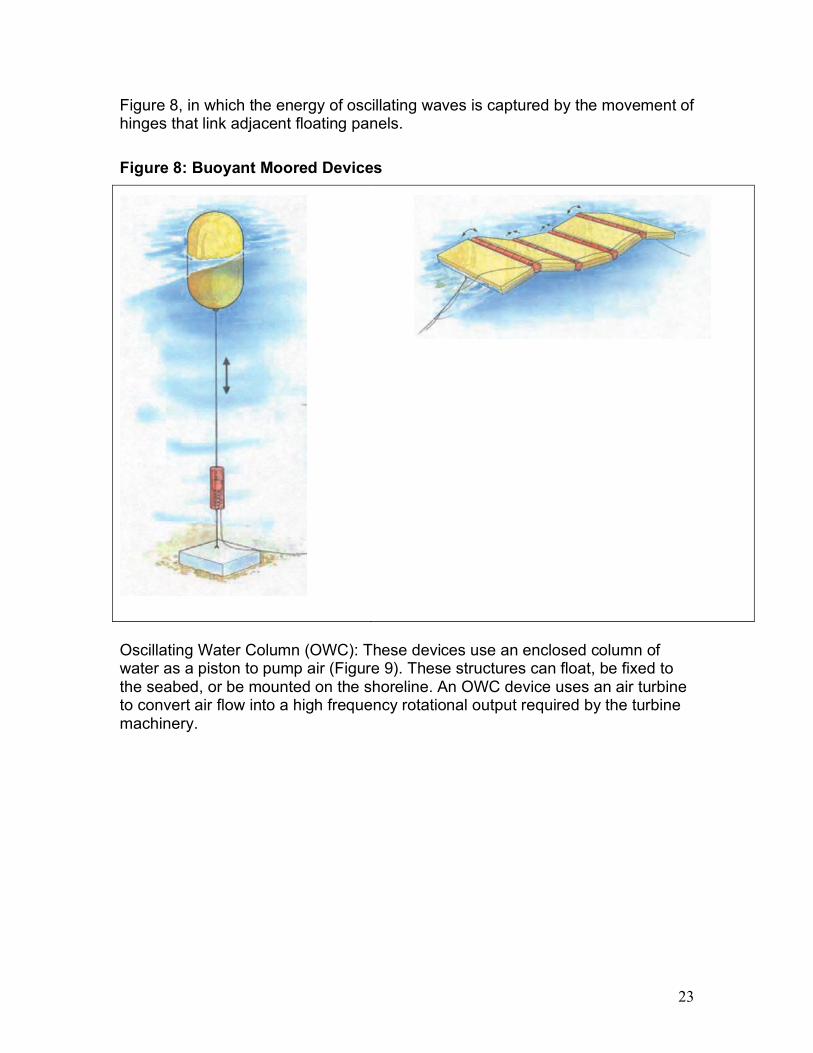
23
Figure 8, in which the energy of oscillating waves is captured by the movement of hinges that link adjacent floating panels. Figure 8: Buoyant Moored Devices
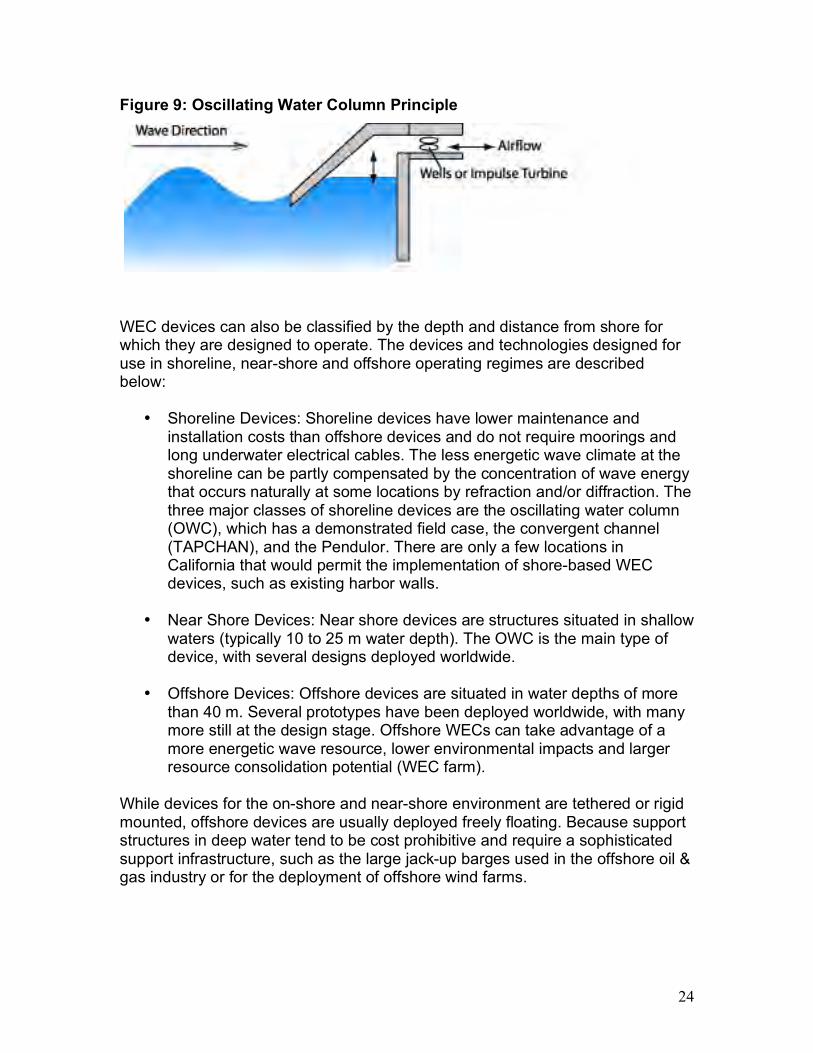
Oscillating Water Column (OWC): These devices use an enclosed column of water as a piston to pump air (Figure 9). These structures can float, be fixed to the seabed, or be mounted on the shoreline. An OWC device uses an air turbine to convert air flow into a high frequency rotational output required by the turbine machinery.
24
Figure 9: Oscillating Water Column Principle
WEC devices can also be classified by the depth and distance from shore for which they are designed to operate. The devices and technologies designed for use in shoreline, near-shore and offshore operating regimes are described below:
• Shoreline Devices: Shoreline devices have lower maintenance and installation costs than offshore devices and do not require moorings and long underwater electrical cables. The less energetic wave climate at the shoreline can be partly compensated by the concentration of wave energy that occurs naturally at some locations by refraction and/or diffraction. The three major classes of shoreline devices are the oscillating water column (OWC), which has a demonstrated field case, the convergent channel (TAPCHAN), and the Pendulor. There are only a few locations in California that would permit the implementation of shore-based WEC devices, such as existing harbor walls.
• Near Shore Devices: Near shore devices are structures situated in shallow
waters (typically 10 to 25 m water depth). The OWC is the main type of device, with several designs deployed worldwide.
• Offshore Devices: Offshore devices are situated in water depths of more
than 40 m. Several prototypes have been deployed worldwide, with many more still at the design stage. Offshore WECs can take advantage of a more energetic wave resource, lower environmental impacts and larger resource consolidation potential (WEC farm).
While devices for the on-shore and near-shore environment are tethered or rigid mounted, offshore devices are usually deployed freely floating. Because support structures in deep water tend to be cost prohibitive and require a sophisticated support infrastructure, such as the large jack-up barges used in the offshore oil & gas industry or for the deployment of offshore wind farms.

25
i California Energy Commission, April 2005, 2004 Net System Power Calculation, Sacramento, CA CEC-300-2005-004SF ii California Energy Commission, May 8, 2003, Energy Action Plan, www.energy.ca.gov/energy_action_plan iii California Energy Commission, November 19, 2003, Renewable Resources Development Report, Sacramento, CA 500-03-080F
26
Bibliography Conner, Alison. Francfort, James. U.S. Hydropower Resource Assessment—California. United States Department of Energy, 1998. Roughton, Robert and Matthew Gass. California RPS-Eligible Small Hydropower Potential. Draft report to the California Energy Commission, 2004. Previsic, Mirko and Asfaw Beyene. Guay, Christopher. California Ocean Wave Energy Assessment. Draft report to the California Energy Commission, 2003.