california science test training items scoring guide · this california science test (cast)...
TRANSCRIPT

C A L I F O R N I A Assessment of Student Performance and Progress
California Science Test Training Items Scoring Guide
2016–17 Administration
Updated March 15, 2017.Prepared by Educational Testing Service ®

CAASPP System
– ii –
Table of Contents Guide Content .................................................................................................................................... 1
Grade Five Sample Items .................................................................................................................................... 3
Grade Eight Sample Items ................................................................................................................................ 15
High School Sample Items ................................................................................................................................ 24

Guide Content
Updated March 15, 2017 2016–17 California Science Test Training Items Scoring Guide 1
Guide Content
Note: The purpose of the California Science Test (CAST) training test is to introduce students and test administrators to new item types. This is the first generation of CAST training test; future versions will include corrections, new test items, and other improvements.
This California Science Test (CAST) training items scoring guide offers details about the items, student response types, correct responses, and related scoring considerations for the included sample of training items. These items have been selected to show some of the new approaches to measuring the California Next Generation Science Standards (CA NGSS) that can be found in the assessment. The training test items are not fully representative of all possible item types included in the pilot or field test for the CA NGSS, but additional samples will be provided over time. The sample covers a selection of items from grade five, grade eight, and high school. The various item types are not limited to a particular grade level and could appear for any grade.
Within this guide, the following information is presented along with each item:
• Grade Level: The intended grade level of the item • Performance Expectations (PE): Assessable statements of what students should know
and be able to do • Science and Engineering Practices (SEP): Descriptions of behaviors that scientists
and engineers engage in as they investigate the natural world and design solutions, respectively
• Disciplinary Core Ideas (DCI): Most essential ideas in the major science disciplines that all students should understand during 13 years of school
• Crosscutting Concepts (CCC): Interdisciplinary skills that unify the study of science and engineering through their common application across fields
• Depth of Knowledge (DOK): A measure of complexity that considers the student’s cognitive process in response to an item. There are four DOK levels, with 4 being the highest.
• Item and stimulus: A representation of the item and any associated stimulus material • Answer Key: The expected student response or example response from score point
value • Rubric and sample student response for each score point for short answer items:
Score point representations for student responses
A short description of the alignment of the item is provided as well. Each item is aligned to a specific PE but may align through an emphasis or focus on the different dimensions of the PE (the SEP, DCI, or CCC). Within each dimension and the overall alignment to the PE, the items may have differing degrees of alignment as well. Some items may align more strongly to the DCI and SEP while others align better to the SEP and less strongly to the CCC. The training test samples represent some, but not all, possible degrees of alignment to the three dimensions of the PEs.

Guide Content
2 2016–17 California Science Test Training Items Scoring Guide Updated March 15, 2017
The items included also represent a range of difficulties and cognitive approaches to the assessment of the CA NGSS. However, this sample is not yet fully representative of the full range of item difficulty that will be available later.
The first seven sample items are representative of a set of items collectively treated as a performance task from grade five. The 2017 pilot test will include one performance task. The next four sample items are from grade eight and are similar to items that will appear on the pilot test prior to the performance task. The final six sample items are from a high school performance task.
The sample items will include numbered instructional text preceding each grade level’s section of items as well as introductory text for performance tasks. Following are examples of introductory and instructional text for performance tasks.
Each item that follows has a metadata table like the one shown below. The item number in the table preceding each sample item corresponds to the sequence number of the item as it appears in the training test.
Example of Metadata Table:

Grade Five Sample Items
Updated March 15, 2017 2016–17 California Science Test Training Items Scoring Guide 3
Grade Five Sample Items
The following stimulus accompanies grade five items numbered 4, 5, 6, 7 and 8 in the training test.

Grade Five Sample Items
4 2016–17 California Science Test Training Items Scoring Guide Updated March 15, 2017
Item Grade PE SEP DCI CCC DOK
4 5 5-LS2-1 2. Developing and using models
LS2.A Interdependent Relationships in Ecosystems
4. Systems and system models 2
Key: D
Rubric: (1 point) The student selects the correct source of the oxygen in the water.

Grade Five Sample Items
Updated March 15, 2017 2016–17 California Science Test Training Items Scoring Guide 5
Item Grade PE SEP DCI CCC DOK
5 5 5-LS2-1 2. Developing and using models
LS2.A Interdependent Relationships in Ecosystems
4. Systems and system models 2

Grade Five Sample Items
6 2016–17 California Science Test Training Items Scoring Guide Updated March 15, 2017
Exemplar:
(1 point) “The pyramid shows that zooplankton eat matter in phytoplankton and algae. Insects eat matter in zooplankton, and fish eat matter in insects.”
(0 points) “Algae eat fish.” OR student provides off-topic, unclear, or no response.
Rubric:
(1 point)
The student demonstrates full understanding of the Performance Expectation, including
• developing a model to describe a phenomenon AND how food of almost any kind of animal can be traced back to plants;
• that organisms are related in food webs in which some animals eat the animals that eat plants;
• that some organisms, such as fungi and bacteria, break down dead organisms and therefore operate as decomposers;
• that decomposition eventually restores (recycles) some materials back to the soil; • that organisms can survive only in environments in which their particular needs are
met; • that a healthy ecosystem is one in which multiple species of different types are each
able to meet their needs in a relatively stable web of life; OR • that newly introduced species can damage the balance of an ecosystem.
(0 points) The student demonstrates little or no understanding of the Performance Expectation.

Grade Five Sample Items
Updated March 15, 2017 2016–17 California Science Test Training Items Scoring Guide 7
Item Grade PE SEP DCI CCC DOK
6 5 5-LS2-1 2. Developing and using models
LS2.A Interdependent Relationships in Ecosystems
4. Systems and system models 2
Key: B
Rubric: (1 point) The student selects the most likely consequence of a decrease in zooplankton.
Grade Five Sample Items
8 2016–17 California Science Test Training Items Scoring Guide Updated March 15, 2017
Item Grade PE SEP DCI CCC DOK
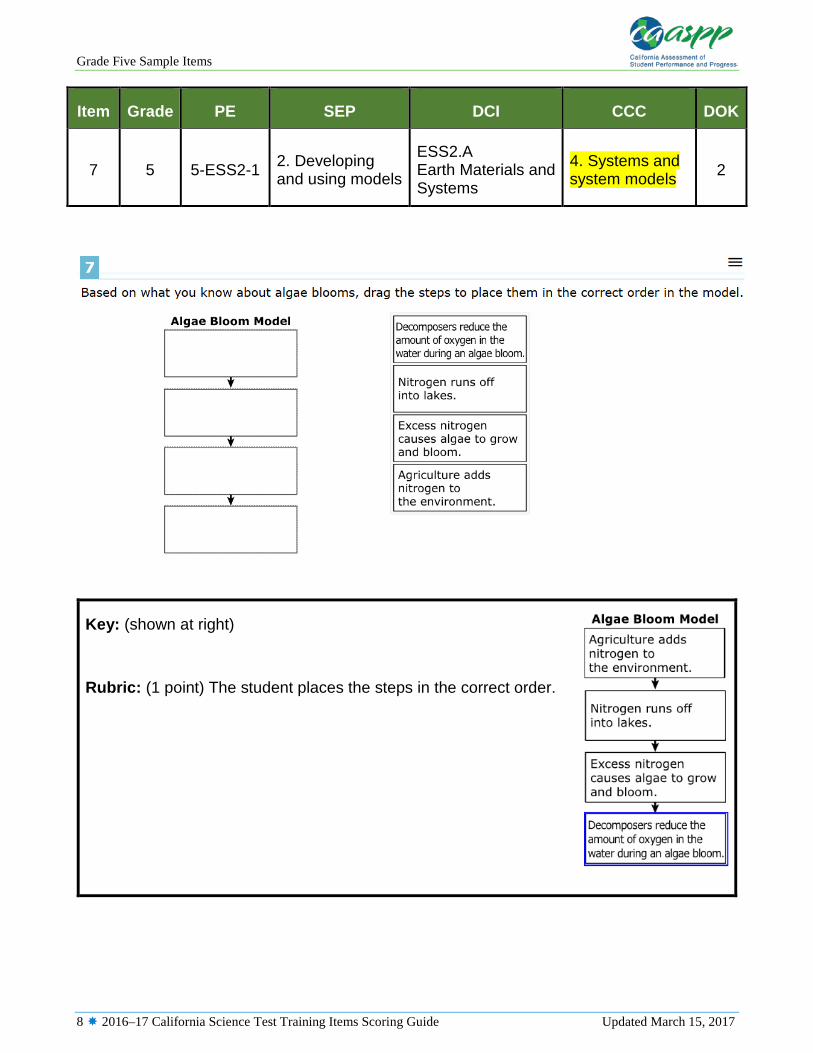
7 5 5-ESS2-1 2. Developing and using models
ESS2.A Earth Materials and Systems
4. Systems and system models 2
Key: (shown at right)
Rubric: (1 point) The student places the steps in the correct order.

Grade Five Sample Items
Updated March 15, 2017 2016–17 California Science Test Training Items Scoring Guide 9
Item Grade PE SEP DCI CCC DOK
8 5 5-ESS3-1
8. Obtaining, evaluating, and communicating information
ESS3.C Human Impacts on Earth Systems
4. Systems and system models 2
Key: 1st, 3rd, and 5th options
Rubric: (1 point) The student selects the correct types of data.

Grade Five Sample Items
10 2016–17 California Science Test Training Items Scoring Guide Updated March 15, 2017
The following text and simulation compose the stimulus that accompanies grade five items numbered 9 and 10 in the training test.

Grade Five Sample Items
Updated March 15, 2017 2016–17 California Science Test Training Items Scoring Guide 11
This section will be completed by the student within the test delivery system.

Grade Five Sample Items
12 2016–17 California Science Test Training Items Scoring Guide Updated March 15, 2017
Item Grade PE SEP DCI CCC DOK
9 5 5-ESS3-1
8. Obtaining, evaluating, and communicating information
ESS3.C Human Impacts on Earth Systems
4. Systems and system models 2
Key: 2nd and 3rd options
Rubric: (1 point) The student selects the correct policies.

Grade Five Sample Items
Updated March 15, 2017 2016–17 California Science Test Training Items Scoring Guide 13
Item Grade PE SEP DCI CCC DOK
10 5 5-ESS3-1
8. Obtaining, evaluating, and communicating information
ESS3.C Human Impacts on Earth Systems
4. Systems and system models 2

Grade Five Sample Items
14 2016–17 California Science Test Training Items Scoring Guide Updated March 15, 2017
Exemplar:
(2 points) “Nitrogen in water decreases. Populations of fish increase.” OR “Algae bloom shrinks.”
(1 point) Any one of the following: “Nitrogen decreases.” OR “Fish increase.” OR “Less algae”
(0 points) “Nitrogen increases.” OR “Water animals decrease.” OR “Algae increases.” OR student provides off-topic, unclear, or no response.
Rubric:
(2 points) The student demonstrates full understanding of the Performance Expectation, including the ability to
• obtain and combine information from reliable media to explain phenomena or solutions to a design problem; AND
• demonstrate an understanding of human activities in agriculture, industry, or everyday life that have major effects on any one of the following:
o Land o Vegetation o Streams o Oceans o Air o Outer space; AND
• demonstrate an understanding of actions individuals OR communities take to help protect Earth’s resources and environments
(1 point) The student demonstrates partial understanding of the Performance Expectation.
(0 points) The student demonstrates little or no understanding of the Performance Expectation.

Grade Eight Sample Items
Updated March 15, 2017 2016–17 California Science Test Training Items Scoring Guide 15
Grade Eight Sample Items Item Grade PE SEP DCI CCC DOK
12 8 MS-ESS1-1
2. Developing and using models
ESS1.B Earth and the Solar System
1. Patterns 2

Grade Eight Sample Items
16 2016–17 California Science Test Training Items Scoring Guide Updated March 15, 2017
Functionality: The student uses the dynamic slider to move the Moon to the correct position number in the model.
Key: Position 2
Rubric: (1 point) The student places the Moon in the correct position number. Any other position is incorrect and worth zero points.

Grade Eight Sample Items
Updated March 15, 2017 2016–17 California Science Test Training Items Scoring Guide 17
Item Grade PE SEP DCI CCC DOK
13 8 MS-ESS1-1
2. Developing and using models
ESS1.B Earth and the Solar System
1. Patterns 2
Exemplar: “The total solar eclipse only happens when the Moon, Earth, and Sun line up in a straight line.” OR “The total solar eclipse is rare because the Moon doesn’t always line up in the right place to block the Sun.” Rubric: (1 point) The student demonstrates full understanding of the Performance Expectation, including
• aspects of supporting an argument with evidence, data, or a model; AND • that the Sun is a star that appears larger and brighter than other stars because it is
closer to Earth. Stars range greatly in their distance from Earth. (0 points) The student demonstrates little or no understanding of the Performance Expectation.

Grade Eight Sample Items
18 2016–17 California Science Test Training Items Scoring Guide Updated March 15, 2017
Item Grade PE SEP DCI CCC DOK
14 8 MS-PS3-1 4. Analyzing and interpreting data
PS3.A Definitions of Energy
3. Scale, proportion, and quantity
2
l
Functionality: The value of the kinetic energy appears under the graph when the student moves the Car 5 bar to any point at 0.1 J intervals between 0.2 J and 4.5 J on the graph.

Grade Eight Sample Items
Updated March 15, 2017 2016–17 California Science Test Training Items Scoring Guide 19
Exemplar:
(2 points) The student receives 1 point for correct placement of the bar on the graph and 1 point for correct calculation of mass for a possible total of 2 points.
An example of correct bar graph placement (1 point)
An example of correctly calculated mass (1 point)

Grade Eight Sample Items
20 2016–17 California Science Test Training Items Scoring Guide Updated March 15, 2017
Rubric:
(2 points)
• The student moves the bar to a correct height and correctly calculates the mass.
(1 point)
• The student moves the bar to a height between 3.1 and 3.5 J (inclusive) on the bar graph. Any height less than or equal to 3.0 J or greater than or equal to 3.6 J is incorrect and worth zero points. OR
• The student enters a mass in the table that equals the kinetic energy listed in the first column of the table (which is from the bar graph) based on use of the following equation: 0.5 × mass × (velocity)2. The velocity used for this formula should be 2.0 m/s, as shown in the table. Any number combinations that do not yield the kinetic energy in the first column of the table based on the equation given [0.5 × mass × (2.0)2] are incorrect and worth zero points.
(0 points)
• The student places the bar at an incorrect height in the graph and incorrectly calculates the mass.
Item Grade PE SEP DCI CCC DOK
15 8 MS-LS2-1 4. Analyzing and interpreting data
LS2.A Interdependent Relationships in Ecosystems
2. Cause and effect: mechanism and explanation
2
(Item 15 continues on the following page.)

Grade Eight Sample Items
Updated March 15, 2017 2016–17 California Science Test Training Items Scoring Guide 21

Grade Eight Sample Items
22 2016–17 California Science Test Training Items Scoring Guide Updated March 15, 2017
Functionality: The student selects either “Increases” or “Decreases” from the drop-down menu for perch population. The graphs autopopulate for the perch and sea otter populations. The student completes the table by identifying the impact (Increases, Decreases, or Remains steady) on the populations of orcas, sea urchins, and kelp.
Exemplar: (1 point)
Choice: The student chooses “Increases” from the drop-down menu for perch population.
The graphs for the “Increases” selection are shown.
Key: The orca population increases, the sea urchin population decreases, and the kelp population decreases.
OR
Choice: The student chooses “Decreases” from the drop-down menu for perch population.
The graphs for the “Decreases” selection are shown.

Grade Eight Sample Items
Updated March 15, 2017 2016–17 California Science Test Training Items Scoring Guide 23
Key: The orca population decreases, the sea urchin population increases, and the kelp population decreases.
Rubric: (1 point) The student chooses the correct impacts for the initial selection.

High School Sample Items
24 2016–17 California Science Test Training Items Scoring Guide Updated March 15, 2017
High School Sample Items
Item Grade PE SEP DCI CCC DOK
18 High School HS-LS4-3 4. Analyzing and
interpreting data LS4.B Natural Selection 1. Patterns 2
Exemplar:
• “There are no short-winged flies because long wings are dominant.” OR • “There are no short-winged flies because short wings are recessive.”
Rubric:
(1 point) The student demonstrates a full understanding of the Performance Expectation, including aspects of applying concepts of statistics and probability in the expression of genetic information. The differential survival and reproduction of organisms in a population that have an advantageous heritable trait leads to an increase in the proportion of individuals in future generations that have the trait and to a decrease in the proportion of individuals that do not.
(0 points) The student demonstrates little or no understanding of the Performance Expectation.

High School Sample Items
Updated March 15, 2017 2016–17 California Science Test Training Items Scoring Guide 25
The following stimulus accompanies high school items numbered 19 and 20 in the training test.

High School Sample Items
26 2016–17 California Science Test Training Items Scoring Guide Updated March 15, 2017
Item Grade PE SEP DCI CCC DOK
19 High School HS-LS3-3 4. Analyzing and
interpreting data LS3.B Variation of Traits
3. Scale, proportion, and quantity
2
Key: 50
Rubric: (1 point) The student enters the correct percent.

High School Sample Items
Updated March 15, 2017 2016–17 California Science Test Training Items Scoring Guide 27
Item Grade PE SEP DCI CCC DOK
20 High School HS-LS3-3 4. Analyzing and
interpreting data LS3.B Variation of Traits
3. Scale, proportion, and quantity
2
Key: Aa, Aa
Rubric: (1 point) The student enters the correct genotypes.
High School Sample Items
28 2016–17 California Science Test Training Items Scoring Guide Updated March 15, 2017
Item Grade PE SEP DCI CCC DOK
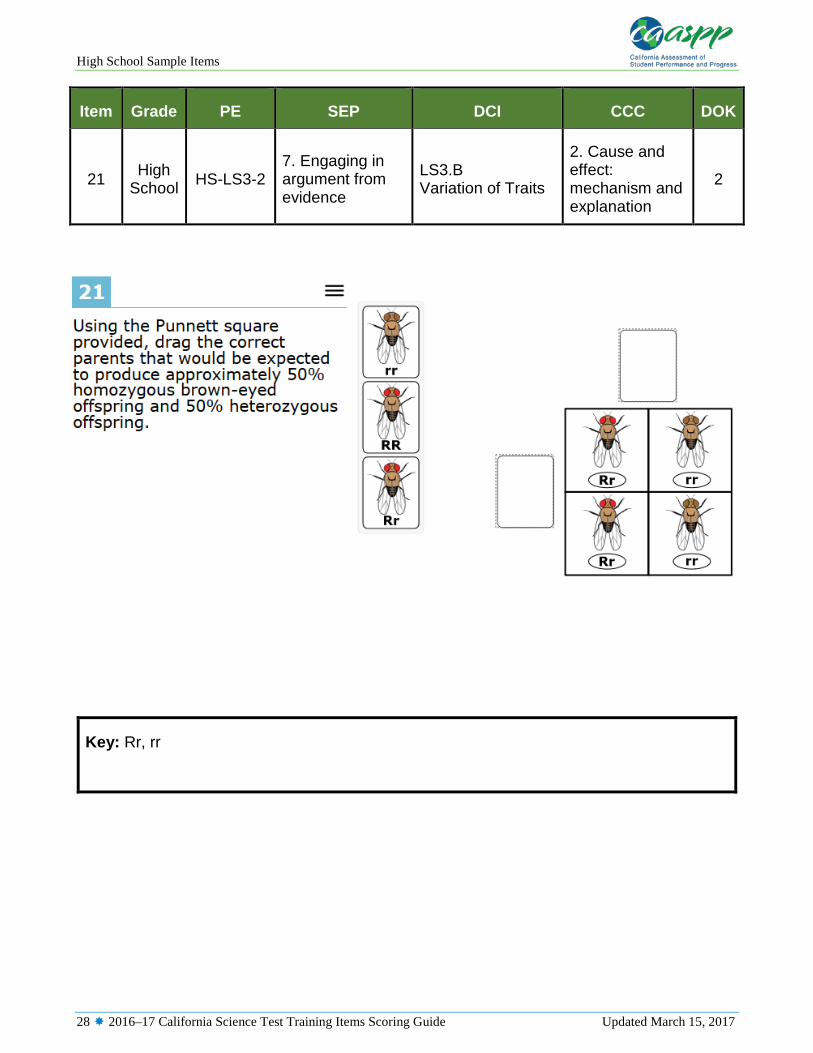
21 High School HS-LS3-2
7. Engaging in argument from evidence
LS3.B Variation of Traits
2. Cause and effect: mechanism and explanation
2
Key: Rr, rr

High School Sample Items
Updated March 15, 2017 2016–17 California Science Test Training Items Scoring Guide 29
Exemplar: The student may put the Rr genotype in the left box and the rr genotype in the top box.
OR
The student may put the rr genotype in the left box and the Rr genotype in the top box.
Rubric: (1 point) The student correctly enters the genotypes.

High School Sample Items
30 2016–17 California Science Test Training Items Scoring Guide Updated March 15, 2017
Item Grade PE SEP DCI CCC DOK
22 High School HS-LS4-2
6. Constructing explanations (for science) and designing solutions (for engineering)
LS4.B Natural Selection
2. Cause and effect: mechanism and explanation
3
Exemplar:
(2 points) “Light-bodied flies carry a recessive allele for dark body color, and the offspring homozygous for the recessive trait appear.”
(1 point) “The dark body is recessive.” OR “Homozygous offspring can appear later.”
Rubric:

High School Sample Items
Updated March 15, 2017 2016–17 California Science Test Training Items Scoring Guide 31
(2 points) The student demonstrates a full understanding of the Performance Expectation, including
• aspects of constructing explanations based on evidence obtained from a variety of sources; AND
• that natural selection occurs only if there is variation in the genetic information between organisms in a population.
(1 point) The student demonstrates a partial understanding of the Performance Expectation.
(0 points) The student demonstrates little or no understanding of the Performance Expectation.

High School Sample Items
32 2016–17 California Science Test Training Items Scoring Guide Updated March 15, 2017
Item Grade PE SEP DCI CCC DOK
23 High School HS-LS4-3
4. Analyzing and interpreting data
LS4.B Natural Selection 1. Patterns 2

High School Sample Items
Updated March 15, 2017 2016–17 California Science Test Training Items Scoring Guide 33
Functionality: The student chooses line segments inside the circle to create a pie chart and then places genotype labels on the sections of the pie chart.
Key: The student correctly labels the pie chart:
• One-half (50%) represents Bb. • One-fourth (25%) represents BB. • One-fourth (25%) represents bb.
Exemplars:
OR
Rubric: (1 point) The student correctly labels three portions of the pie chart to represent the genotypes.