california commission on teacher credentialing biennial ... · 12/2/2013 · california commission...
TRANSCRIPT

1
California Commission on Teacher Credentialing
Biennial Report #2
California State University Channel Islands Academic Years 2011-12 and 2012-13
Report Submitted: September 15, 2013
Last Site Visit: 2009
Name of Program: School of Education
Program Contact: Dr. Gary W. Kinsey
AVP for Academic Affairs and Director of the School of Education
Phone: (805) 437-2002
Fax: (805) 437-3302

2
Table of Contents
Section A. Credential Specific Information 3
Multiple Subject Credential Program 3
Multiple Subject Preliminary
Multiple Subject Intern
Single Subject Credential Program 26
Single Subject Preliminary (Mathematics, Science, English/
Language Arts, History/Social Science)
Single Subject Intern (Mathematics, Science, English/Language
Arts, History/Social Science)
Education Specialist Credential Program 54
Education Specialist Mild/Moderate Preliminary
Education Specialist Mild/Moderate Intern
Administrative Services Credential Program 69
Administrative Services Preliminary
Section B. Institutional Summary and Plan of Action 85

3
Commission on Teacher Credentialing
Biennial Report 2013
(For Institutions in the Green Cohort Due Fall 2013)
Academic Years 2011-2012 and 2012-13
Institution CSU Channel Islands
Date report is submitted September 15, 2013
Program documented in this report School of Education
Name of Program Multiple Subject Teaching Credential Program
Please identify all delivery options through
which this program is offered
(Traditional, Intern, Other)
Traditional and Intern (Note: There are no Multiple
Subject Interns for this period of reporting from
2011-2013)
Credential awarded Multiple Subject Preliminary Credential
Multiple Subject Intern Credential
Is this program offered at more than one site? No
If yes, list all sites at which the
program is offered
Program Contact Dr. Merilyn Buchanan, Interim Multiple Subject Program Coordinator
Title Professor of Elementary Education
Phone # 805-437-4579
E-Mail [email protected]

4
SECTION A – CREDENTIAL PROGRAM SPECIFIC INFORMATION
PART I – Contextual Information
The Multiple Subject (MS) Teaching Credential Program at CI graduates candidates with the necessary
skills to meet the needs of the diverse population found in California’s K-8 public schools. The following
student learning outcomes align with CCTC standards and expectations:
Teach all general education subjects in self-contained classroom
Teach children with English as first or second language
Understand and relate to linguistic and cultural diversity of children and families
Meet the diverse needs of all students and those with special needs
Be reflective and deliberate practitioners
Link content and pedagogy
Actively engage children in their learning
Integrate research, theory and best educational practice into their teaching
Teacher candidates are admitted into the Multiple Subject Program as full-time or part-time students. If successful, full-time students may complete the program in two semesters. Each semester has three content specific methods courses, a student teaching experience and an accompanying student teaching seminar. Part-time students may finish the program in three to six semesters depending upon the number of methods course in which they elect to enroll, and will additionally enroll in a field placement each semester they are not enrolled in student teaching Together the program coordinator and each part-time student develop an individualized study plan.
Table 1.1 Student Teaching (Full Time) Semester Overview
Timeline Time in Class Time/Activities in Field Evaluation
Weeks 1-8 Two full and two
half days for
subject methods
courses per week,
plus a weekly early
evening seminar
Fourteen hours a week: one full day
plus two mornings.
Minimum of 2 Informal
Evaluations; 2 Overview
Lesson Plans; Midterm
Evaluation; Evaluation of
Professional Dispositions
Weeks 9-16 Weekly early
evening seminar
Five full days a week; Responsible
for all teaching and planning for a
minimum of one full week in the
initial semester and two full weeks
in the advanced semester.
Minimum of 4 Formal
Evaluations; 4 Detailed
Lesson Plans; Final
Student Teaching
Evaluation

5
Table 1.2 Program Specific Candidate Information
Numbers of candidates and completers/graduates for two years reported
2011-2012 2012-2013
Number of
Candidates
Number of Program
Completers
Number of
Candidates
Number of Program
Completers
Fall 35 20 22 8
Spring 26 15 30 14
Multiple Subject Interns: There were no Multiple Subject Intern candidates in the 2011-12 and 2012-13 academic years, as there were few employment opportunities and our service area cooperating school districts were able to secure fully credentialed Multiple Subject candidates to meet their needs.
Changes Since Last Accreditation Activity (Biennial Report, Program Assessment or Site Visit)
Fall 2011
A Co-Teaching pilot program was introduced. Five students elected to be in year-long residencies, with four placed at the university’s professional development partner school and another with a county office school for special needs students. Regular Co-Teaching meetings were scheduled for all candidates, cooperating teachers, and supervisor participants, as well as program and field placement coordinators.
EDMS 566, Initial Student Teaching Seminar, was modified through the curriculum process from 1 to 2 units. Students meet weekly for 2 hours instead of bi-weekly for 2 hours, providing time to focus on both the discussion of their classroom placements and in working with young students (per feedback shown in 2011 Biennial Report), as well as introducing the PACT tasks.
Spring 2012
EDMS 565 and 575 (Initial and Advanced Student Teaching) were extended from one full day per week (Wednesdays) during the first eight weeks of the semester to include two additional mornings (Monday and Friday). Classroom experience time for all candidates was increased by 112 hours over the two semesters of student teaching.
Summer 2012
A series of meetings were held between program coordinators, methods instructors and cooperating teachers from our partner schools, some of whom are graduates from CI’s Multiple Subject Program. Each course in the program was reviewed in terms of its currency of content, value to the candidates’ overall preparation, and appropriateness of assignments to the school

6
settings. Recommendations were made and syllabi amended for Fall 2012 implementation. In response to CSU Exit and One-Year-Out survey feedback, each course has specific primary and secondary focuses to address areas that graduates identified as needing additional attention. (See Table 1.17 at the end of the Multiple Subject Program section of this report).
Fall 2012
The Co-Teaching Program was expanded and 9 students were placed in the year-long residency program. An additional school district (and partner school) hosted four of the Co-Teaching placements.
The four-unit Teaching Elementary Mathematics Methods course (EDMS 526) was modified through the curriculum process. Two courses resulted from the modification: EDMS 525 (3 units) is taught in the initial semester with a focus on K-3rd grade curriculum; EDMS 526 (2 units) was modified to focus on 4-6th grade curriculum and taught in the second semester. The grade level focus aligns with student teaching placements thus supporting candidates when working with young children (as noted in the 2001 Biennial Report) and upper elementary grades levels.
EDMS 566, Initial Student Teaching Seminar, and EDMS 576 initiated a two-semester binder in which candidates gathered evidence of preparation for the TPA (PACT).
Spring 2013
Additional EDMS courses were moved from our campus to two different partner school sites as part of our professional development school emphasis and development. Classroom teachers at the schools were actively involved in presenting to the candidates during the course sessions, and candidates visited classrooms to a greater degree to see theory in action.
The number of guest speakers (practicing educators and service providers) increased in both initial and advanced student teaching seminars, EDMS 566 and 576. Discussion topics included career choices, preparation for the job market, parent conferencing, working with special populations of students (The guest speakers support specific topics noted in the 2001 Biennial Report.
Note: EDMS = The official University course prefix used for the Multiple Subject Program coursework
SECTION A – CREDENTIAL PROGRAM SPECIFIC INFORMATION
PART II – Candidate Assessment/Performance and Program Effectiveness Information
a) What are the primary candidate assessment(s) the program uses up to and through
recommending the candidate for a credential?
Note: The response for both questions a) and b) follow the prompt for question b) below.

7
b) What additional information about candidate and program completer performance or program
effectiveness is collected and analyzed to inform programmatic decision-making?
The various assessment tools used by CI’s Multiple Subject Credential Program to evaluate candidate
progress/performance and program effectiveness are displayed in Table 1.3 below. The table lists all of
the assessments used by the program to assess candidates leading up to recommendation for a
credential—these are the items labeled “a” corresponding to the prompts above. Additional candidate
and program completer information used to make program decisions are labeled “b”. This is followed by
a report of the aggregated data on the four key assessments tools indicated by the blue background
shading in the Table 1.3.
Table 1.3 Assessment & Evaluation Tools used in the CI Multiple Subject Program
Assessment Tool Description Data Collected
a) Informal Student Teaching
Evaluation
Open-ended instrument
completed by University
Supervisor during initial visits
prior to full takeover
Professional dispositions
Early Teaching Behaviors
a) Formal Student Teaching
Evaluations
Rubrics completed by University
Supervisor on a minimum of four
visits per candidate per semester
Teaching Performance
Expectations 1-13
a) Midterm Student Teaching
Evaluations
Rubrics completed by student
teacher, cooperating teacher,
and university supervisor to
determine readiness for fulltime
student teaching
Teaching Performance
Expectations 1-13
a) Midterm Evaluation of
Professional Disposition
Checklist completed by
cooperating teacher, supervisor
and student teacher to rate
professionalism of candidate and
set goals for second half of
semester
Appearance
Attendance
Follow-Through
Professional Attitude
Relationship-students
Relationship-adults
Communication Skills

8
a) Statement of Concern A form for goal setting and
remediation for candidates who
need specialized support
Varies depending upon
assessment of candidate’s need /
performance deficiency
a) Course Evaluations Candidates rate course
objectives and instructor
performance
Course objectives
Course delivery
Course content
Instructor
a) Course Grades Students must maintain a B
average (3.0) minimum with no
grades lower than a C+
Learning
Coursework
Varies— might warrant a
Statement of Concern
b) Mock Interviews Advanced semester candidates
are interviewed by panels of 3 to
4 educators (drawn from
principals, cooperating teachers,
county / district level
administrators, directors of
human resources, university
faculty), provided written and
verbal evaluation of knowledge
and performance
Coursework
Learning from field placement
State content standards
Professional demeanor
a) Performance Assessment for
California Teachers (PACT)
State approved culminating
performance assessment
Teaching Performance
Expectations 1-13
a) Final Student Teaching
Evaluations
Rubrics completed by
cooperating teacher and
university supervisor to
determine either readiness for
second student teaching
experience or program
completion
Teaching Performance
Expectations 1-13
Professional disposition criteria
b) CSU System-wide Exit Survey Candidates completing the
program are surveyed about
their experiences in the program
Coursework
Fieldwork

9
Learning
Preparation to teach
b) CSU System-wide One-Year-
Out Survey
Candidates completing their
first year of teaching, and their
employers complete a survey
about the candidate’s
preparation to teach
Coursework
Fieldwork
Learning
Preparation to teach
c) Include aggregated data from 4-6 instruments that were described in prompts (a) and (b) above. Key Assessments for the CI Multiple Subject Credential Program used in response to this prompt include:
#1 PACT
#2 Final Student Teaching Evaluations
#3 CSU System-wide Exit Survey
#4 CSU System-wide One-Year-Out Survey
Key Assessment #1: PACT (TPA)
Description of Assessment: PACT
The Performance Assessment of California Teachers (PACT) is an alternative to the California TPA and
was developed by a consortium of public and private universities to meet the mandated Teacher
Performance Assessment requirements. PACT evaluates candidates on four of five tasks (excluding
Context) and a sixth criterion, all associated with a Teaching Event. The six categories are:
Task 1: Context Task 4: Assessment
Task 2: Planning Task 5: Reflection
Task 3: Instruction Academic Language
CI selected Elementary Mathematics (EM) as the core content area for the main teaching event in the
Multiple Subject Credential program.
Candidate submissions are evaluated against a standard rubric that ranges from 1 to 4, with "4" being
the highest and “2” being the minimum passing score on each of the 12 rubrics. Candidates pass the
10
Teaching Event if they pass ALL FIVE rubric categories (Planning, Instruction, Assessment, Reflection, and
Academic Language) AND have no more than 2 scores of "1" across all tasks. The cut score for each
category is as follows: 1.66 for Planning and Assessment (1 out of 3 scores can be a "1"); 1.5 in
Instruction, Reflection, and Academic Language (1 out of 2 scores can be a "1").
Summary of the Aggregated Data
Data from this key assessment is shown for program completers in AYs 2011-12 and 2012-13 by each of
the 12 rubrics that describe performance in the five critical teaching categories; the percentage of the
total number of completers scoring at each of the four score levels; the raw number of program
completers scoring at each level; and the average score attained on each rubric.
Table 1.5 PACT Scores by Rubrics for Fall 2011 and Spring 2012 Program Completers
n=42
Average
Score CRITERION 1 2 3 4
PLANNING 0% 34.1% 60.4% 5.5%
ESTABLISHING A BALANCED INSTRUCTIONAL
FOCUS 0 12 28 2 2.7
MAKING CONTENT ACCESSIBLE 0 17 21 4 2.7
DESIGNING ASSESSMENTS 0 14 27 1 2.7
INSTRUCTION 4.6% 48.8% 41.2% 4.4%
ENGAGING STUDENTS IN LEARNING 2 18 20 2 2.5
MONITORING STUDENT LEARNING DURING
INSTRUCTION 3 23 15 2 2.4
ASSESSMENT 8.7% 49.2% 35.7% 8.7%
ANALYZING STUDENT WORK FROM AN
ASSESSMENT 0 21 16 5 2.6
USING ASSESSMENT TO INFORM TEACHING 7 17 15 3 2.3
USING FEEDBACK TO PROMOTE STUDENT
LEARNING 4 24 14 3 2.4
REFLECTION 9.5% 45.2% 30.9% 14.2%
MONITORING STUDENT PROGRESS 4 18 15 5 2.5
REFLECTING ON LEARNING 4 20 11 7 2.4

11
ACADEMIC LANGUAGE 8.4% 66.6% 25% 0%
UNDERSTANDING LANGUAGE DEMANDS 6 25 11 0 2.1
SUPPORTING ACADEMIC LANGUAGE
DEVELOPMENT 1 31 10 0 2.2
Indicates the program’s highest scores
Indicates the program’s lowest scores
Table 1.6 PACT Scores by Rubrics for Fall 2012 and Spring 2013 Program Completers
n=38
Average
Score CRITERION 1 2 3 4
PLANNING 0% 41% 52% 7%
ESTABLISHING A BALANCED INSTRUCTIONAL
FOCUS 0 15 21 2 2.7
MAKING CONTENT ACCESSIBLE 0 18 15 5 2.7
DESIGNING ASSESSMENTS 0 14 23 1 2.7
INSTRUCTION 7% 49% 38% 7%
ENGAGING STUDENTS IN LEARNING 2 15 18 3 2.6
MONITORING STUDENT LEARNING DURING
INSTRUCTION 3 22 11 2 2.3
ASSESSMENT 9% 46% 39% 5%
ANALYZING STUDENT WORK FROM AN
ASSESSMENT 1 18 16 3 2.6
USING ASSESSMENT TO INFORM TEACHING 5 18 12 3 2.4
USING FEEDBACK TO PROMOTE STUDENT
LEARNING 4 17 17 0 2.3
REFLECTION 3% 51% 41% 5%
MONITORING STUDENT PROGRESS 1 17 17 3 2.6
REFLECTING ON LEARNING 1 22 14 1 2.4

12
ACADEMIC LANGUAGE 12% 54% 33% 1%
UNDERSTANDING LANGUAGE DEMANDS 5 20 12 1 2.2
SUPPORTING ACADEMIC LANGUAGE
DEVELOPMENT 4 21 13 0 2.2
Indicates the program’s highest scores
Indicates the program’s lowest scores
Table 1.7 Number of Candidates who did not pass PACT on their first attempt.
Fall 2011 0 Fall 2012 1
Spring 2012 1 Spring 2013 0
d) Assessor information related to the implementation of the TPA. Biennial reports for Multiple Subject or Single Subject programs must include the following assessor information related to the implementation of the TPA in addition to data for 4-6 key assessments:
1) The total number of assessors the program uses and the number of assessors who scored in the years for which the biennial report data is being submitted.
2) The number of assessors who successfully completed initial training and the number who recalibrated for the applicable biennial report years.
3) Data on (% of score agreement).
4) Modifications made to assessor selection, training, recalibration. (May also be addressed in Section A, Part IV).
Table 1.8 Assessor information related to TPA (PACT) implementation Semester Number of PACT
Assessors
Assessor Initial
Training and
Recalibration
Data on Reliability
Related to Double
Scoring
Modifications made to
assessor selection,
training, recalibration
Fall 2011 7 CAT1 Training
2 R
2/39% 2 external assessors
added
Spring 2012 7 10 R 5/125%
Fall 2012 4 3/117%
Spring 2013 5 2 Trainers
retrained/calibrated
1 T
2/43% Additional EM
trainer
1CATs: Content Area Tasks: part of the TPA assess candidates ability to effectively plan, instruct and assess in core content areas other than mathematics;
implemented and assessed at the course level by instructors using appropriate PACT rubrics.

13
Key Assessment #2: Final Student Teaching Evaluations
Description of the Assessment
Candidates in the Multiple Subject Credential Program complete a K-2 school student teaching
assignment during their initial semester in the program and a 3-6th grade student teaching in their
advanced semester in the program. Fall admit candidates who elect to be in the Co-Teaching Project are
placed in a 1st -5th grade classroom for the academic year. Each semester, students are in their student
teaching placements one full day a week and two full mornings for the first eight weeks of the semester.
The second eight weeks consist of full-time student teaching, returning one evening a week for seminar.
Both the university supervisor and the cooperating teacher complete a Final Student Teaching
Evaluation form, providing a copy and feedback to the student teacher. The initial semester Final
Student Teaching Evaluation is used to determine the "readiness" of candidates to proceed to the next
semester of the program, while for second semester candidates a successful Final Student Teaching
Evaluation result is one component of recommendation for a preliminary teaching credential.
Candidates are evaluated on the following categories using the Final Student Teaching Evaluation Form:
1) Professional Dispositions (15 items) 2) Planning and Assessment (12 items) 3) Instruction (14 items) 4) Environment for Learning (9 items)
The supervisor and the cooperating teacher indicate a candidate’s performance levels for each of the 50
skills/traits observed (when completing the Evaluation form) by using the following descriptors and
rating symbols:
EE = Exceeding Expectations (+) AE = Achieving Expectations (√+)
AP= Approaching Expectations (√) SA = Needs Special Attention (–)
UN = Unobserved or Not Applicable
(Designating Exceeding Expectations (EE) signifies an area of unusual strength for a beginning teacher.)
For the purpose of providing quantitative data in this report, the descriptors were assigned the following ratings:
3 Noteworthy evidence that the candidate meets this criterion (EE) 2 Considerable evidence that the candidate meets this criterion (AE) 1 Some evidence that the candidate meets this criterion (AP) 0 No evidence that the candidate meets this criterion (SA or UN - calculated as “0”) due to
data collection techniques in this reporting cycle)

14
Summary of Aggregated Data
Table 1.9 EDMS 565: Final Evaluations Initial Student Teaching
*Colors represent the same group/cohort of students as they travel through the program.
Table 1.10 EDMS 576: Final Evaluations Advanced Student Teaching
*Colors represent the same group/cohort of students as they travel through the program.
University Supervisor Cooperating Teacher
Plan Instr Mngt Prof Ave Plan Instr Mngt Prof Ave
Fall 2011
n=16 1.7 1.8 1.9 1.9 1.8
Fall 2011
n=11 2.03 2.0 2.15 2.19 2.1
Spring2012
n=8 2 2 2.13 1.87 2.06
Spring2012
n=8 1.87 2.0 2.13 2.37 2.11
Fall 2012
n=15 2 2.13 2.3 2.2 2.01
Fall 2012
n=11 2.18 2.27 2.36 2.45 2.32
Spring2013
n=14 2 1.92 2 2.07 2
Spring2013
n=10 1.8 1.9 2.1 2.3 2.03
Average 1.9 1.96 2.08 2.01 1.98 Average 1.97 2.04 2.19 2.33 2.14
University Supervisor Cooperating Teacher
Plan Instr Mngt Prof Ave Plan Instr Mngt Prof Ave
Fall 2011
n=20 2.0 2.25 2.2 2.2 2.14
Fall 2011
n=19 2.15 2.16 2.3 2.5 2.3
Spring2012
n=16 1.95 1.9 2.0 2.15 2.0
Spring 2012
n=16 2.06 2.06 2.26 2.3 2.16
Fall 2012
n=6 2 2.17 2.17 2.17 2.17
Fall 2012
n=6 2 2 2.17 2.17 2.08
Spring2013
n=12 2.08 2.25 2.34 2.4 2.3
Spring 2013
n=11 2.36 2.36 2.45 2.6 2.46
Average 2.01 2.14 2.18 2.23 2.15 Average 2.14 2.15 2.3 2.4 2.25

15
Key Assessment #3: CSU System-wide Exit Survey
Description of the Assessment
Each year, the CSU Chancellor’s Office administers an on-line survey to all credential program graduates.
Candidates rate the degree to which they were prepared on a lengthy list of items reported in four data
tables and a series of open-ended responses. While all of the information is valuable, only a selection of
item responses from the Effectiveness of Preparation for Teaching - Tables 1.11 & 1.12 - is displayed
below. These cover many areas relevant to candidate learning as well as program improvement, and are
the same areas highlighted in the 2011 Biennial Report to assist with identifying needs. Due to the
lengthiness of the open-ended responses, they are not included in this report but were used to confirm
and understand the numerical data.
Data collection process
At the end of each semester, graduating credential candidates are provided a URL
(www.csuexitsurvey.org) along with a specific campus code, to complete a 30-minute on-line survey
developed by the CSU Chancellor’s Office. To ensure a significant campus response rate, candidates are
asked to bring verification of Exit Survey completion to the Credential Services Office where it becomes
part of their student file for verification of completion to the CTC.
The following results were gathered for the period July 1, 2011 through August 1, 2013. During this Fall
2011 to Spring 2013 period, responses were received from 50 CSUCI Multiple Subject program
completers (although not all answered all sections or specific questions). Data for each campus is
aggregated by the CSU system office and reported to each campus.
Table 1.11 Overall Evaluation of Multiple Subject Teaching Credential Program
What is your overall evaluation of your Teaching Credential Program? Select the one
statement that most closely matches your current overall perspective on your program.
N=
46
72% I learned a lot in my university credential program. The program contributed in
important ways to my teaching this year.
46 26% I learned quite a bit that was important. The university program also included a
lot of material that has not been helpful.
46 0% The university program included relatively little substance. Most of the material
has been of little value in my teaching.
46 2% The university professional preparation program offered nothing of value. It was
almost entirely a waste of my time.

16
The data in the following tables (Tables 1.12 and 1.13) show all areas of the Exit Survey where CI
rated program and preparation elements above 75% and all areas below 50%. Those items that
were scored in the middle range, 79% - 51%, are not reported. Responses have been arranged
from high to low.
Indicates the program’s highest scores ≥ 80% (strengths)
Indicates the program’s lowest scores ≥ 50% (major concern)
Table 1.12 Effectiveness of Preparation for Teaching 1
… The university expects that you will also have chances to develop your teaching skills and ideas
with your mentor's help. Important aspects of a teacher's job are listed below. At the university,
how well prepared are you to begin each aspect of a teacher's job? Please finish each statement
below by selecting the radio button that best represents the level of your preparation.
As a new teacher, I am ... N
well
prepared
to begin
(3)
adequately
prepared
to begin
(2)
somewhat
prepared
to begin
(1)
not at all
prepared
to begin
(0)
...to evaluate and reflect on my own teaching
and to seek out assistance that leads to
professional growth.
49 90% 6% 0% 0%
...to prepare lesson plans and make prior
arrangements for students' class activities. 49 86% 10% 0% 0%
...to learn about my students' interests and
motivations, and how to teach accordingly. 49 82% 14% 0% 0%
...to use class time efficiently by relying on
daily routines and planned transitions. 49 78% 18% 0% 0%
...to adhere to principles of educational
equity in the teaching of all students. 49 76% 20% 0% 0%
Below 50%
...to meet the instructional needs of students
with special learning needs. 47 47% 23% 30% 0%
...to use computer-based technology to help
students learn subjects of the curriculum. 49 45% 35% 16% 0%
17
...to use computer-based technology for
instruction, research, and record keeping.. 49 45% 33% 10% 6%
...to know about resources in the school &
community for at-risk students and families. 49 41% 43% 10% 2%
Average Percentage (all questions)
66.52% 24.6% 4.17% 0.43%
Table 1.13 Effectiveness of Preparation for Teaching 2
At the university, how well prepared are you to begin each aspect of a teacher's job? Please finish
each statement below by selecting a radio button that best represents the level of your
preparation.
As a new teacher, I am ... N
well
prepared
to begin
adequately
prepared
to begin
somewhat
prepared
to begin
not at all
prepared
to begin
Can
Not
Answer
(N)
...to design hands-on classroom
activities that suit the attention
spans of my students.
47 94% 6% 0% 0% 2
...to enable my young students to
interact with their peers in
healthy, productive ways.
47 85% 15% 0% 0% 2
...to create an environment that
supports language use, analysis,
practice and fun.
47 81% 19% 0% 0% 2
...to teach science according to
California State Content Standards
in science.
47 81% 19% 0% 0% 2
...to assist students in managing
their time and in keeping track of
school assignments.
46 80% 17% 2% 0% 3
...to assist individual students in
areas of their instructional needs
in reading and mathematics.
47 79% 17% 4% 0% 2
...to build on peer friendships,
develop group skills, and
encourage leadership roles.
47 79% 19% 0% 2% 2

18
...to assist students in decision-
making, problem-solving, and
critical thinking.
47 79% 21% 0% 0% 2
...to teach reading-language arts
according to California Content
Standards in reading.
47 79% 21% 0% 0% 2
...to teach mathematics according
to California Content Standards in
math.
47 79% 21% 0% 0% 2
...to teach physical education
according to the California P. E.
Curriculum Framework.
47 77% 21% 2% 0% 2
...to promote the academic skills
of pupils at different levels of prior
proficiency.
47 77% 21% 2% 0% 2
...to use language so pupils at
different levels understand oral
and written English.
47 77% 21% 2% 0% 2
Below 50%
...to teach visual and performing
arts according to California
Content Standards.
47 47% 26% 26% 2% 2
Average Percentage (all questions)
74.2% 21.68% 3.59% 0.36% 2
Key Assessment #4: CSU System-wide One-Year-Out Survey
Description of the Assessment
First-year CSU prepared teachers and their supervisors respond to the ‘One-Year-Out’ survey conducted by the CSU annually which gathers data on a campus’ program effectiveness in 34 significant domains of the Learning-to-Teach curriculum. The questions intend to measure program effectiveness on three dimensions:
1. The extent to which K-12 teachers are prepared effectively for their most important teaching responsibilities
2. The extent to which CSU professional coursework and fieldwork that the new teachers complete are professionally valuable and helpful to them during their initial year K-12 teaching, and

19
3. The extent to which programs that the new teachers completed in the CSU, match in quality the program characteristics and features that are identified in professional accreditation standards.
The survey results are reported to each campus and a comparison made to the mean of all CSU campus responses. The data are used to examine the quality of the program and identify areas in need of improvement. The most current data set (2012) represents responses from the 2010-2011 cohort of graduates - who
were represented in the 2009-2011 Biennial Report. We had a 50% response rate from our 40 graduates
(n= 20) and a good response rate from their supervisors (n = 15). The number of candidates employed
one year after graduation determines the response rate.
Seventeen composite measures, assessing the significant domains of the learning-to-teach curriculum,
summarize the responses to groups of questions. The name of each measure identifies its focus and
whether it summarizes responses by teachers or supervisors. The composites are more reliable than
responses to any individual item and these are reported below in Table 1.15.
Data collection process
Data collection involves the employed graduates and their school-site supervisors answering an
extensive set (100+) of common and credential-specific questions as the beginning teachers near the
end of their first year in classrooms. The intention is to capture judgments and reflections on the
quality, value and effectiveness of the teachers’ preparation programs by asking respondents to rate the
beginning teacher as Well Prepared, Adequately Prepared, Somewhat Prepared or Not-at-All Prepared
on each item. Thematically related questions are grouped to provide composite scores that represent
important topics for programs to consider.
Summary of aggregated data
Table 1.14 Teachers Assess Overall Effectiveness of CI’s/CSU’s Multiple Subject Programs
Cohort Total
Respondents
Total No.
of
Judgments
Well
Prepared
Adequately
Prepared
Somewhat
Prepared
Not-at-All
Prepared
Well +
Adequately-
Prepared
CSUCI
2010-11
20 401 39% 49% 10% 2% 88%
System
2010-11
362 10,230 39% 38% 18% 5% 77%

20
Table 1.15 Supervisors Assess Overall Effectiveness of CI’s/CSU’s Multiple Subject Programs
Cohort Total
Respondents
Total No.
of
Judgments
Well
Prepared
Adequately
Prepared
Somewhat
Prepared
Not-at-All
Prepared
Well +
Adequately-
Prepared
CSUCI
2010-11
15 401 58% 31% 11% 0% 89%
System
2010-11
362 10,230 46% 38% 15% 1% 84%
Table 1.16 Supervisors’ and Teachers’ composite evidence about MS Programs.
Supervisor
Composite
CSUCI
Supervisor
Composite
CSU
Teacher
Composite
CSUCI
Teacher
Composite
CSU
Teach Reading-Language Arts K-8 95% 85% 98% 88%
Teach Mathematics in Grades K-8 94% 88% 98% 85%
Teach Other Subjects K-8 85% 83% 85% 68%
Plan Instruction for All Students and Subjects 88% 86% 91% 82%
Motivate Students to be Active Learners 93% 87% 91% 83%
Manage Instruction for Learning 90% 83% 82% 76%
Use Education Technology Effectively 100% 90% 71% 66%
Use Good Pedagogy Across the Curriculum 89% 84% 89% 78%
Assess and Reflect on K-12 Teaching 92% 82% 87% 80%
Equity and Diversity in K-12 Education 85% 80% 89% 78%
Teach Young Children in Grades K-3 97% 78% 88% 85%
Teach Middle-Grade Students in Grades 4-8 85% 84% 81% 80%
Teach English Learners in Grades K-12 90% 83% 90% 80%

21
Teach Special Learners in Inclusive Schools 87% 81% 89% 75%
Value of CSU Professional Coursework N/A N/A 86% 81%
Value and Quality of Fieldwork Experiences N/A N/A 88% 83%
Elements that CI graduates or their supervisors rated ≥ 10% higher than system-wide respondents
Elements that rated ≥ 10% higher than the figures reported in CI’s 2011biennial report
Lowest rated items (less than 75% of responses indicate “Well or Adequately-Prepared”
PART III – Analyses and Discussion of Candidate and Program Data
Key Assessment #1: PACT
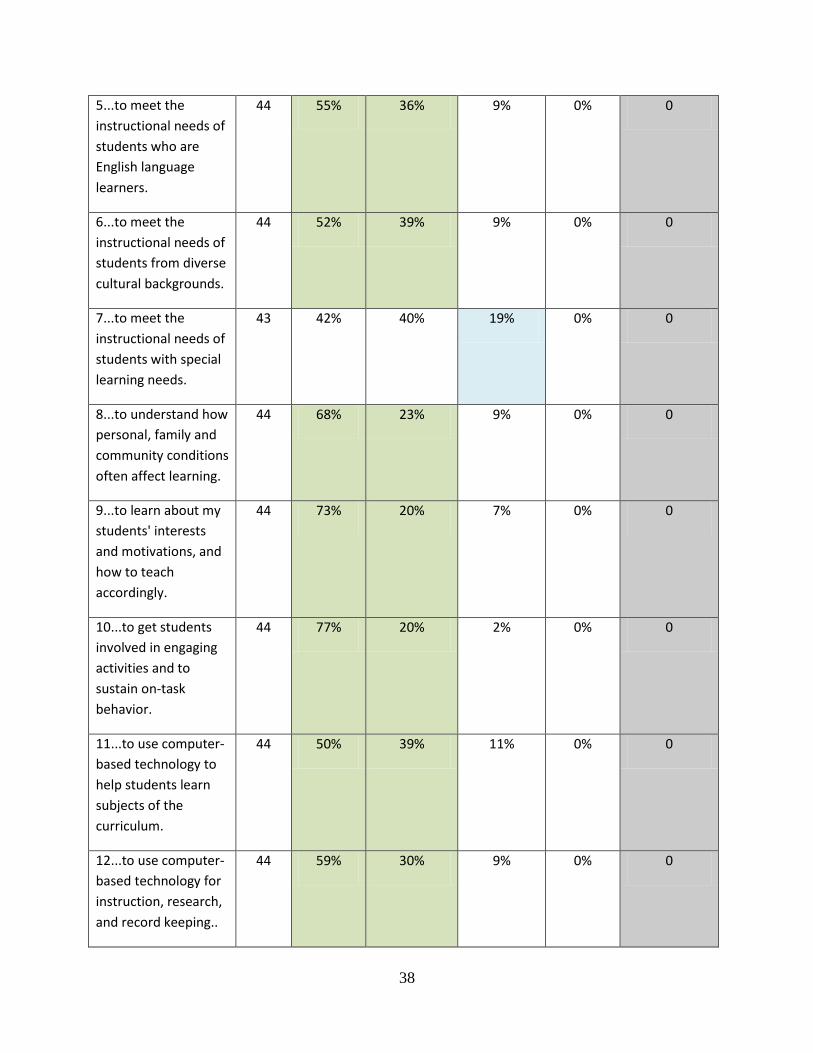
Refer to Tables 1.5 & 1.6
Results from this key assessment shown for program completers from AYs 2011-12 and 2012-13 have
remained relatively constant between this reporting period and the previous (2011). Data show
candidates have particular strength in Planning for Instruction (2.7). Within other domains candidates
demonstrate through their Instruction video and commentary evidence that they are able to engage
learners (2.6), exhibit their ability to analyze students’ Assessment data (2.6) and, relatedly, show
through their Reflection on Practice the ability to monitor students’ progress (2.6).
Academic Language remains an area for improvement (2.1 and 2.2). This is a consistent finding both
across CI results and across PACT institutions. Working with campus representatives, the PACT center is
continually working to clarify the scoring criteria of the two Academic Language Development rubrics.
It is disappointing that despite efforts within the Multiple Subject program to: (a) strengthen candidates’
understanding of language demands of the curriculum faced by all students, and (b) help candidates
create a systematic plan and develop a repertoire of skills for building and supporting their students’
academic language proficiency, that these remain an area of significant need. These issues need to
continue to be a priority across the program.
Key Assessment #2: Final Student Teaching Evaluations
Refer to Tables 1.9 and 1.10
Data from this key assessment indicates that as candidates student teach they are progressing in their
abilities to effectively plan, instruct, and manage the learning environment, and are developing

22
professional characteristics. The data shows, as would be expected, that the teaching performance of
the advanced semester candidates is rated stronger than that of initial semester candidates. Although
cooperating teachers evaluation of candidates tends to be very slightly higher that the university
supervisors’, overall the assessments by both evaluator groups are highly consistent, thus supporting
the reliability of the how our candidates are evaluated. The data suggests that the program is effective
in helping candidates achieve our desired expectations for them, and that it assists candidates’ progress
in building skills and confidence along many dimensions of teaching.
Aggregated data from this assessment tool reflects when there have been issues in the field with either
the performance of a candidate or a mismatch between the cooperating and student teacher, or if a
new feature in the program is piloted. For example, the Fall 2011/Spring 2012 cohort’s data show low
evaluations by university supervisors of candidates (see Tables 1.9 and 1.10). This reflects poor
performance evaluations for two students who were supported through student teaching into the
second semester but who did not pass the final student teaching experience.
It is worth noting that during data collection a number of “N/A” scores appeared in the Final Student
Teaching Evaluations. These N/A scores were recorded as “0” for this round of data collection, artificially
deflating the overall average scores. This highlights the need to reinforce to university supervisors and
cooperating teachers the importance of documenting and recording assessment data.
For Key Assessments #3 and #4 a color-coding rating system was used to identify areas of strength
(green) and areas of major concern (pink). Corresponding percentages used to determine the rating
were: 80% and higher = strength; 30% and below = major concern.
Key Assessment #3: CSU System-wide Exit Survey
Refer to Tables 1.11-1.13
Overall, the CI Multiple Subject Program graduates from Fall 2011 through Spring 2013 (n=46) were
satisfied with their credential program believing they “learned a lot” and that “the program contributed
in important ways to (their) teaching.”
Candidates reported being most prepared for: (a) designing hands-on classroom activities matched to
students’ attention spans (94%); (b) preparing lesson plans and arranging for class activities (86%); and
(c) using class time efficiently by relying on daily routines and planned transitions (78%). They were well
prepared to adhere to principles of educational equity in the teaching of all students, including: enabling
healthy, productive ways for students to interact with peers; and to reflect on practice. Preparation to
teach core subject was rated highly: (a) 83% were particularly well prepared to teach mathematics, and
(b) 81% of candidates believed themselves to be well prepared to teach both language arts and science,
as well as create a supportive, fun environment for language use, and development; while (c) 82% were
confident in their ability to learn about and teach to their students' interests and motivations.

23
Candidates reported being well or adequately prepared to evaluate and reflect on their teaching, as well
as seek assistance that would lead to professional growth (90%). Students were well supported and
guided by their university supervisors (85%) and cooperating teacher (89%) in their field experiences.
The data highlighted where the program needs to evaluate how to best prepare candidates. Figures
showed the percentage of candidates who felt ‘somewhat’ or ‘not’ prepared to meet the instructional
needs of students with special learning needs (30%), with 12% not adequately knowing about school
and community resources to help them support at-risk students and families. One particular curriculum
area that needs to be reviewed is candidates’ preparation to teach visual and performing arts (28%).
Additionally, candidates need to be prepared to use computer-based technology to both help students
content (16%) and for instructional and record keeping purposes (12%).
Key Assessment #4: CSU System-wide One-Year-Out Survey
Refer to Tables 1.14-1.16
As shown on Table 1.16, 85% or more of employers (n=15) regarded their CI prepared teachers (n=20) as
well prepared on all fourteen composite measures. Overall, the supervisors/principals rated the
teachers beginning skills higher than did the teachers themselves. In all categories, CI was rated higher
than the average scores for all CSU campuses.
Four areas of preparation that received the highest rating from principals were: teaching reading (95%)
and teaching mathematics (94%), motivating students (93%), and teaching young children (97%). This
last area was identified in the 2011 Biennial Report as in need of attention. Measures were taken in the
past year to address this need, such as a course specifically aimed at teaching mathematics to K-2nd
grades. These program revisions appear to have been successful.
Like their principals, beginning teachers recognized the preparation they received to teach core content
areas: 98% considered being well prepared to teach reading and mathematics. They also identified being
well prepared to plan lessons and motivate students (98%). Beginning teachers see themselves well or
adequately prepared to meet the needs of students with special needs (89%) as do their principals
(87%), and 90% of both groups recognized the teachers being well prepared to teach English learners
(90%).
It is interesting to note, that 71% of program graduates (the lowest rated area) and 100% of their
employers regard the beginning teachers as well prepared to effectively use technology, yet 16%
students exiting the Multiple Subject program do not consider themselves well or even adequately
prepared in using instructional or management technologies.
24
Data Analysis and Discussion Summary
CI candidates who responded to the CSU One-Year -Out Survey (Key Assessment #4) completed the CI
Multiple Subject Credential Program in 2010-2011. Therefore, data from this key assessment does not
directly align with data reported for Key Assessment Tools #1-3. However, data from the one-year-out
survey does allow us to look at the impact of program changes implemented based upon the data
contained in our previous biennial report.
PART IV – Use of Assessment Results to Improve Candidate and Program Performance
Each program describes how it used the data from analyses of candidate assessments and program
effectiveness to improve candidate outcomes and program effectiveness. The focus of this section
should not be on the process employed by the institution to discuss changes (although it can be
mentioned briefly), but on the actual considered, proposed, or implemented programmatic changes
specific to the data. If proposed changes are being made, please connect the proposed changes to the
data that stimulated those modifications and to the Program and/or Common Standard(s) that
compels program performance in that area. If preferred, programs may combine responses to
Sections III (Analysis of the Data) with Section IV (Use of Assessment Results to Improve Candidate
and Program Performance) so long as all the required aspects of the responses are addressed.
Issue Proposed Changes/Plan of Action Data Source/s
Academic Language (AL)1 Address academic content language in methods
coursework
Incorporate more direct instruction about PACT
and (AL) in coursework - especially math methods
and seminars
All faculty members to become certified PACT
evaluators to further knowledge of AL
Key Assessment #1
Meeting Instructional
needs of Students with
Special Learning Needs1
Meet with EDSS 560 Instructors to share
qualitative and quantitative feedback.
SELPA guest speaker in student teaching seminar,
to review prior SPED 345 content
Key Assessment #3
Key Assessment #4
Knowledge of school and
community resources for
at-risk students1
A school principal and a district level Assistant
Superintendent for Curriculum Services invited to
speak on the topic at the advanced student
teaching seminar
Key Assessment # 3

25
Building knowledge and
skills in instructional and
management
technologies1
New undergraduate course, COMP 110:
Computing for Educators, approved through the
university curriculum process. To be
implemented in Fall 2013, co-taught by a CI faulty
member and the County Office of Education’s
technology specialist
Key Assessment # 3
Preparation for teaching
visual and performing
arts
Discussions with Performing Arts faculty for
workshop to refresh students’ knowledge of
Teaching Drama to Children (EDUC 343).
Professor from neighboring institution will hold
‘ACT’ workshop during initial semester seminar.
Key Assessment # 3
Table 1.17 MS Program Courses’ Special Focus Topics as Identified in 2011 Biennial Report
1 Table 1.17 below was created in consultation with course instructors, cooperating teachers (some of whom are
program graduates), Multiple Subject and PACT (TPA) coordinators during a series of program review meetings.
Each course in the Multiple Subject Credential program was assigned a primary and secondary focus
topic to be incorporated into the course curriculum.
Course Focus 1 Focus 2
522 Lit 1 Special populations: At Risk students Special populations : EL
523 Lit 2 Technology infusion Parent Involvement
525 Math K-3 Special populations: At Risk students
526 Math 4-6 Special populations: GATE provision
527 HSS/Integrated Art Parent Involvement Technology
529 Science / Health /PE Special populations: EL: vocab/concepts Technology
566 Initial Seminar Parent Involvement
576 Advanced Seminar Special populations: EL

26
Commission on Teacher Credentialing
Biennial Report 2013 (For Institutions in the Green Cohort Due Fall 2013)
Academic Years 2011-2012 and 2012-13
Institution CSU Channel Islands
Date report is submitted September 15, 2013
Program documented in this report School of Education
Name of Program Single Subject Teaching Credential Program
Please identify all delivery options through
which this program is offered.
Traditional and Intern (Note: There are no Single
Subject Interns for this period of reporting from
2011-2013)
Credential awarded Single Subject Preliminary Credential (English, Mathematics, Science, History/ Social Science)
Single Subject Intern Credential (English, Mathematics, Science, History/Social Science)
Is this program offered at more than one site? No
If yes, list all sites at which the
program is offered
Program Contact Dr. Jeanne M. Grier, Single Subject Program Coordinator
Title Professor of Secondary Education
Phone # 805-437-8987
E-Mail [email protected]

27
SECTION A – CREDENTIAL PROGRAM SPECIFIC INFORMATION
PART I – Contextual Information
Students admitted into the Single Subject Program can be full-time, part-time, or an intern if they have
obtained a teaching position in a secondary school. If successful, full-time students may complete the
program in two semesters with student teaching (EDSS 575/585) in each semester along with a content
specific methods course and other coursework. Part-time students and Interns may finish the program
in three to six semesters depending upon the sequence option they choose, but will be enrolled in a
field placement (EDSS 570/580) each semester not enrolled in student teaching (EDSS 575/585). Intern
students can finish the program in three semesters taking a modified part-time schedule developed in
conjunction with the program advisor.
Table 2.1 Student Teaching (Full Time) Semester Overview
EDSS 575 (MIDDLE SCHOOL) AND EDSS 585 (HIGH SCHOOL)
Timeline Time in Class Time/Activities in Field Evaluation
Weeks 1-8 Three to four day or
evenings per week
including a weekly
seminar
Eight hours a week: either one
full day or two half days; teach 1-
2 periods/lessons weeks 4-8
Minimum of 2 Informal
Evaluations; 2 Overview
Lesson Plans; Midterm
Evaluation
Weeks 9-16 One evening once a
week in seminar may
include a methods
class
Five full days a week; Responsible
for all teaching and planning for
four full weeks; Two week phase
in/out
Minimum of 4 Formal
Evaluations; 4 Detailed
Lesson Plans;
Final Evaluation
Table 2.2 Program Specific Candidate Information
Numbers of candidates and completers/graduates for two years reported
2011-2012 2012-2013
Number of
Candidates
Number of
Completers/
Graduates
Number of
Candidates
Number of
Completers/
Graduates
Fall Math = 8
Science = 5
English = 8
Math = 6
Science = 2
English = 3
Math = 8
Science = 4
English = 6
Math = 0
Science = 2
English = 2

28
History/SS = 7
Total = 28
History/SS = 3
Total = 14
History/SS = 11
Total = 29
History/SS = 4
Total = 8
Spring Math = 2
Science = 5
English = 7
History/SS = 10
Total = 24
Math = 1
Science = 2
English = 4*
History/SS = 3
Total = 10
Math = 13
Science = 6
English = 7
History/SS = 14
Total = 40
Math = 6
Science = 2
English = 3
History/SS = 7
Total = 17**
Single Subject Interns: There were no Single Subject Intern candidates in the 2011-12 and 2012-13 academic years, as there were few employment opportunities and our service area cooperating school districts were able to secure fully credentialed Single Subject candidates to meet their needs.
Changes Since Last Accreditation Activity (Biennial Report, Program Assessment or Site Visit)
Spring 2012
EDSS 530 (General Secondary Methods) moved to afternoon to relieve burden of evening class scheduling
Fall 2012
EDSS 533 & EDSS 534 (English and Social Studies Middle School Methods) offered as daytime courses
Content Methods courses (EDSS 541, 542, 543, 544) modified in the curriculum process from 4 to 3 units. Supplemental literacy component removed. Emphasis on Common Core Standards added. Will be offered/implemented in Spring 2014.
EDSS 540 Literacy in Secondary Schools reinstated as a 2-unit course and retitled: Literacy in the Content Areas. Will address academic literacy, especially strategies to provide access to complex texts and support for writing tasks, in the Common Core Standards across content areas in all disciplines. Will be offered/implemented in Spring 2014.
Seminars and Student Teaching Field Experiences title changes to “Initial” and “Advanced” rather than school site or grade level dependent. Effective Fall 2013.
Spring 2013
All EDSS students placed in high schools to match field placement with methods course level.
All EDSS High School Content methods courses (EDSS 541, 542, 543, 544) offered in a one night a week all semester long format.

29
SECTION A – CREDENTIAL PROGRAM SPECIFIC INFORMATION
PART II – Candidate Assessment/Performance and Program Effectiveness Information
a) What are the primary candidate assessment(s) the program uses up to and through
recommending the candidate for a credential?
Note: The response for both questions a) and b) follow the prompt for question b) below.
b) What additional information about candidate and program completer performance or program
effectiveness is collected and analyzed that informs programmatic decision-making?
The various assessment tools the CI Single Subject Credential Program uses to evaluate candidate
progress/performance and program effectiveness are displayed in Table 2.3 below. Data summaries will
not be given for each assessment as in a full accreditation report. Instead, data will be presented for the
four highlighted key assessment tools. The table below lists all the assessments used by the program to
assess candidates up to and through recommendation for a credential—these are the items labeled “a”
corresponding to the prompt above. Additional candidate and program completer information used to
make program decisions are labeled “b”. This is followed by a report of aggregated data on the four
highlighted key assessments.
Table 2.3 Assessment & Evaluation Tools used in the CI Single Subject Program
Assessment Tool Description Data Collected
a) Informal Student Teaching
Evaluation
Open-ended instrument
completed by University
Supervisor during first two
student teaching visits prior to
full takeover
Professional dispositions
Early Teaching Behaviors
a) Formal Student Teaching
Evaluations
Rubrics completed by University
Supervisor on a minimum of four
visits per candidate per semester
Teaching Performance
Expectations 1-13
a) Midterm Student Teaching
Evaluations
Rubrics completed by student
teacher, cooperating teacher,
and university supervisor to
determine readiness for fulltime
student teaching
Teaching Performance
Expectations 1-13
a) Professional Dispositions Survey given to cooperating
teachers to rate candidate
professionalism
Appearance
Attendance

30
Follow-Through
Professional Attitude
Relationship-students
Relationship-adults
Communication Skills
a) Statement of Concern A form for goal setting and
remediation for candidates who
need specialized support
Varies depending upon
deficiency
a) Course Evaluations Candidates rate course
objectives and instructor
performance
Course objectives
Course delivery
Course content
Instructor
*Not used in Program Evaluation
a) Course Grades Students must maintain a B
average (3.0) minimum with no
grades lower than a C+
Varies—this would warrant a
“Statement of Concern”
b) Single Subject Program End of
Year Survey
Candidates after their first
semester in the program
Coursework
Fieldwork
Learning
Preparation to teach
a) Performance Assessment of
California Teachers (PACT)
State approved culminating
performance assessment
Teaching Performance
Expectations 1-13
a) Final Student Teaching
Evaluations
Rubrics completed by
cooperating teacher and
university supervisor to
determine either readiness for
second student teaching
experience or program
completion
Teaching Performance
Expectations 1-13
31
b) CSU System-wide Exit Survey Candidates completing the
program are surveyed about
their experiences in the program
Coursework
Fieldwork
Learning
Preparation to teach
b) CSU System-wide One-Year-
Out Survey
Candidates in their first year of
teaching, and their employers
complete a survey about the
candidate’s preparation to teach
Coursework
Fieldwork
Learning
Preparation to teach
c) Include aggregated data from 4-6 instruments that were described in (a) and (b).
Key Assessments utilized for this analysis of the CI Single Subject Credential Program:
#1 TPA (PACT)
#2 Final Student Teaching Evaluations
#3 CSU System-wide Exit Survey
#4 CSU System-wide One-Year-Out Survey
Key Assessment #1: TPA (PACT)
Description of Assessment: PACT
The Performance Assessment of California Teachers (PACT) is an alternative to the California TPA and
was developed by a consortium of public and private universities to meet the mandated Teacher
Performance Assessment requirements. PACT evaluates candidates on four of five tasks (excluding
Context) and a sixth criterion, all associated with a Teaching Event. The six categories are:
Task 1: Context Task 4: Assessment
Task 2: Planning Task 5: Reflection
Task 3: Instruction Academic Language
CI has a process for recruiting, training, and calibrating scorers in each of the four single subject content areas. Candidate submissions are evaluated against a standard rubric that ranges from 1 to 4 with "4"

32
being the highest. Candidates pass the Teaching Event if they pass ALL FIVE rubric categories (Planning, Instruction, Assessment, Reflection, and Academic Language) AND have no more than 2 scores of "1" across all tasks. The cut score for each category is as follows: 1.66 for Planning and Assessment (1 out of 3 scores can be a "1"); 1.5 in Instruction, Reflection, and Academic Language (1 out of 2 scores can be a "1").
Summary of Aggregated Data Table 2.4 Number of Candidates who did not pass PACT on their first attempt
Fall 2011 = 0 Fall 2012 = 1 (History/Social Science)
Spring 2012 = 0 Spring 2013 = 0
Table 2.5 PACT Scores by Discipline for Fall 2011, Spring 2012, Fall 2012 & Spring 2013
Completers
Planning Instruction Assessment Reflection Academic
Language
English (n=11) 3.06 2.55 2.88 2.91 2.36
Math (n=13) 2.77 2.15 2.23 2.54 1.88
History/Social
Science (n=16)
2.74 2.42 2.46 2.44 2.03
Science (n=7) 3.04 2.79 2.95 2.21 2.43
Total 2.90 2.48 2.63 2.53 2.18
*Green = high score in category; Orange = low score in category
Table 2.6 PACT Scores by Cohort Completers
Planning Instruction Assessment Reflection Academic
Language
Fall 2011
(n=13)
2.92 2.58 2.69 2.62 2.31
Spring 2012
(n=11)
2.85 2.36 2.24 2.36 2.0

33
Fall 2012
(n=9)
2.93 2.50 2.74 2.44 2.17
Spring 2013
(n=14)
2.80 2.30 2.60 2.68 2.04
Total 2.88 2.44 2.57 2.53 2.13
Colors correspond to completer groups in Tables 2.11 & 2.12 below.
Biennial reports for Multiple Subject or Single Subject programs must include the
following assessor information related to the implementation of the TPA in addition to data
for 4-6 key assessments:
5) Table 2.7 Number of Assessors: The total number of assessors the program uses and the
number of assessors who scored in the years for which the biennial report data is being
submitted.
ELA HSS Math Science
Fall 2011 2 2 3 1
Spring 2012 2 1 1 1
Fall 2012 2 3 0 1
Spring 2013 1 2 3 1
6) Table 2.8 Assessor Initial Training and Recalibration: The number of assessors who
successfully completed initial training and the number who recalibrated for the applicable
biennial report years.
ELA Math HSS Science
Fall 2011 1 R 1 T
Spring 2012 2R 3R 2 R 1 R
Fall 2012
Spring 2013
R = Recalibration; T = Training
7) Table 2.9 Data on Reliability Related to Double Scoring (% of score agreement).
PACT requires 15% of all submissions to be double scored. Due to the relatively small number
of TPA submissions from CI candidates, the 15% is applied to all candidates across both the
Single and Multiple Subject programs. Submissions are selected to be double or triple scored to
ensure the reliability of the scoring process and scorers’ results. The table below shows the

34
number of double scoring events within subject areas and the percentage of the required 15%
they represent over the four semesters reported.
ELA Math HSS Science
Fall 2011 2 = 49.4% 1 = 21.5% 1 = 21.5%
Spring 2012 1 = 24.7%
Fall 2012 1 = 40%
Spring 2013 1 = 21.5% 1 = 21.5%
8) Table 2.10 Modifications Made to Assessor Selection, Training, and Recalibration. (May also be addressed in Section A, Part IV)
ELA Math HSS Science
Fall 2011 Program Coordinator trained as scorer.
Spring 2012
Fall 2012
Spring 2013 Scorers asked to volunteer to complete Trainer program in Fall 2013,
when full retraining for all scorers will occur.
Key Assessment #2: Final Student Teaching Evaluations
Description of the Assessment
Candidates in the Single Subject Credential program complete a middle school student teaching
placement during their first semester in the program and a high school student teaching experience in
their second or final semester in the program. (Beginning in Spring 2013, students complete a high
school student teaching placement in the spring semester and a middle school student teaching
experience in the fall semester to align with content methods courses). Each semester, students are in
classes 3-4 days/evenings a week and in their student teaching placement one day a week for the first
eight weeks of the semester. The second eight weeks consist of full-time student teaching and returning
for seminar one night a week. The Final Student Teaching Evaluation is used to determine the
"readiness" of first semester candidates (in EDSS 575) to proceed to the next semester of the program
and for second semester candidates (in EDSS 585) to be recommended for a credential pending
successful completion of other program components.
Candidates are evaluated on the following categories with the Final Student Teaching Evaluation Form:
1) Planning (6 items)
2) Instruction (7 items)
3) Management (4 items)
4) Professional Characteristics (10 items)

35
The following rating scale is used:
3 Noteworthy evidence that the candidate meets this criterion
2 Considerable evidence that the candidate meets this criterion
1 Some evidence that the candidate meets this criterion
0 No evidence that the candidate meets this criterion
N/A Not applicable or not observed (**This was calculated as “0” due to data collection
techniques this reporting cycle.)
Summary of Aggregated Data
Table 2.11 EDSS 575—Initial Student Teaching
University Supervisor Cooperating Teacher
Plan Instr Mang Prof Total Plan Instr Mang Prof Total
Fall 2011
n=11
2.26 2.61 2.59 2.9 2.6 2.28 2.69 2.55 2.89 2.65
Spring 2012
n=11
2.26 2.78 2.9 2.82 2.56 2.27 2.27 2.78 2.84 2.54
Fall 2012
n=17
2.48 2.73 2.78 2.89 2.74 2.58 2.58 2.72 2.91 2.78
Spring 2013
n=18
2.58 2.58 2.59 2.74 2.61 2.36 2.36 2.5 2.76 2.51
Total 2.40 2.68 2.72 2.84 2.66 2.37 2.47 2.64 2.85 2.62
Colors represent the same group/cohort of students as they travel through the program.

36
Table 2.12 EDSS 585—Advanced Student Teaching
University Supervisor Cooperating Teacher
Plan Instr Mang Prof Total Plan Instr Mang Prof Total
Fall 2011
n=13
2.21 2.77 2.87 2.85 2.69 2.24 2.7 2.75 2.92 2.69
Spring2012
n=9
2.22 2.7 2.57 2.7 2.7 2.04 2.61 2.57 2.89 2.4
Fall 2012
n=9
2.46 2.72 2.83 2.89 2.74 2.60 3.04 2.86 2.66 2.77
Spring2013
n=17
2.78 2.85 2.87 2.91 2.86 2.67 2.64 2.52 2.86 2.71
Total 2.42 2.76 2.79 2.84 2.75 2.39 2.75 2.68 2.83 2.64
Colors represent the same group/cohort of students as they travel through the program.
Key Assessment #3: CSU System-wide Exit Survey
Description of the assessment
Each year, the CSU Chancellor’s Office administers an on-line survey to all credential program graduates.
Candidates rate the degree to which they were prepared on a lengthy list of items that is presented in
four data tables and a series of open-ended responses. While all of this information is valuable, there is
far too much to include in this report. Effectiveness of Preparation for Teaching, Tables 2.13 and 2.14
cover many areas that are pertinent to both candidate learning and program improvement. Due to the
lengthiness of the open-ended responses, they are not included in this report, however, they were used
to confirm and understand the numerical data.
Data collection process
At the end of each semester, graduating credential candidates are provided a URL
(www.csuexitsurvey.org) along with a specific campus code, to complete a 30-minute on-line survey
developed by the CSU Chancellor’s Office. Data for each campus is aggregated by the system office and
reported to each campus. The following results are for candidates who completed the program Fall 2011
through Spring 2013. [Dates used were July 1, 2011 through August 1, 2013.]

37
Summary of Aggregated Data
Table 2.13 Effectiveness of Preparation for Teaching 1
Your university campus designed your initial teaching credential program to prepare you to start
working as a new teacher in a school where your preparation would continue. In your credential
program, the university wanted you to learn basic teaching skills and educational ideas at an initial
level. Your campus expects that you will have a mentor in your school to assist you in learning how to
use your teaching skills in class with your students. The university expects that you will also have
chances to develop your teaching skills and ideas with your mentor's help. Important aspects of a
teacher's job are listed below. At the university, how well prepared are you to begin each aspect of a
teacher's job? Please finish each statement below by selecting the choice that best represents the level
of your preparation.
As a new teacher, I
am ...
N well
prepared
to begin
(3)
adequately
prepared to
begin
(2)
somewhat
prepared to
begin
(1)
not at all
prepared
to begin
(0)
Can Not
Answer
(N)
1...to prepare lesson
plans and make prior
arrangements for
students' class
activities.
44 91% 9% 0% 0% 0
2...to organize and
manage a class or a
group of students for
instructional activities
44 80% 18% 2% 0% 0
3...to organize and
manage student
behavior and
discipline
satisfactorily.
44 52% 34% 14% 0% 0
4...to use an effective
mix of teaching
strategies and
instructional
activities.
44 80% 20% 0% 0% 0
38
5...to meet the
instructional needs of
students who are
English language
learners.
44 55% 36% 9% 0% 0
6...to meet the
instructional needs of
students from diverse
cultural backgrounds.
44 52% 39% 9% 0% 0
7...to meet the
instructional needs of
students with special
learning needs.
43 42% 40% 19% 0% 0
8...to understand how
personal, family and
community conditions
often affect learning.
44 68% 23% 9% 0% 0
9...to learn about my
students' interests
and motivations, and
how to teach
accordingly.
44 73% 20% 7% 0% 0
10...to get students
involved in engaging
activities and to
sustain on-task
behavior.
44 77% 20% 2% 0% 0
11...to use computer-
based technology to
help students learn
subjects of the
curriculum.
44 50% 39% 11% 0% 0
12...to use computer-
based technology for
instruction, research,
and record keeping..
44 59% 30% 9% 0% 0
39
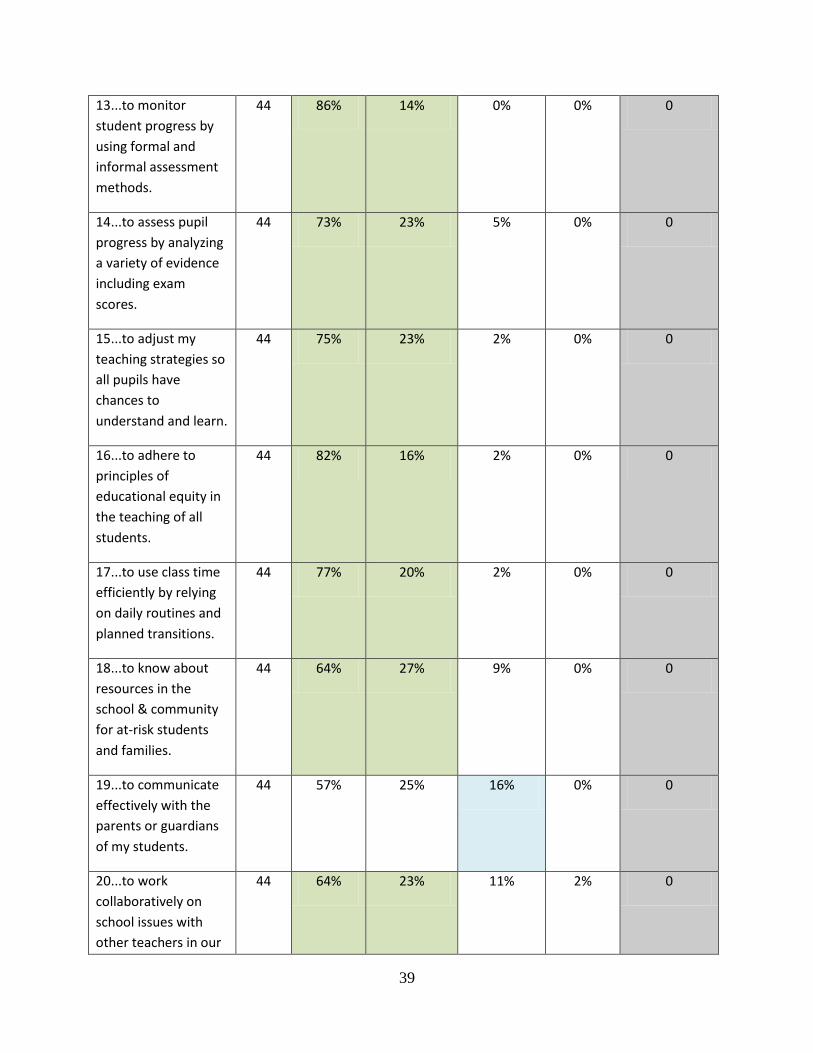
13...to monitor
student progress by
using formal and
informal assessment
methods.
44 86% 14% 0% 0% 0
14...to assess pupil
progress by analyzing
a variety of evidence
including exam
scores.
44 73% 23% 5% 0% 0
15...to adjust my
teaching strategies so
all pupils have
chances to
understand and learn.
44 75% 23% 2% 0% 0
16...to adhere to
principles of
educational equity in
the teaching of all
students.
44 82% 16% 2% 0% 0
17...to use class time
efficiently by relying
on daily routines and
planned transitions.
44 77% 20% 2% 0% 0
18...to know about
resources in the
school & community
for at-risk students
and families.
44 64% 27% 9% 0% 0
19...to communicate
effectively with the
parents or guardians
of my students.
44 57% 25% 16% 0% 0
20...to work
collaboratively on
school issues with
other teachers in our
44 64% 23% 11% 2% 0

40
school.
21...to think about
problems that occur
in teaching and to try-
out various solutions.
44 68% 23% 9% 0% 0
22...to understand my
professional, legal,
and ethical
obligations.
44 64% 27% 7% 0% 0
23...to evaluate and
reflect on my own
teaching and to seek
out assistance that
leads to professional
growth.
44 91% 7% 2% 0% 0
Table 2.14 Effectiveness of Preparation for Teaching 2
At the university, how well prepared are you to begin each aspect of a teacher's job? Please finish each
statement below by selecting the choice that best represents the level of your preparation.
As a new teacher, I
am ...
N well
prepared
to begin
adequately
prepared to
begin
somewhat
prepared to
begin
not at all
prepared
to begin
Can Not
Answer
(N)
1...to know and
understand the
subject(s) in which I
earned my teaching
credential(s).
43 79% 21% 0% 0% 1
2...to teach my
primary subject
according to State
Academic Standards
in my grade(s)
43 81% 19% 0% 0% 1
3...to contribute to
students' reading
43 65% 30% 5% 0% 1

41
skills including
comprehension in my
subject area.
4...to use textbooks
and other materials
that are aligned with
State Standards in my
area.
42 79% 19% 2% 0% 2
5...to recognize
adolescence as a
period of intense
pressure for students
to be like peers
43 84% 16% 0% 0% 1
6...to anticipate and
address issues of
drug, alcohol and
tobacco use by my
students.
43 58% 30% 12% 0% 1
7...to anticipate and
address possession of
weapons and threats
of violence at school.
43 47% 40% 14% 0% 1
8...to anticipate and
address the needs of
students who are at
risk of dropping out.
43 47% 40% 14% 0% 1
9...to understand
adolescent
development, human
learning and the
purposes of schools
43 70% 26% 5% 0% 1
10...to assist
individual students in
areas of their
instructional needs in
my subject area.
43 81% 14% 5% 0% 1

42
11...to establish
academic
expectations that are
intellectually
challenging for
students.
43 79% 21% 0% 0% 1
12...to provide
opportunities for
students to develop
advanced problem-
solving skills.
43 65% 30% 5% 0% 1
13...to communicate
my course goals and
requirements to
students and parents.
43 79% 14% 7% 0% 1
14...to develop fair
criteria for course
grades and to explain
these to students and
parents.
42 76% 21% 2% 0% 2
15...to help students
realize the
connections between
my subject and life
beyond school.
43 72% 26% 2% 0% 1
16...to help students
realize the impact of
academic choices on
life- and career-
options.
42 62% 31% 7% 0% 2
17...to
encourage/enable
students to assume
increasing
responsibility for their
learning.
43 74% 16% 9% 0% 1

43
18...to encourage/
enable students to
learn behaviors that
contribute to future
success.
43 72% 23% 5% 0% 1
Key Assessment #4: CSU System-wide One Year Out Survey
Description of the Assessment
The CSU System-wide Evaluation of Teacher Preparation is an annual assessment of university graduates
conducted by a central office of the CSU. It measures program effectiveness on three dimensions.
1) the extent to which K-12 teachers are prepared effectively for their most important teaching responsibilities
2) the extent to which CSU professional coursework and fieldwork that the new teachers complete are professionally valuable and helpful to them during their initial year K-12 teaching, and
3) the extent to which programs that the new teachers completed in the CSU match in quality the program characteristics and features that are identified in professional accreditation standards.
The results of the survey are reported to each campus and a comparison is made to the mean of all CSU campus responses. The data are used to examine the quality of the program and identify areas in need of improvement. The most current data set (2012) represents responses from the 2010-2011 cohort of graduates—who were represented in the 2009-2011 Biennial Report. We had a decent response rate from our graduates (n= 10) and a good response rate from their supervisors (n = 8) on the survey this particular year. Tables 2.15-2.18 are presented out of a data set of 14 Tables. Tables 2.15 & 2.16 are completed by the Employment Supervisors (principals) and program graduates complete Tables 2.17 & 2.18. Data collection process The method used includes the graduates and their school-site supervisors answering an extensive set of common and credential-specific questions at the end of the graduates’ first year of teaching. Questions that are thematically related are grouped into composite scores that represent important topics for programs to consider. The composites are considerably more reliable than responses to any individual item. Validity and reliabilities studies have been completed on the survey.
Summary of Aggregated Data See Tables 2.15 through 2.18 from the CSU One-Year-Out Survey results.

44
Table 2.15 of this Report, (Table 1 of the CSU One-Year-Out Survey)
General Concepts and Practices of Teaching: The Effectiveness of CSU Single Subject Teaching Credential Programs
During 2010-11 as Evaluated in 2012 by the Employment Supervisors of the Programs’ First-Year Teaching Graduates
Evaluation Questions Answered in 2012 by the 7-12 Employment
Supervisors of Teaching Graduates of CSU Single Subject
Credential Programs:
This CSU Campus:
Single Subject Programs
CSU System:
Single Subject Programs
Based on your observations of and conferences with this teacher
(who was named in the survey), please assess how well s/he was
prepared to. .
(1) (2) (3) (4) (5) (6) (7) (8) (9) (10)
N Well or
Adequately
Prepared
Somewhat
or Not
Prepared
Mean SD N Well or
Adequately
Prepared
Somewhat
or Not
Prepared
Mean SD
1 . . . know and understand the subjects of the curriculum at your grade
level(s).
8 100% 0% 2.63 .52 386 93% 7% 2.54 .64
2 . . . organize and manage a class or a group of pupils for instructional
activities.
8 88% 13% 2.5 .76 395 76% 24% 2.13 .87
3 . . . organize and manage student behavior and discipline
satisfactorily.
8 63% 38% 2.13 1.25 394 71% 29% 1.97 .97
4 . . . prepare lesson plans and make prior arrangements for class
activities.
8 88% 13% 2.38 .74 393 83% 17% 2.31 .79
5 . . . use an effective mix of teaching strategies and instructional
activities.
8 75% 25% 2.38 .92 391 80% 20% 2.19 .84
6 . . . meet the instructional needs of students who are English language
learners.
7 57% 43% 2.00 1.0 364 70% 30% 1.95 .83
7 . . . meet the instructional needs of students from diverse cultural
backgrounds.
8 63% 38% 2.00 .93 379 77% 23% 2.09 .81
8 . . . meet the instructional needs of students with special learning
needs.
8 63% 38% 2.13 .99 381 70% 30% 1.96 .84
9 . . . communicate effectively with the parents or guardians of your
students.
8 63% 38% 2.00 .93 384 75% 25% 2.07 .84
10 . . . maintain positive rapport and foster students' motivation and
excitement.
8 75% 25% 2.38 .92 388 83% 17% 2.29 .85
11 . . . think about problems that occur in teaching and try out various
solutions.
8 88% 13% 2.38 .74 366 78% 22% 2.11 .86

45
Table 2.16 of this Report, (Table 2 of the CSU One-Year-Out Survey)
General Concepts and Practices of Teaching: The Effectiveness of CSU Single Subject Teaching Credential Programs
During 2010-11 as Evaluated in 2012 by the Employment Supervisors of the Programs’ First-Year Teaching Graduates
Evaluation Questions Answered in 2012 by the 7-12 Employment
Supervisors of Teaching Graduates of CSU Single Subject
Credential Programs: This CSU Campus: Single Subject Programs
CSU System:
Single Subject Programs
Based on your observations of and conferences with this teacher
(who was named in the survey), please assess how well s/he
was prepared to. .
(1) (2) (3) (4) (5) (6) (7) (8) (9) (10)
N Well or
Adequately
Prepared
Somewhat
or Not
Prepared
Mean SD N Well or
Adequately
Prepared
Somewhat
or Not
Prepared
Mean SD
12 . . . understand adolescent growth, human learning and the purposes
of schools.
7 86% 14% 2.29 .76 382 76% 24% 2.1 .86
13 . . . understand how personal, family and community conditions affect
learning.
8 88% 13% 2.25 .71 381 78% 22% 2.13 .82
14 . . . learn about students’ interests and motivations, and how to teach
accordingly.
7 100% 0% 2.57 .53 385 80% 20% 2.19 .87
15 . . . get students involved in engaging activities and to sustain on-task
behavior.
8 63% 38% 2.25 1.04 390 78% 22% 2.16 .87
16 . . . use computer-based applications to help students learn curriculum
subjects.
7 100% 0% 2.57 .53 345 89% 11% 2.35 .70
17 . . . use computer-based technology in class activities and to keep class
records.
7 100% 0% 2.71 .49 356 90% 10% 2.38 .72
18 . . . monitor student progress by using formal and informal assessment
methods.
8 75% 25% 2.25 .89 387 80% 20% 2.17 .84
19 . . . assess pupil progress by analyzing a variety of evidence including
test scores.
7 71% 29% 2.00 .82 381 80% 20% 2.15 .82
20 . . . assist individual students in areas of their instructional needs in
reading/math.
7 86% 14% 2.14 .69 377 82% 18% 2.20 .78
21 . . . adjust teaching strategies so all pupils have chances to understand
and learn.
8 88% 13% 2.25 .71 385 77% 23% 2.15 .85
22 . . . adhere to principles of educational equity in the teaching of all
students.
8 75% 25% 2.25 .89 367 87% 13% 2.33 .72
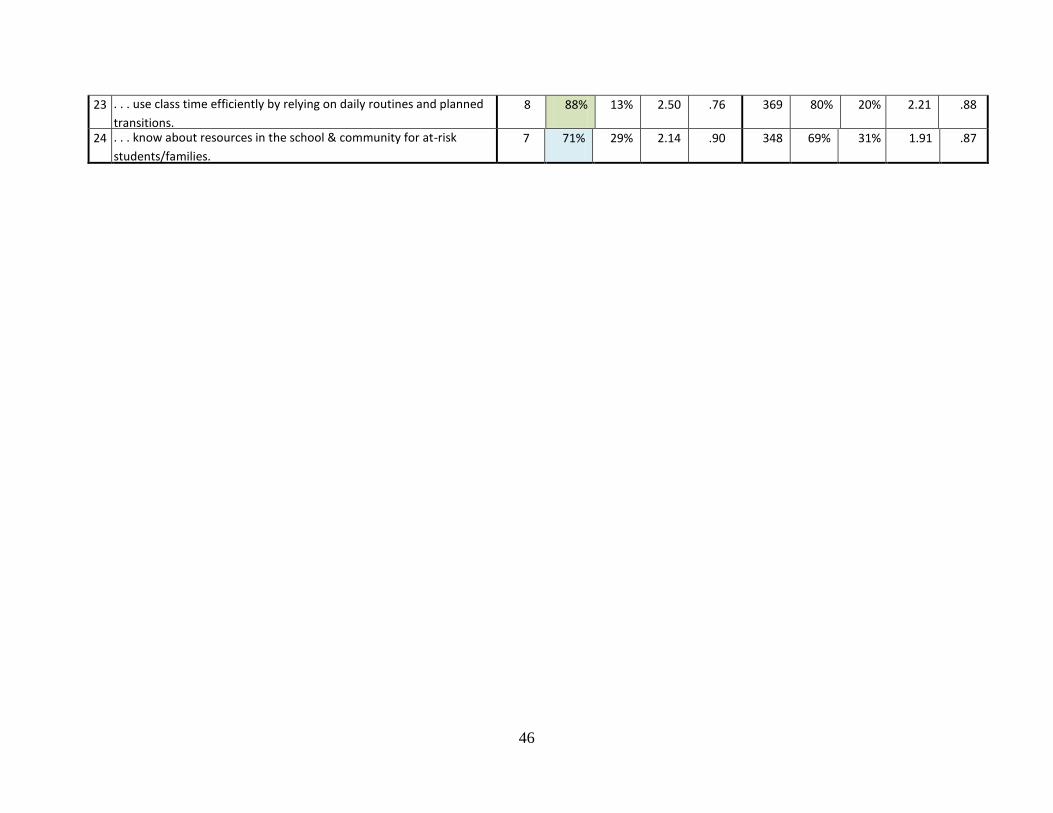
46
23 . . . use class time efficiently by relying on daily routines and planned
transitions.
8 88% 13% 2.50 .76 369 80% 20% 2.21 .88
24 . . . know about resources in the school & community for at-risk
students/families.
7 71% 29% 2.14 .90 348 69% 31% 1.91 .87

47
Table 2.17 of this Report, (Table 3 of the CSU One-Year-Out Survey)
General Concepts and Practices of Teaching: The Effectiveness of CSU Single Subject Teaching Credential Programs
During 2010-11 as Evaluated by the Programs' First-Year Teaching Graduates in 2010 While They Taught in Grades 7-12
Evaluation Questions Answered in 2012 by Teachers in Grades 7-12 Who
Completed CSU Single Subject Credential Programs in 2010-11: This CSU Campus:
Single Subject Programs
CSU System:
Single Subject Programs
Once you finished your CSU credential program in 2011, and when you
served as a 7-12 teacher in 2011-12, how well prepared were you to . . .
(1) (2) (3) (4) (5) (6) (7) (8) (9) (10)
N Well or
Adequately
Prepared
Somewhat
or Not
Prepared
Mean SD N Well or
Adequately
Prepared
Somewhat
or Not
Prepared
Mean SD
1 . . . know and understand the subjects of the curriculum at your grade level(s). 10 100% 0% 2.60 .52 605 85% 15% 2.34 .77
2 . . . organize and manage a class or a group of pupils for instructional activities. 10 80% 20% 2.30 .82 617 72% 28% 2.03 .88
3 . . . organize and manage student behavior and discipline satisfactorily. 10 60% 40% 1.80 1.23 615 60% 40% 1.76 .95
4 . . . prepare lesson plans and make prior arrangements for class activities. 10 100% 0% 3.00 .00 614 84% 16% 2.33 .77
5 . . . use an effective mix of teaching strategies and instructional activities. 10 90% 10% 2.30 .67 616 81% 19% 2.18 .78
6 . . . meet the instructional needs of students who are English language learners. 9 78% 22% 2.11 .78 606 76% 24% 2.05 .83
7 . . . meet the instructional needs of students from diverse cultural backgrounds. 10 90% 10% 2.10 .57 607 76% 24% 2.09 .84
8 . . . meet the instructional needs of students with special learning needs. 10 70% 30% 1.80 .92 609 66% 34% 1.86 .91
9 . . . communicate effectively with the parents or guardians of your students. 9 78% 22% 1.78 1.09 604 62% 38% 1.75 .95
10 . . . maintain positive rapport and foster students' motivation and excitement. 10 90% 10% 2.60 .70 615 80% 20% 2.20 .83
11 . . . think about problems that occur in teaching and try out various solutions. 10 80% 20% 2.30 .82 612 72% 28% 1.97 .87

48
Table 2.18 of this Report, (Table 4 of the CSU One-Year-Out Survey)
General Concepts and Practices of Teaching: The Effectiveness of CSU Single Subject Teaching Credential Programs
During 2010-11 as Evaluated by the Programs' First-Year Teaching Graduates in 2010 While They Taught in Grades 7-12
Evaluation Questions Answered in 2012 by Teachers in Grades 7-12 Who
Completed CSU Single Subject Credential Programs in 2010-11: This CSU Campus: Single Subject Programs
CSU System:
Single Subject Programs
Once you finished your CSU credential program in 2011, and when you
served as a 7-12 teacher in 2011-12, how well prepared were you to . . .
(1) (2) (3) (4) (5) (6) (7) (8) (9) (10)
N Well or
Adequately
Prepared
Somewhat
or Not
Prepared
Mean SD N Well or
Adequately
Prepared
Somewhat
or Not
Prepared
Mean SD
12 . . . understand adolescent growth, human learning and the purposes of schools. 10 100% 0% 2.60 .52 610 79% 21% 2.12 .85
13 . . . understand how personal, family and community conditions affect learning. 10 100% 0% 2.70 .48 610 80% 20% 2.18 .83
14 . . . learn about students’ interests and motivations, and how to teach
accordingly.
9 100% 0% 2.22 .44 614 79% 21% 2.11 .82
15 . . . get students involved in engaging activities and to sustain on-task behavior. 10 80% 20% 2.20 .79 615 73% 27% 2.03 .85
16 . . . use computer-based applications to help students learn curriculum subjects. 10 60% 40% 1.70 .95 606 60% 40% 1.79 .97
17 . . . use computer-based technology in class activities and to keep class records. 10 80% 20% 2.00 .94 604 67% 33% 1.89 .99
18 . . . monitor student progress by using formal and informal assessment methods. 10 90% 10% 2.50 .71 612 83% 17% 2.24 .79
19 . . . assess pupil progress by analyzing a variety of evidence including test scores. 10 100% 0% 2.70 .48 608 78% 22% 2.11 .87
20 . . . assist individual students in areas of their instructional needs in
reading/math.
10 100% 0% 2.30 .48 608 79% 21% 2.15 .81
21 . . . adjust teaching strategies so all pupils have chances to understand and learn. 10 90% 10% 2.40 .48 611 80% 20% 2.16 .80
22 . . . adhere to principles of educational equity in the teaching of all students. 10 90% 10% 2.40 .70 609 84% 16% 2.27 .78

49
23 . . . use class time efficiently by relying on daily routines and planned transitions. 10 80% 20% 2.50 .70 613 78% 22% 2.15 .85
24 . . . know about resources in the school & community for at-risk
students/families.
10 80% 20% 1.90 .85 604 55% 45% 1.64 .98
.88
50
PART III – Analyses and Discussion of Candidate and Program Data
For Key Assessments #3 and #4 a color-coding rating system was used to identify areas of strength
(green), areas of concern (blue) and areas of major concern (orange). Corresponding percentages used
to determine the rating were: 85% and higher = strength; 70%-84.9% = concern; below 70% = major
concern. Fifteen percent increments were chosen due to the low N for both key assessments and to
maintain an equivalency across assessment tools.
Key Assessment #1: TPA (PACT)
Overall data from this key assessment across cohorts indicate that CI Single Subject Credential
candidates are strong in the PACT areas of Planning (2.88), Instruction (2.44), Assessment (2.57) and
Reflection (2.53). Academic Language (2.13) continues to be the lowest scoring category at CI; however
the score continues to be above the minimum cut score for the category.
Looking at the aggregated data from a disciplinary perspective, the English candidates score well on
Planning (3.06) and Reflection (2.91). Science candidates score well on Instruction (2.79), Assessment
(2.95) and Academic Language (2.43) while scoring the lowest on Reflection (2.21). Math candidates
score the lowest on Instruction (2.15), Assessment (2.23) and Academic Language (1.88) and History
candidates score lowest in Planning (2.74).
Key Assessment #2: Final Student Teaching Evaluations
Data from this key assessment indicates candidates are progressing in their abilities in the areas of
planning, instruction, management, and professional characteristics in each student teaching experience
over the course of the credential program--first semester to second semester (See color coding of
cohorts). The data also supports that the structure of our program is effective for candidates achieving
our desired expectations and progressing in both their experience and confidence along many teaching
categories.
Aggregated data from this assessment tool also indicates when there have been issues in the field with
either candidate performance, a mismatch with a cooperating teacher or school site, or a pilot test of a
new program feature. Spring 2013 illustrates particularly low evaluations for candidate performances by
cooperating teachers of EDSS 575 candidates (see Table 2.11). This was the first semester that high
school teachers in our service area had ever had first semester student teachers. Prior to this semester
they had always had candidates who had one semester of middle school student teaching experience
prior to entering their high school placement.

51
One item of concern that was noted during data collection was the number of “N/A” scores that
appeared in the Final Student Teaching Evaluations in the categories of Planning and Instruction. These
N/A scores were recorded as “0” for this round of data collection that artificially deflated our overall
average scores. This highlights the need for a discussion with university supervisors to revisit the forms,
scoring, and importance of their observations in our program assessment practices.
Key Assessment #3: CSU System-wide Exit Survey
CI Single Subject Program graduates from Fall 2011 through Spring 2013 (n=43) were highly satisfied
with their credential program. Of the 41 items presented on the Effectiveness of Preparation for
Teaching (Tables 2.13 and 2.14), 85% or more candidates rated 39 items as “well or adequately
prepared” to teach. Only two items were identified by more than 15% of the students as feeling
“somewhat prepared to begin” teaching. The first item was “…to meet the instructional needs of
students with special learning needs.” with 19% of the candidates responding with concern. The second
item was “…to communicate effectively with the parents or guardians of my students.” with 16% of the
candidates responding as “somewhat prepared to begin” teaching. No items were identified as “major
concerns” in their preparation to teaching after completing the credential program.
Key Assessment #4: CSU System-wide One-Year-Out Survey
Employers (n=8) of CI candidates who completed the CI Single Subject Credential Program in 2010-2011
and completed their first year of teaching in 2012 felt they were “well or adequately prepared” on half
of the 24 items (with a cut-off rating set at 85%). Four items received a 100% rating of employers as
being “well or adequately prepared”. They were: 1) know and understand the subjects of the curriculum
at your grade level(s); 2) learn about students’ interests and motivations, and how to teach accordingly;
3) use computer-based applications to help students learn curriculum subjects; and 4) use computer-
based technology in class activities and to keep class records.
Employers identified six areas of major concern (cut-off rating set at below 70%) of the first year
teachers that ranged from 57% -63% feeling of being “well or adequately prepared:” 1) organize and
manage student behavior and discipline satisfactorily; 2) meet the instructional needs of students who
are English language learners; 3) meet the instructional needs of students from diverse cultural
backgrounds; 4) meet the instructional needs of students with special learning needs; 5) communicate
effectively with the parents or guardians of your students; and 6) get students involved in engaging
activities and to sustain on-task behavior.
CI candidates (n=10) who completed the Single Subject Credential Program in 2010-2011 and completed
their first year of teaching in 2012 felt they were “well or adequately prepared” on 13 of the 24 items
(with a cut-off rating set at 85%). Seven items received a 100% rating of candidates as being “well or
adequately prepared.” They were: 1) know and understand the subjects of the curriculum at your grade

52
level(s); 2) prepare lesson plans and make prior arrangements for class activities; 3) understand
adolescent growth, human learning and the purposes of schools; 4) understand how personal, family
and community conditions affect learning; 5) learn about students’ interests and motivations, and how
to teach accordingly; 6) assess pupil progress by analyzing a variety of evidence including test scores; 7)
assist individual students in areas of their instructional needs in reading/math. 90% of students felt well
or adequately prepared on six items.
Nine items were identified as areas of concern (cut-off rating between 70% - 84.9%). The item in this
range with the lowest rating of 70% of candidates feeling “well or adequately prepared” was the area of
“meeting the instructional needs of students with special learning needs.”
Of the 24 items, two items were identified as areas of major concern (cut-off rating set below 70%) with
60% of the candidates reporting being “well or adequately prepared.” The two areas were “organize and
manage student behavior and discipline satisfactorily” and “use computer-based applications to help
students learn curriculum subjects.”
Data Analysis and Discussion Summary CI candidates who responded to the CSU One-Year-Out Survey completed the CI Single Subject
Credential Program in 2010-2011. Therefore, data from this key assessment does not align directly (or
rather, triangulate) with more recent data as reported in the Key Assessment Tools #1-3. However, data
from the one-year-out survey provides a snapshot of the program prior to changes that were
implemented based upon the findings of our previous biennial report. As there were many areas
identified by employers and candidates in the one-year-out survey data that were in need of
improvement, the data in Key Assessment Tools #1 – 3 reveals that the Single Subject Credential
Program has addressed many of these issues by Spring 2013.
PART IV – Use of Assessment Results to Improve Candidate and Program Performance
Each program describes how it used the data from analyses of candidate assessments and program
effectiveness to improve candidate outcomes and program effectiveness. The focus of this section
should not be on the process employed by the institution to discuss changes (although it can be
mentioned briefly), but on the actual considered, proposed, or implemented programmatic changes
specific to the data. If proposed changes are being made, please connect the proposed changes to the
data that stimulated those modifications and to the Program and/or Common Standard(s) that
compels program performance in that area. If preferred, programs may combine responses to
Sections III (Analysis of the Data) with Section IV (Use of Assessment Results to Improve Candidate
and Program Performance) so long as all the required aspects of the responses are addressed.

53
Issue Proposed Changes/Plan of Action Data Source/s
PACT-Academic
Language
All faculty members to become certified PACT
evaluators
Incorporate more direct instruction about PACT and
academic language in coursework (especially math
methods) and advanced seminar
Insert materials on Academic Language in the general
methods course (EDSS 530) with regard to lesson
planning
Add emphasis on Academic Language in the Literacy
in the Content Areas course (EDSS 540)
Key Assessment #1
Communication with
Families
Meet with faculty in early Fall 2013 to discuss where
family communication is being addressed and how in
both prerequisite and program coursework.
Create a communication with families matrix that
identifies desired skills and where in program skills
are being taught, reinforced, and mastered
Key Assessment #3
Key Assessment #4
Meeting Instructional
needs of Students
with Special Learning
Needs
Meet with EDSS 560 Instructors to share qualitative
and quantitative feedback. An instructor change was
made in Fall 2012 to address previously raised issues
that may be reflected in this data. We are confident
this issue is resolved.
Key Assessment #3
Key Assessment #4
Student Teaching
Evaluation Forms and
Data Collection
Meet with University Supervisors in early Fall to
review raw aggregated data and review the
observation forms for possible revisions. Develop
mechanism for supervisors to enter student data into
a common spreadsheet for data collection
aggregation at the end of the semester.
Key Assessment #2

54
Commission on Teacher Credentialing
Biennial Report 2013 (For Institutions in the Green Cohort Due Fall 2013)
Academic Years 2011-2012 and 2012-13
Institution CSU Channel Islands
Date report is submitted September 15, 2013
Program documented in this report School of Education
Name of Program Education Specialist Teaching Credential Program
Please identify all delivery options through
which this program is offered
Traditional and Intern
Credential awarded Education Specialist Mild/Moderate Preliminary
Education Specialist Mild/Moderate Intern
Is this program offered at more than one site? No
If yes, list all sites at which the
program is offered
Program Contact Dr. Tiina Itkonen, Special Education Program Coordinator
Title Associate Professor of Education and Political Science
Phone # 805-437-3294
E-Mail [email protected]

55
SECTION A – CREDENTIAL PROGRAM SPECIFIC INFORMATION
PART I – Contextual Information
The Education Specialist Teaching Credential Program at CI graduates candidates with the necessary
skills to meet the needs of the diverse population eligible for special education under IDEA found in
California’s K-12 public schools. The following student learning outcomes align with CTC standards and
expectations:
Teach children with English as first or second language
Understand and relate to linguistic and cultural diversity of children and families
Meet the diverse needs of all students and those with special needs
Be reflective and deliberate practitioners
Link content and pedagogy
Actively engage children in their learning
Integrate research, theory and best educational practice into their teaching
Collaborate with families, general education teachers, and outside agencies
Teacher candidates are admitted into the Education Specialist Credential program as full-time or part-
time students, or interns. If successful, full-time students may complete the program in two semesters.
Interns must be part time and take 4 semesters minimum to graduate. Each semester has a content
specific methods course, a student teaching experience and an accompanying student teaching seminar.
Part-time students may finish the program in three to six semesters depending upon the number of
methods courses in which they elect to enroll, and will additionally enroll in a field placement each
semester they are not enrolled in student teaching. Together the program coordinator and each part-
time student develop an individualized study plan. Para-educators take a part time program and
complete one day of field experience per semester, but at the end they take their student teaching (2
courses) at two sites which are not their site of employment.
Table 3.1 Program Specific Candidate Information
Traditional 2011-12 Intern 2011-12 Traditional 2012-13 Intern 2012-13
Incoming students 14 2 12 8
Continuing 20 5 18 8
Completing 14 3 14 3
Applied 14 3 6 3
Discontinue 1 0 0 0
Dismissed 0 0 1 0

56
Changes Since Last Accreditation Activity (Biennial Report, Program Assessment or Site Visit)
Fall 2011
Co-Teaching pilot introduced along with the Multiple Subject Credential program. One student was placed at a school serving students diagnosed with emotional disturbance.
Spring 2012
Co-Teaching pilot was continued, also with one Education Specialist candidate placed in Co-Teaching. The choice is for the student to make, whether they want to have a Co-Teaching experience.
Fall 2012
New coordinator takes over the Special Education program (the one completing this report).
Meetings were held with part time instructors to inform them about the new standards and TPEs.
A new pre-requisite course, guiding behavior was added to the Education Specialist program. Students learn basics about classroom management and spend 1 unit out in schools. This course was a pre-requisite in the Multiple Subject and Single Subject programs.
Spring 2013
A program was submitted to CTC on aligning the Mild/Moderate Preliminary Credential with a new Moderate/Severe Preliminary Credential. Standards were embedded and three new courses proposed for the Moderate/Severe Preliminary Credential in addition to the course work in Mild/Moderate (one methods course (4 units), one student teaching and a seminar). The CI and CTC review and approval is pending.
A meeting was held with all pre-requisite instructors on aligning the sections of the introduction class to special education.
Meetings were held to discuss the inclusion of Moderate/Severe Standards in course assignments and readings.
The student teaching handbook was revised. Also a decision was made that for the first 3 weeks of the semester, student teachers would observe the class 3 times a week instead of just one. A specific list of what they should observe and do was included in the new handbook.
Lesson plan format was re-designed and all instructors, through a meeting, now know to have their students use just one lesson plan instead of the multiple plans that were previously used.
Portfolio rubrics were revised

57
Summer 2013
Meetings were held with all part time instructors to further discuss the new standards and TPEs and to align sections of the same class.
The coordinator completing this report wrote syllabi for SPED 345 and shared with instructors who teach sections of that class.
The coordinator filing this report met with the credential office staff to begin discussions on student teaching sites for the Moderate/Severe Preliminary Credential program, should it be approved.
A separate handbook was developed for the intern program and a coordinator appointed to specifically oversee the program, rather than each teaching credential program coordinator managing the intern coordination for their area.
SECTION A – CREDENTIAL PROGRAM SPECIFIC INFORMATION
PART II – Candidate Assessment/Performance and Program Effectiveness Information
a) What are the primary candidate assessment(s) the program uses up to and through recommending
the candidate for a credential?
Note: The response for both questions a) and b) follow the prompt for question b) below.
b) What additional information about candidate and program completer performance or program
effectiveness is collected and analyzed to inform programmatic decision-making?
The various assessment tools used by CI’s Education Specialist Program to evaluate candidate
progress/performance and program effectiveness are displayed in Table 3.2 below. This is followed by a
report of the aggregated data on the four key assessments tools indicated by the blue background
shading.
Table 3.2 Assessment & Evaluation Tools used in the CI Education Specialist Program
Assessment Tool Description Data Collected
a) Formal Student Teaching
Evaluations
Rubrics completed by University
Supervisor on a minimum of four
visits per candidate per semester
Teaching Performance
Expectations 1-13

58
a) Statement of Concern A form for goal setting and
remediation for candidates who
need specialized support
Varies depending upon
assessment of candidate’s need /
performance deficiency
a) Portfolio Students provide their teaching
philosophy, resume, and
signature assignments from
course work
The depth of philosophy and
signature assignments
a) Culminating Intervention and
Poster presentation
Students prepare a poster on
their final method class
intervention with a small group
of students with disabilities.
Posters are presented in a
professional forum.
Methodology
Integration and synthesis of
methods, behavioral supports,
direct instruction
a) Course Grades Students must maintain a B
average (3.0) minimum with no
grades lower than a C+
Learning
Coursework
Varies— might warrant a
statement of concern
a) Final Student Teaching
Evaluations
Rubrics completed by
cooperating teacher and
university supervisor to
determine either readiness for
second student teaching
experience or program
completion
Align with Teaching Performance
Expectations 1-13
Professional disposition criteria
b) CSU System-wide Exit Survey Candidates completing the
program are surveyed about
their experiences in the program
Coursework
Fieldwork
Learning
Preparation to teach
b) CSU System-wide One-Year-
Out Survey
Candidates in their first year of
teaching, and their employers
complete a survey about the
candidate’s preparation to teach
Coursework
Fieldwork
Learning
Preparation to teach

59
b) Focus group In the student teaching seminar
candidates are asked about their
experience in the program and
any changes they would
recommend or the areas to
maintain.
Verbal feedback
c) Include aggregated data from 4-6 instruments that were described in (a) and (b).
Key Assessments utilized for data analysis in this report for the Education Specialist Mild/Moderate
Preliminary Credential Program include:
#1 Portfolios
#2 Culminating Intervention and Poster Presentations
#3 CSU System-wide One-Year-Out-Survey
#4 Focus group data
Key Assessment #1: Portfolios
Description of Assessment
The students complete a portfolio, which includes their resume, teaching philosophy, and signature assignments from all of their classes. In 2012-2013 they wrote 4 reflections on what they have learned in foundations, methods, assessment and their teaching philosophy. Two independent scorers rate the portfolios using a rubric, to assess the depth of the data. The rubric focuses on synthesis of learning, so that it is a reflection about assessment; it should have for behavioral supports and the teaching of English learners embedded. The results reported are the mean scores of each cohort as rated by two independent scorers.
Summary of the Aggregated Data
Table 3.3 2011-2012 Cohort (old portfolio format) Distinguished Proficient Emerging
Synthesis of Learning 50% 12%
Teaching Philosophy 38% 25%
All signature assignments were turned in and grades ranged from B (20%) to A (80%).

60
Table 3.4 2012-2013 Cohort (new rubric/requirements for the portfolio)
Distinguished Proficient Emerging Underdeveloped
Philosophy of
teaching
23% 86%
Reflection
Foundations
33% 63%
Reflection
Assessment
17% 47%
Reflection Methods
63% 37%
Note: Interns are not included in this data as they take a 2-year program.
All Signature Assignments were included with the exception of 13% of students. One student received a C grade for a foundations class (less than 1 %).
These data indicate that one of the stronger components of the program is the methods content.
Students take two methods courses which are 4 units each.
In this cohort no one demonstrated emerging or underdeveloped practice as evidenced in their portfolios.
Key Assessment #2: Culminating Intervention and Poster Presentation
Description of the Assessment
Students in the program conduct an evidence-based intervention (which can be math, language arts,
social studies) for a small group of students in their student teaching placement. They must conduct a
literature review, design the methods, conduct the intervention, and communicate with parents and
general education teachers. Their final product is a poster that is presented in a professional forum. Two
raters rate each poster. Community members and prior graduates are second raters with faculty.

61
The rating scale includes (1) significantly below standard; (2) below standard; (3) meets standard; (4) exceeds standard; (5) significantly exceeds standards. The results reported are means of the cohort as rated by two scorers.
Cohort Assessment Results
Candidates are rated utilizing the following scale:
1. Significantly below standard 2. Below standard 3. Meets standard 4. Exceeds standard 5. Significantly exceeds standard
Table 3.5 2011-2012 Cohort: Culminating Intervention and Poster Presentation
1 2 3 4 5 Comments
The candidate introduced the project clearly
14% 1% 85%
The candidate cited appropriate literature in the introduction (using APA)
1% 43% 56%
The candidate accurately described the teaching methods used in the intervention
1% 1% 43% 55%
The candidate wrote accurate goals and objectives
14% 29% 57%
The candidate demonstrated understanding of CBM
14% 14% 72%
The candidate demonstrated an understanding of using assessment to inform instruction by using ongoing data.
21% 21% 58%
The candidate accurately used the terms ecological changes, antecedent interventions, consequence interventions to describe how student behavior was addressed
4% 38% 58%
The candidate demonstrated the ability to synthesize information across methods, assessment, behavior and
1% 1% 36% 62%

62
communication/collaboration
The candidate demonstrated the ability
to communicate results of instruction to
parents
1% 36% 63%
The candidate demonstrated the ability
to communicate results of instruction to
general education teachers
1% 36% 63%
The candidate demonstrated
professional writing (mechanics and
style)
1% 21% 78%
Note: Any student receiving a 2 or lower in any given area will be asked to resubmit that area prior to receiving
their credential at CI.
Table 3.6 2011-2012 Cohort: Culminating Intervention and Poster Presentation
1 2 3 4 5 Comments
The candidate introduced the project
clearly
10% 80% 10%
The candidate cited appropriate
literature in the introduction (using APA)
80% 10% 10%
The candidate accurately described the
teaching methods used in the
intervention
5% 75% 20%
The candidate wrote accurate goals and
objectives
20% 60% 20%
The candidate demonstrated
understanding of CBM
50% 30% 20%
The candidate demonstrated an
understanding of using assessment to
inform instruction by using ongoing data.
90% 10%
The candidate accurately used the terms ecological changes, antecedent interventions, consequence interventions to describe how student behavior was addressed
78% 20% 2%

63
The candidate demonstrated the ability
to synthesize information across
methods, assessment, behavior and
communication/collaboration
64% 36%
The candidate demonstrated the ability
to communicate results of instruction to
parents
25% 30% 45% 1% no evidence
The candidate demonstrated the ability
to communicate results of instruction to
general education teachers
2% 77% 21% no evidence because the
placement was in special public
schools for students with ED
The candidate demonstrated
professional writing (mechanics and
style)
53% 13% 34%
Note: Any student receiving a 2 or lower in any given area will be asked to resubmit that area prior to receiving
their credential at CI.
These data indicate that CBM needs to be included across course work more thoroughly. The majority of
this cohort, while meeting standard in integrating behavioral supports to their intervention, did not
synthesize the concepts into their intervention as indicated in the poster assessment.
Both cohort assessments indicate that synthesis of course work and content is a challenge.
Key Assessment #3: CSU System-wide Exit Survey
Description of the Assessment
Each year, the CSU Chancellor’s Office administers an on-line survey to all credential program graduates.
Candidates rate the degree to which they were prepared on a lengthy list of items reported in four data
tables and a series of open-ended responses.
Data Collection Process
At the end of each semester, graduating credential candidates are provided a URL
(www.csuexitsurvey.org) along with a specific campus code, to complete a 30-minute on-line survey
developed by the CSU Chancellor’s Office. To ensure a significant campus response rate, candidates are
asked to bring verification of Exit Survey completion to the Credential Office as they complete the
candidate recommendation files for CTC.
64
The following results were gathered for the period July 1, 2011 through August 1, 2013. The Education
Specialist Program has made changes in areas identified as a need since last report (ELL, At-Risk
students) and out-performs the CSU averages. Since these graphs and data are available from the
Chancellor’s Office they are not replicated here, but key results from the surveys are examined as they
pertain to past program needs and any new areas identified by the data.
ENGLISH LANGUAGE LEARNERS
First year Education Specialist teachers report that they were “well or adequately prepared” to develop
English learners’ academic language and content learning 100% of the time. Their employment
supervisors report that these teachers were “well or adequately prepared” 88% of the time. Both are
significant improvements from 2009-10 data (76% and 50% respectively). The CSU One-Year Out Survey
further indicate that teachers feel they are able to meet the instructional needs of students from diverse
cultural backgrounds 100% of the time. The employment supervisors’ ratings indicate that teachers are
“well or adequately prepared” 90% of the time to meet the needs of culturally diverse students.
Teachers report that they were “well or adequately prepared” to communicate with parents effectively
90% of the time, while employment supervisors report 89% of the time. Both are improvements from
the 2009-10 data (56% and 79%, respectively).
AT-RISK STUDENTS First year Education Specialist Credential teachers report that 100% of the time, they were “well or
adequately prepared” to know about resources in the school and community for at-risk students. Their
employment supervisors report that 89% of the time, these teachers were “well or adequately
prepared” to know about such resources. Both are significant improvements from 2009-10 data (67%
and 80%, respectively).
The student teaching seminar had guest speakers who represented various community organizations
that provide resources for at-risk students and their families. The campus police gave a presentation on
drugs and gangs, and on warning signs that youth display when engaged in either of these activities. At-
risk components continue to be infused in SPED 560 (Access to Learning) in assignments and course
content. Fieldwork continues to include working in classrooms that have at-risk students. SPED 530
(Typical and Atypical Development) continues to have a focus on students with Autism Spectrum
Disorders who are at-risk for social/behavioral and/or academic failure. These program changes from
the last biennial report have improved program performance as indicated in the above statistics.
WORKING with PARAPROFESSIONALS
The CSU One-Year-Out survey, while showing 80-100% being “well prepared” by first year teachers and
their supervisors in the various areas on the survey, did indicate a need for the Education Specialist
Credential program. Only 67% of the first year teachers felt they were “well or adequately prepared” to
collaborate with paraprofessionals (i.e. Instructional Assistants) in the classroom. Data indicate that this

65
item is a need, and it will be addressed more in the SPED 543 course (Methods) and in SPED 560 (Access
to Learning). This item will also be addressed in the student teaching seminars to a greater extent.
TECHNOLOGY
The program has not performed well in this area according to past one-year-out surveys. However, in
the recent survey 90% of teachers and employers reported they are “well prepared” to use technology
in their teaching. This too is an indicator of a program improvement.
Key Assessment #4: Focus Group
Description of the Assessment
At the end of the program, a focus group is conducted with the cohort. This is an important assessment,
albeit qualitative, because the program is freshly in the mind of the candidates. A facilitator asks semi-
structured questions with probes about the candidates’ perception of the program effectiveness and
how prepared they are to teach.
Table 3.7 Cohort 2011-2012 Focus Group Results
Well prepared Somewhat
prepared
Not prepared
Classroom
management
43% 57%
Assessment 67% 33%
ELL and at risk
students
50% 50%
Curriculum and
instruction
72% 28%
Table 3.8 Cohort 2012-2013 Focus Group Results
Well prepared Somewhat
prepared
Not prepared
Classroom
management
67% 33%

66
Assessment Data missing in
this item
ELL and At-Risk
students
60% 40%
Curriculum and
Instruction
87% 13%
Qualitative comments:
Course assignments need to be more aligned so there is no overlap
Course assignments must be mapped so that there are not multiple signature assignments due in one week
Students would like to have a mentor who is a graduate of the program, to guide them through the process of transitioning from the program into the job market
PART III – Analyses and Discussion of Candidate and Program Data
In synthesizing the four data sets presented in this report, the following analyses can be made:
The program has improved its performance from the last biennial report cycle in areas that were identified as a need: (a) use of technology, (b) working with EL learners, and (c) working with at- risk students. Programmatic changes were made and improvements have been made as indicated across data.
A need identified in this reporting cycle is preparing students to work with paraprofessionals
Course work needs to be better aligned. In order to accomplish this task, meetings need to be held individually with instructors because many have jobs in our area school districts during the day and teach in the evenings (difficult for all of them to attend program faculty meetings).
Synthesis of core content continues to be a challenge for students as evidenced in the portfolios and culminating poster assessments.
Candidates’ knowledge of behavioral supports and classroom management vary according to which data are analyzed.
Overall though, all data indicate that candidates are “well prepared” with the exception of working with paraprofessionals.
The culminating portfolio needs to be revised again. This biennial report was helpful in realizing that it does not measure the new standards and TPEs to the extent needed. Those changes will be incorporated into the new portfolio revisions this semester.

67
PART IV – Use of Assessment Results to Improve Candidate and Program Performance
Each program describes how it used the data from analyses of candidate assessments and program
effectiveness to improve candidate outcomes and program effectiveness. The focus of this section
should not be on the process employed by the institution to discuss changes (although it can be
mentioned briefly), but on the actual considered, proposed, or implemented programmatic changes
specific to the data. If proposed changes are being made, please connect the proposed changes to the
data that stimulated those modifications and to the Program and/or Common Standard(s) that
compels program performance in that area. If preferred, programs may combine responses to
Sections III (Analysis of the Data) with Section IV (Use of Assessment Results to Improve Candidate
and Program Performance) so long as all the required aspects of the responses are addressed.
Issue Proposed Changes/Plan of Action Data Source/s
Working with
paraprofessionals
Infuse this content to SPED 560 and in methods
courses explicitly with much more detail. Add an
assignment to these courses. Work with
supervisors to address this in student teaching
and in seminars.
One-Year-Out survey
Knowledge of school and
community resources for
at-risk students1
Although progress has been made in this area
based on the one-year-out survey, it continues to
be a need. In student teaching seminar a police
officer and other community agencies will
continue to present to the students on the
warning signs for individuals in need and the
services available to students with disabilities and
their families.
One -Year-Out survey
and Focus Group
Building knowledge and
skills in instructional and
management
technologies1
Even if progress has been made in this area as well, technology is moving so fast that it continues to be a priority. A new undergraduate course, COMP 110: Computing for Educators, was approved through the university curriculum process. To be implemented in Fall 2013, co-taught by a CI faulty member and the County Office of Education’s technology specialist.
Faculty is using technology based classrooms to model teaching with technology, and faculty is getting support by CI’s new technology initiative and Director.
One-Year-Out survey,
Focus Group, and
Culminating Portfolios

68
Synthesis of core content
(“seeing the big picture”)
Program instructors will share each other’s syllabi
to know who is teaching what and when, and
work to provide students with connections on
how various core areas are related
Culminating Portfolio,
Culminating Poster,
Focus Group
EL students Continue focusing to keep the program
improvements integrated and appropriately
covered
One-Year-Out survey,
Focus Group
Classroom management
and behavioral supports
Continue focusing across curriculum as this
seems to be a need in some reporting years
Focus Group,
Culminating Poster,
Culminating Portfolio

69
Commission on Teacher Credentialing
Biennial Report 2013
(For Institutions in the Green Cohort Due Fall 2013)
Academic Years 2011-2012 and 2012-13
Institution CSU Channel Islands
Date report is submitted September 15, 2013
Program documented in this report School of Education
Name of Program Administrative Services Credential Program
Please identify all delivery options through
which this program is offered
Traditional
Credential awarded Administrative Services Preliminary Credential
Is this program offered at more than one site? No
If yes, list all sites at which the
program is offered
Program Contact Dr. Tim Rummel
Title Educational Leadership Program Coordinator
Phone # 805-437-8429
E-Mail [email protected]

70
Section A—CREDENTIAL PROGRAM SPECIFIC INFORMATION
PART I—Contextual Information
California State University Channel Islands, located in Ventura County is a four year university that
opened in August of 2002. The School of Education, working closely with the Ventura County
Superintendent of Schools and the Superintendents of the local school districts, identified the
preparation of school administrators as a primary need. In response to this need, CSU Channel Islands
submitted a program proposal for the Preliminary Administrative Services Credential, and this proposal
was approved by CTC in Fall 2004. The Educational Leadership Program admitted its first cohort in Fall
Semester 2004 with an additional cohort being added each year. Cohort Ten will begin classes in Fall
Semester 2013. In Cohorts One through Nine, 129 students have been admitted and 110 have
successfully completed the program. Currently, 24 graduates are known to be employed as school or
district administrators in the area.
Courses are taught by CSU Channel Islands faculty and local school administrators with no instructor
teaching more than one course in the program. The program requires 33 credits (34 for the Masters in
Education). The program includes nine separate courses (27 units) and six units of professional
development/fieldwork.
Students take two courses each semester with the exception of their final semester. Fieldwork is
completed over the entire two years of the program.
Table 4.1 Program Specific Candidate Information
Numbers of candidates and completers/graduates for two years reported
2011-2012 2012-13
Number of
Candidates
Number of Completers/
Graduates
Number of
Candidates
Number of Completers/
Graduates
21 10 18 11 + 2*
* Two candidates from
previous cohorts completed
the program.
Changes Since Last Accreditation Activity (Biennial Report, Program Assessment or Site Visit) Identified places in the curriculum where candidates directly learn the communication and problem solving skills they need in order to work effectively with students, parents, faculty, staff and community. Special attention was placed on working with parents in difficult personal and family situations and school disciplinary matters.

71
(1) Communication and problem solving skills needed to work effectively with students, parents,
faculty and staff and community were addressed in the following courses:
EDPL 610 - Foundations of Curriculum, Instruction and Assessment (Implemented Fall 2011)
(a) The following four textbooks are utilized in the course along with weekly articles from a variety of educational journals.
Readings: Marzano, Robert J. (2003). What Works in Schools- Translating Research into Action, Alexandria, VA. Association for Supervision and Curriculum Development (0-87120-717-6)
Marzano, Robert J. (2001). Classroom Instruction that Works, Alexandria VA. Association for Supervision and Curriculum Development (0-87120-504-1)
Mattos, Mike. (2009). Pyramid Response to Intervention, Bloomington, IN. Solution Tree (978-1-934009-33-8)
Schmoker, Mike. (2006). Results Now, Alexandria, VA. Association for Supervision and Curriculum Development (ISBN-10: 1-14166-0358-1)
In utilizing these books and articles, discussions occur on how to make sure both parents
and colleagues know what is being accomplished. Discussions center on how to
communicate these ideas during Back to School Night or Open House, individual parent
conferences, PTA/Site Council meetings, as well as sharing the information with colleagues
both at the site as a leader and with administrative colleagues at the district level. Creating
public awareness that research and the use of new ideas are integral in promoting student
achievement, is a specific emphasis of the course.
(b) Small group discussions are utilized to solve a variety of problems that face administrators
on a regular basis. Often, the small group discussion scenarios involve a frustrated,
disgruntled parent, or colleague that may have issues in getting along with one another.
The discussion always centers on a resolution where all parties feel that they have been
heard and that a plan of action is in place to resolve the issue.
(c) Students are asked to create an agenda that would be used during a grade level/ or course
level meeting to promote the use of personal classroom data to improve instruction. The
focus is on building trusting relationships among colleagues.
(d) Creating and promoting PLCs at a school site can be a difficult and challenging situation.
Several class sessions are devoted to the challenges and strategies necessary to promote
this work. Each student has to examine their own school's unique situation and develop a
plan to improve this process.

72
(e) Examining individual school RtI programs provides students with an opportunity to problem-
solve some of the legal ramifications of the law.
(f) Students have an opportunity on a weekly basis to discuss any issues that may be facing
their school sites that are unusual or difficult.
EDPL 620 Instructional Leadership of the Principal (Implemented Spring 2012)
(a) Students study and discuss cases that address typical administrative challenges with staff,
students and families. They analyze the cases and develop action plans that address the
conflict positively.
(b) Students learn to use discussion protocols, e.g., protocols from National School Reform
Faculty, to promote full participation, equity and trust. These protocols can serve as useful
tools in faculty interaction in present and future leadership interaction.
(c) Students are exposed to issues leaders confront when working with a diverse student body,
including the achievement gap, accountability and working with parents to foster inclusion
among families.
EDPL 622 School Finance and Applied Leadership (Implemented Fall 2011)
(a) Students are asked to articulate the basic differences between leading as opposed to
managing in an increasingly diverse world.
(b) Students apply skills they find in required readings of research literature from EdSource and
other articles on a myriad of topics covering allocation systems, charter schools, competing
priorities, budget calendars, demographics and enrollment projections, student
achievement, special education and adequacy.
(c) Students define and describe aspects of the present system of funding public schools in lay
terms for audiences which include colleagues, parents, students and community members.
(d) Students individually articulate the nexus between budgeting of financial resources and the
programs that they support, and the importance of this relationship as a roadmap for
student learning.
(e) Students are asked how they would describe to the general public the controls and audit
compliance functions that govern and ensure that public taxpayer dollars are managed and
expended appropriately.
(f) In simulation format, students assume the role of the site principal in managing unforeseen
challenges in areas besides accounting and budget such as safety, food service, facilities,
maintenance and operations, and student organizations.
73
(g) Students are expected to grasp big picture issues, i.e., national and statewide trends and
their implications on the local landscape and to develop a facility for dealing with the media
and other constituent groups in representing the best interests of our children. All students
are required to complete a fieldwork assignment which includes attendance at and/or
participation in a formal school district board meeting, school site council meeting or
budget committee meeting, and communicate and produce a paper describing the topic, its
implications, and what they learned from it.
EDPL 621 School Law
(a) Students developed documents and presentations to interact with students, parents,
faculty, staff and community as it relates to NCLB.
(b) The class focuses on student discipline and student rights. Students create Do’s and
Don’t lists for dialogues with staff and parents based on challenging student discipline and
administrative response scenarios that are case based.
(c) Students defended opposing sides of cases related to English language learners and
students with disabilities. These presentations were contextualized and crafted to be useful
tools for practical applications in interactions with students in the day to day interactions
and duties as an administrator.
EDPL 623 Understanding and Influencing Organizations (Implemented Spring 2012)
(a) Students learn to identify the potential organizational sources of conflict and develop
responses that address the underlying causes of problems. Communication issues are
strongly emphasized in the Human Resource Frame.
(b) Students develop conflict resolution skills that can be used in a variety of situations based
on research-based strategies of communication and negotiation.
(c) Students use the “Balcony Assessment” Strategy to identify issues at their school site and to
develop responses to identified issues based on analysis of the priority and cause of the
issues.
(d) Students learn strategies of communication and conflict management based on John
Kotter’s steps for change. The importance of inclusion of all stakeholders is an essential
element of each student’s project addressing a specific issue at their school site.
EDPL 624 Human Resources in Education (Implemented Fall 2011)
(a) Students read,”K-12 Teacher Termination Hearings Are They Worth the Cost” by Michael
Blacher, then have a class discussion on employee discipline starting at the lowest level of a
conversation with the employee and moving up progressively to termination.
74
(b) Students address the legal issues and what is required of the principal and or district in
progressive discipline scenarios/case studies. Additionally, the public relations aspect of the
cases are also discussed.
(c) Students write a discipline letter using the FRISK model several times during the semester.
It is also tested on the midterm and/or final.
(d) Students review employee contracts and Board Polices to explore what school leaders can
and cannot do and the public relations aspect they need to be aware of in working with
their parent groups.
EDPL 625 Building Inclusive Learning Communities (Implemented Spring 2012)
(a) Students discuss the complex procedures involved with special education and the
responsibility of the school leader in helping parents to navigate the process/procedures.
(b) Students discuss dealing with difficult issues/parent meetings regarding students with
disabilities. Emphasis of discussion is to identify strategies that could be utilized in dealing
with difficult issues while maintaining dignity and respect for all.
(c) Students discuss school culture and building a culture of inclusion and acceptance of all
students.
(d) Identified agencies and community resources that are available for SWD and their families.
(e) Students designed a staff development presentation utilizing technology.
(2) Include in the curriculum mock interviews/and or require each candidate to participate in actual
application and interview for an administrative position.
EDPL 624 Human Resources in Education (Implemented Fall 2011)
(a) Students obtain an application for an administrative position of interest to them, solicit
three letters of recommendation from administrators who have supervised their work,
and prepare both a resume and a cover letter for the position. Application materials are
graded.
(b) Students are required to obtain a list of questions their district uses for interviews with
principals or assistant principals.
(c) Mock interviews are held during class using the questions the students gathered from their
districts. Different types of interview protocols are discussed.
75
(d) Students review ways that candidates can get real life practice applying and doing
interviews.
(3) Include in courses, panels of practicing administrators (school level) who can share experiences
related to the application of course knowledge and skills.
EDPL 620 Instructional Leadership of the Principal (Implemented in Spring 2012)
(a) Students shadow a school principal and prepare written reflections and an oral report on
the experience.
EDPL 623 Understanding and Influencing Organizations (Implemented in Spring 2013)
(a) Students are assigned the task of working together to design and implement a panel of
school administrators to respond to questions developed by the class. All of the details of
the event are managed by the students as a class project that also examines the
organizational challenges of working together as a self-directed team.
(4) Provide each faculty member with the syllabi for all courses in the program thereby increasing
articulation and coordination of course content, resources, projects and assignments across the
entire faculty.
(a) Each faculty member for the program was provided with a notebook of syllabi at a joint
faculty meeting conducted in Fall, 2011. Faculty members shared with the group the
highlights of each course, discussed resources, their projects and assignments. Where
relevant, adjustments were made in course readings and activities as a result of this activity.
(5) Work with Project Vista, a federally funded HSI grant awarded to CSU Channel Islands to support
the enrollment and success of historically under-represented students in graduate programs.
Project Vista is having a profound effect on graduate education at Channel Islands.
(a) A Graduate Center has been established that includes a variety of services for students.
(b) Scholarships awarded based on the leadership potential and financial need of the students.
(c) A mentoring group of Hispanic School Administrators has been organized from schools in Ventura County to support the recruitment and success of leadership candidates.
(d) Project Vista provided I-pads for Cohort VIII that each student used for both professional,
academic and personal purposes throughout the 2012-2013 school year.
(e) A Career Development Network of graduates of the Channel Islands Educational Leadership
Program was established to provide professional development activities and build
collaborative school cultures. Additionally, conflict resolution was offered to current

76
students and to new school administrators during school year 2011-12. Opportunities for
strengthening the network are under consideration.
(f) Admitted Educational Leadership students were provided the opportunity to participate in a
Critical Friends Group during the summer prior to starting the program.
(g) A graduate student writing center has been established on campus to offer support for
graduate students in courses and final culminating projects.
PART II—Candidate Assessment/Performance and Program Effectiveness Information
a) Primary candidate assessments used up to and through recommendation for a credential
Fall Term 1
Individual conference with Candidate and University Fieldwork Supervisor (UFS)
Joint conference with Candidate, Site Administrator and UFS
Academic performance in EDPL Foundations of Curriculum course
Academic performance in EDUC 605 Education in a Diverse Society course
Writing Assessment in EDUC 605
Spring Term 2
Individual conference with University Fieldwork Supervisor (January/February)
Academic performance in EDPL 620 Instructional Leadership of the Principal course
Academic performance in EDPL 623 Understanding and Influencing Organizations course
Joint conference with Candidate, Site Administrator and UFS
Summer Term 3
Academic performance in EDPL 621 School Law course
Academic performance in EDUC 615 Research in Education course
Fall Term 4
Academic performance in EDPL 622 Human Resources in Education course
Academic performance in EDPL 624 School Finance and Applied Leadership course
Joint conference with Candidate, Site Administrator and UFS (September)
Fall Term 5
Academic performance in EDPL 625 Building a Collaborative, Inclusive Learning Community

77
Portfolio documenting Standards aligned work in courses and fieldwork
Individual assessment of the Portfolio by the UFS
Joint assessment conference with Candidate, Site Administrator and UFS
Recommendation of the Site Administrator
Recommendation of the University Fieldwork Supervisor and Program Coordinator
b) Additional information about candidate and program completer performance and program
effectiveness.
1.. Review of end of program Site Administrator Fieldwork Evaluation
2. Focus group of entire cohort conducted by a faculty member not aligned with the program.
3. Review of Portfolio Essays on CPSELs Standards 2 and 3 to assess the clarity of understanding of the
meaning of the standard, quality of fieldwork presented as meeting the standard and alignment of the
fieldwork with the standard.
4. Review of results of Candidate self-assessment of Level of Experience and Level of Knowledge related
to the California Professional Standards for Educational Leadership (CPSELs). This instrument, created
by Dr. Leigh Barton and Dr. Keni Cox of CSU Fullerton was reported on in the International Journal of
Educational Leadership Preparation, Volume 7, Number 1 (March, 2012).
5. Individual structured interviews with Program Completers in their second year of work in a position
requiring the Preliminary Administrative Services Credential.
c) Include aggregated data from 4-6 instruments that were described in (a) and (b) above.
Key Assessments utilized for this analysis of the CI Administrative Services Credential Program:
a) #1 Supervising Site Administrator Evaluations
b) #2 Focus Group Assessment
c) #3 Portfolio Essay Assessment
d) #4 Candidate Self-Assessment of Level of Experience and Level of Knowledge
e) #5 Interviews with Program Completers (Two-Years Out from Program Completion)
Key Assessment #1: Supervising Site Administrator Evaluations
At the end of the program the Supervising Site Administrator completes an evaluation that rates the candidate on each of the CPSELs. A rating of 1 is low, 5 is exceptional and 3.5 to 4 is the rating for an entry level principal.

78
Cohort VII Ten of the ten (100%) candidates completed the program.
Cohort VIII Eleven of the twelve (92%) candidates have completed the program with one
candidate having an incomplete on the Portfolio assessment.
Table 4.2 Supervising Site Administrator Evaluation of Candidates Based on CPSELS
Cohort VII Cohort VIII
CPSEL Standard 1 Average rating 4.25 (range 3.5-5) 4.18 (range 3.0- 5)
CPSEL Standard 2 Average rating 4.55 (range 3.5-5) 4.27 (range 3.5 to 5)
CPSEL Standard 3 Average rating 4.25 (range 3.5-5) 4.31 (range 3.5 to 5)
CPSEL Standard 4 Average rating 4.45 (range 3.5-5) 4.09 (range 3.0 to 5)
CPSEL Standard 5 Average rating 4.35 (range 3.5-5) 4.31 (range 3.5 to 5)
CPSEL Standard 6 Average rating 4.05 (range 3.5-5) 4.09 (range 3 to 3.5)
Table 4.3 Assessment of Candidate’s overall performance (grade) in fieldwork
experiences by the Supervising Site Administrator.
Cohort VII Cohort VIII
A = 70% A = 55% B = 30% B+ = 9%
B = 36%
Note: All candidates above were recommended for the Preliminary Administrative Services Credential.
Key Assessment #2: Focus Group Assessment
A Focus Group Assessment was used for the first time in 2012-13 with Cohort VIII. Focus Group questions included the following:
a. How has your leadership development and practice evolved or changed in the past year(s) while enrolled in the MA/Credential program?
b. How did this program prepare you to advocate, nurture and sustain a school culture that supports the success of all learners?
c. What has been most valuable in this program to you and why?
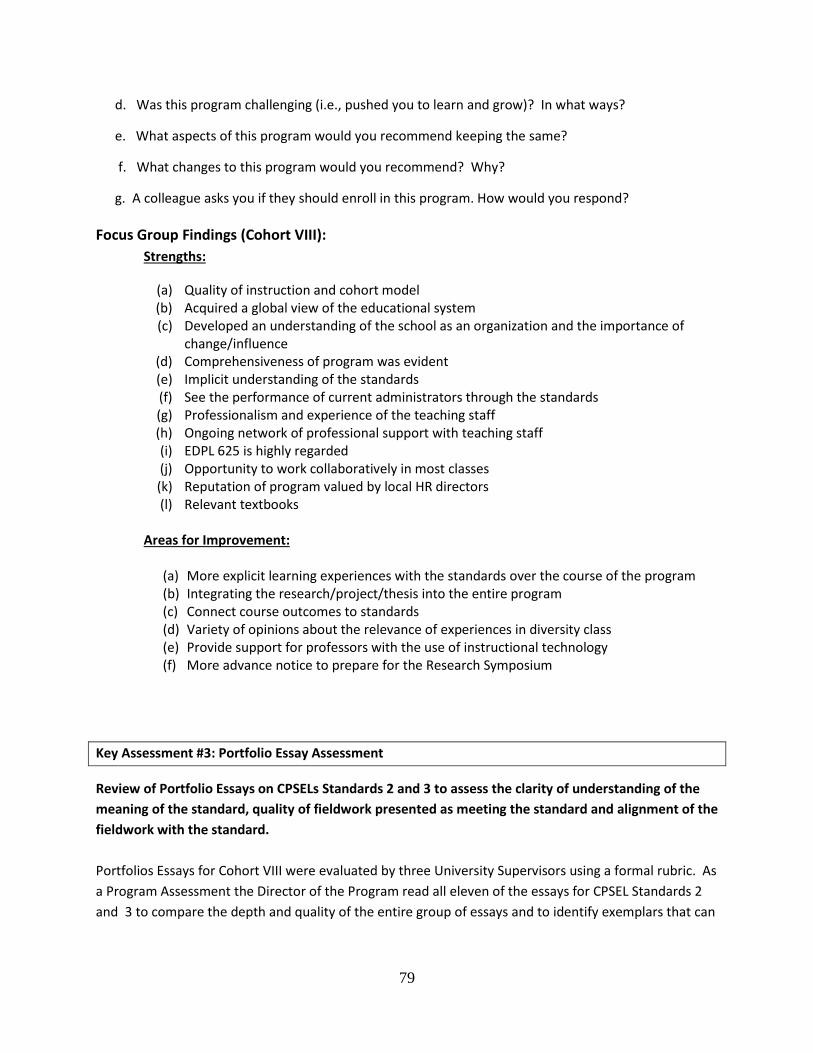
79
d. Was this program challenging (i.e., pushed you to learn and grow)? In what ways?
e. What aspects of this program would you recommend keeping the same?
f. What changes to this program would you recommend? Why?
g. A colleague asks you if they should enroll in this program. How would you respond?
Focus Group Findings (Cohort VIII):
Strengths:
(a) Quality of instruction and cohort model (b) Acquired a global view of the educational system (c) Developed an understanding of the school as an organization and the importance of
change/influence (d) Comprehensiveness of program was evident (e) Implicit understanding of the standards (f) See the performance of current administrators through the standards (g) Professionalism and experience of the teaching staff (h) Ongoing network of professional support with teaching staff (i) EDPL 625 is highly regarded (j) Opportunity to work collaboratively in most classes (k) Reputation of program valued by local HR directors (l) Relevant textbooks
Areas for Improvement:
(a) More explicit learning experiences with the standards over the course of the program (b) Integrating the research/project/thesis into the entire program (c) Connect course outcomes to standards (d) Variety of opinions about the relevance of experiences in diversity class (e) Provide support for professors with the use of instructional technology (f) More advance notice to prepare for the Research Symposium
Key Assessment #3: Portfolio Essay Assessment
Review of Portfolio Essays on CPSELs Standards 2 and 3 to assess the clarity of understanding of the
meaning of the standard, quality of fieldwork presented as meeting the standard and alignment of the
fieldwork with the standard.
Portfolios Essays for Cohort VIII were evaluated by three University Supervisors using a formal rubric. As
a Program Assessment the Director of the Program read all eleven of the essays for CPSEL Standards 2
and 3 to compare the depth and quality of the entire group of essays and to identify exemplars that can

80
guide the work of students in future cohorts and also serve as models for the evaluators. Essays for
eleven of the twelve (92%) candidates were evaluated.
Each essay was evaluated using a scale of 1-4 on the following criteria:
Clarity of presentation of the meaning of the standard: definition, importance, and knowledge
and skills needed to meet the standard.
Quality of fieldwork experiences presented as evidence of meeting the standard
Alignment of fieldwork experiences presented with the elements of the standard
Table 4.4 Portfolio Essay Assessment
Note: Number of students with a percentage score (given a maximum 12 points for each student).
CPSEL Standard 2 CPSEL Standard 3
90-100% (4)
80-89% (2)
70-79% (0)
60-69% (3)
50-60% (1)
40-50% (1)
90-100% (3)
80-89% (3)
70-79% (2)
60-69% (3)
Key Assessment #4: Candidate Self-Assessment of Level of Experience and Level of Knowledge
Review of results of Candidate self-assessment of Level of Experience and Level of Knowledge related to the California Professional Standards for Educational Leadership (CPSELs). This instrument, created by Dr. Leigh Barton and Dr. Keni Cox of CSU Fullerton was reported on in the International Journal of Educational Leadership Preparation, Volume 7, Number 1 (March, 2012).
This self-assessment survey was designed to measure candidates perceptions of their pre-program
and post-program levels of experience and knowledge of specific tasks related to each of the
standards.
The survey was given to all 12 members of Cohort VIII at the conclusion of the program. Surveys
were completed anonymously.
The pilot assessment of Cohort VIII program completers provides initial data from the survey that
can be used as a baseline for future cohorts on a pre and post basis. The survey will also provide the
faculty of the program with the challenge of examining the specific tasks of the survey in
relationship to knowledge and skills that are currently a part of our program.

81
Table 4.5 Candidate Self-Assessment Survey Results
CPSEL Standard 2 4 3 2 1
Level of Experience
Mean=2.95
30% 37% 23% 11%
Level of Knowledge
Mean =3.2
35% 55% 7% 2%
CPSEL Standard 3 4 3 2 1
Level of Experience
Mean =2.65
28% 35% 28% 10%
Level of Knowledge
Mean =3.05
33% 55% 12% 0%
Key Assessment #5: Interviews with Program Completers (Two-Years-Out from Program Completion)
Individual structured interviews of 4 of the 5 program completers who are in their second year in a
position requiring the Preliminary Administrative Services Credential (PASC).
(Note: The fifth program completer was unavailable because of a maternity leave).
The interview process itself provides an opportunity to follow-up with each program completer
who moves into an administrative position. In addition seeking feedback on the Educational
Leadership Program the Program Director and University Supervisors are able to provide
continuing career support for the beginning administrator.
Interviews were conducted with 12 Program Completers in 2011 and in 2014
Seven Program Completers will be completing their second year in an administrative position.
Program Completer Interview Findings:
Program Strengths
i. Cohort Model structure
ii. Practicing professionals as instructors/anecdotal stories
iii. Encouraged to seek an administrative position
iv. Cultural/Ethnic Diversity (ref: CPSEL Standard 4)
v. Ethics/Professionalism modeled by professors
vi. Lifelong learning modeled by professors
vii. Fieldwork spread out over entire program

82
Program Areas for Improvement
i. Need for more practical/in-depth IEP experiences/scenarios
ii. More focus on discipline, parents, conflict resolution, working with Police/focus on entry level position work
iii. Shadowing/Fieldwork at different types of schools
iv. Practical Budget/Purchasing Experience
v. Timing for the Research Class with regard to the Thesis/Project
vi. Clarify project vs. thesis
vii. More focus on counseling with families and staff w/ personal problems
PART III—Analyses and Discussion of Candidate and Program Data
An overview of the data shows continuing strong support for the cohort model, the professionalism and
expertise of faculty and the quality of instruction. While program completers identified the implicit
understanding of the standards throughout the program they singled out the need to make the linkage
to the standards more explicit. A review of the individual sources of data shows the following:
Key Assessment #1: Supervising Site Administrator Evaluations
Site administrators are assigning a small range of evaluation scores and final grade recommendations.
Some program completers are performing at a minimal level and increased focus on the quality, breadth
and depth of fieldwork experiences will strengthen the outcomes of the program. A more clearly
defined set of field work experiences would be helpful to provide supervising site administrators with a
stronger rubric to use when making evaluations.
Key Assessment #2: Focus Group Assessment of Cohort VIII Program Completers
The twelve strengths of the program identified by the Focus Group provide clear evidence of a strong
program that is valued by program completers. Recommendations of the participants point to the need
for strengthening the linkage of the standards and the courses throughout the program. We have begun
implementing this improvement with Cohort IX at the conclusion of the first year of the program and we
have scheduled seminars on the standards for the beginning of the second year (Fall, 2013). Additional
promising suggestions include examining the quality and relevance of the Diversity Class (EDUC 605) and
providing structured support for the faculty in the use of instructional technology.

83
Key Assessment #3: Review of Portfolio Essays on CPSEL Standards 2 and 3
The range of scores on both CPSEL Standards 2 and 3 show a need for improvement in preparing
students to meet the expectations of the portfolio essays. The essays address both an understanding of
the standard and the linkage of quality fieldwork with the intent of the standard. Both of these areas
need attention. There may also be a need to provide additional support in the area of writing for some
of the students who struggle with written expression.
Key Assessment #4: Candidate Self-Assessment of Level of Experience and Level of Knowledge Related
to the CPELs
The use of the self-assessment instrument provides the program with an initial attempt to link specific
administrative tasks with each of the standards. The analysis focused on CPSEL Standards 2 and 3 so as
to narrow the focus and link to assessment #3 above. The results showing that the Level of Knowledge
is stronger than the Level of Experience shows positive support for the content of program and also
room to strengthen the experiential dimension through fieldwork and assignments requiring
application. The instrument will also provide the faculty with a specific set of standards based
applications that can be reviewed/adopted or modified and then used for future program assessment.
Key Assessment #5: Interviews with Program Completers (Two-Years-Out)
The small number of program completers eligible for interviews provides a limited source of data.
However, data that links to other assessment sources and previous/future feedback will be helpful. The
strongest recommendation points to a need to include entry-level skills in the program. The broader
scope of the program built on the CPSELs may not provide program completers with the real life
expectations of an entry-level position that is most often focused on working with students, teachers
and parents on issues related to student management and discipline.
PART IV—Use of Assessment Results to Improve Candidate and Program Performance
Data Source Plan of Action or Proposed Changes Made Applicable Program or
Common Standard(s)
#2,3.4 Strengthen the explicit linkage of the CPSELs
with courses and fieldwork
CPSELs 1-6

84
#1,2,3,4 Clearly define a set of administrative
applications that are linked to the CPSELs
Use the Candidate Self-Assessment of Level of
Experience and Level of Knowledge instrument
as a foundation for this work.
CPSELs 1-6
#1,3,4 Provide candidates with more specific directions
on fieldwork experiences and seek the support
of Supervising Site Administrators in providing
these experiences.
CPSELs 1-6
#5 While maintaining the breadth and depth of the
program provide candidates with preparation
for the challenges of entry-level administrative
positions
CPSELs 2,3,4,5

85
SECTION B
INSTITUTIONAL SUMMARY AND PLAN OF ACTION
This section reflects the institution’s review of the reports from all Commission-approved educator preparation programs within that institution. The summary is submitted by the unit leader: Dean, Director of Education, Superintendent, or Head of the Governing Board of the Program Sponsor.
1) If you have a one page graphic of your unit assessment system, please provide it. If not, please briefly outline your system. The School of Education (SOE) uses a variety of sources of information for all phases of the unit’s assessment, evaluation and improvement processes. The data are gathered from all members of the professional community including the Credential Services and Field Placement staff, faculty, cooperating teachers and other institutional and community partners. The unit relies on the assessment of candidates, faculty and cooperating teachers to improve the quality of its programs. The following describes the unit-wide assessment process, program level information, evaluation activities, and highlights t h e overall S O E evaluation system including the candidate, faculty and cooperating teacher assessment components. Consistent with the Conceptual Framework guiding the SOE, the assessment and evaluation system has three components that are interrelated and cyclically occurring (See Figure 5.1 below).
Figure 5.1

86
The first assessment goal of knowing is aligned with the SOE Conceptual Framework and
seeks information about the SOE, programs, faculty, and candidate performance through
measures of key performances at specific transition points. For example, SOE and program
transition points are documented through biennial reporting; for faculty these transitions are
tracked through the retention/tenure/promotion process; and transition points for candidates
are evaluated through admissions, mid-semester, and end-of-program assessments. The actions
associated with this goal are to identify key elements of the conceptual framework, design
candidate performance indicators, and then gather, collate and summarize the data from the
assessments conducted.
The second assessment and evaluation goal of connecting is aligned with the Conceptual
Framework and seeks to identify the patterns of strength and areas in need of improvement for
the SOE, programs, faculty, and candidates. The actions are to analyze data, reflect upon the
findings, and engage community partners in reflecting upon SOE, program, faculty, and
candidate strengths and weaknesses.
The third evaluation goal of believing is aligned with the SOE Conceptual Framework and uses
the analyses of the assessment data as a base for improving programs and ensuring that SOE
operations are aligned with the values, beliefs and goals of the SOE Conceptual Framework and
University mission. Furthermore this component guides decisions made about the program,
faculty, and candidate progress to ensure that they are based upon the underlying Conceptual
Framework, standards, teacher performance expectations and established effective practices.
The enactment of this goal provides evidence of program, candidate and faculty strength,
identifies areas in need of improvement, and implements action plans associated with the
improvements needed.
We have identified how key assessments at all of these levels align with the elements in our
Conceptual Framework. This was done by examining our admissions process to ensure that
candidate selection is consistently informed by the values and beliefs articulated in that
framework. Another step taken was to align our Conceptual Framework with assessment and
evaluation practices to formally organize the elements of our candidate assessment processes
into one conceptual whole, crafting questions to be answered at each transition point within
and across each credential program. This “whole picture” look is captured in the table below. It
shows how candidates are assessed and how those data are used to answer questions about the
program’s and unit’s effectiveness.
CANDIDATE ASSESSMENT
The following Table 5.1, excerpted from the Channel Islands Common Standards (2009) and updated for this report, identifies the assessment components for all CSU Channel Islands credential program candidates.

87
Table 5.1 School of Education Evaluation System for Judging Candidate Performance across All Credential Programs
Transition
Point Individual Level
Assessments Program Level
Assessments Analysis of
Assessment Data Potential Action
Steps Admission to
program and
entry into field
experience
(Candidates
begin field
experiences
during first
semester so all
field experience
requirements
must be met at
admission to the
program).
Grade point average
indicating academic
and subject matter
preparation
Subject matter
competence (approved
Academic major or
CSET)
Personal qualities for
working with youth
(letters of
recommendation, 45
hours of documented
experience, Field
Observation from
EDUC 521/522
evaluation and hours,
personal interview)
Basic Skills
Requirement
Certificate of
clearance
(Fingerprint and FBI,
DOJ)
Health clearance
(Tuberculin test)
Clarity of
communication--
verbally and in
writing (Personal
statement, written
responses during
interview, personal
interview)
US Constitution
Three Years Teaching
Experience (Ed Admin)
Letters of Rec and Essay
(Ed Admin)
Recruitment
yield
Ethnicity and
gender of
applicants
aggregated
Subject matter
competency
Is the academic
preparation of
candidates
sufficient and
appropriate for
high quality
educators?
Is the School of
Education
attracting and
admitting a diverse
group of students?
Is the School of
Education attracting
and admitting
students to high
demand teaching
areas?
Are the prospective
candidates’
communication skills
effective for
communicating
with children and
adults?
Adjust recruitment
plans and procedures-
recruiting sessions
and materials
Adjust recruitment and
completion of program
for ethnicity, gender
and professional entry
level of candidates
Identify areas where
preparation could be
enhanced, create plan
to work with CI
programs to enhance
subject matter
preparation of
candidates,
implement plan
Identify and seek
funding sources to
support diverse
candidates and
candidates for high
demand areas
Identify roadblocks
and facilitative
strategies for diverse
candidates and
candidates for high
demand areas
Examine reflections
from prerequisite
courses and field
experience for
concurrence with
Conceptual
Framework
Identify key elements
from Conceptual
Framework to
incorporate into scoring
rubrics for admissions
decisions

88
Transition
Point Individual Level
Assessments Program Level
Assessments Analysis of
Assessment Data Potential Action
Steps Mid-term
assessment Review of
candidates’
performance in field
experiences as rated
by cooperating
teachers and
university
supervisors
Review of
candidates’
performance in
courses across
instructors and
supervisors
Faculty meet to
discuss
candidates who
are having
difficulty in
courses and/or
field
experiences.
Are candidates’
dispositions
appropriate for
beginning full time
or in-depth field
experiences?
Are there course
issues or concerns
related to candidate
performance that
can be addressed?
Review of
preparation of
supervisors and/or
cooperating teachers
and new plan
implemented
Creating of mini-
courses in areas of
need such as Spring
Break writing
workshop for
candidates who are
English learners
Statement of Concern
for candidate with
supports and
interventions
specified
Mid-year
assessment Review of
candidates’
performance in field
experiences as rated
by cooperating
teachers and/or
university
supervisors
Review of
candidates’
performance in
courses by program
coordinators and
AVP/Director
Director of
Credential
Services and
Field
Placements/Ed
Admin Coord.
review field
experience
evaluations.
School of
Education
AVP/Director
reviews all
failing grades of
candidates
.
Is candidates’
performance
appropriate for
moving to next
semester of field
experience?
Are there field
experiences across
candidates that
need to be modified
or changed?
Are there courses
w/ unusual patterns
of grading?
Statement of Concern
for candidate with
supports and
interventions
specified
Increase field
observations with
additional coaching
and mentoring
Program
Completion Review of candidate
performance in field
experiences as rated
by cooperating
teachers and
university
supervisors
Review of
candidates’
completion of
courses
Pass rate of
PACT
Subtest scores of
PACT
Completion rate
for cohort
Pass rate for
RICA and
CTEL
What are candidate
strengths and
weakness in field
experience?
Propose changes to
program
Identify across
program areas for
improvement

89
Transition
Point Individual Level
Assessments Program Level
Assessments Analysis of
Assessment Data Potential Action
Steps
Review of candidates
completion of
Teacher Performance
Assessment (PACT)
Review of other
credential specific
requirements for
completion (e.g.,
MS-RICA, CPR,
Mock interviews,
Practice Teaching
Survey; SS Program
End of Year Survey;
ES End of Program
Performance
Assessment, Focus
Group, Performance
Assessment
Exit surveys
completed by
candidates (paper or
focus group)
Exit survey of
graduates
Focus Group
Interviews
What are the
candidate strengths
and weaknesses on
PACT?
How do these
strengths and
weaknesses relate
to other candidate
assessments-
confirming,
disconfirming?
What are the
program
implications for the
candidate’s
performance?
What are the
overall strengths
and weaknesses
across all programs
that can be
addressed by unit
work?
What do candidates
say are the
program’s strengths
and areas in need
of improvement?
Post
Graduation One year follow-up
survey of graduates
and their supervisors
(Multiple Subject,
Single Subject and
Educational
Specialist)
Admin. Services
C r ed en t i a l
P ro g ra m 2 Y e ar
O u t P ro gr a m
C o mp l e t e r S u r v e y
(a post-graduation
survey)
CSU System-
wide survey of
graduates and
their employers
(MS, SS, Sped)
PASC Program
Completer
Survey (Ed
Admin)
What are the
strengths and areas
in need of
improvement as
rated by graduates
and their
employers?
Report data to
administration and
advisory committee
with faculty and staff
recommendations –
strengths and
improvements

90
Measures of Candidate Competence
Key assessments in each program indicate that our graduates have met the Commission-adopted
competency requirements, as specified in the program standards. An overview of key assessments
that have been used in each credential program is provided in Table 5.2.
Table 5 . 2 Map of Key Assessments by Program (2002-2009) ( Taken from Common Standards Report of 2009 and Updated).
Key
Assessments
Categories
Multiple
Subject
(Fall 2002)
Single Subject
(Spring 2004) Education
Specialist I
(Fall 2003)
Education
Specialist II
(Fall 2005)
Administrative
Services
(Fall 2004) Coursework • Course Grades
CO
• Embedded
Signature
Assessments
(PACT)
DR (Syllabi),
PC
• Course
Grades
CO
* Exit
Portfolio:
F04-F13
DR
• Course
Grades
CO
• Signature
Assignments
DR
(Syllabi)
Sample
assignments
in DR
• Course
Grades
CO
• Signature
Assignment
DR
(Syllabi)
• Course Grades
CO
• Signature
Assignments
DR
(Syllabi
Supervisors’
Evaluations
in the Field
* Student Teaching
Evaluation (old
form) F02-Sp07
CO
• Student Teaching
Evaluation (new
form) Sp07-F13
FO, CO
• Student
Teaching
Evaluations
FO, CO
• Student
Teaching
Midterm and
Final
Evaluations
FO, CO
* Student
Teaching
Evaluations
(old form)
2003-2005
CO
• Student
Teaching
Evaluation
(new form)
implemented
2005
FO, CO
• Administrative
Services Field
Evaluation
PC
State
Mandated
Teaching
Performance
Assessment
* TPA F05-Sp07
DR
• PACT pilot F07,
implemented
Sp08
DR
• PACT pilot
F07,
implemented
Sp08
DR
Portfolio
Assessment * Professional
Practice Portfolio
F02-Sp03
NA
* TPE Portfolio
F03-Sp05
DR
* TPA Portfolio
F05-Sp06
DR
*Exit
Portfolio:
F04-F07
DR
* Exit
Portfolio:
F03-Sp06
DR
• Induction
Portfolio
DR
• Reflective
Essays
DR
• Matrix and
Artifact
Presentation
DR

91
Other
Performance
Assessments
• Mock Interviews
DR • Poster
Presentation:
Sp06-present
DR
• Mock Interviews
PC
Survey of
Candidates’
Experience
in Credential
Program
• Practice Teaching
Experience
Survey
DR
• Single
Subject End
of Year
Survey
DR
• Focus
Groups
DR
• Focus
Groups
DR
• One-year
Follow-up
Survey of
Graduates,
Principals
(Spr2009)
PC
• Focus
Groups
DR
• Two-year
Follow-up
Survey of
Graduates,
Principals
(Spr2013)
PC CSU System-
wide
Surveys
• Exit Survey
DR
• One-Year-Out
Survey
DR
• Exit Survey
DR
• One-Year-
Out Survey
DR
• Exit Survey
DR
• One-Year-Out
Survey
DR
* = No longer used • = Currently used = Location of evidence
Location of Evidence: CO = Credential Office DR = Document Room FO = Field Office
PC = Program Coordinator NA = No Evidence Available
Note: Files for current teacher education candidates (Multiple Subject, Single Subject, Education Specialist)
are of two kinds and exist in two places. A master file for each current teacher education candidate exists in
the Credential Services Office and initially contains all documentation of students’ qualifications for entering
a credential program, their application for admission, and the results of the application process (i.e.,
interview rating sheet). Upon completion of the credential program, field placement files are sent to the
Credential Services Office and contents are merged with the master file. All completed master files (which
includes all paperwork required for credential) are kept in the Credential Services Office Archive Room.
While candidates are actively pursuing their credential, their files are located and maintained in the offices of
the Credential Analysts.
In addition to the Credential Service Office’s master file, a field placement file is also kept for each teacher
education candidate while they are completing their field experience. These field placement files are located
and maintained in the Field Placement Office.
Master files for Education Specialist and Administrative Services candidates are located and maintained in the
office of a credential analyst. Upon completion of the program, these files are transferred to the Credential
Services Office Archive Room.
Prerequisite Assessment of Prospective Candidates’ Performance
For the Multiple Subject, Single Subject, and Education Specialist programs, during prerequisite
courses pre-candidates are assessed in coursework and field experience. Prerequisite students’ field
placement cooperating teachers and supervisors assess their dispositions on a standard form. The
Director of Credential Services and Field Placement is responsible for collecting pre-candidate
dispositions and delivering them to Credential S e r v i c e s Office files. At the conclusion of the

92
semester all prerequisite students whose prerequisite course grades are C- or lower are sent to the
AVP/Director of the School of Education for review. If prerequisite students are not progressing
satisfactorily with course work or field experience they will be placed on probation or counseled out of
the program.
Candidate Admission
At admissions the Credential Services Office is responsible for collecting and maintaining all candidate
information. The Credential Services Office staff organizes each candidate’s file and determines if the
candidate has met the minimum requirements for admission to the program (for Multiple Subject,
Single Subject, and Education Specialist Credential candidates--GPA, Subject matter competence,
passage of basic skills requirement, Certificate of Clearance, health clearance, 45 hours of work with
children or youth in schools, passage of course on US constitution, and written essay; for ES II; for the
Administrative Services Credential candidates (ASC)--CBEST, California teaching credential, 5 years of
experience teaching, two letters of recommendation, and essay). If the candidate has met the
requirements then the candidate is scheduled for an interview. Multiple Subject, Single Subject and
Education Specialist programs assess the candidate’s ability to communicate with adults in writing and
verbally by asking the candidate to read, write about and discuss a passage. Groups of candidates
discuss commitment to teaching all learners in the richness of their diversity, and other pertinent
questions while being observed by faculty and scored on a rating scale. Letters of recommendation
and essays are scored using the same rubric. The results of the group discussion, written responses,
recommendations and essay are considered by faculty and credential staff in determining admission.
Once Education Specialist and Administrative Services credential applicants’ files are complete,
they are invited for an interview. At the interview they are assessed on group verbal skills and a
written essay submitted with their application. At the conclusion of the interview process, the faculty
and credential staff determines admission.
All candidate files are stored with the Credential Services Office. Access to the electronic files is
controlled by password protected database. The paper files are either housed with the Credential
Analyst (for active files) or in storage in locked file cabinets for seven years (for graduates). Access
to these files is through the Director of Credential Services and Field Placement.
During Credential Program
Each program coordinator collects, critiques, summarizes and analyzes each candidate’s
performance data with members of their program’s faculty and share relevant data with the
AVP/Director of the School of Education. The Director of Credential Services and Field Placement is
responsible for collecting all field experience data and sharing it with the appropriate individuals--
usually program coordinators and the AVP/Director of the School of Education. All candidate
performance data are summarized in the Biennial Reports to the CTC.

93
Coursework
Each program reviews the grades of candidates at mid-semester. If a candidate is not achieving
successfully, then the program coordinator will meet with the candidate to determine what steps are
necessary for the candidate to become successful. At the end of the semester the University
Records Office sends the AVP/Director of the SOE and Credential Services Office and Field Placement
Director a list of students who have not met either the specific grades or grade point average needed
for successful progress. They examine the candidates listed and determine if there is reason to place a
candidate on probation or dismissal. The AVP/Director of the SOE and Director of Credential Services
and Field Placement are responsible for overseeing any notifications to probationary or dismissed
candidates.
Field Experiences
The Director of Credential Services and Field Placement maintains records of Multiple Subject, Single
Subject, and Education Specialist candidate progress in field experiences and communicates with
supervisors, cooperating teachers, faculty, program coordinators and the AVP/Director of SOE
regarding candidates not progressing satisfactorily in field experiences. Each program has an
instrument for assessing candidates’ fieldwork that is completed by the university supervisor and
cooperating teacher a minimum of twice each semester: at mid- semester and at the conclusion of the
semester. Candidates who are not progressing satisfactorily meet with the Director of Credent ia l
Serv ices and Field Placements and appropriate program coordinator for a Statement of Concern.
This document describes the behaviors that are problematic and the steps the candidate needs to
take to improve or change. The Director of Credential Services and Field Placement or program
coordinator communicates the information to the candidate’s university supervisor and cooperating
teacher.
All supervisors in the Administrative Services Credential (ASC) program complete a mid-point progress
report on fieldwork and an end-of-program final evaluation to evaluate candidates in the field. All
(ASC) candidates are visited a minimum of twice per semester. Supervisors meet regularly to discuss
candidates’ progress towards meeting requirements of the evaluation rubric. The Coordinator of the
Administrative Services Credential program oversees all field and employing supervisors’ work with CI
program candidates.
Culminating Assessment As noted in the Approved Common Standards for CI: “The Multiple and Single Subject Programs use
the Performance Assessment for California Teachers (PACT) as the culminating assessment. This
standardized assessment of teacher performance is aligned with the California standards for the
preparation of teachers and the teacher performance expectations. It provides reliable and valid
information about candidate performance” (from the CI Common Standards Document 2009, p. 41).

94
After Completion of the Credential Program
One year after the completion of the Multiple Subject, Single Subject and Education Specialist
Preliminary Programs, graduates and their supervisors complete a CSU System-wide Survey. The
survey asks how well prepared the new teacher was in the professional preparation program on a
variety of dimensions. Reliability and validity has been established for the instrument by the CSU
Center for Teacher Quality (CTQ). The data it yields is used by each program individually and the SOE
to determine areas of strength and areas in need of improvement. Survey instruments from 2004 to
the present are available for review in the SOE Document Room.
Candidates in the Administrative Services Credential program complete a Focus Group discussion and
program exit survey to provide their feedback on their experiences in the program.
FACULTY ASSESSMENT
There are two types of faculty: tenure-track/tenured or lecturers. University supervisors are all
lecturers. Cooperating teachers are not considered faculty. The processes for assessing the work
of tenure-track/tenured and lecturers are specified in the:
(1) CFA contract: http://www.csuci.edu/academics/faculty/facultyaffairs/cba.htm
(2) University Retention Tenure and Promotion Policies (see http://www.csuci.edu/academics/faculty/facultyaffairs/rtp.htm)
(3) Education Program Personnel Standards (see http://www.csuci.edu/academics/faculty/facultyaffairs/rtp.htm); and policies for the evaluation of lecturers (see http://www.csuci.edu/academics/faculty/facultyaffairs/policies.htm).
(4) University supervisor evaluations in the teacher credential programs, completed by Director of Credential Services and Field Placement, by student teachers, and by cooperating teachers.
Essentially each group must be evaluated by students in every course taught and by peers annually.
These evaluations are reviewed by the AVP/Director of the SOE annually. The faculty member
receives the feedback from the assessments and the AVP/Director. These assessments are used to
determine faculty’s continuation at the University and in the School of Education.
95
Table 5.3 Faculty Assessment Point in Pro- gram
Individual Level Assessments assessments
Program Level Assessments
Analysis of Assessment Data
Potential Action Steps
First Year Tenure-Track Probationary
faculty
Professional Development Plan
(PDP)
First year review
elements:
1. Vita
2. Peer review of
teaching
3. Student
evaluations of
teaching
Reviewed by
Program
Personnel
Committee
(PPC)
Chair
AVP/Director
Is the PDP
appropriate for setting the trajectory
for the faculty member?
Are the student
assessments and
peer observations
indicative of
excellent teaching?
Faculty member re-
writes the PDP
PPC, chair or AVP
recommend faculty
member seek
mentoring, coaching
or sup- port for
teaching
Second year Tenure-track
Probationary
faculty
Portfolio submitted- PDP, Vitae
Self-Assessment of
accomplishments in
teaching, scholarship and service
Student evaluations
of teaching
Peer observation of
teaching
Reviewed by PPC
Chair
AVP/
Dir.
Are the student
assessments and
peer observations
indicative of excel-
lent teaching?
Is faculty member
beginning or
continuing
scholarship
Is faculty member
contributing to
service at the
program level?
PPC, chair or dean
acknowledge and
commend work
and/or recommend
improvements such as
faculty member seek
mentoring, coaching
or support for
teaching.
If progress is not
satisfactory contract
discontinued.
Years three though six tenure-track faculty
Annual portfolio
submitted that
includes Vitae
Self-Assessment of
accomplishments in
teaching, scholarship
and service
Student evaluations
of teaching
Peer observation of teaching
Reviewed by PPC
Chair
AVP/
Dir.
In Years 3 and 6
University RTP
Committee
Are the student assessments and
peer observations
indicative of excel-
lent teaching?
Is faculty member
continuing scholar-
ship at a level
satisfactory for
promotion and
tenure at the
appropriate time?
Is faculty member contributing to
service at gradually
increasing levels?
PPC, chair or AVP
acknowledge and
commend work and/or recommend
improvements such as
faculty member seek
mentoring, coaching
or support for teaching.

96
Post Tenure Every five years tenured faculty not
going for promotion, prepare portfolio of teaching, scholarship and service, Vitae, student evaluations of teaching
Peer review committee PRC
(5 members)
AVP/Director
of the SOE
Is the faculty member’s teaching,
scholarship and service at appropriate levels to benefit the university and program?
PRC or AVP ac-
knowledge and com-
mend work and/or
recommend
improvements such
as faculty member
seek mentoring,
coaching or support
for teaching.
All faculty files are maintained by the University’s Faculty Affairs Office. The AVP/Director of the SOE
has access to these files. Faculty who are on committees reviewing faculty members’ work for
retention, tenure and/or promotion decisions have access to specific faculty member files.
COOPERATING TEACHER ASSESSMENT
School District/County Office of Education Cooperating Teachers are assessed each semester by the
student teacher and by the university supervisor. When items of concern are expressed, the
Director of Credential Services and Field Placement meets with the cooperating teacher to discuss
the concerns. Semi-annually all cooperating teachers are recognized for their contributions to the
university as supervisors.
Table 5.4 School District/County Office Cooperating Teacher Assessment
Point in Pro- gram
Individual Level Assessments
Program Level Assessments
Analysis of Assessment Data
Potential Action Steps
Semi-annually Student teachers and
University
supervisors evaluate
cooperating teacher
Director of Credential Services and Field
Placement re-
views each
assessment
Is the cooperating
teacher mentoring,
supporting and
communicating
with the student teacher?
Is the cooperating
teacher receptive to
the university
supervisor and
communicating?
Cooperating teachers
are honored at end of
year celebration
Cooperating teachers
for which there are
minor concerns are
given feedback about
ways to more
effectively work with
student teacher and
university supervisor.
Cooperating teachers
who are not found to
be satisfactory are not
selected in future.
All Cooperating Teacher files are maintained by the Field Experience Office. Access to these files is through the Director of Credential Services and Field Placements.

97
Biennial Report Planning
In Fall 2007, SOE faculty collectively decided to frame the first biennial report by calendar year
rather than by academic year. In each program, faculty analyzed data collected on candidate
performance from Spring 2007 through Fall 2007. Patterns were identified, strengths noted, and
action plans for making program-level improvements were created. These program-level analyses
and action plans were then collectively reviewed. Patterns across programs were identified,
strengths noted, and an action plan for making School- wide improvements was created. Since
submitting the first biennial report to CTC in August 2008, we have carried out those action plans at
program and School-wide levels, as evidenced in our responses to Common Standard 9.
Our initial experience with the biennial report taught us that the shift in thinking from academic
year to calendar year was not an easy one to make. Since most of our programs create a cohort of
new credential candidates each semester, it was thought in Fall 2007 that simply reporting on the
previous and current semesters’ data made sense. In practice, however, this seemingly simple shift
in defining “yearly” data proved difficult and offered no benefit. In October 2008 SOE faculty
decided to revise the evaluation cycle to reflect data collected on an academic rather than calendar
year schedule, as shown in Table 5.5.
Table 5.5 School of Education Evaluation Cycle: Transition from CY to AY Reporting
SOE Reports on
Candidate
Competence
Semesters of Data Collection
WASC Report Submitted Fall 2006
Fall 2002-Fall 2006
Biennial Report #1 Submitted August 2008
Spring 2007 Fall 2007
Biennial Report #2
Submit October 2010
Spring 2008 Fall 2008 Spring 2009 Fall 2009
Spring 2010
Biennial Report #3
Submit October 2012
Fall 2010 Spring 2011 Fall 2011 Spring 2012
Our next biennial report, due in October 2015, will reflect what we do with data collected over four
semesters – from Fall 2013 through Spring 2015. We will continue to ensure that our analyses and uses
of these data serve purposes that we value, ensuring continual innovation and improvement in our
programs and bringing our School of Education always closer into alignment with the ideals named in
our Conceptual Framework. We intend to follow a similar pattern for each subsequent biennial report,
with purposeful opportunities built into the non-reporting years for looking at data reflexively and
creatively, with an eye toward envisioning new possibilities and innovations as much as toward
identifying and correcting any problems or weaknesses within our programs in the School of Education.

98
To support the documentation of your system in action, please provide a table that shows a sample of the actions the unit has taken in the past two years and link the action with the data and analysis that led to the action. If your institution only offers one approved educator preparation program, this information may have been provided in Section A. Do not repeat the information here, instead please refer the reader back to Section A.
1) Documentation of the Unit Assessment System Based on Analysis of Data (2011-12 and 2012-13)
Table 5.5 School of Education Sample Analysis of Data with Unit Assessment System
Action Taken Date Data Source(s) Analysis leading to the Action
Academic Language (AL)1
Address academic
content language in MS
methods coursework
Incorporate more
direct instruction about
PACT and (AL) in
coursework - especially
math methods and
seminars
All faculty members to
become certified PACT
evaluators to further
knowledge of AL
Insert materials on
Academic Language in
the general methods
course (EDSS 530) with
regard to lesson
planning
Add emphasis on
Academic Language in
the Literacy in the
Content Areas course
(EDSS 540)
Fall 2012
Fall 2013
Spring
2013
Spring
2013
Spring
2013
Teacher Performance
Assessment (PACT)
Academic Language remains an
area for improvement (2.1 and
2.2) in the MS and SS programs.
This is a consistent finding both
across CI results and across
PACT institutions. Working with
campus representatives, the
PACT center is continually
working to clarify the scoring
criteria of the two Academic
Language Development rubrics.
It is disappointing that despite
efforts within the Multiple and
Single Subject programs to: (a)
strengthen candidates’
understanding of language
demands of the curriculum
faced by all students, and (b)
help candidates create a
systematic plan and develop a
repertoire of skills for building
and supporting their students’
academic language proficiency,
that these remain an area of
significant need. These issues
need to continue to be a
priority across the programs.

99
Meeting Instructional needs of
Students with Special Learning
Needs1
Meet with EDSS 560
Instructors to share
qualitative and
quantitative feedback.
SELPA guest speaker in
student teaching
seminar, to review
prior SPED 345 content
Fall 2013
Fall 2011
CSU System-wide Exit
Survey
CSU System-wide
One-Year-Out Survey
The MS and SS program data
highlighted where the program
needs to evaluate how to best
prepare candidates. Figures
showed the percentage of
candidates who felt ‘somewhat’
or ‘not’ prepared to meet the
instructional needs of students
with special learning needs
(30%), with 12% not adequately
knowing about school and
community resources to help
them support at-risk students
and families.
Knowledge of school and
community resources for at-
risk students1
A school principal and a
district level Assistant
Superintendent for
Curriculum Services
invited to speak on
these topics at the
advanced student
teaching seminar
Meet with faculty in
early Fall 2013 to
discuss where family
communication is being
addressed and how it is
presented in both
prerequisite and
program coursework.
Create communication
Fall 2012
(ongoing)
Fall 2013
Spring
2013
CSU System-wide Exit
Survey
CSU System-wide
One-Year-Out Survey
Focus Group (Educ.
Specialist Program)
Focus Group (Ed
Admin Program)
Ed Admin Survey of
Completers
MS program data showed that
12 percent of candidates did
not feel adequately
knowledgeable about school
and community resources to
help them support at-risk
students and families.
Although progress has been
made in this area for the
Education Specialist program
based on the one-year-out
survey, it continues to be an
expressed need.
Ed Admin Focus Group results and Survey of Completer results express a need for more focus on discipline, parents,

100
with families matrix
that identifies desired
skills and where in
program skills are being
taught, reinforced, and
mastered
In student teaching
seminar a police officer
and other community
agencies will continue
to present to the
students on the
warning signs for
individuals in need and
the services available to
students with
disabilities and their
families.
Fall 2011
(ongoing)
conflict resolution, working with Police/focus on entry level position work
Ed Admin Survey of Completers data also indicates a desire for more focus on counseling with families and staff w/ personal problems
Building knowledge and skills
in instructional and
management technologies1
New undergraduate
course, COMP 110:
Computing for
Educators, approved
through the university
curriculum process. To
be implemented in Fall
2013, co-taught by a CI
faulty member and the
Ventura County Office
of Education’s
Technology Specialist
Faculty is using
technology based
classrooms to model
teaching with
technology, and faculty
Fall 2013
Fall 2012
(ongoing)
CSU System-wide Exit
Survey
CSU System-wide
One-Year-Out Survey
Ed Specialist
Culminating Portfolios
MS candidates indicate a need
to be better prepared to use
computer-based technology to
both help students content
(16%) and for instructional and
record keeping purposes (12%).
It is interesting to note, that
71% of MS program graduates
(the lowest rated area) and
100% of their employers regard
the beginning teachers as well
prepared to effectively use
technology, yet 16% students
exiting the Multiple Subject
program do not consider
themselves well or even
adequately prepared in using
instructional or management
technologies.
Even if progress has been made in this area as well for the Ed

101
is getting support by
CI’s new digital
technology initiative
and CI Director.
CI and SOE Digital
Initiatives are providing
training opportunities
for faculty in the area
of new technologies
and available software
applications
Spring
2013
Focus Group (Ed
Admin Program)
Specialist Credential program, technology is moving so fast that it continues to be a priority.
Focus group findings expressed
that there was a need to assist
Ed Admin program faculty in
their proficiency in integrating
new technologies into their
instruction.
Please note any implications for your institution related to the Common Standards based on the data presented in this Biennial Report. This will require a review of the information presented in the Biennial Report with the concepts in the Commission’s Common Standards (1-Leadership, 2-Unit and Program Assessment and Evaluation, 3-Resources, 4-Faculty and Instructional Personnel, 5-Admission, 6-Advice and Assistance, 7-Field Experience, 8-District Employed Supervisors, and 9-Candidate Assessment).
2) Common Standard Implications – (Fall 2013)
Table 5.6 Common Standard Implications – Area to Improve
Identified Issue Program(s)
Involved Area to Improve Applicable Common
Standard (s)
Updating of Student Teaching and
Field Experience Evaluation Forms
and Data Collection Procedures
Multiple
Subject
Single Subject
Ed Specialist
Admin Services
Meet with University
Supervisors in early Fall
to review raw
aggregated data and
review the observation
forms for possible
revisions.
Develop mechanism for
supervisors to enter
student data into a
common digital
spreadsheet for data
collection aggregation
at end of the semester.
Common Standard 2: Unit and Program Assessment
Common Standard 7:
Field Experience

102
Table 5.6 Common Standard Implications – Area of Strength
Identified Issue Program(s)
Involved Area of Strength Applicable Common
Standard (s)
Demonstration of new technology
by SOE faculty in their coursework
and the utilization of these digital
resources with their Instructional
practices, daily work and research
Hands-on use of new technologies
by SOE program candidates
Multiple
Subject
Single Subject
Ed Specialist
Admin Services
SOE Faculty, Staff and
Field Supervisors have
been issued iPads for
their use in teaching,
evaluation, research,
daily work and
communication.
Faculty, Staff and
Supervisors are able to
acquire desired
software applications
as needed from the
SOE Budget Analyst
with AVP approval
(funds have been set
aside for iPad Ap
purchases)
A new digital teaching
lab was created for the
SOE in newly
constructed facilities
that is equipped with a
class set of iPads,
Technology Cart,
Instructional Station,
Ceiling Mounted HD
Projection System,
Portable HD Projection
System, Promethean
Smart Board, Apple TV
capability, and a flex
furniture arrangement
Annual SOE Digital Day
Workshop and ongoing
user group and training
opportunities
Common Standard 3:
Resources

103
throughout the
academic year for SOE
Faculty, Staff, and
Candidates
SOE Supervisors are
using Digital
Evaluation
Documentation and
Archiving for Candidate
Field Experience and
Clinical Practice
Evaluation Purposes
Candidate Co-Teaching
Teams in the Multiple
Subject and Education
Specialist Programs are
issued iPads for use in
classroom instruction
and planning (the
Candidate and the
Cooperating Teacher
are each provided a
loaner iPad for the CI
academic year to utilize
in their Co-Teaching
classroom).
Ed Admin Cohorts are
issued iPads for use in
their coursework and
in everyday work in
their current positions
for the CI academic
year.
Faculty is training to
teach in blended and
online instructional
formats.
Common Standard 3:
Resources