california abandoned mines prioritization tool · california abandoned mines prioritization tool...
TRANSCRIPT
California Abandoned Mines Prioritization Tool
Phase I Technical and Business Process Report
Prepared For: Department of Conservation
Sacramento, CA
Sierra Nevada Conservancy Auburn, CA
Prepared By:
Fraser Shilling, Ph.D., UC Davis Glenda Marsh, M.S. & Sarah Reeves, Geologist, Department of Conservation
April 27, 2017
STATE OF CALIFORNIA DEPARTMENT OF CONSERVATION DIVISION OF MINE RECLAMATION
ABANDONED MINE LANDS PROGRAM 801 K Street
Sacramento, California 95814
California Abandoned Mines Prioritization Tool April 27, 2017 P a g e | 1
Table of Contents
Acknowledgements ......................................................................................................................... 4
Executive Summary ........................................................................................................................ 5
1.0 Project Overview ...................................................................................................................... 7
1.1 Background ............................................................................................................................... 7
1.2 Approach and Progress ............................................................................................................. 9
1.3 Scope of Work ........................................................................................................................ 12
2.0 Model Objectives and Requirements ...................................................................................... 13
2.1 Tool Services .......................................................................................................................... 13
2.2 Model Client-Base Summary .................................................................................................. 13
2.3 Model Development ................................................................................................................ 15
2.3.1 Prioritization Model Types & Characteristics ............................................................... 15
2.3.2 Basis for Prioritization Model Algorithm ...................................................................... 16
2.3.3 Model Design ................................................................................................................. 20
2.3.4 Model Output ................................................................................................................. 30
3.0 Project Summary ..................................................................................................................... 31
3.1 Next Steps for Model Implementation .................................................................................... 32
4.0 Glossary of Terms ................................................................................................................... 34
5.0 Literature Cited ....................................................................................................................... 37
6.0 Appendices .............................................................................................................................. 38
California Abandoned Mines Prioritization Tool April 27, 2017 P a g e | 2
Figures
Figure 1. Work flow for Tiers 1, 2, and 3. .................................................................................... 11
Figure 2. Evaluation range types. ................................................................................................. 19
Figure 3. Imminent risk to human or ecological health – Tier 2 Physical Hazard. ...................... 22
Figure 4 Risk from detection of elevated Constituents of Concern – Tier 2 Chemical Hazard. .. 23
Figure 5. Imminent risk to humans or ecological health – Tier 3. ................................................ 24
Figure 6. Risk from type and concentration of constituent in media (soil, sediment, groundwater,
surface water) – Tier 3. ................................................................................................................. 25
Figure 7. Risk from volume of contaminated material – Tier 3. .................................................. 26
Figure 8. Risk from mobility of contaminants – Tier 3. ............................................................... 27
Figure 9. Example of model output showing range of scores for the best sites for remediation in
the Sacramento River watershed, including consideration of the risk of methylation and private
property. (Shilling et al., 2002). .................................................................................................... 30
California Abandoned Mines Prioritization Tool April 27, 2017 P a g e | 3
Tables
Table 1. Agency risk framework. ................................................................................................... 7
Table 2. State and federal agencies participating in CAMPT. ........................................................ 8
Table 3. – Phase I – Planning........................................................................................................ 12
Table 4. Phase II - Tool development and implementation. ......................................................... 13
Table 5. Correspondence between CAMPT screening tiers and state and federal site investigation
and cleanup process activities. ...................................................................................................... 14
Table 6. Example attributes and evaluation values. ...................................................................... 17
Table 7. Constituents of concern and media included in Tier 3. .................................................. 20
Table 8. Breakdown of logical implementation phases. ............................................................... 32
California Abandoned Mines Prioritization Tool April 27, 2017 P a g e | 4 Acknowledgements
This groundbreaking project would not have been possible without funding from the Sierra Nevada Conservancy and the Department of Conservation. Equally, the project depended on the generous provision of expertise, commitment, and teamwork from staff and management from state and federal agencies, and academic partners who are involved with addressing the hazards from abandoned mines in California.
Jim Branham, Sierra Nevada Conservancy Julie Griffith-Flatter, Sierra Nevada Conservancy Fraser Shilling, Ph,D., University of California, Davis Carrie Monahan, Ph.D., California State University, Chico Bill Ryan, Department of Toxic Substances Control Steven Becker, Department of Toxic Substances Control Randy Adams, Department of Toxic Substances Control Carolyn Yee, Department of Toxic Substances Control Leslie Graves (retired), State Water Resources Control Board Josh Munn, State Water Resources Control Board Mark Barston, State Water Resources Control Board Erin Garner, State Water Resources Control Board Robert Busby, Central Valley Regional Water Quality Control Board Lindsay Whalin, San Francisco Bay Regional Water Quality Control Board Matt Keeling, Central Coast Regional Water Quality Control Board Doug Smith, Lahontan Regional Water Quality Control Board Charlie Alpers, Ph.D., U.S. Geological Survey Dennis Geiser, U.S. Forest Service Peter Graves, Bureau of Land Management Sterling White, Desert District, Bureau of Land Management John Hillenbrand, U.S. Environmental Protection Agency Ben Roberts, National Park Service Pat Perez, Department of Conservation Glenda Marsh, Department of Conservation Sarah Reeves, Department of Conservation Craig Turner, Department of Conservation Jon Mistchenko, Department of Conservation Samantha Birdsong, Department of Conservation Nate Roth, Department of Conservation
California Abandoned Mines Prioritization Tool April 27, 2017 P a g e | 5 Executive Summary
California has over 47,000 potential legacy abandoned mine sites which vary considerably in the risks and hazards they pose to the public and the environment. The Department of Conservation’s (DOC) Division of Mine Reclamation (DMR) led the California Abandoned Mine Prioritization Tool (CAMPT) project to help develop a proposed work flow that could prioritize and rank legacy abandoned mine sites in California for further study and clean-up based on relative risks and hazards. Such a work flow could be the basis for a new system that could be used by multiple federal and state land, resource, environmental and public health management agencies and departments to prioritize funding to address physical and chemical contamination challenges at abandoned mines. A statewide system for priority ranking will:
Help identify where to perform new inventories of Abandoned Mine Lands (AML); Select mine sites that should be assessed for potential environmental contamination; Identify which sites should be considered for clean up; and Determine which physical hazards generate the highest risk.
The goal of Phase I of CAMPT is to support development of a comprehensive and flexible ranking tool that encompasses the needs and interests of multiple entities and provides the ability to rank AML sites based on specific criteria, and includes the ability to apply the tool to data residing in different data systems at multiple agencies and departments. Phase I resulted in a work flow that encompasses both physical safety and chemical contamination risks. Agencies use a three-point framework for evaluating chemical risks from abandoned mines:
1) Are there contaminants that pose a hazard? 2) Is the contamination carried off site? 3) Can the contamination impact human or ecological receptors?
The framework for physical hazards involves 2 factors:
1) Depth, height, or condition of mine features. 2) Ease and manner (i.e., distance, vehicle, hike) of public access to the mine site.
The work flow for the proposed tool is based on attributes and guidelines developed previously by agency experts participating in the California Abandoned Mine Lands Agency Group (CAMLAG). These attributes were separated into “tiers” which describe different successive steps in prioritizing mine sites for further investigation. Tier 1 takes available information in GIS for the tens of thousands mine sites in the state and would result in prioritization of sites that may pose immediate risk to the public, or that may pose a risk and need further investigation. Tier 2 would take information from site visits to each of the prioritized Tier 1 sites and would result in a set of prioritized sites that pose a potential risk and that need in-depth investigation or remediation of physical safety hazards. Tier 3 would take the information from in-depth investigations and prioritize the mine sites that are most likely to need contamination cleanup to protect public and environmental well-being. The workflow also recognizes that the prioritization process

California Abandoned Mines Prioritization Tool April 27, 2017 P a g e | 6 should allow space for identification of mine sites that pose an acute risk and the inclusion of expert opinion in prioritization.
This document outlines important steps in the work flow, the client base for risk and hazard reduction, a prioritization model, next steps, potential financial requirements, and benefits of taking action.
California Abandoned Mines Prioritization Tool April 27, 2017 P a g e | 7 1.0 Project Overview
1.1 Background
The California Abandoned Mines Prioritization Tool (CAMPT) project originated from various federal, state and local agencies participating in the California Abandoned Mine Lands Agency Group (CAMLAG), including DOC, that have examined different ways of investigating potential impacts, prioritizing and remediating legacy abandoned mine sites in California posing the most risk. In many ways, this project formalizes discussion over the last decade among members of CAMLAG about how to formalize steps in prioritizing mine sites for further study and remediation. The CAMLAG charter identifies the group’s role in developing the CAMPT system with two objectives:
Supports a more efficient and effective implementation of programs and tools used to address California’s abandoned mine land problems.
Develops criteria for selecting and addressing abandoned mine sites for remediation.
In addressing these two objectives, CAMLAG created a problem statement detailing the challenge agencies face in prioritizing mine sites and coordinating resources to achieve remediation.
“Various state and federal programs exist to identify and remediate the physical and chemical hazards from legacy mines in California. Such mines may endanger human health and the environment, posing risks from low to high. In addition, the risk is not known for every mine site. Funding to remediate mine sites is limited and therefore requires choosing amongst sites. One of the barriers to making choices is not having a way to rank sites statewide. Such a ranking would enable regulators and land management agencies to select sites according to risk and endangerment and apply various fund sources based on a prioritization.”
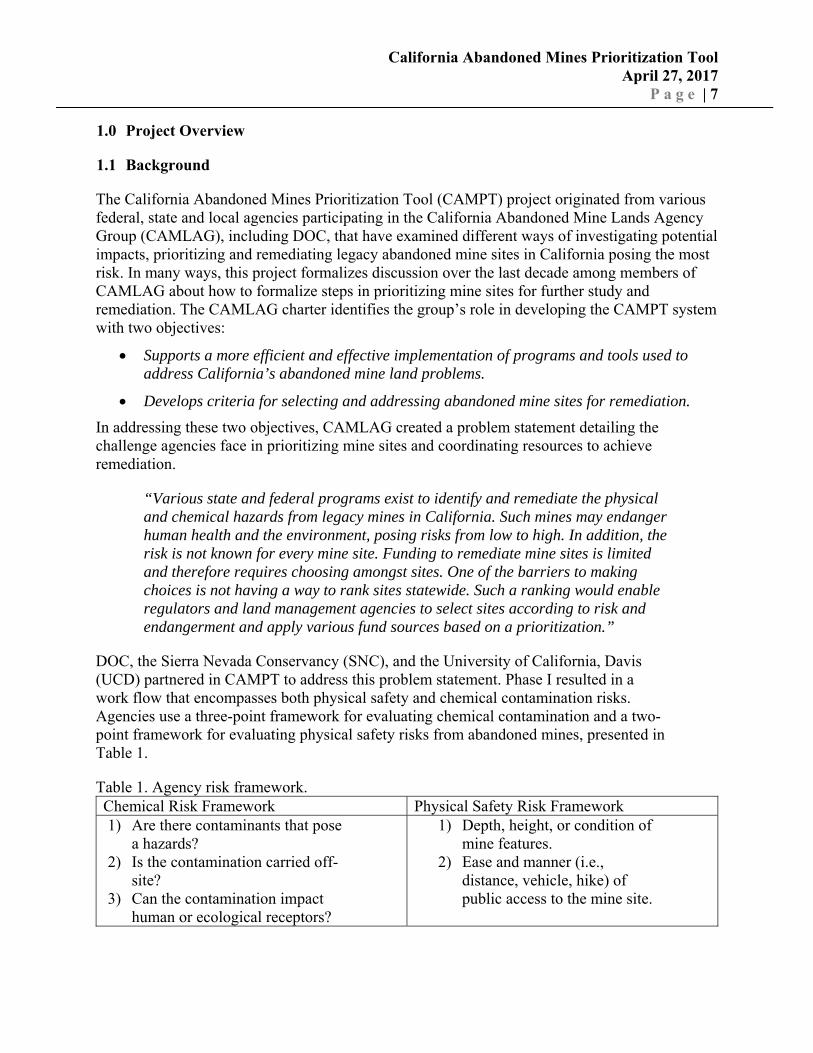
DOC, the Sierra Nevada Conservancy (SNC), and the University of California, Davis (UCD) partnered in CAMPT to address this problem statement. Phase I resulted in a work flow that encompasses both physical safety and chemical contamination risks. Agencies use a three-point framework for evaluating chemical contamination and a two-point framework for evaluating physical safety risks from abandoned mines, presented in Table 1.
Table 1. Agency risk framework. Chemical Risk Framework Physical Safety Risk Framework 1) Are there contaminants that pose
a hazards? 2) Is the contamination carried off-
site? 3) Can the contamination impact
human or ecological receptors?
1) Depth, height, or condition of mine features.
2) Ease and manner (i.e., distance, vehicle, hike) of public access to the mine site.
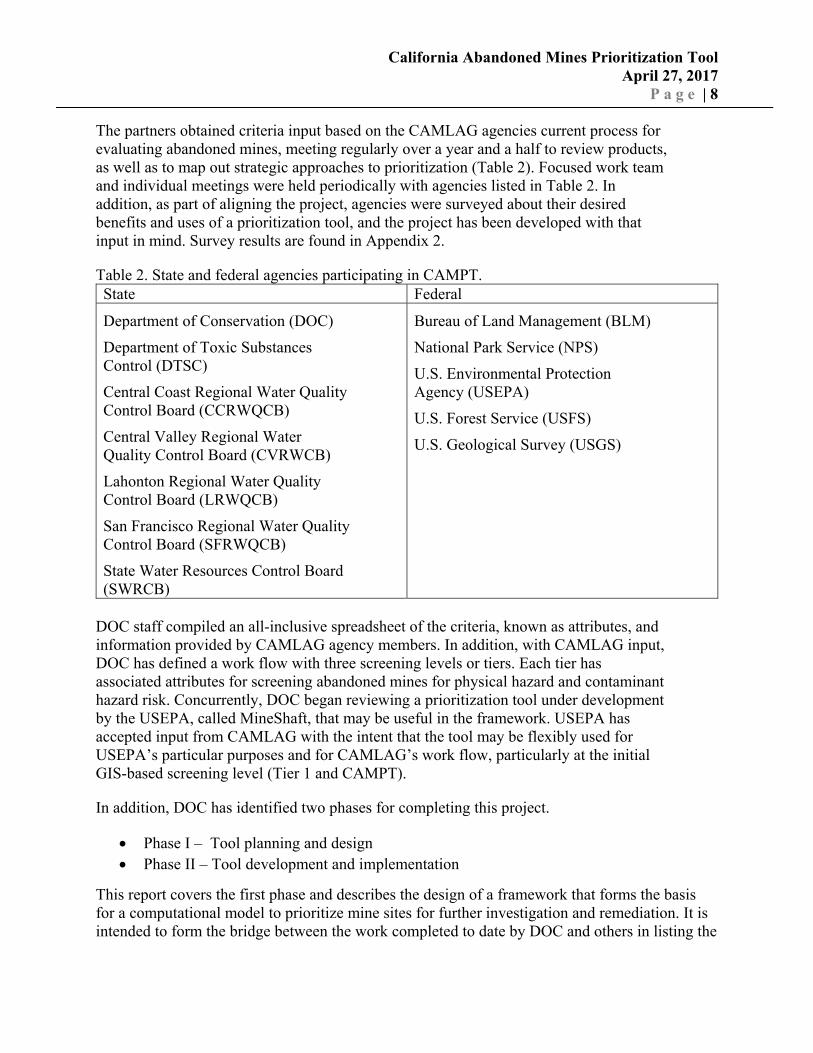
California Abandoned Mines Prioritization Tool April 27, 2017 P a g e | 8 The partners obtained criteria input based on the CAMLAG agencies current process for evaluating abandoned mines, meeting regularly over a year and a half to review products, as well as to map out strategic approaches to prioritization (Table 2). Focused work team and individual meetings were held periodically with agencies listed in Table 2. In addition, as part of aligning the project, agencies were surveyed about their desired benefits and uses of a prioritization tool, and the project has been developed with that input in mind. Survey results are found in Appendix 2.
Table 2. State and federal agencies participating in CAMPT. State Federal
Department of Conservation (DOC)
Department of Toxic Substances Control (DTSC)
Central Coast Regional Water Quality Control Board (CCRWQCB)
Central Valley Regional Water Quality Control Board (CVRWCB)
Lahonton Regional Water Quality Control Board (LRWQCB)
San Francisco Regional Water Quality Control Board (SFRWQCB)
State Water Resources Control Board (SWRCB)
Bureau of Land Management (BLM)
National Park Service (NPS)
U.S. Environmental Protection Agency (USEPA)
U.S. Forest Service (USFS)
U.S. Geological Survey (USGS)
DOC staff compiled an all-inclusive spreadsheet of the criteria, known as attributes, and information provided by CAMLAG agency members. In addition, with CAMLAG input, DOC has defined a work flow with three screening levels or tiers. Each tier has associated attributes for screening abandoned mines for physical hazard and contaminant hazard risk. Concurrently, DOC began reviewing a prioritization tool under development by the USEPA, called MineShaft, that may be useful in the framework. USEPA has accepted input from CAMLAG with the intent that the tool may be flexibly used for USEPA’s particular purposes and for CAMLAG’s work flow, particularly at the initial GIS-based screening level (Tier 1 and CAMPT).
In addition, DOC has identified two phases for completing this project.
Phase I – Tool planning and design Phase II – Tool development and implementation
This report covers the first phase and describes the design of a framework that forms the basis for a computational model to prioritize mine sites for further investigation and remediation. It is intended to form the bridge between the work completed to date by DOC and others in listing the
California Abandoned Mines Prioritization Tool April 27, 2017 P a g e | 9 types of attributes that could be used to prioritize mine sites and the development of a tool that results in lists of mine sites prioritized for action. This bridging role also included many opportunities for CAMLAG agencies to introduce new ideas, check inclusion of important attributes, and verify utility of the tool for their institutional purposes.
The next phase, if implemented, would result in creation of a spatially-explicit decision-support tool that uses available information about mine sites to develop a list of mine sites for implementing further investigation, or for immediate in-depth investigation and remediation for sites that appear to pose immediate risk to the public or environment.
1.2 Approach and Progress
The CAMPT builds upon existing knowledge and priorities of multiple agencies and stakeholders. Existing prioritization guidance from agencies has been incorporated in the project, including a computerized analytical tool called the Preliminary Assessment and Ranking model (PAR) created in 1998 by DOC with input from the Abandoned Mine Lands Task Force, consisting of various agencies, as an in-house method to analyze the types of data collected by DOC during preliminary screening-level field site visits. The PAR served as the basis for creating a more flexible, data-specific, and spatially based model. The PAR model scored and ranked sites based on observable data collected in the field and limited analytical data collected with field meters. While the PAR model did rank all sites across multiple agencies, it did not use more detailed information that is typically gathered with site investigation or characterization activities, limiting the usefulness of the PAR model in prioritizing sites for remedial actions. The PAR model also was developed at a time when acid mine drainage (AMD) was the prevalent contamination issue of concern with abandoned mines. Since that time, mercury, a complex contamination issue, and other heavy metals associated with many abandoned mines have gained increasing attention, and the PAR model underrepresents the contamination hazards that might be present. Appendix 1 lists all of the guidance and technical documents used to provide the initial criteria used in CAMPT.
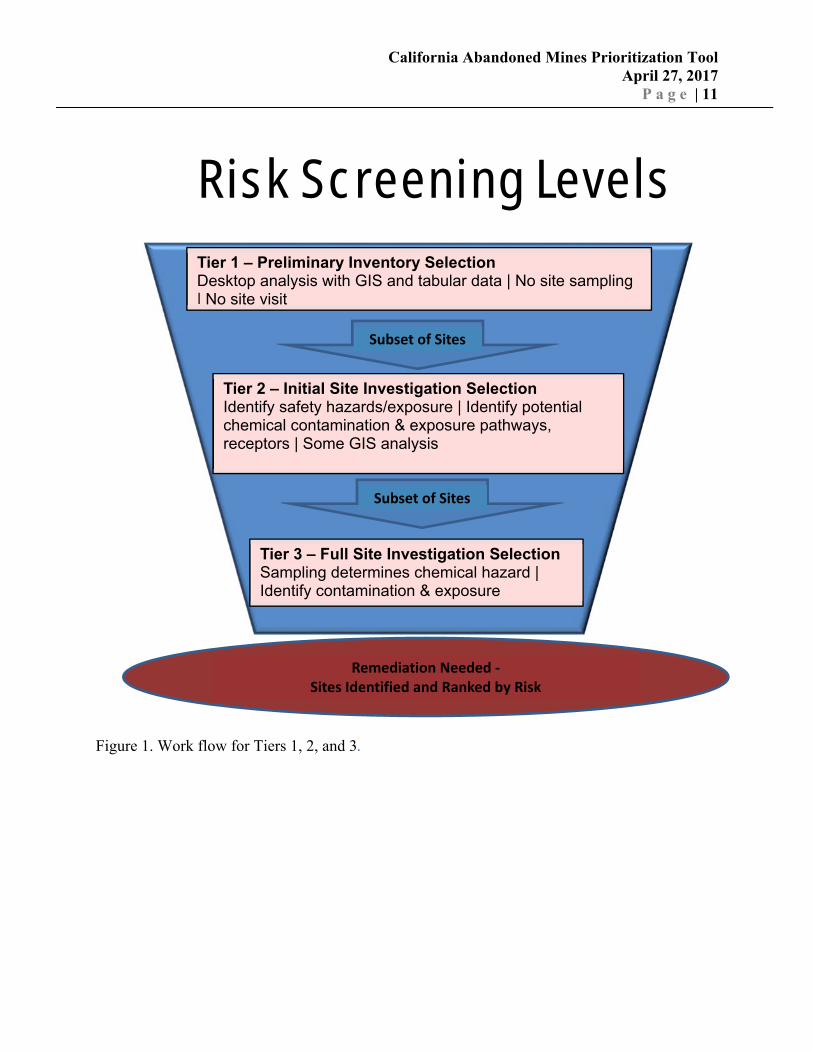
The development of the tool represents the first major step in the overall path to eventual remediation of California’s abandoned mine sites that pose the most risks to humans, wildlife, and the environment. The tool provides a work flow involving a series of decision points or screening tiers based on data available at the time to produce prioritized lists of mine sites. Attributes used in each of the screening tiers are defined to identify whether there is the potential to cause impacts, and thus to score and rank sites based on hazard they present. Figure 1 shows the inputs and outputs for each tier in a work flow for a system using explicit data for prioritizing hazards from abandoned mines.
The objective of Tier 1 is to select potential areas or sites that may have an elevated risk of either physical or contamination impacts to humans, wildlife or the environment and for which no site-specific data is available. This selection Tier is a desktop GIS analysis only and no site-specific information is used in the analysis. Data used for this tier would be readily available in GIS format and GIS analysis would be applied to potential areas or sites to rank for performing future preliminary inventory. The objective of Tier 2 is to
California Abandoned Mines Prioritization Tool April 27, 2017 P a g e | 10 select sites with potential risk to humans, wildlife or the environment based on data collected during a preliminary inventory and where additional information is needed to determine the actual risk associated with the site. Data collected for this tier consists of qualitative and quantitative information, but not sampling, collected during the preliminary inventory process that can be used to determine if a site will need further investigation. The objective of Tier 3 is to select sites identified to have actual risk to humans, wildlife or the environment based on data collected during an initial site investigation and where additional data is needed to fill critical data gaps before a final decision on a remedial action is taken. Attributes used in Tier 3 focus on the framework for chemical contamination in Table 1. In addition, Tier 3 includes a set of supplemental attributes, called Supplemental Considerations in Appendix 6, that agencies use to identify special impacts or sites that are more suitable for clean up, such as sites that impact tribal, low-income or minority communities, or sites that have clean up projects already partially funded. Data collected through a Preliminary Assessment/Site Investigation (PASI) or equivalent process will help determine which sites need a more thorough full site characterization or which sites have enough information to determine remedial action.
California Abandoned Mines Prioritization Tool April 27, 2017 P a g e | 11
Figure 1. Work flow for Tiers 1, 2, and 3.
Risk Screening Levels
Tier 1 – Preliminary Inventory Selection Desktop analysis with GIS and tabular data | No site sampling | No site visit
Tier 2 – Initial Site Investigation Selection Identify safety hazards/exposure | Identify potential chemical contamination & exposure pathways, receptors | Some GIS analysis
Tier 3 – Full Site Investigation Selection Sampling determines chemical hazard | Identify contamination & exposure
Remediation Needed - Sites Identified and Ranked by Risk
Subset of Sites
Subset of Sites

California Abandoned Mines Prioritization Tool April 27, 2017 P a g e | 12 CAMLAG has selected ranking attributes that are relevant to physical safety hazards and human health and environment contaminant hazards. DOC and partners compiled and organized the attribute sets provided by CAMLAG agency members. The attributes use data about mine sites to evaluate risk, which will result in a score and rank for each site. Attributes have different types of associated data, such as geospatial data, other data in electronic format, and data in non-electronic format (reports or literature, for example). Important data gaps were also identified such as there not being broad coverage of water quality data for smaller watersheds where many abandoned mines are located.
1.3 Scope of Work
DOC and the SNC, with technical guidance and expertise from UCD, completed the Phase I (Table 3) development of the criteria (called attributes in the model), business processes, and scores and weights for each attribute. This report contains the documentation for all three of these tasks in Phase I.
Table 3. – Phase I – Planning.
TASK 1: Coordinate with CAMLAG participants to further refine and define a uniform set of criteria for the transparent and consistent application across agencies in the state. This will result in a final set of criteria, criteria definitions, and grouping of criteria into appropriate screening levels. Activities include: Develop consensus between CAMLAG participants on data definitions for each
criteria. Identify the most appropriate foundation data set(s) of mines to which the tool
would be applied. In coordination with CAMLAG participants, gather and evaluate existing
geospatial or other data sets that could be used to support the criteria, identify other sources (outside of CAMLAG) of pertinent data or information that may add benefit, and make recommendations for how best to use geospatial or other data sets that may be incomplete or inconsistent, but may be the best data available. Identify data gaps in criteria and geospatial data.
Refine criteria based on identified foundation data. TASK 2: In coordination with CAMLAG participants, develop an integrated business
process for using this tool with available data sets that will meet stakeholders usage needs.
TASK 3: Develop numerical scores and weights for each criteria. Review and incorporate, when appropriate, elements from the U.S. EPA’s Hazard Ranking System (HRS) and site selection tool, DOC’s Preliminary Appraisal and Ranking System (PAR), Department of Toxic Substance Control’s Priority Setting Procedures for Cleanup of State-Funded Hazardous Substances Release Sites, and the Montana Department of State Lands Abandoned and Inactive Mines Scoring System into the algorithm.
Source: Scope of work for DOC-UCD-SNC Agreement # 6014-012.
Programming, platform identification, and implementation tasks of Phase II were not performed as part of this project, but are outlined here for informational purposes (Table 4).

California Abandoned Mines Prioritization Tool April 27, 2017 P a g e | 13 Table 4. Phase II - Tool development and implementation. TASK 1: Develop an algorithm using the scores and weights defined in Phase I into an
algorithm that produces a weighted rank for each identified mine site in a data set. The algorithm should allow for statewide ranking of abandoned mine sites as well as targeted ranking based on selected criteria from the user.
TASK 2: Develop a computer-based spatial modeling tool that uses the criteria and datasets identified in Phase I to prioritize mine sites for management action. Activities may include: Determine software and or programming needs necessary for creating a
tool usable by multiple agencies. Test tool on foundation data set identified during Phase I to produce an
initial rankings of sites statewide. Conduct user testing with CAMLAG agencies. Adjust scores or weights of individual criteria to reflect the professional
judgment of how types of mine sites or contaminant problems should rank, as needed.
Finalize tool and algorithm.
2.0 Model Objectives and Requirements
2.1 Tool Services
The goal of the tool is to provide a series of prioritized lists of mine sites in three tiers of prioritization to inform decision-making about sites that may pose a risk or hazard to the public or environment, sites needing further study, and sites for which remediation engineering plans should be carried out. One important service of the tool is that it encourages multiple agencies to use similar prioritization rules and criteria across California’s diverse abandoned mine sites. This is likely to assure that abandoned mine sites selected for remediation are the most in need, when compared to other such sites within the state. A transparent and information-based presentation of the state’s abandoned mine threats will assure decision-makers and funders that resources will be applied to identified priorities, similar to states that administer federal funds for abandoned coal mine clean up and reclamation where ranked risks are a requirement.
The output of CAMPT Tier 1 will be a list of priority areas or mine sites to focus future preliminary inventory efforts that may pose a risk or hazard to the public or environment. Tier 2 results in a list of priority sites where additional information is needed which is gathered during an initial site investigation, such as a PASI or equivalent process. Tier 3 results in a prioritized list of sites that need a full site characterization before a remedial action can take place.
2.2 Model Client-Base Summary
State and federal agencies have pursued abandoned mine cleanup and remediation for many years. The rate of cleanup has been limited by a variety of challenges, including – lack of a standardized tool for prioritizing mines throughout the state and funding for clean up and reclamation of high priority mine sites. This project covers the former in order to inform the latter.
CAMLAG, which is composed of local, state and federal agencies, offers a forum for improving how to use new tools for ranking the risks posed by different mine sites. The clientele for the

California Abandoned Mines Prioritization Tool April 27, 2017 P a g e | 14 plan and modeling is primarily agencies, but also includes non-governmental organizations and the private sector that have expressed interest in the topic. One of the critical aspects of CAMPT is that it has been developed to meet the existing remediation decision-support needs of state and federal agencies. Table 5 presents the proposed alignments of the three CAMPT screening tiers with federal and state site investigation and cleanup process activities. Understanding this alignment helps agencies and departments further standardize and collect data that can be used in a prioritization tool work flow, such as envisioned with CAMPT.
Within agencies and organizations, the client base includes both policy-makers in management and technical staff charged with developing recommended priorities to support policies. The aim of the prioritization tool is to support the efforts to inform decision-makers with reducing the number of physical and chemical hazards on humans and the environment from abandoned mines.
Table 5. Correspondence between CAMPT screening tiers and state and federal site investigation and cleanup process activities.
Key: [a] Water Code – Porter-Cologne Water Quality Control Act. [b] Resolution 92-49 (Water Code Section 13304): State Water Resources Control Board Resolution No. 92-49 “Policies and Procedures for Investigation and Cleanup and Abatement of Discharges Under Water Code Section 13304.” Resolution applies if site has been issued a Cleanup and Abatement Order per Water Code Section 13304. [c] Water Code Section 13304 – Cleanup and Abatement. Ch. 5 Enforcement & Implementation, Art. 1. Administrative Enforcement and Remedies.
CAMPT TIER
Tier 1 (GIS Based Data)
Tier 2 (Site Visit w/ some GIS data, limited sampling) Tier 3 (Site Investigation)
Remediation Process
STATE WATER RESOURCES CONTROL BOARD PROCESS
CERCLA PROCESS (Federal)
STATE PROCESS
Remarks Federal CERCLA/STATE PROCESS
Discovery
Discovery Discovery Same process No sampling
Preliminary site assessment b Site Screening
Site Screening Same process Limited sampling
Soil and water investigation b,c,g,d
PA/SI 1 PSP 1
PEA 1
Characterization & Assessment
Proposal and selection of cleanup and abatement action b,e,f
RI/FS EE/CA 2
RI/FS Characterization & Assessment Remedy Evaluation
Implementation of action b,e ROD or RAM 3
RAP or RAW 4 Decision Document Site Remedy/Response Action Selection

California Abandoned Mines Prioritization Tool April 27, 2017 P a g e | 15 [d] Water Code Section 13267 – Investigations; Inspections. Regional Water Board authority to investigate the quality of any waters of the state. Ch. 4. Regional Water Quality Control, Article 4. Waste Discharge Requirements. [e] Water Code Section 13365 – Definitions; billing; cost recovery; requirements. Ch. 5 Enforcement and Implementation, Art.7 Hazardous Substance Removal and Remedial Action Charges. [f] Water Code Sections 13397-13398.9 – Legislative findings; Definitions; Remediating agency responsibilities; Remediation plan; Oversight agency responsibilities; Approval of remediation plans; Remediating agency liability; respectively. Ch. 5.7. Drainage From Abandoned Mines. [g] Title 27 – California Code of Regulations Ch. 7, Subch.1, Art.1. SWRCB – Mining Waste Management Regulations.
Acronyms CERCLA – Comprehensive Environmental Response, Compensation, and Liability Act of 1980 EE/CA - Engineering Evaluation/ Cost Analysis includes human risk assessment and ecological risk assessment for CERCLA removal actions PA/SI - Preliminary Assessment/Site Inspection, includes scoring criteria for NPL listing PEA - Preliminary Endangerment Assessment, includes screening level human risk assessment and ecological scoping assessment PSP - Priority Setting Procedures for Cleanup of State Funded Hazardous Substances Release Sites, includes scoring criteria. RAM – Removal Action Memorandum RAP - Remedial Action Plan RAW - Removal Action Workplan RI/FS - Remedial Investigation/Feasibility Study, includes human risk assessment and ecological risk assessment for CERCLA remedial actions ROD - Record of Decision
Notes: [1] Response actions may be implemented following PA/SI, PSP, or PEA (e.g., interim actions such as: fence/post, diversions, containment, and excavation/off-site disposal activities). [2] EE/CAs are performed for sites that are being addressed under CERCLA’s removal authorities and a RI/FS is performed at a site that is being addressed under CERCLA remedial authorities. [3] An RAM is prepared for CERCLA removal action sites and a ROD is prepared for CERCLA remedial action sites. [4] A RAP and RAW are based on the scope/cost of project. A RAW is a combined feasibility/decision document. A RAP is a decision document.
2.3 Model Development
The implementation of the model requires several important steps, three of which have been accomplished with the current project (2.3.1, 2.3.3, and 2.3.5) and contained in Appendices 4 - 6):
Choose a modeling approach and software that fits the needs of CAMPT (2.3.1). Develop an algorithm for the modeling software (2.3.2). Design the relationships among model components, including evaluation rules for each
attribute (2.3.3). Anticipate the types of deliverables that will aid decision-support by the final
implementation of the model (2.3.4). Describe how implementation of the model could be carried out (2.3.5).
2.3.1 Prioritization Model Types & Characteristics
There are several possible classes of models that could be used to help prioritize mine sites for more investigation or remediation. Probabilistic models return information about the likelihood of different kinds of events occurring (e.g., slope failure) and combinations of probabilities about risks and hazards. Physical models are designed to predict actual conditions and usually require a lot of data for model “training” and model validation. Rank/prioritization models usually are used to compare projects/objects with each other, based on user-defined criteria and are most useful when data varies in availability across topic areas and among the places/objects of concern.

California Abandoned Mines Prioritization Tool April 27, 2017 P a g e | 16 The recommended model type for CAMPT is the latter type, rank/prioritization model, because it results in outputs that address the problem of prioritizing mine sites for further action. This type of model also tends to be more forgiving of unevenness in data availability, which is typical for abandoned mine sites in California. The primary modeling program employed is the Ecosystem Management Decision Support (EMDS; Reynolds, 2001), which after more than 15 years is on its 5th update and works with ArcGIS 10.4. Other systems have been developed that mimic EMDS (e.g., Environmental Evaluation Modeling System, Conservation Biology Institute), but lack the breadth of use that EMDS has enjoyed, including in CA (e.g., Bleier et al., 2003; Girvetz and Shilling, 2003; Dai et al., 2004).
The same model approach is used by many organizations for making rank-based decisions. The Nature Conservancy uses a similar model for land acquisition decisions, the U.S. Army Corps of Engineers for managing dredging and spoils, and restoration, on the Mississippi River, and the U.S. Forest Service’s Tahoe National Forest in California for road rehabilitation and retirement decisions.
Developing an EMDS-based abandoned mines prioritization tool will require three main characteristics to be successful:
User/expert engagement in developing the attributes and evaluation rules that drive the model,
Spatial or tabular data corresponding to the attributes selected, Clear association between the spatial outputs and policy and management needs of user
entities.
Running the model will also require development of several precursor analyses that use spatial data and result in secondary datasets. For example, one way of estimating physical risk to the public from mine features is calculating in GIS the linear or route distance between points of access (e.g., trailheads) and the features. This distance calculation would be the raw material used in the model. Key features of EMDS are its ability to handle disparate types of information in the same modeling environment and its ability to take advantage of intermediate attribute values, where an attribute is not directly measured (i.e., a quantity or concentration), but is represented by conditions, such as site conditions that promote transport of contamination off-site. The algorithm for the CAMPT model was developed with these characteristics in mind and is described below.
2.3.2 Basis for Prioritization Model Algorithm
A decision about prioritizing remediation of any physical safety or contamination hazards at a mine depends on a variety of factors for which data is available or can be collected. Because it is difficult to conduct this operation mentally and because one may want to tackle the decision-making with varying weights attached to the various data, a decision-support system, like CAMPT, is an essential component in effective planning assessment. Such a system captures and makes explicit the rule sets or preferences the decision-maker is actually using.
The algorithm basis for a prioritization model was developed using past guidance from CAMLAG and feedback from member agencies. Individual attributes describing mine sites and impacts were grouped according to regulatory and other concerns (e.g., water quality; physical safety). Evaluation strategies and data sources were developed and described for each attribute.
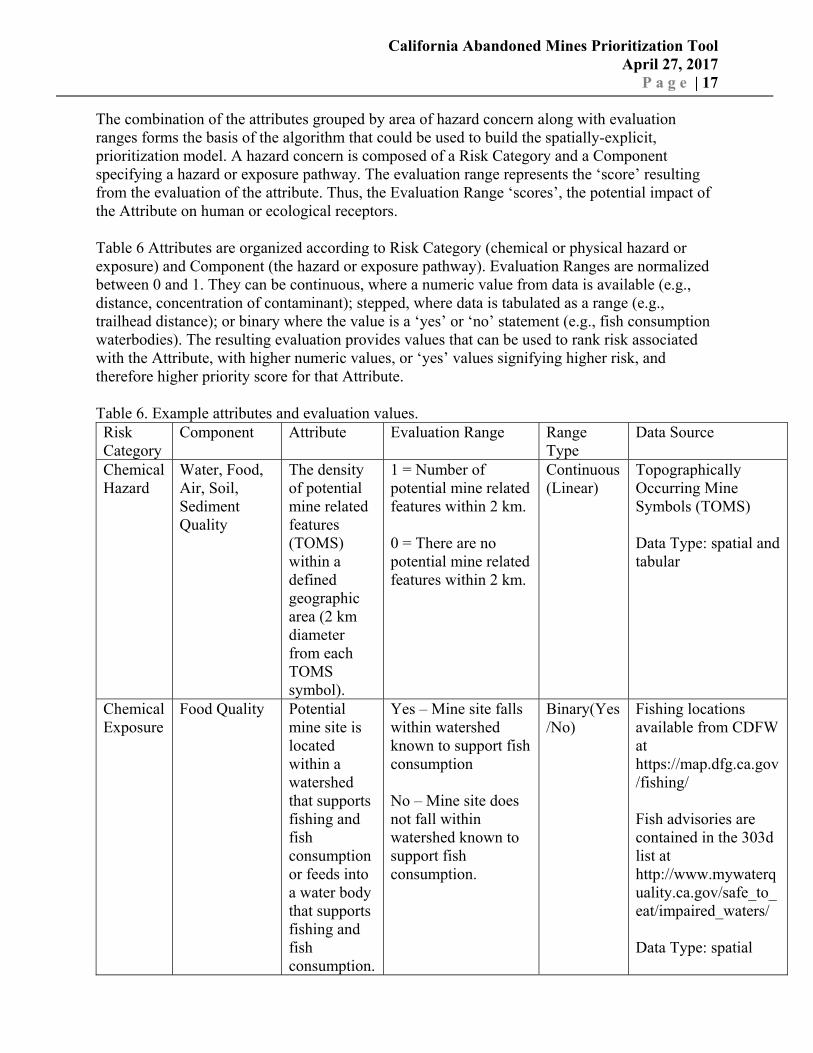
California Abandoned Mines Prioritization Tool April 27, 2017 P a g e | 17 The combination of the attributes grouped by area of hazard concern along with evaluation ranges forms the basis of the algorithm that could be used to build the spatially-explicit, prioritization model. A hazard concern is composed of a Risk Category and a Component specifying a hazard or exposure pathway. The evaluation range represents the ‘score’ resulting from the evaluation of the attribute. Thus, the Evaluation Range ‘scores’, the potential impact of the Attribute on human or ecological receptors.
Table 6 Attributes are organized according to Risk Category (chemical or physical hazard or exposure) and Component (the hazard or exposure pathway). Evaluation Ranges are normalized between 0 and 1. They can be continuous, where a numeric value from data is available (e.g., distance, concentration of contaminant); stepped, where data is tabulated as a range (e.g., trailhead distance); or binary where the value is a ‘yes’ or ‘no’ statement (e.g., fish consumption waterbodies). The resulting evaluation provides values that can be used to rank risk associated with the Attribute, with higher numeric values, or ‘yes’ values signifying higher risk, and therefore higher priority score for that Attribute.
Table 6. Example attributes and evaluation values. Risk Category
Component Attribute Evaluation Range Range Type
Data Source
Chemical Hazard
Water, Food, Air, Soil, Sediment Quality
The density of potential mine related features (TOMS) within a defined geographic area (2 km diameter from each TOMS symbol).
1 = Number of potential mine related features within 2 km. 0 = There are no potential mine related features within 2 km.
Continuous (Linear)
Topographically Occurring Mine Symbols (TOMS) Data Type: spatial and tabular
Chemical Exposure
Food Quality Potential mine site is located within a watershed that supports fishing and fish consumption or feeds into a water body that supports fishing and fish consumption.
Yes – Mine site falls within watershed known to support fish consumption No – Mine site does not fall within watershed known to support fish consumption.
Binary(Yes/No)
Fishing locations available from CDFW at https://map.dfg.ca.gov/fishing/ Fish advisories are contained in the 303d list at http://www.mywaterquality.ca.gov/safe_to_eat/impaired_waters/ Data Type: spatial
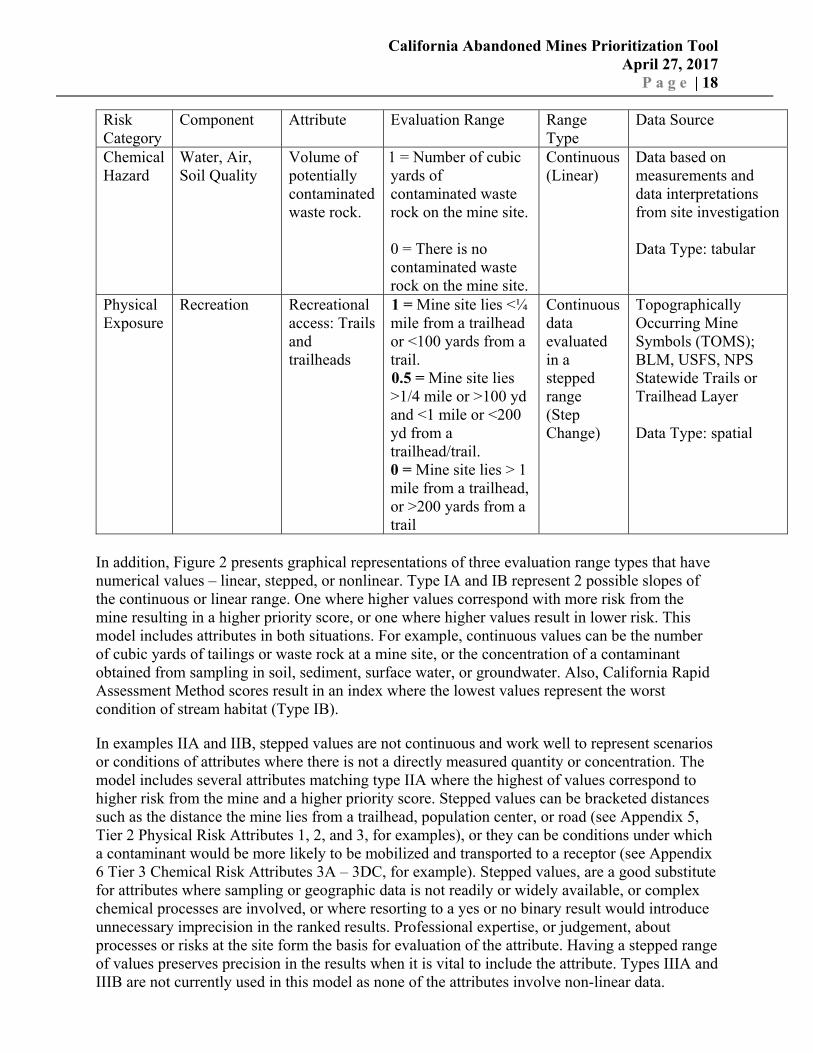
California Abandoned Mines Prioritization Tool April 27, 2017 P a g e | 18 Risk Category
Component Attribute Evaluation Range Range Type
Data Source
Chemical Hazard
Water, Air, Soil Quality
Volume of potentially contaminated waste rock.
1 = Number of cubic yards of contaminated waste rock on the mine site. 0 = There is no contaminated waste rock on the mine site.
Continuous (Linear)
Data based on measurements and data interpretations from site investigation Data Type: tabular
Physical Exposure
Recreation Recreational access: Trails and trailheads
1 = Mine site lies <¼ mile from a trailhead or <100 yards from a trail. 0.5 = Mine site lies >1/4 mile or >100 yd and <1 mile or <200 yd from a trailhead/trail. 0 = Mine site lies > 1 mile from a trailhead, or >200 yards from a trail
Continuous data evaluated in a stepped range (Step Change)
Topographically Occurring Mine Symbols (TOMS); BLM, USFS, NPS Statewide Trails or Trailhead Layer Data Type: spatial
In addition, Figure 2 presents graphical representations of three evaluation range types that have numerical values – linear, stepped, or nonlinear. Type IA and IB represent 2 possible slopes of the continuous or linear range. One where higher values correspond with more risk from the mine resulting in a higher priority score, or one where higher values result in lower risk. This model includes attributes in both situations. For example, continuous values can be the number of cubic yards of tailings or waste rock at a mine site, or the concentration of a contaminant obtained from sampling in soil, sediment, surface water, or groundwater. Also, California Rapid Assessment Method scores result in an index where the lowest values represent the worst condition of stream habitat (Type IB).
In examples IIA and IIB, stepped values are not continuous and work well to represent scenarios or conditions of attributes where there is not a directly measured quantity or concentration. The model includes several attributes matching type IIA where the highest of values correspond to higher risk from the mine and a higher priority score. Stepped values can be bracketed distances such as the distance the mine lies from a trailhead, population center, or road (see Appendix 5, Tier 2 Physical Risk Attributes 1, 2, and 3, for examples), or they can be conditions under which a contaminant would be more likely to be mobilized and transported to a receptor (see Appendix 6 Tier 3 Chemical Risk Attributes 3A – 3DC, for example). Stepped values, are a good substitute for attributes where sampling or geographic data is not readily or widely available, or complex chemical processes are involved, or where resorting to a yes or no binary result would introduce unnecessary imprecision in the ranked results. Professional expertise, or judgement, about processes or risks at the site form the basis for evaluation of the attribute. Having a stepped range of values preserves precision in the results when it is vital to include the attribute. Types IIIA and IIIB are not currently used in this model as none of the attributes involve non-linear data.

California Abandoned Mines Prioritization Tool April 27, 2017 Page | 19
Figure 2. Evaluation range types.
Linear change - Priority with Value Non-linear change - Priority with Value Step change - Priority with Value
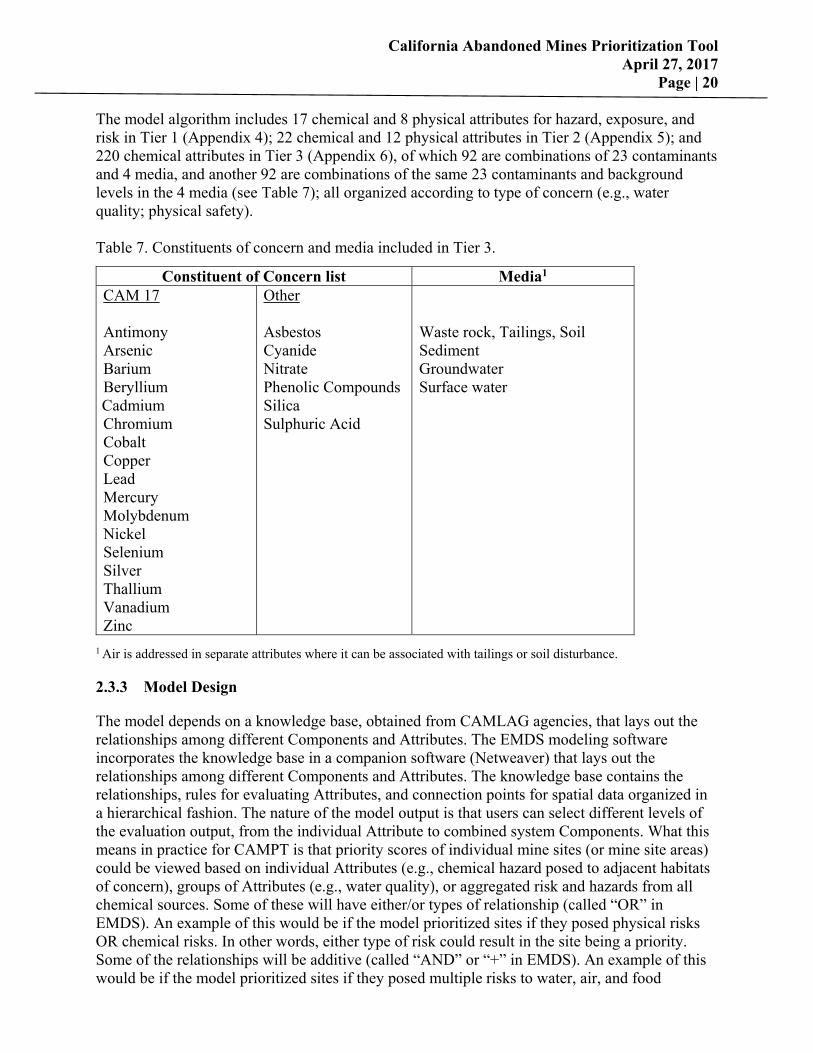
California Abandoned Mines Prioritization Tool April 27, 2017 Page | 20 The model algorithm includes 17 chemical and 8 physical attributes for hazard, exposure, and risk in Tier 1 (Appendix 4); 22 chemical and 12 physical attributes in Tier 2 (Appendix 5); and 220 chemical attributes in Tier 3 (Appendix 6), of which 92 are combinations of 23 contaminants and 4 media, and another 92 are combinations of the same 23 contaminants and background levels in the 4 media (see Table 7); all organized according to type of concern (e.g., water quality; physical safety). Table 7. Constituents of concern and media included in Tier 3.
1 Air is addressed in separate attributes where it can be associated with tailings or soil disturbance.
2.3.3 Model Design
The model depends on a knowledge base, obtained from CAMLAG agencies, that lays out the relationships among different Components and Attributes. The EMDS modeling software incorporates the knowledge base in a companion software (Netweaver) that lays out the relationships among different Components and Attributes. The knowledge base contains the relationships, rules for evaluating Attributes, and connection points for spatial data organized in a hierarchical fashion. The nature of the model output is that users can select different levels of the evaluation output, from the individual Attribute to combined system Components. What this means in practice for CAMPT is that priority scores of individual mine sites (or mine site areas) could be viewed based on individual Attributes (e.g., chemical hazard posed to adjacent habitats of concern), groups of Attributes (e.g., water quality), or aggregated risk and hazards from all chemical sources. Some of these will have either/or types of relationship (called “OR” in EMDS). An example of this would be if the model prioritized sites if they posed physical risks OR chemical risks. In other words, either type of risk could result in the site being a priority. Some of the relationships will be additive (called “AND” or “+” in EMDS). An example of this would be if the model prioritized sites if they posed multiple risks to water, air, and food
Constituent of Concern list Media1 CAM 17 Antimony Arsenic Barium Beryllium Cadmium Chromium Cobalt Copper Lead Mercury Molybdenum Nickel Selenium Silver Thallium Vanadium Zinc
Other Asbestos Cyanide Nitrate Phenolic Compounds Silica Sulphuric Acid
Waste rock, Tailings, Soil Sediment Groundwater Surface water
California Abandoned Mines Prioritization Tool April 27, 2017 Page | 21 characteristics. Thus, a site that posed multiple types of risk would get a higher priority than a site with only one type of risk.
The knowledge base also explicitly lays out how attributes would be evaluated (introduced above). For each Attribute, the model would use the specified Evaluation Ranges and input data to determine how much each mine site contributed to a Risk Category, Component and Attribute and therefore how much of a priority it was. In most cases, this would be partial risk, resulting in an intermediate priority score. The desired result of these evaluation steps is that mine sites would fall across a somewhat normal distribution curve, with some sites given high priority for further investigation or remediation, most given intermediate values, and other sites receiving low priority for further investigation or remediation.
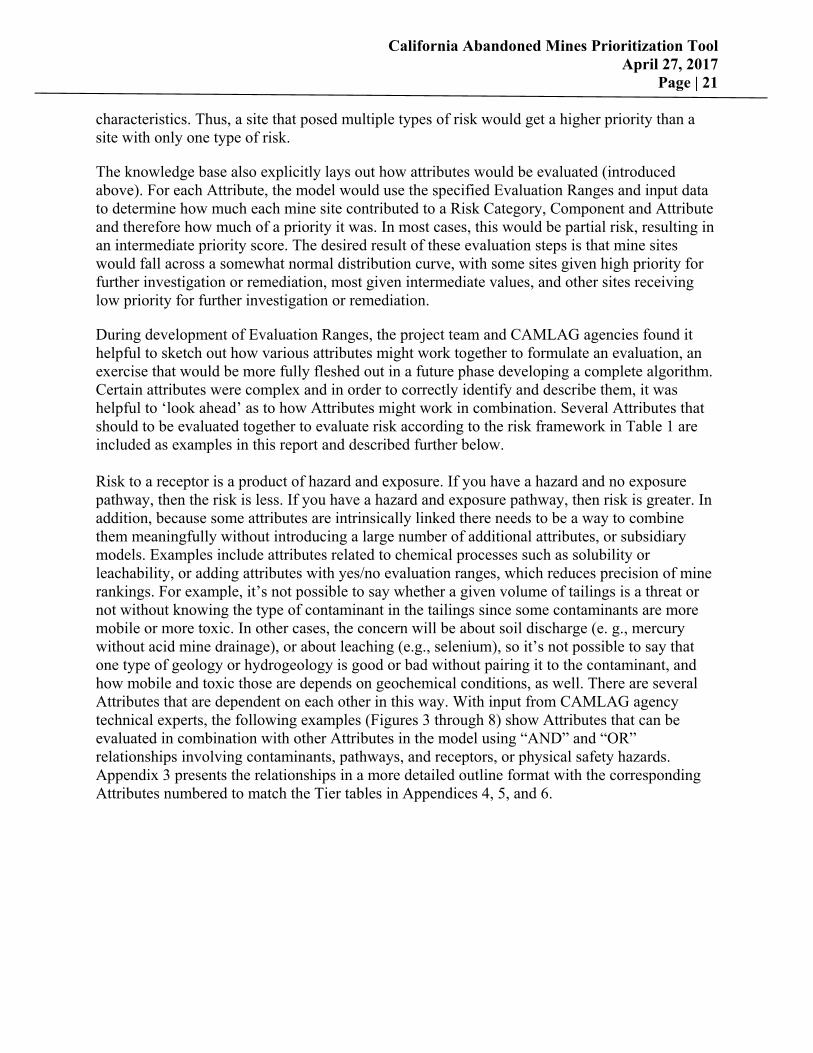
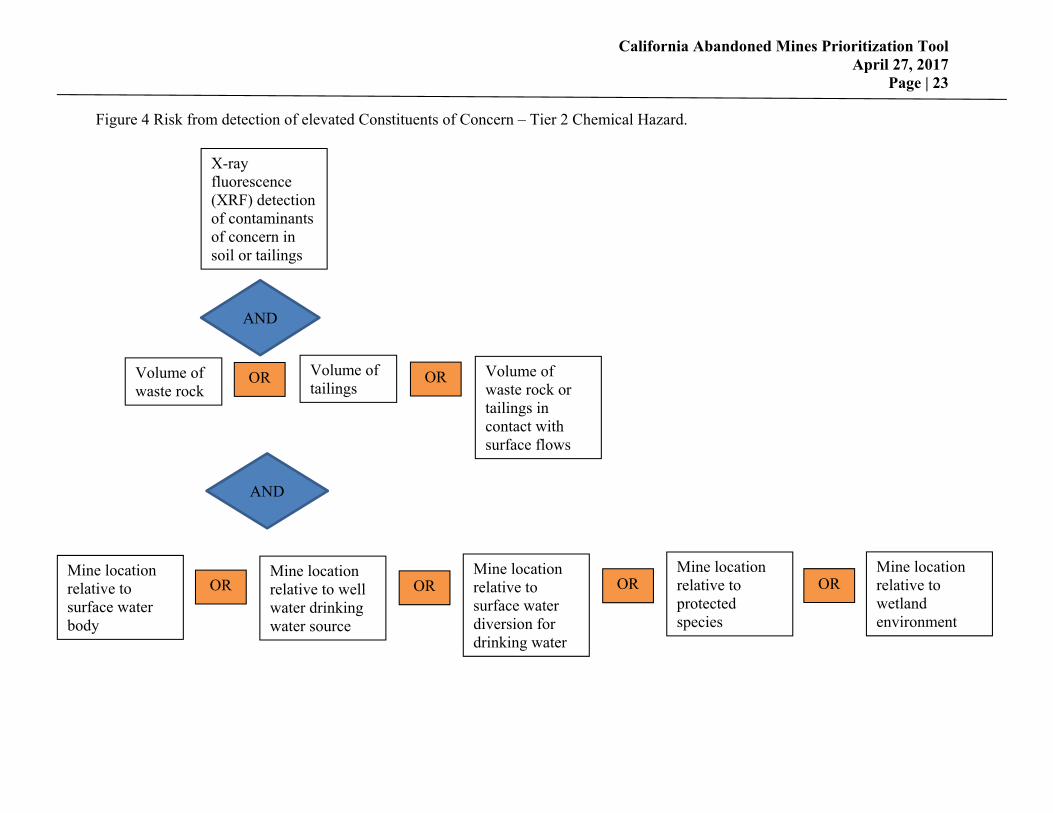
During development of Evaluation Ranges, the project team and CAMLAG agencies found it helpful to sketch out how various attributes might work together to formulate an evaluation, an exercise that would be more fully fleshed out in a future phase developing a complete algorithm. Certain attributes were complex and in order to correctly identify and describe them, it was helpful to ‘look ahead’ as to how Attributes might work in combination. Several Attributes that should to be evaluated together to evaluate risk according to the risk framework in Table 1 are included as examples in this report and described further below. Risk to a receptor is a product of hazard and exposure. If you have a hazard and no exposure pathway, then the risk is less. If you have a hazard and exposure pathway, then risk is greater. In addition, because some attributes are intrinsically linked there needs to be a way to combine them meaningfully without introducing a large number of additional attributes, or subsidiary models. Examples include attributes related to chemical processes such as solubility or leachability, or adding attributes with yes/no evaluation ranges, which reduces precision of mine rankings. For example, it’s not possible to say whether a given volume of tailings is a threat or not without knowing the type of contaminant in the tailings since some contaminants are more mobile or more toxic. In other cases, the concern will be about soil discharge (e. g., mercury without acid mine drainage), or about leaching (e.g., selenium), so it’s not possible to say that one type of geology or hydrogeology is good or bad without pairing it to the contaminant, and how mobile and toxic those are depends on geochemical conditions, as well. There are several Attributes that are dependent on each other in this way. With input from CAMLAG agency technical experts, the following examples (Figures 3 through 8) show Attributes that can be evaluated in combination with other Attributes in the model using “AND” and “OR” relationships involving contaminants, pathways, and receptors, or physical safety hazards. Appendix 3 presents the relationships in a more detailed outline format with the corresponding Attributes numbered to match the Tier tables in Appendices 4, 5, and 6.
California Abandoned Mines Prioritization Tool April 27, 2017 Page | 22 Figure 3. Imminent risk to human or ecological health – Tier 2 Physical Hazard.
Condition of shafts or adits
Density of mine features
Road Access
AND
AND
Campground access
OR Trail Access
OR
Condition of pools of standing water
Presence of hazardous materials
OR OR
AND
Land Ownership
California Abandoned Mines Prioritization Tool April 27, 2017 Page | 23
Figure 4 Risk from detection of elevated Constituents of Concern – Tier 2 Chemical Hazard.
X-ray fluorescence (XRF) detection of contaminants of concern in soil or tailings
Mine location relative to surface water diversion for drinking water
Mine location relative to well water drinking water source
Mine location relative to surface water body
Volume of waste rock
OR OR
AND
AND
Volume of waste rock or tailings in contact with surface flows
OR
Mine location relative to protected species
OR
Volume of tailings
OR
Mine location relative to wetland environment
OR

California Abandoned Mines Prioritization Tool April 27, 2017 Page | 24
Figure 5. Imminent risk to humans or ecological health – Tier 3.
Contaminant concentration above threshold
Ecological exposure pathway is contaminated and direct intake/contact is occurring
Human Exposure pathway is contaminated or direct intake/contact occurring
Contamination impacts Beneficial Uses of waters of the state for human or aquatic health
Contamination impacts groundwater or downstream surface water diversion for drinking water
Water chemistry does not meet standard
OR
OR OR OR
AND
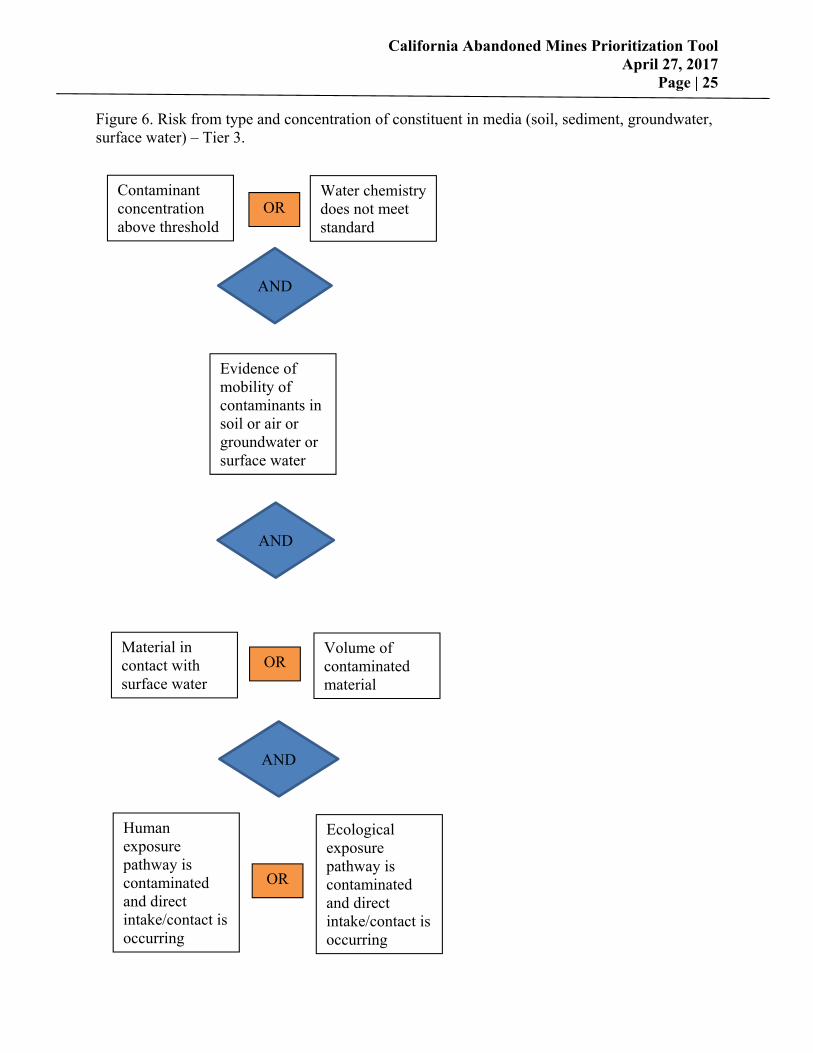
California Abandoned Mines Prioritization Tool April 27, 2017 Page | 25 Figure 6. Risk from type and concentration of constituent in media (soil, sediment, groundwater, surface water) – Tier 3.
Contaminant
concentration above threshold
Ecological exposure pathway is contaminated and direct intake/contact is occurring
Volume of contaminated material
Material in contact with surface water
Evidence of mobility of contaminants in soil or air or groundwater or surface water
Water chemistry does not meet standard
OR
OR
OR
AND
AND
Human exposure pathway is contaminated and direct intake/contact is occurring
AND
California Abandoned Mines Prioritization Tool April 27, 2017 Page | 26
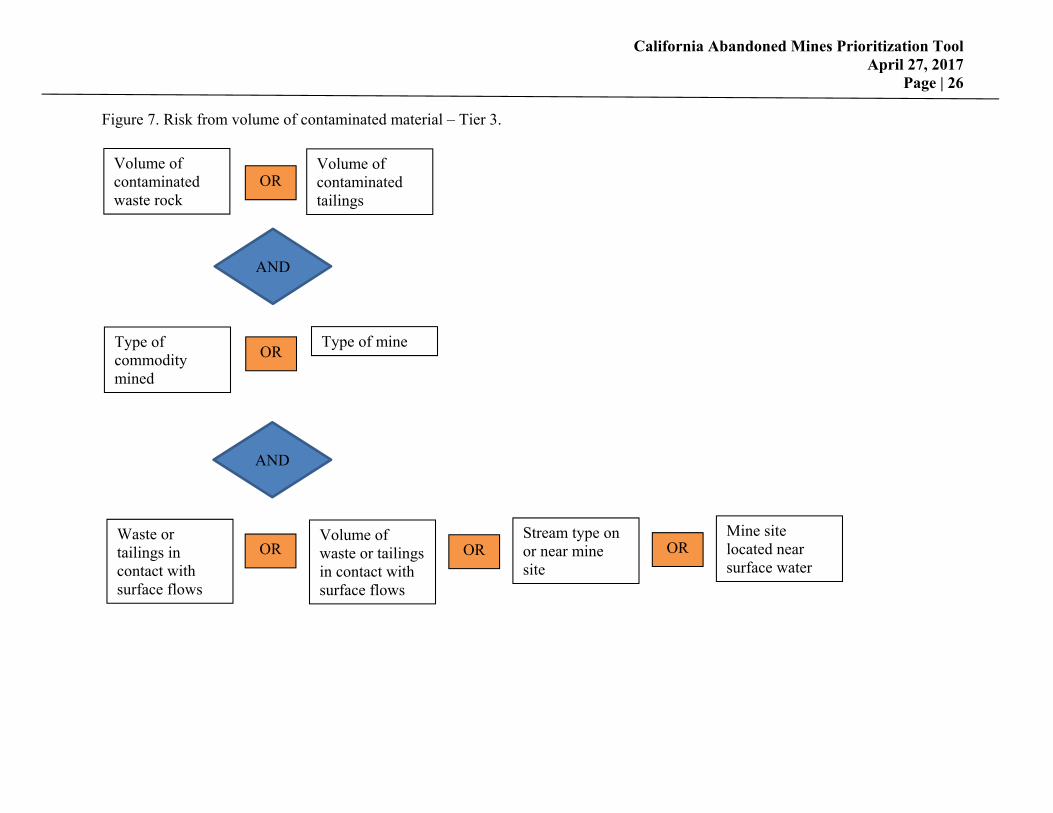
Figure 7. Risk from volume of contaminated material – Tier 3.
Volume of contaminated waste rock
Stream type on or near mine site
Volume of waste or tailings in contact with surface flows
Waste or tailings in contact with surface flows
Type of commodity mined
Volume of contaminated tailings
OR
OR OR
AND
AND
Type of mine OR
Mine site located near surface water
OR
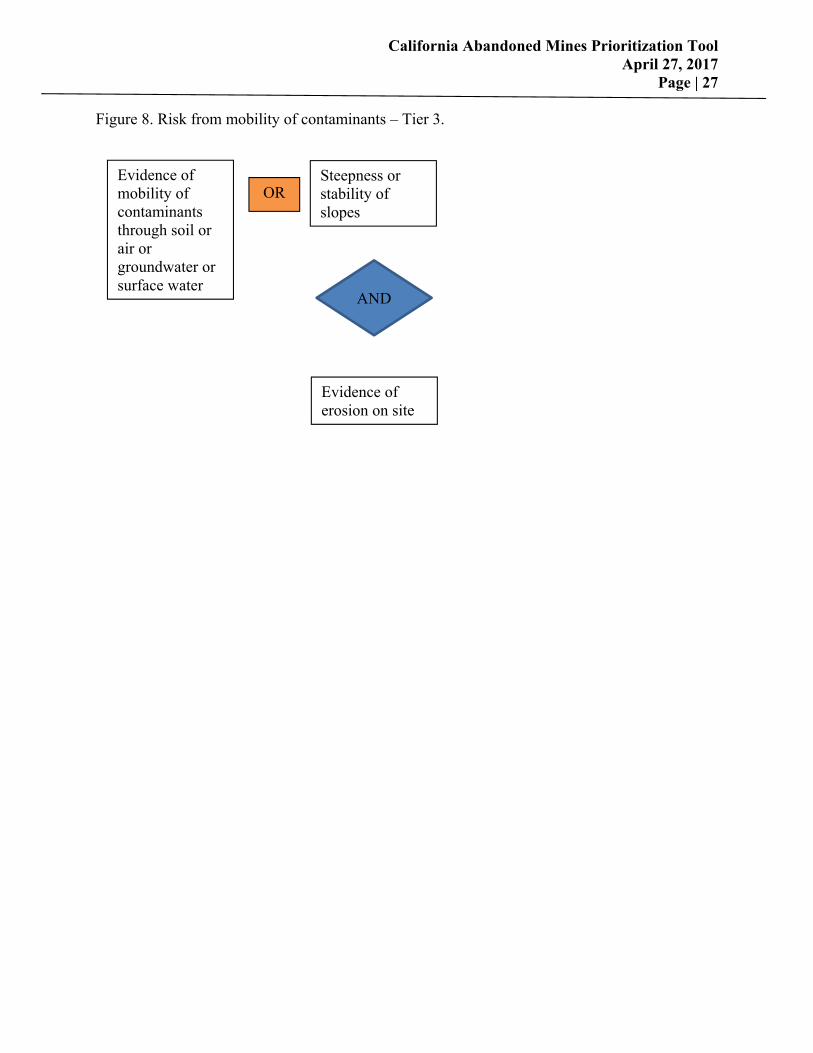
California Abandoned Mines Prioritization Tool April 27, 2017 Page | 27 Figure 8. Risk from mobility of contaminants – Tier 3.
Evidence of mobility of contaminants through soil or air or groundwater or surface water
Evidence of erosion on site
Steepness or stability of slopes
OR
AND
California Abandoned Mines Prioritization Tool April 27, 2017 Page | 28 In addition, some attributes recommended for identifying chemical hazards were complex to define and introduced the potential for including submodels within the model, such as for the processes for solubility, leachability, mobility, and mercury methylation. Each of these was handled in the model as follows.
Solubility
Solubility, in the context of CAMPT, is about how easily source material (e.g., rock, waste rock, tailings) is dissolved, resulting in making contaminants available, particularly metals, to leaching or transport processes. Solubility depends on several factors (such as pH of water and type of metal) that are not all included in the CAMPT model. There are multiple types of tests for solubility (e.g., Toxic Characteristic Leaching Procedure, Citric Acid Waste Extraction Test (WET), deionized water WET test). Test values can be compared to drinking water and ecological standards. The higher the test value, the more soluble the material. This would require attributes in the model for each test in order to capture continuous test values (more precision) and compare to applicable standards.
Resorting to a single yes/no evaluation for whether the test value indicates high solubility or not introduces an attribute with much less precision. Recall that using continuous values (i.e. evaluation types IA or IB in Figure 2), versus a yes/no response, provides more precision for the model rank results. Since solubility is a model on its own, and incorporating a subsidiary model into CAMPT would make CAMPT more complex than necessary, the decision was made to not include solubility directly in the model. Rather, solubility will be evaluated through other attributes related to mobility of detected contaminants in media (soil, air, groundwater, surface water) and contaminant detection in sediment pathways that can impact receptors. The rationale is that if source material is soluble, and metals have leached and been detected in pathway media, the final question is, are those leached contaminants being transported to receptors. This will ultimately maintain a higher degree of precision for CAMPT rank results.
Leachability
Leaching is the process by which inorganic - organic contaminants or radionuclides are released from the solid phase into the water phase under the influence of mineral dissolution, desorption, complexation processes as affected by pH, redox, dissolved organic matter and (micro) biological activity. The process itself is universal, as any material exposed to contact with water will leach components from its surface or its interior depending on the porosity of the material considered (source: Surface and Aqueous Geochemistry Group, Stanford, USA. http://www.leaching.net/leaching/the-leaching-process). Leaching depends on several factors (parent material, presence of water, type of mineral) that are not all included in the CAMPT model. There are different leaching tests, usually conducted in a laboratory setting, (e.g., pH, column, tank, granular) and thresholds for the amount of metals leached by the test. This would require attributes in the model for each test in order to capture continuous test values (more precision) and compare to applicable test standards.
Resorting to a single yes/no evaluation for whether the test value indicates high leachability or not introduces an attribute with much less precision. Recall that using continuous values, versus a yes/no response, provides more precision for the model rank results. Since leachability can be a model on its own, and incorporating a subsidiary model into CAMPT would make CAMPT more complex than necessary, the decision was made to not include solubility directly in the model.
California Abandoned Mines Prioritization Tool April 27, 2017 Page | 29 Rather, leachability is represented by two Attributes in the model at two points in the work flow, Tier 2 and Tier 3. One (see Appendix 5, Tier 2 Chemical Risk - Attribute 4) is evaluated using a Type IIA Step range about seven different evidence of leaching for which data can be collected via observation in a screening level site visit. The other (see Appendix 6, Tier 3 Chemical Risk - Attribute 13) is evaluated with a yes/no response about the degree to which constituents are leachable from source material. This evaluation is based on professional interpretation of a larger scope of sample and test results about whether constituents are highly leachable from the material or not and could become available for transport off site.
Mobility
Mobility, in the context of CAMPT, is the ability of contaminants to be transported off the mine site or off the mine feature toward receptors. Mobility depends on several factors such as slope of waste rock or tailings piles, water erosion, wind erosion, pH of water, or permeability through surfaces to groundwater. Many of these attributes are included in the CAMPT model, and data is obtained in the field or through existing geo datasets already available for use. Because media (soil, sediment, surface water, groundwater, and fish) are analyzed for contaminants conclusions can directly be drawn about the source and transportation of contaminants and potential impacts on receptors, without having to model chemical processes, mineral deposits (although this data is under development by USGS, and should be included in CAMPT later), or geology within the model.
Mobility is represented by four attributes in the model specific to the potential for contaminants to move or migrate toward a receptor through soil, air, groundwater, or surface water. The attributes are evaluated with a three step range (i.e., evaluation type IIA in the Figure 2), based on site investigation results and interpretation, which maintains more model precision than a yes/no response.
Mercury methylation
Mercury is a constituent of concern included in CAMPT. Mercury must become methylated in order to be absorbed into the food chain, where it can impact fish and wildlife and human receptors. Methylation of mercury can occur in streams, lakes, reservoirs, and wetlands downstream of mines where mercury was mined and produced as well as locations where mercury was used to process mined ores and released into the environment. Mercury methylation involves a complex set of factors that are being modeled elsewhere, and which would be unwieldy to include in CAMPT. DOC staff recommends including a summary attribute to reflect whether mercury from the mine is being transported to a methylating environment in a yes/no format. This information may or may not be known for the mine or downstream surface waters, and may not be able to be directly related back upstream. Therefore, mobility factors and presence of methylating environments downstream may be two attributes of interest. More information is needed about the extent of data available about downstream methylating environments that could be used in CAMPT. Data about the presence of mercury in fish consumed by wildlife and humans, the detection or concentration of mercury found in soil, sediment or water, and mobility factors are included in CAMPT and can be used together to evaluate potential impact to receptors from mercury contamination.
California Abandoned Mines Prioritization Tool April 27, 2017 Page | 30 2.3.4 Model Output
The fully-implemented model would provide several information types useful in prioritizing mines for further investigation and/or remediation. Agencies often have concerns unique to specific types of risks or hazards found at or originating from mine sites. The model would provide disaggregated information about specific types of risks allowing agencies to hone in on concerns important to them (e.g., water quality impacts; physical safety). Two main types of problems that mine sites can pose to the public are physical risk and chemical risk. The model will provide prioritization based on either type of risk. Finally, cumulative risk across all attributes and concerns is useful when prioritizing mine sites at the state-level and can also result from the model.
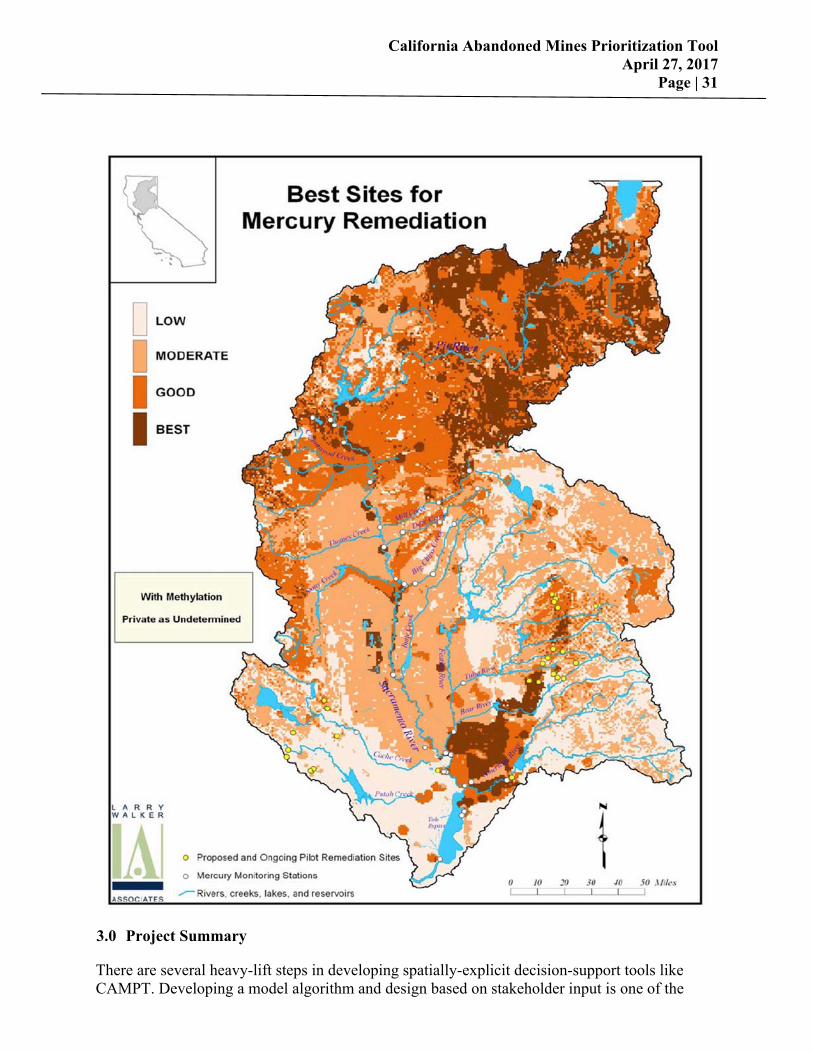
The model is intended to be spatially-explicit, meaning that it is informed by spatial/map data and can produce prioritization results in map form. Figure 8 provides an example of a map output from a similar rule-based prioritization model created for the report Reduction of mercury in the Sacramento River watershed and San Francisco Bay-Delta (Shilling et al., 2002). This means that prioritization can take into account downstream and other externalized forms of impact through waterway connections. It also means that watersheds with multiple mine sites can be prioritized either because of greater cumulative impacts, or because it would be more efficient to work on mine sites near each other, or both. Priorities can also be summarized and shared at a variety of boundary scales (e.g., Forest District, or county), which can help with planning for additional work and funding needs.
Because the model is based upon physical and chemical attributes of mine sites, prioritization scores represent real risks and hazards that mines may pose. This means that priority scores are more than just a way to rank mine sites, they may also be used to judge imminent risks, or be used to drill down and discover what exact risk a mine site poses. The latter is particularly useful in testing the model’s finding against other methods for prioritization, as well as for testing model sensitivity to specific types of risks.
Another way that model findings can be used is to pose scenarios for remediation of specific mine sites and discover what types of effects this would have on a mine’s priority score or rank. For example, if a mine site is primarily a risk to the public because of a number of openings that pose a physical risk, then closing these opening may result in the mine being “taken off the list”. If the cost of specific remediation actions are known or estimable, then mine-specific, jurisdiction-specific, or total costs could be estimated to bring mines into compliance with the regulatory standards. Even at an order of magnitude level, this is critical planning and policy information.Figure 9. Example of model output showing range of scores for the best sites for remediation in the Sacramento River watershed, including consideration of the risk of methylation and private property. (Shilling et al., 2002).
California Abandoned Mines Prioritization Tool April 27, 2017 Page | 31
3.0 Project Summary
There are several heavy-lift steps in developing spatially-explicit decision-support tools like CAMPT. Developing a model algorithm and design based on stakeholder input is one of the
California Abandoned Mines Prioritization Tool April 27, 2017 Page | 32 biggest tasks, and was accomplished with the present project phase. Future steps should include data acquisition and analysis, model testing/validation, and model rollout with critical decision-makers. Implementing the CAMPT in a computer-supported software and developing outputs should continue to use outside collaboration forums such as CAMLAG to ensure utility and applicability of the tool. Phase I of CAMPT provides a foundation for what a decision-making system could do for identifying and prioritizing risks from abandoned mines. Such tools require consistent collection and input of data over time to make a dynamic model that can be used into the future to guide decision-making.
3.1 Next Steps for Model Implementation
Phase I focused on identifying and defining the work flow, Attributes, and Evaluation Ranges. The tables containing the attributes for Tiers 1, 2, and 3 present the definitions and Evaluation Ranges for each unique Attribute, placed at the tier level where the appropriate data would be applied or collected. Some Attributes will be used more than once in the model, and sometimes across Tiers depending on what is needed to appropriately evaluate an individual attribute. An example is provided in Appendix 3 under Risk from Mobility of Contaminants where a Tier 3 Attribute is evaluated using some Attributes from Tier 2. Likewise, population center can be evaluated in Tier 1 or Tier 2 with various attributes such as a population density, community, or campground or trailhead locations defined in Tier 2 since these are all geodatasets that already exist without having to collect new field data.
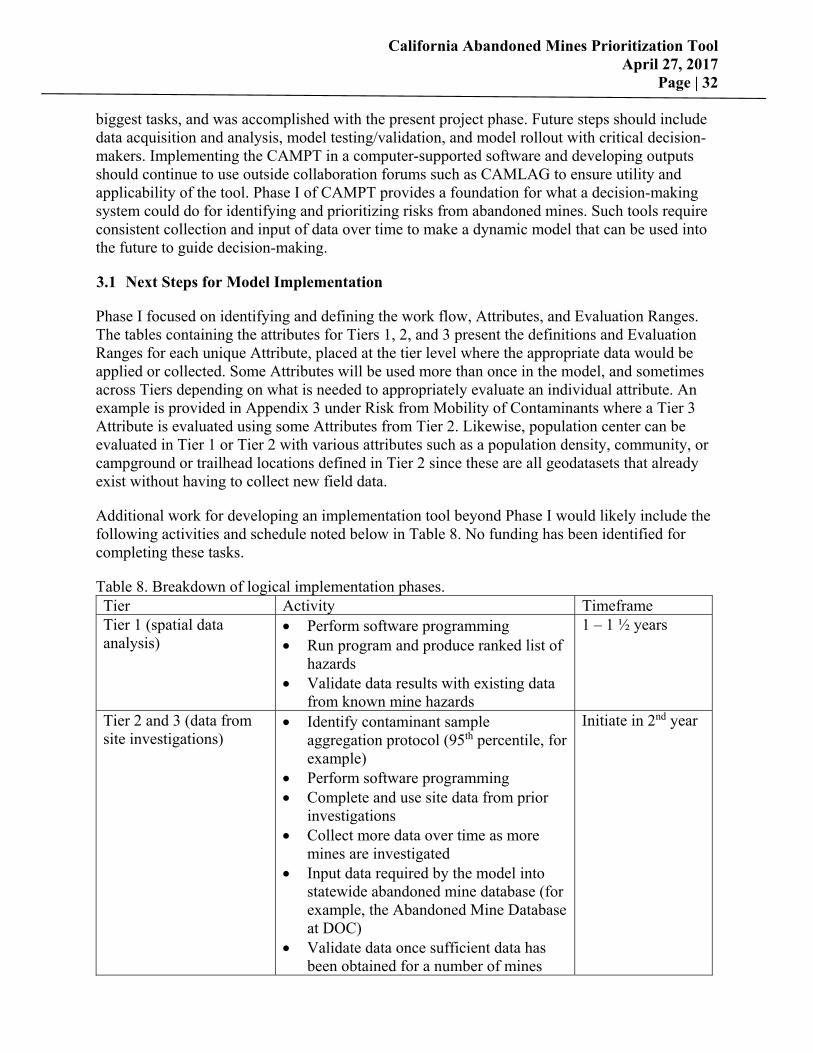
Additional work for developing an implementation tool beyond Phase I would likely include the following activities and schedule noted below in Table 8. No funding has been identified for completing these tasks.
Table 8. Breakdown of logical implementation phases. Tier Activity Timeframe Tier 1 (spatial data analysis)
Perform software programming Run program and produce ranked list of
hazards Validate data results with existing data
from known mine hazards
1 – 1 ½ years
Tier 2 and 3 (data from site investigations)
Identify contaminant sample aggregation protocol (95th percentile, for example)
Perform software programming Complete and use site data from prior
investigations Collect more data over time as more
mines are investigated Input data required by the model into
statewide abandoned mine database (for example, the Abandoned Mine Database at DOC)
Validate data once sufficient data has been obtained for a number of mines
Initiate in 2nd year
California Abandoned Mines Prioritization Tool April 27, 2017 Page | 33 Preliminary technological and cost considerations include:
Location where data and analytical tool would be hosted and maintained; Building and contributing a robust long-term dataset; Refining cost estimates and obtaining funding.
From a technology perspective the data that would be analyzed by a modeling tool can be hosted in one location/agency and the modeling tool itself can be hosted in another location/agency, contributing to flexibility in leveraging existing information storage or data analysis computing capabilities, responsibilities and costs. For example, DOC confirmed it will continue hosting the abandoned mine database within the Division of Mine Reclamation, including data for mines that is collected by other organizations, as well as the data for mines we inventory for federal and state agencies on a routine basis.
An important aspect of creating modeling tools is adding data in early years, and continuing to add data over the long-term while managing activity on abandoned mines. The more data that is collected from site investigations and added to an abandoned mine database, the more meaningful the rankings and decisions made based on rankings. CAMPT Tiers 2 and 3 are logically a later phase of tool implementation because they rely on actual data collected from investigations, which takes time to accumulate. Data from investigations that have already been performed are currently being added to the abandoned mine database at DOC as a step toward having a more robust state-wide dataset for any analyses. Such a dataset would be available to agencies working in California who need to track and identify abandoned mine infrastructure and remediation status in the state.
The model could be implemented either as desktop-based application or a web-based application. As a desktop application, the hosting organization would have to receive a request to analyze abandoned mine data using the model and then output that analysis (ranked list) to the Internet or some other service (like Drop Box) for the requesting organization to receive. As a web-based application, the model would be accessed via a web portal and be used online, where an agency could log in and access the model to analyze the data set on their own. The preference expressed by CAMLAG agencies is to use a web-based application.
California Abandoned Mines Prioritization Tool April 27, 2017 Page | 34 4.0 Glossary of Terms
The purpose of these definitions is to promote understanding among users of the California Abandoned Mines Prioritization Tool (CAMPT) of common terms and concepts. There may be other definitions and terms, but for the purpose of the CAMPT, these are the definitions used.
303d list – A state’s list of impaired and threatened waters (e.g. stream/river segments, lakes) as designated under the federal Clean Water Act Section 303(d). Acid Rock Drainage (ARD) – The acidic water that is created when sulphide minerals are exposed to air and water and, through a natural chemical reaction, produce sulphuric acid. Abandoned Mine Lands (AML) – Collections of mine sites and features on public or private lands that were previously used for mineral commodity production, but which have been abandoned, usually without current, liable owners. Attribute – Qualitative or quantitative attributes of a mine feature or site that can be used by itself or in combination with other criteria to help characterize a component. Basin Plan – A Water Quality Control Plan (Basin Plan) is a legal document that the State Water Resources Control Board and Regional Water Quality Control Boards use to designate beneficial uses and water quality objectives, methods used to attain those objectives, for waters of the state, including surface waters and groundwater. Category – A grouping of one or more components that are all related based on both chemical or physical hazard and exposure to humans, wildlife, or the environment. Chemical/Constituent/Pollutant – An element (e.g., copper, arsenic) or compound (e.g., iron sulphide, methyl mercury) that may leach or leak from mine lands/features into adjacent soils and waterbodies. Commodity – An economic mineral or mined material. Commodity group – Groups of minerals or mined materials that have similar properties (ie, metallic minerals, nonmetallic minerals, aggregate materials, etc.). Component – A grouping of one or more attributes that are used to characterize a category. Containment structures – Buildings, dams, tanks, vats, ponds or other structures designed and built to contain potential contamination on a mine site. Data input – The spatial, quantitative, and/or qualitative information used to evaluate the attribute. Ease of access – The relative difficulty of accessing a mine site. Environmental justice – The fair treatment and meaningful involvement of all people regardless of race, color, national origin, or income with respect to the development, implementation, and enforcement of environmental laws, regulations, and policies. EPA – U.S. Environmental Protection Agency. Evaluation Range – The quantitative positive and negative values to evaluate attributes for each mine feature or landscape component. Exposure – Contact with a potentially harmful place/feature or ingestion/inhalation of a potentially harmful substance. Fish advisory – Advisories that provide “safe eating guidelines” to help you choose the safest fish to eat and avoid fish species with high levels of chemicals in them. Hazard – Any mine feature or mine related sources of potential harm. IDLH (Immediately Dangerous to Life and Health) - Exposure to airborne contaminants that is "likely to cause death or immediate or delayed permanent adverse health effects or prevent escape from such an environment. Imminent and substantial endangerment – Mine lands, features, or products of mine leaching that pose immediate and serious risks and hazards to people and wildlife.

California Abandoned Mines Prioritization Tool April 27, 2017 Page | 35 Metal leaching – The process of loss of metals and their salts from mine wastes and features Mine Land Features – Physical features related to the production of mineral commodities. Shaft – A vertical or near vertical passage into a mine for the purpose accessing mineral commodities or ventilation. Adit – A horizontal or near horizontal passage into a mine for the purpose of accessing mineral commodities or drainage of water. Pit – A large excavation in the ground for the purpose of accessing mineral commodities. Subsidence – An opening at the ground surface created by the collapse of underground workings. Tailings – The non-economic residual material remaining after ore has been processed and the economic fraction has been removed. Waste Rock – Unprocessed mined material with little or no economic value. Mill/Kiln/Structures – The buildings and other structures used to move and process ore containing rock. Mobility – The ease at which a contaminant can travel from onsite to offsite environments. Mode of access – The type of transportation used to access a mine site. National Priorities List (NPL) – The list of national priorities among the known releases or threatened releases of hazardous substances, pollutants, or contaminants throughout the United States and its territories. The NPL is intended primarily to guide the EPA in determining which sites warrant further investigation. Physical/Injury – Properties of mine lands/features that could cause injury or death among members of the public that come in contact with, or enter the features. Potentially Responsible Party - Any individual or organization—including owners, operators, transporters or generators—potentially responsible for, or contributing to, a spill or other contamination under the Comprehensive Environmental Response, Compensation, and Liability Act (CERCLA), a 1980 law commonly known as Superfund. Preliminary Appraisal and Ranking System (PAR) - An empirically-derived system for assigning a numerical score to abandoned mines based on readily quantifiable measures of chemical and physical properties and associated exposure potentials. Prioritization – The act of deciding the order in which mine lands and features should be investigated and/or remediated. Remediation – The act of stopping or reducing environmental damage by cleaning up or reducing chemical and physical hazards on mine sites or lands impacted by mine sites. Risk – actual or potential probability of adverse effects on humans, wildlife or the environment by mines or mined areas. Screening Tier – A data-driven decision point encompassing the data required to make specific decisions.
Tier 1: Preliminary Inventory Selection – The purpose of this tier is to select potential areas or sites that may have an elevated risk of either physical or chemical impacts to humans, wildlife or the environment and for which no site-specific data is available. This selection Tier is a desktop GIS analysis only and no site-specific information is used in the analysis. Data used for this tier would be readily available in GIS format and GIS analysis would be applied to potential areas or sites to rank for performing future preliminary inventory using existing methodologies employed by DOC’s AMLP. Tier 1 results in a list of priority areas or sites to focus future preliminary inventory efforts.
Tier 2: Initial Site Investigation Selection–The purpose of this tier is to select sites with potential risk to humans, wildlife or the environment based on data collected during a
California Abandoned Mines Prioritization Tool April 27, 2017 Page | 36
preliminary inventory and where additional information is needed to determine the actual risk associated with the site. Data collected for this tier consists of qualitative and quantitative information, but not sampling, collected during the preliminary inventory process that can be used to determine if a site will need further investigation. Tier 2 results in a list of priority sites that needs an initial site investigation, such as a Preliminary Assessment/Site Investigation (PASI) or equivalent process.
Tier 3: Full Site Investigation Selection – The purpose of this tier is to select sites identified to have actual risk to humans, wildlife or the environment based on data collected during an initial site investigation and where additional data is needed to fill critical data gaps before a final decision on a remedial action is taken. Data collected through a PASI or equivalent process will help determine which sites need a more thorough full site characterization or which sites have enough information to determine remedial action. Tier 3 results in a prioritized list of sites that need a full site characterization before a remedial action can take place.
Sensitive environments – Environments that are easily impacted by people visiting or contamination from mined areas. Could include cultural environments, unique/ sole source habitats, wetlands, or presence of T&E species, for example. Stability – A mine feature that has the quality of being stable and therefore less likely to erode or otherwise lose material off-site. Threatened and Endangered (T&E) species – Any species that is likely or in danger of becoming extinct throughout a significant portion of its range. Total Maximum Daily Load (TMDL) – Allowable numeric thresholds for chemical constituents and physical properties (e.g., temperature) to reduce impairment and achieve water quality objectives. Toxicity - The degree to which a substance (a toxin or poison) can harm humans or animals.
California Abandoned Mines Prioritization Tool April 27, 2017 Page | 37 5.0 Literature Cited
Bleier, C., Downie, S., Cannata, S., Henly, R., Walker, R., Keithley, C., Scruggs, M.; Custis, K., Clements, J. and R. Klamt. 2003. North Coast Watershed Assessment Program Methods Manual. California Resources Agency and California Environmental Protection Agency, Sacramento, California. 191 pages.
Dai, J.J., S. Lorenzato, and D.M. Rocke 2004. A knowledge-based model of watershed assessment for sediment. Environmental Modelling & Software 19: 423–433.
Girvetz, E., and Shilling, F. 2003. Decision Support for Road System Analysis and Modification on the Tahoe National Forest. Environmental Management 32:218-233.
Reynolds, K.M. 2001. Fuzzy logic knowledge bases in integrated landscape assessment: examples and possibilities. Gen. Tech. Rep. PNW-GTR-521. Portland, OR: U.S. Department of Agriculture, Forest Service, Pacific Northwest Research Station. 24 pages.
Shilling, F.M. and 9 co-authors (2002). Reduction of mercury in the Sacramento River watershed and San Francisco Bay-Delta. Delta Tributaries Mercury Council. 119 pages.

California Abandoned Mines Prioritization Tool April 27, 2017 Page | 38 6.0 Appendices

California Abandoned Mines Prioritization Tool April 27, 2017 Page | 39 Appendix 1 California Abandoned Mine Lands Agency Group (CAMLAG) – Agency Survey Responses
California Abandoned Mines Prioritization Tool April 27, 2017 Page | 40 Summary of Results Abandoned Mine Lands (AML) Priority Criteria Survey Results There were 11 agency respondents to the on-line survey conducted by the Sierra Nevada Conservancy in 2014. Below is a synopsis of the responses for each question in bulleted form interfused to avoid duplication. What benefits do you envision for CAMLAG members and others from creating a comprehensive AML ranking system?
A consistent system
A comprehensive list
An easier method for cross-agency information exchange
A means to facilitate a more collaborative approach between agencies
A good tool for site comparisons
A means to capture specific interests
The creation of an up to date ranking system
The ability to match sites with current funding opportunities
The ability for CAMLAG to review sites as a group
The ability to focus on the largest polluters
A tool to find consensus
A tool for relative ranking
How would you use a system that contains cross-agency ranking criteria?
To develop and identify priority sites
To explore additional information
To exchange information
To identify sites for cooperative and collaborative efforts
To create individualized or specific needs lists
To evaluate impacts by watershed and landownership
What filters would you most likely use when searching a database for priority AML sites?
Location
Localized or larger geographic area impact (e.g. Watershed)
Proximity and impact on populations, water bodies, historic resources, and recreation facilities (including numbers of people, users, etc)
Number of incidents/accidents
Estimated cost of cleanup
Landownership
Watershed
Threats and impacts to and on human health and safety, wildlife and habitat, and water quality
California Abandoned Mines Prioritization Tool April 27, 2017 Page | 41
Types and concentrations of physical and chemical hazards
Beneficial uses of impacted water bodies
Volume of discharge
Generation and transport mechanism for chemical hazards
What benefits do you envision for CAMLAG members and others from creating a comprehensive AML ranking system?
A consistent ranking system in the state Certainly a ranking system is essential to any AML program. National Park Service
(NPS) has our own, which CAMLAG used in completing the AML inventory for California NPS units over the past 4 years. Not sure how your new system will compare to that of NPS, but unless you don’t like it, uniformity of systems would be a good plan. Not sure if the other feds have prioritization schemes.
It would allow for ease of information exchange among agencies. You would be able to compare AMLs throughout the state and determine mines with similar issues to those within your jurisdiction. Then you could connect with others to gather information about they're reclamation work and exchange ideas.
The comprehensive list would allow the participants of the CAMLAG group to discuss specific sites based on ranking system criteria which could facilitate a collaborative effort on a site(s) or an individual member taking on the task of addressing a site(s).
Ability to compare sites within watersheds or other planning areas, regardless of land ownership and management.
I envision that the specific interests of each applicable agency can be expressed this way, and the priorities for reclamation could be organized based on this comprehensive list.
From U.S. EPA's perspective, there would be benefit of ranking private/tribal land sites. A comprehensive list of all sites is of little use to EPA because we have limited authority on non-private, non-tribal land. I think state and federal legislators, non-governmental organizations and others may find the comprehensive list useful.
We could more easily produce a list of ranked sites based on different criteria, based on what the needs for a prioritized list are. We can match sites that rank high with various funding and program purposes. We can review sites together at our CAMLAG meetings, make this a regular part of our meetings.
The State Water Board no longer has a staff member that specializes in mining impacts. A comprehensive database would help make sure we are all (federal, state, local agencies) on the same page. Since resources are difficult to find, this type of ranking system could help assure we get the most bang for the buck.
At the State Water Board, we are creating a project to address mercury-impaired reservoirs statewide. One element of the project is to identify and prioritize mine site cleanups to reduce erosion of mercury-contaminated waste into the reservoir. While there may be 1000’s of mine sites, we need to focus efforts on those sites that are the largest polluters. The ranking system will be a useful tool for this- even better if there is a general consensus on what the criteria should be for both public and private lands.
A uniform ranking /scoring system compares AML sites relative to one another (e.g., relative ranking).
How would you use a system that contains cross-agency ranking criteria?

California Abandoned Mines Prioritization Tool April 27, 2017 Page | 42
Develop priorities (with DOC) in ranking specific sites to my agency Not sure, exactly, since we have our own. If yours were more elaborate or had fields
other than those in the NPS database, your system could provide us with good additional information.
I would use it like I mentioned in Question 1. I would look at applicable ranking criteria to identify a site(s) that our Department could
potentially work on. Planning tool to identify and cooperate on high priority AML sites. We could prioritize our reclamation goals to coincide with the most highly ranked
hazards, and try to schedule a reclamation list that fits best with the priorities of the other agencies involved in the reclamation list.
EPA would prioritize private land and tribal sites for NPL listing or removal actions. Look for high risk sites based on ownership, clean up status, watershed, legislative
district, pollutant type, hazard type. I would look at the funds DOC has available for remediation and match them to sites and partners in order to develop projects for clean up.
The system should be flexible and allow each user/agency to set up customized rankings suitable to specific needs. Once the data is input, different queries could be developed by the individual to pull the data they need.
Useful in addressing AML sites in watersheds. Useful in addressing AML sites within a watershed having different ownership (e.g., federal, state, private).
What filter(s) would you most likely use when searching a database for priority AML sites?
Locations to nearest populations (schools, homes, high use areas), incidents/accidents, costs to close the sites, risk, and number of features at the AML site.
Well of course, we'd be interested in which sites are on NPS lands, for starters. To see where sites overlap onto other agencies' lands or into common watersheds would be helpful.
I would like to see a filter for its impact on the surrounding environment. For example, does it have a large impact on the watershed or is its impact more localized to the site?
Threats to human health, water quality, or ecological receptors. Human safety, wildlife habitat (bats). Physical and chemical hazards. Presence of historic resources. Land ownership, then pollutant (Mercury, AMD and Other [mostly arsenic]). Hazard type (chemical and physical), pollutant type, clean up status, ownership,
proximity to recreation facilities (roads, campgrounds, trailheads), proximity to water way, proximity to city/town.
Chemical constituent of concern (COC), how is COC generated (erosion, oxidation, natural, etc) and transported, impact on water quality (surface and groundwater), potential/actual impact on human population, including how many people potentially exposed, proximity to surface waters, beneficial uses of water body impacted by discharge, volume (solid or liquid) of discharge.
Amount of onsite mine waste; amount of onsite mine waste contacting surface waters; mercury concentration in mine waste runoff; distance to surface water (creek, river); distance to reservoir; percentage of vegetative cover on mine wastes; degree of existing
California Abandoned Mines Prioritization Tool April 27, 2017 Page | 43
erosion (visual evidence of rills, channels, off site waste, movement, etc.); erosion potential of mine waste piles; site access.
Highest concentration of a given contaminant of concern, human health impact, and environmental impacts - including ecological and water quality impacts.

California Abandoned Mines Prioritization Tool April 27, 2017 Page | 44 Appendix 2 Guidance Used to Generate Attributes for CAMPT
California Abandoned Mines Prioritization Tool April 27, 2017 Page | 45 Bureau of Land Management. 2004. Risk management criteria for metals at BLM mining sites. National Science and Technology Center. Technical Note 390 (revised). October 2004. Denver, CO.
Bureau of Land Management. 2006. Abandoned Mine Land Program Policy Manual. Renewable Resources and Planning. BLM MS-3720. July 2006. Revised September 30, 2013.
Bureau of Land Management. 2006. The Cooperative Conservation Based Strategic Plan for the Abandoned Mine Lands Program. March 2006.
California Code of Regulations. 2017. Title 27, Environmental Protection. Division 2, Solid Waste.
California Regional Water Quality Control Boards. 2008. Mining Waste Characterization. Tech Note. June 2008. http://www.waterboards.ca.gov/centralvalley/water_issues/mining/mine_waste_technote.pdf. Accessed 3/17/17.
California Regional Water Quality Control Board. Central Valley Region. 1989. The Designated Level Methodology for Waste Classification and Cleanup Level Determination. Updated June 1989. Sacramento, CA.
Department of Conservation. 1998. Preliminary Appraisal and Ranking System (PAR). Division of Mine Reclamation, Abandoned Mine Lands Program. Sacramento, CA.
Department of Toxic Substances Control. 1993. Priority setting procedures for cleanup of state-funded hazardous substances release sites. State of California Environmental Protection Agency. Department of Toxic Substances Control. Planning and Management Branch. August 1993. Sacramento, CA.
Department of Toxic Substances Control. 1998. Abandoned Mine Lands Preliminary Assessment Handbook. State of California Environmental Protection Agency. Department of Toxic Substances Control. January 1998. Sacramento, CA.
National Park Service. 2014. Abandoned Mineral Lands in the National Park System—Comprehensive Inventory and Assessment. Natural Resource Technical Report NPS/NRSS/GRD/NRTR—2014/906. Geologic Resources Division. Denver, CO.
State Water Resources Control Board. 1996. Resolution number 92 – 49. Policies and procedures for investigation and cleanup and abatement of discharges under Water Code Section 13304. Sacramento, CA.
State Water Resources Control Board. 2017. Porter-Cologne Water Quality Control Act. Division 7, Water Quality, Sections 13000-16104.
U.S. Environmental Protection Agency. 1992. Hazard Ranking System Guidance Manual, Interim Final. Hazardous Site Evaluation Division, Office of Solid Waste and Emergency Response. November 1992. Washington, DC.
U.S. Environmental Protection Agency. 2000. Abandoned mine site characterization and clean up handbook. EPA 910-B-00-001. U.S. EPA Region 10. Seattle, WA.
U.S. Environmental Protection Agency. 2006. Abandoned mine lands site discovery process. June 30, 2006. U.S. EPA Region 9. San Francisco, CA.
U.S. Geological Survey. Mineral Resources Data System. Last updated in 2011. https://mrdata.usgs.gov/mrds/. Accessed 3/17/17.

California Abandoned Mines Prioritization Tool April 27, 2017 Page | 46
Appendix 3 Outline of Select Attribute Combinations for Risk Evaluation

California Abandoned Mines Prioritization Tool April 27, 2017 Page | 47 Tier 2 Relationships --------------------------------------------------------------------------------------------------------------- IMMINENT RISK TO HUMAN OR ECOLOGICAL HEALTH – Physical Hazards Only
Concept: Attribute 1 evaluates endangerment from physical safety hazards based on certain Chemical Hazards and Physical Hazards in Tier 2. Tier 2 does not evaluate imminent risk to human or ecological health from chemical hazards because it is assumed not enough data would be collected to determine endangerment at this stage of site investigation.
Physical Risk
Tier 2 Chemical Risk Attribute 1 (presence of hazardous materials) OR Attributes 1A or 1B (condition of adits or shafts) OR Attribute 3 (condition of high walls) OR Attribute 7 (condition of pools of standing water)
+ Tier 1 Attribute 1 (road access) OR Attribute 2 (Trails access) OR Attribute 3 (campground access)
+ Tier 1 Chemical Risk Attribute 5 (density of mine features)
+ Tier 1 Chemical Risk Attribute 16 (land ownership) ---------------------------------------------------------------------------------------------------------------- DETECTION OF ELEVATED CONSTITUENTS OF CONCERN
Concept: 1. Are there contaminants that may produce a hazard? 2. Is the contamination going anywhere? 3. Can it impact a receptor?
Chemical Risk
Tier 2 Attribute 22 (detection of contaminant of concern in soil or tailings using XRF)
+ Tier 2 Attribute 2 OR Attribute 3 (volume of waste OR tailings) OR Tier 2 Attribute 15A OR 15B (volume of waste OR tailings in contact with surface flows)
AND
+ Tier 1 Attribute 6 (mine location relative to surface water body) OR Attribute 10 (mine location relative to ground water drinking water source) OR Attribute 11 (mine location relative to surface water diversion for drinking water) OR Attribute 13 (mine location relative to protected species) OR Attribute 14 (mine location relative to wetland environment) ---------------------------------------------------------------------------------------------------------------

California Abandoned Mines Prioritization Tool April 27, 2017 Page | 48 Tier 3 Relationships ----------------------------------------------------------------------------------------------------------------- IMMINENT RISK TO HUMAN OR ECOLOGICAL HEALTH
Concept: To ascertain evaluation for Attribute 1 certain attributes in Tier 3 should be flagged.
Chemical Risk
Tier 3 Attributes 2ACOC to 2DCOC (concentration of any contaminant in any of 4 media above threshold) OR Attributes 9A to 9E (water chemistry parameters that do not meet standards)
AND
Tier 3 Attribute 10A OR Attribute 10B (Contaminant impacts ground water OR downstream surface water diversion for drinking water)
OR
Tier 3 Attribute 6AHumWater OR Attribute 6AHumSoil OR Attribute 6AHumSediment OR Attribute 6BHumFood (Human exposure pathway is contaminated and direct intake/contact is occurring)
OR
Tier 3 Attribute 6AEcoWater OR Attribute 6aEcoSoil OR Attribute 6AEcoSediment OR Attribute 6BEcoFood (Ecological exposure pathway is contaminated and direct intake/contact is occurring) --------------------------------------------------------------------------------------------------------------------- TYPE AND CONCENTRATION OF CONSTITUENT IN MEDIA (SOIL, SEDIMENT, GROUNDWATER, SURFACE WATER)
Concept: 1. Are there contaminants that may produce a hazard? 2. Is the contamination going anywhere? 3. Can it impact a receptor?
Chemical Risk
Tier 3 Attributes 2ACOC to 2DCOC (concentration of any contaminant in any of 4 media above threshold) OR Attributes 9A to 9E (water chemistry parameters that do not meet standards)
+ Tier 3 Attribute 3A OR Attribute 3B OR Attribute 3C OR Attribute 3D (mobility of contaminants in soil, air, groundwater, surface water) OR Tier 2 Attribute 13 OR Attribute 14 (evidence of erosion on site) OR Attribute 15 (waste in contact with surface flows)
+ Tier 2 Attributes 15A OR 15B (volume of waste OR Tailings in contact with surface water) OR Tier 3 Attribute 5A OR Attribute 5B (volume of contaminated material on site)
+ Tier 3 Attribute 10A OR Attribute 10B (Contaminant impacts ground water or downstream surface water diversion for drinking water) OR Attribute 6AHumWater OR Attribute

California Abandoned Mines Prioritization Tool April 27, 2017 Page | 49 6AHumSoil OR Attribute 6AHumSediment OR Attribute 6BHumFood (Human exposure pathway is contaminated and direct intake/contact is occurring)
OR
+ Tier 3 Attribute 6AEcoWater OR Attribute 6aEcoSoil OR 6AEcoSediment OR Attribute 6BEcoFood (Ecological exposure pathway is contaminated and direct intake/contact is occurring) ---------------------------------------------------------------------------------------------------------------- RISK FROM VOLUME OF CONTAMINATED MATERIAL
Concept: The amount of contaminated waste rock should be evaluated along with the type of commodity mined.
Chemical Risk
Tier 3 Attribute 5A OR Attribute 5B (volume of contaminated waste rock OR tailings)
+ Tier 2 Attribute 6 OR Attribute 8 (commodity mined OR type of mine)
+ Tier 2 Attribute 14 (waste or tailings in contact with surface flows) OR Attributes 15A OR 15B (volume of waste OR tailings in contact with surface flows) OR Attribute 16 (stream type on or near mine site) OR Attribute 17 (mine site located near surface water) ---------------------------------------------------------------------------------------------------------------- RISK FROM MOBILITY OF CONTAMINANTS
Concept: Is the contamination going anywhere?
Chemical Risk
Tier 3 Attribute 3A OR Attribute 3B OR Attribute 3C OR Attribute 3D (evidence of mobility of contaminants through 4 different media)
OR
Tier 2 Physical Risk Attribute 5 (steepness/stability of slopes)
+ Tier 2 Attribute 12 OR Attribute 13 (evidence of water or wind erosion on site) OR Attribute 14 (waste or tailings in contact with surface flows)
------------------------------------------------------------------------------------------------------------------

California Abandoned Mines Prioritization Tool April 27, 2017 Page | 50 Appendix 4 Tier 1 Attributes and Evaluation Ranges
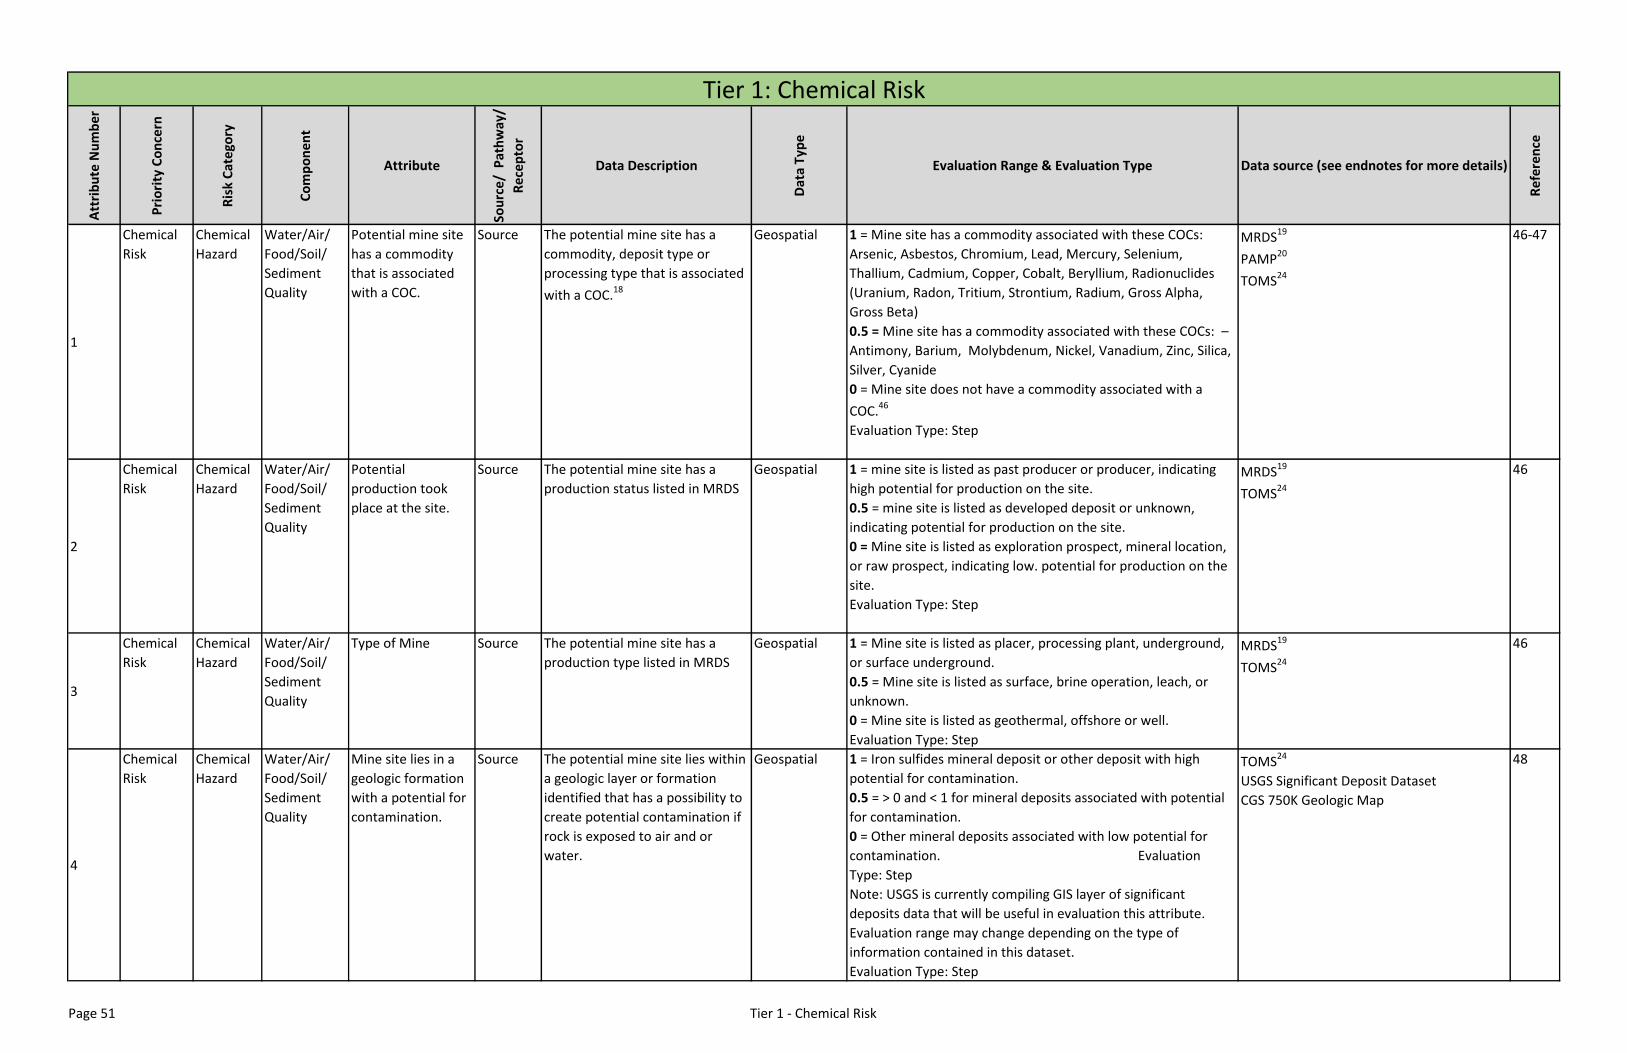
Att
rib
ute
Nu
mb
er
Pri
ori
ty C
on
cern
Ris
k C
ate
gory
Co
mp
on
ent
Attribute
Sou
rce/
Pat
hw
ay/
Re
cep
tor
Data Description
Dat
a T
ype
Evaluation Range & Evaluation Type Data source (see endnotes for more details)
Re
fere
nce
1
Chemical
Risk
Chemical
Hazard
Water/Air/
Food/Soil/
Sediment
Quality
Potential mine site
has a commodity
that is associated
with a COC.
Source The potential mine site has a
commodity, deposit type or
processing type that is associated
with a COC.18
Geospatial 1 = Mine site has a commodity associated with these COCs:
Arsenic, Asbestos, Chromium, Lead, Mercury, Selenium,
Thallium, Cadmium, Copper, Cobalt, Beryllium, Radionuclides
(Uranium, Radon, Tritium, Strontium, Radium, Gross Alpha,
Gross Beta)
0.5 = Mine site has a commodity associated with these COCs: –
Antimony, Barium, Molybdenum, Nickel, Vanadium, Zinc, Silica,
Silver, Cyanide
0 = Mine site does not have a commodity associated with a
COC.46
Evaluation Type: Step
MRDS19
PAMP20
TOMS24
46-47
2
Chemical
Risk
Chemical
Hazard
Water/Air/
Food/Soil/
Sediment
Quality
Potential
production took
place at the site.
Source The potential mine site has a
production status listed in MRDS
Geospatial 1 = mine site is listed as past producer or producer, indicating
high potential for production on the site.
0.5 = mine site is listed as developed deposit or unknown,
indicating potential for production on the site.
0 = Mine site is listed as exploration prospect, mineral location,
or raw prospect, indicating low. potential for production on the
site.
Evaluation Type: Step
MRDS19
TOMS24
46
3
Chemical
Risk
Chemical
Hazard
Water/Air/
Food/Soil/
Sediment
Quality
Type of Mine Source The potential mine site has a
production type listed in MRDS
Geospatial 1 = Mine site is listed as placer, processing plant, underground,
or surface underground.
0.5 = Mine site is listed as surface, brine operation, leach, or
unknown.
0 = Mine site is listed as geothermal, offshore or well.
Evaluation Type: Step
MRDS19
TOMS24
46
4
Chemical
Risk
Chemical
Hazard
Water/Air/
Food/Soil/
Sediment
Quality
Mine site lies in a
geologic formation
with a potential for
contamination.
Source The potential mine site lies within
a geologic layer or formation
identified that has a possibility to
create potential contamination if
rock is exposed to air and or
water.
Geospatial 1 = Iron sulfides mineral deposit or other deposit with high
potential for contamination.
0.5 = > 0 and < 1 for mineral deposits associated with potential
for contamination.
0 = Other mineral deposits associated with low potential for
contamination. Evaluation
Type: Step
Note: USGS is currently compiling GIS layer of significant
deposits data that will be useful in evaluation this attribute.
Evaluation range may change depending on the type of
information contained in this dataset.
Evaluation Type: Step
TOMS24
USGS Significant Deposit Dataset
CGS 750K Geologic Map
48
Tier 1: Chemical Risk
Page 51 Tier 1 - Chemical Risk
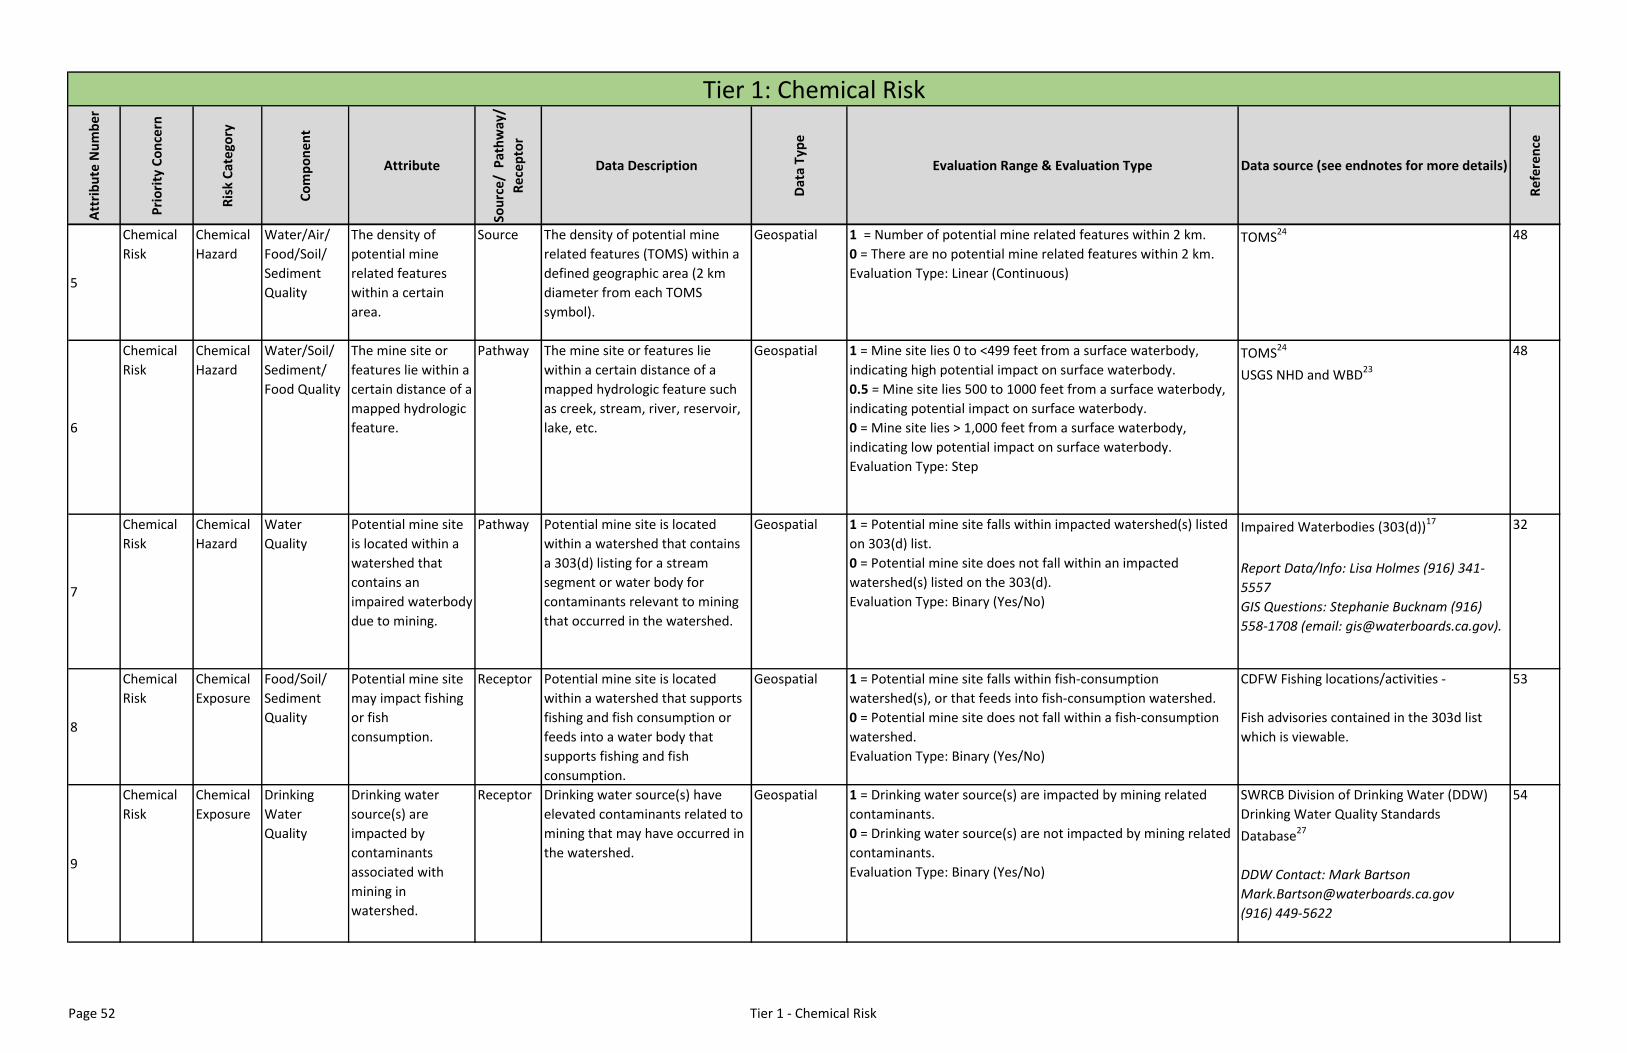
Att
rib
ute
Nu
mb
er
Pri
ori
ty C
on
cern
Ris
k C
ate
gory
Co
mp
on
ent
Attribute
Sou
rce/
Pat
hw
ay/
Re
cep
tor
Data Description
Dat
a T
ype
Evaluation Range & Evaluation Type Data source (see endnotes for more details)
Re
fere
nce
Tier 1: Chemical Risk
5
Chemical
Risk
Chemical
Hazard
Water/Air/
Food/Soil/
Sediment
Quality
The density of
potential mine
related features
within a certain
area.
Source The density of potential mine
related features (TOMS) within a
defined geographic area (2 km
diameter from each TOMS
symbol).
Geospatial 1 = Number of potential mine related features within 2 km.
0 = There are no potential mine related features within 2 km.
Evaluation Type: Linear (Continuous)
TOMS24 48
6
Chemical
Risk
Chemical
Hazard
Water/Soil/
Sediment/
Food Quality
The mine site or
features lie within a
certain distance of a
mapped hydrologic
feature.
Pathway The mine site or features lie
within a certain distance of a
mapped hydrologic feature such
as creek, stream, river, reservoir,
lake, etc.
Geospatial 1 = Mine site lies 0 to <499 feet from a surface waterbody,
indicating high potential impact on surface waterbody.
0.5 = Mine site lies 500 to 1000 feet from a surface waterbody,
indicating potential impact on surface waterbody.
0 = Mine site lies > 1,000 feet from a surface waterbody,
indicating low potential impact on surface waterbody.
Evaluation Type: Step
TOMS24
USGS NHD and WBD23
48
7
Chemical
Risk
Chemical
Hazard
Water
Quality
Potential mine site
is located within a
watershed that
contains an
impaired waterbody
due to mining.
Pathway Potential mine site is located
within a watershed that contains
a 303(d) listing for a stream
segment or water body for
contaminants relevant to mining
that occurred in the watershed.
Geospatial 1 = Potential mine site falls within impacted watershed(s) listed
on 303(d) list.
0 = Potential mine site does not fall within an impacted
watershed(s) listed on the 303(d).
Evaluation Type: Binary (Yes/No)
Impaired Waterbodies (303(d))17
Report Data/Info: Lisa Holmes (916) 341-
5557
GIS Questions: Stephanie Bucknam (916)
558-1708 (email: [email protected]).
32
8
Chemical
Risk
Chemical
Exposure
Food/Soil/
Sediment
Quality
Potential mine site
may impact fishing
or fish
consumption.
Receptor Potential mine site is located
within a watershed that supports
fishing and fish consumption or
feeds into a water body that
supports fishing and fish
consumption.
Geospatial 1 = Potential mine site falls within fish-consumption
watershed(s), or that feeds into fish-consumption watershed.
0 = Potential mine site does not fall within a fish-consumption
watershed.
Evaluation Type: Binary (Yes/No)
CDFW Fishing locations/activities -
Fish advisories contained in the 303d list
which is viewable.
53
9
Chemical
Risk
Chemical
Exposure
Drinking
Water
Quality
Drinking water
source(s) are
impacted by
contaminants
associated with
mining in
watershed.
Receptor Drinking water source(s) have
elevated contaminants related to
mining that may have occurred in
the watershed.
Geospatial 1 = Drinking water source(s) are impacted by mining related
contaminants.
0 = Drinking water source(s) are not impacted by mining related
contaminants.
Evaluation Type: Binary (Yes/No)
SWRCB Division of Drinking Water (DDW)
Drinking Water Quality Standards
Database27
DDW Contact: Mark Bartson
(916) 449-5622
54
Page 52 Tier 1 - Chemical Risk
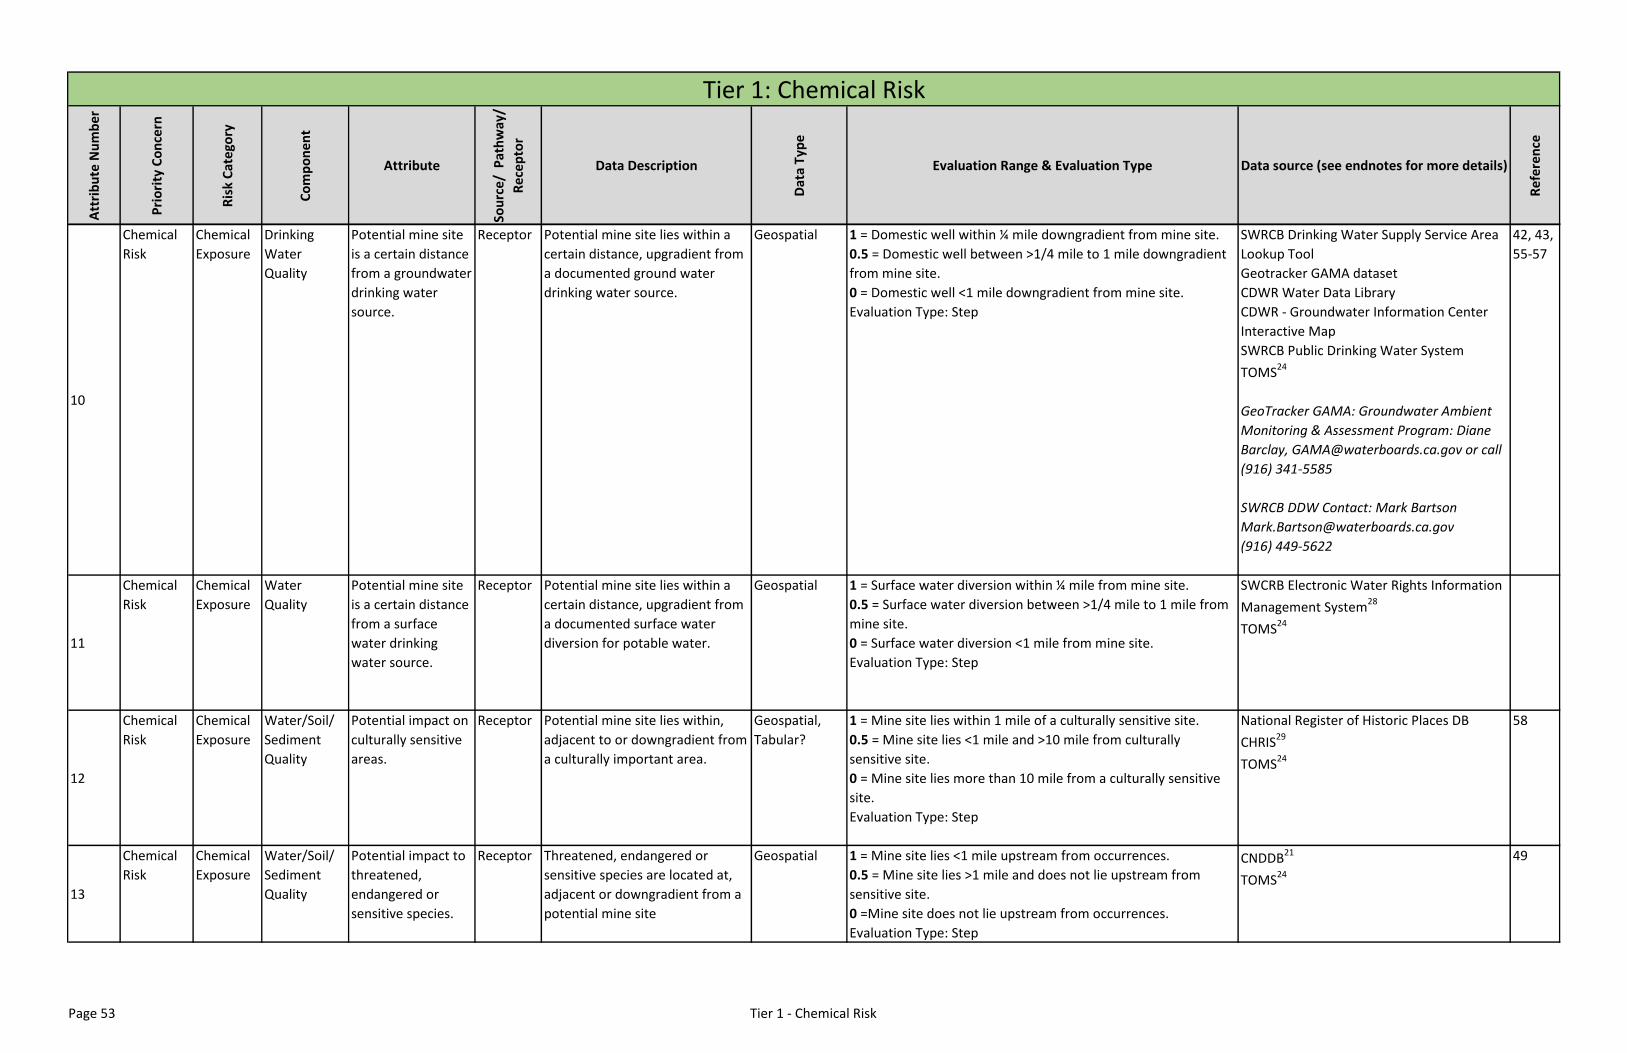
Att
rib
ute
Nu
mb
er
Pri
ori
ty C
on
cern
Ris
k C
ate
gory
Co
mp
on
ent
Attribute
Sou
rce/
Pat
hw
ay/
Re
cep
tor
Data Description
Dat
a T
ype
Evaluation Range & Evaluation Type Data source (see endnotes for more details)
Re
fere
nce
Tier 1: Chemical Risk
10
Chemical
Risk
Chemical
Exposure
Drinking
Water
Quality
Potential mine site
is a certain distance
from a groundwater
drinking water
source.
Receptor Potential mine site lies within a
certain distance, upgradient from
a documented ground water
drinking water source.
Geospatial 1 = Domestic well within ¼ mile downgradient from mine site.
0.5 = Domestic well between >1/4 mile to 1 mile downgradient
from mine site.
0 = Domestic well <1 mile downgradient from mine site.
Evaluation Type: Step
SWRCB Drinking Water Supply Service Area
Lookup Tool
Geotracker GAMA dataset
CDWR Water Data Library
CDWR - Groundwater Information Center
Interactive Map
SWRCB Public Drinking Water System
TOMS24
GeoTracker GAMA: Groundwater Ambient
Monitoring & Assessment Program: Diane
Barclay, [email protected] or call
(916) 341-5585
SWRCB DDW Contact: Mark Bartson
(916) 449-5622
42, 43,
55-57
11
Chemical
Risk
Chemical
Exposure
Water
Quality
Potential mine site
is a certain distance
from a surface
water drinking
water source.
Receptor Potential mine site lies within a
certain distance, upgradient from
a documented surface water
diversion for potable water.
Geospatial 1 = Surface water diversion within ¼ mile from mine site.
0.5 = Surface water diversion between >1/4 mile to 1 mile from
mine site.
0 = Surface water diversion <1 mile from mine site.
Evaluation Type: Step
SWCRB Electronic Water Rights Information
Management System28
TOMS24
12
Chemical
Risk
Chemical
Exposure
Water/Soil/
Sediment
Quality
Potential impact on
culturally sensitive
areas.
Receptor Potential mine site lies within,
adjacent to or downgradient from
a culturally important area.
Geospatial,
Tabular?
1 = Mine site lies within 1 mile of a culturally sensitive site.
0.5 = Mine site lies <1 mile and >10 mile from culturally
sensitive site.
0 = Mine site lies more than 10 mile from a culturally sensitive
site.
Evaluation Type: Step
National Register of Historic Places DB
CHRIS29
TOMS24
58
13
Chemical
Risk
Chemical
Exposure
Water/Soil/
Sediment
Quality
Potential impact to
threatened,
endangered or
sensitive species.
Receptor Threatened, endangered or
sensitive species are located at,
adjacent or downgradient from a
potential mine site
Geospatial 1 = Mine site lies <1 mile upstream from occurrences.
0.5 = Mine site lies >1 mile and does not lie upstream from
sensitive site.
0 =Mine site does not lie upstream from occurrences.
Evaluation Type: Step
CNDDB21
TOMS24
49
Page 53 Tier 1 - Chemical Risk
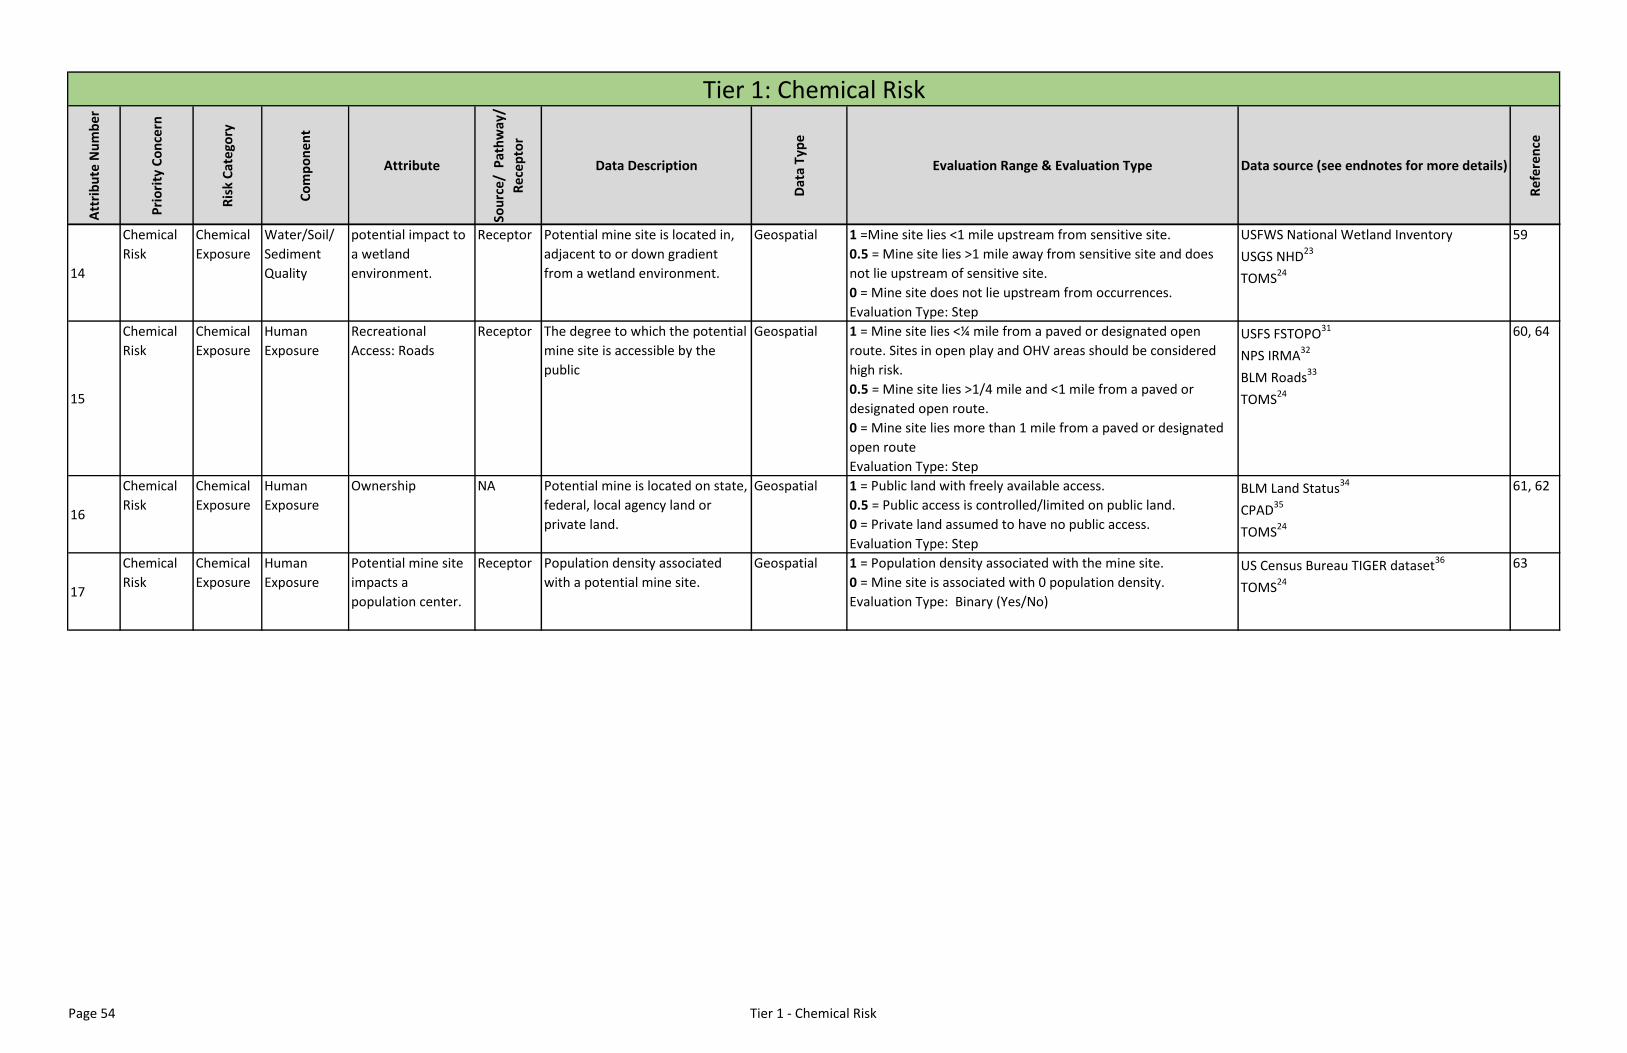
Att
rib
ute
Nu
mb
er
Pri
ori
ty C
on
cern
Ris
k C
ate
gory
Co
mp
on
ent
Attribute
Sou
rce/
Pat
hw
ay/
Re
cep
tor
Data Description
Dat
a T
ype
Evaluation Range & Evaluation Type Data source (see endnotes for more details)
Re
fere
nce
Tier 1: Chemical Risk
14
Chemical
Risk
Chemical
Exposure
Water/Soil/
Sediment
Quality
potential impact to
a wetland
environment.
Receptor Potential mine site is located in,
adjacent to or down gradient
from a wetland environment.
Geospatial 1 =Mine site lies <1 mile upstream from sensitive site.
0.5 = Mine site lies >1 mile away from sensitive site and does
not lie upstream of sensitive site.
0 = Mine site does not lie upstream from occurrences.
Evaluation Type: Step
USFWS National Wetland Inventory
USGS NHD23
TOMS24
59
15
Chemical
Risk
Chemical
Exposure
Human
Exposure
Recreational
Access: Roads
Receptor The degree to which the potential
mine site is accessible by the
public
Geospatial 1 = Mine site lies <¼ mile from a paved or designated open
route. Sites in open play and OHV areas should be considered
high risk.
0.5 = Mine site lies >1/4 mile and <1 mile from a paved or
designated open route.
0 = Mine site lies more than 1 mile from a paved or designated
open route
Evaluation Type: Step
USFS FSTOPO31
NPS IRMA32
BLM Roads33
TOMS24
60, 64
16
Chemical
Risk
Chemical
Exposure
Human
Exposure
Ownership NA Potential mine is located on state,
federal, local agency land or
private land.
Geospatial 1 = Public land with freely available access.
0.5 = Public access is controlled/limited on public land.
0 = Private land assumed to have no public access.
Evaluation Type: Step
BLM Land Status34
CPAD35
TOMS24
61, 62
17
Chemical
Risk
Chemical
Exposure
Human
Exposure
Potential mine site
impacts a
population center.
Receptor Population density associated
with a potential mine site.
Geospatial 1 = Population density associated with the mine site.
0 = Mine site is associated with 0 population density.
Evaluation Type: Binary (Yes/No)
US Census Bureau TIGER dataset36
TOMS24
63
Page 54 Tier 1 - Chemical Risk
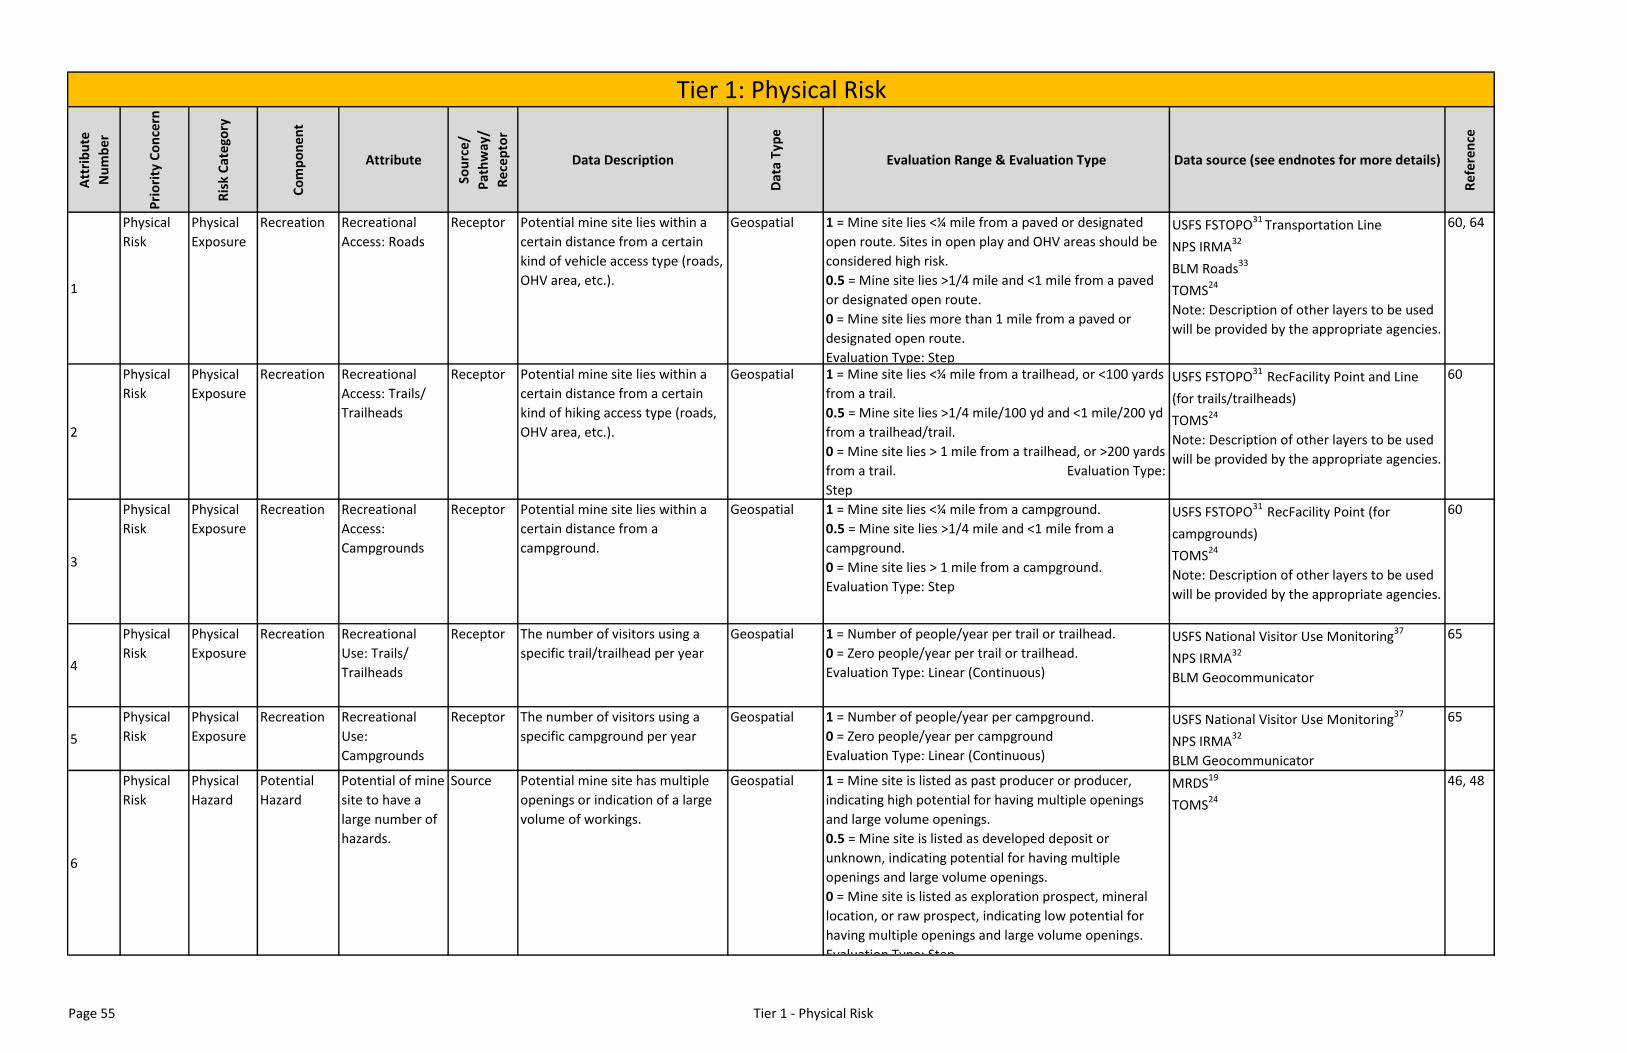
Att
rib
ute
Nu
mb
er
Pri
ori
ty C
on
cern
Ris
k C
ate
gory
Co
mp
on
ent
Attribute
Sou
rce/
Pat
hw
ay/
Re
cep
tor
Data Description
Dat
a T
ype
Evaluation Range & Evaluation Type Data source (see endnotes for more details)
Re
fere
nce
1
Physical
Risk
Physical
Exposure
Recreation Recreational
Access: Roads
Receptor Potential mine site lies within a
certain distance from a certain
kind of vehicle access type (roads,
OHV area, etc.).
Geospatial 1 = Mine site lies <¼ mile from a paved or designated
open route. Sites in open play and OHV areas should be
considered high risk.
0.5 = Mine site lies >1/4 mile and <1 mile from a paved
or designated open route.
0 = Mine site lies more than 1 mile from a paved or
designated open route.
Evaluation Type: Step
USFS FSTOPO31
Transportation Line
NPS IRMA32
BLM Roads33
TOMS24
Note: Description of other layers to be used
will be provided by the appropriate agencies.
60, 64
2
Physical
Risk
Physical
Exposure
Recreation Recreational
Access: Trails/
Trailheads
Receptor Potential mine site lies within a
certain distance from a certain
kind of hiking access type (roads,
OHV area, etc.).
Geospatial 1 = Mine site lies <¼ mile from a trailhead, or <100 yards
from a trail.
0.5 = Mine site lies >1/4 mile/100 yd and <1 mile/200 yd
from a trailhead/trail.
0 = Mine site lies > 1 mile from a trailhead, or >200 yards
from a trail. Evaluation Type:
Step
USFS FSTOPO31 RecFacility Point and Line
(for trails/trailheads)
TOMS24
Note: Description of other layers to be used
will be provided by the appropriate agencies.
60
3
Physical
Risk
Physical
Exposure
Recreation Recreational
Access:
Campgrounds
Receptor Potential mine site lies within a
certain distance from a
campground.
Geospatial 1 = Mine site lies <¼ mile from a campground.
0.5 = Mine site lies >1/4 mile and <1 mile from a
campground.
0 = Mine site lies > 1 mile from a campground.
Evaluation Type: Step
USFS FSTOPO31 RecFacility Point (for
campgrounds)
TOMS24
Note: Description of other layers to be used
will be provided by the appropriate agencies.
60
4
Physical
Risk
Physical
Exposure
Recreation Recreational
Use: Trails/
Trailheads
Receptor The number of visitors using a
specific trail/trailhead per year
Geospatial 1 = Number of people/year per trail or trailhead.
0 = Zero people/year per trail or trailhead.
Evaluation Type: Linear (Continuous)
USFS National Visitor Use Monitoring37
NPS IRMA32
BLM Geocommunicator
65
5
Physical
Risk
Physical
Exposure
Recreation Recreational
Use:
Campgrounds
Receptor The number of visitors using a
specific campground per year
Geospatial 1 = Number of people/year per campground.
0 = Zero people/year per campground
Evaluation Type: Linear (Continuous)
USFS National Visitor Use Monitoring37
NPS IRMA32
BLM Geocommunicator
65
6
Physical
Risk
Physical
Hazard
Potential
Hazard
Potential of mine
site to have a
large number of
hazards.
Source Potential mine site has multiple
openings or indication of a large
volume of workings.
Geospatial 1 = Mine site is listed as past producer or producer,
indicating high potential for having multiple openings
and large volume openings.
0.5 = Mine site is listed as developed deposit or
unknown, indicating potential for having multiple
openings and large volume openings.
0 = Mine site is listed as exploration prospect, mineral
location, or raw prospect, indicating low potential for
having multiple openings and large volume openings.
Evaluation Type: Step
MRDS19
TOMS24
46, 48
Tier 1: Physical Risk
Page 55 Tier 1 - Physical Risk
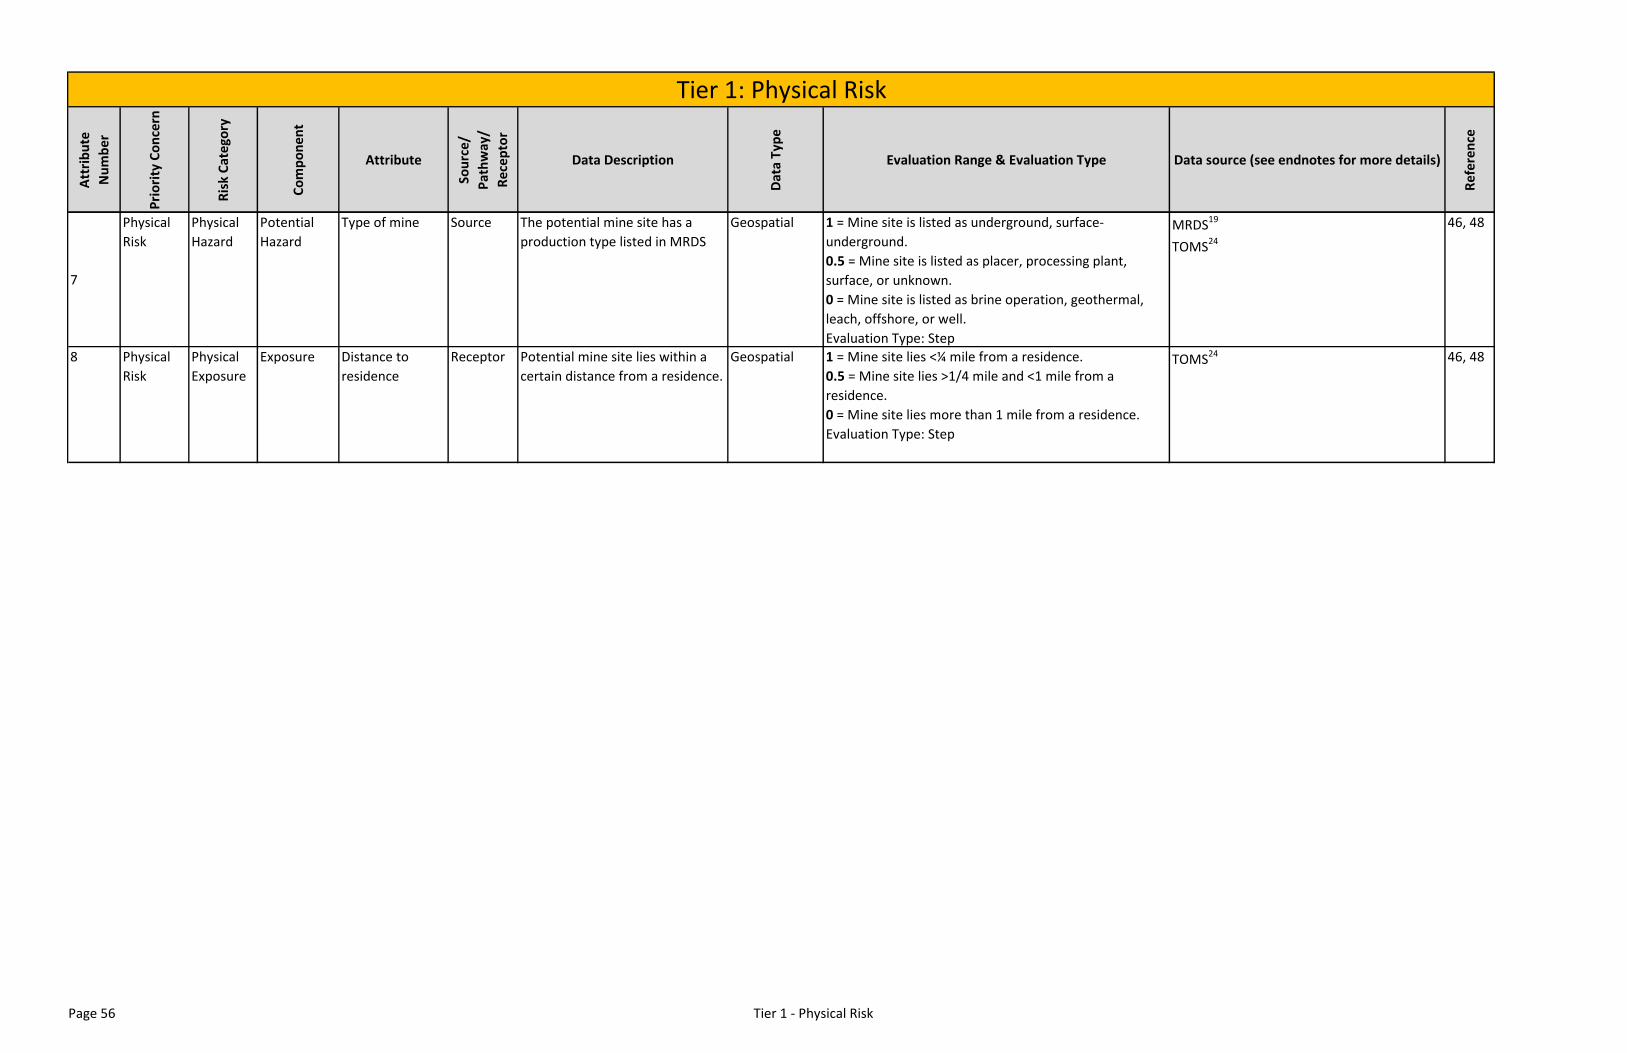
Att
rib
ute
Nu
mb
er
Pri
ori
ty C
on
cern
Ris
k C
ate
gory
Co
mp
on
ent
Attribute
Sou
rce/
Pat
hw
ay/
Re
cep
tor
Data Description
Dat
a T
ype
Evaluation Range & Evaluation Type Data source (see endnotes for more details)
Re
fere
nce
Tier 1: Physical Risk
7
Physical
Risk
Physical
Hazard
Potential
Hazard
Type of mine Source The potential mine site has a
production type listed in MRDS
Geospatial 1 = Mine site is listed as underground, surface-
underground.
0.5 = Mine site is listed as placer, processing plant,
surface, or unknown.
0 = Mine site is listed as brine operation, geothermal,
leach, offshore, or well.
Evaluation Type: Step
MRDS19
TOMS24
46, 48
8 Physical
Risk
Physical
Exposure
Exposure Distance to
residence
Receptor Potential mine site lies within a
certain distance from a residence.
Geospatial 1 = Mine site lies <¼ mile from a residence.
0.5 = Mine site lies >1/4 mile and <1 mile from a
residence.
0 = Mine site lies more than 1 mile from a residence.
Evaluation Type: Step
TOMS24 46, 48
Page 56 Tier 1 - Physical Risk

California Abandoned Mines Prioritization Tool April 27, 2017 Page | 57 Appendix 5 Tier 2 Attributes and Evaluation Ranges
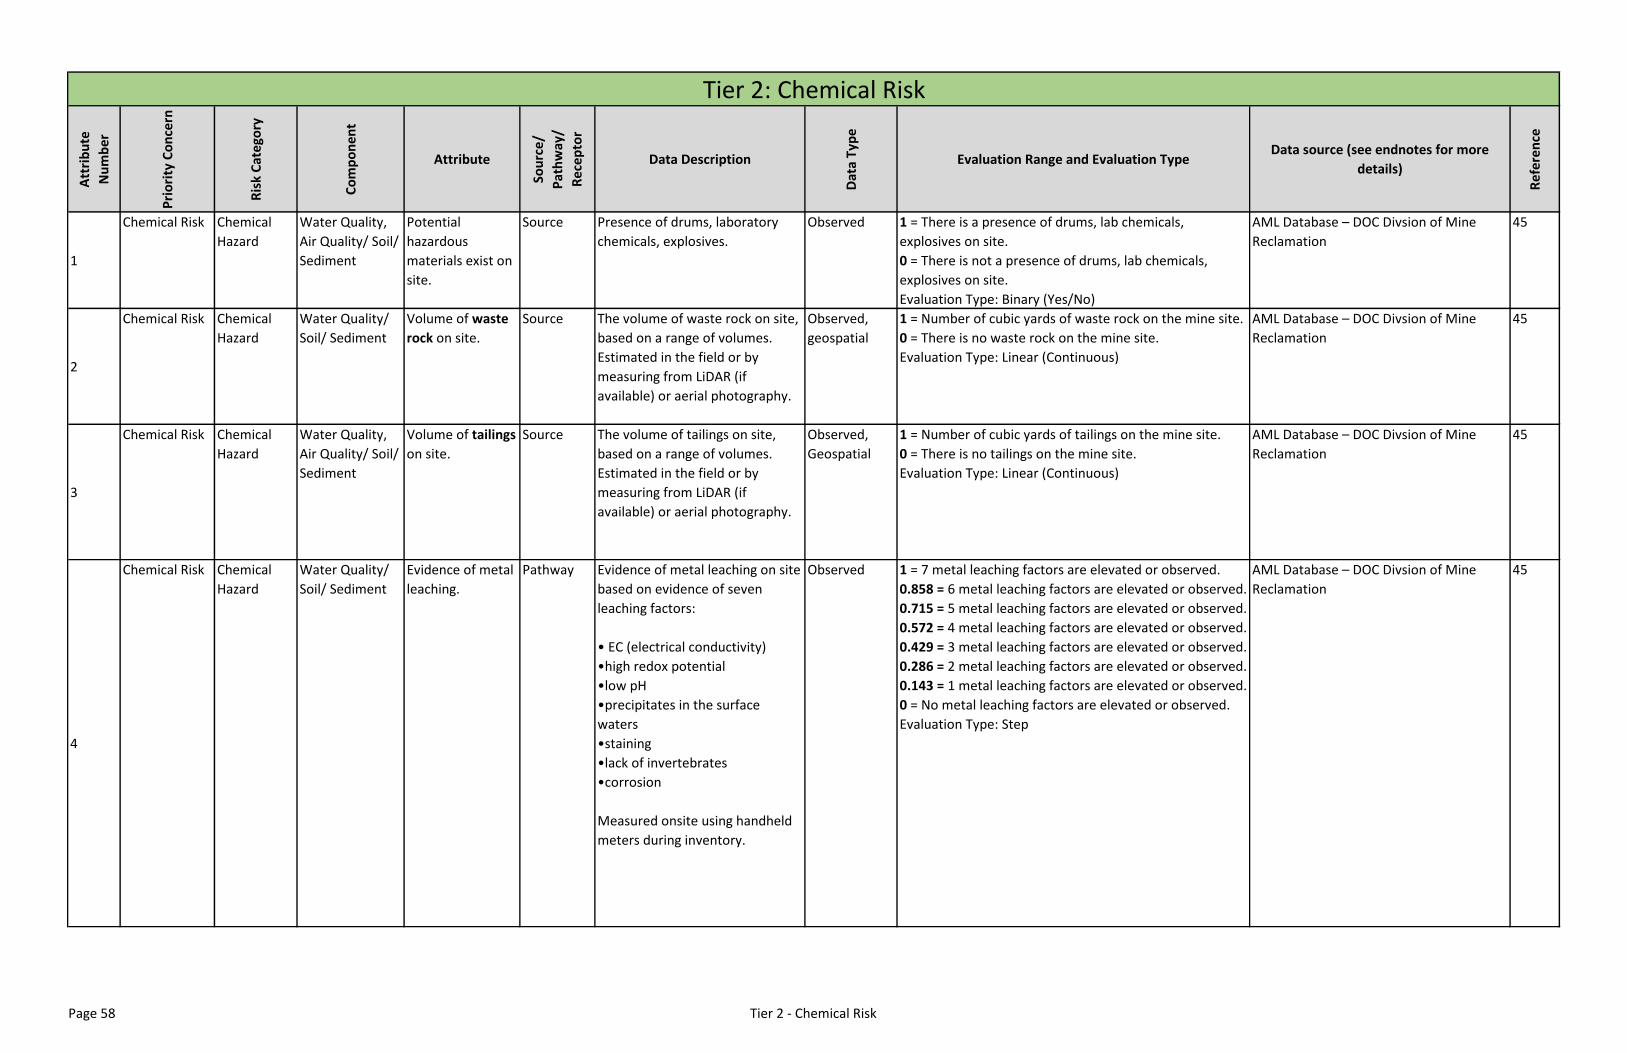
Att
rib
ute
Nu
mb
er
Pri
ori
ty C
on
cern
Ris
k C
ate
gory
Co
mp
on
ent
Attribute
Sou
rce/
Pat
hw
ay/
Re
cep
tor
Data Description
Dat
a T
ype
Evaluation Range and Evaluation TypeData source (see endnotes for more
details)
Re
fere
nce
1
Chemical Risk Chemical
Hazard
Water Quality,
Air Quality/ Soil/
Sediment
Potential
hazardous
materials exist on
site.
Source Presence of drums, laboratory
chemicals, explosives.
Observed 1 = There is a presence of drums, lab chemicals,
explosives on site.
0 = There is not a presence of drums, lab chemicals,
explosives on site.
Evaluation Type: Binary (Yes/No)
AML Database – DOC Divsion of Mine
Reclamation
45
2
Chemical Risk Chemical
Hazard
Water Quality/
Soil/ Sediment
Volume of waste
rock on site.
Source The volume of waste rock on site,
based on a range of volumes.
Estimated in the field or by
measuring from LiDAR (if
available) or aerial photography.
Observed,
geospatial
1 = Number of cubic yards of waste rock on the mine site.
0 = There is no waste rock on the mine site.
Evaluation Type: Linear (Continuous)
AML Database – DOC Divsion of Mine
Reclamation
45
3
Chemical Risk Chemical
Hazard
Water Quality,
Air Quality/ Soil/
Sediment
Volume of tailings
on site.
Source The volume of tailings on site,
based on a range of volumes.
Estimated in the field or by
measuring from LiDAR (if
available) or aerial photography.
Observed,
Geospatial
1 = Number of cubic yards of tailings on the mine site.
0 = There is no tailings on the mine site.
Evaluation Type: Linear (Continuous)
AML Database – DOC Divsion of Mine
Reclamation
45
4
Chemical Risk Chemical
Hazard
Water Quality/
Soil/ Sediment
Evidence of metal
leaching.
Pathway Evidence of metal leaching on site
based on evidence of seven
leaching factors:
• EC (electrical conductivity)
•high redox potential
•low pH
•precipitates in the surface
waters
•staining
•lack of invertebrates
•corrosion
Measured onsite using handheld
meters during inventory.
Observed 1 = 7 metal leaching factors are elevated or observed.
0.858 = 6 metal leaching factors are elevated or observed.
0.715 = 5 metal leaching factors are elevated or observed.
0.572 = 4 metal leaching factors are elevated or observed.
0.429 = 3 metal leaching factors are elevated or observed.
0.286 = 2 metal leaching factors are elevated or observed.
0.143 = 1 metal leaching factors are elevated or observed.
0 = No metal leaching factors are elevated or observed.
Evaluation Type: Step
AML Database – DOC Divsion of Mine
Reclamation
45
Tier 2: Chemical Risk
Page 58 Tier 2 - Chemical Risk
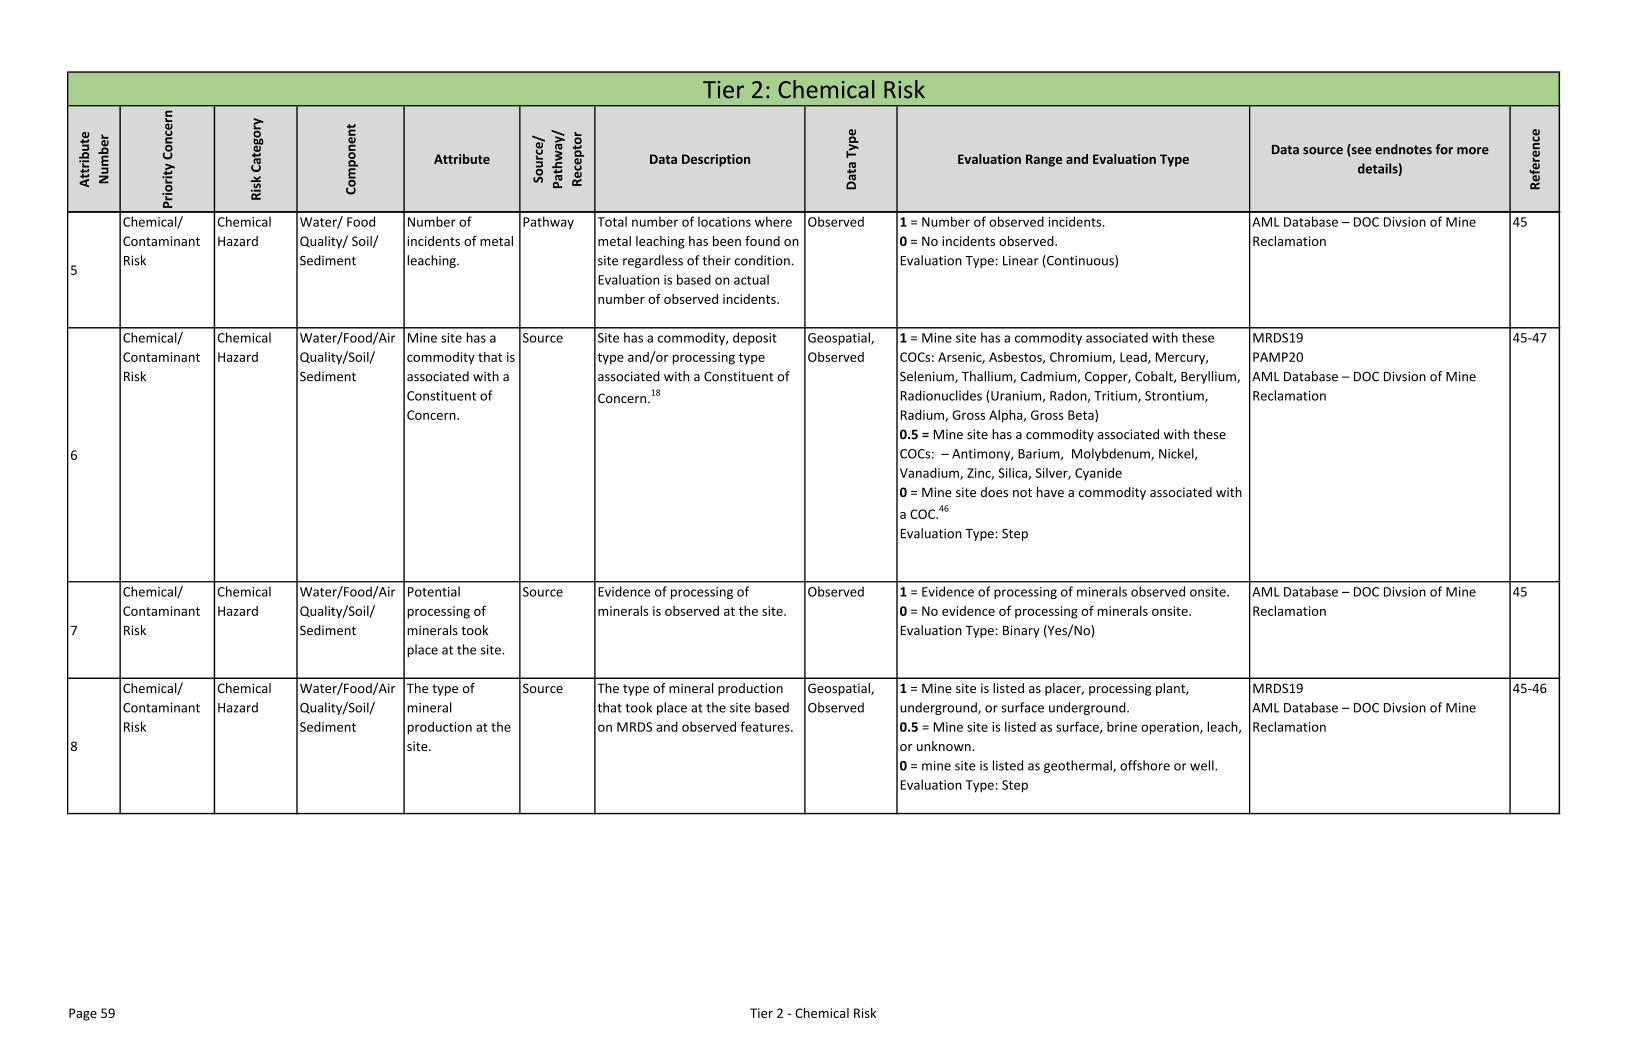
Att
rib
ute
Nu
mb
er
Pri
ori
ty C
on
cern
Ris
k C
ate
gory
Co
mp
on
ent
Attribute
Sou
rce/
Pat
hw
ay/
Re
cep
tor
Data Description
Dat
a T
ype
Evaluation Range and Evaluation TypeData source (see endnotes for more
details)
Re
fere
nce
Tier 2: Chemical Risk
5
Chemical/
Contaminant
Risk
Chemical
Hazard
Water/ Food
Quality/ Soil/
Sediment
Number of
incidents of metal
leaching.
Pathway Total number of locations where
metal leaching has been found on
site regardless of their condition.
Evaluation is based on actual
number of observed incidents.
Observed 1 = Number of observed incidents.
0 = No incidents observed.
Evaluation Type: Linear (Continuous)
AML Database – DOC Divsion of Mine
Reclamation
45
6
Chemical/
Contaminant
Risk
Chemical
Hazard
Water/Food/Air
Quality/Soil/
Sediment
Mine site has a
commodity that is
associated with a
Constituent of
Concern.
Source Site has a commodity, deposit
type and/or processing type
associated with a Constituent of
Concern.18
Geospatial,
Observed
1 = Mine site has a commodity associated with these
COCs: Arsenic, Asbestos, Chromium, Lead, Mercury,
Selenium, Thallium, Cadmium, Copper, Cobalt, Beryllium,
Radionuclides (Uranium, Radon, Tritium, Strontium,
Radium, Gross Alpha, Gross Beta)
0.5 = Mine site has a commodity associated with these
COCs: – Antimony, Barium, Molybdenum, Nickel,
Vanadium, Zinc, Silica, Silver, Cyanide
0 = Mine site does not have a commodity associated with
a COC.46
Evaluation Type: Step
MRDS19
PAMP20
AML Database – DOC Divsion of Mine
Reclamation
45-47
7
Chemical/
Contaminant
Risk
Chemical
Hazard
Water/Food/Air
Quality/Soil/
Sediment
Potential
processing of
minerals took
place at the site.
Source Evidence of processing of
minerals is observed at the site.
Observed 1 = Evidence of processing of minerals observed onsite.
0 = No evidence of processing of minerals onsite.
Evaluation Type: Binary (Yes/No)
AML Database – DOC Divsion of Mine
Reclamation
45
8
Chemical/
Contaminant
Risk
Chemical
Hazard
Water/Food/Air
Quality/Soil/
Sediment
The type of
mineral
production at the
site.
Source The type of mineral production
that took place at the site based
on MRDS and observed features.
Geospatial,
Observed
1 = Mine site is listed as placer, processing plant,
underground, or surface underground.
0.5 = Mine site is listed as surface, brine operation, leach,
or unknown.
0 = mine site is listed as geothermal, offshore or well.
Evaluation Type: Step
MRDS19
AML Database – DOC Divsion of Mine
Reclamation
45-46
Page 59 Tier 2 - Chemical Risk
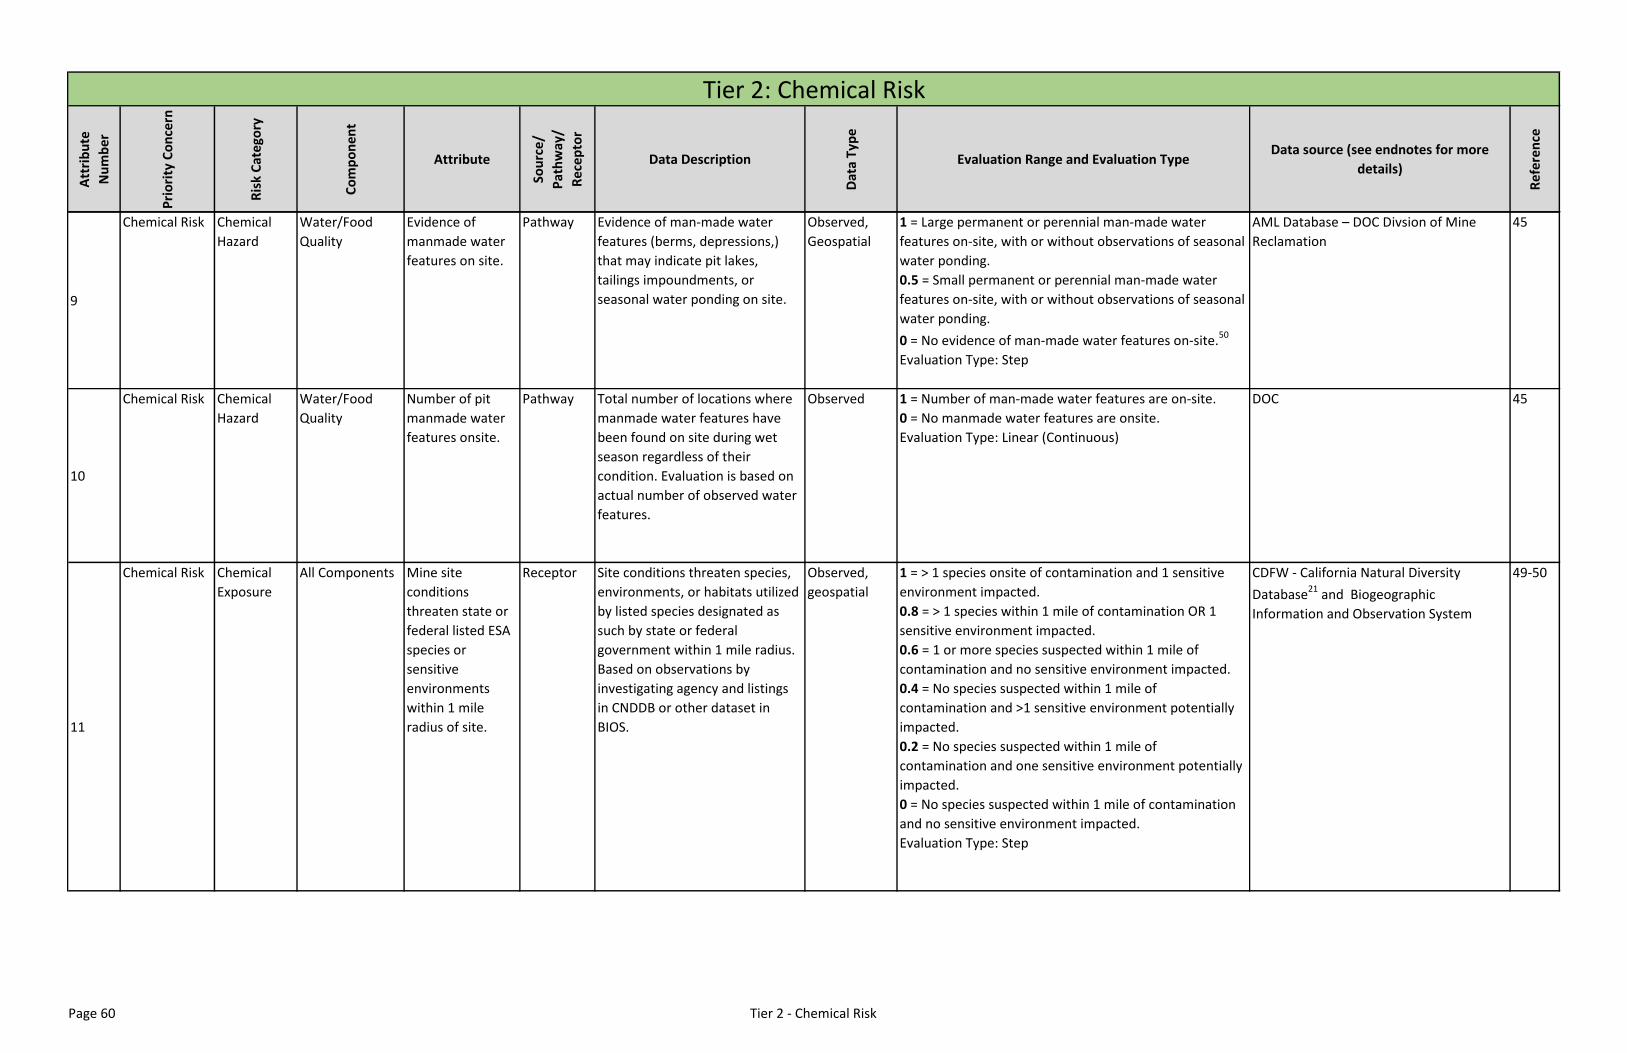
Att
rib
ute
Nu
mb
er
Pri
ori
ty C
on
cern
Ris
k C
ate
gory
Co
mp
on
ent
Attribute
Sou
rce/
Pat
hw
ay/
Re
cep
tor
Data Description
Dat
a T
ype
Evaluation Range and Evaluation TypeData source (see endnotes for more
details)
Re
fere
nce
Tier 2: Chemical Risk
9
Chemical Risk Chemical
Hazard
Water/Food
Quality
Evidence of
manmade water
features on site.
Pathway Evidence of man-made water
features (berms, depressions,)
that may indicate pit lakes,
tailings impoundments, or
seasonal water ponding on site.
Observed,
Geospatial
1 = Large permanent or perennial man-made water
features on-site, with or without observations of seasonal
water ponding.
0.5 = Small permanent or perennial man-made water
features on-site, with or without observations of seasonal
water ponding.
0 = No evidence of man-made water features on-site.50
Evaluation Type: Step
AML Database – DOC Divsion of Mine
Reclamation
45
10
Chemical Risk Chemical
Hazard
Water/Food
Quality
Number of pit
manmade water
features onsite.
Pathway Total number of locations where
manmade water features have
been found on site during wet
season regardless of their
condition. Evaluation is based on
actual number of observed water
features.
Observed 1 = Number of man-made water features are on-site.
0 = No manmade water features are onsite.
Evaluation Type: Linear (Continuous)
DOC 45
11
Chemical Risk Chemical
Exposure
All Components Mine site
conditions
threaten state or
federal listed ESA
species or
sensitive
environments
within 1 mile
radius of site.
Receptor Site conditions threaten species,
environments, or habitats utilized
by listed species designated as
such by state or federal
government within 1 mile radius.
Based on observations by
investigating agency and listings
in CNDDB or other dataset in
BIOS.
Observed,
geospatial
1 = > 1 species onsite of contamination and 1 sensitive
environment impacted.
0.8 = > 1 species within 1 mile of contamination OR 1
sensitive environment impacted.
0.6 = 1 or more species suspected within 1 mile of
contamination and no sensitive environment impacted.
0.4 = No species suspected within 1 mile of
contamination and >1 sensitive environment potentially
impacted.
0.2 = No species suspected within 1 mile of
contamination and one sensitive environment potentially
impacted.
0 = No species suspected within 1 mile of contamination
and no sensitive environment impacted.
Evaluation Type: Step
CDFW - California Natural Diversity
Database21
and Biogeographic
Information and Observation System
49-50
Page 60 Tier 2 - Chemical Risk
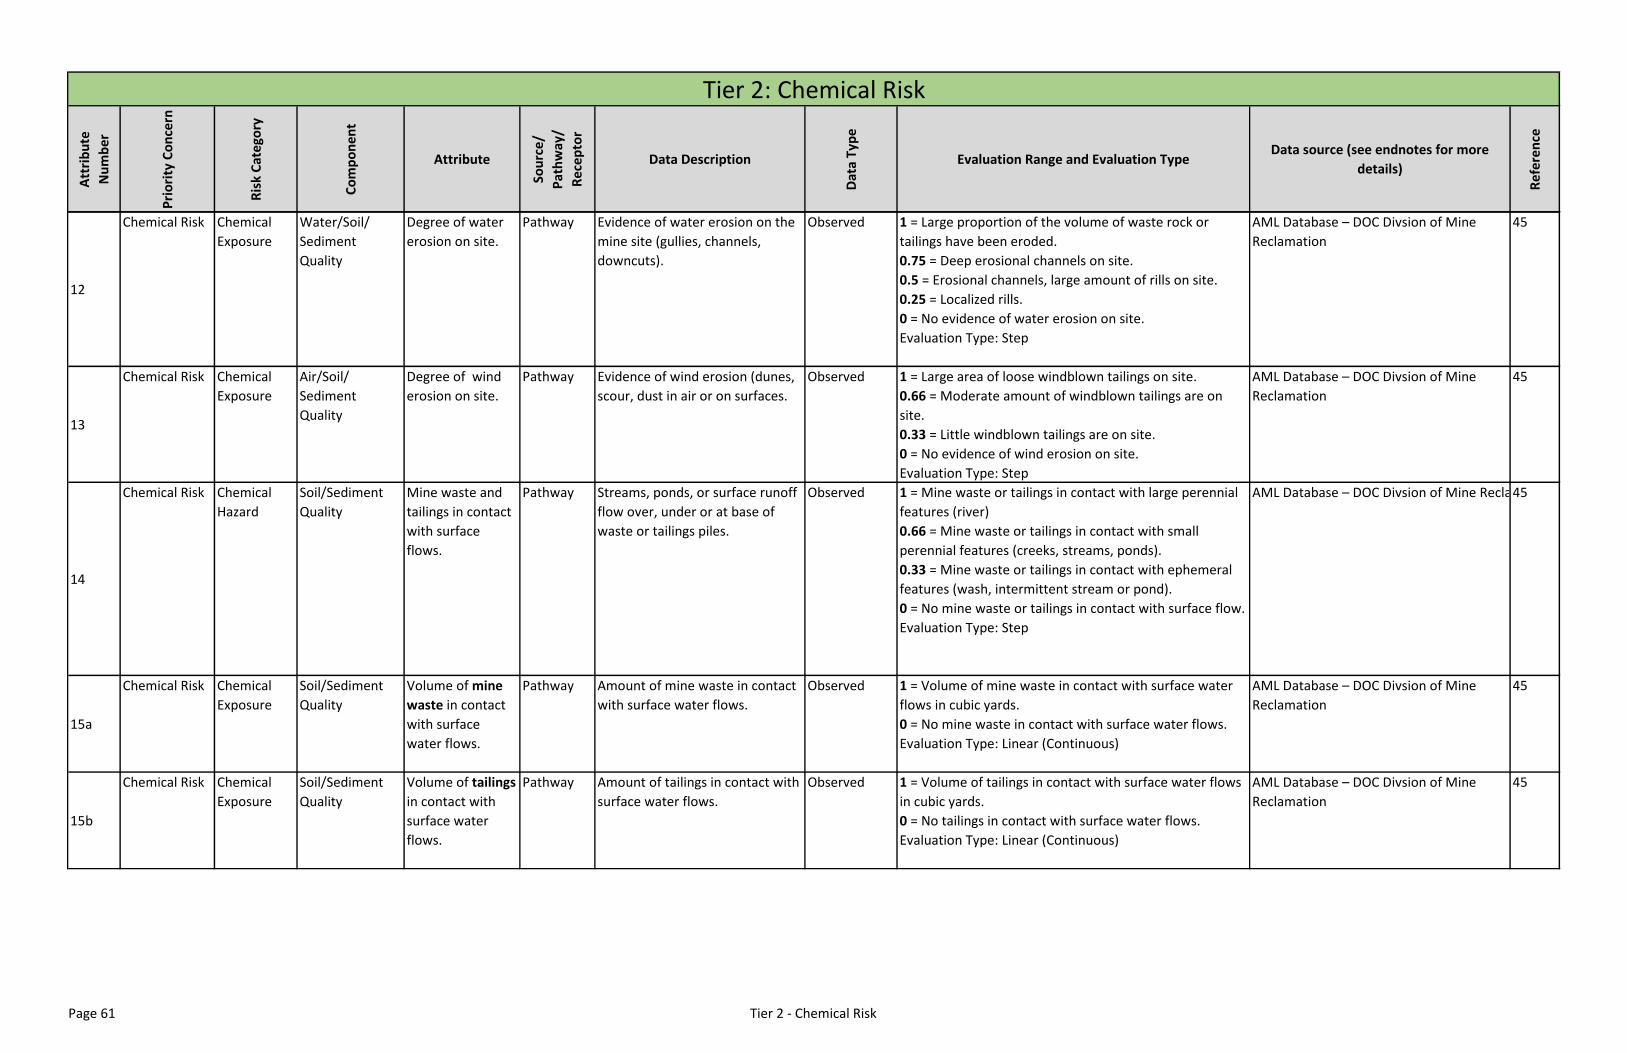
Att
rib
ute
Nu
mb
er
Pri
ori
ty C
on
cern
Ris
k C
ate
gory
Co
mp
on
ent
Attribute
Sou
rce/
Pat
hw
ay/
Re
cep
tor
Data Description
Dat
a T
ype
Evaluation Range and Evaluation TypeData source (see endnotes for more
details)
Re
fere
nce
Tier 2: Chemical Risk
12
Chemical Risk Chemical
Exposure
Water/Soil/
Sediment
Quality
Degree of water
erosion on site.
Pathway Evidence of water erosion on the
mine site (gullies, channels,
downcuts).
Observed 1 = Large proportion of the volume of waste rock or
tailings have been eroded.
0.75 = Deep erosional channels on site.
0.5 = Erosional channels, large amount of rills on site.
0.25 = Localized rills.
0 = No evidence of water erosion on site.
Evaluation Type: Step
AML Database – DOC Divsion of Mine
Reclamation
45
13
Chemical Risk Chemical
Exposure
Air/Soil/
Sediment
Quality
Degree of wind
erosion on site.
Pathway Evidence of wind erosion (dunes,
scour, dust in air or on surfaces.
Observed 1 = Large area of loose windblown tailings on site.
0.66 = Moderate amount of windblown tailings are on
site.
0.33 = Little windblown tailings are on site.
0 = No evidence of wind erosion on site.
Evaluation Type: Step
AML Database – DOC Divsion of Mine
Reclamation
45
14
Chemical Risk Chemical
Hazard
Soil/Sediment
Quality
Mine waste and
tailings in contact
with surface
flows.
Pathway Streams, ponds, or surface runoff
flow over, under or at base of
waste or tailings piles.
Observed 1 = Mine waste or tailings in contact with large perennial
features (river)
0.66 = Mine waste or tailings in contact with small
perennial features (creeks, streams, ponds).
0.33 = Mine waste or tailings in contact with ephemeral
features (wash, intermittent stream or pond).
0 = No mine waste or tailings in contact with surface flow.
Evaluation Type: Step
AML Database – DOC Divsion of Mine Reclamation45
15a
Chemical Risk Chemical
Exposure
Soil/Sediment
Quality
Volume of mine
waste in contact
with surface
water flows.
Pathway Amount of mine waste in contact
with surface water flows.
Observed 1 = Volume of mine waste in contact with surface water
flows in cubic yards.
0 = No mine waste in contact with surface water flows.
Evaluation Type: Linear (Continuous)
AML Database – DOC Divsion of Mine
Reclamation
45
15b
Chemical Risk Chemical
Exposure
Soil/Sediment
Quality
Volume of tailings
in contact with
surface water
flows.
Pathway Amount of tailings in contact with
surface water flows.
Observed 1 = Volume of tailings in contact with surface water flows
in cubic yards.
0 = No tailings in contact with surface water flows.
Evaluation Type: Linear (Continuous)
AML Database – DOC Divsion of Mine
Reclamation
45
Page 61 Tier 2 - Chemical Risk
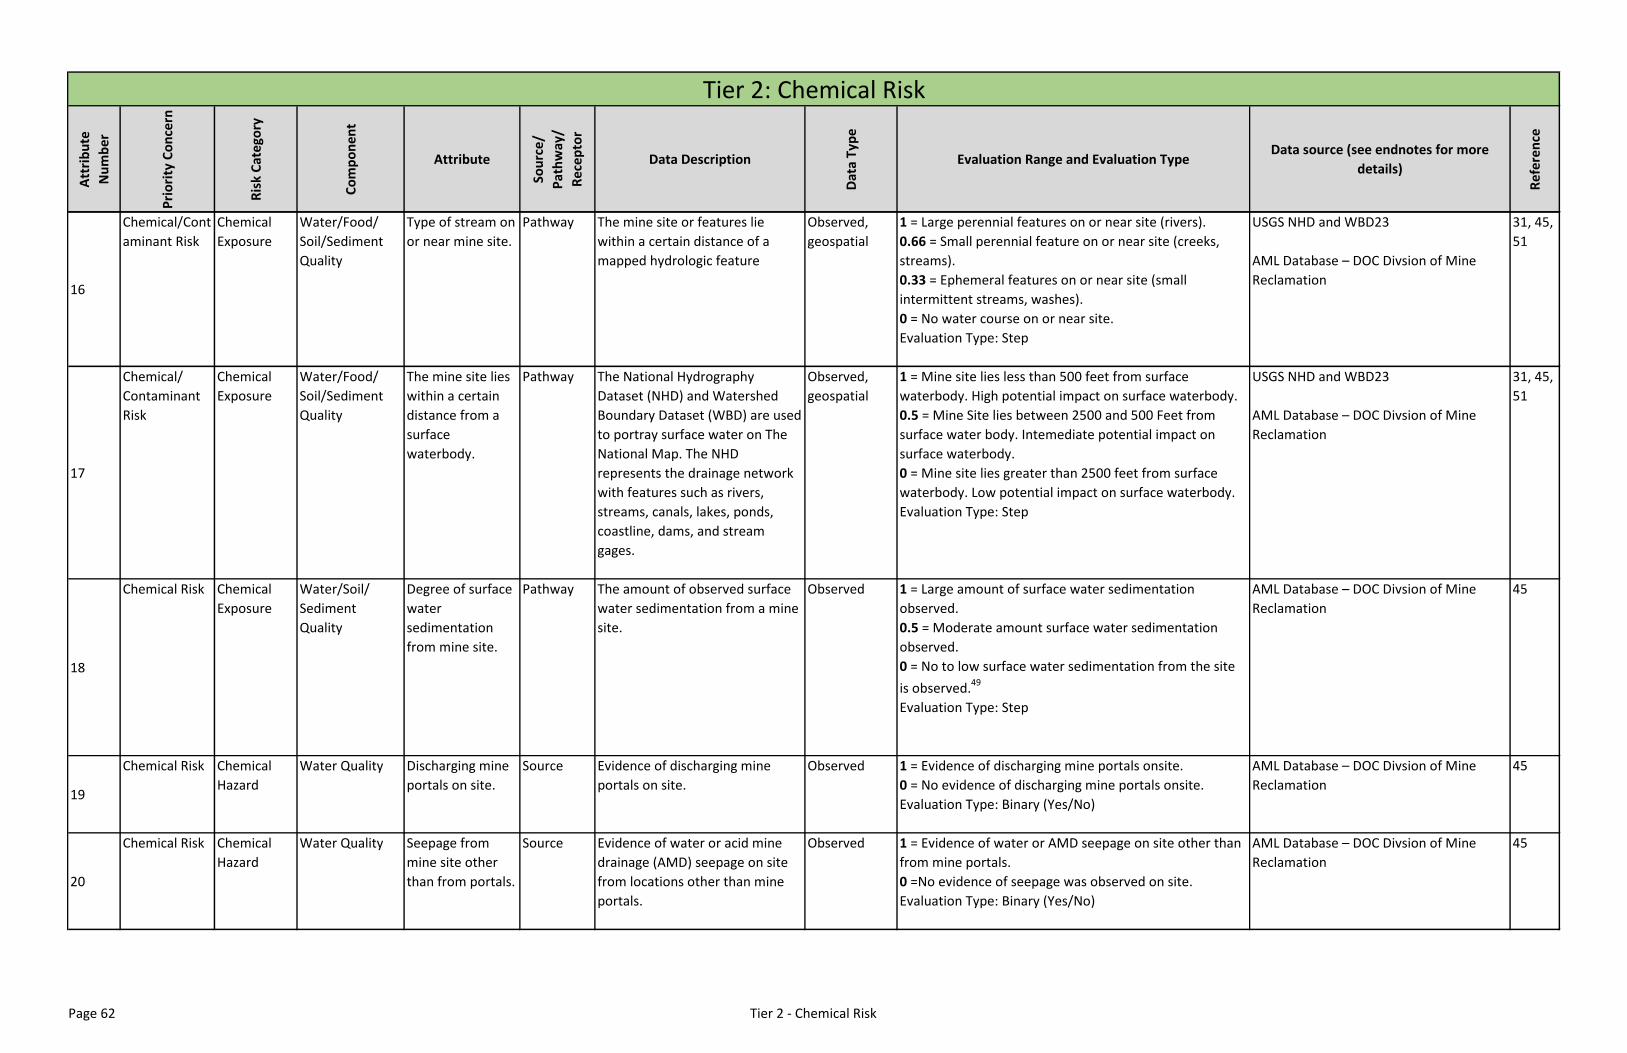
Att
rib
ute
Nu
mb
er
Pri
ori
ty C
on
cern
Ris
k C
ate
gory
Co
mp
on
ent
Attribute
Sou
rce/
Pat
hw
ay/
Re
cep
tor
Data Description
Dat
a T
ype
Evaluation Range and Evaluation TypeData source (see endnotes for more
details)
Re
fere
nce
Tier 2: Chemical Risk
16
Chemical/Cont
aminant Risk
Chemical
Exposure
Water/Food/
Soil/Sediment
Quality
Type of stream on
or near mine site.
Pathway The mine site or features lie
within a certain distance of a
mapped hydrologic feature
Observed,
geospatial
1 = Large perennial features on or near site (rivers).
0.66 = Small perennial feature on or near site (creeks,
streams).
0.33 = Ephemeral features on or near site (small
intermittent streams, washes).
0 = No water course on or near site.
Evaluation Type: Step
USGS NHD and WBD23
AML Database – DOC Divsion of Mine
Reclamation
31, 45,
51
17
Chemical/
Contaminant
Risk
Chemical
Exposure
Water/Food/
Soil/Sediment
Quality
The mine site lies
within a certain
distance from a
surface
waterbody.
Pathway The National Hydrography
Dataset (NHD) and Watershed
Boundary Dataset (WBD) are used
to portray surface water on The
National Map. The NHD
represents the drainage network
with features such as rivers,
streams, canals, lakes, ponds,
coastline, dams, and stream
gages.
Observed,
geospatial
1 = Mine site lies less than 500 feet from surface
waterbody. High potential impact on surface waterbody.
0.5 = Mine Site lies between 2500 and 500 Feet from
surface water body. Intemediate potential impact on
surface waterbody.
0 = Mine site lies greater than 2500 feet from surface
waterbody. Low potential impact on surface waterbody.
Evaluation Type: Step
USGS NHD and WBD23
AML Database – DOC Divsion of Mine
Reclamation
31, 45,
51
18
Chemical Risk Chemical
Exposure
Water/Soil/
Sediment
Quality
Degree of surface
water
sedimentation
from mine site.
Pathway The amount of observed surface
water sedimentation from a mine
site.
Observed 1 = Large amount of surface water sedimentation
observed.
0.5 = Moderate amount surface water sedimentation
observed.
0 = No to low surface water sedimentation from the site
is observed.49
Evaluation Type: Step
AML Database – DOC Divsion of Mine
Reclamation
45
19
Chemical Risk Chemical
Hazard
Water Quality Discharging mine
portals on site.
Source Evidence of discharging mine
portals on site.
Observed 1 = Evidence of discharging mine portals onsite.
0 = No evidence of discharging mine portals onsite.
Evaluation Type: Binary (Yes/No)
AML Database – DOC Divsion of Mine
Reclamation
45
20
Chemical Risk Chemical
Hazard
Water Quality Seepage from
mine site other
than from portals.
Source Evidence of water or acid mine
drainage (AMD) seepage on site
from locations other than mine
portals.
Observed 1 = Evidence of water or AMD seepage on site other than
from mine portals.
0 =No evidence of seepage was observed on site.
Evaluation Type: Binary (Yes/No)
AML Database – DOC Divsion of Mine
Reclamation
45
Page 62 Tier 2 - Chemical Risk
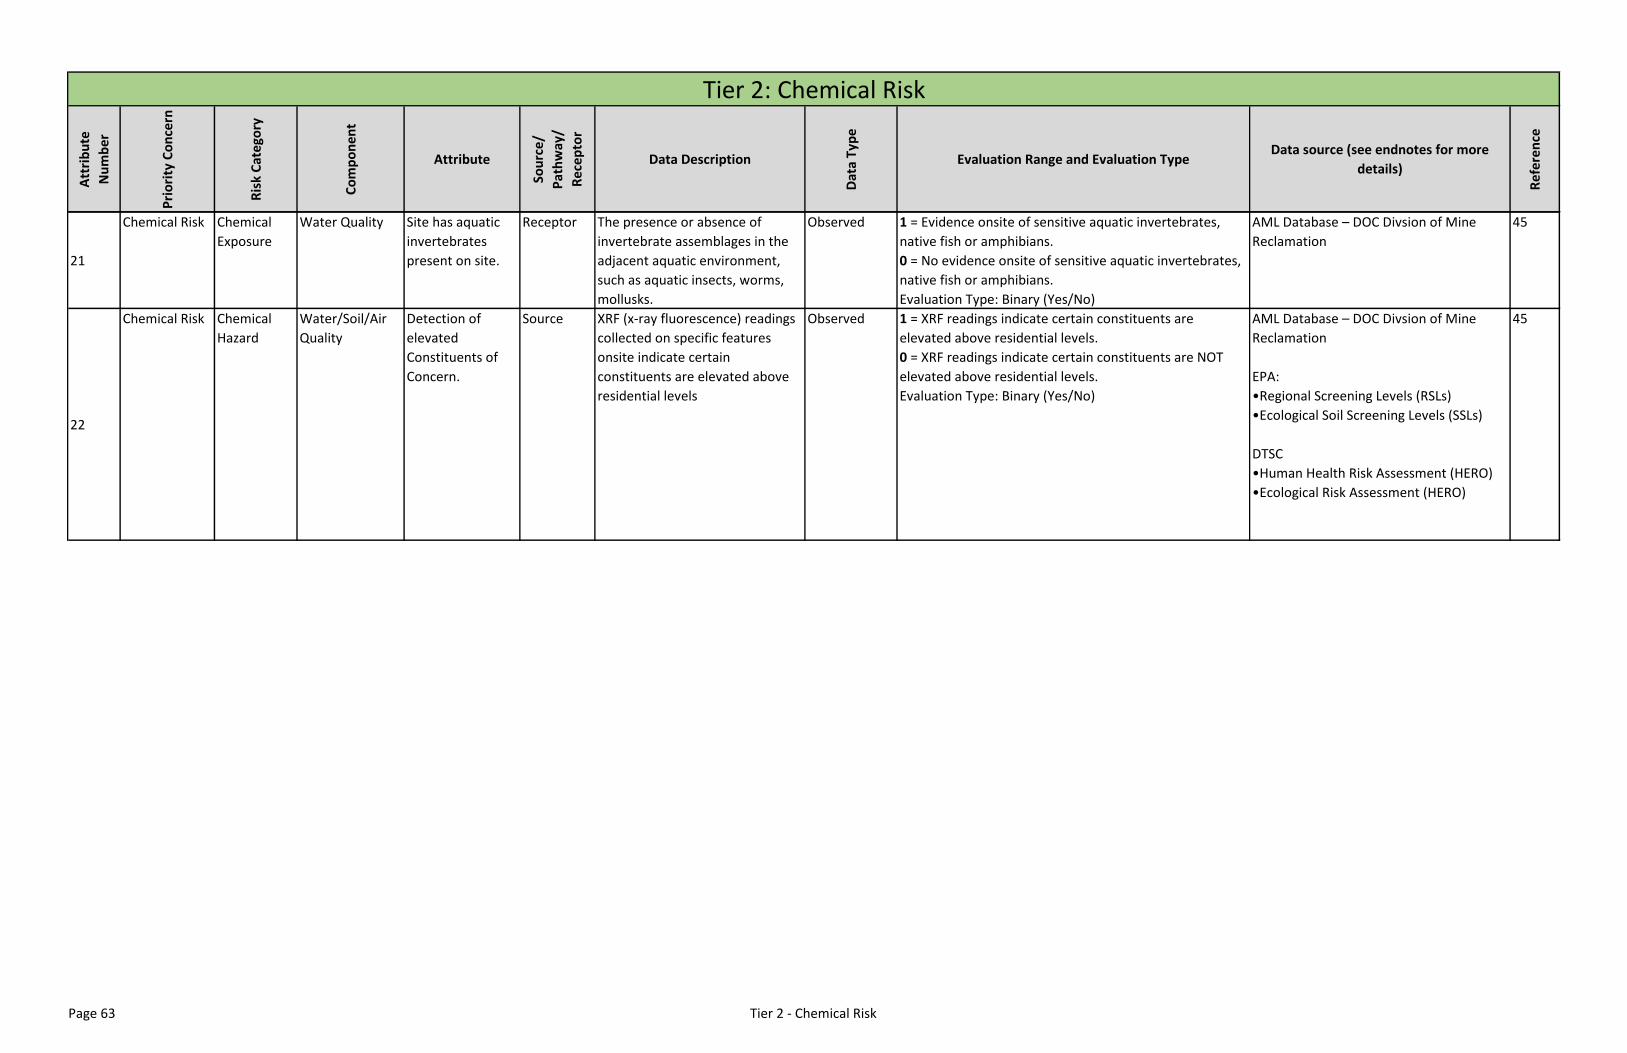
Att
rib
ute
Nu
mb
er
Pri
ori
ty C
on
cern
Ris
k C
ate
gory
Co
mp
on
ent
Attribute
Sou
rce/
Pat
hw
ay/
Re
cep
tor
Data Description
Dat
a T
ype
Evaluation Range and Evaluation TypeData source (see endnotes for more
details)
Re
fere
nce
Tier 2: Chemical Risk
21
Chemical Risk Chemical
Exposure
Water Quality Site has aquatic
invertebrates
present on site.
Receptor The presence or absence of
invertebrate assemblages in the
adjacent aquatic environment,
such as aquatic insects, worms,
mollusks.
Observed 1 = Evidence onsite of sensitive aquatic invertebrates,
native fish or amphibians.
0 = No evidence onsite of sensitive aquatic invertebrates,
native fish or amphibians.
Evaluation Type: Binary (Yes/No)
AML Database – DOC Divsion of Mine
Reclamation
45
22
Chemical Risk Chemical
Hazard
Water/Soil/Air
Quality
Detection of
elevated
Constituents of
Concern.
Source XRF (x-ray fluorescence) readings
collected on specific features
onsite indicate certain
constituents are elevated above
residential levels
Observed 1 = XRF readings indicate certain constituents are
elevated above residential levels.
0 = XRF readings indicate certain constituents are NOT
elevated above residential levels.
Evaluation Type: Binary (Yes/No)
AML Database – DOC Divsion of Mine
Reclamation
EPA:
•Regional Screening Levels (RSLs)
•Ecological Soil Screening Levels (SSLs)
DTSC
•Human Health Risk Assessment (HERO)
•Ecological Risk Assessment (HERO)
45
Page 63 Tier 2 - Chemical Risk
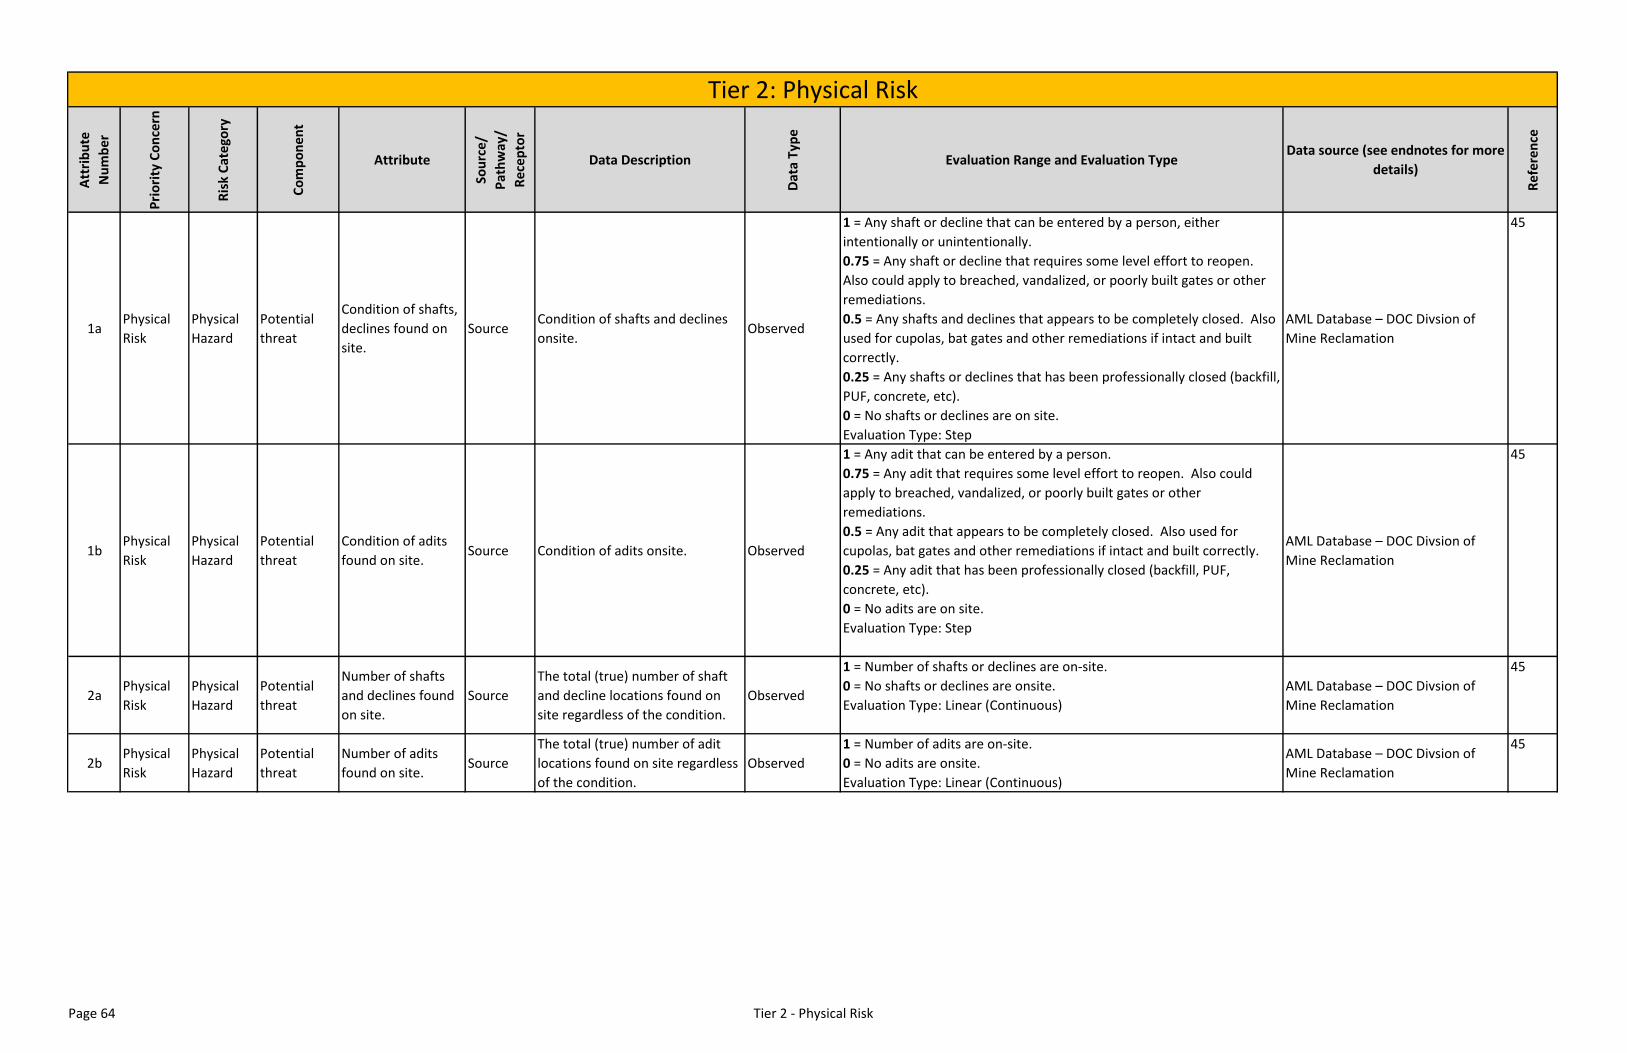
Att
rib
ute
Nu
mb
er
Pri
ori
ty C
on
cern
Ris
k C
ate
gory
Co
mp
on
ent
Attribute
Sou
rce/
Pat
hw
ay/
Re
cep
tor
Data Description
Dat
a T
ype
Evaluation Range and Evaluation TypeData source (see endnotes for more
details)
Re
fere
nce
1aPhysical
Risk
Physical
Hazard
Potential
threat
Condition of shafts,
declines found on
site.
SourceCondition of shafts and declines
onsite.Observed
1 = Any shaft or decline that can be entered by a person, either
intentionally or unintentionally.
0.75 = Any shaft or decline that requires some level effort to reopen.
Also could apply to breached, vandalized, or poorly built gates or other
remediations.
0.5 = Any shafts and declines that appears to be completely closed. Also
used for cupolas, bat gates and other remediations if intact and built
correctly.
0.25 = Any shafts or declines that has been professionally closed (backfill,
PUF, concrete, etc).
0 = No shafts or declines are on site.
Evaluation Type: Step
AML Database – DOC Divsion of
Mine Reclamation
45
1bPhysical
Risk
Physical
Hazard
Potential
threat
Condition of adits
found on site.Source Condition of adits onsite. Observed
1 = Any adit that can be entered by a person.
0.75 = Any adit that requires some level effort to reopen. Also could
apply to breached, vandalized, or poorly built gates or other
remediations.
0.5 = Any adit that appears to be completely closed. Also used for
cupolas, bat gates and other remediations if intact and built correctly.
0.25 = Any adit that has been professionally closed (backfill, PUF,
concrete, etc).
0 = No adits are on site.
Evaluation Type: Step
AML Database – DOC Divsion of
Mine Reclamation
45
2aPhysical
Risk
Physical
Hazard
Potential
threat
Number of shafts
and declines found
on site.
Source
The total (true) number of shaft
and decline locations found on
site regardless of the condition.
Observed
1 = Number of shafts or declines are on-site.
0 = No shafts or declines are onsite.
Evaluation Type: Linear (Continuous)
AML Database – DOC Divsion of
Mine Reclamation
45
2bPhysical
Risk
Physical
Hazard
Potential
threat
Number of adits
found on site.Source
The total (true) number of adit
locations found on site regardless
of the condition.
Observed
1 = Number of adits are on-site.
0 = No adits are onsite.
Evaluation Type: Linear (Continuous)
AML Database – DOC Divsion of
Mine Reclamation
45
Tier 2: Physical Risk
Page 64 Tier 2 - Physical Risk
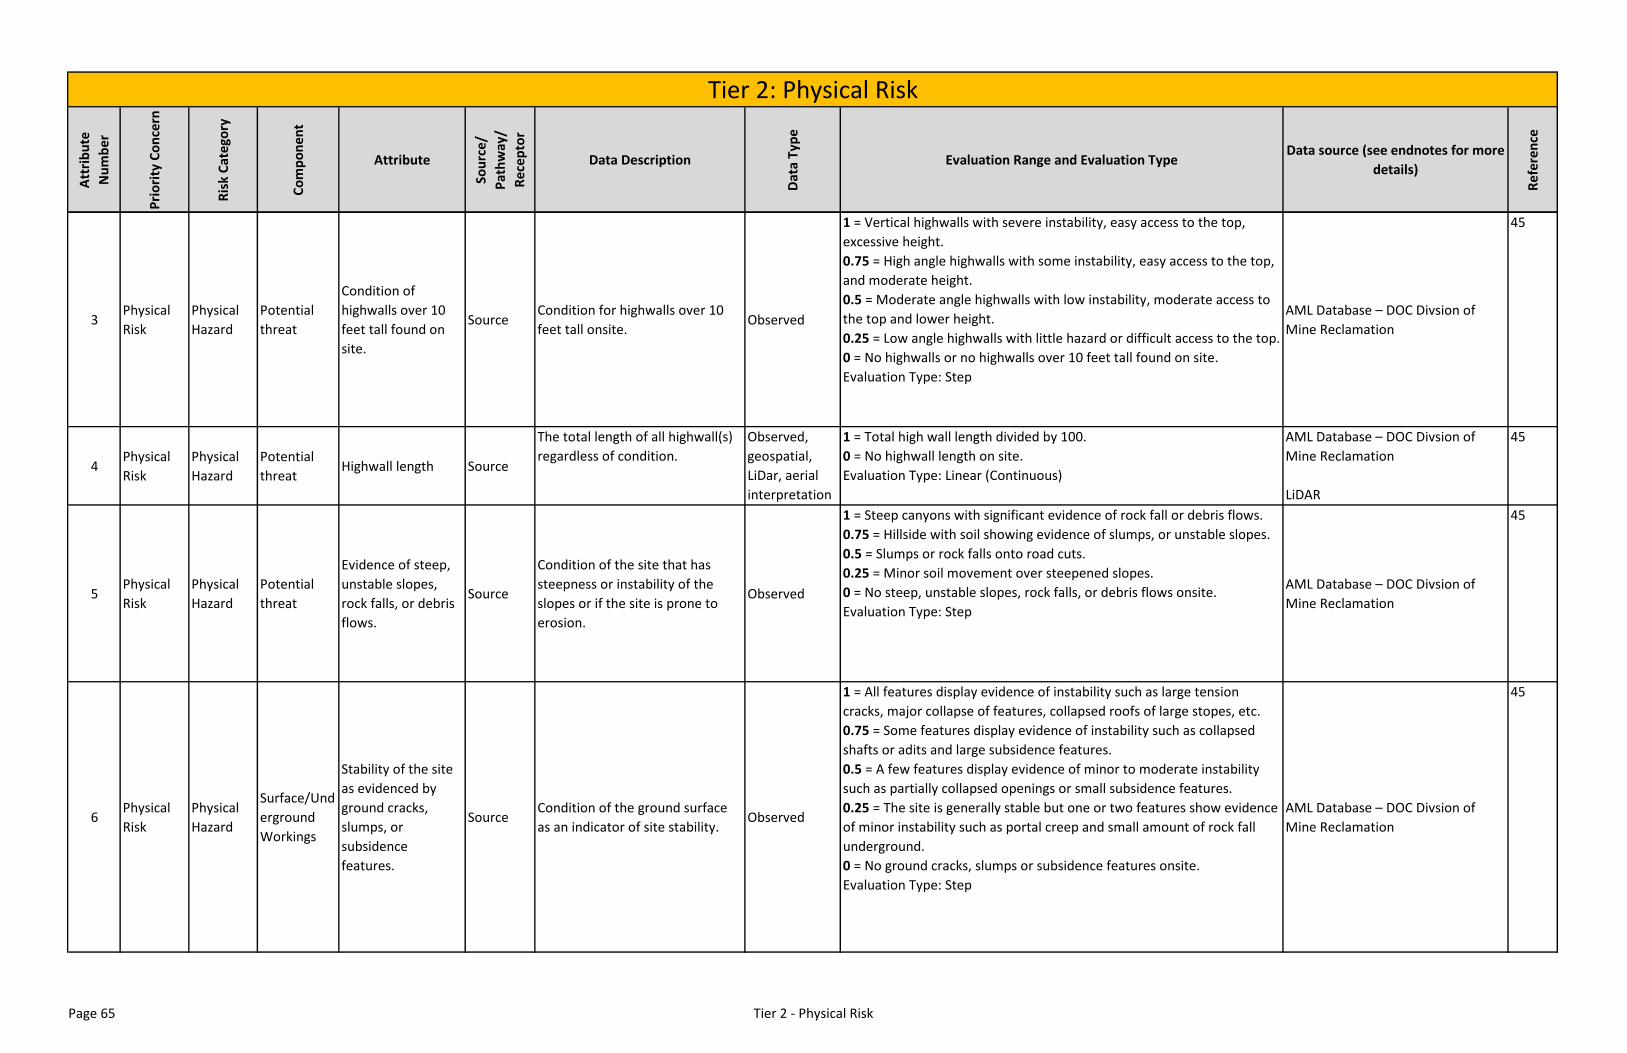
Att
rib
ute
Nu
mb
er
Pri
ori
ty C
on
cern
Ris
k C
ate
gory
Co
mp
on
ent
Attribute
Sou
rce/
Pat
hw
ay/
Re
cep
tor
Data Description
Dat
a T
ype
Evaluation Range and Evaluation TypeData source (see endnotes for more
details)
Re
fere
nce
Tier 2: Physical Risk
3Physical
Risk
Physical
Hazard
Potential
threat
Condition of
highwalls over 10
feet tall found on
site.
SourceCondition for highwalls over 10
feet tall onsite.Observed
1 = Vertical highwalls with severe instability, easy access to the top,
excessive height.
0.75 = High angle highwalls with some instability, easy access to the top,
and moderate height.
0.5 = Moderate angle highwalls with low instability, moderate access to
the top and lower height.
0.25 = Low angle highwalls with little hazard or difficult access to the top.
0 = No highwalls or no highwalls over 10 feet tall found on site.
Evaluation Type: Step
AML Database – DOC Divsion of
Mine Reclamation
45
4Physical
Risk
Physical
Hazard
Potential
threatHighwall length Source
The total length of all highwall(s)
regardless of condition.
Observed,
geospatial,
LiDar, aerial
interpretation
1 = Total high wall length divided by 100.
0 = No highwall length on site.
Evaluation Type: Linear (Continuous)
AML Database – DOC Divsion of
Mine Reclamation
LiDAR
45
5Physical
Risk
Physical
Hazard
Potential
threat
Evidence of steep,
unstable slopes,
rock falls, or debris
flows.
Source
Condition of the site that has
steepness or instability of the
slopes or if the site is prone to
erosion.
Observed
1 = Steep canyons with significant evidence of rock fall or debris flows.
0.75 = Hillside with soil showing evidence of slumps, or unstable slopes.
0.5 = Slumps or rock falls onto road cuts.
0.25 = Minor soil movement over steepened slopes.
0 = No steep, unstable slopes, rock falls, or debris flows onsite.
Evaluation Type: Step
AML Database – DOC Divsion of
Mine Reclamation
45
6Physical
Risk
Physical
Hazard
Surface/Und
erground
Workings
Stability of the site
as evidenced by
ground cracks,
slumps, or
subsidence
features.
SourceCondition of the ground surface
as an indicator of site stability.Observed
1 = All features display evidence of instability such as large tension
cracks, major collapse of features, collapsed roofs of large stopes, etc.
0.75 = Some features display evidence of instability such as collapsed
shafts or adits and large subsidence features.
0.5 = A few features display evidence of minor to moderate instability
such as partially collapsed openings or small subsidence features.
0.25 = The site is generally stable but one or two features show evidence
of minor instability such as portal creep and small amount of rock fall
underground.
0 = No ground cracks, slumps or subsidence features onsite.
Evaluation Type: Step
AML Database – DOC Divsion of
Mine Reclamation
45
Page 65 Tier 2 - Physical Risk
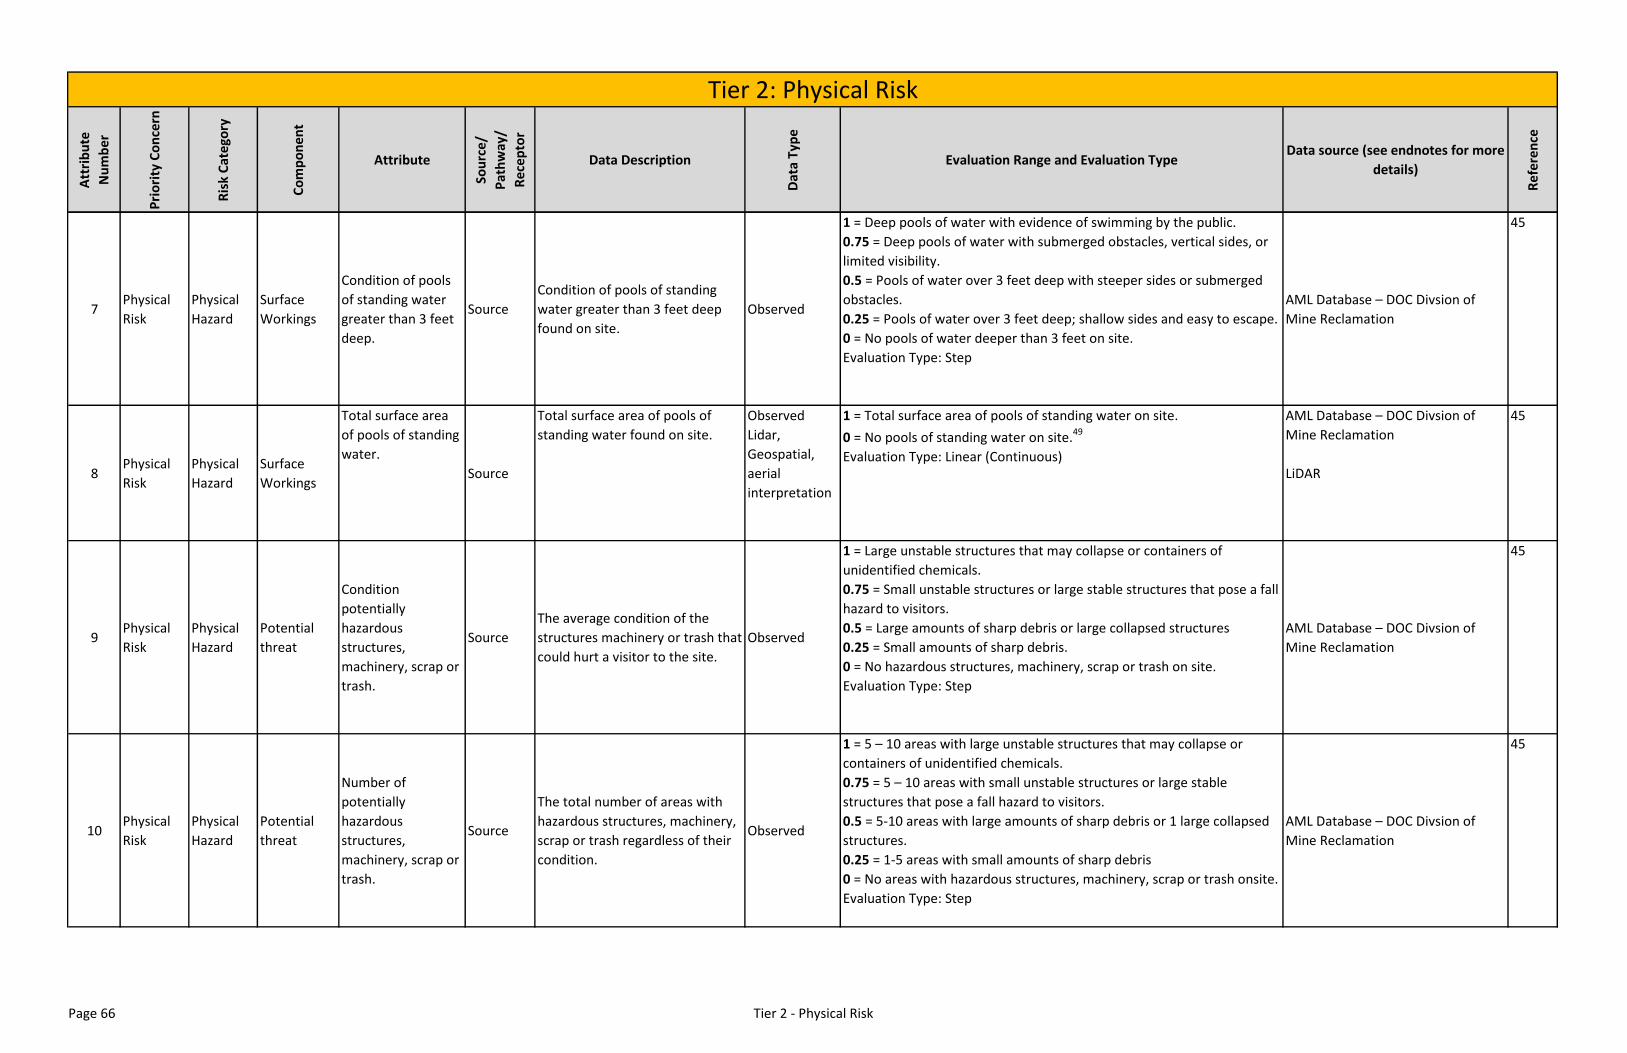
Att
rib
ute
Nu
mb
er
Pri
ori
ty C
on
cern
Ris
k C
ate
gory
Co
mp
on
ent
Attribute
Sou
rce/
Pat
hw
ay/
Re
cep
tor
Data Description
Dat
a T
ype
Evaluation Range and Evaluation TypeData source (see endnotes for more
details)
Re
fere
nce
Tier 2: Physical Risk
7Physical
Risk
Physical
Hazard
Surface
Workings
Condition of pools
of standing water
greater than 3 feet
deep.
Source
Condition of pools of standing
water greater than 3 feet deep
found on site.
Observed
1 = Deep pools of water with evidence of swimming by the public.
0.75 = Deep pools of water with submerged obstacles, vertical sides, or
limited visibility.
0.5 = Pools of water over 3 feet deep with steeper sides or submerged
obstacles.
0.25 = Pools of water over 3 feet deep; shallow sides and easy to escape.
0 = No pools of water deeper than 3 feet on site.
Evaluation Type: Step
AML Database – DOC Divsion of
Mine Reclamation
45
8Physical
Risk
Physical
Hazard
Surface
Workings
Total surface area
of pools of standing
water.
Source
Total surface area of pools of
standing water found on site.
Observed
Lidar,
Geospatial,
aerial
interpretation
1 = Total surface area of pools of standing water on site.
0 = No pools of standing water on site.49
Evaluation Type: Linear (Continuous)
AML Database – DOC Divsion of
Mine Reclamation
LiDAR
45
9Physical
Risk
Physical
Hazard
Potential
threat
Condition
potentially
hazardous
structures,
machinery, scrap or
trash.
Source
The average condition of the
structures machinery or trash that
could hurt a visitor to the site.
Observed
1 = Large unstable structures that may collapse or containers of
unidentified chemicals.
0.75 = Small unstable structures or large stable structures that pose a fall
hazard to visitors.
0.5 = Large amounts of sharp debris or large collapsed structures
0.25 = Small amounts of sharp debris.
0 = No hazardous structures, machinery, scrap or trash on site.
Evaluation Type: Step
AML Database – DOC Divsion of
Mine Reclamation
45
10Physical
Risk
Physical
Hazard
Potential
threat
Number of
potentially
hazardous
structures,
machinery, scrap or
trash.
Source
The total number of areas with
hazardous structures, machinery,
scrap or trash regardless of their
condition.
Observed
1 = 5 – 10 areas with large unstable structures that may collapse or
containers of unidentified chemicals.
0.75 = 5 – 10 areas with small unstable structures or large stable
structures that pose a fall hazard to visitors.
0.5 = 5-10 areas with large amounts of sharp debris or 1 large collapsed
structures.
0.25 = 1-5 areas with small amounts of sharp debris
0 = No areas with hazardous structures, machinery, scrap or trash onsite.
Evaluation Type: Step
AML Database – DOC Divsion of
Mine Reclamation
45
Page 66 Tier 2 - Physical Risk

California Abandoned Mines Prioritization Tool April 27, 2017 Page | 67 Appendix 6 Tier 3 Attributes and Evaluation Ranges
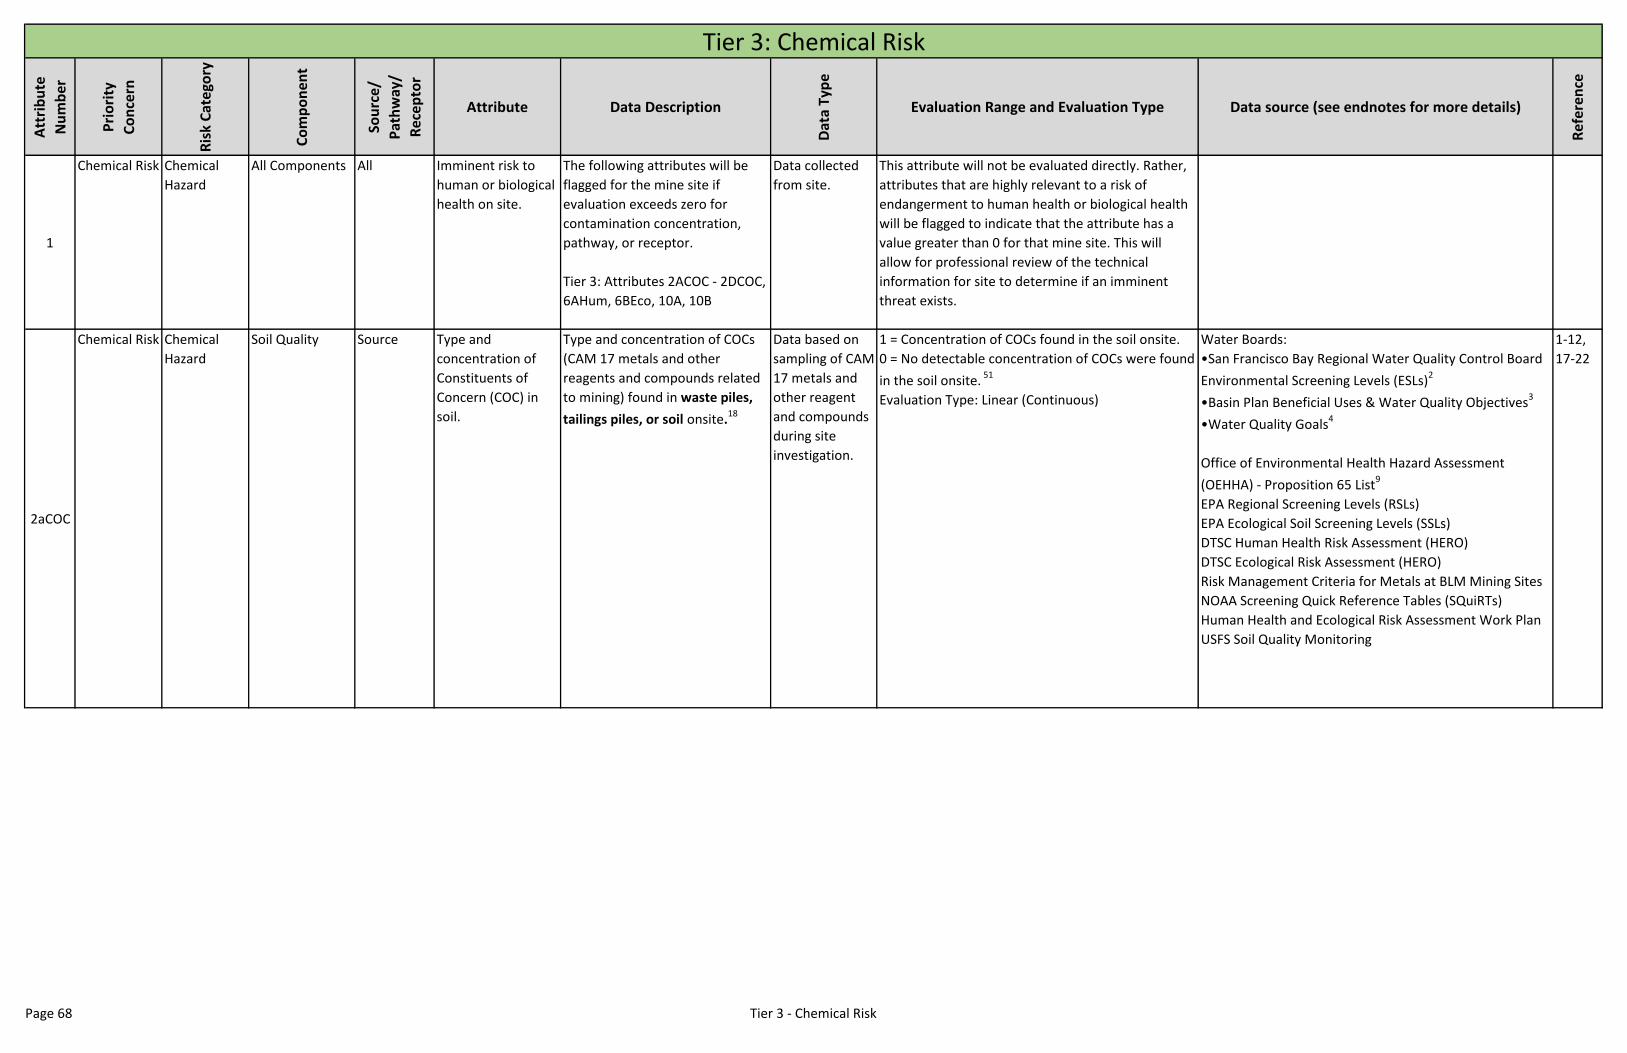
Att
rib
ute
Nu
mb
er
Pri
ori
ty
Co
nce
rn
Ris
k C
ate
gory
Co
mp
on
ent
Sou
rce
/
Pat
hw
ay/
Rec
ep
tor
Attribute Data Description
Dat
a Ty
pe
Evaluation Range and Evaluation Type Data source (see endnotes for more details)
Ref
eren
ce
1
Chemical Risk Chemical
Hazard
All Components All Imminent risk to
human or biological
health on site.
The following attributes will be
flagged for the mine site if
evaluation exceeds zero for
contamination concentration,
pathway, or receptor.
Tier 3: Attributes 2ACOC - 2DCOC,
6AHum, 6BEco, 10A, 10B
Data collected
from site.
This attribute will not be evaluated directly. Rather,
attributes that are highly relevant to a risk of
endangerment to human health or biological health
will be flagged to indicate that the attribute has a
value greater than 0 for that mine site. This will
allow for professional review of the technical
information for site to determine if an imminent
threat exists.
2aCOC
Chemical Risk Chemical
Hazard
Soil Quality Source Type and
concentration of
Constituents of
Concern (COC) in
soil.
Type and concentration of COCs
(CAM 17 metals and other
reagents and compounds related
to mining) found in waste piles,
tailings piles, or soil onsite.18
Data based on
sampling of CAM
17 metals and
other reagent
and compounds
during site
investigation.
1 = Concentration of COCs found in the soil onsite.
0 = No detectable concentration of COCs were found
in the soil onsite. 51
Evaluation Type: Linear (Continuous)
Water Boards:
•San Francisco Bay Regional Water Quality Control Board
Environmental Screening Levels (ESLs)2
•Basin Plan Beneficial Uses & Water Quality Objectives3
•Water Quality Goals4
Office of Environmental Health Hazard Assessment
(OEHHA) - Proposition 65 List9
EPA Regional Screening Levels (RSLs)
EPA Ecological Soil Screening Levels (SSLs)
DTSC Human Health Risk Assessment (HERO)
DTSC Ecological Risk Assessment (HERO)
Risk Management Criteria for Metals at BLM Mining Sites
NOAA Screening Quick Reference Tables (SQuiRTs)
Human Health and Ecological Risk Assessment Work Plan
USFS Soil Quality Monitoring
1-12,
17-22
Tier 3: Chemical Risk
Page 68 Tier 3 - Chemical Risk
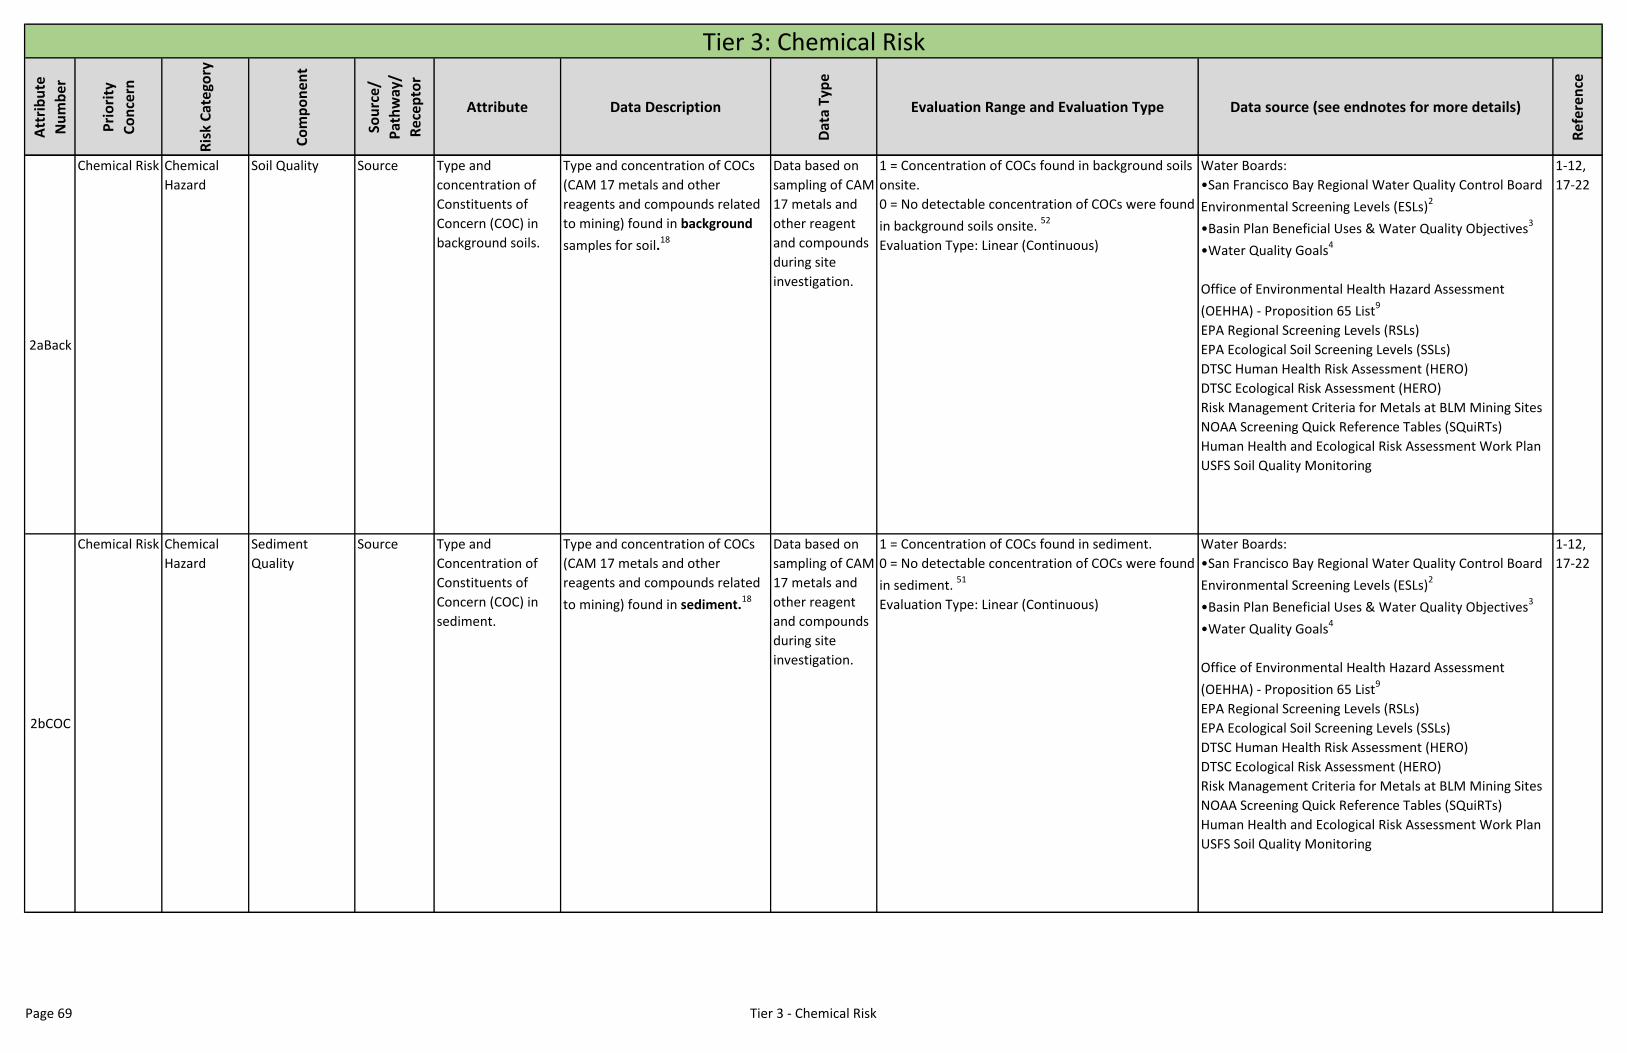
Att
rib
ute
Nu
mb
er
Pri
ori
ty
Co
nce
rn
Ris
k C
ate
gory
Co
mp
on
ent
Sou
rce
/
Pat
hw
ay/
Rec
ep
tor
Attribute Data Description
Dat
a Ty
pe
Evaluation Range and Evaluation Type Data source (see endnotes for more details)
Ref
eren
ce
Tier 3: Chemical Risk
2aBack
Chemical Risk Chemical
Hazard
Soil Quality Source Type and
concentration of
Constituents of
Concern (COC) in
background soils.
Type and concentration of COCs
(CAM 17 metals and other
reagents and compounds related
to mining) found in background
samples for soil.18
Data based on
sampling of CAM
17 metals and
other reagent
and compounds
during site
investigation.
1 = Concentration of COCs found in background soils
onsite.
0 = No detectable concentration of COCs were found
in background soils onsite. 52
Evaluation Type: Linear (Continuous)
Water Boards:
•San Francisco Bay Regional Water Quality Control Board
Environmental Screening Levels (ESLs)2
•Basin Plan Beneficial Uses & Water Quality Objectives3
•Water Quality Goals4
Office of Environmental Health Hazard Assessment
(OEHHA) - Proposition 65 List9
EPA Regional Screening Levels (RSLs)
EPA Ecological Soil Screening Levels (SSLs)
DTSC Human Health Risk Assessment (HERO)
DTSC Ecological Risk Assessment (HERO)
Risk Management Criteria for Metals at BLM Mining Sites
NOAA Screening Quick Reference Tables (SQuiRTs)
Human Health and Ecological Risk Assessment Work Plan
USFS Soil Quality Monitoring
1-12,
17-22
2bCOC
Chemical Risk Chemical
Hazard
Sediment
Quality
Source Type and
Concentration of
Constituents of
Concern (COC) in
sediment.
Type and concentration of COCs
(CAM 17 metals and other
reagents and compounds related
to mining) found in sediment.18
Data based on
sampling of CAM
17 metals and
other reagent
and compounds
during site
investigation.
1 = Concentration of COCs found in sediment.
0 = No detectable concentration of COCs were found
in sediment. 51
Evaluation Type: Linear (Continuous)
Water Boards:
•San Francisco Bay Regional Water Quality Control Board
Environmental Screening Levels (ESLs)2
•Basin Plan Beneficial Uses & Water Quality Objectives3
•Water Quality Goals4
Office of Environmental Health Hazard Assessment
(OEHHA) - Proposition 65 List9
EPA Regional Screening Levels (RSLs)
EPA Ecological Soil Screening Levels (SSLs)
DTSC Human Health Risk Assessment (HERO)
DTSC Ecological Risk Assessment (HERO)
Risk Management Criteria for Metals at BLM Mining Sites
NOAA Screening Quick Reference Tables (SQuiRTs)
Human Health and Ecological Risk Assessment Work Plan
USFS Soil Quality Monitoring
1-12,
17-22
Page 69 Tier 3 - Chemical Risk
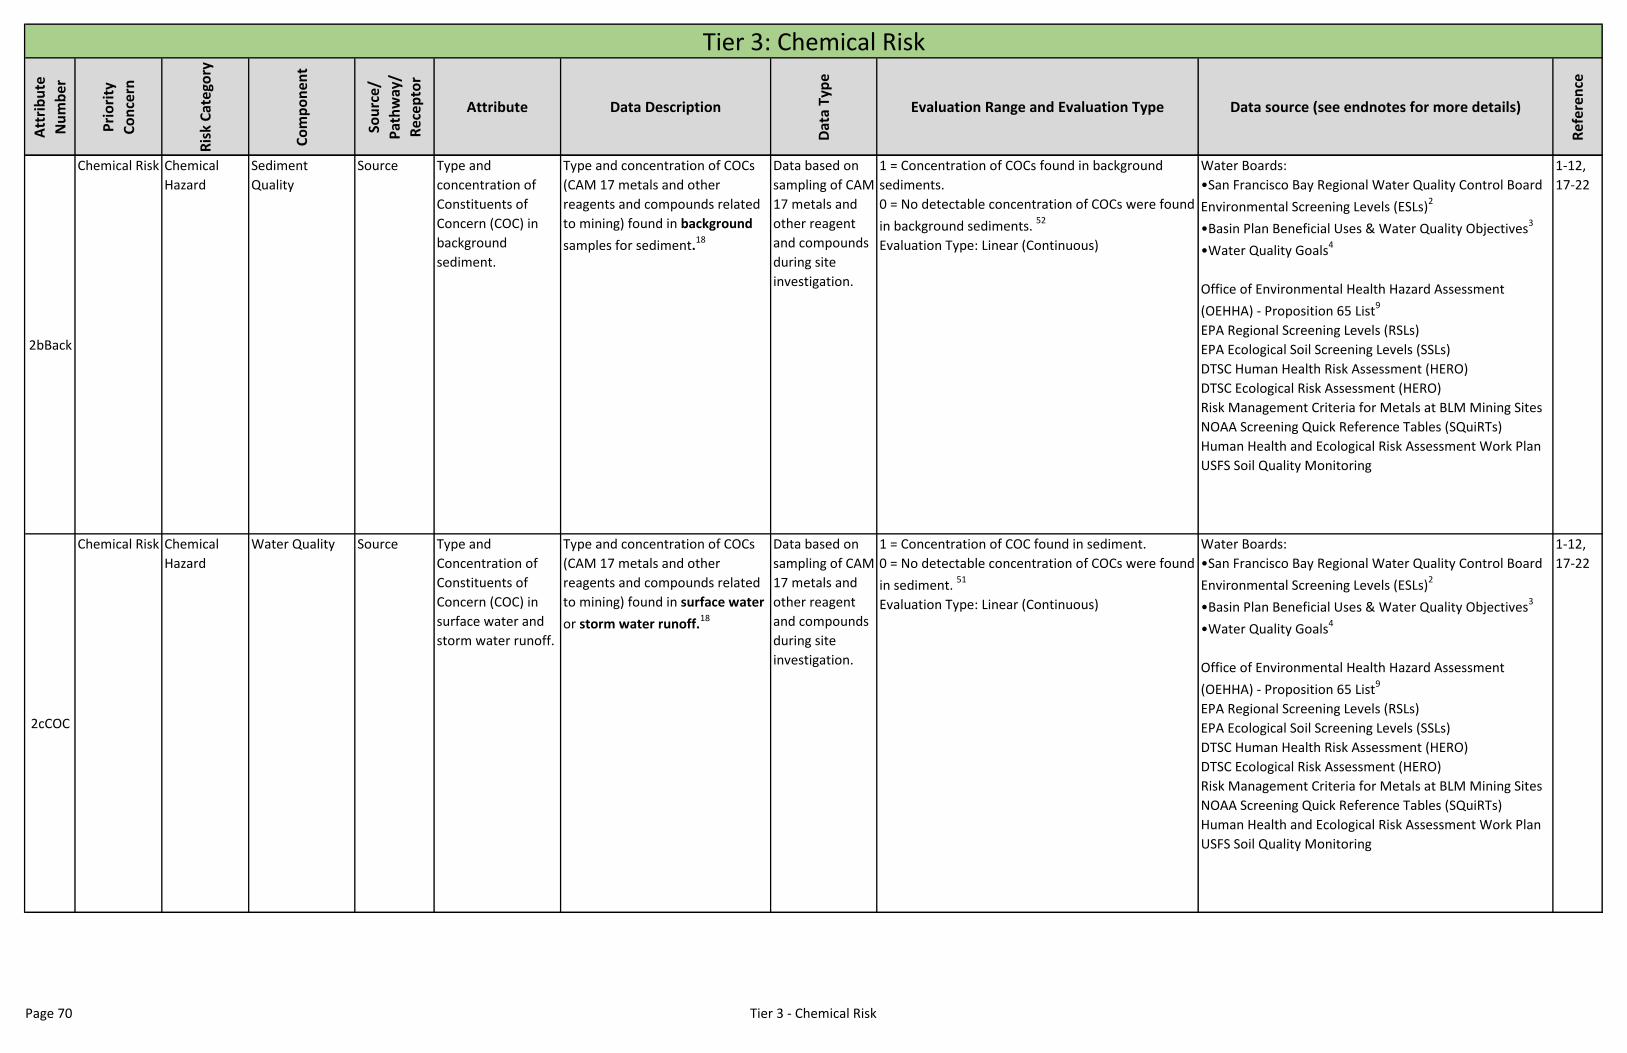
Att
rib
ute
Nu
mb
er
Pri
ori
ty
Co
nce
rn
Ris
k C
ate
gory
Co
mp
on
ent
Sou
rce
/
Pat
hw
ay/
Rec
ep
tor
Attribute Data Description
Dat
a Ty
pe
Evaluation Range and Evaluation Type Data source (see endnotes for more details)
Ref
eren
ce
Tier 3: Chemical Risk
2bBack
Chemical Risk Chemical
Hazard
Sediment
Quality
Source Type and
concentration of
Constituents of
Concern (COC) in
background
sediment.
Type and concentration of COCs
(CAM 17 metals and other
reagents and compounds related
to mining) found in background
samples for sediment.18
Data based on
sampling of CAM
17 metals and
other reagent
and compounds
during site
investigation.
1 = Concentration of COCs found in background
sediments.
0 = No detectable concentration of COCs were found
in background sediments. 52
Evaluation Type: Linear (Continuous)
Water Boards:
•San Francisco Bay Regional Water Quality Control Board
Environmental Screening Levels (ESLs)2
•Basin Plan Beneficial Uses & Water Quality Objectives3
•Water Quality Goals4
Office of Environmental Health Hazard Assessment
(OEHHA) - Proposition 65 List9
EPA Regional Screening Levels (RSLs)
EPA Ecological Soil Screening Levels (SSLs)
DTSC Human Health Risk Assessment (HERO)
DTSC Ecological Risk Assessment (HERO)
Risk Management Criteria for Metals at BLM Mining Sites
NOAA Screening Quick Reference Tables (SQuiRTs)
Human Health and Ecological Risk Assessment Work Plan
USFS Soil Quality Monitoring
1-12,
17-22
2cCOC
Chemical Risk Chemical
Hazard
Water Quality Source Type and
Concentration of
Constituents of
Concern (COC) in
surface water and
storm water runoff.
Type and concentration of COCs
(CAM 17 metals and other
reagents and compounds related
to mining) found in surface water
or storm water runoff.18
Data based on
sampling of CAM
17 metals and
other reagent
and compounds
during site
investigation.
1 = Concentration of COC found in sediment.
0 = No detectable concentration of COCs were found
in sediment. 51
Evaluation Type: Linear (Continuous)
Water Boards:
•San Francisco Bay Regional Water Quality Control Board
Environmental Screening Levels (ESLs)2
•Basin Plan Beneficial Uses & Water Quality Objectives3
•Water Quality Goals4
Office of Environmental Health Hazard Assessment
(OEHHA) - Proposition 65 List9
EPA Regional Screening Levels (RSLs)
EPA Ecological Soil Screening Levels (SSLs)
DTSC Human Health Risk Assessment (HERO)
DTSC Ecological Risk Assessment (HERO)
Risk Management Criteria for Metals at BLM Mining Sites
NOAA Screening Quick Reference Tables (SQuiRTs)
Human Health and Ecological Risk Assessment Work Plan
USFS Soil Quality Monitoring
1-12,
17-22
Page 70 Tier 3 - Chemical Risk

Att
rib
ute
Nu
mb
er
Pri
ori
ty
Co
nce
rn
Ris
k C
ate
gory
Co
mp
on
ent
Sou
rce
/
Pat
hw
ay/
Rec
ep
tor
Attribute Data Description
Dat
a Ty
pe
Evaluation Range and Evaluation Type Data source (see endnotes for more details)
Ref
eren
ce
Tier 3: Chemical Risk
2cBack
Chemical Risk Chemical
Hazard
Water Quality Source Type and
concentration of
Constituents of
Concern (COC) in
background surface
water or storm
water runoff.
Type and concentration of COCs
(CAM 17 metals and other
reagents and compounds related
to mining) found in background
samples for surface water or
storm water runoff.18
Data based on
sampling of CAM
17 metals and
other reagent
and compounds
during site
investigation.
1 = Concentration of COCs found in background
water samples for surface water or storm water
runoff.
0 = No detectable concentration of COCs were found
in background samples for surface water or storm
water runoff. 52
Evaluation Type: Linear (Continuous)
Water Boards:
•San Francisco Bay Regional Water Quality Control Board
Environmental Screening Levels (ESLs)2
•Basin Plan Beneficial Uses & Water Quality Objectives3
•Water Quality Goals4
Office of Environmental Health Hazard Assessment
(OEHHA) - Proposition 65 List9
EPA Regional Screening Levels (RSLs)
EPA Ecological Soil Screening Levels (SSLs)
DTSC Human Health Risk Assessment (HERO)
DTSC Ecological Risk Assessment (HERO)
Risk Management Criteria for Metals at BLM Mining Sites
NOAA Screening Quick Reference Tables (SQuiRTs)
Human Health and Ecological Risk Assessment Work Plan
USFS Soil Quality Monitoring
1-12,
17-22
2dCOC
Chemical Risk Chemical
Hazard
Water Quality Source Type and
Concentration of
Constituents of
Concern (COC) in
groundwater.
Type and concentration of COCs
(CAM 17 metals and other
reagents and compounds related
to mining) found in
groundwater.18
Data based on
sampling of CAM
17 metals and
other reagent
and compounds
during site
investigation.
1 = Concentration of COC found in surface water or
storm water runoff..
0 = No detectable concentration was found in
surface water or storm water runoff. 51
Evaluation Type: Linear (Continuous)
Water Boards:
•San Francisco Bay Regional Water Quality Control Board
Environmental Screening Levels (ESLs)2
•Basin Plan Beneficial Uses & Water Quality Objectives3
•Water Quality Goals4
Office of Environmental Health Hazard Assessment
(OEHHA) - Proposition 65 List9
EPA Regional Screening Levels (RSLs)
EPA Ecological Soil Screening Levels (SSLs)
DTSC Human Health Risk Assessment (HERO)
DTSC Ecological Risk Assessment (HERO)
Risk Management Criteria for Metals at BLM Mining Sites
NOAA Screening Quick Reference Tables (SQuiRTs)
Human Health and Ecological Risk Assessment Work Plan
USFS Soil Quality Monitoring
1-12,
17-22
Page 71 Tier 3 - Chemical Risk
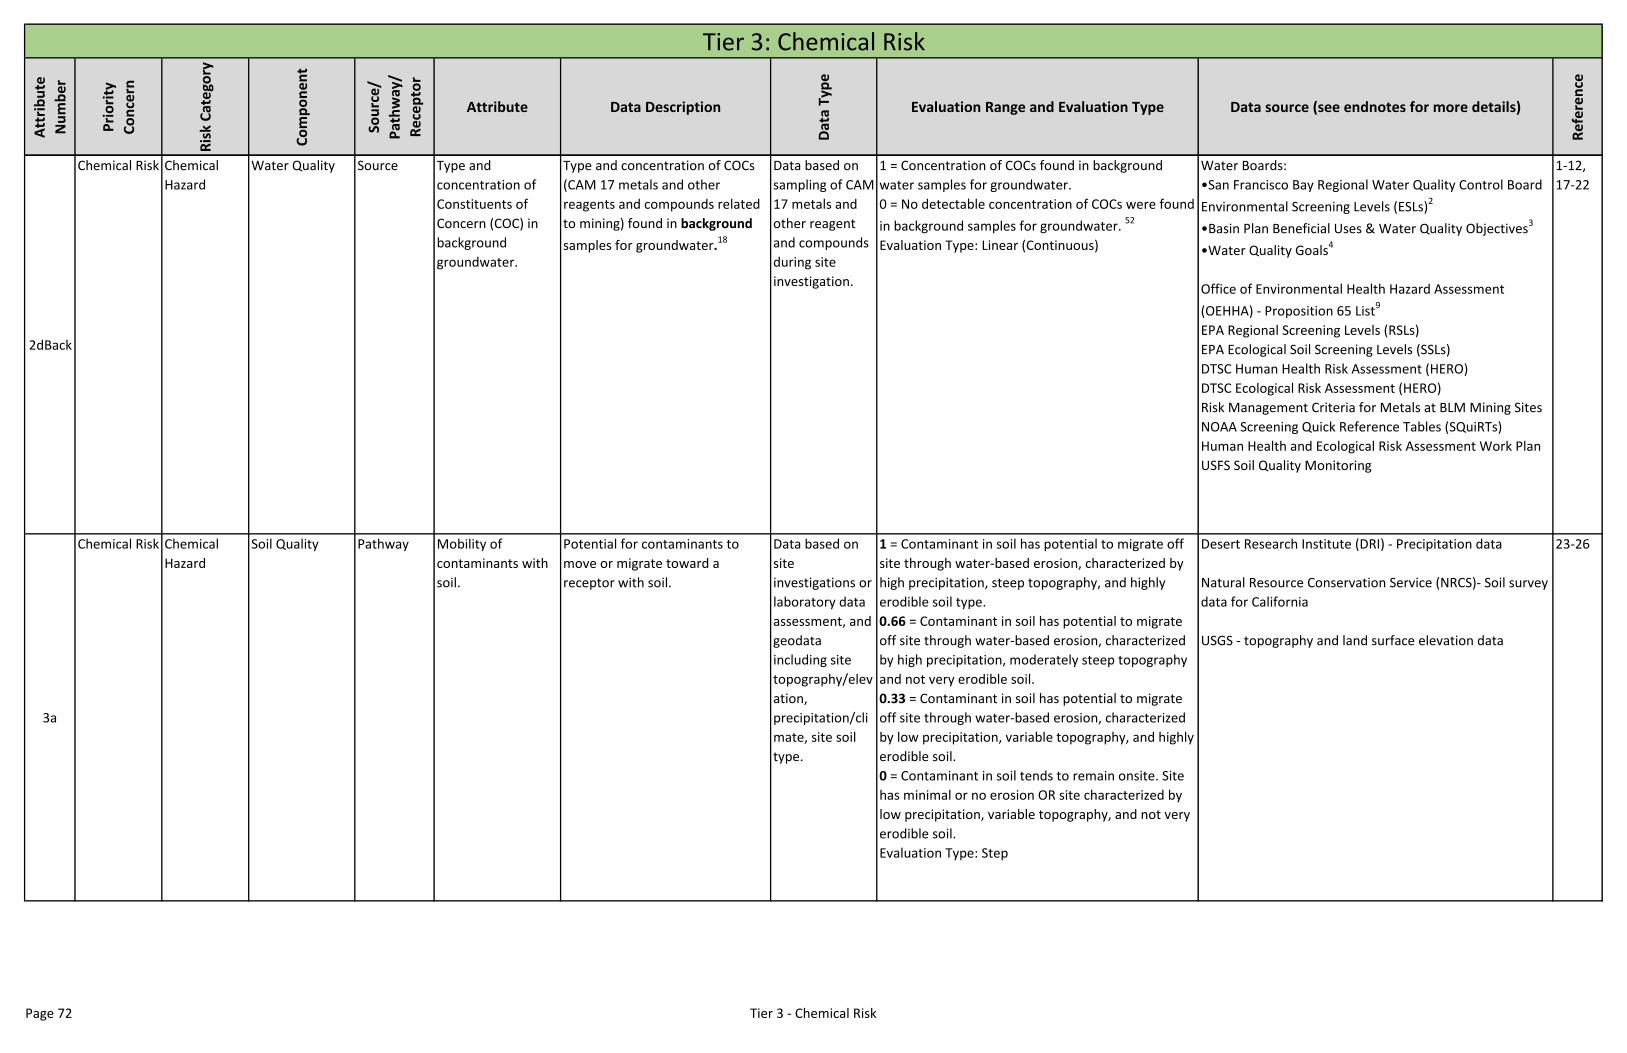
Att
rib
ute
Nu
mb
er
Pri
ori
ty
Co
nce
rn
Ris
k C
ate
gory
Co
mp
on
ent
Sou
rce
/
Pat
hw
ay/
Rec
ep
tor
Attribute Data Description
Dat
a Ty
pe
Evaluation Range and Evaluation Type Data source (see endnotes for more details)
Ref
eren
ce
Tier 3: Chemical Risk
2dBack
Chemical Risk Chemical
Hazard
Water Quality Source Type and
concentration of
Constituents of
Concern (COC) in
background
groundwater.
Type and concentration of COCs
(CAM 17 metals and other
reagents and compounds related
to mining) found in background
samples for groundwater.18
Data based on
sampling of CAM
17 metals and
other reagent
and compounds
during site
investigation.
1 = Concentration of COCs found in background
water samples for groundwater.
0 = No detectable concentration of COCs were found
in background samples for groundwater. 52
Evaluation Type: Linear (Continuous)
Water Boards:
•San Francisco Bay Regional Water Quality Control Board
Environmental Screening Levels (ESLs)2
•Basin Plan Beneficial Uses & Water Quality Objectives3
•Water Quality Goals4
Office of Environmental Health Hazard Assessment
(OEHHA) - Proposition 65 List9
EPA Regional Screening Levels (RSLs)
EPA Ecological Soil Screening Levels (SSLs)
DTSC Human Health Risk Assessment (HERO)
DTSC Ecological Risk Assessment (HERO)
Risk Management Criteria for Metals at BLM Mining Sites
NOAA Screening Quick Reference Tables (SQuiRTs)
Human Health and Ecological Risk Assessment Work Plan
USFS Soil Quality Monitoring
1-12,
17-22
3a
Chemical Risk Chemical
Hazard
Soil Quality Pathway Mobility of
contaminants with
soil.
Potential for contaminants to
move or migrate toward a
receptor with soil.
Data based on
site
investigations or
laboratory data
assessment, and
geodata
including site
topography/elev
ation,
precipitation/cli
mate, site soil
type.
1 = Contaminant in soil has potential to migrate off
site through water-based erosion, characterized by
high precipitation, steep topography, and highly
erodible soil type.
0.66 = Contaminant in soil has potential to migrate
off site through water-based erosion, characterized
by high precipitation, moderately steep topography
and not very erodible soil.
0.33 = Contaminant in soil has potential to migrate
off site through water-based erosion, characterized
by low precipitation, variable topography, and highly
erodible soil.
0 = Contaminant in soil tends to remain onsite. Site
has minimal or no erosion OR site characterized by
low precipitation, variable topography, and not very
erodible soil.
Evaluation Type: Step
Desert Research Institute (DRI) - Precipitation data
Natural Resource Conservation Service (NRCS)- Soil survey
data for California
USGS - topography and land surface elevation data
23-26
Page 72 Tier 3 - Chemical Risk
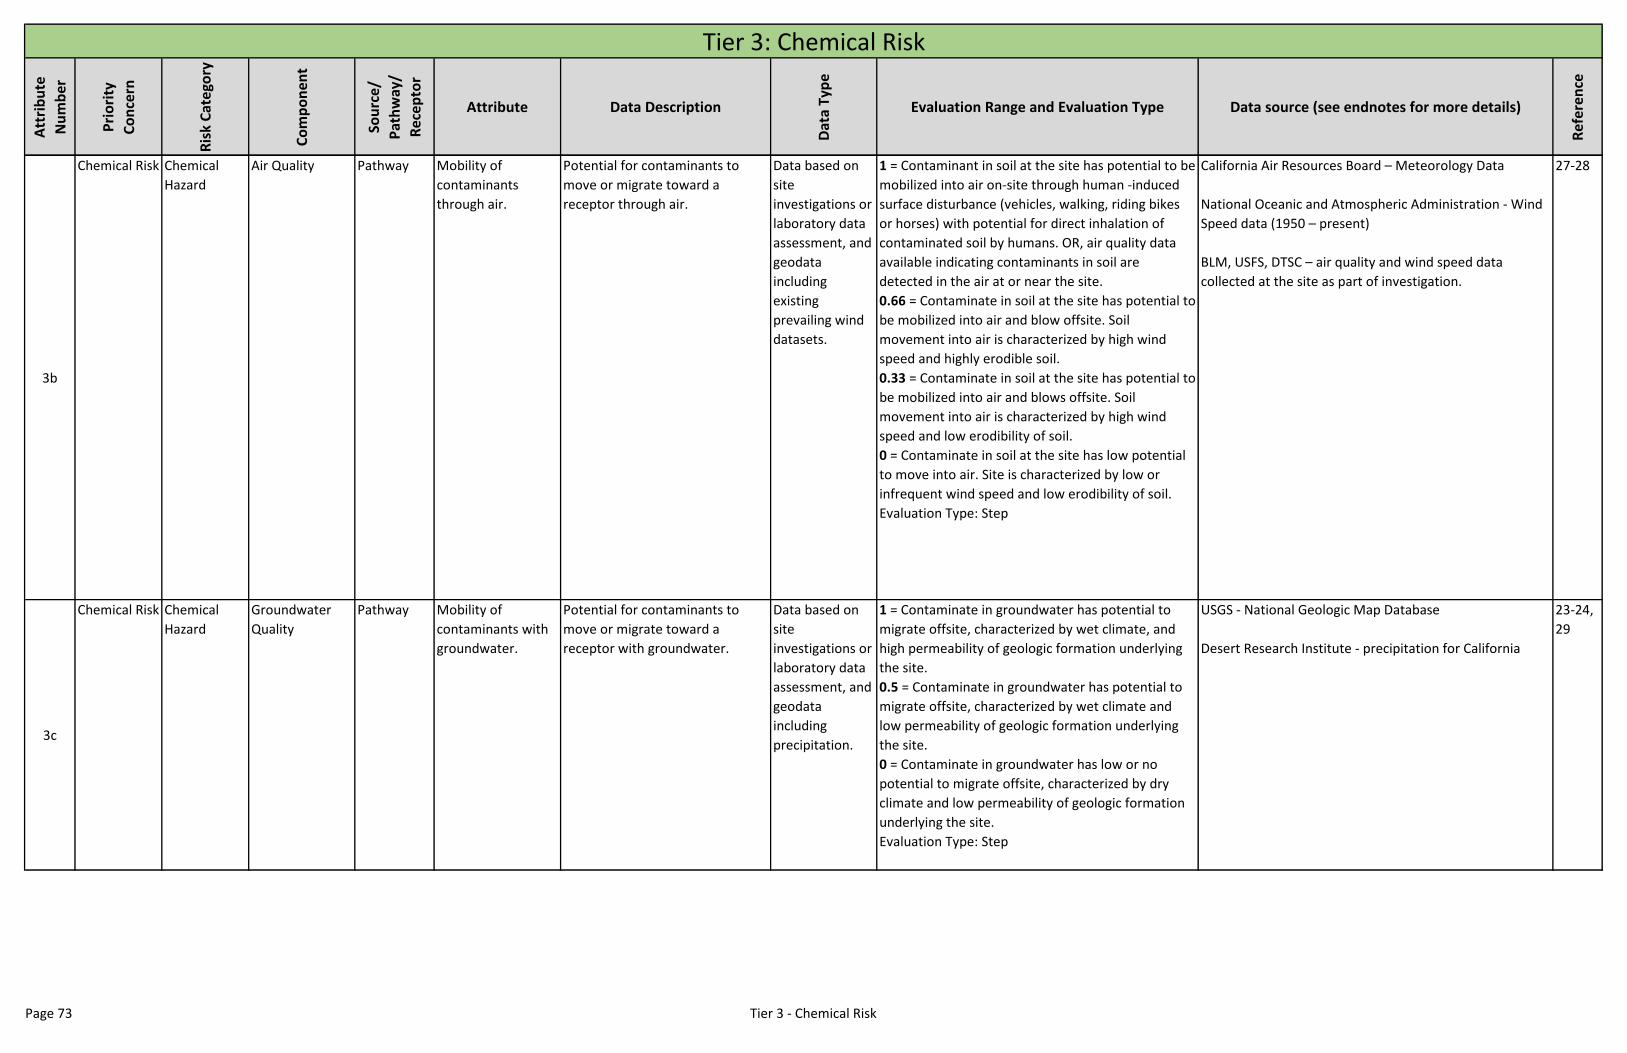
Att
rib
ute
Nu
mb
er
Pri
ori
ty
Co
nce
rn
Ris
k C
ate
gory
Co
mp
on
ent
Sou
rce
/
Pat
hw
ay/
Rec
ep
tor
Attribute Data Description
Dat
a Ty
pe
Evaluation Range and Evaluation Type Data source (see endnotes for more details)
Ref
eren
ce
Tier 3: Chemical Risk
3b
Chemical Risk Chemical
Hazard
Air Quality Pathway Mobility of
contaminants
through air.
Potential for contaminants to
move or migrate toward a
receptor through air.
Data based on
site
investigations or
laboratory data
assessment, and
geodata
including
existing
prevailing wind
datasets.
1 = Contaminant in soil at the site has potential to be
mobilized into air on-site through human -induced
surface disturbance (vehicles, walking, riding bikes
or horses) with potential for direct inhalation of
contaminated soil by humans. OR, air quality data
available indicating contaminants in soil are
detected in the air at or near the site.
0.66 = Contaminate in soil at the site has potential to
be mobilized into air and blow offsite. Soil
movement into air is characterized by high wind
speed and highly erodible soil.
0.33 = Contaminate in soil at the site has potential to
be mobilized into air and blows offsite. Soil
movement into air is characterized by high wind
speed and low erodibility of soil.
0 = Contaminate in soil at the site has low potential
to move into air. Site is characterized by low or
infrequent wind speed and low erodibility of soil.
Evaluation Type: Step
California Air Resources Board – Meteorology Data
National Oceanic and Atmospheric Administration - Wind
Speed data (1950 – present)
BLM, USFS, DTSC – air quality and wind speed data
collected at the site as part of investigation.
27-28
3c
Chemical Risk Chemical
Hazard
Groundwater
Quality
Pathway Mobility of
contaminants with
groundwater.
Potential for contaminants to
move or migrate toward a
receptor with groundwater.
Data based on
site
investigations or
laboratory data
assessment, and
geodata
including
precipitation.
1 = Contaminate in groundwater has potential to
migrate offsite, characterized by wet climate, and
high permeability of geologic formation underlying
the site.
0.5 = Contaminate in groundwater has potential to
migrate offsite, characterized by wet climate and
low permeability of geologic formation underlying
the site.
0 = Contaminate in groundwater has low or no
potential to migrate offsite, characterized by dry
climate and low permeability of geologic formation
underlying the site.
Evaluation Type: Step
USGS - National Geologic Map Database
Desert Research Institute - precipitation for California
23-24,
29
Page 73 Tier 3 - Chemical Risk
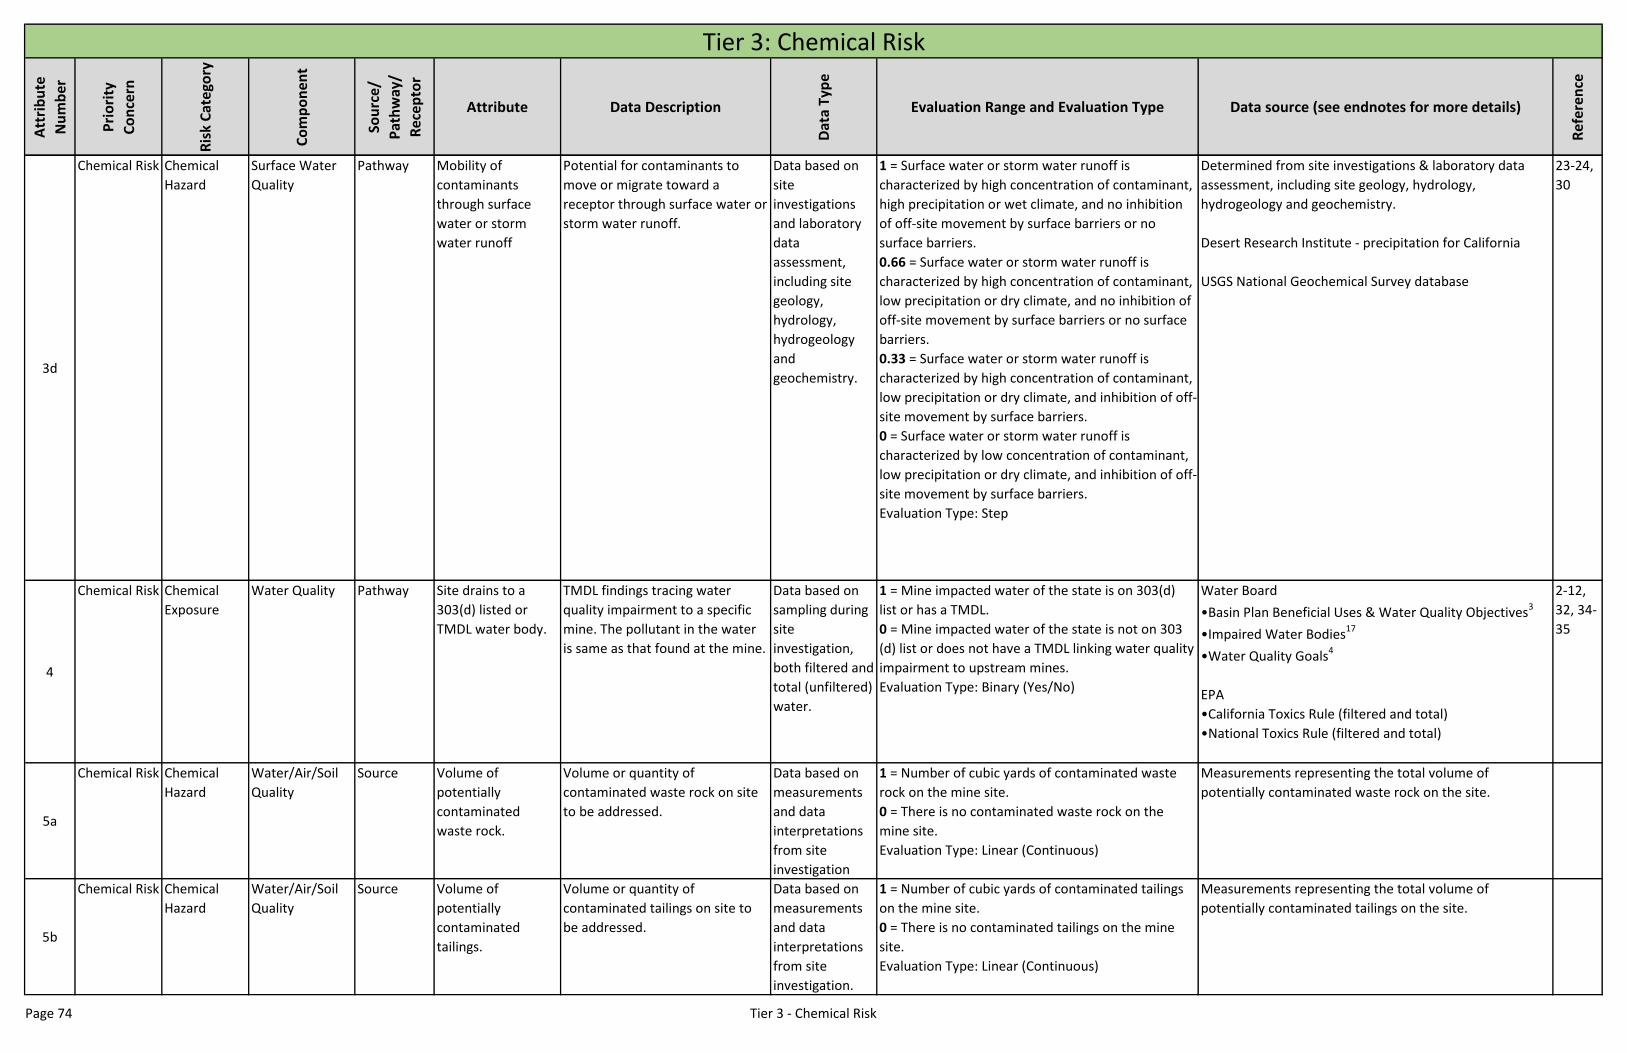
Att
rib
ute
Nu
mb
er
Pri
ori
ty
Co
nce
rn
Ris
k C
ate
gory
Co
mp
on
ent
Sou
rce
/
Pat
hw
ay/
Rec
ep
tor
Attribute Data Description
Dat
a Ty
pe
Evaluation Range and Evaluation Type Data source (see endnotes for more details)
Ref
eren
ce
Tier 3: Chemical Risk
3d
Chemical Risk Chemical
Hazard
Surface Water
Quality
Pathway Mobility of
contaminants
through surface
water or storm
water runoff
Potential for contaminants to
move or migrate toward a
receptor through surface water or
storm water runoff.
Data based on
site
investigations
and laboratory
data
assessment,
including site
geology,
hydrology,
hydrogeology
and
geochemistry.
1 = Surface water or storm water runoff is
characterized by high concentration of contaminant,
high precipitation or wet climate, and no inhibition
of off-site movement by surface barriers or no
surface barriers.
0.66 = Surface water or storm water runoff is
characterized by high concentration of contaminant,
low precipitation or dry climate, and no inhibition of
off-site movement by surface barriers or no surface
barriers.
0.33 = Surface water or storm water runoff is
characterized by high concentration of contaminant,
low precipitation or dry climate, and inhibition of off-
site movement by surface barriers.
0 = Surface water or storm water runoff is
characterized by low concentration of contaminant,
low precipitation or dry climate, and inhibition of off-
site movement by surface barriers.
Evaluation Type: Step
Determined from site investigations & laboratory data
assessment, including site geology, hydrology,
hydrogeology and geochemistry.
Desert Research Institute - precipitation for California
USGS National Geochemical Survey database
23-24,
30
4
Chemical Risk Chemical
Exposure
Water Quality Pathway Site drains to a
303(d) listed or
TMDL water body.
TMDL findings tracing water
quality impairment to a specific
mine. The pollutant in the water
is same as that found at the mine.
Data based on
sampling during
site
investigation,
both filtered and
total (unfiltered)
water.
1 = Mine impacted water of the state is on 303(d)
list or has a TMDL.
0 = Mine impacted water of the state is not on 303
(d) list or does not have a TMDL linking water quality
impairment to upstream mines.
Evaluation Type: Binary (Yes/No)
Water Board
•Basin Plan Beneficial Uses & Water Quality Objectives3
•Impaired Water Bodies17
•Water Quality Goals4
EPA
•California Toxics Rule (filtered and total)
•National Toxics Rule (filtered and total)
2-12,
32, 34-
35
5a
Chemical Risk Chemical
Hazard
Water/Air/Soil
Quality
Source Volume of
potentially
contaminated
waste rock.
Volume or quantity of
contaminated waste rock on site
to be addressed.
Data based on
measurements
and data
interpretations
from site
investigation
1 = Number of cubic yards of contaminated waste
rock on the mine site.
0 = There is no contaminated waste rock on the
mine site.
Evaluation Type: Linear (Continuous)
Measurements representing the total volume of
potentially contaminated waste rock on the site.
5b
Chemical Risk Chemical
Hazard
Water/Air/Soil
Quality
Source Volume of
potentially
contaminated
tailings.
Volume or quantity of
contaminated tailings on site to
be addressed.
Data based on
measurements
and data
interpretations
from site
investigation.
1 = Number of cubic yards of contaminated tailings
on the mine site.
0 = There is no contaminated tailings on the mine
site.
Evaluation Type: Linear (Continuous)
Measurements representing the total volume of
potentially contaminated tailings on the site.
Page 74 Tier 3 - Chemical Risk

Att
rib
ute
Nu
mb
er
Pri
ori
ty
Co
nce
rn
Ris
k C
ate
gory
Co
mp
on
ent
Sou
rce
/
Pat
hw
ay/
Rec
ep
tor
Attribute Data Description
Dat
a Ty
pe
Evaluation Range and Evaluation Type Data source (see endnotes for more details)
Ref
eren
ce
Tier 3: Chemical Risk
6aHum
Wat
Chemical Risk Chemical
Exposure
Water Quality Receptor Actual human
exposure to
contaminated
water under current
conditions.
Exposure pathway (water) is
contaminated above human
health standards and direct
intake/contact is occurring.
Data based on
sampling from
site
investigation.
1 = Concentration of contaminant in water to which
humans are exposed through direct contact or
consumption exceeds the standard OR background
level.
0 = Concentration of contaminant in water to which
humans are exposed through direct contact or
consumption does not exceed threshold or
background level.
Evaluation Type: Linear (Continuous)
Water Board
•San Francisco Bay Regional Water Quality Control Board
Environmental Screening Levels (ESLs)2
•Basin Plan Beneficial Uses & Water Quality Objectives3
•Water Quality Goals4
EPA:
•Regional Screening Levels (RSLs)
•Ecological Soil Screening Levels (SSLs)
•Regulated Drinking Water Contaminants
DTSC
•Human Health Risk Assessment (HERO)
•Ecological Risk Assessment (HERO)
Risk Management Criteria for Metals at BLM Mining Sites
NOAA Screening Quick Reference Tables (SQuiRTs)
Human Health and Ecological Risk Assessment Work Plan
1-12,
18-21,
36-39
6aHum
Soil
Chemical Risk Chemical
Exposure
Soil Quality Receptor Actual human
exposure to
contaminated soil
under current
conditions.
Exposure pathway (soil) is
contaminated above human
health standards and direct
intake/contact is occurring.
Data based on
sampling from
site
investigation.
1 = Concentration of contaminant in soil to which
humans are exposed through direct contact or
inhalation exceeds the standard OR background
level.
0 = Concentration of contaminant in soil to which
humans are exposed through direct contact or
inhalation does not exceed threshold or background
level.
Evaluation Type: Linear (Continuous)
EPA:
•Regional Screening Levels (RSLs)
•Ecological Soil Screening Levels (SSLs)
•Regulated Drinking Water Contaminants
DTSC
•Human Health Risk Assessment (HERO)
•Ecological Risk Assessment (HERO)
Risk Management Criteria for Metals at BLM Mining Sites
NOAA Screening Quick Reference Tables (SQuiRTs)
Human Health and Ecological Risk Assessment Work Plan
USFS Soil Quality Monitoring
17, 19-
21, 39
Page 75 Tier 3 - Chemical Risk
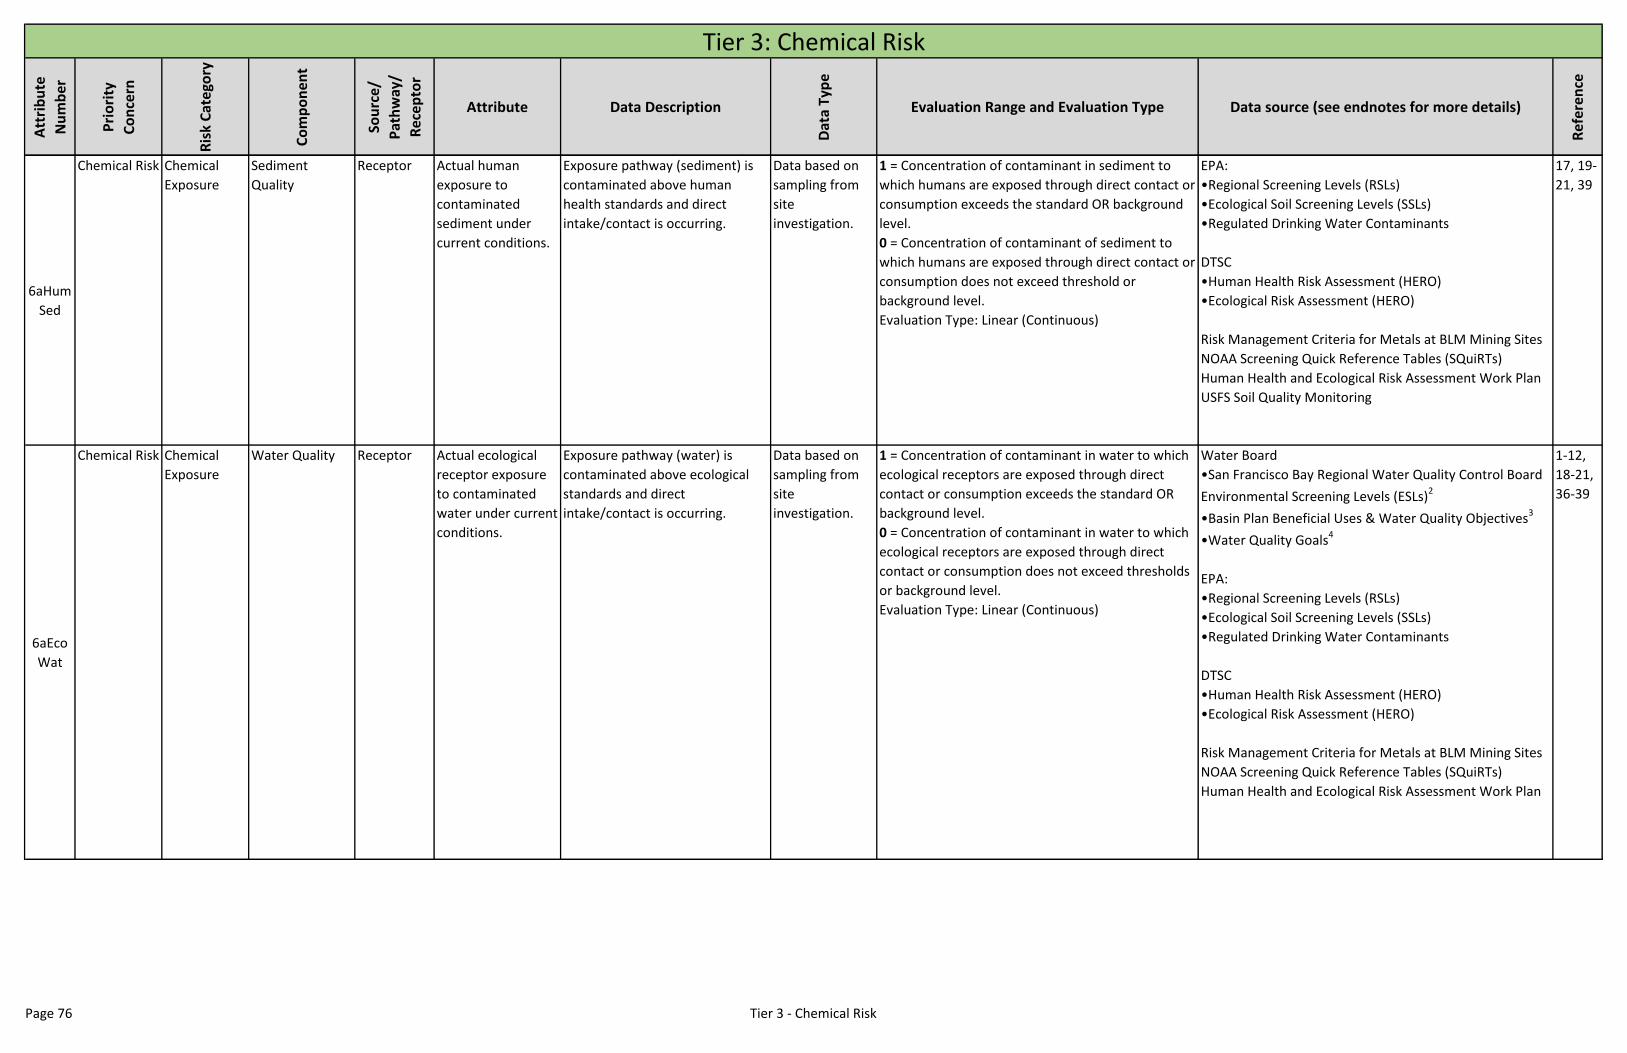
Att
rib
ute
Nu
mb
er
Pri
ori
ty
Co
nce
rn
Ris
k C
ate
gory
Co
mp
on
ent
Sou
rce
/
Pat
hw
ay/
Rec
ep
tor
Attribute Data Description
Dat
a Ty
pe
Evaluation Range and Evaluation Type Data source (see endnotes for more details)
Ref
eren
ce
Tier 3: Chemical Risk
6aHum
Sed
Chemical Risk Chemical
Exposure
Sediment
Quality
Receptor Actual human
exposure to
contaminated
sediment under
current conditions.
Exposure pathway (sediment) is
contaminated above human
health standards and direct
intake/contact is occurring.
Data based on
sampling from
site
investigation.
1 = Concentration of contaminant in sediment to
which humans are exposed through direct contact or
consumption exceeds the standard OR background
level.
0 = Concentration of contaminant of sediment to
which humans are exposed through direct contact or
consumption does not exceed threshold or
background level.
Evaluation Type: Linear (Continuous)
EPA:
•Regional Screening Levels (RSLs)
•Ecological Soil Screening Levels (SSLs)
•Regulated Drinking Water Contaminants
DTSC
•Human Health Risk Assessment (HERO)
•Ecological Risk Assessment (HERO)
Risk Management Criteria for Metals at BLM Mining Sites
NOAA Screening Quick Reference Tables (SQuiRTs)
Human Health and Ecological Risk Assessment Work Plan
USFS Soil Quality Monitoring
17, 19-
21, 39
6aEco
Wat
Chemical Risk Chemical
Exposure
Water Quality Receptor Actual ecological
receptor exposure
to contaminated
water under current
conditions.
Exposure pathway (water) is
contaminated above ecological
standards and direct
intake/contact is occurring.
Data based on
sampling from
site
investigation.
1 = Concentration of contaminant in water to which
ecological receptors are exposed through direct
contact or consumption exceeds the standard OR
background level.
0 = Concentration of contaminant in water to which
ecological receptors are exposed through direct
contact or consumption does not exceed thresholds
or background level.
Evaluation Type: Linear (Continuous)
Water Board
•San Francisco Bay Regional Water Quality Control Board
Environmental Screening Levels (ESLs)2
•Basin Plan Beneficial Uses & Water Quality Objectives3
•Water Quality Goals4
EPA:
•Regional Screening Levels (RSLs)
•Ecological Soil Screening Levels (SSLs)
•Regulated Drinking Water Contaminants
DTSC
•Human Health Risk Assessment (HERO)
•Ecological Risk Assessment (HERO)
Risk Management Criteria for Metals at BLM Mining Sites
NOAA Screening Quick Reference Tables (SQuiRTs)
Human Health and Ecological Risk Assessment Work Plan
1-12,
18-21,
36-39
Page 76 Tier 3 - Chemical Risk
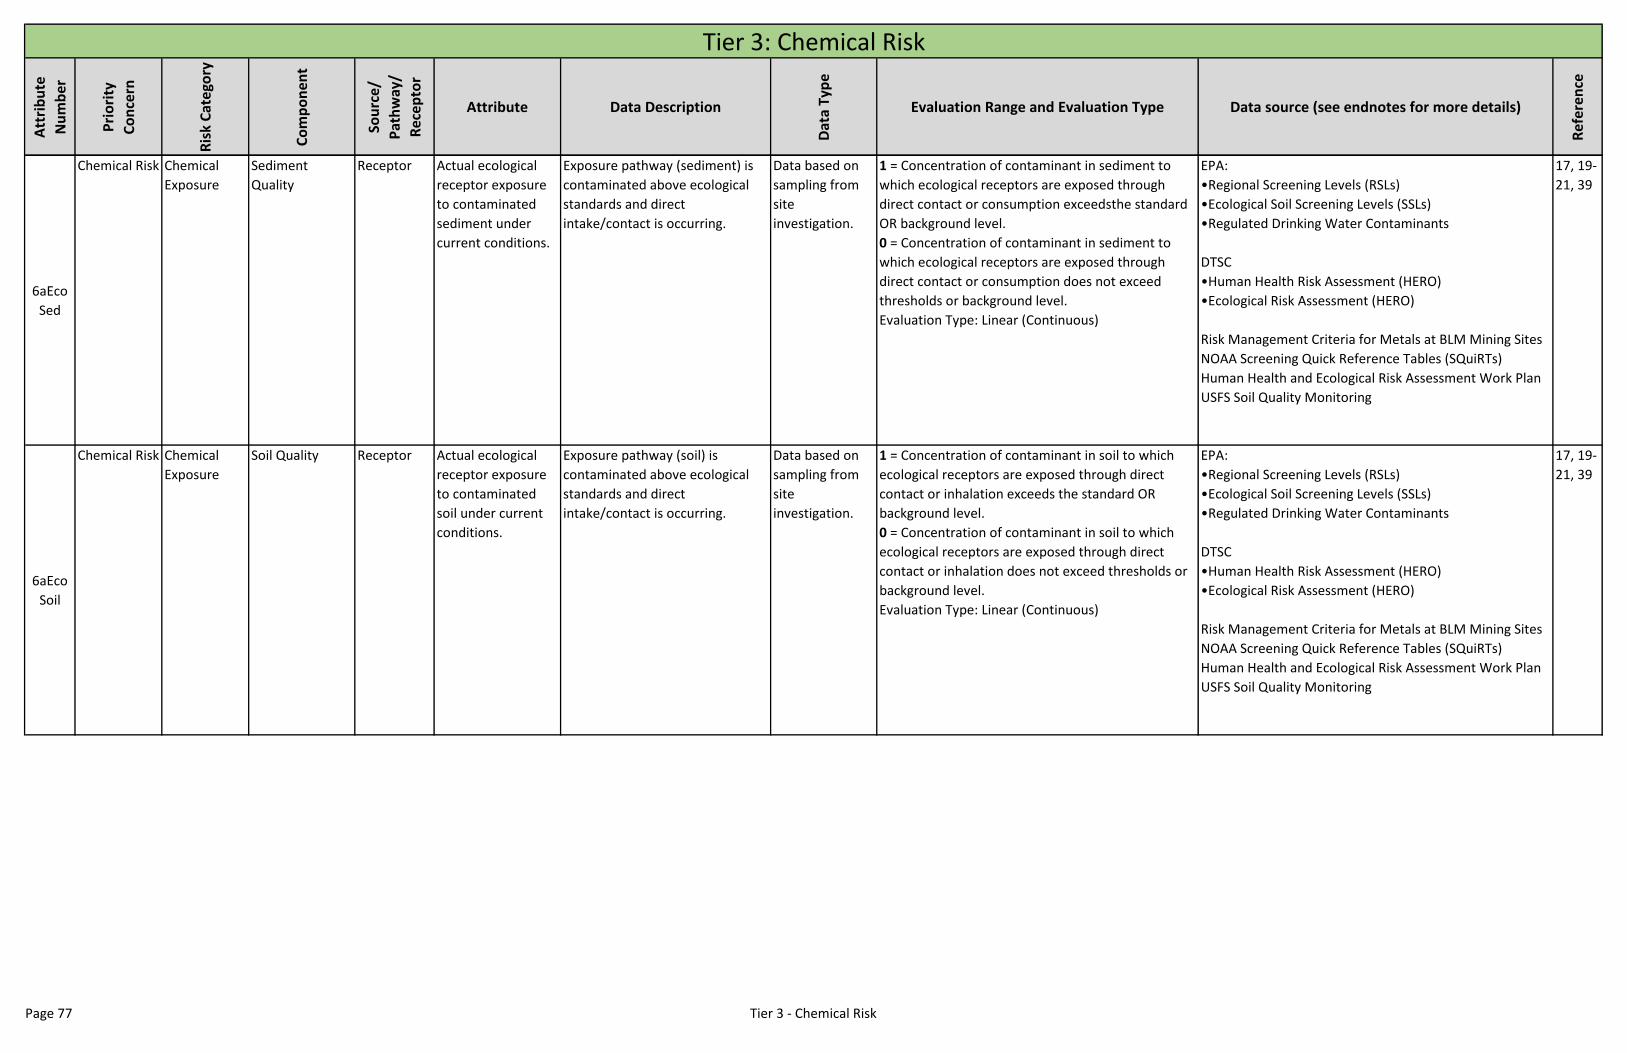
Att
rib
ute
Nu
mb
er
Pri
ori
ty
Co
nce
rn
Ris
k C
ate
gory
Co
mp
on
ent
Sou
rce
/
Pat
hw
ay/
Rec
ep
tor
Attribute Data Description
Dat
a Ty
pe
Evaluation Range and Evaluation Type Data source (see endnotes for more details)
Ref
eren
ce
Tier 3: Chemical Risk
6aEco
Sed
Chemical Risk Chemical
Exposure
Sediment
Quality
Receptor Actual ecological
receptor exposure
to contaminated
sediment under
current conditions.
Exposure pathway (sediment) is
contaminated above ecological
standards and direct
intake/contact is occurring.
Data based on
sampling from
site
investigation.
1 = Concentration of contaminant in sediment to
which ecological receptors are exposed through
direct contact or consumption exceedsthe standard
OR background level.
0 = Concentration of contaminant in sediment to
which ecological receptors are exposed through
direct contact or consumption does not exceed
thresholds or background level.
Evaluation Type: Linear (Continuous)
EPA:
•Regional Screening Levels (RSLs)
•Ecological Soil Screening Levels (SSLs)
•Regulated Drinking Water Contaminants
DTSC
•Human Health Risk Assessment (HERO)
•Ecological Risk Assessment (HERO)
Risk Management Criteria for Metals at BLM Mining Sites
NOAA Screening Quick Reference Tables (SQuiRTs)
Human Health and Ecological Risk Assessment Work Plan
USFS Soil Quality Monitoring
17, 19-
21, 39
6aEco
Soil
Chemical Risk Chemical
Exposure
Soil Quality Receptor Actual ecological
receptor exposure
to contaminated
soil under current
conditions.
Exposure pathway (soil) is
contaminated above ecological
standards and direct
intake/contact is occurring.
Data based on
sampling from
site
investigation.
1 = Concentration of contaminant in soil to which
ecological receptors are exposed through direct
contact or inhalation exceeds the standard OR
background level.
0 = Concentration of contaminant in soil to which
ecological receptors are exposed through direct
contact or inhalation does not exceed thresholds or
background level.
Evaluation Type: Linear (Continuous)
EPA:
•Regional Screening Levels (RSLs)
•Ecological Soil Screening Levels (SSLs)
•Regulated Drinking Water Contaminants
DTSC
•Human Health Risk Assessment (HERO)
•Ecological Risk Assessment (HERO)
Risk Management Criteria for Metals at BLM Mining Sites
NOAA Screening Quick Reference Tables (SQuiRTs)
Human Health and Ecological Risk Assessment Work Plan
USFS Soil Quality Monitoring
17, 19-
21, 39
Page 77 Tier 3 - Chemical Risk
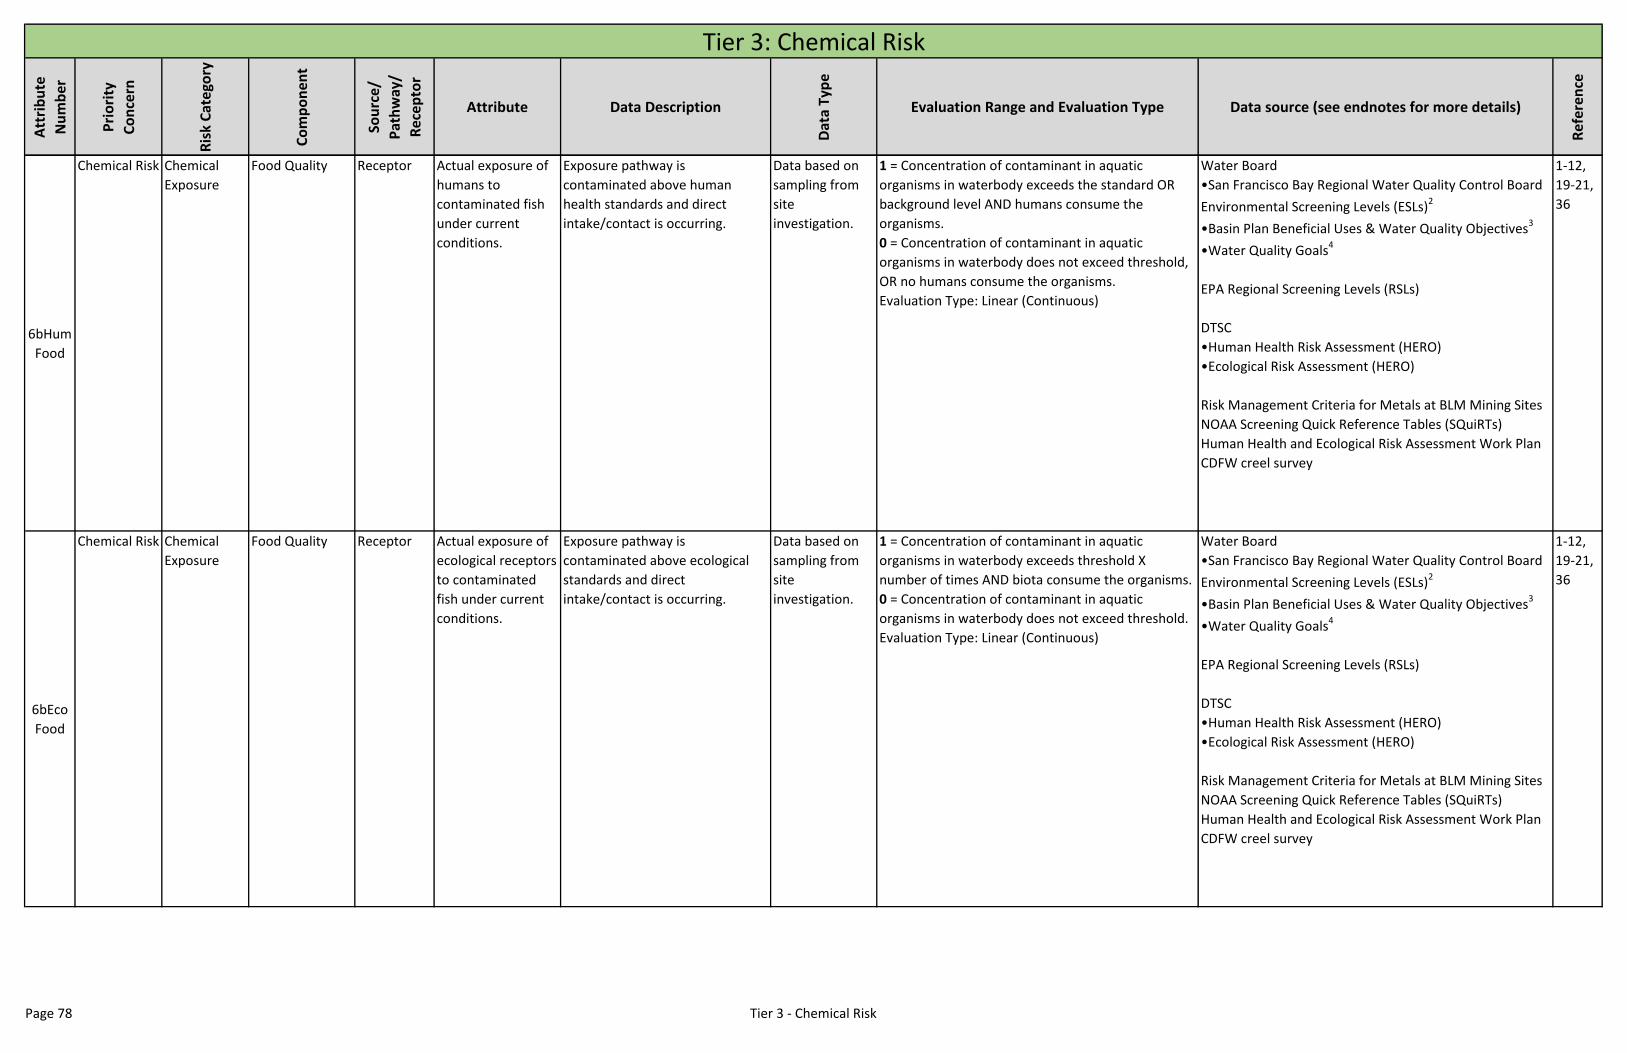
Att
rib
ute
Nu
mb
er
Pri
ori
ty
Co
nce
rn
Ris
k C
ate
gory
Co
mp
on
ent
Sou
rce
/
Pat
hw
ay/
Rec
ep
tor
Attribute Data Description
Dat
a Ty
pe
Evaluation Range and Evaluation Type Data source (see endnotes for more details)
Ref
eren
ce
Tier 3: Chemical Risk
6bHum
Food
Chemical Risk Chemical
Exposure
Food Quality Receptor Actual exposure of
humans to
contaminated fish
under current
conditions.
Exposure pathway is
contaminated above human
health standards and direct
intake/contact is occurring.
Data based on
sampling from
site
investigation.
1 = Concentration of contaminant in aquatic
organisms in waterbody exceeds the standard OR
background level AND humans consume the
organisms.
0 = Concentration of contaminant in aquatic
organisms in waterbody does not exceed threshold,
OR no humans consume the organisms.
Evaluation Type: Linear (Continuous)
Water Board
•San Francisco Bay Regional Water Quality Control Board
Environmental Screening Levels (ESLs)2
•Basin Plan Beneficial Uses & Water Quality Objectives3
•Water Quality Goals4
EPA Regional Screening Levels (RSLs)
DTSC
•Human Health Risk Assessment (HERO)
•Ecological Risk Assessment (HERO)
Risk Management Criteria for Metals at BLM Mining Sites
NOAA Screening Quick Reference Tables (SQuiRTs)
Human Health and Ecological Risk Assessment Work Plan
CDFW creel survey
1-12,
19-21,
36
6bEco
Food
Chemical Risk Chemical
Exposure
Food Quality Receptor Actual exposure of
ecological receptors
to contaminated
fish under current
conditions.
Exposure pathway is
contaminated above ecological
standards and direct
intake/contact is occurring.
Data based on
sampling from
site
investigation.
1 = Concentration of contaminant in aquatic
organisms in waterbody exceeds threshold X
number of times AND biota consume the organisms.
0 = Concentration of contaminant in aquatic
organisms in waterbody does not exceed threshold.
Evaluation Type: Linear (Continuous)
Water Board
•San Francisco Bay Regional Water Quality Control Board
Environmental Screening Levels (ESLs)2
•Basin Plan Beneficial Uses & Water Quality Objectives3
•Water Quality Goals4
EPA Regional Screening Levels (RSLs)
DTSC
•Human Health Risk Assessment (HERO)
•Ecological Risk Assessment (HERO)
Risk Management Criteria for Metals at BLM Mining Sites
NOAA Screening Quick Reference Tables (SQuiRTs)
Human Health and Ecological Risk Assessment Work Plan
CDFW creel survey
1-12,
19-21,
36
Page 78 Tier 3 - Chemical Risk
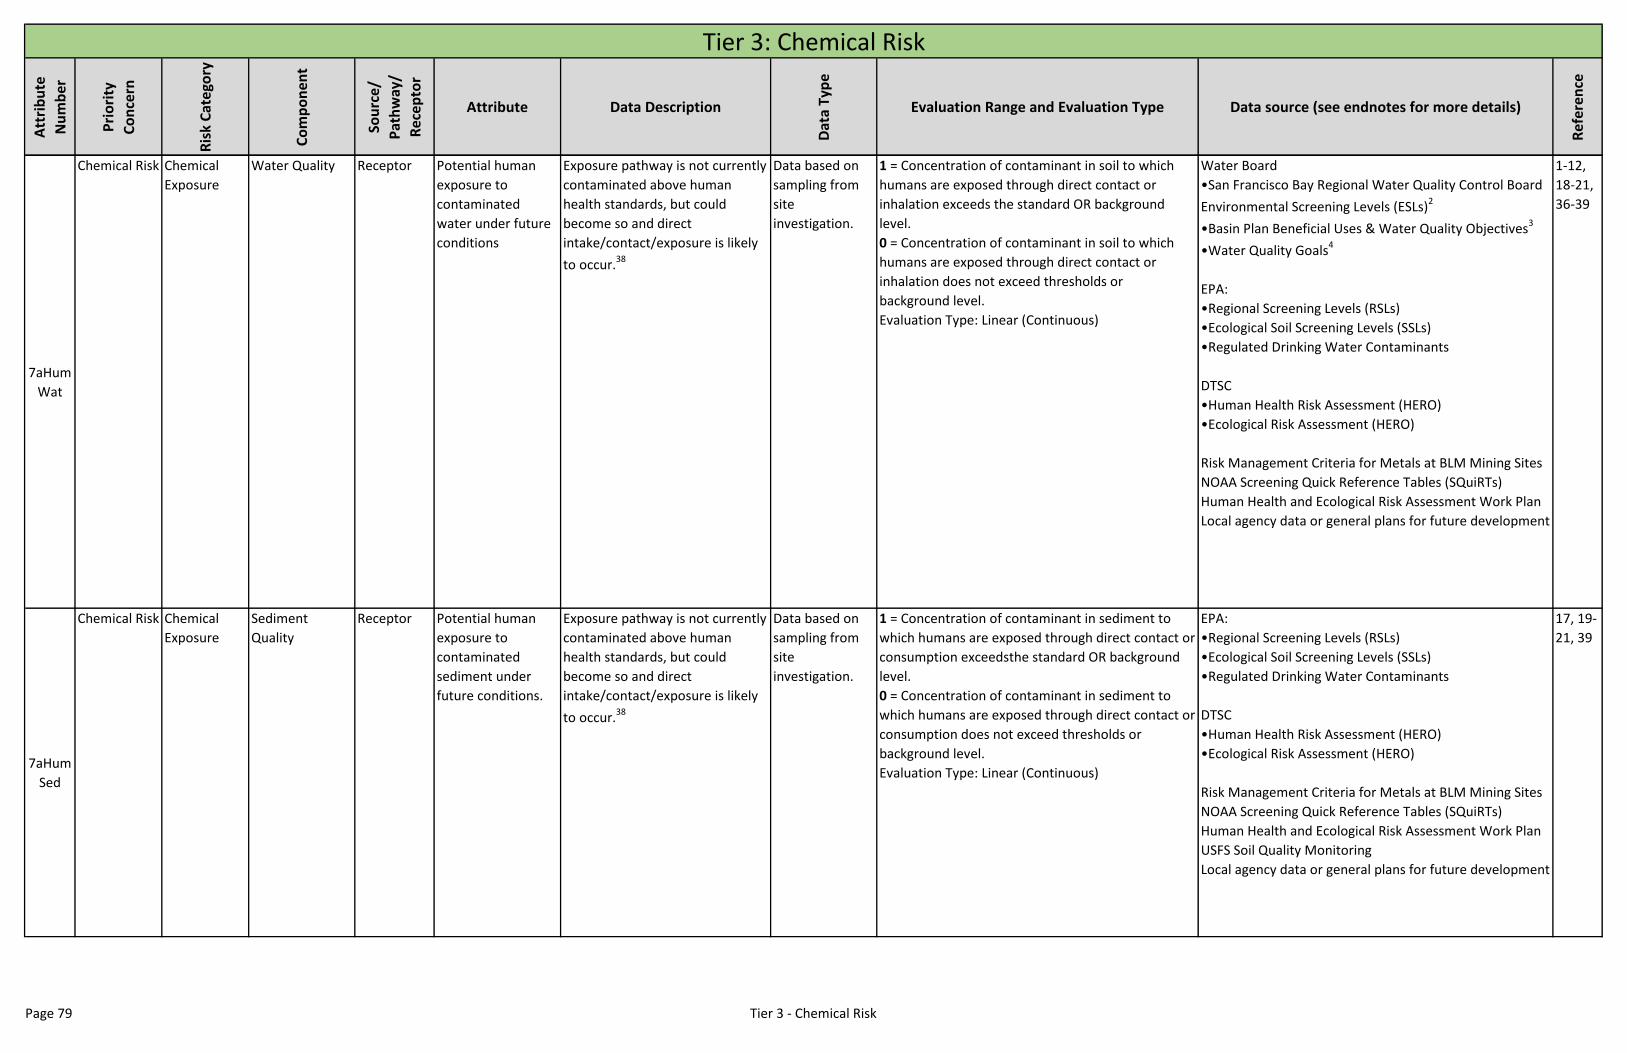
Att
rib
ute
Nu
mb
er
Pri
ori
ty
Co
nce
rn
Ris
k C
ate
gory
Co
mp
on
ent
Sou
rce
/
Pat
hw
ay/
Rec
ep
tor
Attribute Data Description
Dat
a Ty
pe
Evaluation Range and Evaluation Type Data source (see endnotes for more details)
Ref
eren
ce
Tier 3: Chemical Risk
7aHum
Wat
Chemical Risk Chemical
Exposure
Water Quality Receptor Potential human
exposure to
contaminated
water under future
conditions
Exposure pathway is not currently
contaminated above human
health standards, but could
become so and direct
intake/contact/exposure is likely
to occur.38
Data based on
sampling from
site
investigation.
1 = Concentration of contaminant in soil to which
humans are exposed through direct contact or
inhalation exceeds the standard OR background
level.
0 = Concentration of contaminant in soil to which
humans are exposed through direct contact or
inhalation does not exceed thresholds or
background level.
Evaluation Type: Linear (Continuous)
Water Board
•San Francisco Bay Regional Water Quality Control Board
Environmental Screening Levels (ESLs)2
•Basin Plan Beneficial Uses & Water Quality Objectives3
•Water Quality Goals4
EPA:
•Regional Screening Levels (RSLs)
•Ecological Soil Screening Levels (SSLs)
•Regulated Drinking Water Contaminants
DTSC
•Human Health Risk Assessment (HERO)
•Ecological Risk Assessment (HERO)
Risk Management Criteria for Metals at BLM Mining Sites
NOAA Screening Quick Reference Tables (SQuiRTs)
Human Health and Ecological Risk Assessment Work Plan
Local agency data or general plans for future development
1-12,
18-21,
36-39
7aHum
Sed
Chemical Risk Chemical
Exposure
Sediment
Quality
Receptor Potential human
exposure to
contaminated
sediment under
future conditions.
Exposure pathway is not currently
contaminated above human
health standards, but could
become so and direct
intake/contact/exposure is likely
to occur.38
Data based on
sampling from
site
investigation.
1 = Concentration of contaminant in sediment to
which humans are exposed through direct contact or
consumption exceedsthe standard OR background
level.
0 = Concentration of contaminant in sediment to
which humans are exposed through direct contact or
consumption does not exceed thresholds or
background level.
Evaluation Type: Linear (Continuous)
EPA:
•Regional Screening Levels (RSLs)
•Ecological Soil Screening Levels (SSLs)
•Regulated Drinking Water Contaminants
DTSC
•Human Health Risk Assessment (HERO)
•Ecological Risk Assessment (HERO)
Risk Management Criteria for Metals at BLM Mining Sites
NOAA Screening Quick Reference Tables (SQuiRTs)
Human Health and Ecological Risk Assessment Work Plan
USFS Soil Quality Monitoring
Local agency data or general plans for future development
17, 19-
21, 39
Page 79 Tier 3 - Chemical Risk
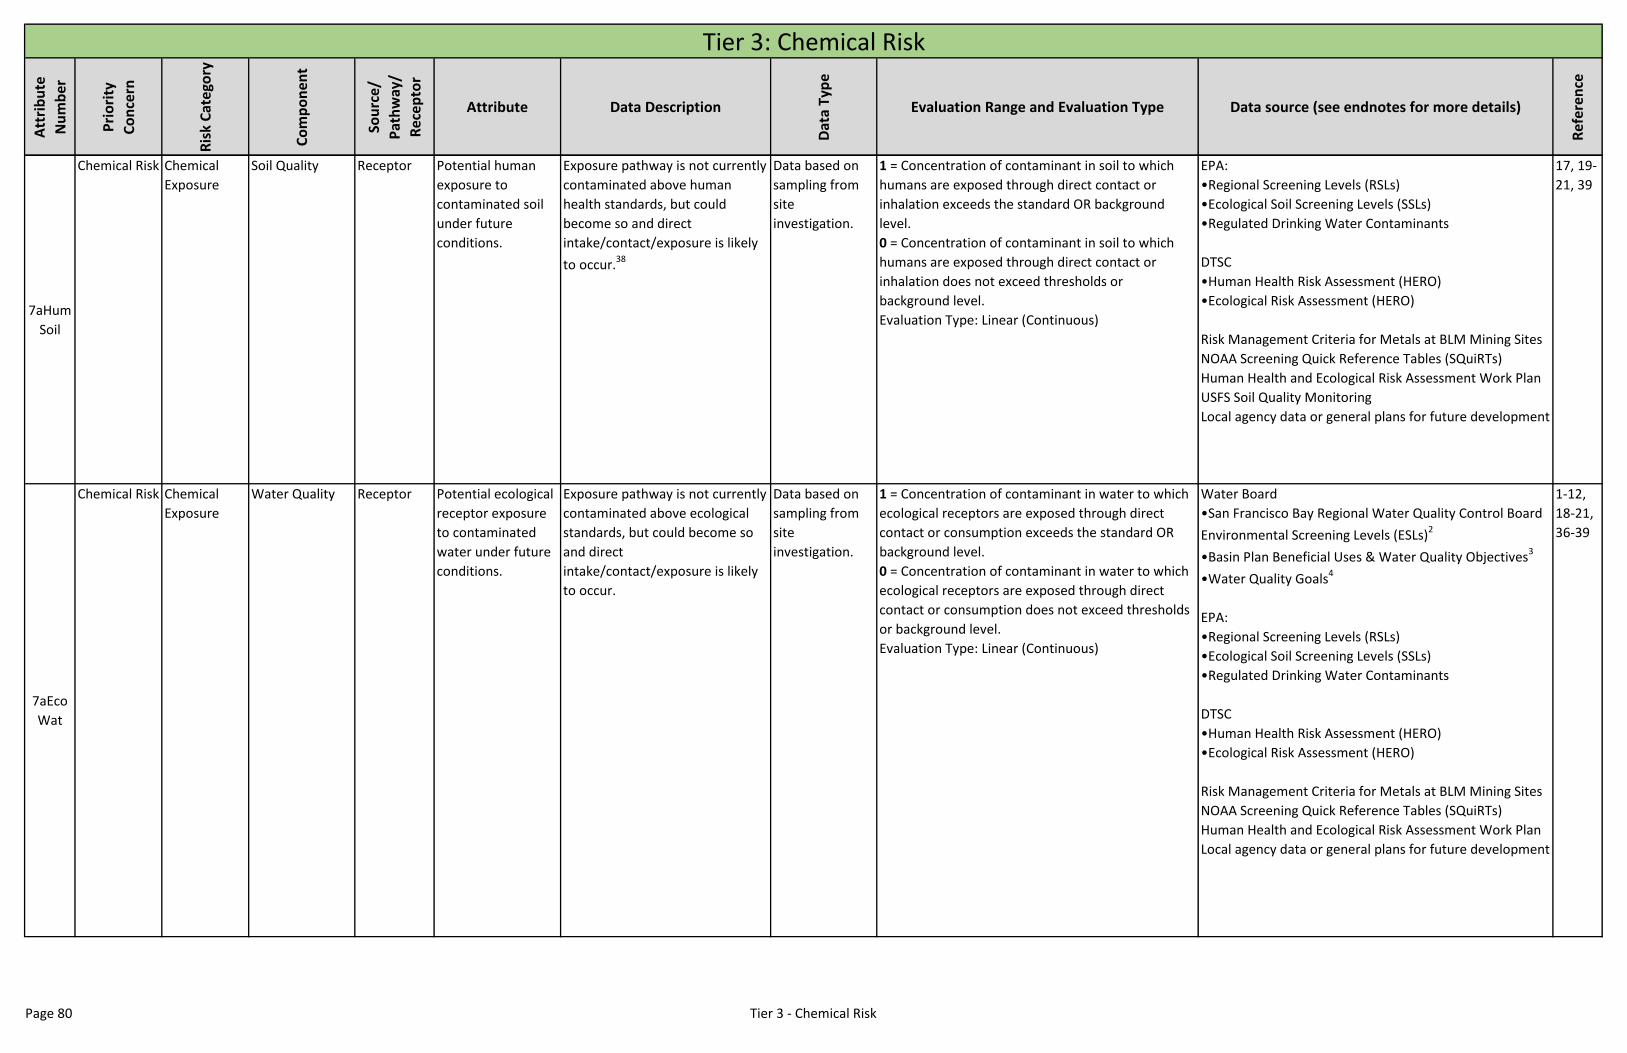
Att
rib
ute
Nu
mb
er
Pri
ori
ty
Co
nce
rn
Ris
k C
ate
gory
Co
mp
on
ent
Sou
rce
/
Pat
hw
ay/
Rec
ep
tor
Attribute Data Description
Dat
a Ty
pe
Evaluation Range and Evaluation Type Data source (see endnotes for more details)
Ref
eren
ce
Tier 3: Chemical Risk
7aHum
Soil
Chemical Risk Chemical
Exposure
Soil Quality Receptor Potential human
exposure to
contaminated soil
under future
conditions.
Exposure pathway is not currently
contaminated above human
health standards, but could
become so and direct
intake/contact/exposure is likely
to occur.38
Data based on
sampling from
site
investigation.
1 = Concentration of contaminant in soil to which
humans are exposed through direct contact or
inhalation exceeds the standard OR background
level.
0 = Concentration of contaminant in soil to which
humans are exposed through direct contact or
inhalation does not exceed thresholds or
background level.
Evaluation Type: Linear (Continuous)
EPA:
•Regional Screening Levels (RSLs)
•Ecological Soil Screening Levels (SSLs)
•Regulated Drinking Water Contaminants
DTSC
•Human Health Risk Assessment (HERO)
•Ecological Risk Assessment (HERO)
Risk Management Criteria for Metals at BLM Mining Sites
NOAA Screening Quick Reference Tables (SQuiRTs)
Human Health and Ecological Risk Assessment Work Plan
USFS Soil Quality Monitoring
Local agency data or general plans for future development
17, 19-
21, 39
7aEco
Wat
Chemical Risk Chemical
Exposure
Water Quality Receptor Potential ecological
receptor exposure
to contaminated
water under future
conditions.
Exposure pathway is not currently
contaminated above ecological
standards, but could become so
and direct
intake/contact/exposure is likely
to occur.
Data based on
sampling from
site
investigation.
1 = Concentration of contaminant in water to which
ecological receptors are exposed through direct
contact or consumption exceeds the standard OR
background level.
0 = Concentration of contaminant in water to which
ecological receptors are exposed through direct
contact or consumption does not exceed thresholds
or background level.
Evaluation Type: Linear (Continuous)
Water Board
•San Francisco Bay Regional Water Quality Control Board
Environmental Screening Levels (ESLs)2
•Basin Plan Beneficial Uses & Water Quality Objectives3
•Water Quality Goals4
EPA:
•Regional Screening Levels (RSLs)
•Ecological Soil Screening Levels (SSLs)
•Regulated Drinking Water Contaminants
DTSC
•Human Health Risk Assessment (HERO)
•Ecological Risk Assessment (HERO)
Risk Management Criteria for Metals at BLM Mining Sites
NOAA Screening Quick Reference Tables (SQuiRTs)
Human Health and Ecological Risk Assessment Work Plan
Local agency data or general plans for future development
1-12,
18-21,
36-39
Page 80 Tier 3 - Chemical Risk
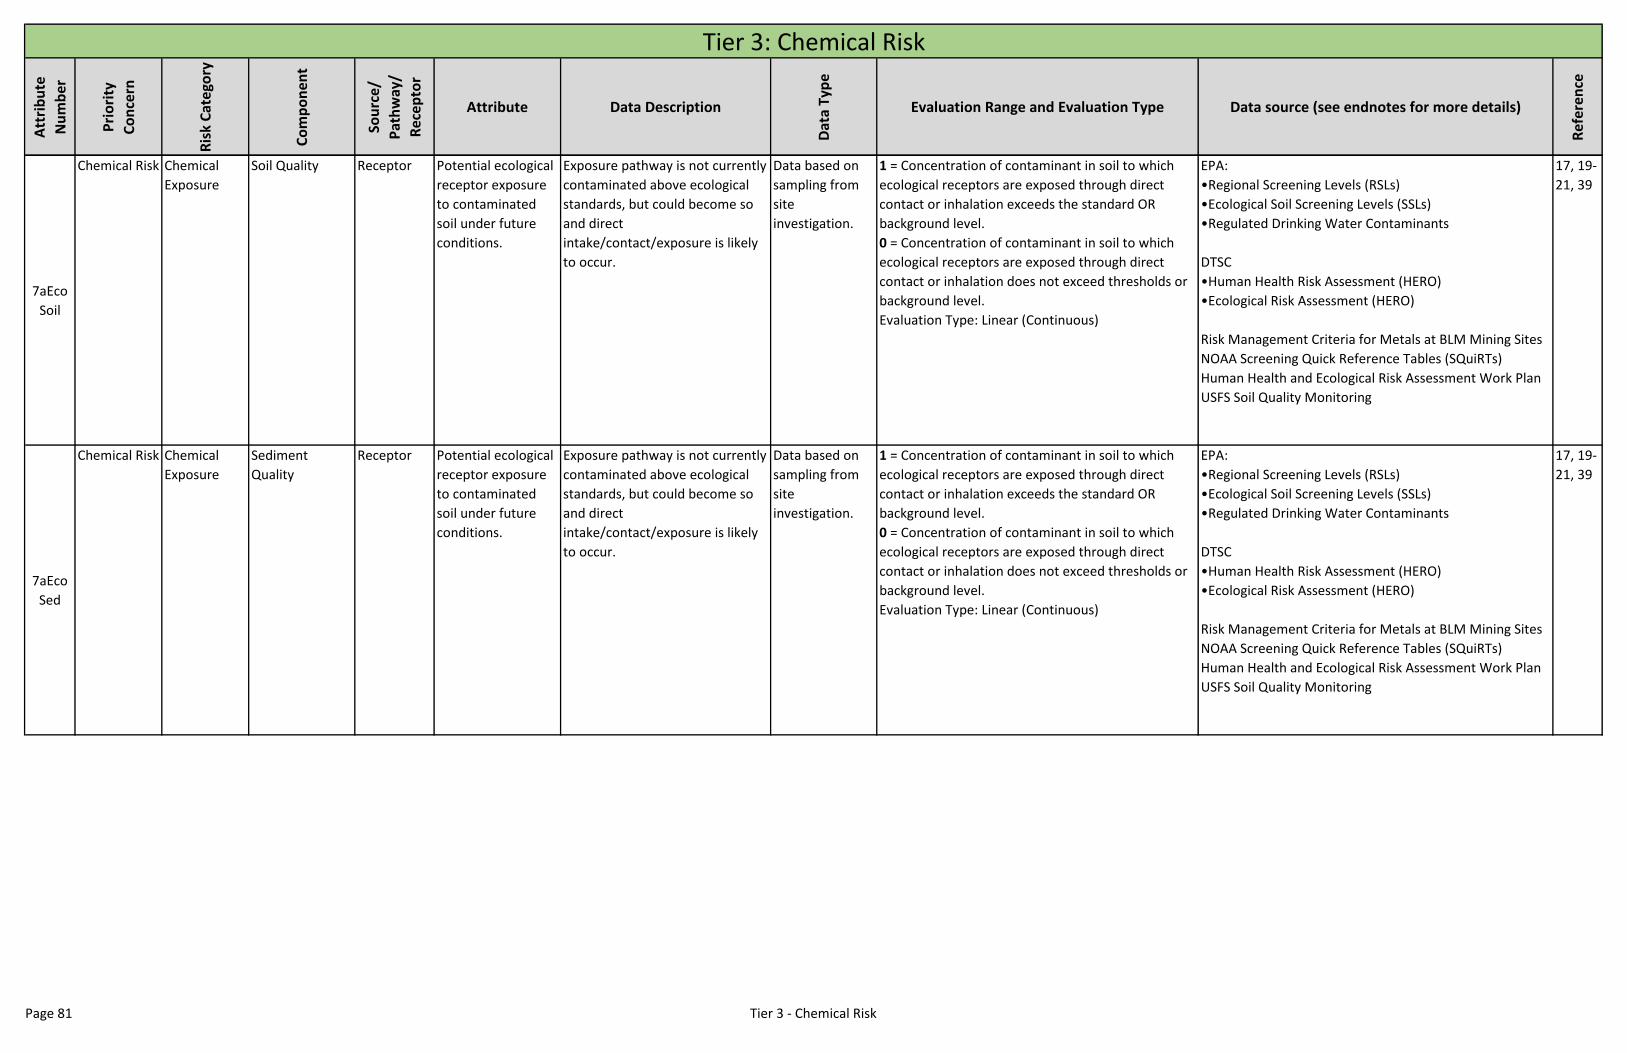
Att
rib
ute
Nu
mb
er
Pri
ori
ty
Co
nce
rn
Ris
k C
ate
gory
Co
mp
on
ent
Sou
rce
/
Pat
hw
ay/
Rec
ep
tor
Attribute Data Description
Dat
a Ty
pe
Evaluation Range and Evaluation Type Data source (see endnotes for more details)
Ref
eren
ce
Tier 3: Chemical Risk
7aEco
Soil
Chemical Risk Chemical
Exposure
Soil Quality Receptor Potential ecological
receptor exposure
to contaminated
soil under future
conditions.
Exposure pathway is not currently
contaminated above ecological
standards, but could become so
and direct
intake/contact/exposure is likely
to occur.
Data based on
sampling from
site
investigation.
1 = Concentration of contaminant in soil to which
ecological receptors are exposed through direct
contact or inhalation exceeds the standard OR
background level.
0 = Concentration of contaminant in soil to which
ecological receptors are exposed through direct
contact or inhalation does not exceed thresholds or
background level.
Evaluation Type: Linear (Continuous)
EPA:
•Regional Screening Levels (RSLs)
•Ecological Soil Screening Levels (SSLs)
•Regulated Drinking Water Contaminants
DTSC
•Human Health Risk Assessment (HERO)
•Ecological Risk Assessment (HERO)
Risk Management Criteria for Metals at BLM Mining Sites
NOAA Screening Quick Reference Tables (SQuiRTs)
Human Health and Ecological Risk Assessment Work Plan
USFS Soil Quality Monitoring
17, 19-
21, 39
7aEco
Sed
Chemical Risk Chemical
Exposure
Sediment
Quality
Receptor Potential ecological
receptor exposure
to contaminated
soil under future
conditions.
Exposure pathway is not currently
contaminated above ecological
standards, but could become so
and direct
intake/contact/exposure is likely
to occur.
Data based on
sampling from
site
investigation.
1 = Concentration of contaminant in soil to which
ecological receptors are exposed through direct
contact or inhalation exceeds the standard OR
background level.
0 = Concentration of contaminant in soil to which
ecological receptors are exposed through direct
contact or inhalation does not exceed thresholds or
background level.
Evaluation Type: Linear (Continuous)
EPA:
•Regional Screening Levels (RSLs)
•Ecological Soil Screening Levels (SSLs)
•Regulated Drinking Water Contaminants
DTSC
•Human Health Risk Assessment (HERO)
•Ecological Risk Assessment (HERO)
Risk Management Criteria for Metals at BLM Mining Sites
NOAA Screening Quick Reference Tables (SQuiRTs)
Human Health and Ecological Risk Assessment Work Plan
USFS Soil Quality Monitoring
17, 19-
21, 39
Page 81 Tier 3 - Chemical Risk

Att
rib
ute
Nu
mb
er
Pri
ori
ty
Co
nce
rn
Ris
k C
ate
gory
Co
mp
on
ent
Sou
rce
/
Pat
hw
ay/
Rec
ep
tor
Attribute Data Description
Dat
a Ty
pe
Evaluation Range and Evaluation Type Data source (see endnotes for more details)
Ref
eren
ce
Tier 3: Chemical Risk
7bHum
Food
Chemical Risk Chemical
Exposure
Food Quality Receptor Potential exposure
of humans to
contaminated fish
under future
conditions.
Exposure pathway is not currently
contaminated above human
health standards, but could
become so and direct
intake/contact/exposure is likely
to occur.38
Data based on
sampling from
site
investigation.
1 = Concentration of contaminant in aquatic
organisms in waterbody exceeds the standard OR
background level AND humans consume the
organisms, OR a human population that consumes
fish is located near the contaminated water body.
0 = Concentration of contaminant in aquatic
organisms in waterbody does not exceed thresholds,
OR no humans consume the organisms, OR no
human population that consumes fish is located near
the contaminated water body.
Evaluation Type: Linear (Continuous)
Water Board
•San Francisco Bay Regional Water Quality Control Board
Environmental Screening Levels (ESLs)2
•Basin Plan Beneficial Uses & Water Quality Objectives3
•Water Quality Goals4
EPA Regional Screening Levels (RSLs)
DTSC
•Human Health Risk Assessment (HERO)
•Ecological Risk Assessment (HERO)
Risk Management Criteria for Metals at BLM Mining Sites
NOAA Screening Quick Reference Tables (SQuiRTs)
Human Health and Ecological Risk Assessment Work Plan
CDFW creel survey
Local agency data or general plans for future development
1-12,
19-21,
36
7bEco
Food
Chemical Risk Chemical
Exposure
Food Quality Receptor Potential exposure
of ecological
receptors to
contaminated fish
under future
conditions.
Exposure pathway is not currently
contaminated above ecological
standards, but could become so
and direct
intake/contact/exposure is likely
to occur.
Data based on
sampling from
site
investigation
1 = Concentration of contaminant in aquatic
organisms in waterbody exceeds the standard OR
background level AND biota consume the organisms,
OR a wildlife population that consumes fish is
located near the contaminated water body.
0 = Concentration of contaminant in aquatic
organisms in waterbody does not exceed thresholds,
OR no biota consume the organisms, OR no wildlife
population that consumes fish is located near the
contaminated water body.
Evaluation Type: Linear (Continuous)
Water Board
•San Francisco Bay Regional Water Quality Control Board
Environmental Screening Levels (ESLs)2
•Basin Plan Beneficial Uses & Water Quality Objectives3
•Water Quality Goals4
EPA Regional Screening Levels (RSLs)
DTSC
•Human Health Risk Assessment (HERO)
•Ecological Risk Assessment (HERO)
Risk Management Criteria for Metals at BLM Mining Sites
NOAA Screening Quick Reference Tables (SQuiRTs)
Human Health and Ecological Risk Assessment Work Plan
CDFW creel survey
1-12,
19-21,
36
Page 82 Tier 3 - Chemical Risk
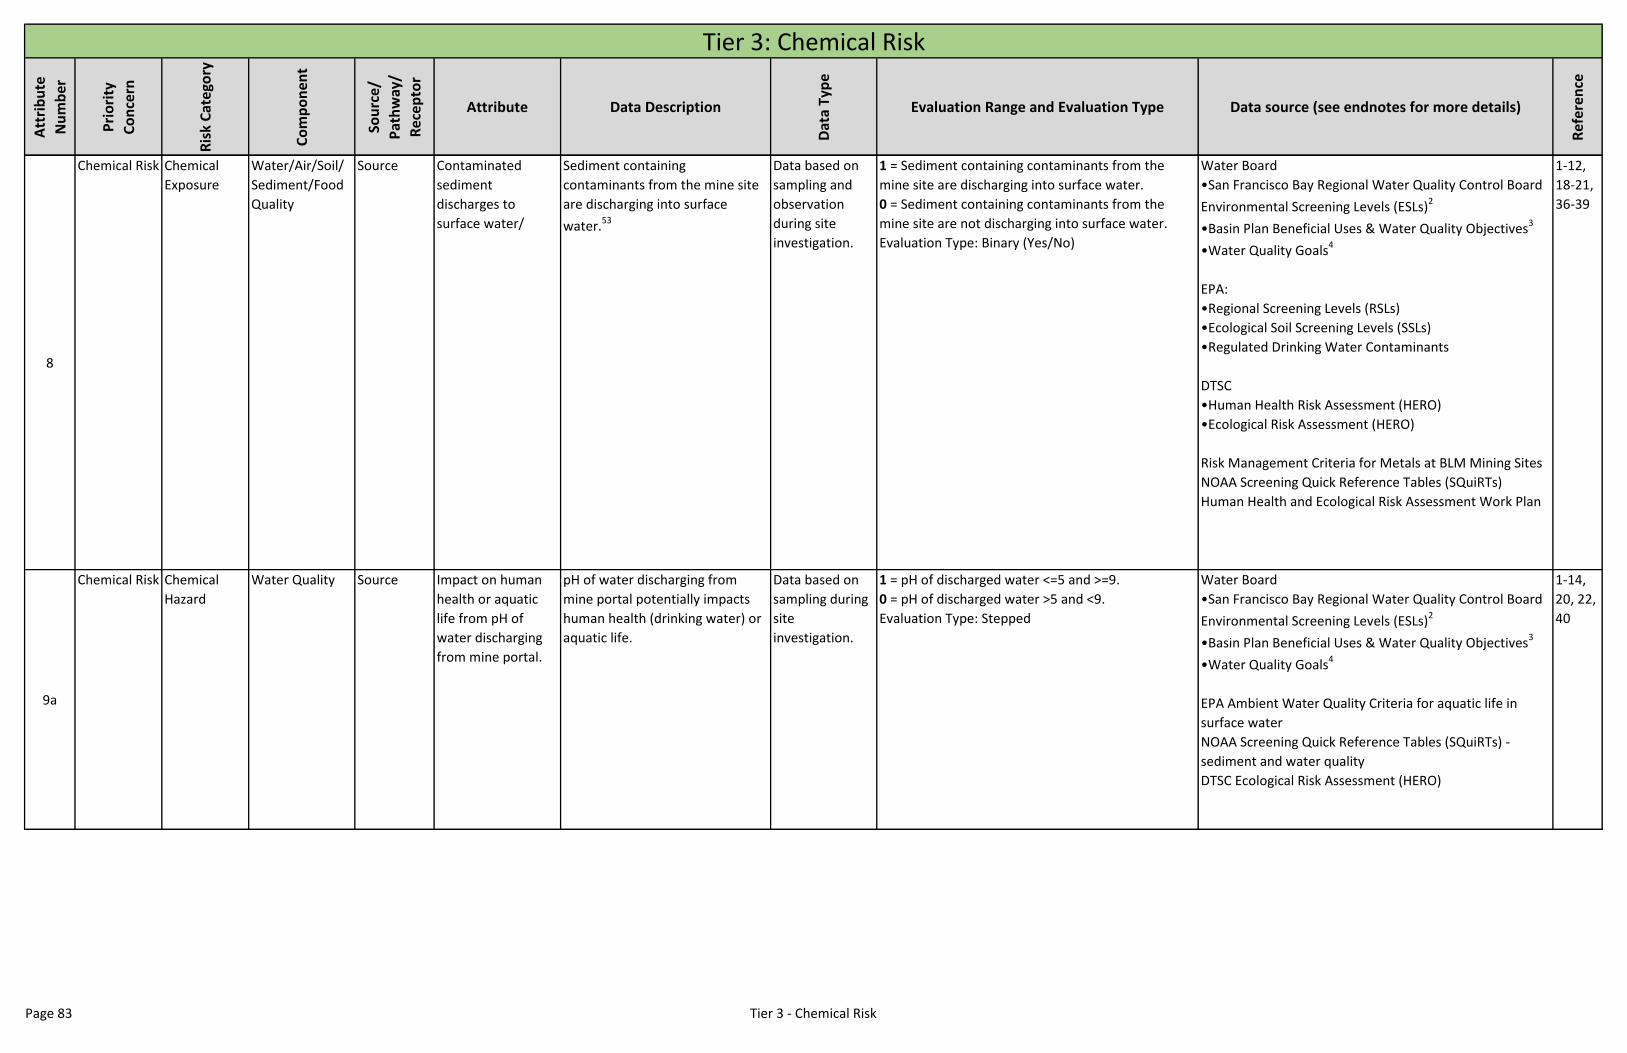
Att
rib
ute
Nu
mb
er
Pri
ori
ty
Co
nce
rn
Ris
k C
ate
gory
Co
mp
on
ent
Sou
rce
/
Pat
hw
ay/
Rec
ep
tor
Attribute Data Description
Dat
a Ty
pe
Evaluation Range and Evaluation Type Data source (see endnotes for more details)
Ref
eren
ce
Tier 3: Chemical Risk
8
Chemical Risk Chemical
Exposure
Water/Air/Soil/
Sediment/Food
Quality
Source Contaminated
sediment
discharges to
surface water/
Sediment containing
contaminants from the mine site
are discharging into surface
water.53
Data based on
sampling and
observation
during site
investigation.
1 = Sediment containing contaminants from the
mine site are discharging into surface water.
0 = Sediment containing contaminants from the
mine site are not discharging into surface water.
Evaluation Type: Binary (Yes/No)
Water Board
•San Francisco Bay Regional Water Quality Control Board
Environmental Screening Levels (ESLs)2
•Basin Plan Beneficial Uses & Water Quality Objectives3
•Water Quality Goals4
EPA:
•Regional Screening Levels (RSLs)
•Ecological Soil Screening Levels (SSLs)
•Regulated Drinking Water Contaminants
DTSC
•Human Health Risk Assessment (HERO)
•Ecological Risk Assessment (HERO)
Risk Management Criteria for Metals at BLM Mining Sites
NOAA Screening Quick Reference Tables (SQuiRTs)
Human Health and Ecological Risk Assessment Work Plan
1-12,
18-21,
36-39
9a
Chemical Risk Chemical
Hazard
Water Quality Source Impact on human
health or aquatic
life from pH of
water discharging
from mine portal.
pH of water discharging from
mine portal potentially impacts
human health (drinking water) or
aquatic life.
Data based on
sampling during
site
investigation.
1 = pH of discharged water <=5 and >=9.
0 = pH of discharged water >5 and <9.
Evaluation Type: Stepped
Water Board
•San Francisco Bay Regional Water Quality Control Board
Environmental Screening Levels (ESLs)2
•Basin Plan Beneficial Uses & Water Quality Objectives3
•Water Quality Goals4
EPA Ambient Water Quality Criteria for aquatic life in
surface water
NOAA Screening Quick Reference Tables (SQuiRTs) -
sediment and water quality
DTSC Ecological Risk Assessment (HERO)
1-14,
20, 22,
40
Page 83 Tier 3 - Chemical Risk
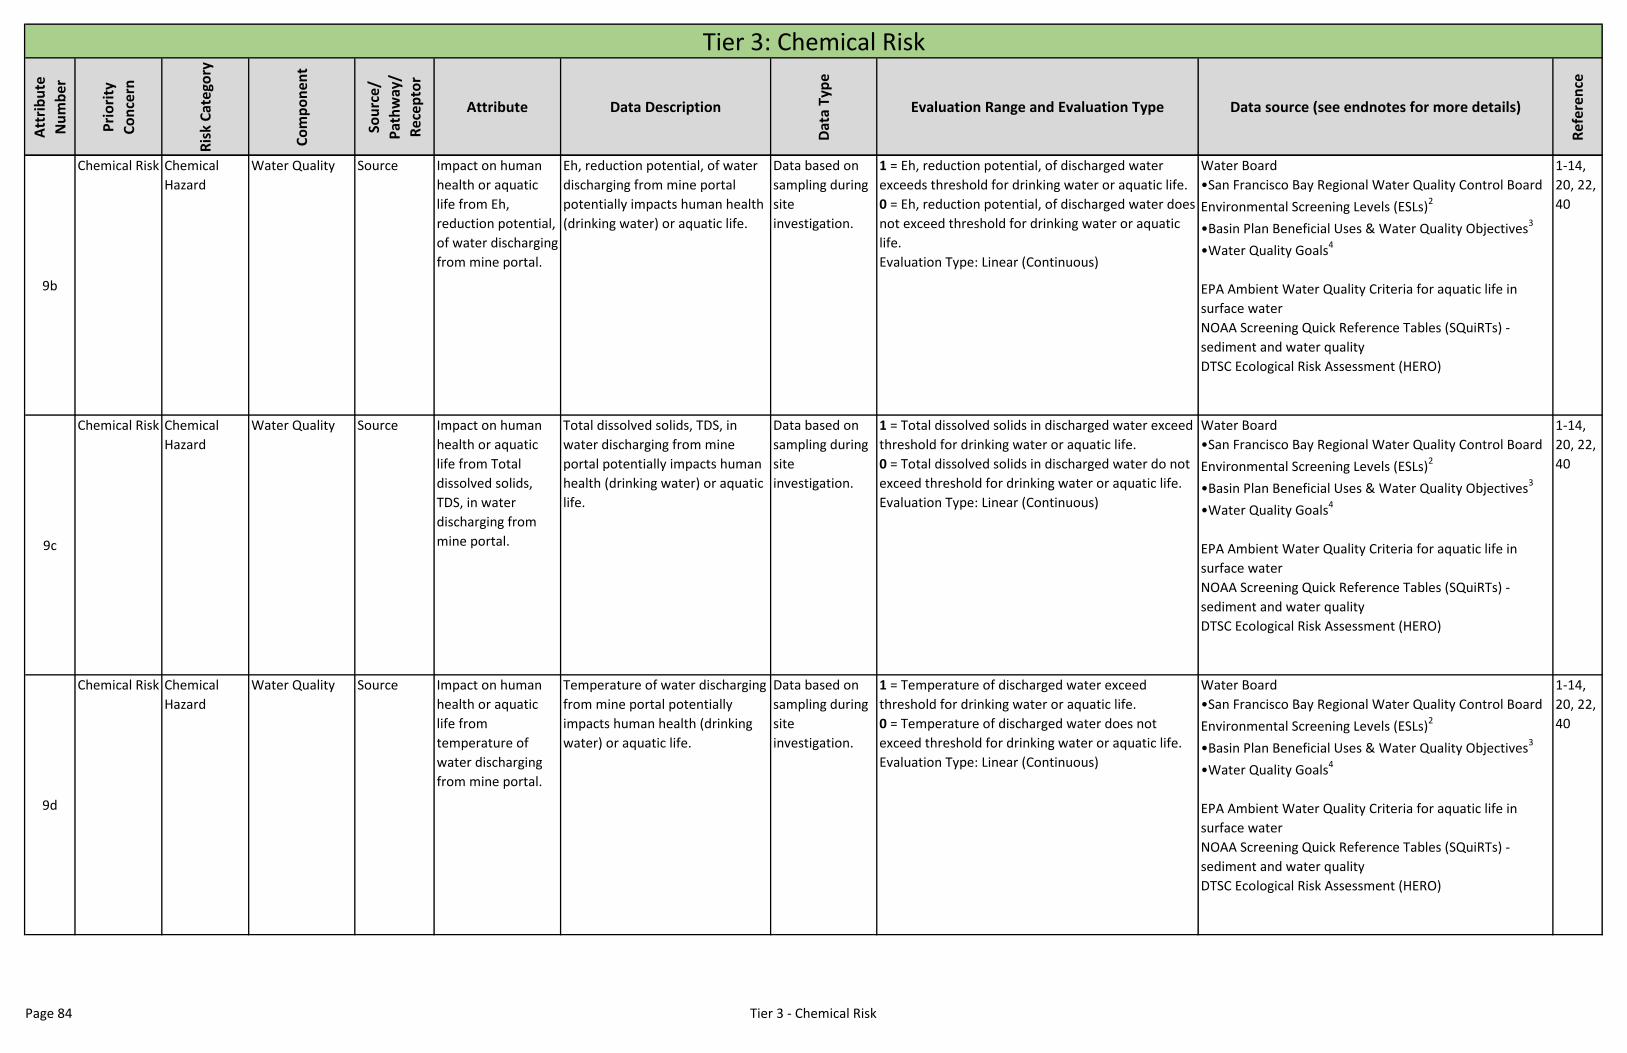
Att
rib
ute
Nu
mb
er
Pri
ori
ty
Co
nce
rn
Ris
k C
ate
gory
Co
mp
on
ent
Sou
rce
/
Pat
hw
ay/
Rec
ep
tor
Attribute Data Description
Dat
a Ty
pe
Evaluation Range and Evaluation Type Data source (see endnotes for more details)
Ref
eren
ce
Tier 3: Chemical Risk
9b
Chemical Risk Chemical
Hazard
Water Quality Source Impact on human
health or aquatic
life from Eh,
reduction potential,
of water discharging
from mine portal.
Eh, reduction potential, of water
discharging from mine portal
potentially impacts human health
(drinking water) or aquatic life.
Data based on
sampling during
site
investigation.
1 = Eh, reduction potential, of discharged water
exceeds threshold for drinking water or aquatic life.
0 = Eh, reduction potential, of discharged water does
not exceed threshold for drinking water or aquatic
life.
Evaluation Type: Linear (Continuous)
Water Board
•San Francisco Bay Regional Water Quality Control Board
Environmental Screening Levels (ESLs)2
•Basin Plan Beneficial Uses & Water Quality Objectives3
•Water Quality Goals4
EPA Ambient Water Quality Criteria for aquatic life in
surface water
NOAA Screening Quick Reference Tables (SQuiRTs) -
sediment and water quality
DTSC Ecological Risk Assessment (HERO)
1-14,
20, 22,
40
9c
Chemical Risk Chemical
Hazard
Water Quality Source Impact on human
health or aquatic
life from Total
dissolved solids,
TDS, in water
discharging from
mine portal.
Total dissolved solids, TDS, in
water discharging from mine
portal potentially impacts human
health (drinking water) or aquatic
life.
Data based on
sampling during
site
investigation.
1 = Total dissolved solids in discharged water exceed
threshold for drinking water or aquatic life.
0 = Total dissolved solids in discharged water do not
exceed threshold for drinking water or aquatic life.
Evaluation Type: Linear (Continuous)
Water Board
•San Francisco Bay Regional Water Quality Control Board
Environmental Screening Levels (ESLs)2
•Basin Plan Beneficial Uses & Water Quality Objectives3
•Water Quality Goals4
EPA Ambient Water Quality Criteria for aquatic life in
surface water
NOAA Screening Quick Reference Tables (SQuiRTs) -
sediment and water quality
DTSC Ecological Risk Assessment (HERO)
1-14,
20, 22,
40
9d
Chemical Risk Chemical
Hazard
Water Quality Source Impact on human
health or aquatic
life from
temperature of
water discharging
from mine portal.
Temperature of water discharging
from mine portal potentially
impacts human health (drinking
water) or aquatic life.
Data based on
sampling during
site
investigation.
1 = Temperature of discharged water exceed
threshold for drinking water or aquatic life.
0 = Temperature of discharged water does not
exceed threshold for drinking water or aquatic life.
Evaluation Type: Linear (Continuous)
Water Board
•San Francisco Bay Regional Water Quality Control Board
Environmental Screening Levels (ESLs)2
•Basin Plan Beneficial Uses & Water Quality Objectives3
•Water Quality Goals4
EPA Ambient Water Quality Criteria for aquatic life in
surface water
NOAA Screening Quick Reference Tables (SQuiRTs) -
sediment and water quality
DTSC Ecological Risk Assessment (HERO)
1-14,
20, 22,
40
Page 84 Tier 3 - Chemical Risk
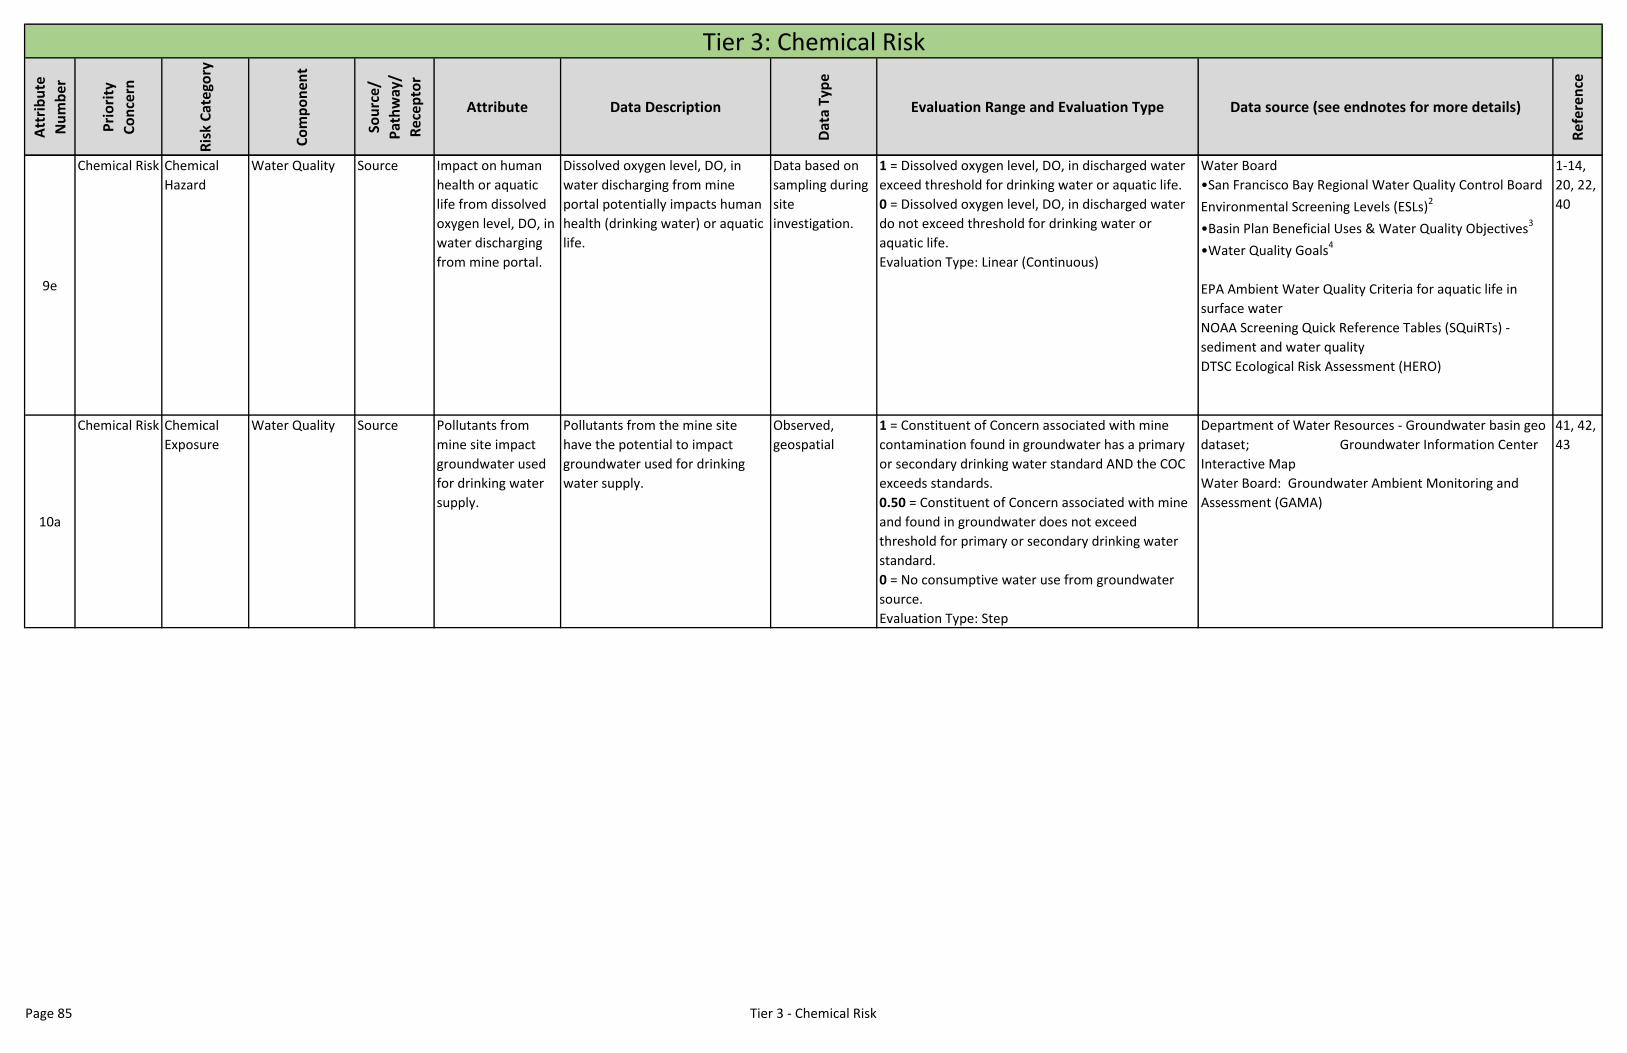
Att
rib
ute
Nu
mb
er
Pri
ori
ty
Co
nce
rn
Ris
k C
ate
gory
Co
mp
on
ent
Sou
rce
/
Pat
hw
ay/
Rec
ep
tor
Attribute Data Description
Dat
a Ty
pe
Evaluation Range and Evaluation Type Data source (see endnotes for more details)
Ref
eren
ce
Tier 3: Chemical Risk
9e
Chemical Risk Chemical
Hazard
Water Quality Source Impact on human
health or aquatic
life from dissolved
oxygen level, DO, in
water discharging
from mine portal.
Dissolved oxygen level, DO, in
water discharging from mine
portal potentially impacts human
health (drinking water) or aquatic
life.
Data based on
sampling during
site
investigation.
1 = Dissolved oxygen level, DO, in discharged water
exceed threshold for drinking water or aquatic life.
0 = Dissolved oxygen level, DO, in discharged water
do not exceed threshold for drinking water or
aquatic life.
Evaluation Type: Linear (Continuous)
Water Board
•San Francisco Bay Regional Water Quality Control Board
Environmental Screening Levels (ESLs)2
•Basin Plan Beneficial Uses & Water Quality Objectives3
•Water Quality Goals4
EPA Ambient Water Quality Criteria for aquatic life in
surface water
NOAA Screening Quick Reference Tables (SQuiRTs) -
sediment and water quality
DTSC Ecological Risk Assessment (HERO)
1-14,
20, 22,
40
10a
Chemical Risk Chemical
Exposure
Water Quality Source Pollutants from
mine site impact
groundwater used
for drinking water
supply.
Pollutants from the mine site
have the potential to impact
groundwater used for drinking
water supply.
Observed,
geospatial
1 = Constituent of Concern associated with mine
contamination found in groundwater has a primary
or secondary drinking water standard AND the COC
exceeds standards.
0.50 = Constituent of Concern associated with mine
and found in groundwater does not exceed
threshold for primary or secondary drinking water
standard.
0 = No consumptive water use from groundwater
source.
Evaluation Type: Step
Department of Water Resources - Groundwater basin geo
dataset; Groundwater Information Center
Interactive Map
Water Board: Groundwater Ambient Monitoring and
Assessment (GAMA)
41, 42,
43
Page 85 Tier 3 - Chemical Risk
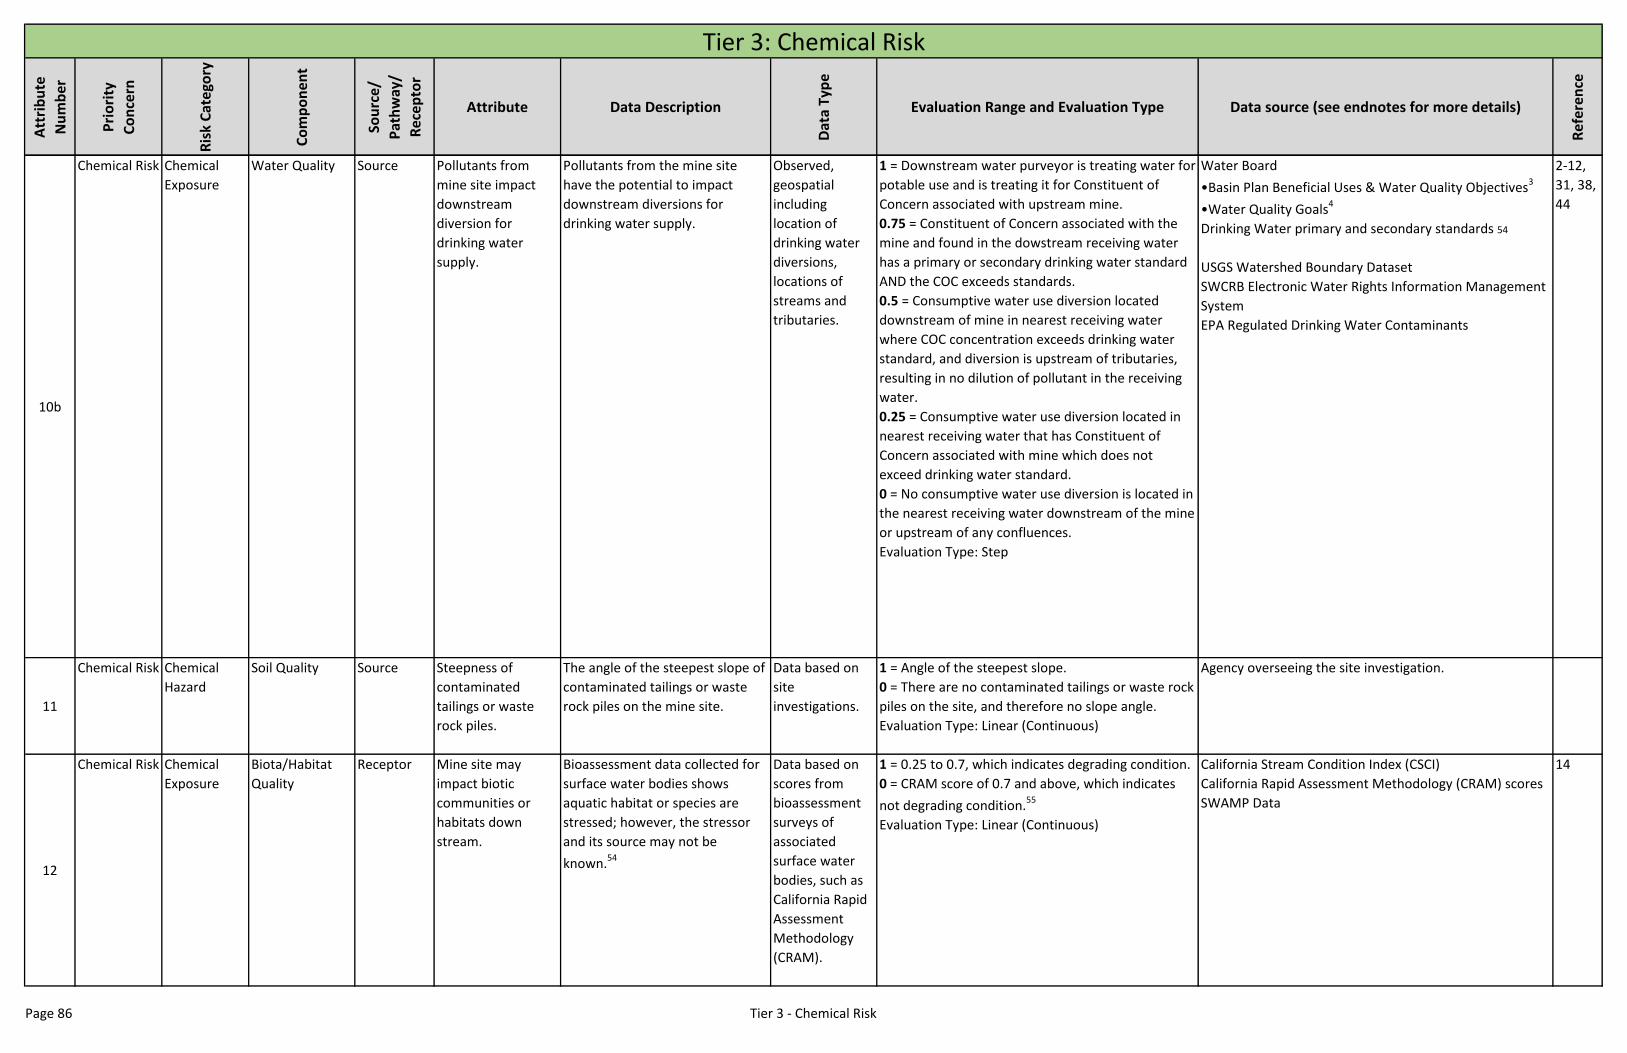
Att
rib
ute
Nu
mb
er
Pri
ori
ty
Co
nce
rn
Ris
k C
ate
gory
Co
mp
on
ent
Sou
rce
/
Pat
hw
ay/
Rec
ep
tor
Attribute Data Description
Dat
a Ty
pe
Evaluation Range and Evaluation Type Data source (see endnotes for more details)
Ref
eren
ce
Tier 3: Chemical Risk
10b
Chemical Risk Chemical
Exposure
Water Quality Source Pollutants from
mine site impact
downstream
diversion for
drinking water
supply.
Pollutants from the mine site
have the potential to impact
downstream diversions for
drinking water supply.
Observed,
geospatial
including
location of
drinking water
diversions,
locations of
streams and
tributaries.
1 = Downstream water purveyor is treating water for
potable use and is treating it for Constituent of
Concern associated with upstream mine.
0.75 = Constituent of Concern associated with the
mine and found in the dowstream receiving water
has a primary or secondary drinking water standard
AND the COC exceeds standards.
0.5 = Consumptive water use diversion located
downstream of mine in nearest receiving water
where COC concentration exceeds drinking water
standard, and diversion is upstream of tributaries,
resulting in no dilution of pollutant in the receiving
water.
0.25 = Consumptive water use diversion located in
nearest receiving water that has Constituent of
Concern associated with mine which does not
exceed drinking water standard.
0 = No consumptive water use diversion is located in
the nearest receiving water downstream of the mine
or upstream of any confluences.
Evaluation Type: Step
Water Board
•Basin Plan Beneficial Uses & Water Quality Objectives3
•Water Quality Goals4
Drinking Water primary and secondary standards 54
USGS Watershed Boundary Dataset
SWCRB Electronic Water Rights Information Management
System
EPA Regulated Drinking Water Contaminants
2-12,
31, 38,
44
11
Chemical Risk Chemical
Hazard
Soil Quality Source Steepness of
contaminated
tailings or waste
rock piles.
The angle of the steepest slope of
contaminated tailings or waste
rock piles on the mine site.
Data based on
site
investigations.
1 = Angle of the steepest slope.
0 = There are no contaminated tailings or waste rock
piles on the site, and therefore no slope angle.
Evaluation Type: Linear (Continuous)
Agency overseeing the site investigation.
12
Chemical Risk Chemical
Exposure
Biota/Habitat
Quality
Receptor Mine site may
impact biotic
communities or
habitats down
stream.
Bioassessment data collected for
surface water bodies shows
aquatic habitat or species are
stressed; however, the stressor
and its source may not be
known.54
Data based on
scores from
bioassessment
surveys of
associated
surface water
bodies, such as
California Rapid
Assessment
Methodology
(CRAM).
1 = 0.25 to 0.7, which indicates degrading condition.
0 = CRAM score of 0.7 and above, which indicates
not degrading condition.55
Evaluation Type: Linear (Continuous)
California Stream Condition Index (CSCI)
California Rapid Assessment Methodology (CRAM) scores
SWAMP Data
14
Page 86 Tier 3 - Chemical Risk

Att
rib
ute
Nu
mb
er
Pri
ori
ty
Co
nce
rn
Ris
k C
ate
gory
Co
mp
on
ent
Sou
rce
/
Pat
hw
ay/
Rec
ep
tor
Attribute Data Description
Dat
a Ty
pe
Evaluation Range and Evaluation Type Data source (see endnotes for more details)
Ref
eren
ce
Tier 3: Chemical Risk
13
Chemical Risk Chemical
Exposure
Water/Soil/
Sediment/Air
Quality
Pathway Constituent of
Concern is highly
leachable from
source material.
The degree to which constituents
are leachable from source
material, and based on
professional interpretation of the
results, whether constituents are
highly leachable from the material
or not and could become
available.
Leach test data 1 = Test results show constituents are highly
leachable from source material.
0 = Test results show constituents are NOT highly
leachable from source material.
Evaluation Type: Binary (Yes/No)
Agency overseeing the site investigation
14
Chemical Risk Chemical
Exposure
Water Quality Receptor Pollutants from
mine site impact
drinking water
wells.
Pollutants from the mine site
have the potential to impact wells
used for drinking water supply.
Geospatial, well
sampling data
during site
investigation.
1 = Constituent of Concern from the mine site found
in well water has a primary or secondary drinking
water standard AND the COC exceeds the threshold.
0.5 = Constituent of Concern from the mine site is
found in well water and does not exceed threshold
for drinking water quality or human consumption.
0= No Constituent of Concern related to
contamination from the mine site is found in well
water.
Evaluation Type: Step
Water Board
Groundwater basin geo dataset
Groundwater Ambient Monitoring and Assessment data
(GAMA) •Basin Plan Beneficial
Uses & Water Quality Objectives3
•Water Quality Goals4
2-12,
41, 43
Page 87 Tier 3 - Chemical Risk
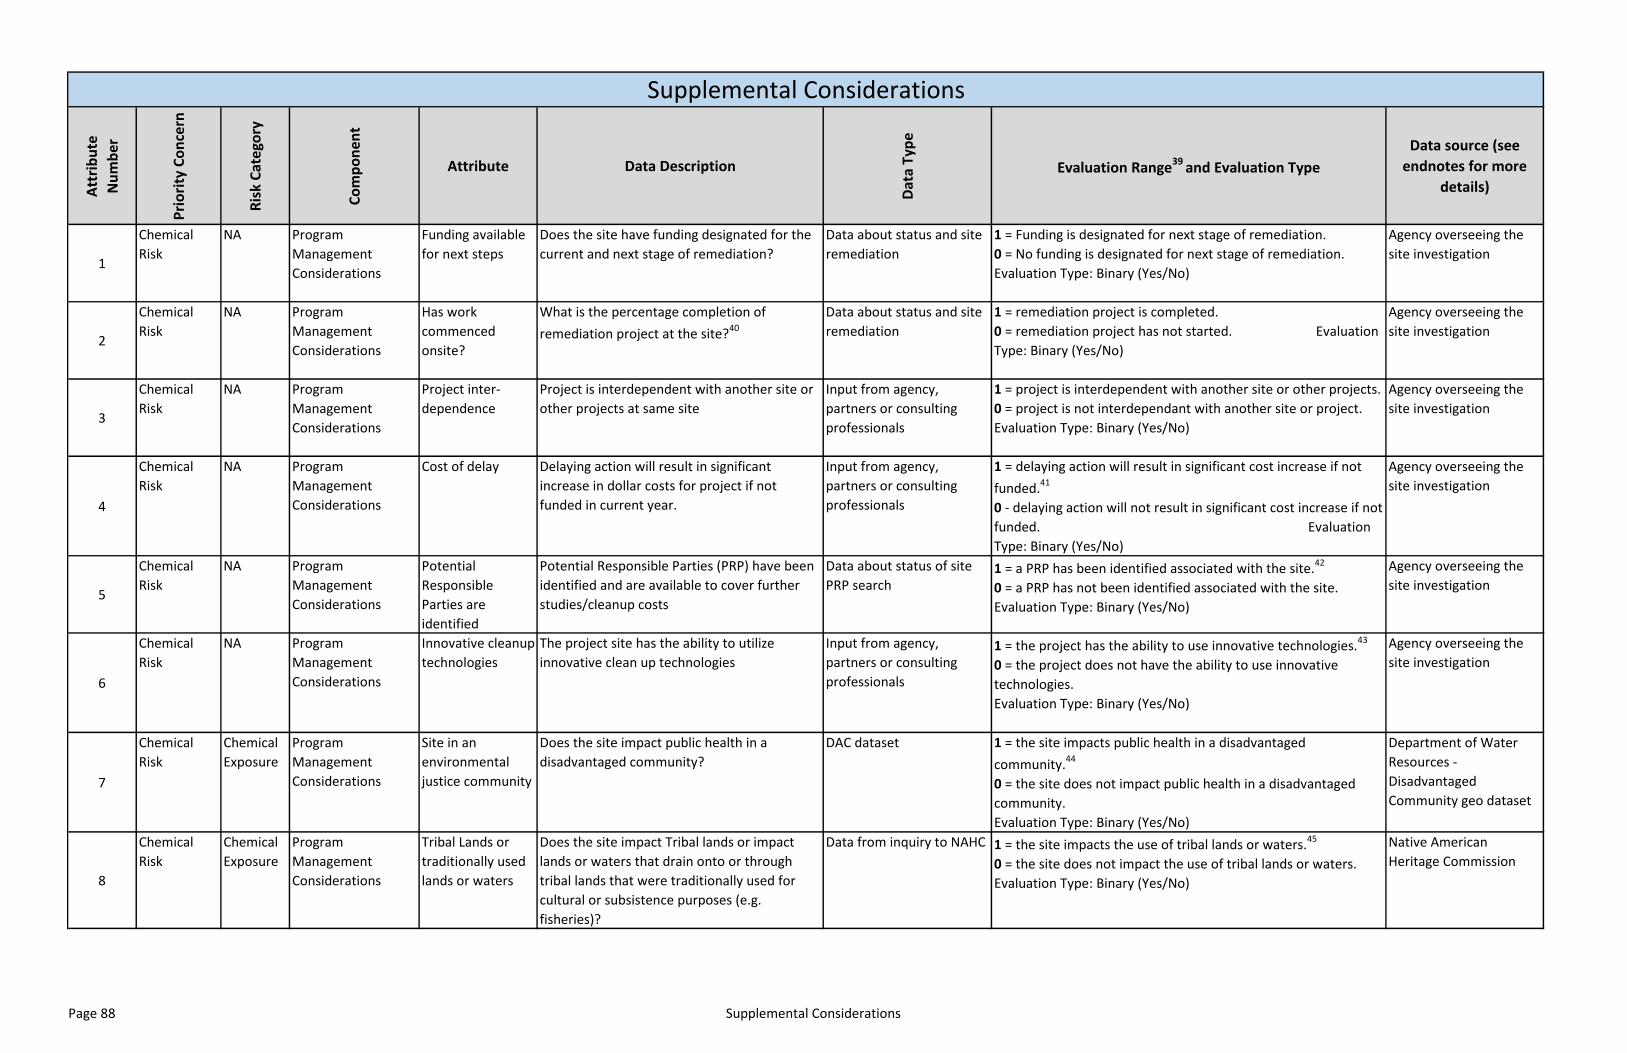
Att
rib
ute
Nu
mb
er
Pri
ori
ty C
on
cern
Ris
k C
ate
gory
Co
mp
on
ent
Attribute Data Description
Dat
a Ty
pe
Evaluation Range39 and Evaluation Type
Data source (see
endnotes for more
details)
1
Chemical
Risk
NA Program
Management
Considerations
Funding available
for next steps
Does the site have funding designated for the
current and next stage of remediation?
Data about status and site
remediation
1 = Funding is designated for next stage of remediation.
0 = No funding is designated for next stage of remediation.
Evaluation Type: Binary (Yes/No)
Agency overseeing the
site investigation
2
Chemical
Risk
NA Program
Management
Considerations
Has work
commenced
onsite?
What is the percentage completion of
remediation project at the site?40
Data about status and site
remediation
1 = remediation project is completed.
0 = remediation project has not started. Evaluation
Type: Binary (Yes/No)
Agency overseeing the
site investigation
3
Chemical
Risk
NA Program
Management
Considerations
Project inter-
dependence
Project is interdependent with another site or
other projects at same site
Input from agency,
partners or consulting
professionals
1 = project is interdependent with another site or other projects.
0 = project is not interdependant with another site or project.
Evaluation Type: Binary (Yes/No)
Agency overseeing the
site investigation
4
Chemical
Risk
NA Program
Management
Considerations
Cost of delay Delaying action will result in significant
increase in dollar costs for project if not
funded in current year.
Input from agency,
partners or consulting
professionals
1 = delaying action will result in significant cost increase if not
funded.41
0 - delaying action will not result in significant cost increase if not
funded. Evaluation
Type: Binary (Yes/No)
Agency overseeing the
site investigation
5
Chemical
Risk
NA Program
Management
Considerations
Potential
Responsible
Parties are
identified
Potential Responsible Parties (PRP) have been
identified and are available to cover further
studies/cleanup costs
Data about status of site
PRP search1 = a PRP has been identified associated with the site.42
0 = a PRP has not been identified associated with the site.
Evaluation Type: Binary (Yes/No)
Agency overseeing the
site investigation
6
Chemical
Risk
NA Program
Management
Considerations
Innovative cleanup
technologies
The project site has the ability to utilize
innovative clean up technologies
Input from agency,
partners or consulting
professionals
1 = the project has the ability to use innovative technologies.43
0 = the project does not have the ability to use innovative
technologies.
Evaluation Type: Binary (Yes/No)
Agency overseeing the
site investigation
7
Chemical
Risk
Chemical
Exposure
Program
Management
Considerations
Site in an
environmental
justice community
Does the site impact public health in a
disadvantaged community?
DAC dataset 1 = the site impacts public health in a disadvantaged
community.44
0 = the site does not impact public health in a disadvantaged
community.
Evaluation Type: Binary (Yes/No)
Department of Water
Resources -
Disadvantaged
Community geo dataset
8
Chemical
Risk
Chemical
Exposure
Program
Management
Considerations
Tribal Lands or
traditionally used
lands or waters
Does the site impact Tribal lands or impact
lands or waters that drain onto or through
tribal lands that were traditionally used for
cultural or subsistence purposes (e.g.
fisheries)?
Data from inquiry to NAHC 1 = the site impacts the use of tribal lands or waters.45
0 = the site does not impact the use of tribal lands or waters.
Evaluation Type: Binary (Yes/No)
Native American
Heritage Commission
Supplemental Considerations
Page 88 Supplemental Considerations
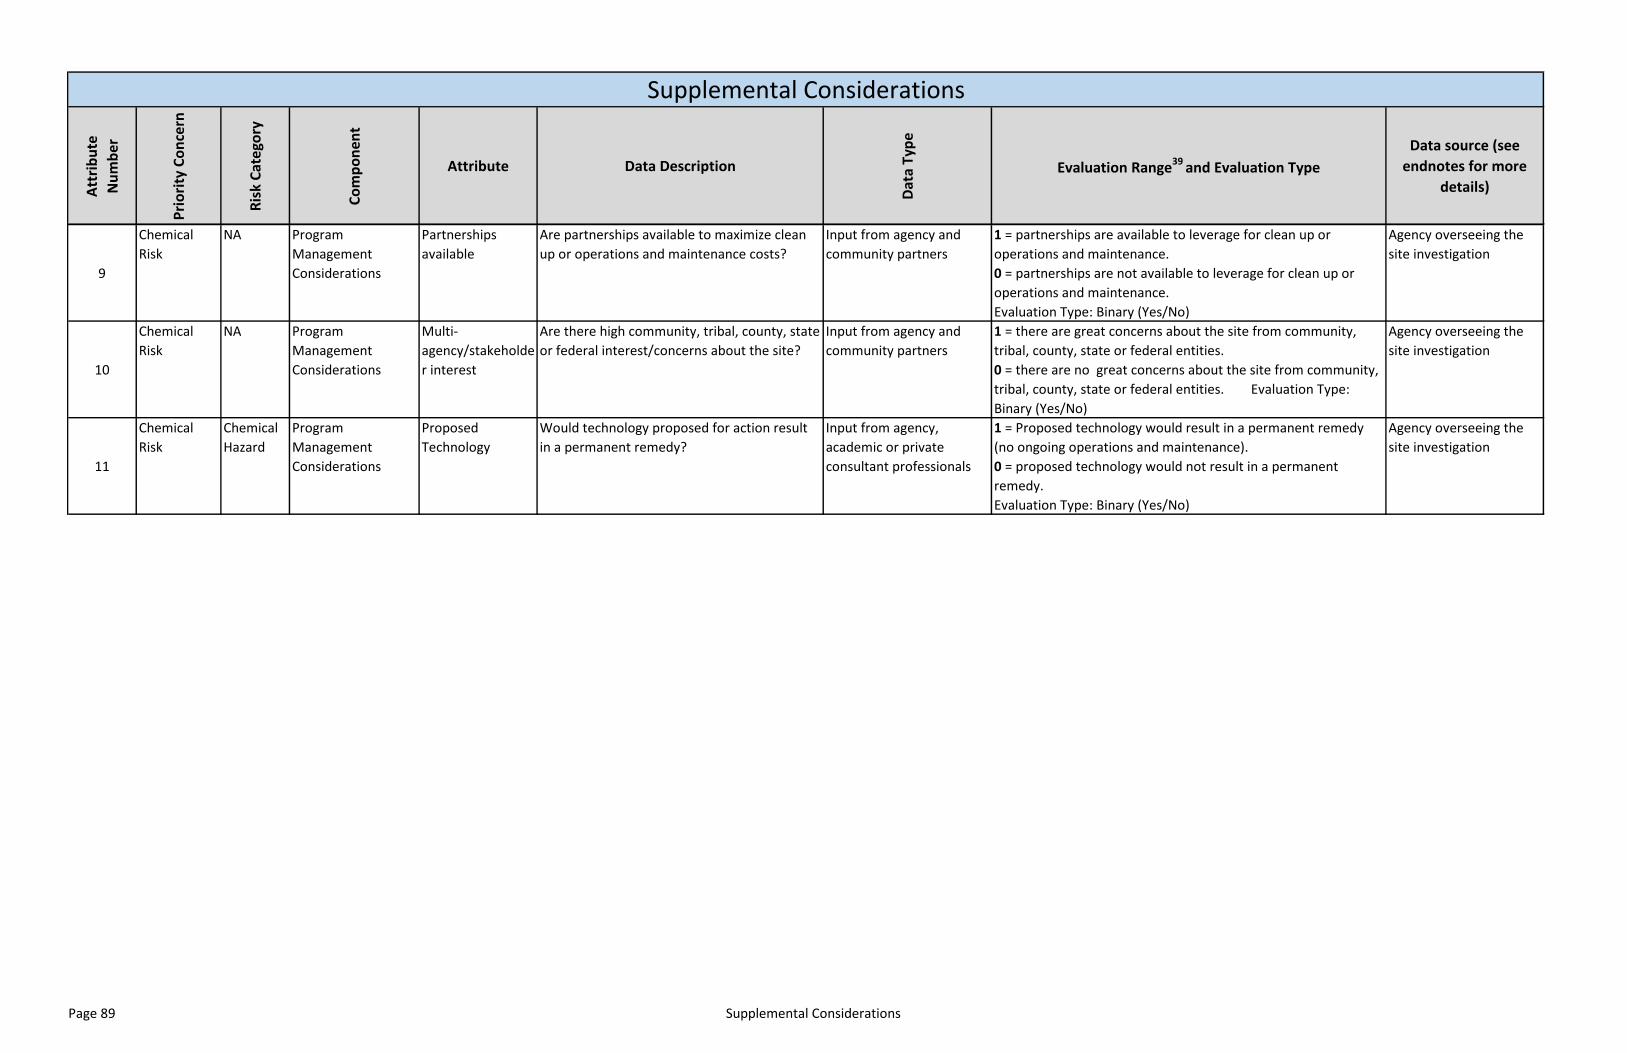
Att
rib
ute
Nu
mb
er
Pri
ori
ty C
on
cern
Ris
k C
ate
gory
Co
mp
on
ent
Attribute Data Description
Dat
a Ty
pe
Evaluation Range39 and Evaluation Type
Data source (see
endnotes for more
details)
Supplemental Considerations
9
Chemical
Risk
NA Program
Management
Considerations
Partnerships
available
Are partnerships available to maximize clean
up or operations and maintenance costs?
Input from agency and
community partners
1 = partnerships are available to leverage for clean up or
operations and maintenance.
0 = partnerships are not available to leverage for clean up or
operations and maintenance.
Evaluation Type: Binary (Yes/No)
Agency overseeing the
site investigation
10
Chemical
Risk
NA Program
Management
Considerations
Multi-
agency/stakeholde
r interest
Are there high community, tribal, county, state
or federal interest/concerns about the site?
Input from agency and
community partners
1 = there are great concerns about the site from community,
tribal, county, state or federal entities.
0 = there are no great concerns about the site from community,
tribal, county, state or federal entities. Evaluation Type:
Binary (Yes/No)
Agency overseeing the
site investigation
11
Chemical
Risk
Chemical
Hazard
Program
Management
Considerations
Proposed
Technology
Would technology proposed for action result
in a permanent remedy?
Input from agency,
academic or private
consultant professionals
1 = Proposed technology would result in a permanent remedy
(no ongoing operations and maintenance).
0 = proposed technology would not result in a permanent
remedy.
Evaluation Type: Binary (Yes/No)
Agency overseeing the
site investigation
Page 89 Supplemental Considerations
California Abandoned Mines Prioritization Tool April 27, 2017 Page | 90 Appendix 7 End Notes and References for Tier 1, 2, and 3 Tables
End Notes are associated with the Data Description, Evaluation Range and Evaluation Type, and Data Source columns in each table. References are associated only with the Reference column in each table.
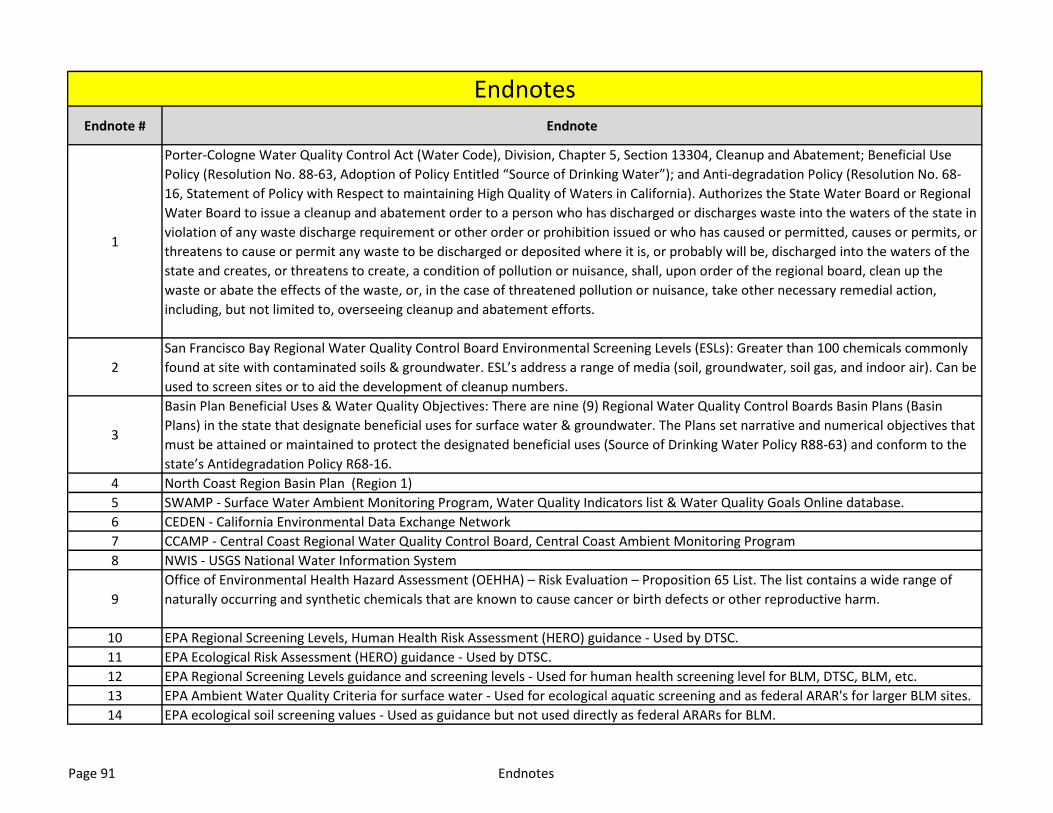
Endnote # Endnote
1
Porter-Cologne Water Quality Control Act (Water Code), Division, Chapter 5, Section 13304, Cleanup and Abatement; Beneficial Use
Policy (Resolution No. 88-63, Adoption of Policy Entitled “Source of Drinking Water”); and Anti-degradation Policy (Resolution No. 68-
16, Statement of Policy with Respect to maintaining High Quality of Waters in California). Authorizes the State Water Board or Regional
Water Board to issue a cleanup and abatement order to a person who has discharged or discharges waste into the waters of the state in
violation of any waste discharge requirement or other order or prohibition issued or who has caused or permitted, causes or permits, or
threatens to cause or permit any waste to be discharged or deposited where it is, or probably will be, discharged into the waters of the
state and creates, or threatens to create, a condition of pollution or nuisance, shall, upon order of the regional board, clean up the
waste or abate the effects of the waste, or, in the case of threatened pollution or nuisance, take other necessary remedial action,
including, but not limited to, overseeing cleanup and abatement efforts.
2
San Francisco Bay Regional Water Quality Control Board Environmental Screening Levels (ESLs): Greater than 100 chemicals commonly
found at site with contaminated soils & groundwater. ESL’s address a range of media (soil, groundwater, soil gas, and indoor air). Can be
used to screen sites or to aid the development of cleanup numbers.
3
Basin Plan Beneficial Uses & Water Quality Objectives: There are nine (9) Regional Water Quality Control Boards Basin Plans (Basin
Plans) in the state that designate beneficial uses for surface water & groundwater. The Plans set narrative and numerical objectives that
must be attained or maintained to protect the designated beneficial uses (Source of Drinking Water Policy R88-63) and conform to the
state’s Antidegradation Policy R68-16.
4 North Coast Region Basin Plan (Region 1)
5 SWAMP - Surface Water Ambient Monitoring Program, Water Quality Indicators list & Water Quality Goals Online database.
6 CEDEN - California Environmental Data Exchange Network
7 CCAMP - Central Coast Regional Water Quality Control Board, Central Coast Ambient Monitoring Program
8 NWIS - USGS National Water Information System
9
Office of Environmental Health Hazard Assessment (OEHHA) – Risk Evaluation – Proposition 65 List. The list contains a wide range of
naturally occurring and synthetic chemicals that are known to cause cancer or birth defects or other reproductive harm.
10 EPA Regional Screening Levels, Human Health Risk Assessment (HERO) guidance - Used by DTSC.
11 EPA Ecological Risk Assessment (HERO) guidance - Used by DTSC.
12 EPA Regional Screening Levels guidance and screening levels - Used for human health screening level for BLM, DTSC, BLM, etc.
13 EPA Ambient Water Quality Criteria for surface water - Used for ecological aquatic screening and as federal ARAR's for larger BLM sites.
14 EPA ecological soil screening values - Used as guidance but not used directly as federal ARARs for BLM.
Endnotes
Page 91 Endnotes

Endnote # Endnote
Endnotes
15Screening Assessment Approaches for Metals in Soil at BLM HazMat/AML Sites - A memo used by BLM that contains some EPA RSL
values as well as BLM derived recreational visitor values.
16 Background Levels will be determined by the investigating agency.
17
Impaired Water Bodies: A waterbody that has been determined under state policy and federal law to be not meeting water quality
standards. An impaired water is a water that has been listed on the California 303(d) list or has not yet been listed but otherwise meets
the criteria for listing. A water is a portion of a surface water of the state, including ocean, estuary, lake, river, creek, or wetland. The
water currently may not be meeting state water quality standards or may be determined to be threatened and have the potential to not
18
Constituents of Concern related to mine sites typically sampled for are CAM17: Antimony, Arsenic, Barium, Beryllium, Cadmium,
Chromium, Cobalt, Copper, Lead, Mercury, Molybdenum, Nickel, Selenium, Silver, Thallium, Vanadium, Zinc; Other and reagents:
Asbestos, Cyanide, Nitrate, Phenolic compounds, Silica, Sulphuric acid, Radionuclides.
19MRDS - USGS Mineral Resource Data System. A collection of reports describing metallic and nonmetallic mineral resources throughout
the world. Included are deposit name, location, commodity, deposit description, geologic characteristics, production, reserves,
20
PAMP - Principal Areas of Mine Pollution. A dataset is a compilation of 2,422 mining operations and their potential water-quality
problems. This information was originally compiled in 1972 by the Division of Mines and Geology for the State Water Resources Control
Board. It was published in a series of volumes of tabular data. The data set includes operations where production exceeded $100,000 or
where other factors indicated a high potential for pollution.
21 CNDDB - California Natural Diversity Database. The CNDDB dataset represents reported locations of sensitive, threatened or
22 BIOS - Biogeographic Information and Observation System
23USGS National Hydrography Dataset (NHD) and Watershed Boundary Dataset (WBD) are used to portray surface water on The National
Map. The NHD represents the drainage network with features such as rivers, streams, canals, lakes, ponds, coastline, dams, and stream
24 USGS Significant Deposits Dataset - USGS is currently compiling GIS layer of significant deposits data.
25 TOMS - Topographically Occurring Mine Symbol
26
Fishing locations/activities- A waterbody that has been determined to support fishing activity where consumption of the fish is likely. A
waterbody that supports recreational, subsistence, or tribal fishing activity where fish consumption has been estimated or is likely.
Fishing activity may be determined based upon DFW creel surveys, or other surveys conducted and/or supported by tribal, federal,
state, or private entities.
27
Drinking Water Quality Standards Database: The Division of Drinking water website includes lists for regulated contaminates and
drinking water standards (Maximum Contaminant Levels), i.e. federal and California MCLs and notifications levels of unregulated
contaminants.
Page 92 Endnotes

Endnote # Endnote
Endnotes
28SWRCB Divisions of Water Rights and Drinking Water has geospatial data for location of potable water diversions in their eWRIMS
dataset.
29
California Historical Resources Information System (CHRIS)- The CHRIS Inventory includes the State Historic Resources Inventory
maintained by the OHP as defined in California Public Resources Code § 5020.1(p), and the larger number of resource records and
research reports managed under contract by the nine Information Centers. The information centers have varying levels of gis
digitization completed. Most have paper maps and reports available. This is a fee for service and only contains information reported to
SHPO through the CEQA/NEPA process. Access is restricted (not public).
30National Register of Historic Places Database - Compiled by the National Park Service, (yearly updates; would need to get permission to
use dataset with sensitive or restricted data).
31 USFS FSTOPO - USFS site for geodatasetsTransportation Line is the dataset that contains all trails and roads.
32 NPS IRMA - Data Portal
33
BLM Roads - Ground Transportation Linear Feature (GTLF) is the data standard for linear features in BLM’s GIS system. Routes is the
roads and OHV trails layer. So GTLF_*Region*_Routes is the likely file structure. This data is not publicly available.
34 BLM Land Status - contains information on ownership for federal, state, local and private lan ownership.
35CPAD - California Protected Areas Data Portal contains GIS data about lands that are owned in fee and protected for open space
purposes by over 1,000 public agencies or non-profit organizations.
36US Census Bureau TIGER dataset - Topographically Integrated Geographic Encoding and Referencing dataset contains a variety of data
including 2010 census data.
37
USFS National Visitor Use Monitoring - The National Visitor Use Monitoring program surveys over 100,000 visitors to National Forest
System lands every five years, with 20% of the national forests conducting surveys each year. This nationwide visitor use survey
provides statistically sound estimates of visitation to each national forest and to each site type. The surveys also provide information
about who these visitors are demographically, why they come to the national forests, how satisfied they are with the facilities and
services provided, and how much money they spend on their visit.
38 Use human proximity attributes to complement 9AHum and 9BHum attributes.
39For all management considerations – recommend giving a multiplier base on how many of these considerations are encompassed by the
site.
Page 93 Endnotes
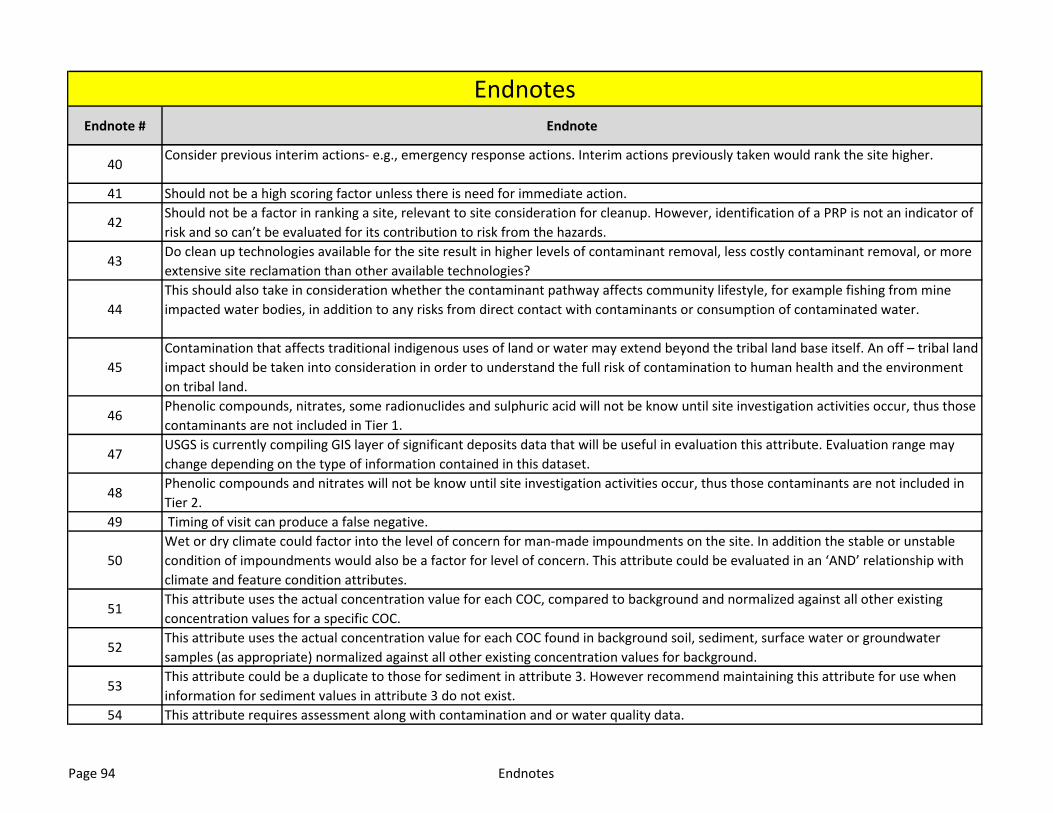
Endnote # Endnote
Endnotes
40Consider previous interim actions- e.g., emergency response actions. Interim actions previously taken would rank the site higher.
41 Should not be a high scoring factor unless there is need for immediate action.
42Should not be a factor in ranking a site, relevant to site consideration for cleanup. However, identification of a PRP is not an indicator of
risk and so can’t be evaluated for its contribution to risk from the hazards.
43Do clean up technologies available for the site result in higher levels of contaminant removal, less costly contaminant removal, or more
extensive site reclamation than other available technologies?
44
This should also take in consideration whether the contaminant pathway affects community lifestyle, for example fishing from mine
impacted water bodies, in addition to any risks from direct contact with contaminants or consumption of contaminated water.
45
Contamination that affects traditional indigenous uses of land or water may extend beyond the tribal land base itself. An off – tribal land
impact should be taken into consideration in order to understand the full risk of contamination to human health and the environment
on tribal land.
46Phenolic compounds, nitrates, some radionuclides and sulphuric acid will not be know until site investigation activities occur, thus those
contaminants are not included in Tier 1.
47USGS is currently compiling GIS layer of significant deposits data that will be useful in evaluation this attribute. Evaluation range may
change depending on the type of information contained in this dataset.
48Phenolic compounds and nitrates will not be know until site investigation activities occur, thus those contaminants are not included in
Tier 2.
49 Timing of visit can produce a false negative.
50
Wet or dry climate could factor into the level of concern for man-made impoundments on the site. In addition the stable or unstable
condition of impoundments would also be a factor for level of concern. This attribute could be evaluated in an ‘AND’ relationship with
climate and feature condition attributes.
51This attribute uses the actual concentration value for each COC, compared to background and normalized against all other existing
concentration values for a specific COC.
52This attribute uses the actual concentration value for each COC found in background soil, sediment, surface water or groundwater
samples (as appropriate) normalized against all other existing concentration values for background.
53This attribute could be a duplicate to those for sediment in attribute 3. However recommend maintaining this attribute for use when
information for sediment values in attribute 3 do not exist.
54 This attribute requires assessment along with contamination and or water quality data.
Page 94 Endnotes
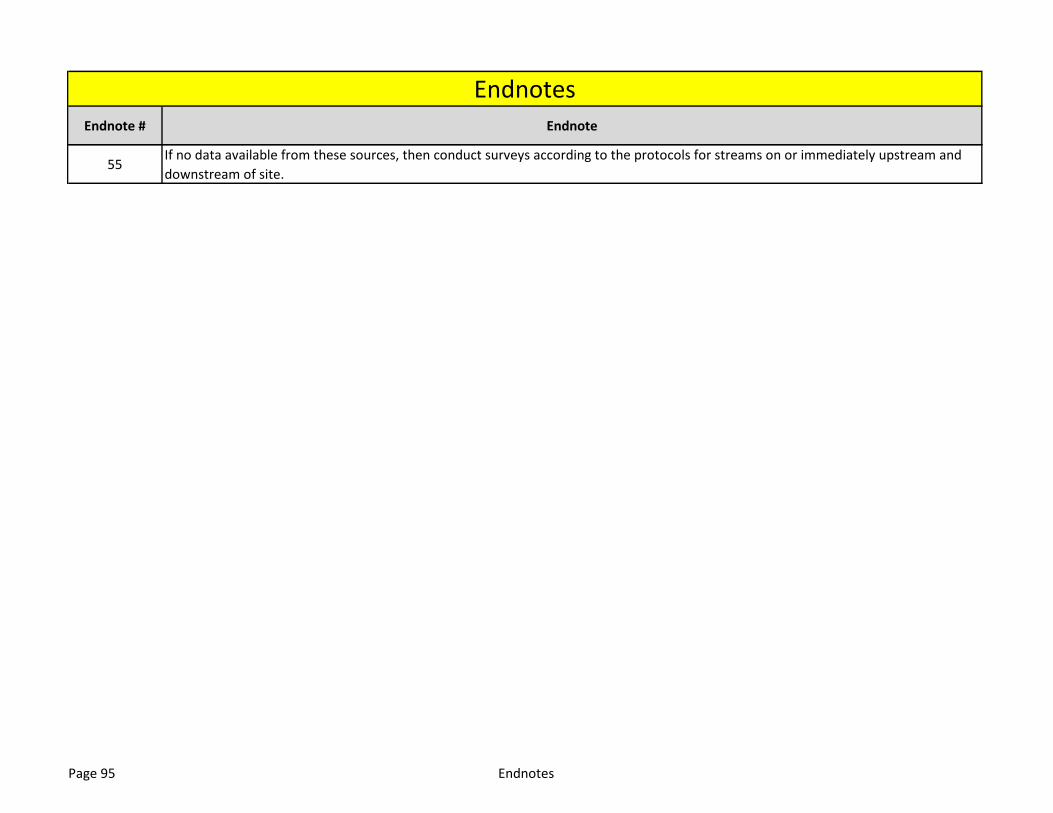
Endnote # Endnote
Endnotes
55If no data available from these sources, then conduct surveys according to the protocols for streams on or immediately upstream and
downstream of site.
Page 95 Endnotes
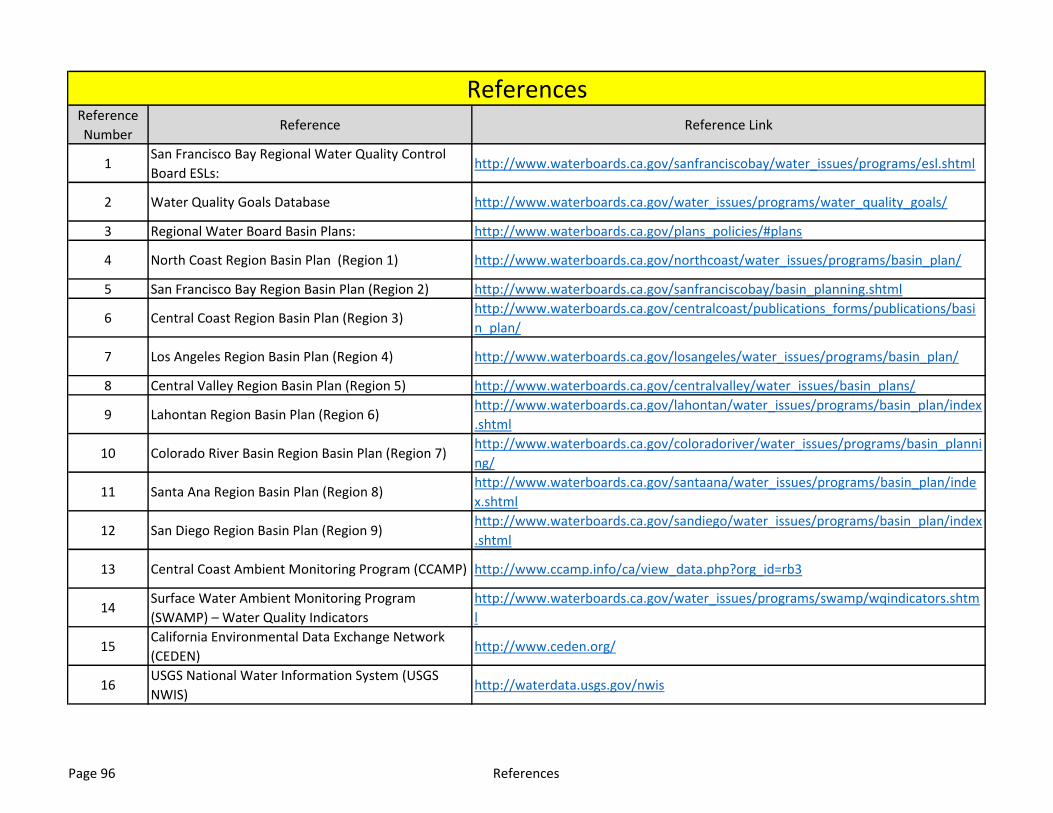
Reference
NumberReference Reference Link
1San Francisco Bay Regional Water Quality Control
Board ESLs:http://www.waterboards.ca.gov/sanfranciscobay/water_issues/programs/esl.shtml
2 Water Quality Goals Database http://www.waterboards.ca.gov/water_issues/programs/water_quality_goals/
3 Regional Water Board Basin Plans: http://www.waterboards.ca.gov/plans_policies/#plans
4 North Coast Region Basin Plan (Region 1) http://www.waterboards.ca.gov/northcoast/water_issues/programs/basin_plan/
5 San Francisco Bay Region Basin Plan (Region 2) http://www.waterboards.ca.gov/sanfranciscobay/basin_planning.shtml
6 Central Coast Region Basin Plan (Region 3)http://www.waterboards.ca.gov/centralcoast/publications_forms/publications/basi
n_plan/
7 Los Angeles Region Basin Plan (Region 4) http://www.waterboards.ca.gov/losangeles/water_issues/programs/basin_plan/
8 Central Valley Region Basin Plan (Region 5) http://www.waterboards.ca.gov/centralvalley/water_issues/basin_plans/
9 Lahontan Region Basin Plan (Region 6)http://www.waterboards.ca.gov/lahontan/water_issues/programs/basin_plan/index
.shtml
10 Colorado River Basin Region Basin Plan (Region 7)http://www.waterboards.ca.gov/coloradoriver/water_issues/programs/basin_planni
ng/
11 Santa Ana Region Basin Plan (Region 8)http://www.waterboards.ca.gov/santaana/water_issues/programs/basin_plan/inde
x.shtml
12 San Diego Region Basin Plan (Region 9)http://www.waterboards.ca.gov/sandiego/water_issues/programs/basin_plan/index
.shtml
13 Central Coast Ambient Monitoring Program (CCAMP) http://www.ccamp.info/ca/view_data.php?org_id=rb3
14Surface Water Ambient Monitoring Program
(SWAMP) – Water Quality Indicators
http://www.waterboards.ca.gov/water_issues/programs/swamp/wqindicators.shtm
l
15California Environmental Data Exchange Network
(CEDEN) http://www.ceden.org/
16USGS National Water Information System (USGS
NWIS) http://waterdata.usgs.gov/nwis
References
Page 96 References
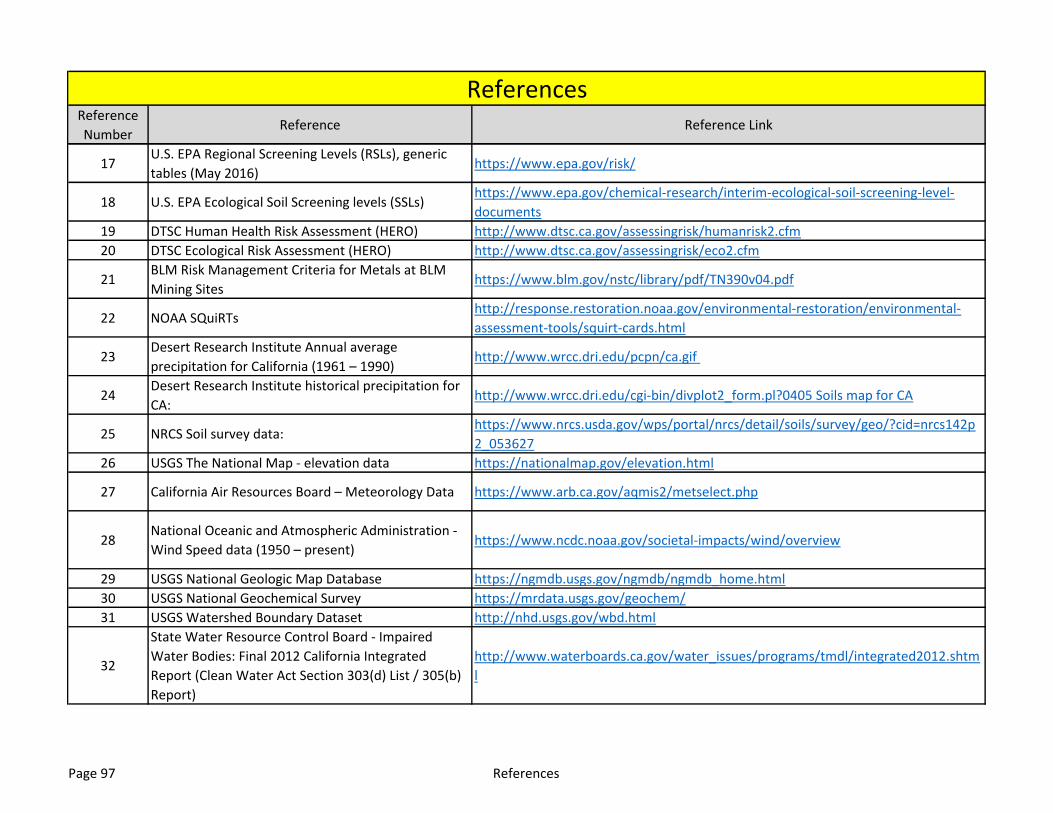
Reference
NumberReference Reference Link
References
17U.S. EPA Regional Screening Levels (RSLs), generic
tables (May 2016)https://www.epa.gov/risk/
18 U.S. EPA Ecological Soil Screening levels (SSLs)https://www.epa.gov/chemical-research/interim-ecological-soil-screening-level-
documents
19 DTSC Human Health Risk Assessment (HERO) http://www.dtsc.ca.gov/assessingrisk/humanrisk2.cfm
20 DTSC Ecological Risk Assessment (HERO) http://www.dtsc.ca.gov/assessingrisk/eco2.cfm
21BLM Risk Management Criteria for Metals at BLM
Mining Siteshttps://www.blm.gov/nstc/library/pdf/TN390v04.pdf
22 NOAA SQuiRTshttp://response.restoration.noaa.gov/environmental-restoration/environmental-
assessment-tools/squirt-cards.html
23Desert Research Institute Annual average
precipitation for California (1961 – 1990) http://www.wrcc.dri.edu/pcpn/ca.gif
24Desert Research Institute historical precipitation for
CA:http://www.wrcc.dri.edu/cgi-bin/divplot2_form.pl?0405 Soils map for CA
25 NRCS Soil survey data:https://www.nrcs.usda.gov/wps/portal/nrcs/detail/soils/survey/geo/?cid=nrcs142p
2_053627
26 USGS The National Map - elevation data https://nationalmap.gov/elevation.html
27 California Air Resources Board – Meteorology Data https://www.arb.ca.gov/aqmis2/metselect.php
28National Oceanic and Atmospheric Administration -
Wind Speed data (1950 – present)https://www.ncdc.noaa.gov/societal-impacts/wind/overview
29 USGS National Geologic Map Database https://ngmdb.usgs.gov/ngmdb/ngmdb_home.html
30 USGS National Geochemical Survey https://mrdata.usgs.gov/geochem/
31 USGS Watershed Boundary Dataset http://nhd.usgs.gov/wbd.html
32
State Water Resource Control Board - Impaired
Water Bodies: Final 2012 California Integrated
Report (Clean Water Act Section 303(d) List / 305(b)
Report)
http://www.waterboards.ca.gov/water_issues/programs/tmdl/integrated2012.shtm
l
Page 97 References
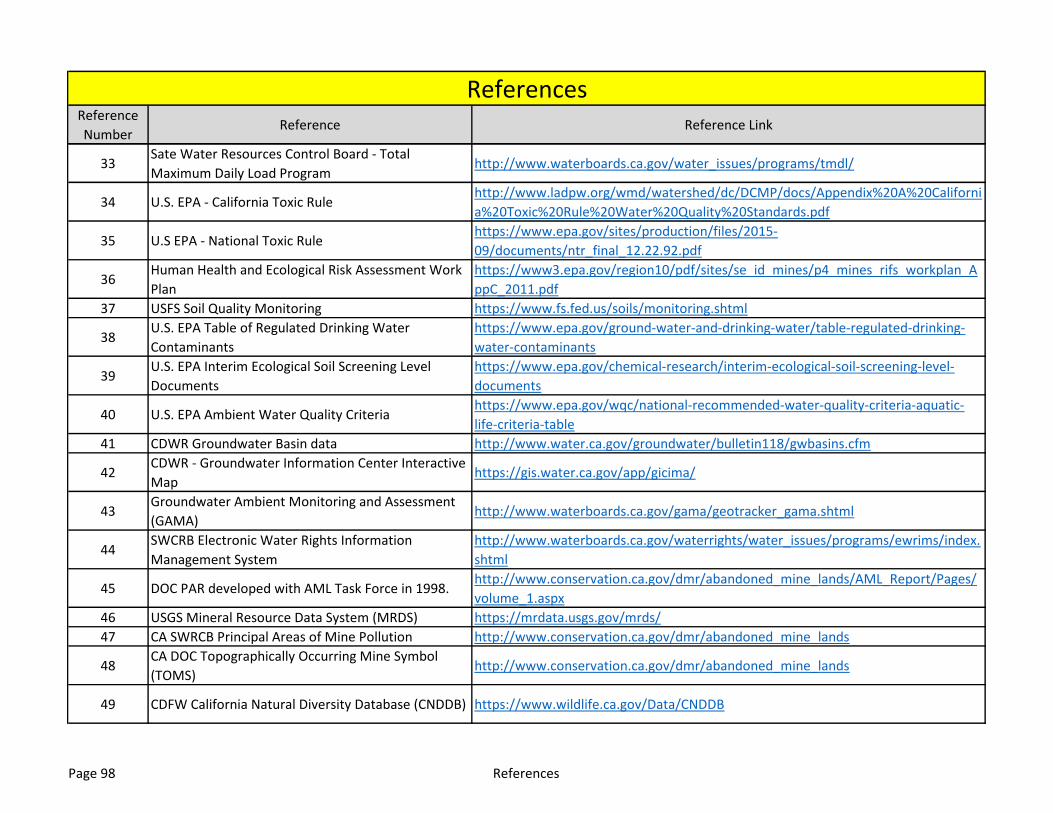
Reference
NumberReference Reference Link
References
33Sate Water Resources Control Board - Total
Maximum Daily Load Programhttp://www.waterboards.ca.gov/water_issues/programs/tmdl/
34 U.S. EPA - California Toxic Rulehttp://www.ladpw.org/wmd/watershed/dc/DCMP/docs/Appendix%20A%20Californi
a%20Toxic%20Rule%20Water%20Quality%20Standards.pdf
35 U.S EPA - National Toxic Rulehttps://www.epa.gov/sites/production/files/2015-
09/documents/ntr_final_12.22.92.pdf
36Human Health and Ecological Risk Assessment Work
Plan
https://www3.epa.gov/region10/pdf/sites/se_id_mines/p4_mines_rifs_workplan_A
ppC_2011.pdf
37 USFS Soil Quality Monitoring https://www.fs.fed.us/soils/monitoring.shtml
38U.S. EPA Table of Regulated Drinking Water
Contaminants
https://www.epa.gov/ground-water-and-drinking-water/table-regulated-drinking-
water-contaminants
39U.S. EPA Interim Ecological Soil Screening Level
Documents
https://www.epa.gov/chemical-research/interim-ecological-soil-screening-level-
documents
40 U.S. EPA Ambient Water Quality Criteriahttps://www.epa.gov/wqc/national-recommended-water-quality-criteria-aquatic-
life-criteria-table
41 CDWR Groundwater Basin data http://www.water.ca.gov/groundwater/bulletin118/gwbasins.cfm
42CDWR - Groundwater Information Center Interactive
Maphttps://gis.water.ca.gov/app/gicima/
43Groundwater Ambient Monitoring and Assessment
(GAMA)http://www.waterboards.ca.gov/gama/geotracker_gama.shtml
44SWCRB Electronic Water Rights Information
Management System
http://www.waterboards.ca.gov/waterrights/water_issues/programs/ewrims/index.
shtml
45 DOC PAR developed with AML Task Force in 1998.http://www.conservation.ca.gov/dmr/abandoned_mine_lands/AML_Report/Pages/
volume_1.aspx
46 USGS Mineral Resource Data System (MRDS) https://mrdata.usgs.gov/mrds/
47 CA SWRCB Principal Areas of Mine Pollution http://www.conservation.ca.gov/dmr/abandoned_mine_lands
48CA DOC Topographically Occurring Mine Symbol
(TOMS)http://www.conservation.ca.gov/dmr/abandoned_mine_lands
49 CDFW California Natural Diversity Database (CNDDB) https://www.wildlife.ca.gov/Data/CNDDB
Page 98 References
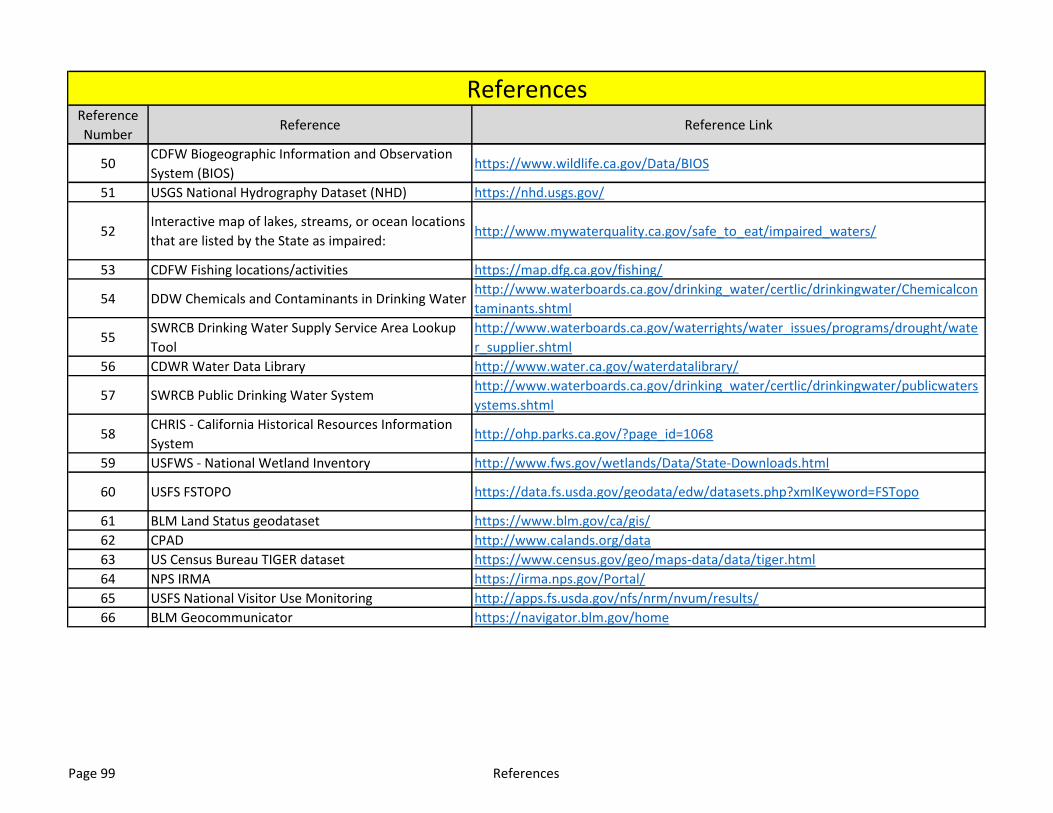
Reference
NumberReference Reference Link
References
50CDFW Biogeographic Information and Observation
System (BIOS)https://www.wildlife.ca.gov/Data/BIOS
51 USGS National Hydrography Dataset (NHD) https://nhd.usgs.gov/
52Interactive map of lakes, streams, or ocean locations
that are listed by the State as impaired: http://www.mywaterquality.ca.gov/safe_to_eat/impaired_waters/
53 CDFW Fishing locations/activities https://map.dfg.ca.gov/fishing/
54 DDW Chemicals and Contaminants in Drinking Waterhttp://www.waterboards.ca.gov/drinking_water/certlic/drinkingwater/Chemicalcon
taminants.shtml
55SWRCB Drinking Water Supply Service Area Lookup
Tool
http://www.waterboards.ca.gov/waterrights/water_issues/programs/drought/wate
r_supplier.shtml
56 CDWR Water Data Library http://www.water.ca.gov/waterdatalibrary/
57 SWRCB Public Drinking Water Systemhttp://www.waterboards.ca.gov/drinking_water/certlic/drinkingwater/publicwaters
ystems.shtml
58CHRIS - California Historical Resources Information
Systemhttp://ohp.parks.ca.gov/?page_id=1068
59 USFWS - National Wetland Inventory http://www.fws.gov/wetlands/Data/State-Downloads.html
60 USFS FSTOPO https://data.fs.usda.gov/geodata/edw/datasets.php?xmlKeyword=FSTopo
61 BLM Land Status geodataset https://www.blm.gov/ca/gis/
62 CPAD http://www.calands.org/data
63 US Census Bureau TIGER dataset https://www.census.gov/geo/maps-data/data/tiger.html
64 NPS IRMA https://irma.nps.gov/Portal/
65 USFS National Visitor Use Monitoring http://apps.fs.usda.gov/nfs/nrm/nvum/results/
66 BLM Geocommunicator https://navigator.blm.gov/home
Page 99 References