calibrated chemical amplifier for atmospheric rox measurements
TRANSCRIPT
Calibrated Chemical Amplifier for Atmospheric RO, Measurements
Donald R. Hastie,’ Michael Weissenmayer, John P. Burrows,* and Geoffrey W. Harris Air Chemistry Department, Max-Planck Institute for Chemistry, Saarstrasse 23, Postfach 3060, 0-6500 Mainz, Germany
An experlmentai and madding study of an amblent RO, (HO + HO, + RO -t- R02) detector is presented. As descrlbed prevkurly, the detector utiilzes chmkai ampllflcatlon of the radical concentration through a chain reaction involving NO and CO to produce NO2. Modifications reported here over- come a PAN and PNA hterferance to produce a detector that k a factor of -25 low sensitive to these interferences than the conventional dedgn, has improved rejection of artHact signals, and can have varlablelength inlets wlthout requiring a controlled nitrogen flow. A modd of the chemical ampHfier chemistry, whkh includes chemkai and wail loss of radicals, showed that slmpilfled calculations greatly overestimate the chain length. l lw varlatbn of the chain length wtlh wail loss rates, radical concentration, reaction time, and radical type has been investigated. The wide variation In reported chain lengths has been attributed to a chain length dependence on radical concentration and inadequacies associated with one of the calibration techniques. Absolute radkal calibration of tho Instrument was performed by using the thermal decom- position of PAN as a source of known concentrations of peroxyacetyl radkak. A M measurements over a M a y period show a dlwnai variation of RO, radical concentrations and that daytime maximum concentrations of 3 pptv are readily dkcernibie.
INTRODUCTION The chemistry of the troposphere is dominated by the
reactions of gas-phase free radicals. The hydroxyl radical (HO), formed following the photolysis of ozone (OJ (I), is the most important tropospheric gas-phase oxidant and is re- sponsible for initiating the tropospheric oxidation of virtually all gases emitted into the atmosphere (2). Reaction of HO with hydrocarbons or CO leads to the production of hydro- peroxy (HO,), organic oxy (RO), and organic peroxy (RO,) radicals. In NO,-rich environments, the reactions of these RO, radicals (HO + HOz + RO + R02) combine in photochemical cycles to produce O3 (3). Where there is insufficient NO,, O3 is removed via its reaction with the peroxy radicals, and RO, thus plays a critical role in determining the oxidative capacity of the atmosphere. In addition, free-radical reactions are important in heterogeneous processes (4) , while the self-re- actions of peroxy radicals lead to the formation of peroxides, which may be taken up by clouds where they act as important oxidants. For example, approximately half of the oxidation of SO2 to sulfate (SO4”) may proceed via aqueous-phase ox- idation by hydrogen peroxide (5).
Despite their central importance to tropospheric chemistry, there have been few measurements of RO, concentrations because of the difficulties associated with measuring the very
*Author to whom corres ondence should be addressed. Permanent address: &emistry Department and Centre for
Atmos heric Chemistry, York University, 4700 Keele St., North York, 8ntan0, Canada M3J 1P3.
small concentrations present in the troposphere. Calculations suggest daytime HO concentrations are in the range (1-40) X lo5 or 0.004-0.16 pptv (parts per trillion by volume) and those of H02 are (1-50) X lo7 or 0.4-20 pptv (e.g., ref 6).
A number of specific laser-induced fluorescence (LIF) methods for HO measurement have been developed (7-10) as has a long path laser absorption method (11-13). A chemical conversion technique in which HO reacts with “CO to produce 14C02, which can be collected and measured by using radioactive counting techniques, has also been used
There have also been some spectroscopic measurements of tropsopheric H02 concentrations. The low-pressure LIF HO instrument (7) was used to monitor HOz concentrations by conversion of HOz to HO through the addition of excess NO. Milhelcic et al. (1 7-19) have used matrix isolation-electron paramagnetic resonance spectroscopy (MIESR) for the measurement of H02 and speciated R02 radicals.
An alternative strategy for the measurement of RO, was developed by Cantrell and Stedman (20) and Cantrell et al. (21), who proposed a chemical amplifier system to measure the sum of HO, RO, H02, and R02 radicals. The chemical amplifier utilizes a chain reaction involving NO and CO to produce a large number of NO2 molecules for each radical. HO, RO, HOz, and R02 radicala can all be measured by this technique since the chain can be initiated at any of the re- actions (1)-(5).
(1 4-1 6) .
€302 + NO + NO2 + HO HO + CO + H + C02
H + 02 + M - HO2 + M
RO, + NO + RO + NO2
RO + 02 -.+ R”C0R’ + HO2
(1)
(2)
(3)
(4)
( 5 )
The number of NO2 molecules produced per radical is dependent on the rates of reactions (1)-(5) and on the reac- tions that remove radicals from the system. Regularly re- placing the CO with N2 turns the amplifier chemistry on and off, yielding a modulated NOz signal, which is a measure of the radical concentration. A specific NOz detedor is required and the chemiluminescent reaction of NO2 with luminol (22, 23) was used for this purpose (20,21).
Clearly the actual number of NO2 molecules produced per radical depends on experimental conditions such as NO and CO concentrations, on the reaction time, and on the processes that remove radicals from the system. Cantrell et al. (21) investigated their experimental arrangement and considered the reaction of HO with NO to be the most significant radical loss process:
HO + NO + M - HONO + M (6)
They estimated the NO2 molecules produced per radical, or the chain length (CL), to be as high as 1500. However, ex-
0003-2700/91/0363-2048$02.50/0 @ 1991 American Chemical Society
ANALYTICAL CHEMISTRY, VOL. 63, NO. 18, SEPTEMBER 15, 1991 2049
NO 2 DETECTOR
REACTOR -
RADICAL DETECTOR
AIR PUMP
FIG. 1A
NO 2 Linearisation Flow
=NO A[ I
FIG. 1B
\ Heater = C O /,3WAY f 16 cm x 114' B
VALVE 0.9 m ( t = 0.22 sec )
NO2 Linearisation Flow
3.2 m ( t = 0.78 sec )
i DETECTOR Q
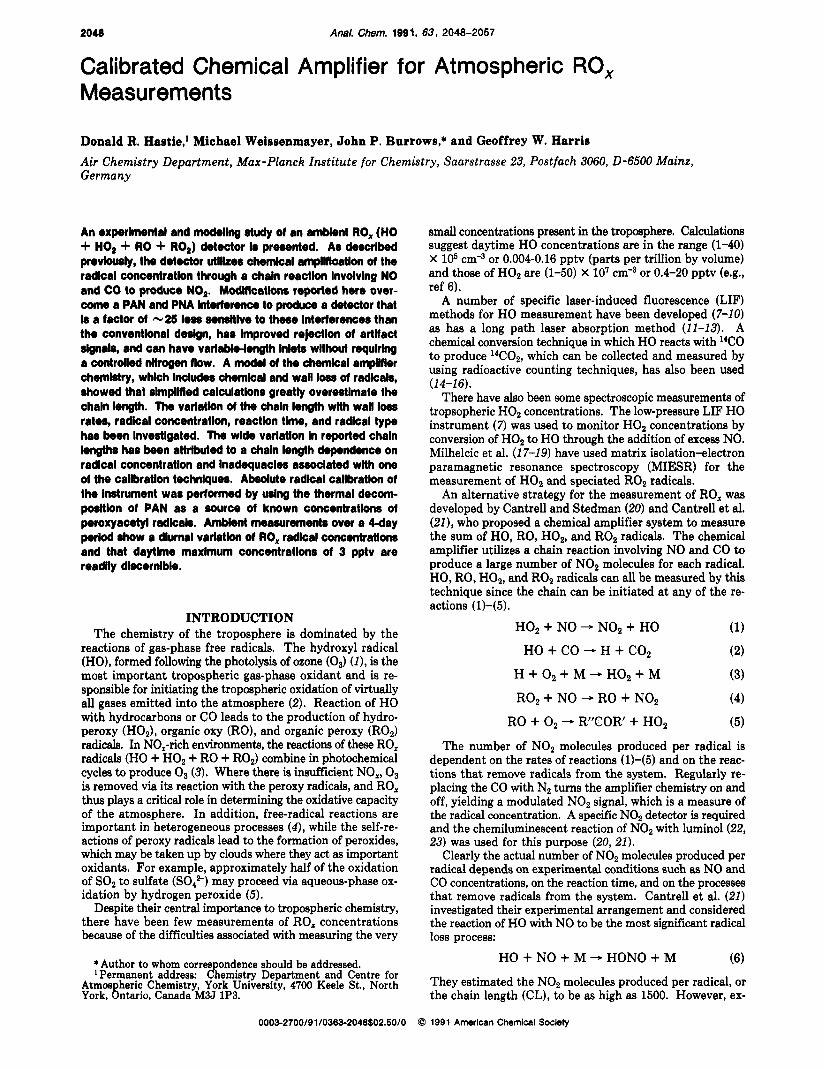
Figure 1. Schematic diagrams of the radical detectors used in this study. (A) The conventional amplifier according to ref 21; (B) the final configuration used in this study.
periments to determine CL have yielded chain lengths varying from 40 to 1100 (21, 24).
In this paper, a new experimental and theoretical study of the chemical amplifier based RO, detector is reported. A number of problems with the "conventional" RO, detector are identified, and a modified detector that overcomes these problems is described. In particular, it is shown that the conventional RO, detector suffers interferences from ambient concentrations of peroxyacetyl nitrate (PAN - CH3C03N02) and pernitric acid (PNA - H02NOJ. Modification of our RO, detector enabled these interferences to be reduced by a factor of approximately 25 compared to a conventional detector. A procedure suitable for field calibration of the RO, detector using radicals generated from the thermal decomposition of PAN has been developed. This procedure overcomes many of the difficulties previously encountered in calibrating the detector. The discrepancies between the calibrations reported in the literature are shown to be due to a combination of a nonlinearity in the amplifier and an inappropriate method of radical concentration determination. The end product of this study is a calibrated radical detector suitable for the measurement of ambient RO, radical concentrations in the troposphere.
EXPERIMENTAL SECTION Instrumentation. The RO, detector consists of a reactor, in
which the chemical amplification takes place, and an analyzer to determine the NO2 produced in the reactor. Several designs of reactor were used in this work. Initially a conventional reactor similar to that described by Cantrell et al. (21), as shown in Figure lA, was constructed. This was found to have many shortcomings and was extensively modified: our final configuration is shown in Figure 1B.
For the diagnostic and development studies, the NO and CO mixing ratios in the amplifier were 2 ppmv and 4%, respectively. In the conventional RO, detector, a radical zero was obtained by
NO2 DETECTOR - COMMON TO 1A & 1B
FROM CHEMICAL
G LUMINOL
SOLUTION
I M
I ' SIGNAL c OUT.
NO 2 H DETECTOR
r1-L TO PUMP AIR
REACTION CHAMBER
&--- Photomultiplier
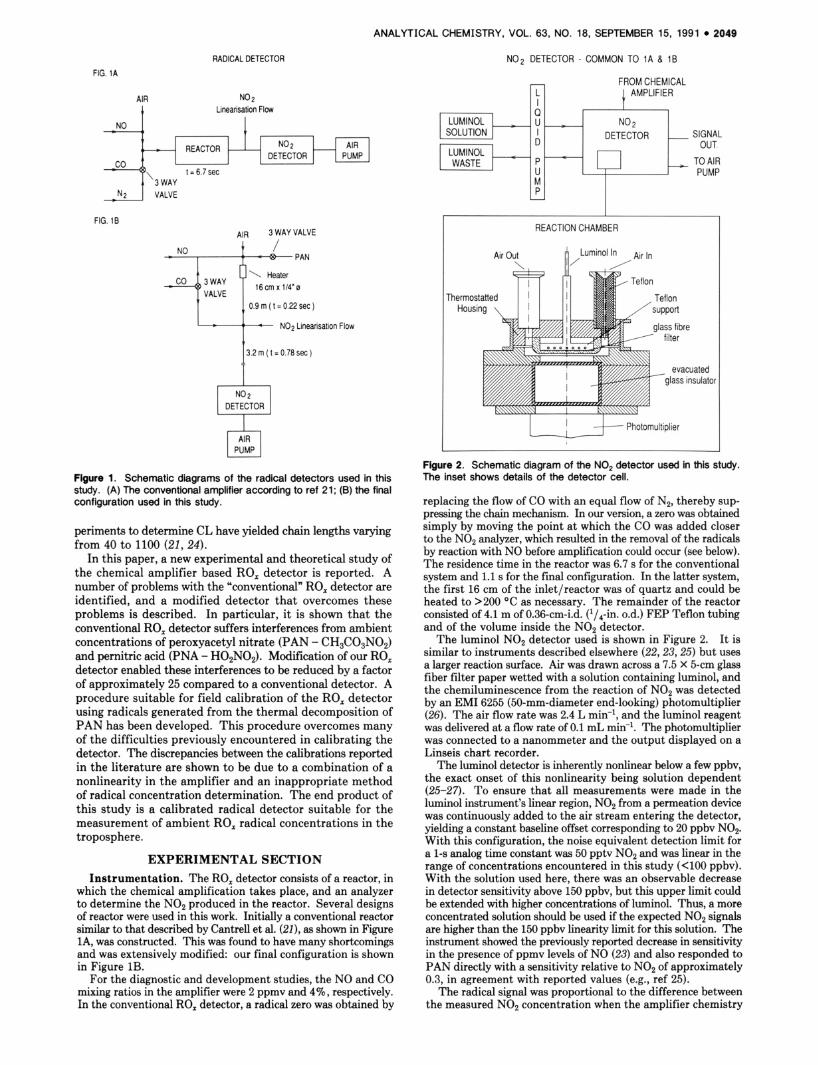
Figure 2. Schematic diagram of the NOP detector used in this study. The inset shows details of the detector cell.
replacing the flow of CO with an equal flow of N2, thereby sup- pressing the chain mechanism. In our version, a zero was obtained simply by moving the point at which the CO was added closer to the NO2 analyzer, which resulted in the removal of the radicals by reaction with NO before amplification could occur (see below). The residence time in the reactor was 6.7 s for the conventional system and 1.1 s for the final configuration. In the latter system, the first 16 cm of the inlet/reactor was of quartz and could be heated to >200 "C as necessary. The remainder of the reactor consisted of 4.1 m of 0.36-cm4.d. (1/4-in. 0.d.) FEP Teflon tubing and of the volume inside the NO2 detector.
The luminol NO2 detector used is shown in Figure 2. It is similar to instruments described elsewhere (22,23,25) but uses a larger reaction surface. Air was drawn across a 7.5 X 5-cm glass fiber filter paper wetted with a solution containing luminol, and the chemiluminescence from the reaction of NO2 was detected by an EM1 6255 (50-mm-diameter end-looking) photomultiplier (26). The air flow rate was 2.4 L min-', and the luminol reagent was delivered at a flow rate of 0.1 mL min-'. The photomultiplier was connected to a nanommeter and the output displayed on a Linseis chart recorder.
The luminol detector is inherently nonlinear below a few ppbv, the exact onset of this nonlinearity being solution dependent (25-27). To ensure that all measurements were made in the luminol instrument's linear region, NO2 from a permeation device was continuously added to the air stream entering the detector, yielding a constant baseline offset corresponding to 20 ppbv NO* With this configuration, the noise equivalent detection limit for a 1-s analog time constant was 50 pptv NO2 and was linear in the range of concentrations encountered in this study (<lo0 ppbv). With the solution used here, there was an observable decrease in detector sensitivity above 150 ppbv, but this upper limit could be extended with higher concentrations of luminol. Thus, a more concentrated solution should be used if the expected NO2 signals are higher than the 150 ppbv linearity limit for this solution. The instrument showed the previously reported decrease in sensitivity in the presence of ppmv levels of NO (23) and also responded to PAN directly with a sensitivity relative to NO2 of approximately 0.3, in agreement with reported values (e.g., ref 25).
The radical signal was proportional to the difference between the measured NO2 concentration when the amplifier chemistry
2050 ANALYTICAL CHEMISTRY, VOL. 63, NO. 18, SEPTEMBER
was operating and when it was not. In this study, the chain length (CL) is defied as the number of NO2 molecules produced by the amplifier per radical (or interfering molecule) entering the de- tector.
Following the development work, an ambient monitor was assembled. It had an amplifier region as shown in Figure 1B with the reactant gases added to the ambient air immediately on sampling. In practice, the air inlet was a Nylon cross, coated with halocarbon wax, with one arm open to the air and the NO and CO inlets in the two remaining arms. The CO and NO flows were increased to give concentrations of 8% and 6 ppmv, which gave measured chain lengths of 240 in keeping with the simulations (see below). The NOz monitor was as described above. The system was computer controlled, with the CO addition point being switched every 30 s, and the signals were averaged and stored for later processing. All gas flows were controlled by mass flow controllers (Tylan Corp. and MKS) calibrated by using bubble flowmeters.
Calibration System. Gas-phase PAN was obtained by bubbling synthetic air through a suitably diluted PAN stock solution. The gas-phase PAN concentration leaving the bubbler was determined by GC using a molybdenum converter-NO analyzer as detector (28) and was further diluted by the air flow entering the reactor. The GC system was calibrated daily with NO, regularly with NOz, and intermittently with PAN produced from the quantitative conversion of NO2 in an irradiated acetone/NOz/synthetic air mixture (28). The detection limit of the GC system for PAN was 50 ppbv. With the available gas flows, this determined the minimum PAN concentration that could reliably be introduced into the RO, detector as 20 pptv. The only nitrogen-containing impurity identified in the gas-phase PAN sample was methyl nitrate, resulting from the decomposition of PAN in solution but that could be stripped from the solution in the bubbler prior to an experiment. There were, however, other impurities to which the NOz detector responded. In the gas phase, they added an offset to the PAN signal but did not affect the sensitivity of the NOz analyzer; nor did they decompose to produce measurable amounts of radicals upon heating at 200 OC. They were identified as hydrogen peroxide and a number of organic peroxides. A similar impurity in PAN prepared by the same method has been noted previously, although not identified, and has been separated from PAN by preparative gas chromatography (29; Shepson, P. B., York University, private communication).
Reagents. The gases used in this system were CO, (Linde) purified by passage through a trap consisting of iodine and charcoal to remove metal carbonyls (30) and 100 ppmv NO in nitrogen (Linde), which was passed through a ferrous sulfate trap to remove any NOz. NO2 was supplied by passing Nz over a thermostated permeation tube (Metronics).
The composition of the luminol solution used in the NOz de- tector was 4 X M Na2S03, 5 X lo-' M luminol (3-aminophthalhydrazide, Sigma, 98%), and 0.1% 2- propanol.
A stock solution of PAN in tridecane was prepared as described by NieLsen et al. (31). Acetic anhydride (Sigma, 99%) was oxidized to peracetic acid by using hydrogen peroxide (Peroxide GmbH, 30%). This was then nitrated with concentrated HN03/H2S04, extracted into tridecane (Sigma), and used without further pu- rification.
Safety Considerations. Care must be taken when using this system due to the high concentrations of carbon monoxide in- volved. The system should be carefully tested for leaks, and the exhaust should be safely vented or the CO destroyed by catalytic oxidation (30) before being released.
Simulations. The chemical amplifier was modeled by using the FACSIMILE program (32). The chemistry was described by a scheme of 42 chemical reactions involving 30 species are listed in Table I. Rate coefficients were taken from refs 33 and 34 and expressed in their temperature-dependent forms. For the ter- molecular reactions, rate coefficienta were calculated from the fall-off expression (35), allowing for the temperature dependence of k,, kw, and F. We have no evidence that these reactions occur other than homogeneously in the gas phase, although the pos- sibility of heterogeneous analogues cannot be discounted. In addition to chemical reactions, the physical logs of radicals to the wall of the reactor was included in the model.
M KOH, 5 X
15, 1991
Table I. Reaction Mechanism
reaction rate coefP
Simple Chain Mechanism HO2 + NO - HO + NO2 8.1 X
1.2 x 10-12 5.2 X
7.7 x 10-12 1.9 x 10⁻¹⁶ 1.0 x 10⁻¹² 1.4 X IO-" 1.1 x 10⁻¹¹ 5.6 X
6.8 X lo-"
4.9 x 10⁻¹² 4.7 x 10⁻¹² 1.1 x 10⁻¹¹ 2.3 X lo-" 1.9 x 10⁻¹² 4.8 X 1.1 x 10-10 1.7 X 7.7 x 10-16 1.0 x 10⁻¹¹ 4.0 X 1.0 x 10-11
1.7 X 1.2 X 1.4 X 2.1 x 10-16
PAN and PNA Decomposition 3.7 x lo+* 8.1 X 1.6 X lo-"
HO + CO - H + COZ H + 02 + M 4 HOz + M
CH3Oz + NO - CH30 + NO2 CH30 + O2 - H02 + CH20 CH3 + 0 2 + M - CH3O2 + M
HO + CHZO + H2O + HCO
2.4 x 10⁻¹³
HO + NO + M - HONO + M Other Radical Propogation Reactions
CH3C03 + NO - CHI + COP + NO2
HCO + 0 2 4 HOz + CO
HO + O3 - H02 + O2 HO Radical Reactions
HO + HN03 - H20 + NO3 HO + HONO 4 H20 + NO2 HO + HN04 - H20 + NO2 + O2 HO + NO2 + M + HN03 + M
HO + HO- H20 + 0
HO + HOz - HzO + 0 2
HO + CH4 - CH3 + H2O HO + CH3O2 - HO + CH30 - H20 + CH20
1.0 x 10⁻¹³
HO + NO3 - H02 + NO2
HO + HO + M + HZ02 + M
HO + HzOz - H20 + HO2
HO + CH3N04 - H20 + CH20 + NO3
HOP Radical Reactions HOP + HOz - H202 + 0 2 H02 + H02 + M - H202 + O2 + M HOz + NO2 + M - HNOI + M HOZ + 0 9
PAN - CH3CO3 + NO2
CH&03 + CH302 - CH3 + C02 +
HO + 0 2 + 02
HNO4 + M 4 HO:, + NO2 + M CH3C03 + CH3C03 + 2 CH3 + 2C02
4.5 x 10⁻¹³ CH30 + O2
+ 0 2
CH3C03 + CH302 - CH,COOH + CH20 4.5 x 10⁻¹³
CHsOz Reactions CH302 + NO2 + M - CH3N04 + M 4.0 X CH3O2 + CH3O2 - 2CH30 + O2 8.0 x 10⁻¹⁴ CH3O2 + CH302 - CH30H + CH20 + 2.5 x 10⁻¹³
0, + CH3O2 - CH300CH3 + O2 3.0 X lo-"
1.9* CH3NO4 - CH3O2 + NO2 O3 Reactions
NO + O3 - NO2 + O2 NO2 + O3 - NO3 + O2
1.8 x 10⁻¹⁴ 3.2 x 10⁻¹⁷
NO3 + NO2 + M - NzO6 + M N2O6 + M - NO3 + NO2 + M
HO 4 variable HOz y variable CH3O2 - variable CH3C03 variable
1.4 X 5.2 X
Radical Loss at Walls of Vessel
a Rate coefficients are calculated for conditions of 298 K and, for the reactions that include the third body M, 1 atm of pressure. Units are s-l for second-order rate coefficients and s-l for first-order rate coefficients (starred *).
Simulations were performed for both stirred and plug flow reactors. In the stirred flow case, the gases flowed in and out of the reactor at a constant flow rate, while for plug flow the model was initialized with the required concentrations and run for a time corresponding to the residence time in the reactor. Due to the relatively large size and long residence time in the conventional reactor, the stirred flow assumption was thought to be most
ANALYTICAL CHEMISTRY, VOL. 63, NO. 18, SEPTEMBER 15, 1991 2051
appropriate although it is likely to be in an intermediate regime (36). The modified reactor is a long length of tubing so the turbulent plug flow assumption is more appropriate for this in- strument. Simulations were performed by using zero air (i.e., Nz and O2 only) as the carrier gas and for realistic mixtures repre- senting typical trace gas compositions of ambient air, enabling interferences by reactive species to be investigated.
RESULTS AND DISCUSSION Instrument Tests. Instrument Modifications. We en-
countered several problems with the conventional detector (Figure lA) , the most important being that signals were ob- tained in cases where no radicals were considered to be present, e.g., when sampling laboratory air, when sampling ambient air at night, or when it was raining. The magnitude of these signals was dependent on the amplifier reaction time, and we identified the cause to be the production of radicals from the thermal decomposition of PAN in the chemical amplifier. The lifetime of PAN at 298 K is 45 min, and in the presence of the high NO concentrations in the amplifier, the reverse reaction is negligible. Simulations showed the detector's sensitivity toward PAN to be 11400 of that toward radicals. This represents a major interference to ambient radical measurements. For example, a conventional detector measuring 5 pptv radicals in the presence of 2 ppbv PAN would produce equal NOz signals from the radicals and the PAN, thus overestimating the radical concentration by 100%. A similar effect would be expected for all peroxy nitrates. For example, the lifetimes of pernitric acid (PNA) and CH3OZNOz are only 12 and 1.6 s, respectively, so in the 6.7-s residence time in the conventional reactor, 60% of the PNA and es- sentially all the CH3OZNOz would decompose to produce radicals. Initially this interference was reduced by shortening the reaction time from 6.7 to 1.1 s. This reduced the radical production by these species to 0.04% for PAN, 8% for PNA, and 50% for CH3OzNO2 but had little impact on the measured chain length (see below).
Additional and more practical discrimination against radical production in the chemical amplifier was achieved by the way in which the radical zero was obtained. Rather than replacing the CO with Nz, the point of addition of CO was switched between the inlet and a point 260 ms downstream. Simula- tions showed that, within 40 me of the addition of NO, ef- fectively all RO, radicals were converted, via reaction 6, to HONO. Thus, when the CO was added downstream, no radicals remained and a zero signal resulted. With this con- figuration, any radicals produced in the reactor after the second CO addition point, by thermal decomposition of precursors such as PAN, produced a constant amount of NOz independent of the CO addition point and did not contribute to the modulated or radical signal. This modified system then only measured radicals produced in the amplifier for a max- imum time of 260 ms and so give a total discrimination of a factor of -25 over the conventional system. By using our detector (Figure lB), no radical signal was observed when the maximum expected ambient levels of PAN were added to synthetic air, and no modulated signals attributable to PAN were observed in ambient air.
Changing the way the zero was achieved had three other advantages. Firstly, it allowed the reintroduction of a longer inlet line between the second CO addition point and the detector without increasing the interferences. This was particularly advantageous in the field instrument where the NOz detector needed to be mounted well away from the inlet. Secondly, it removed a small positive modulated signal, the equivalent of 300 pptv NOz, that was observed even when measuring zero air. This signal persisted despite all attempts to purify the gases and may be due to a small change in detector sensitivity toward the 20 ppbv NOz added for line- arization, with the change in gas composition (CO for NJ. By
Table 11. Chain Lengths Determined with HOz Being Produced in the Photolysis of H,/02/Cl2 Mixtures
[Hod [Hod molecule cm-3 CL molecule cm-9 CL
3.2 X 1O'O 91 f 14 8.8 X 1O'O 43 6.5 4.8 X 1O'O 81 i 12 1.1 X 10" 38 f 5.7 6.8 X 10'O 55 f 8.3 1.3 X 10" 34 f 5.1
using the modified configuration, no significant change in composition occurs, and as a result, no signal is obtained. Finally, this modification removes the need for the Nz flow, which, in the conventional system, must be precisely matched to the CO flow.
Calibration Sources. One of the limiting factors in the development and testing of the radical detector has been the difficulty of making stable, known concentrations of radicals. Consequently, chain lengths have always been poorly deter- mined, with reported values ranging from 40 to 1100 (21,24). In this study, attempts were made to duplicate earlier resulta and understand the sources of this variability. The conven- tional RO, detector was used to measure the HOz radicals produced from two sources, the black lamp photolysis (310 < A < 400 nm) of mixtures of Hz, Oz, and Clz and a heated wire in a flowing mixture of hydrogen in air.
A range of HOz radical concentrations between 3 X 1O'O and 1.25 X 10" cm-3 was produced from the photolysis of mixtures of Hz, Oz, and Clz, and the HOZ concentration was measured by optical absorption at 220 nm (37). Although lower con- centrations could be produced, the sensitivity of the UV ab- sorption system prevented the measurement of these lower HOz concentrations. The luminol detector was calibrated at each of the NO2 concentrations produced, to overcome the small nonlinearities in response encountered at the higher concentrations. The chain lengths determined are presented in Table 11. They are much lower than expected from the measurements of Cantrell et al. (21) and, while comparable to those made by Stedman et al. (24) using a similar system, show a previously unreported concentration dependence.
The dependence of chain length on radical concentration is primarily explained by the influence of the reaction of HOz with NOp At high radical concentrations, the production of NOz by the amplifier becomes sufficiently large that the im- portance of the reaction of HOz with NOz as a radical removal process is increased, thus lowering the chain length. In ad- dition, at very high concentrations (>lo" ~ m - ~ ) , consumption of the added NO becomes significant, further reducing the chain length. These explanations of the Concentration de- pendence were supported by the simulations that showed that it is not possible to extrapolate a chain length measured a t high radical concentrations (>lolo ~ m - ~ ) to levels expected to be found in the atmosphere (see below).
The second calibration method followed Cantrell et al. (21) and employed a Pyrex flow tube with a wire (Pt or Ni/Cr) heating element mounted on a sliding injector. A flow of H2 in He was passed over this heated wire before entering the air flow in the main tube. The HOz produced was detected by the RO, detector at the end of the flow tube. The radical signal dependence on residence time in the flow tube was investigated by altering the position of the sliding injector. Provided the concentration of HOz is sufficiently large, re- action 25 (Table I) dominates the loss of HOz and a plot of 1/[NOZ]signal against reaction time has a slope 2kB/CL, where kzs is the total rate coefficient for reaction 25. However, in our studies, second-order behavior was not observed. Rather, the loss of HOz obeyed fi t-order kinetics, indicating that the loss of radicals was dominated by diffusion to, and subsequent destruction on, the wall of the flow tube. Analysis of the HOz decay in the flow tube (43" diameter) yielded an effective
2052 ANALY
NO *added for linearisatioi
of detector
Instrument Zero
ICAL CHEMISTRY, VOL. 63, NO. 18, SEPTEMBER 15, 1991
modulated signal from
60 ppt of radicals
Figure 3. Output from the radical detector for the measurement of 60 pptv peroxyacetyl radicals. first-order rate coefficient for the loss of radicals a t the wall (kwd,) of 0.19 s-l, which is similar to the value of 0.175 s-l reported by Mozurkewich et al. (38) for a 75-mm-diameter tube. For the flow tube determination of chain length to be applicable, the effective wall removal rate of H02 radicals (kwdl[HOz]) must be much smaller than 2k25[HOz]2. For a radical concentration of 5 X log ~ m - ~ , this means kwd must be << 3 X s-l. The conclusion from this investigation is that such a requirement is not achievable by using flow re- actors operating at 1 atm of pressure under laminar flows. It therefore appears that the higher values of CL in the literature, which come from flow tube studies, may arise from casea where the wall loss was underestimated and so are likely to be in error. Thus, the range of chain lengths reported in the lit- erature can be explained by the combination of problems with the flow tube technique and the chain length dependence on radical concentration.
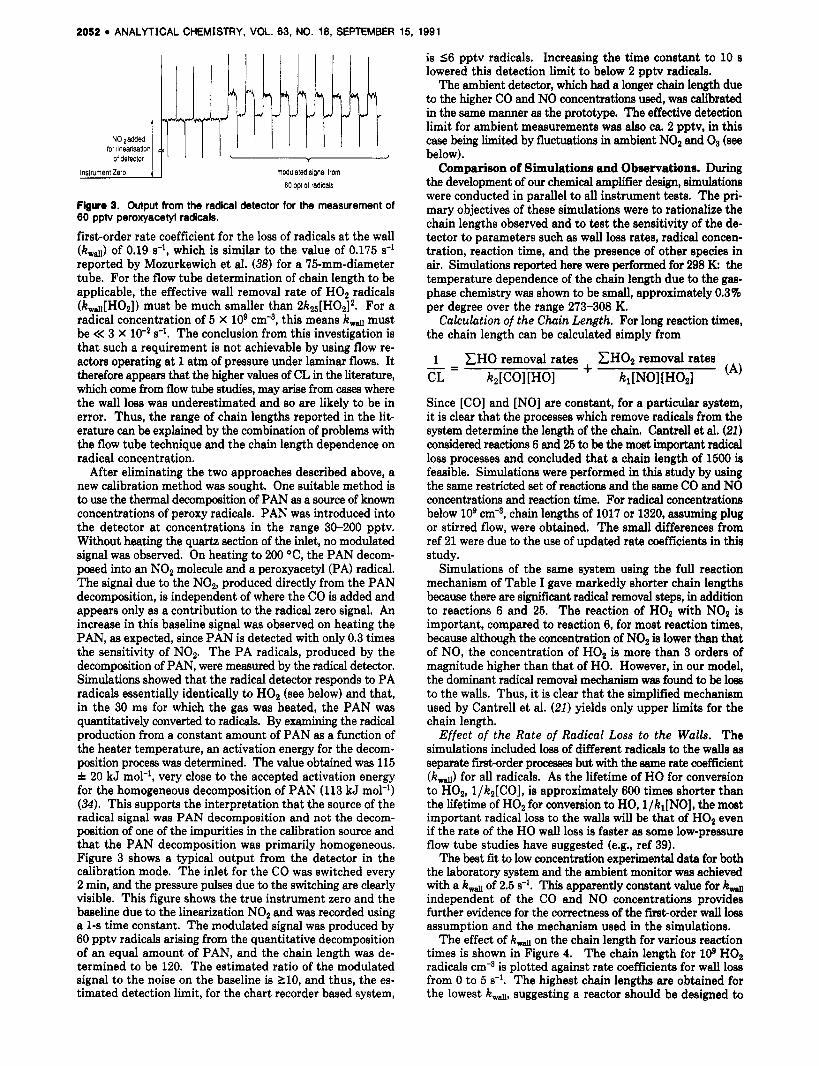
After eliminating the two approaches described above, a new calibration method was sought. One suitable method is to use the thermal decomposition of PAN as a source of known concentrations of peroxy radicals. PAN was introduced into the detector at concentrations in the range 30-200 pptv. Without heating the quartz section of the inlet, no modulated signal was observed. On heating to 200 OC, the PAN decom- posed into an NO2 molecule and a peroxyacetyl (PA) radical. The signal due to the NO2, produced directly from the PAN decomposition, is independent of where the CO is added and appears only as a contribution to the radical zero signal. An increase in this baseline signal was observed on heating the PAN, as expected, since PAN is detected with only 0.3 times the sensitivity of NO2. The PA radicals, produced by the decomposition of PAN, were measured by the radical detedor. Simulations showed that the radical detector responds to PA radicals essentially identically to H02 (see below) and that, in the 30 ms for which the gas was heated, the PAN was quantitatively converted to radicals. By examining the radical production from a constant amount of PAN as a function of the heater temperature, an activation energy for the decom- position process was determined. The value obtained was 115 f 20 kJ mol-', very close to the accepted activation energy for the homogeneous decomposition of PAN (113 kJ mol-') (34). This supports the interpretation that the source of the radical signal was PAN decomposition and not the decom- position of one of the impurities in the calibration source and that the PAN decomposition was primarily homogeneous. Figure 3 shows a typical output from the detector in the calibration mode. The inlet for the CO was switched every 2 min, and the pressure pulses due to the switching are clearly visible. This figure shows the true instrument zero and the baseline due to the linearization NO2 and was recorded using a 1-s time constant. The modulated signal was produced by 60 pptv radicals arising from the quantitative decomposition of an equal amount of PAN, and the chain length was de- termined to be 120. The estimated ratio of the modulated signal to the noise on the baseline is 210, and thus, the es- timated detection limit, for the chart recorder based system,
is 56 pptv radicals. Increasing the time constant to 10 s lowered this detection limit to below 2 pptv radicals.
The ambient detector, which had a longer chain length due to the higher CO and NO concentrations used, was calibrated in the same manner as the prototype. The effective detection limit for ambient measurements was also ca. 2 pptv, in this case being limited by fluctuations in ambient NO2 and O3 (see below). Comparison of Simulations and Observations. During
the development of our chemical amplifier design, simulations were conducted in parallel to all instrument tests. The pri- mary objectives of these simulations were to rationalize the chain lengths observed and to test the sensitivity of the de- tector to parameters such as wall loss rates, radical concen- tration, reaction time, and the presence of other species in air. Simulations reported here were performed for 298 K the temperature dependence of the chain length due to the gas- phase chemistry was shown to be small, approximately 0.3% per degree over the range 273-308 K.
Calculation of the Chain Length. For long reaction times, the chain length can be calculated simply from
(A) + Since [CO] and [NO] are constant, for a particular system, it is clear that the processes which remove radicals from the system determine the length of the chain. Cantrell et al. (21) considered reactions 6 and 25 to be the most important radical loss processes and concluded that a chain length of 1500 is feasible. Simulations were performed in this study by using the same restricted set of reactions and the same CO and NO concentrations and reaction time. For radical concentrations below lo9 ~ m - ~ , chain lengths of 1017 or 1320, assuming plug or stirred flow, were obtained. The small differences from ref 21 were due to the use of updated rate coefficients in this study.
Simulations of the same system using the full reaction mechanism of Table I gave markedly shorter chain lengths because there are significant radical removal steps, in addition to reactions 6 and 25. The reaction of HOz with NO2 is important, compared to reaction 6, for most reaction times, because although the concentration of NO2 is lower than that of NO, the concentration of H02 is more than 3 orders of magnitude higher than that of HO. However, in our model, the dominant radical removal mechanism was found to be loss to the walls. Thus, it is clear that the simplified mechanism used by Cantrell et al. (21) yields only upper limits for the chain length.
Effect of the Rate of Radical Loss to the Walls. The simulations included loss of different radicals to the walls as separate firsborder processes but with the same rate coefficient (kwd) for all radicals. As the lifetime of HO for conversion to H02, l/kz[CO], is approximately 600 times shorter than the lifetime of H02 for conversion to HO, l/k,[NO], the most important radical loss to the walls will be that of H02 even if the rate of the HO wall loss is faster as some low-pressure flow tube studies have suggested (e.g., ref 39).
The beat fit to low concentration experimental data for both the laboratory system and the ambient monitor was achieved with a k d of 2.5 s-l. This apparently constant value for kd independent of the CO and NO concentrations provides further evidence for the correctness of the firsborder wall loss assumption and the mechanism used in the simulations.
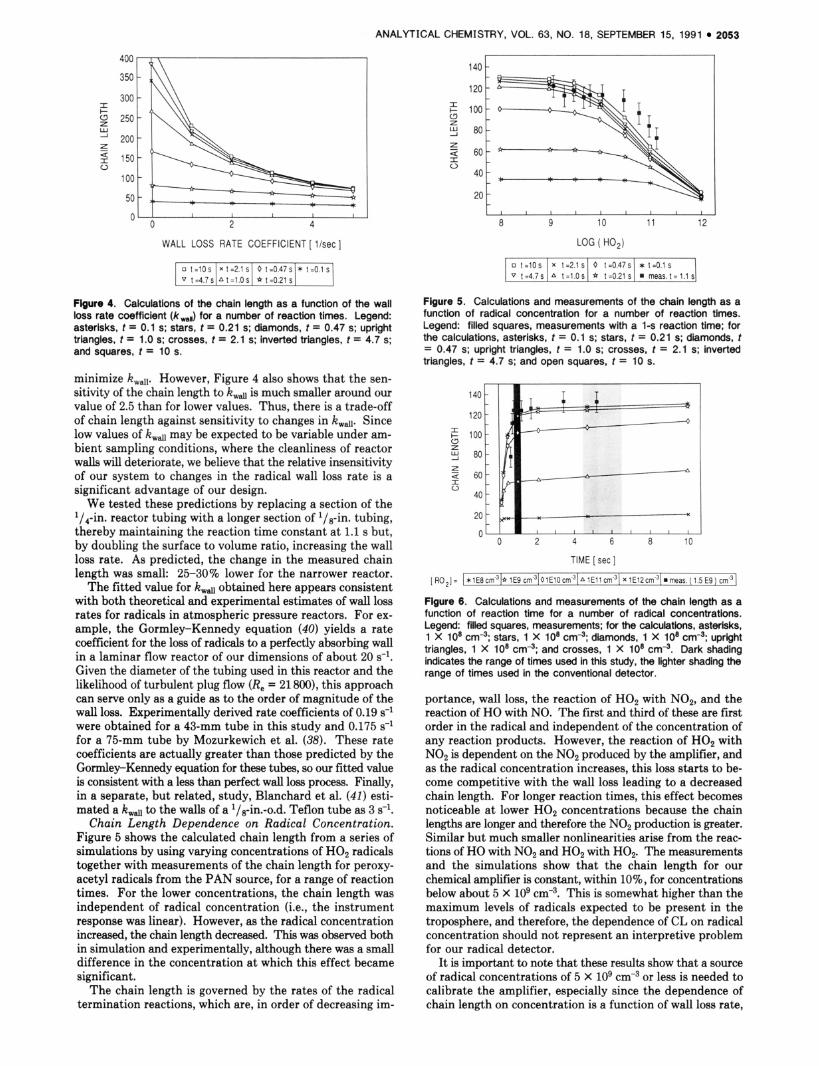
The effect of k d on the chain length for various reaction times is shown in Figure 4. The chain length for log H02 radicals cm-3 is plotted against rate coefficients for wall loss from 0 to 5 s-l. The highest chain lengths are obtained for the lowest k w d , suggesting a reactor should be designed to
1 C H O removal rates CHO2 removal rates k,[NOI[HO21
_ - - CL k,[COI [HOI
ANALYTICAL CHEMISTRY, VOL. 63, NO. 18, SEPTEMBER 15, 1991 2053
o t = l O s v t=4 .7s
400
350
300
250
200
150
100
50
X t = 2 . 1 ~ 0 t = 0 . 4 7 ~ * t = O . l S A t= l .Os * t=0.21s . m e a s . t = l . l s
I I I I I
2 4
WALL LOSS RATE COEFFICIENT [ llsec]
o t = l O s Xt=2 .1S O t = O . 4 7 ~ * t = O . l s I v t = 4 . 7 s / A t = l . o s I * t = 0 . 2 1 s l I Flgure 4. Calculations of the chain length as a function of the wall loss rate coefficient (kmw) for a number of reaction times. Legend: asterisks, t = 0.1 s; stars, t = 0.21 s; diamonds, t = 0.47 s; upright triangles, t = 1.0 s; crosses, t = 2.1 s; inverted triangles, t = 4.7 s; and squares, t = 10 s.
minimize kwdl. However, Figure 4 also shows that the sen- sitivity of the chain length to kd is much smaller around our value of 2.5 than for lower values. Thus, there is a trade-off of chain length against sensitivity to changes in Itwa. Since low values of kwd may be expected to be variable under am- bient sampling conditions, where the cleanliness of reactor walls will deteriorate, we believe that the relative insensitivity of our system to changes in the radical wall loss rate is a significant advantage of our design.
We tested these predictions by replacing a section of the l/a-in. reactor tubing with a longer section of 1/8-in. tubing, thereby maintaining the reaction time constant at 1.1 s but, by doubling the surface to volume ratio, increasing the wall loss rate. As predicted, the change in the measured chain length was small: 25-30% lower for the narrower reactor.
The fitted value for kwa obtained here appears consistent with both theoretical and experimental estimates of wall loss rates for radicals in atmospheric pressure reactors. For ex- ample, the Gormley-Kennedy equation (40) yields a rate coefficient for the loss of radicals to a perfectly absorbing wall in a laminar flow reactor of our dimensions of about 20 s-l. Given the diameter of the tubing used in this reactor and the likelihood of turbulent plug flow (Re = 21 800), this approach can serve only as a guide as to the order of magnitude of the wall loss. Experimentally derived rate coefficients of 0.19 s-l were obtained for a 43-mm tube in this study and 0.175 s-l for a 75-mm tube by Mozurkewich et al. (38). These rate coefficients are actually greater than those predicted by the Gonnley-Kennedy equation for these tubes, so our fitted value is consistent with a less than perfect wall loss process. Finally, in a separate, but related, study, Blanchard et al. (41) esti- mated a k d to the walls of a 1/8-in.-o.d. Teflon tube as 3 s-'.
Chain Length Dependence on Radical Concentration. Figure 5 shows the calculated chain length from a series of simulations by using varying concentrations of H02 radicals together with measurements of the chain length for peroxy- acetyl radicals from the PAN source, for a range of reaction times. For the lower concentrations, the chain length was independent of radical concentration (i.e., the instrument response was linear). However, as the radical concentration increased, the chain length decreased. This was observed both in simulation and experimentally, although there was a small difference in the concentration at which this effect became significant.
The chain length is governed by the rates of the radical termination reactions, which are, in order of decreasing im-
I- I
Figure 5. Calculations and measurements of the chain length as a function of radical concentration for a number of reaction times. Legend: filled squares, measurements with a l-s reaction time; for the calculations, asterisks, t = 0.1 s; stars, t = 0.21 s; diamonds, t = 0.47 s; upright triangles, t = 1.0 s; crosses, t = 2.1 s; inverted triangles, t = 4.7 s; and open squares, t = 10 s.
0 2 4 a 10
TIME [ sec ]
[ RO,] = 1 *1E8 c m y * 1E9 ~m'~101ElOcm.~1A 1E l l cm.31 x l E l 2 ~ m . ~ I meas. ( 1.5 E9) cm-3 1 Figure 6. Calculations and measurements of the chain length as a function of reaction time for a number of radical concentrations. Legend: filled squares, measurements; for the calculations, asterisks, 1 X 10' cm4; stars, 1 X 10' cm4; diamonds, 1 X 10' cm4; upright triangles, 1 X lo8 cmS; and crosses, 1 X 10' cm4. Dark shading indicates the range of times used in this study, the lighter shading the range of times used in the conventional detector.
portance, wall loss, the reaction of H02 with NO2, and the reaction of HO with NO. The first and third of these are first order in the radical and independent of the concentration of any reaction products. However, the reaction of H02 with NO2 is dependent on the NO2 produced by the amplifier, and as the radical concentration increases, this loss starts to be- come competitive with the wall loss leading to a decreased chain length. For longer reaction times, this effect becomes noticeable at lower H02 concentrations because the chain lengths are longer and therefore the NO2 production is greater. Similar but much smaller nonlinearities arise from the reac- tions of HO with NO2 and H02 with HOP The measurements and the simulations show that the chain length for our chemical amplifier is constant, within lo%, for concentrations below about 5 X lo9 cmd3. This is somewhat higher than the maximum levels of radicals expected to be present in the troposphere, and therefore, the dependence of CL on radical concentration should not represent an interpretive problem for our radical detector.
It is important to note that these results show that a source of radical concentrations of 5 X lo9 cm-3 or less is needed to calibrate the amplifier, especially since the dependence of chain length on concentration is a function of wall loss rate,
2054 ANALYTICAL CHEMISTRY, VOL. 63, NO. 18, SEPTEMBER 15, 1991
and extrapolating from high concentration calibrations to the linear regime by using a model is difficult if not impossible.
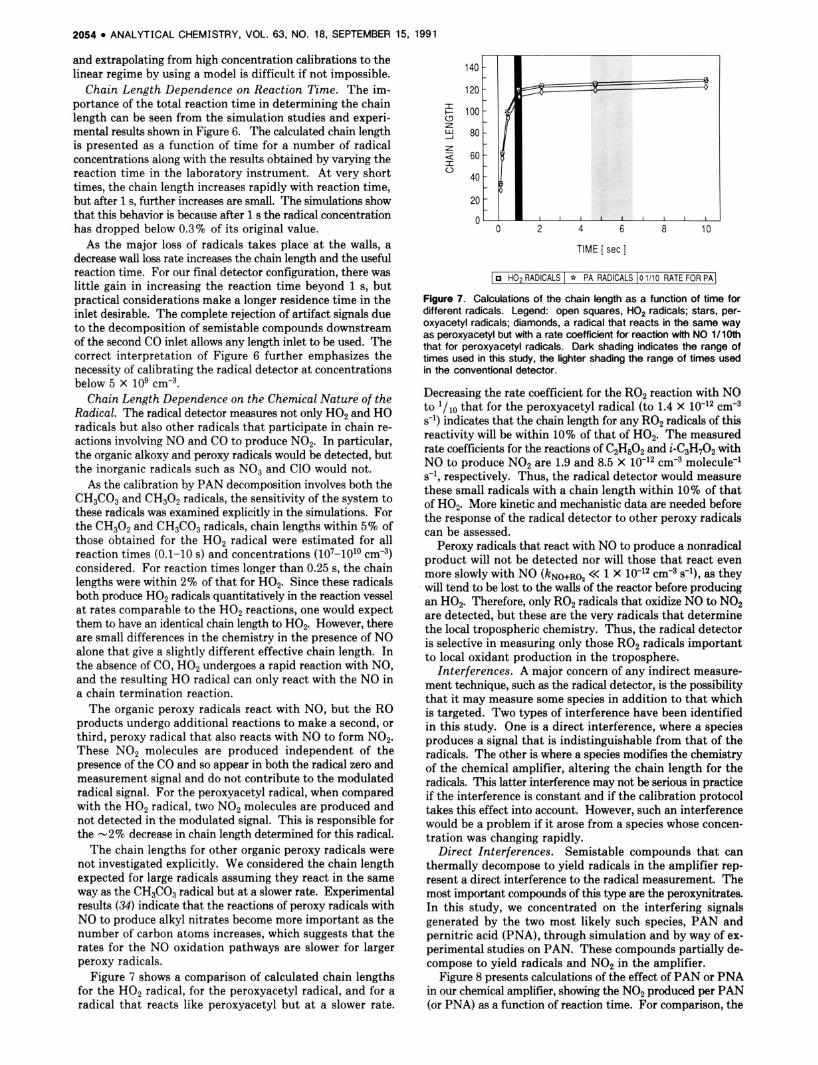
Chain Length Dependence on Reaction Time. The im- portance of the total reaction time in determining the chain length can be seen from the simulation studies and experi- mental results shown in Figure 6. The calculated chain length is presented as a function of time for a number of radical concentrations along with the results obtained by varying the reaction time in the laboratory instrument. At very short times, the chain length increases rapidly with reaction time, but after 1 s, further increases are small. The simulations show that this behavior is because after 1 s the radical concentration has dropped below 0.3% of its original value.
As the major loss of radicals takes place at the walls, a decrease wall loss rate increases the chain length and the useful reaction time. For our final detector configuration, there was little gain in increasing the reaction time beyond 1 s, but practical considerations make a longer residence time in the inlet desirable. The complete rejection of artifact signals due to the decomposition of semistable compounds downstream of the second CO inlet allows any length inlet to be used. The correct interpretation of Figure 6 further emphasizes the necessity of calibrating the radical detector a t concentrations below 5 x lo9 ~ m - ~ .
Chain Length Dependence on the Chemical Nature of the Radical. The radical detector measures not only H02 and HO radicals but also other radicals that participate in chain re- actions involving NO and CO to produce NO2. In particular, the organic alkoxy and peroxy radicals would be detected, but the inorganic radicals such as NO3 and C10 would not.
As the calibration by PAN decomposition involves both the CH3C03 and CH302 radicals, the sensitivity of the system to these radicals was examined explicitly in the simulations. For the CH302 and CH3C03 radicals, chain lengths within 5% of those obtained for the H 0 2 radical were estimated for all reaction times (0.1-10 s) and concentrations (107-1010 ~ m - ~ ) considered. For reaction times longer than 0.25 s, the chain lengths were within 2% of that for H02. Since these radicals both produce H02 radicals quantitatively in the reaction vessel at rates comparable to the H 0 2 reactions, one would expect them to have an identical chain length to HOP However, there are small differences in the chemistry in the presence of NO alone that give a slightly different effective chain length. In the absence of CO, H02 undergoes a rapid reaction with NO, and the resulting HO radical can only react with the NO in a chain termination reaction.
The organic peroxy radicals react with NO, but the RO products undergo additional reactions to make a second, or third, peroxy radical that also reacts with NO to form NO2. These NO2 molecules are produced independent of the presence of the CO and so appear in both the radical zero and measurement signal and do not contribute to the modulated radical signal. For the peroxyacetyl radical, when compared with the H 0 2 radical, two NO2 molecules are produced and not detected in the modulated signal. This is responsible for the -2% decrease in chain length determined for this radical.
The chain lengths for other organic peroxy radicals were not investigated explicitly. We considered the chain length expected for large radicals assuming they react in the same way as the CH3C03 radical but a t a slower rate. Experimental results (34) indicate that the reactions of peroxy radicals with NO to produce alkyl nitrates become more important as the number of carbon atoms increases, which suggests that the rates for the NO oxidation pathways are slower for larger peroxy radicals.
Figure 7 shows a comparison of calculated chain lengths for the H 0 2 radical, for the peroxyacetyl radical, and for a radical that reacts like peroxyacetyl but a t a slower rate.
I I- (3 z W -J
z a I 0
0 2 4 6 8 10
TIME [ sec ]
I H o p RADICALS I * PA RADICALS 10 1110 RATE FOR PA1
Figure 7. Calculations of the chain length as a function of time for different radicals. Legend: open squares, Hop radicals: stars, per- oxyacetyl radicals; diamonds, a radical that reacts in the same way as peroxyacetyl but with a rate coefficient for reaction with NO 1110th that for peroxyacetyl radicals. Dark shading indicates the range of times used in this study, the lighter shading the range of times used in the conventional detector.
Decreasing the rate coefficient for the R02 reaction with NO to that for the peroxyacetyl radical (to 1.4 X cm-3 s-l) indicates that the chain length for any R02 radicals of this reactivity will be within 10% of that of HOP The measured rate coefficients for the reactions of C2H502 and i-C3H,O2 with NO to produce NO2 are 1.9 and 8.5 X cm-3 molecule-' s-l, respectively. Thus, the radical detector would measure these small radicals with a chain length within 10% of that of HOP More kinetic and mechanistic data are needed before the response of the radical detector to other peroxy radicals can be assessed.
Peroxy radicals that react with NO to produce a nonradical product will not be detected nor will those that react even more slowly with NO (KNO+R02 << 1 X cm-3 s-'), as they will tend to be lost to the walls of the reactor before producing an HOP Therefore, only R02 radicals that oxidize NO to NO2 are detected, but these are the very radicals that determine the local tropospheric chemistry. Thus, the radical detector is selective in measuring only those R 0 2 radicals important to local oxidant production in the troposphere.
Interferences. A major concern of any indirect measure- ment technique, such as the radical detector, is the possibility that it may measure some species in addition to that which is targeted. Two types of interference have been identified in this study. One is a direct interference, where a species produces a signal that is indistinguishable from that of the radicals. The other is where a species modifies the chemistry of the chemical amplifier, altering the chain length for the radicals. This latter interference may not be serious in practice if the interference is constant and if the calibration protocol takes this effect into account. However, such an interference would be a problem if it arose from a species whose concen- tration was changing rapidly.
Direct Interferences. Semistable compounds that can thermally decompose to yield radicals in the amplifier rep- resent a direct interference to the radical measurement. The most important compounds of this type are the peroxynitrates. In this study, we concentrated on the interfering signals generated by the two most likely such species, PAN and pernitric acid (PNA), through simulation and by way of ex- perimental studies on PAN. These compounds partially de- compose to yield radicals and NO2 in the amplifier.
Figure 8 presents calculations of the effect of PAN or PNA in our chemical amplifier, showing the NO2 produced per PAN (or PNA) as a function of reaction time. For comparison, the
ANALYTICAL CHEMISTRY, VOL. 63, NO. 18, SEPTEMBER 15, 1991 2055
2 240 a z 200
160
n c
0 0
X - E 120 a z
80
z a 40 I 0
-
-
-
-
-
-
n -
/
-
-
-
-
-
-
-
240
200
160
120
80 z a
40 6
a z 0 c
I
z W
" 0 2 4 6 8 10 "
TIME [ sec ] . NO,/ PAN config. Ib
0 NO,/ PNA config. Ib
* NO,/ PAN conventional
* NO,/ PNA conventional
Flgure 8. Calculations of the chain length as a function of time for different species and detector configurations. Legend: open circles, H02 radicals; filled squares, PAN predicted by using the configuration of Figure 1B; stars, PAN predicted by using the configuration where the CO is replaced by N, to give a radical zero; diamonds, PNA pre- dicted by using the configuration of Figure 1B; asterisks, PNA predicted by using the configuration where the CO is replaced by N,. Dark shading indicates the range of times used in this study, the lighter shading the range of times used in the conventional detector.
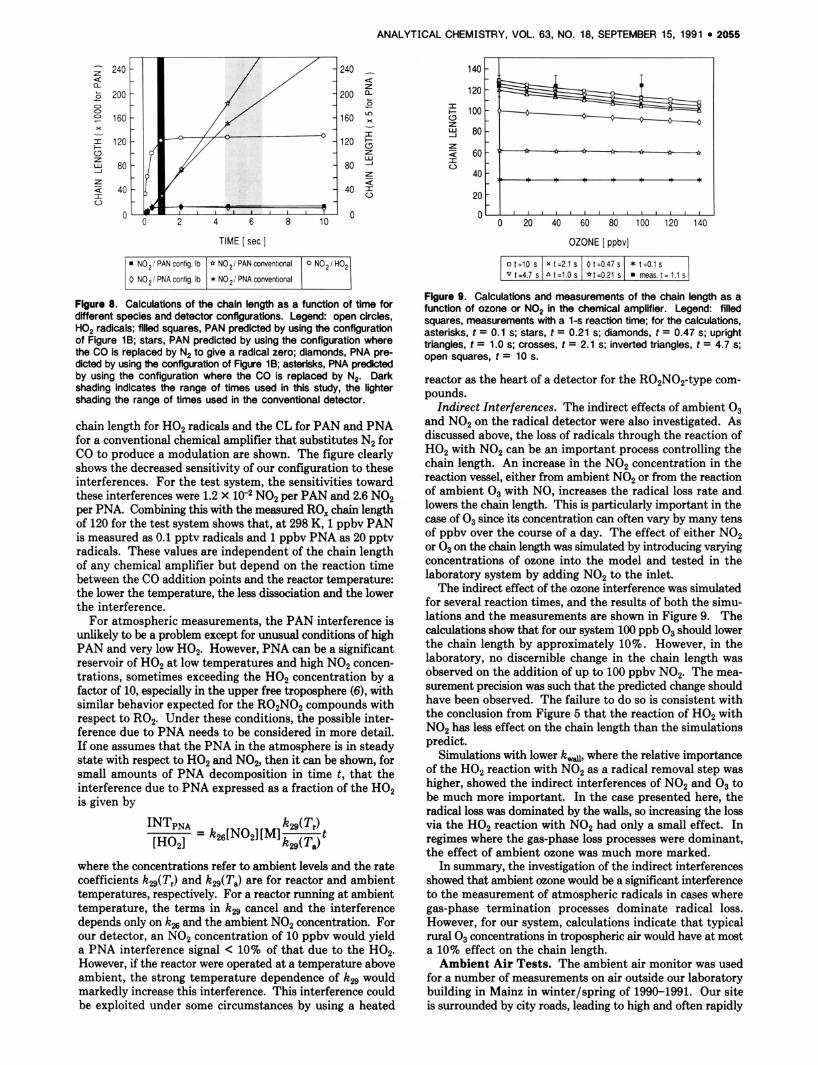
Ot=10 s Vt=4.7s
chain length for H02 radicals and the CL for PAN and PNA for a conventional chemical amplifier that substitutes N2 for CO to produce a modulation are shown. The figure clearly shows the decreased sensitivity of our configuration to these interferences. For the test system, the sensitivities toward these interferences were 1.2 X NO2 per PAN and 2.6 NO2 per PNA. Combining this with the measured RO, chain length of 120 for the test system shows that, at 298 K, 1 ppbv PAN is measured as 0.1 pptv radicals and 1 ppbv PNA as 20 pptv radicals. These values are independent of the chain length of any chemical amplifier but depend on the reaction time between the CO addition points and the reactor temperature: the lower the temperature, the less dissociation and the lower the interference.
For atmospheric measurements, the PAN interference is unlikely to be a problem except for unusual conditions of high PAN and very low H02. However, PNA can be a significant reservoir of H02 at low temperatures and high NO2 concen- trations, sometimes exceeding the H02 concentration by a factor of 10, especially in the upper free troposphere (6), with similar behavior expected for the R02N02 compounds with respect to R02. Under these conditions, the possible inter- ference due to PNA needs to be considered in more detail. If one assumes that the PNA in the atmosphere is in steady state with respect to H02 and NO2, then it can be shown, for small amounts of PNA decomposition in time t , that the interference due to PNA expressed as a fraction of the H02 is given by
xt=2.1 s Ot=O.47~ * t=O.ls A t = l . O s *t=0.21 s m meas.t=l. ls
where the concentrations refer to ambient levels and the rate coefficients k,( T,) and k,( T,) are for reactor and ambient temperatures, respectively. For a reactor running at ambient temperature, the terms in 12, cancel and the interference depends only on k , and the ambient NO2 concentration. For our detector, an NO2 concentration of 10 ppbv would yield a PNA interference signal < 10% of that due to the H02. However, if the reactor were operated at a temperature above ambient, the strong temperature dependence of 12% would markedly increase this interference. This interference could be exploited under some circumstances by using a heated
14aC I ' - 1 I
I 1201 @-
2o 0 * 0 20 40 60 80 100 120 140
OZONE [ ppbv]

2056 ANALYTICAL CHEMISTRY, VOL. 63, NO. 18, SEPTEMBER 15. 1991
j ROz Mixing Ratio in Mainz, Spring 1991
i
i -3 ' o ~ o o lioo o ~ o o l d o o odoo l;oo o ~ o o l;oo ' 14.03.91 15.03.91 16.03.91 17.03.91 18.03.91
TIME
Figure 10. Measurement of the concentration of RO, radicals outside the MPI building in Mainz from March 14 to 18, 1991.
fluctuating NO, mixing ratios that appear in the radical zero baseline on top of a more slowly fluctuating signal due to 03. These fluctuations made the discerning of a modulated signal due to ambient radicals difficult and determined the detection limit. The more rapid switching afforded by the computer control improved our ability to extract the modulated signal in the presence of these fluctuations.
The skies were usually overcast during most of the mea- surement period, and the ozone concentrations were generally below 25 ppbv, conditions that were not conducive to radical formation. However, they constituted an excellent test for the achievable detection limits and for the rejection of in- terferences by the instrument under ambient air monitoring conditions. Under such conditions, we rarely observed un- equivocal ambient radical signals, as expected for overcast winter conditions a t an urban site, and in particular, signals above our detection limit were never observed at night.
The 14th to the 18th of March 1991 presented one of the few opportunities to measure radicals. The weather for this period was cool and windy but generally clear and sunny. Nighttime O3 concentrations were below 15 ppbv, and daytime values were generally around 50 ppbv with excursions up to 70 ppbv on two afternoons. The RO, detector ran unattended from noon on the 14th (Thursday) until early morning on the 18th. Calibrations were performed before and after the measurement period. The measured RO, concentrations re- duced to 15-min average values are presented in Figure 10. There is a clear radical signal each day, maximizing in the early afternoon. The concentrations are low as expected for the latitude (50ON) in March (6). The real detection limit of this system can be seen from these data. The daytime signals of 2-3 pptv on the three complete days are clearly visible so we conclude that a 2 pptv detection limit is achievable with this system. One worrying feature of the data is an apparent 0.5 pptv negative offset at night. This points toward a small (0.5%) increase in either the flow through or pressure in the NO1 detector on switching from the measurement to the zero mode. The calculated change in pressure OD switching to zero mode is too small to be entirely responsible, and we are continuing to test the system to better understand and elim- inate this small offset. These data show that the instrument is able to maintain a satisfactory detection limit over an ex- tended period and is capable of making radical measurements, without interferences, even under conditions where radical production is low.
With the improved understanding afforded by the simu- lation studies, the improved rejection of interferences, the improved calibration method, and the demonstrated ability
to measure radical concentrations under unfavorable condi- tions, we believe the radical detector is now a useful tool for tropospheric chemistry research.
ACKNOWLEDGMENT We thank P. Warneck and S. Limbach for their assistance
with the chromatographic analyses and D. Stedman, A. Volz-Thomas, D. Mihelcic, and M. Mozurkewich for helpful discussions. D.R.H. thanks York University and MPI for the opportunity to spend a sabbatical in Mainz.
LITERATURE CITED Levy, H., 11. Science 1971, 173, 141-143. National Academy of S c k ~ X s . cyobel A t " p h e & ChCMlbtry: A plan for Action; National Academy Press: Washington, DC, 1984. Crutren, P. J. Telyw 1974, 26, 45-57. Chameldes, W.; Davls, D. D. J . Qeophys. Res. 1982, 8 7 ,
Penken, S. A.; Jones, 8. M. R.; Brice, K. A.; Eggleton, A. E. J. Ahnos. Envkm. 1979, 13, 123-137. Kanakidou, M.; Slngh, H. B.; Valentln, K. M.; W e n , P. J. J . c)eophy8 Res., in press. Hard, T. M.; O'Brten. R. J.; Chan, C. Y.; Wabzadeh, A. A. En-.
Chan, C. Y.; Hard, T. M.; Metrabzedeh, A. A.; b g e , 1. A.; O'Brbn,
Davis, L. I., Jr.; Ow. C.; James, J.; Monls, P. T.; Postiff, P.; Wang, C. C. J . -ys. Res. 1985, 90, 12835-12842. Rodgers, M. 0.; Bradshaw, J. D.; Sandhom, S. T.; KeSheng, S.: Davis, D. D. J. W y s . Res. 1985, 90, 12819-12834. Perner, D.; Ehhait, D. H.; PHtz, H. W.; Plan, U.; Roth, E. D.; Volz, A. c)eophys. R ~ S . Len. 1976, 3,486-468. Perm, D.; Plan, U.; Tralner, M.; Hiibler, G.; Drummond, J.; Junker- mann, W.; Rudolph, J.; Schubert, 8.; Vdz. A.; Ehhalt, D. H.; Rumpel, K. J.; HelaS, 0. J . Ahnos. Chem. 1987, 5 , 185-216. Dorn, H. P.; Calks, J.; Plan, U.; Ehhalt, D. H. Telyw 1988, 408, 437-445. Campbell, M. J.; Sheppard. J. C.; Au, B. B. -ys. Res. Len. 1979, 6 , 175-178. Cempbell, M. J.; Fanner, J. C.; Fitmer, C. A.; Henry, M. N.; Sheppard, J. C.; Hardy, R. J.; Hopper, J. F.; MuralWler, V. J . Amos. Chem. 1986, 4 , 413-427. Felton, C. C.; Sheppard, J. C.; Campbell, M. J. Nahm, 1968, 335, 53-55. Mhlcic, D.; Ehhalt, D. H.; K u W , 0. F.; Komfass, J.; Tralner, M.; Schmidt, A.; Rohrs, H. Rxe A M . Qeophys. 1978, 116, 530-542. Mhlcic, D.; Miisgen. P.; Ehhalt, D. H. J . A m . Chem. 1985, 3 ,
Atmos. Chem. 1990. 11, 271-297. Cantreii, C. A.; Stedman, D. H. oeophvs. Res. Len. 1062, 9 ,
Cantrell, C. A.; Stedman, D. H.; Wendel, G. J. Anal. Chem. 1984, 56,
M a d , Y.; Adti, K.; Munemorl, M. Anal. Chem. 1980, 52 , 307-311. Wendel. G. J.; Stedman. D. H.; Cantreli, C. A.; Damrauer, L. Anal.
Stedman, D. H.; Walega, J. 0.; Cantrell, C. A.; Burrows, J. P.; TyndaH, 0. hmktry of multlphese atmospheric systems; NATO AS1 Series G8; Springer Verlag: BerUn, 1986. [)rUnmond, J. W.; Castkdlne, C.; (leen. J.; Denno, R.; Mackay, G. I.; Schm, H. I. New tech-b for use in acid deposiuon networks. I n Monitoring methods fw toxhx In Um aanosphere; Zielinskl, W. L.. Ed.; American Society for Testing and Materlals: Phlladelphla, PA, 1989; ASTM STP 1052. Hlrschberger, K. Dlpbmarbelt. Fachhochschule, Wiesbaden, Gemany, 1988.
4863-4877.
Sei. TedMd. 1984, 18, 768-777.
R. J. J . -9. Res. 1990, 95, 18569-18578.
341-361. MbldC, D.; VOlZ-Thomas, A.; Phtz, H. W.; Kky, D.; Mihelcic, M. J .
846-849.
1496- 1502.
Chem. 1989, 55. 937-940.
s s h H. I.; Mackey, 0. I.; Catledine. C.; Harrls, 0. W.; Trar,, Q. Water Air Soil Pdu. 1986, 30, 105-114. Meyrahn, A f l L A l R H.; Helas, G.; Warneck, P. J . Atmos. Chem. 1987, 5 , .-- ~ .-. Blanchard, P.; Shepson, P. 6.; So, K. W.; Schlff, H. I.; Bonenhelm, J. W.; Gallant, A. J.; Drummond, J. W.; Wong, P. Ahnos. Envkon. 1990,
Stedman, D. H.; Tammaro, D. A.; Branch, D. K.; Pearson, R., Jr. Anal.
Nlelsen, T.; Hansen, A. E.; Thomsen, E. L. Atmos. Env)wr. 1982, 76, 2447-2450. Cuftis, A. R.; Sweetenham, P. FACSIMILE release H users manual. U.K. E R E Report R 1 177 1 ; Computer Sdence and Systems Mvisbn, AERE Harwell. Dldcot, Oxon 11 ORA, U.K. DeMore, W. 8.; Mollna, M. J.; Sander, S. P.; Qolden. D. M.; Hampson, R. F.; Kwyb, M. J.; Howard, C. J.; Ravlshankara, A. R. Chemical kC netics and photochemlcel data for use In stratospherlc modeling. NASA Panel for Data evaluatbn, Evaluation 8, Jet Propulsbn Lebora- tory, Publkxtbn 87-41. Atkinson, R.; Baulch, D. L.; Cox, R. A.; Hampson, R. F.. Jr.; Ken, J. A,; Troe, J. Int. J . Chem. K h t . 1989, 21 , 115-150 J. phvs. Chem. Ref. Data 1989, 18, 881-1097. Troe, J. J . phys. Chem. 1979, 83 , 114-126.
24A. 2839-2846.
Chem. 1979, 51 , 2340-2342.
Anal. Chem. 1001. 63, 2057-2061 2057
(36) Mehrabzadeh, A. A.; OBrlen, R. J.; Hard, T. M. Rev. So/. Instfum.
(37) Cox, R. A.; Burrows, J. P. J. hys. Chem. 1979, 83, 2560-2568.
(39) Key=, L. F. J. phys. Chem. 1981, 65, 3667-3673. (40) Gormley, P. 0.; Kennedy, M. Roc R. I f . Aced., Sect. A 1949, 52A,
presented at the CACGP conference, Chamrousse, France, Sept 1983. 54. 1712-1710. 1990.
phys. RW. 1087, 92, 4163-4170. (38) MOZurltCnnich, M.: McMwry, P. H.: mpta. A.; Cab&. J. 6. J . b- RECEIVED for review February 12,1991. Accepted June 10,
1991. This work was funded by the Max-Planck-Gesellschaft and in part by the BMFT Project 325-4007-07INT347 (P.I. 163- 169.
(41) Blancherd, P.: Shepson, P. 9.; Drummond, J. W.; Schiff, H. I. Paper D. Perner).
General Theory of Excitation in Ion Cyclotron Resonance Mass Spectrometry
Peter B. Grosshans and Alan G. Marshall*?'
Department of Chemistry, The Ohio State University, 120 West 18th Avenue, Columbus, Ohio 43210
The vector posltlon of an Ion as a functlon of tlme before, durlng, and after radio-frequency (rf) electrlc fleld excltatlon by an arbltrary tlme-domaln waveform Is derlved, assuming that the magnetlc field Is unlform and keeping, in the differ- entlal equations of motion, terms through first order In the Taylor series expanslon of the electric flelds. The latter a p proxlmatlon yields a quadrupolar electrostatic potential and a spatlally unlform rf excitation fleld whose magnitude Is de- termhod by the trap geometry and dlmendons of the trap. Under these very general condltlons, we find that the post- excltatlon cyclotron (magnetron) radlus of an Ion Increases, In a vector sense, by an amount proportlonal to the magnl- tude-mode spectral peak height of the excltatlon waveform at the cyclotron (magnetron) frequency of the Ion of interest; the proportlonallty constant depends on the trap geometry but Is Independent of the partlcular excltatlon waveform used. Tlnrs,hovdwtoanyune(hadvance)the ICRcnMalradus resuMng from exdtatlon by a partWar excitation wavetbtm , one need simply evaluate the Fourler transform spectral n?a@Mu& of that exdtatbn waveiom, at th8 Ion's ICR M a l frequency (assuming e l b k InMaI Cyclotron radlus). This linear theory does not address various nonlinear effects that are known to occur during the excitation event, m a notably, effects due to the spatial Inhomogeneity of the excltatlon electrlc field; however, the present theory provides a firm theoretical foundatlon for stored waveform Inverse Fourler transform (SWIFT) excltatlon and two-dlmenslonal FTICR mass spectrometry. The results obtalned are for the special case of a tetragonal trap; however, they are generalizable to any trap geometry. Wlth the aM of materlal presented In the Appendix, the generallzatlon to cyllndrlcal Ion traps wlth the rlng electrode divided Into equal quadrants Is simple.
INTRODUCTION
The capabilities, advantages, and applications of Fourier transform ion cyclotron resonance (FTICR) mass spectrometry are described in ref 1 and reviews cited therein. Once ions have been formed and trapped by static electric and magnetic fields, it is necessary to generate a detectable signal by means
*To whom correspondence should be addressed. lAlso a member of the Department of Biochemistry.
of coherent excitation of ions to a larger ICR orbital radius. The response of an ion to a linearly polarized radio-frequency (rf) electric excitation field has been treated for several dif- ferent waveforms: single-frequency resonant excitation (2) ; "impulse" (3-5) or "burst" (3,6, 7) excitation; frequency-sweep ("chirp") excitation (8-1 0); and stored waveform inverse Fourier transform (SWIFT) excitation (11-15), which has been shown to produce optimally uniform frequency-domain magnitude and selectivity. In all of these prior treatments where postexcitation cyclotron radii were computed, the equations of motion were solved directly for each excitation waveform. A more general approach is clearly desirable.
Guan has treated the response of an ion to a spatially uniform time-varying electric field (16) generated from an unspecified time-domain voltage waveform. He obtained the very general result that the postexcitation cyclotron radius of an ion is proportional to the magnitude-mode Fourier transform of the applied waveform evaluated at the cyclotron frequency of the ion. The proportionality constant he found is correct in the l i i i t of infinitely extended parallel excitation electrodes. Elsewhere, it has been shown that this infinite plate approximation overstates the excitation electric field near the center of a cubic trap by 39% (17-20); thus, one might expect, and we will show, that Guan's result requires an ad- ditional correction factor to achieve the same level of accuracy as other, less general, results. Furthermore, Guan did not treat, nor is his approach applicable to, the more realistic case in which the ion is subject to an electrostatic trapping force, so his treatment does not incorporate magnetron motion, trapping motion, or cyclotron frequency shifts due to the trapping potential.
Here, we derive the vector position of an ion as a function of time for an arbitrary time-domain excitation waveform, assuming only that the electrostatic potential is quadrupolar and the magnetic and rf excitation fields are spatially uniform (electrostatic and rf potentials accurate to second order in field coordinates) under completely general initial conditions (e.g., an ion may begin with arbitrary cyclotron and magnetron orbital radii and phases and arbitrary axial position and ve- locity). We find that the vector increase in the cyclotron (or magnetron) radius of an ion under these conditions is directly proportional to the spectral magnitude of the Fourier trans- form of the excitation waveform evaluated at the cyclotron (or magnetron) frequency of the ion of interest. The present linear theory does not address various nonlinear effects that are known to occur during the excitation event (e.g., space charge); however, the present theory provides a firm theo-
0003-2700/91/0363-2057$02.50/0 0 1991 American Chemical Society