calculation method of losses and efficiency of wind generators
TRANSCRIPT
Chapter 2Calculation Method of Lossesand Efficiency of Wind Generators
Junji Tamura
Abstract In the recent years, many wind turbine generation systems (WTGS)have been installed in many countries. However the electric power obtained fromwind generators is not constant due to wind speed variations. The generatedelectric power and the loss in WTGS change corresponding to the wind speedvariations, and consequently the efficiency and the capacity factor of the systemalso change. In this chapter, methods to evaluate the losses and output power ofwind generator systems with Squirrel-Cage Induction Generator (IG), PermanentMagnet Synchronous Generator (PMSG), and Doubly-fed Induction Generator(DFIG) are explained. By using the presented methods, it is possible to calculatethe generated power, the losses, total energy efficiency, and capacity factor of windfarms quickly.
2.1 Introduction
Wind energy is a clean and renewable energy source. In the recent years, many windturbine generation systems (WTGS) have been installed in many countries from theviewpoints of global warming and depletion of fossil fuels. In addition, WTGS is oflow cost in comparison with other generation systems using renewable energy.However the electric power obtained from wind generators (WG) is not constant dueto wind speed variations. The generated electric power and the loss in WTGS changecorresponding to the wind speed variations, and consequently the efficiency and thecapacity factor of the system also change. In addition, the wind characteristic of each
J. Tamura (&)Department of Electrical and Electronic Engineering, Kitami Institute of Technology,165 Koen-Cho, Kitami 090-8507, Japane-mail: [email protected]
S. M. Muyeen (ed.), Wind Energy Conversion Systems,Green Energy and Technology, DOI: 10.1007/978-1-4471-2201-2_2,� Springer-Verlag London Limited 2012
25
area is different and thus the optimal WTGS for each area is different. Therefore, it isnecessary to analyze the optimal WTGS in each area. In the determination of optimalWTGS, annual energy production and capacity factor are very important factors.
In order to capture more energy from wind, it is essential to analyze the losscharacteristics of WG, which can be determined from wind speed. Furthermore,since many non-linear losses occur in WG, making prediction profit by usingaverage wind speed may cause many errors. This chapter presents a method torepresent various losses in WG as a function of wind speed, which is based on thesteady-state analysis. By using the presented method, wind turbine power, gen-erated power, copper loss, iron loss, stray load loss, mechanical losses, converterloss, and energy efficiency can be calculated quickly.
First, a calculation method of the efficiency for constant speed WGs usingSquirrel-Cage Induction Generator (IG) is presented, in which, using the windturbine characteristics and IG steady-state equivalent circuit, wind turbine output,generator output, and various losses in the system can be calculated. Next, acalculation method of the efficiency for variable speed WGs using permanentmagnet synchronous generator (PMSG) is presented. PMSG has some advantagesover constant speed IG; i.e., PMSG can operate at the speed corresponding to themaximum power coefficient of wind turbine; noise can be decreased becausePMSG WG does not need slip ring, brush, and gear system. However, since itneeds power electronics devices for being connected to the power grid, lossevaluation of the power electronics devices is also needed in order to calculate thetotal efficiency of the wind generation system. Finally, a method to calculate loss,power, and efficiency of WTGS with Doubly-fed Induction Generator (DFIG) ispresented. In recent years, the number of wind farms with large size DFIGs hasincreased all over the world. This type of system has power converters in the rotorcircuit, and thus it can be operated at variable speed. The power rating of thepower converter can be lower in this system than those in other types of systems,for example, WTGS with a synchronous generator with a field winding or per-manent magnet. Thus, the power converter cost becomes lower than those of othersystems.
In the methods presented in this chapter, wind speed is used as the input data,and then all state variables and conditions of the WG system, for example, windturbine output, generator output, output power to the power grid, and variouslosses in the system etc., can be obtained. Generator state variables are calculatedusing the d-q axis equivalent circuit.
As one application of the presented methods, annual energy production andcapacity factor of the wind farm can easily be evaluated by using wind speedcharacteristics expressed by Weibull distribution function. Weibull distributionfunction is commonly used to express the annual wind speed characteristics.Coefficients of Weibull distribution function can be determined by the geographyand climate data of each area. Using the data of Weibull distribution function ofdifferent areas, capacity factor is calculated and compared among three types ofWTGS, i.e., Squirrel-Cage IG, PMSG, and DFIG.
26 J. Tamura
2.2 Calculation Method for Squirrel-CageInduction Generator
2.2.1 Outline of the Calculation Method
Induction generator is widely used as WG due to its low cost, low maintenance,and direct grid connection. However, there are several problems regarding theinduction generator as given below.
• Usually the input, output, and loss conditions of induction generator can bedetermined from rotational speed (slip). However, it is difficult to determine slipfrom wind turbine input torque.
• Generator input torque is reduced by mechanical losses, but mechanical lossesare a function of rotational speed (slip). It is difficult to determine mechanicallosses and slip at the same time.
• It is hard to measure stray load loss and iron loss.• It is difficult to evaluate gear loss analytically as a function of rotational speed.
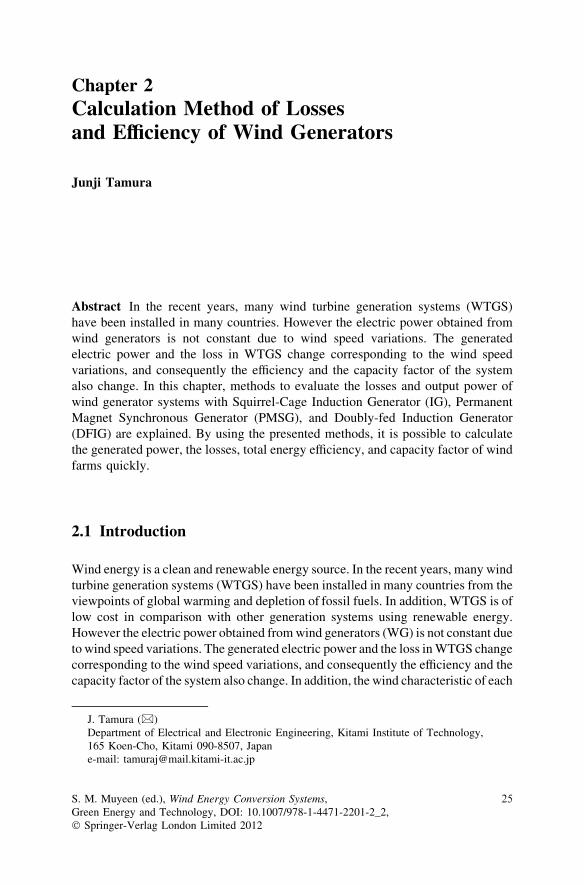
In this section, a method of calculating the efficiency of WG correctly is pre-sented, taking into account the points mentioned above. Figure 2.1 shows thesystem configuration for the analysis in this section. Table 2.1 shows the losses ofthis type of WG. The equivalent circuit of the induction generator used in the
Fig. 2.1 Systemconfiguration with IG
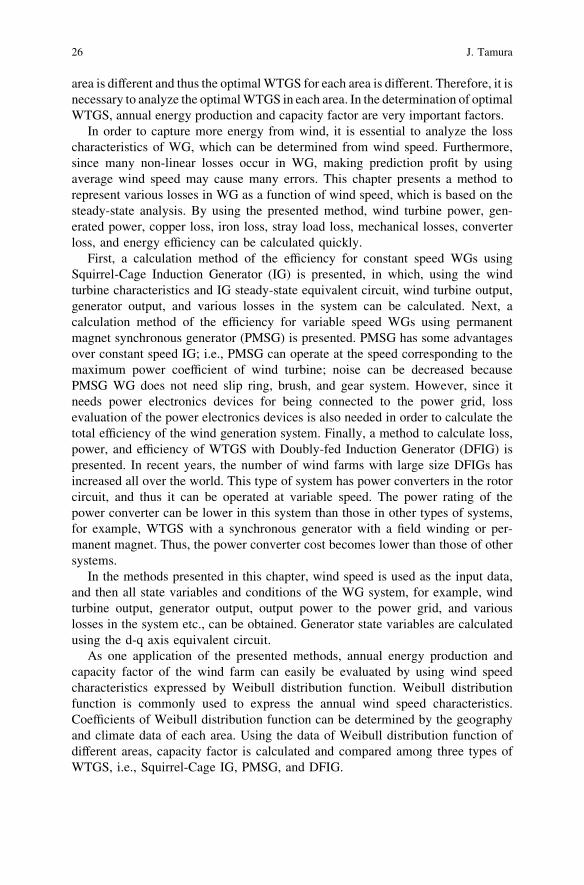
Table 2.1 Losses of windgenerator
Mechanical loss Gear box lossesWindage lossBall bearing loss
Copper loss Primary winding copper lossSecondary winding copper loss
Iron loss Eddy current lossHysteresis loss
Stray load loss
2 Calculation Method of Losses and Efficiency of Wind Generators 27
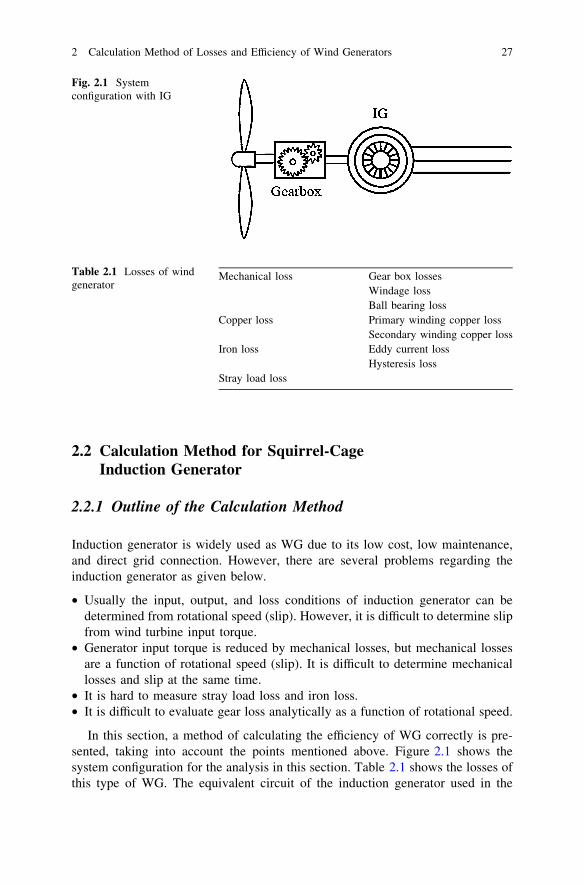
method is shown in Fig. 2.2. The input torque and copper losses are calculated bysolving the circuit Eq. 2.1.
_V1 ¼ � r1 þ jx1 þjrmxm
rm þ jxm
� �_I1 þ
jrmxm
rm þ jxm
_I2
0 ¼ � jrmxm
rm þ jxm
_I1 þjrmxm
rm þ jxm
þ r02sþ jx2
� �_I2
9>>>=>>>;
ð2:1Þ
2.2.2 Models and Equations Necessary in the Calculations
2.2.2.1 Wind Turbine Power
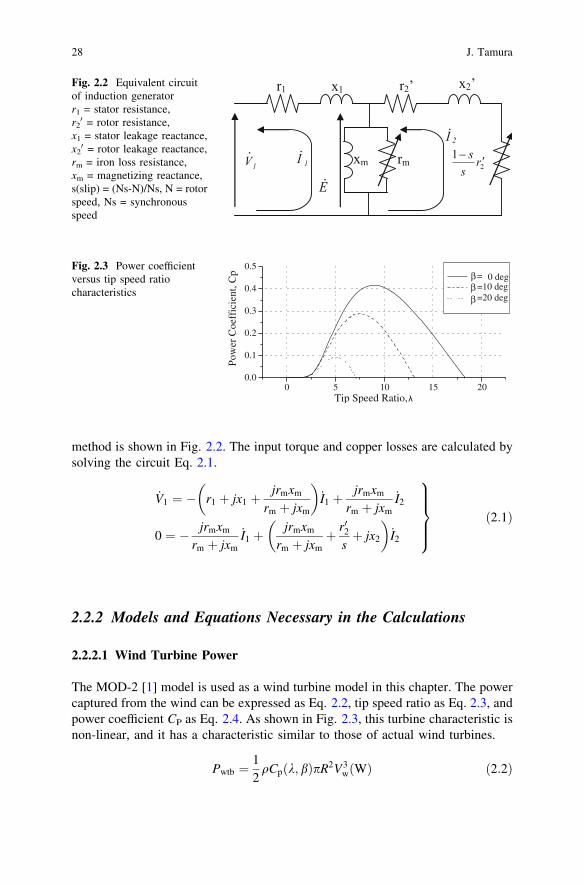
The MOD-2 [1] model is used as a wind turbine model in this chapter. The powercaptured from the wind can be expressed as Eq. 2.2, tip speed ratio as Eq. 2.3, andpower coefficient CP as Eq. 2.4. As shown in Fig. 2.3, this turbine characteristic isnon-linear, and it has a characteristic similar to those of actual wind turbines.
Pwtb ¼12
qCpðk; bÞpR2V3wðWÞ ð2:2Þ
Fig. 2.2 Equivalent circuitof induction generatorr1 = stator resistance,r20 = rotor resistance,
x1 = stator leakage reactance,x20 = rotor leakage reactance,
rm = iron loss resistance,xm = magnetizing reactance,s(slip) = (Ns-N)/Ns, N = rotorspeed, Ns = synchronousspeed
0 5 10 15 200.0
0.1
0.2
0.3
0.4
0.5
Pow
er C
oeff
icie
nt, C
p ==10 deg =20 deg
Tip Speed Ratio,
0 degβββ
Fig. 2.3 Power coefficientversus tip speed ratiocharacteristics
28 J. Tamura
k ¼ xwtbR
Vwð2:3Þ
CPðk; bÞ ¼ 0:5ðC� 0:022b2 � 5:6Þe�0:17C C ¼ R
k� 36001609
� �ð2:4Þ
In Eqs. 2.2–2.4, Pwtb = turbine output power (W), q = air density (kg/m3),Cp = Power coefficient, k = Tip speed ratio, R = Radius of the blade (m), Vw = windspeed (m/s), xwtb = Wind turbine angular speed (rad/s), and b = blade pitchangle (deg).
2.2.2.2 Several Losses in the Generator System
Generator input power can be calculated from the equivalent circuit of Fig. 2.2 asshown below:
I22
1� s
s� r02
� �ðWÞ ð2:5Þ
Copper losses are resistance losses occurring in the winding coils and can becalculated using the equivalent circuit resistances r1 and r2
0 as
wcopper ¼ r1 � I21 þ r02 � I2
2ðWÞ ð2:6Þ
Generally, iron loss is expressed by the parallel resistance in the equivalentcircuit. However, iron loss is the loss produced by the flux change, and it consistsof eddy current loss and hysteresis loss. In the calculation method here, theiron loss per unit volume, wf, is calculated first using the flux density, as shownbelow [5].
wf ¼ B2 rH
f
100
� �þ rEd2 f
100
� �2( )
(W/kg) ð2:7Þ
where B: flux density (T), rH: hysteresis loss coefficient, rE: eddy current losscoefficient, f: frequency (Hz), and d: thickness of iron core steel plate (mm).Generally, flux u and the internal voltage E can be related to Eq. 2.8. Therefore, ifthe number of turns of a coil is fixed, proportionality holds between the fluxdensity and the internal voltage as shown in Eq. 2.9.
E ¼ 4:44� f � kw � w� /ðVÞ ð2:8Þ
B ¼ B0 �E
E0ðTÞ ð2:9Þ
where kw : winding coefficient, w : number of turns, u : flux, E0 : nominal internalvoltage. Then the iron loss resistance can be obtained with respect to the internalvoltage E determined by the flux density as shown below, where Wf is the totaliron loss which is determined using Eq. 2.7 and the iron core weight.
2 Calculation Method of Losses and Efficiency of Wind Generators 29
rm ¼E2
Wf=3ð2:10Þ
Bearing loss is a mechanical friction loss due to the rotation of the rotor, whichcan be expressed as below.
Wb ¼ KBxm ðWÞ ð2:11Þ
where KB is a parameter concerning the rotor weight, the diameter of an axis, andthe rotational speed of the axis.
Windage loss is a friction loss that occurs between the rotor and the air, and isexpressed as follows.
Wm ¼ KWx2m ðWÞ ð2:12Þ
where Kw is a parameter determined by the rotor shape, its length, and the rota-tional speed. Stray load loss is expressed as follows.
Ws ¼ 0:005P2
Pn
ðWÞ ð2:13Þ
where P is generated power (W) and Pn is the rated power (W).Gear box losses [6, 2], are primarily due to tooth contact losses and viscous oil
losses. In general, these losses are difficult to predict. However, tooth contactlosses are very small compared with viscous losses, and at fixed rotational speed,viscous losses do not vary strongly with transmitted torque. Therefore, simpleapproximation of gearbox efficiency can be obtained by neglecting the tooth lossesand assuming that the viscous losses are constant (a fixed percentage of the ratedpower). A viscous loss of 1% of rated power per step is a reasonable assumption.Thus the efficiency of a gearbox with ‘‘q’’ steps can be computed using Eq. 2.14.Generally, the maximum gear ratio per step is approximately 6:1, hence two orthree steps of gears are typically required.
ggear ¼Pt
Pm
¼ Pm � 0:01ð ÞqPmR
Pm
� 100ð%Þ ð2:14Þ
where Pt is gear box output power, Pm is turbine power, and PmR is the ratedturbine power. Figure 2.4 shows the gear box efficiency for three gear steps. In thischapter, three steps are assumed, according to a large-sized WG in recent years.
2.2.2.3 Calculation Method
The efficiency of a generator is determined using the loss expressions describedabove. The input, output, and loss conditions of induction generator can bedetermined from rotational speed (slip). However, it is difficult to determine slipfrom wind turbine input torque. Therefore, an iterative process is needed to obtain
30 J. Tamura
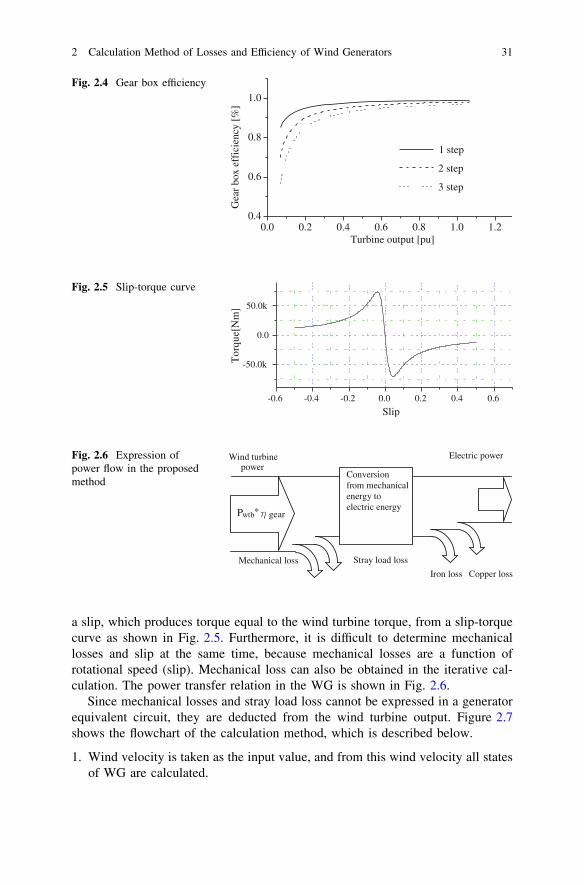
a slip, which produces torque equal to the wind turbine torque, from a slip-torquecurve as shown in Fig. 2.5. Furthermore, it is difficult to determine mechanicallosses and slip at the same time, because mechanical losses are a function ofrotational speed (slip). Mechanical loss can also be obtained in the iterative cal-culation. The power transfer relation in the WG is shown in Fig. 2.6.
Since mechanical losses and stray load loss cannot be expressed in a generatorequivalent circuit, they are deducted from the wind turbine output. Figure 2.7shows the flowchart of the calculation method, which is described below.
1. Wind velocity is taken as the input value, and from this wind velocity all statesof WG are calculated.
0.0 0.2 0.4 0.6 0.8 1.0 1.20.4
0.6
0.8
1.0
Gea
r bo
x ef
fici
ency
[%
]Turbine output [pu]
1 step
2 step
3 step
Fig. 2.4 Gear box efficiency
-0.6 -0.4 -0.2 0.0 0.2 0.4 0.6
-50.0k
0.0
50.0k
Tor
que[
Nm
]
Slip
Fig. 2.5 Slip-torque curve
Iron loss Copper loss
Wind turbine power
Mechanical loss Stray load loss
Conversionfrom mechanical energy to electric energy
Electric power
Pwtb* gear
Fig. 2.6 Expression ofpower flow in the proposedmethod
2 Calculation Method of Losses and Efficiency of Wind Generators 31
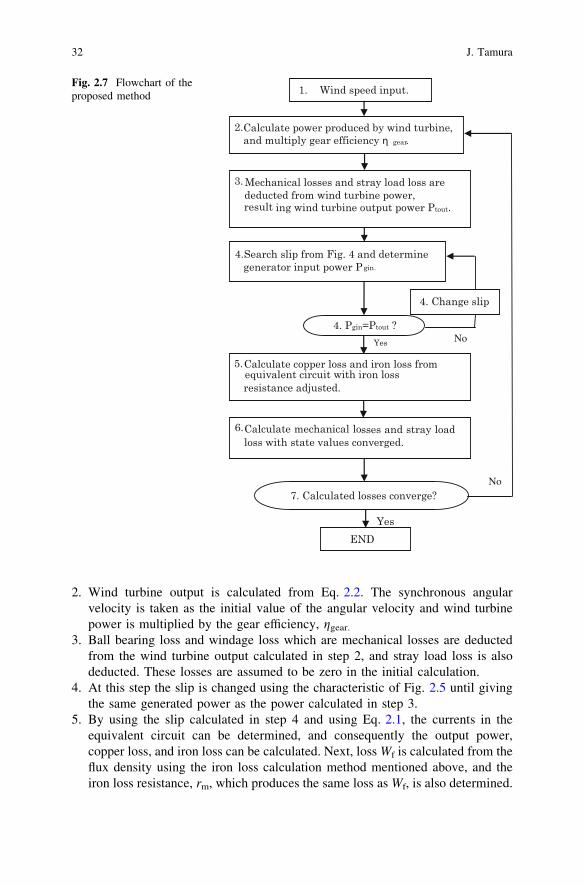
2. Wind turbine output is calculated from Eq. 2.2. The synchronous angularvelocity is taken as the initial value of the angular velocity and wind turbinepower is multiplied by the gear efficiency, ggear.
3. Ball bearing loss and windage loss which are mechanical losses are deductedfrom the wind turbine output calculated in step 2, and stray load loss is alsodeducted. These losses are assumed to be zero in the initial calculation.
4. At this step the slip is changed using the characteristic of Fig. 2.5 until givingthe same generated power as the power calculated in step 3.
5. By using the slip calculated in step 4 and using Eq. 2.1, the currents in theequivalent circuit can be determined, and consequently the output power,copper loss, and iron loss can be calculated. Next, loss Wf is calculated from theflux density using the iron loss calculation method mentioned above, and theiron loss resistance, rm, which produces the same loss as Wf, is also determined.
No
No
Fig. 2.7 Flowchart of theproposed method
32 J. Tamura
6. Ball bearing loss and windage loss are calculated by using Eqs. 2.11 and 2.12,and the rotational slip of the generator determined in step 5. And stray load lossis calculated from Eq. 2.13.
7. If the calculated losses converge, the calculation will stop, otherwise it willreturn to step 2.
2.2.3 Calculated Results
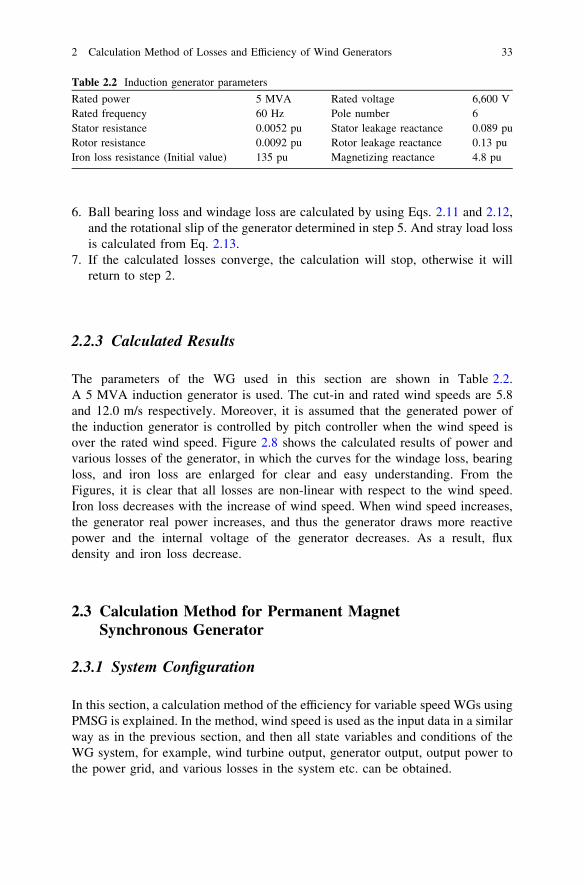
The parameters of the WG used in this section are shown in Table 2.2.A 5 MVA induction generator is used. The cut-in and rated wind speeds are 5.8and 12.0 m/s respectively. Moreover, it is assumed that the generated power ofthe induction generator is controlled by pitch controller when the wind speed isover the rated wind speed. Figure 2.8 shows the calculated results of power andvarious losses of the generator, in which the curves for the windage loss, bearingloss, and iron loss are enlarged for clear and easy understanding. From theFigures, it is clear that all losses are non-linear with respect to the wind speed.Iron loss decreases with the increase of wind speed. When wind speed increases,the generator real power increases, and thus the generator draws more reactivepower and the internal voltage of the generator decreases. As a result, fluxdensity and iron loss decrease.
2.3 Calculation Method for Permanent MagnetSynchronous Generator
2.3.1 System Configuration
In this section, a calculation method of the efficiency for variable speed WGs usingPMSG is explained. In the method, wind speed is used as the input data in a similarway as in the previous section, and then all state variables and conditions of theWG system, for example, wind turbine output, generator output, output power tothe power grid, and various losses in the system etc. can be obtained.
Table 2.2 Induction generator parameters
Rated power 5 MVA Rated voltage 6,600 VRated frequency 60 Hz Pole number 6Stator resistance 0.0052 pu Stator leakage reactance 0.089 puRotor resistance 0.0092 pu Rotor leakage reactance 0.13 puIron loss resistance (Initial value) 135 pu Magnetizing reactance 4.8 pu
2 Calculation Method of Losses and Efficiency of Wind Generators 33
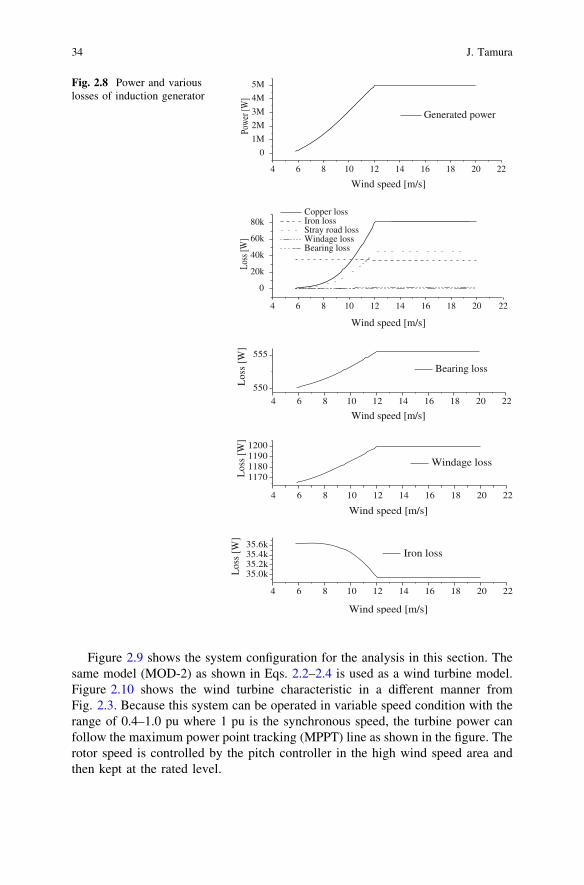
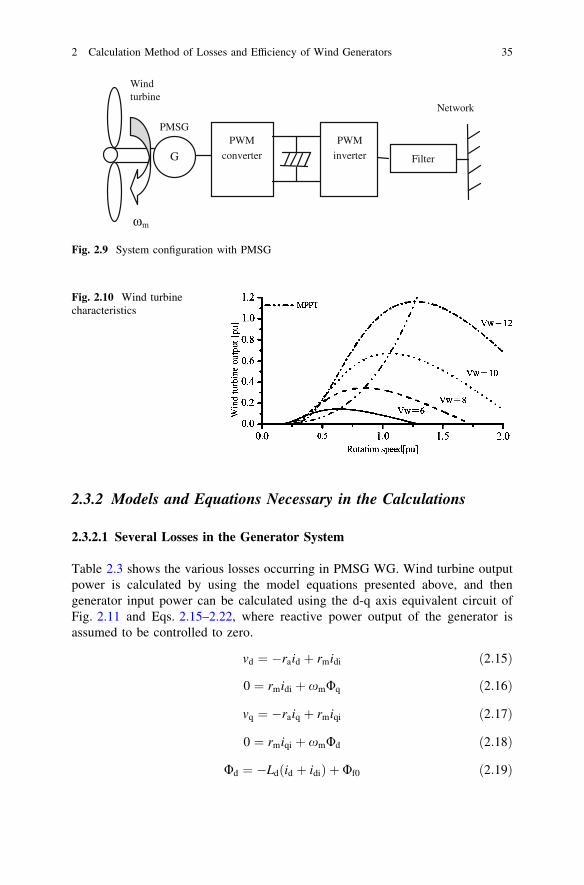
Figure 2.9 shows the system configuration for the analysis in this section. Thesame model (MOD-2) as shown in Eqs. 2.2–2.4 is used as a wind turbine model.Figure 2.10 shows the wind turbine characteristic in a different manner fromFig. 2.3. Because this system can be operated in variable speed condition with therange of 0.4–1.0 pu where 1 pu is the synchronous speed, the turbine power canfollow the maximum power point tracking (MPPT) line as shown in the figure. Therotor speed is controlled by the pitch controller in the high wind speed area andthen kept at the rated level.
4 6 8 10 12 14 16 18 20 22
0
1M
2M
3M
4M
5M
Pow
er [W
]
Generated power
4 6 8 10 12 14 16 18 20 22
0
20k
40k
60k
80k
Loss
[W]
Wind speed [m/s]
Wind speed [m/s]
Copper loss Iron loss Stray road loss Windage loss Bearing loss
4 6 8 10 12 14 16 18 20 22
35.0k35.2k35.4k35.6k
Los
s [W
]
Wind speed [m/s]
Wind speed [m/s]
Iron loss
4 6 8 10 12 14 16 18 20 22
1170118011901200
Los
s [W
]
Windage loss
4 6 8 10 12 14 16 18 20 22
550
555
Los
s [W
]
Wind speed [m/s]
Bearing loss
Fig. 2.8 Power and variouslosses of induction generator
34 J. Tamura
2.3.2 Models and Equations Necessary in the Calculations
2.3.2.1 Several Losses in the Generator System
Table 2.3 shows the various losses occurring in PMSG WG. Wind turbine outputpower is calculated by using the model equations presented above, and thengenerator input power can be calculated using the d-q axis equivalent circuit ofFig. 2.11 and Eqs. 2.15–2.22, where reactive power output of the generator isassumed to be controlled to zero.
vd ¼ �raid þ rmidi ð2:15Þ
0 ¼ rmidi þ xmUq ð2:16Þ
vq ¼ �raiq þ rmiqi ð2:17Þ
0 ¼ rmiqi þ xmUd ð2:18Þ
Ud ¼ �Ldðid þ idiÞ þ Uf0 ð2:19Þ
PMSG
m
Windturbine
GPWM
converter
PWM
inverter
Network
Filter
Fig. 2.9 System configuration with PMSG
Fig. 2.10 Wind turbinecharacteristics
2 Calculation Method of Losses and Efficiency of Wind Generators 35
Uq ¼ �Lqðiq þ iqiÞ ð2:20Þ
Uf0 ¼ Lmdif0 ð2:21Þ
PMG ¼ �xmðLd � LqÞidiq þ xmUf0iq ð2:22Þ
where, Ld ¼ la þ Lmd; Lq ¼ la þ Lmq; Ld: d axis inductance; Lq: q axis inductance;PMG: internal active power (W). Copper losses occur in the stator coil, and arecalculated using stator winding resistance, ra, in the equivalent circuit as below.
Wc ¼ raði2d þ i2qÞðWÞ ð2:23Þ
Mechanical losses, ball bearing loss Wb and windage loss Wm, are frictionlosses due to the rotation of the rotor. In general, bearing has two types, that is,plain bearing and ball-and-roller bearing. The bearing loss can be, in general,
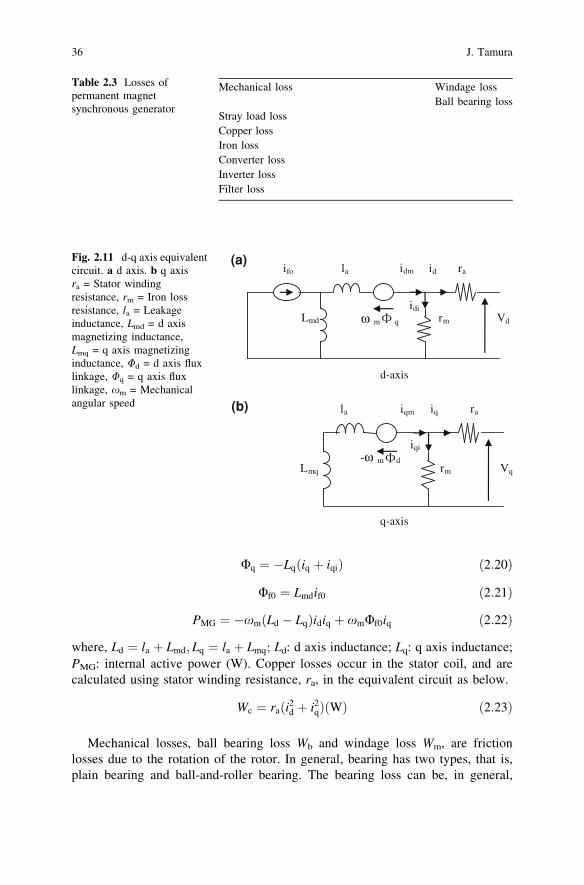
Table 2.3 Losses ofpermanent magnetsynchronous generator
Mechanical loss Windage lossBall bearing loss
Stray load lossCopper lossIron lossConverter lossInverter lossFilter loss
(a)
d-axis
(b)
q-axis
la
Lmd m q
raid
Vd
ifo idm
idirm
Lmq
la
- m drm Vq
iq
iqi
iqm ra
Fig. 2.11 d-q axis equivalentcircuit. a d axis. b q axisra = Stator windingresistance, rm = Iron lossresistance, la = Leakageinductance, Lmd = d axismagnetizing inductance,Lmq = q axis magnetizinginductance, Ud = d axis fluxlinkage, Uq = q axis fluxlinkage, xm = Mechanicalangular speed
36 J. Tamura
expressed as Eq. 2.24, where KB is a parameter concerning the rotor weight, thediameter of the axis, and the rotational speed of the axis. Windage loss is a frictionloss that occurs between the rotor and the air. Since it is difficult to calculatewindage loss correctly, it is approximately expressed as Eq. 2.25 in this section,where Kw is a parameter determined by the rotor shape, its length, and the rota-tional speed. In general, bearing loss and windage loss in the case of PMSG WGare very small because its rotational speed is very low.
Wb ¼ KBxmðWÞ ð2:24Þ
Ww ¼ Kwx2mðWÞ ð2:25Þ
Stray load loss is the electric machine loss produced under loading condition,and it is difficult to calculate accurately. The main factors for the stray load loss arethe eddy current losses in conductors, iron core, and adjoining metallic partsproduced by leakage flux. Stray load loss can be expressed approximately asEq. 2.26 due to IEEE standard expression.
Ws ¼ 0:005� P2
Pn
ðWÞ ð2:26Þ
where, P: generated power (W); Pn: rated output (W).Power electronic converter/inverter devices are necessary to connect PMSG
WG with the power grid. Since the converter/inverter circuits include switchingoperations of IGBT devices, in general, it is difficult to calculate the losses in thedevices accurately. In this section, power electronics device (PED) loss Eqs. 2.27and 2.28 are used which is obtained from the semiconductor device catalogs [5].PED loss is calculated by the combination of Eqs. 2.27 and 2.28.
PIGBT ¼ffiffiffi2p� I0
p� kton þ ktoffð Þ � fc þ D � b � I
20
2þ
ffiffiffi2p
p� a � I0
� �ð2:27Þ
PFWD ¼ffiffiffiffi2�p I0
p� krr � fc þ ð1� DÞ � d � I
20
2þ
ffiffiffi2p
p� c � I0
� �ð2:28Þ
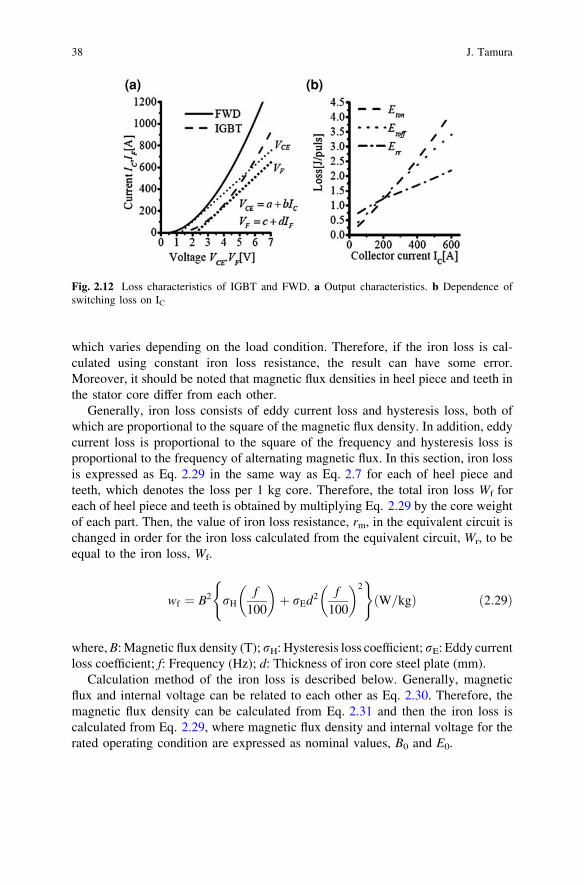
where, I0: Phase current (A); fc: Carrier frequency; D: IGBT duty ratio; kton: IGBTturn on switching energy (mJ/A); ktoff: IGBT turn off switching energy (mJ/A); krr:FWD recovery switching energy (mJ/A); a,b: IGBT on voltage approximationcoefficient; VCE = a + b*I; c,d: FWD forward voltage approximation coefficient;VF = c + d*I. Figure 2.12 shows an example of loss characteristics of IGBT andFWD [7].
Filter is, in general, used to reduce the high harmonic components resulted fromthe inverter. Filter efficiency is assumed to be 98% here.
Iron loss mainly occurs in the stator iron core. Iron loss is expressed by usingthe varying iron loss resistance, rm, in the equivalent circuit as shown in Fig. 2.11.However, real iron loss varies depending on the magnetic flux density in the core
2 Calculation Method of Losses and Efficiency of Wind Generators 37
which varies depending on the load condition. Therefore, if the iron loss is cal-culated using constant iron loss resistance, the result can have some error.Moreover, it should be noted that magnetic flux densities in heel piece and teeth inthe stator core differ from each other.
Generally, iron loss consists of eddy current loss and hysteresis loss, both ofwhich are proportional to the square of the magnetic flux density. In addition, eddycurrent loss is proportional to the square of the frequency and hysteresis loss isproportional to the frequency of alternating magnetic flux. In this section, iron lossis expressed as Eq. 2.29 in the same way as Eq. 2.7 for each of heel piece andteeth, which denotes the loss per 1 kg core. Therefore, the total iron loss Wf foreach of heel piece and teeth is obtained by multiplying Eq. 2.29 by the core weightof each part. Then, the value of iron loss resistance, rm, in the equivalent circuit ischanged in order for the iron loss calculated from the equivalent circuit, Wr, to beequal to the iron loss, Wf.
wf ¼ B2 rH
f
100
� �þ rEd2 f
100
� �2( )
ðW=kgÞ ð2:29Þ
where, B: Magnetic flux density (T); rH: Hysteresis loss coefficient; rE: Eddy currentloss coefficient; f: Frequency (Hz); d: Thickness of iron core steel plate (mm).
Calculation method of the iron loss is described below. Generally, magneticflux and internal voltage can be related to each other as Eq. 2.30. Therefore, themagnetic flux density can be calculated from Eq. 2.31 and then the iron loss iscalculated from Eq. 2.29, where magnetic flux density and internal voltage for therated operating condition are expressed as nominal values, B0 and E0.
Fig. 2.12 Loss characteristics of IGBT and FWD. a Output characteristics. b Dependence ofswitching loss on IC
38 J. Tamura
E ¼ 4:44fkww/ðWÞ ð2:30Þ
where, kw: Winding coefficient; w: Number of turns; f: frequency.
B ¼ B0E
E0ðTÞ ð2:31Þ
where, E0: Nominal internal voltage. Magnetic flux density is determined using theabove equation, and then the total iron loss Wf is calculated. The iron loss resis-tance rm can be obtained with respect to the internal voltage E and the total ironloss Wf as follows.
rm ¼E2
Wf=3ð2:32Þ
By continuing the above calculations until Wf to be equal to Wr, convergedresults can be obtained for the iron loss and iron loss resistance in the equivalentcircuit. For the calculation of iron loss, initial value of iron loss is assumed to be2.5% of the rated power.
2.3.2.2 Calculation Method
Figure 2.13 shows the flowchart of the calculation method, which is describedbelow.
1. Wind speed Vw m/s is taken as the input value, and then all state variables ofWG will be calculated.
2. Wind turbine output power is calculated from Eq. 2.2. Then, MPP(Max-imum Power Point) produced by wind turbine is searched, resulting in themaximum wind turbine output power and the corresponding rotor speed.However, if the obtained power is greater than the rated power, the power ischanged to 1 pu.
3. Bearing loss, windage loss, and also stray load loss are deducted from the windturbine power calculated in step 2, yielding the input power to the generator.However, generator rotor speed is the value calculated in step 2.
4. Assuming generator reactive power to be 0, d and q axis currents are calculatedfrom the d-q axis equivalent circuits, and then internal active power is calcu-lated from Eq. 2.22.
5. Comparing the generator input power with the internal active power, if they arenot equal to each other, calculation returns to step 4 with changing d-q axiscurrents, which will be continued until the generator input power is equal to theinternal active power.
6. Using generator frequency and d-q axis currents calculated in step 5, internalvoltage E, and then, Wf, Wr, and rm, are calculated.
2 Calculation Method of Losses and Efficiency of Wind Generators 39
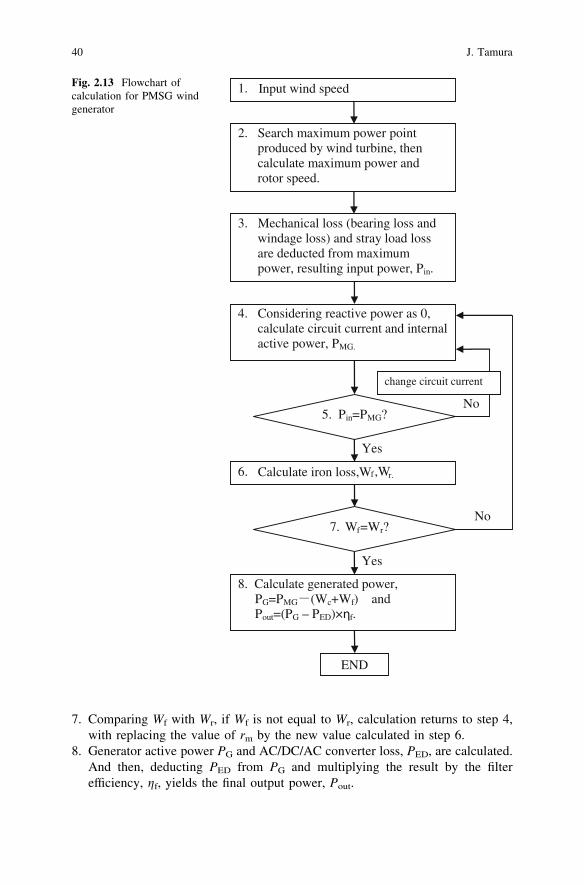
7. Comparing Wf with Wr, if Wf is not equal to Wr, calculation returns to step 4,with replacing the value of rm by the new value calculated in step 6.
8. Generator active power PG and AC/DC/AC converter loss, PED, are calculated.And then, deducting PED from PG and multiplying the result by the filterefficiency, gf, yields the final output power, Pout.
1. Input wind speed
2. Search maximum power point produced by wind turbine, then calculate maximum power and rotor speed.
3. Mechanical loss (bearing loss and windage loss) and stray load loss are deducted from maximum power, resulting input power, Pin.
END
4. Considering reactive power as 0, calculate circuit current and internal active power, PMG.
5. Pin=PMG?
change circuit current
6. Calculate iron loss,Wf,Wr.
7. Wf=Wr?
8. Calculate generated power, PG=PMG (Wc+Wf) andPout=(PG – PED f.
Yes
Yes
No
No
Fig. 2.13 Flowchart ofcalculation for PMSG windgenerator
40 J. Tamura
2.3.3 Calculated Results
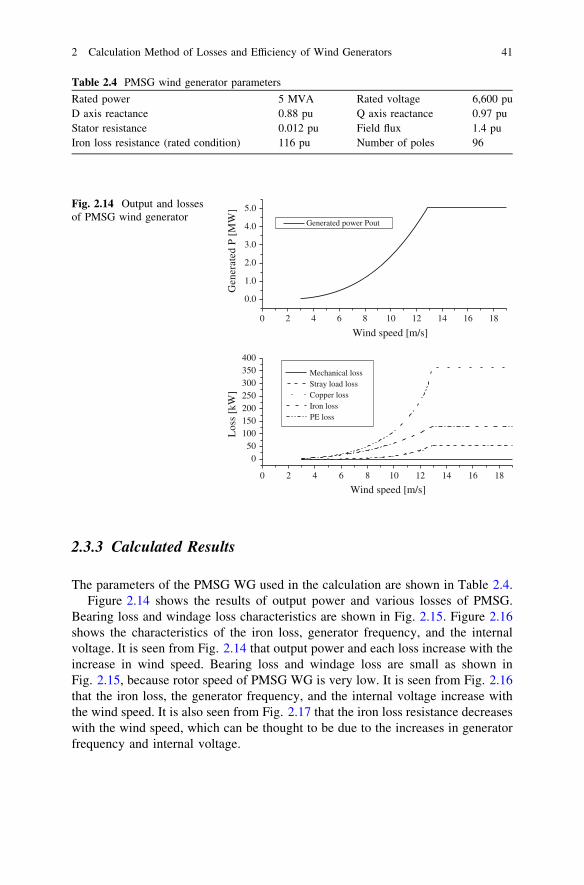
The parameters of the PMSG WG used in the calculation are shown in Table 2.4.Figure 2.14 shows the results of output power and various losses of PMSG.
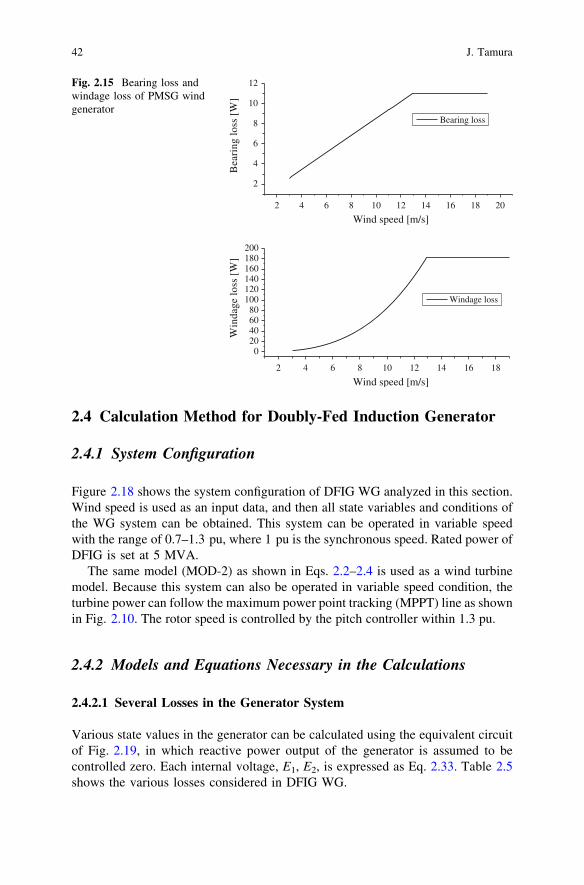
Bearing loss and windage loss characteristics are shown in Fig. 2.15. Figure 2.16shows the characteristics of the iron loss, generator frequency, and the internalvoltage. It is seen from Fig. 2.14 that output power and each loss increase with theincrease in wind speed. Bearing loss and windage loss are small as shown inFig. 2.15, because rotor speed of PMSG WG is very low. It is seen from Fig. 2.16that the iron loss, the generator frequency, and the internal voltage increase withthe wind speed. It is also seen from Fig. 2.17 that the iron loss resistance decreaseswith the wind speed, which can be thought to be due to the increases in generatorfrequency and internal voltage.
Table 2.4 PMSG wind generator parameters
Rated power 5 MVA Rated voltage 6,600 puD axis reactance 0.88 pu Q axis reactance 0.97 puStator resistance 0.012 pu Field flux 1.4 puIron loss resistance (rated condition) 116 pu Number of poles 96
0 2 4 6 8 10 12 14 16 18
0.0
1.0
2.0
3.0
4.0
5.0
Gen
erat
ed P
[M
W]
Generated power Pout
0 2 4 6 8 10 12 14 16 18
050
100150200250300350400
Los
s [k
W]
Wind speed [m/s]
Wind speed [m/s]
Mechanical loss Stray load loss Copper loss Iron lossPE loss
Fig. 2.14 Output and lossesof PMSG wind generator
2 Calculation Method of Losses and Efficiency of Wind Generators 41
2.4 Calculation Method for Doubly-Fed Induction Generator
2.4.1 System Configuration
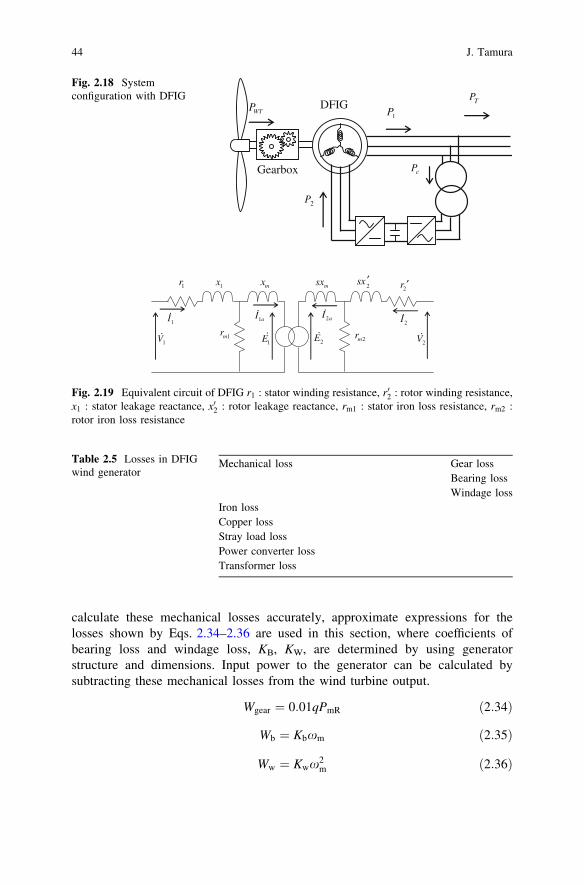
Figure 2.18 shows the system configuration of DFIG WG analyzed in this section.Wind speed is used as an input data, and then all state variables and conditions ofthe WG system can be obtained. This system can be operated in variable speedwith the range of 0.7–1.3 pu, where 1 pu is the synchronous speed. Rated power ofDFIG is set at 5 MVA.
The same model (MOD-2) as shown in Eqs. 2.2–2.4 is used as a wind turbinemodel. Because this system can also be operated in variable speed condition, theturbine power can follow the maximum power point tracking (MPPT) line as shownin Fig. 2.10. The rotor speed is controlled by the pitch controller within 1.3 pu.
2.4.2 Models and Equations Necessary in the Calculations
2.4.2.1 Several Losses in the Generator System
Various state values in the generator can be calculated using the equivalent circuitof Fig. 2.19, in which reactive power output of the generator is assumed to becontrolled zero. Each internal voltage, E1, E2, is expressed as Eq. 2.33. Table 2.5shows the various losses considered in DFIG WG.
2 4 6 8 10 12 14 16 18 20
2
4
6
8
10
12
Bea
ring
loss
[W
]Wind speed [m/s]
Bearing loss
2 4 6 8 10 12 14 16 18
020406080
100120140160180200
Win
dage
loss
[W
]
Wind speed [m/s]
Windage loss
Fig. 2.15 Bearing loss andwindage loss of PMSG windgenerator
42 J. Tamura
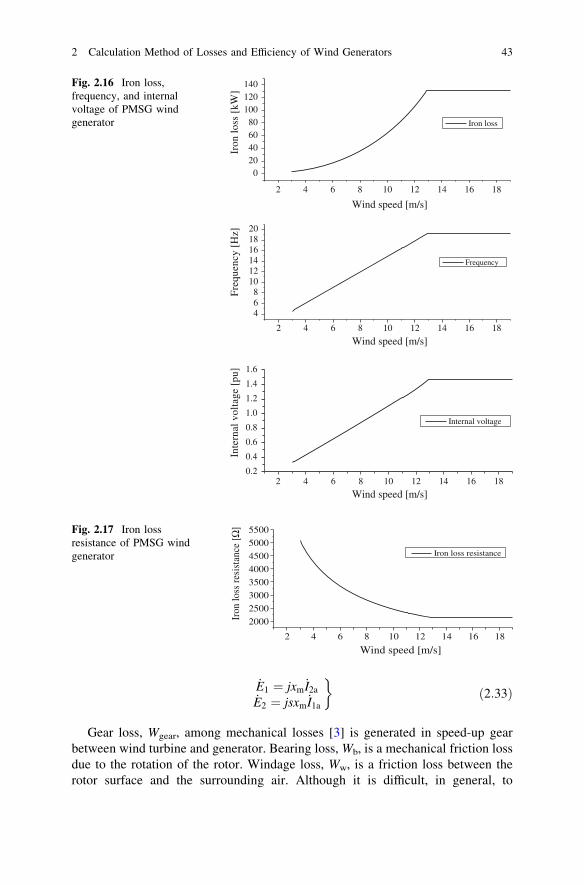
_E1 ¼ jxm_I2a
_E2 ¼ jsxm_I1a
�ð2:33Þ
Gear loss, Wgear, among mechanical losses [3] is generated in speed-up gearbetween wind turbine and generator. Bearing loss, Wb, is a mechanical friction lossdue to the rotation of the rotor. Windage loss, Ww, is a friction loss between therotor surface and the surrounding air. Although it is difficult, in general, to
2 4 6 8 10 12 14 16 18
020406080
100120140
Iron
loss
[kW
]
Wind speed [m/s]
Iron loss
2 4 6 8 10 12 14 16 18
468
101214161820
Fre
quen
cy [
Hz]
Wind speed [m/s]
Frequency
2 4 6 8 10 12 14 16 180.2
0.4
0.6
0.8
1.0
1.2
1.4
1.6
Inte
rnal
vol
tage
[pu
]
Wind speed [m/s]
Internal voltage
Fig. 2.16 Iron loss,frequency, and internalvoltage of PMSG windgenerator
2 4 6 8 10 12 14 16 18
2000
2500
3000
3500
4000
4500
5000
5500
Iron
loss
resi
stan
ce [Ω
]
Wind speed [m/s]
Iron loss resistance
Fig. 2.17 Iron lossresistance of PMSG windgenerator
2 Calculation Method of Losses and Efficiency of Wind Generators 43
calculate these mechanical losses accurately, approximate expressions for thelosses shown by Eqs. 2.34–2.36 are used in this section, where coefficients ofbearing loss and windage loss, KB, KW, are determined by using generatorstructure and dimensions. Input power to the generator can be calculated bysubtracting these mechanical losses from the wind turbine output.
Wgear ¼ 0:01qPmR ð2:34Þ
Wb ¼ Kbxm ð2:35Þ
Ww ¼ Kwx2m ð2:36Þ
TP
1PWTP
cP
2P
Gearbox
DFIG
Fig. 2.18 Systemconfiguration with DFIG
1r 1x mx msx 2sx
2r ′′
1mr 2mr1V 2V
1I2I
2E1E
1aI 2aI
.
. .
..
. .
.
Fig. 2.19 Equivalent circuit of DFIG r1 : stator winding resistance, r02 : rotor winding resistance,x1 : stator leakage reactance, x02 : rotor leakage reactance, rm1 : stator iron loss resistance, rm2 :rotor iron loss resistance
Table 2.5 Losses in DFIGwind generator
Mechanical loss Gear lossBearing lossWindage loss
Iron lossCopper lossStray load lossPower converter lossTransformer loss
44 J. Tamura
In the equations above, PmR is the rated turbine power and xm is angular speed.Iron loss varies dependent on the flux density and frequency. In this section,
iron loss is expressed by using variable iron loss resistances, rm1, rm2, as shown inFig. 2.19. On the other hand, since the iron loss consists of hysteresis loss andeddy-current loss, it can be expressed as Eq. 2.37. Moreover, it should be notedthat magnetic flux densities in yoke core and teeth core differ from each other.Therefore, iron loss of each core is calculated separately using Eq. 2.37 for eachpart of the stator and rotor, and then the total iron loss is obtained by summingthem. Flux density can be expressed to vary in proportion to the internal voltage asshown in Eq. 2.38. Iron loss resistance in the equivalent circuit can be determinedby Eq. 2.39. In these equations, K1 and K2 are coefficients of hysteresis and eddy-current losses, E0 is the reference internal voltage, E0 is the internal voltage, B0 isthe reference flux density, and W is iron core weight.
Wi ¼ Wh þWe ¼ K1fB1:6 þ K2f 2B2ðW=kgÞ ð2:37Þ
B ¼ B0E0
E0ð2:38Þ
rm ¼E02
Wi �W=3ð2:39Þ
Copper losses in the stator coil Pco1 and the rotor coil Pco2 can be calculatedusing winding resistances, r1 and r2
0, in the equivalent circuit as follows.
Pco1 ¼ r1I21 ð2:40Þ
Pco2 ¼ r02I22 ð2:41Þ
Stray load loss can be expressed approximately as Eq. 2.42.
WS ¼ 0:005� P2
PR
ð2:42Þ
where PR is the rated power of the generator and P is generator output.The Power converter is composed of IGBT and FWD. Therefore, power con-
verter loss is calculated as a summation of IGBT switching loss, reverse recoveryloss of FWD, and steady-state losses of IGBT and FWD [5]. It is expressed asEq. 2.43.
PPC ¼12
DT2ffiffiffi2p
pI0aþ I2
0b
� �þ 1
2ð1� DTÞ 2
ffiffiffi2p
pI0cþ I2
0d
� �
þ 12
fCðEon þ EoffÞ þ12
fCEr ð2:43Þ
where, I0: Phase current (A); fc: Carrier frequency (Hz); DT: IGBT duty ratio; kton:IGBT turn on switching energy (mJ/A); ktoff: IGBT turn off switching energy
2 Calculation Method of Losses and Efficiency of Wind Generators 45
(mJ/A); krr: FWD recovery switching energy (mJ/A); a,b: IGBT on-voltageapproximation coefficient, VCE = a + b*I; c,d: FWD forward voltage approxima-tion coefficient, VF = c + d*I.
For simplicity, transformer is expressed by leakage impedance, and its loss iscalculated as a resistance loss. The iron loss of the transformer is not considered.
2.4.2.2 Calculation Method and Results
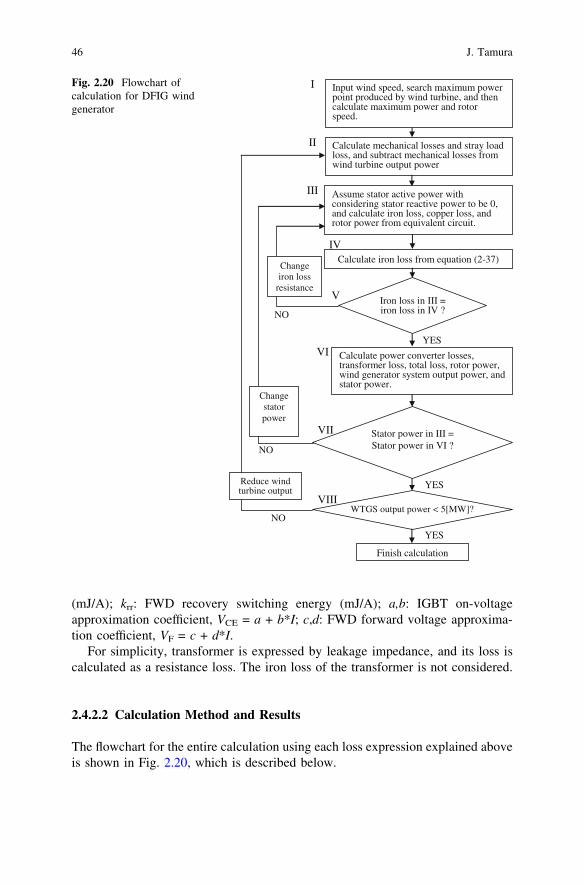
The flowchart for the entire calculation using each loss expression explained aboveis shown in Fig. 2.20, which is described below.
Assume stator active power with considering stator reactive power to be 0, and calculate iron loss, copper loss, and rotor power from equivalent circuit.
Input wind speed, search maximum power point produced by wind turbine, and then calculate maximum power and rotor speed.
Calculate mechanical losses and stray load loss, and subtract mechanical losses from wind turbine output power
Calculate iron loss from equation (2-37)
Calculate power converter losses, transformer loss, total loss, rotor power, wind generator system output power, and stator power.
Stator power in III =Stator power in VI ?
Finish calculation
Change iron loss
resistance
Change stator power
Reduce wind turbine output
I
II
III
IV
V
VI
VII
VIII
NO
YES
YES
NO
NO
YES
WTGS output power < 5[MW]?
Iron loss in III = iron loss in IV ?
Fig. 2.20 Flowchart ofcalculation for DFIG windgenerator
46 J. Tamura
1. Wind speed Vw m/s is taken as the input value, and then all state variables ofWG will be calculated. Wind turbine output power is calculated from Eq. 2.2.Then, MPPT(Maximum Power Point) power produced by wind turbine issearched, resulting the maximum wind turbine output power and the corre-sponding rotor speed.
2. Gear loss, bearing loss, windage loss, and also stray load loss are calculated anddeducted from the wind turbine power calculated in step 1, yielding the inputpower to the generator. Generator rotor speed is the value calculated in step 1.
3. Assuming generator reactive power to be 0 and stator active power to be anappropriate value, iron loss, copper loss, and rotor power are calculated fromthe equivalent circuit, in which the stator voltage is set to be 1 pu.
4. Iron loss is calculated using Eq. 2.37 and iron core weight.5. The above calculation is repeated until the iron loss in step 3 is equal to that in
step 4 with changing the iron loss resistance.6. Power converter losses, transformer loss, total loss, rotor power, WG system
output power, and stator power are calculated.7. Above calculation is repeated until the stator power in step 3 is equal to that in
step 6 with changing the assumed stator power.8. If the WG system output is greater than 1 pu, wind turbine output is reduced by
the pitch controller and go to step 2.
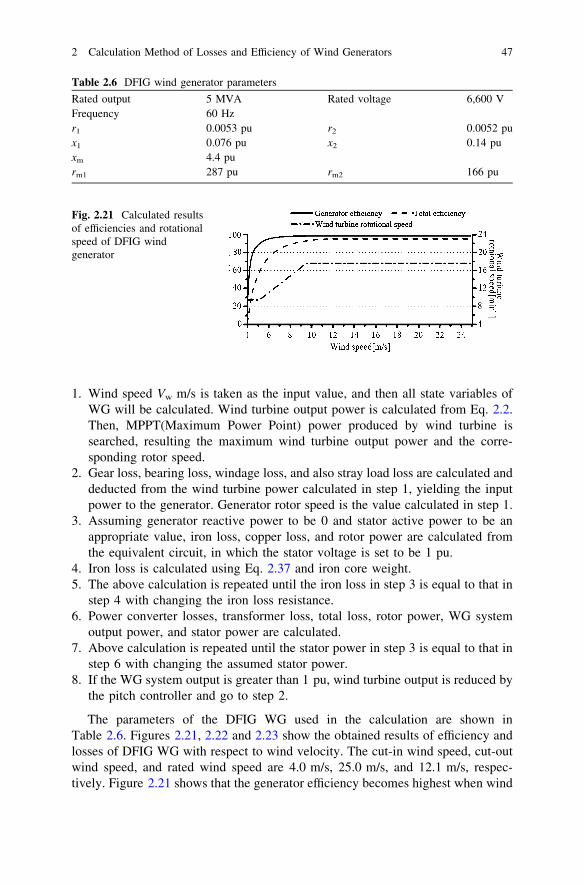
The parameters of the DFIG WG used in the calculation are shown inTable 2.6. Figures 2.21, 2.22 and 2.23 show the obtained results of efficiency andlosses of DFIG WG with respect to wind velocity. The cut-in wind speed, cut-outwind speed, and rated wind speed are 4.0 m/s, 25.0 m/s, and 12.1 m/s, respec-tively. Figure 2.21 shows that the generator efficiency becomes highest when wind
Table 2.6 DFIG wind generator parameters
Rated output 5 MVA Rated voltage 6,600 VFrequency 60 Hzr1 0.0053 pu r2 0.0052 pux1 0.076 pu x2 0.14 puxm 4.4 purm1 287 pu rm2 166 pu
Fig. 2.21 Calculated resultsof efficiencies and rotationalspeed of DFIG windgenerator
2 Calculation Method of Losses and Efficiency of Wind Generators 47
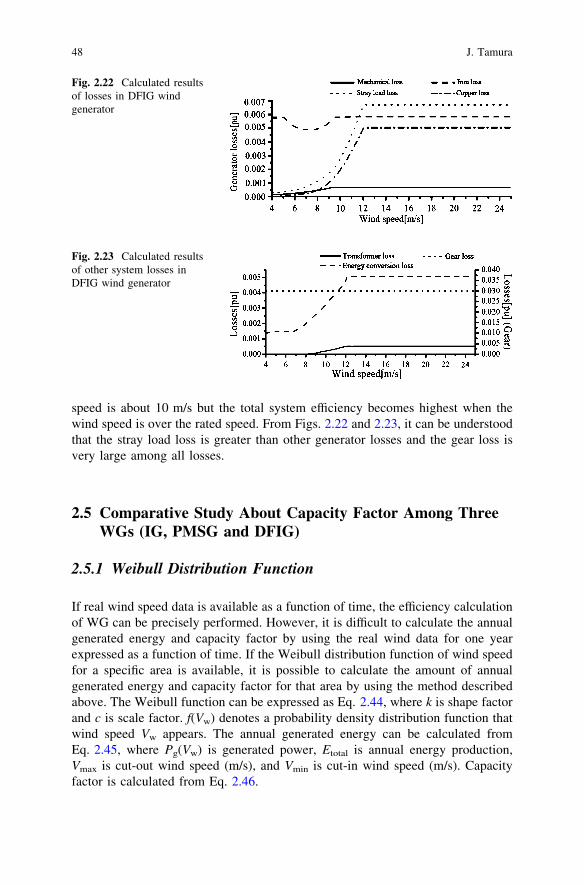
speed is about 10 m/s but the total system efficiency becomes highest when thewind speed is over the rated speed. From Figs. 2.22 and 2.23, it can be understoodthat the stray load loss is greater than other generator losses and the gear loss isvery large among all losses.
2.5 Comparative Study About Capacity Factor Among ThreeWGs (IG, PMSG and DFIG)
2.5.1 Weibull Distribution Function
If real wind speed data is available as a function of time, the efficiency calculationof WG can be precisely performed. However, it is difficult to calculate the annualgenerated energy and capacity factor by using the real wind data for one yearexpressed as a function of time. If the Weibull distribution function of wind speedfor a specific area is available, it is possible to calculate the amount of annualgenerated energy and capacity factor for that area by using the method describedabove. The Weibull function can be expressed as Eq. 2.44, where k is shape factorand c is scale factor. f(Vw) denotes a probability density distribution function thatwind speed Vw appears. The annual generated energy can be calculated fromEq. 2.45, where Pg(Vw) is generated power, Etotal is annual energy production,Vmax is cut-out wind speed (m/s), and Vmin is cut-in wind speed (m/s). Capacityfactor is calculated from Eq. 2.46.
Fig. 2.22 Calculated resultsof losses in DFIG windgenerator
Fig. 2.23 Calculated resultsof other system losses inDFIG wind generator
48 J. Tamura
f Vwð Þ ¼ k
c
Vw
c
� �k�1
exp � Vw
c
� �k" #
ð2:44Þ
Etotal ¼Z V max
V min
Pg Vwð Þ � f Vwð Þ � 8760dv ð2:45Þ
Capacity Factor =Etotal
PR � 365� 24ðh)ð2:46Þ
2.5.2 Calculated Results of Capacity Factor
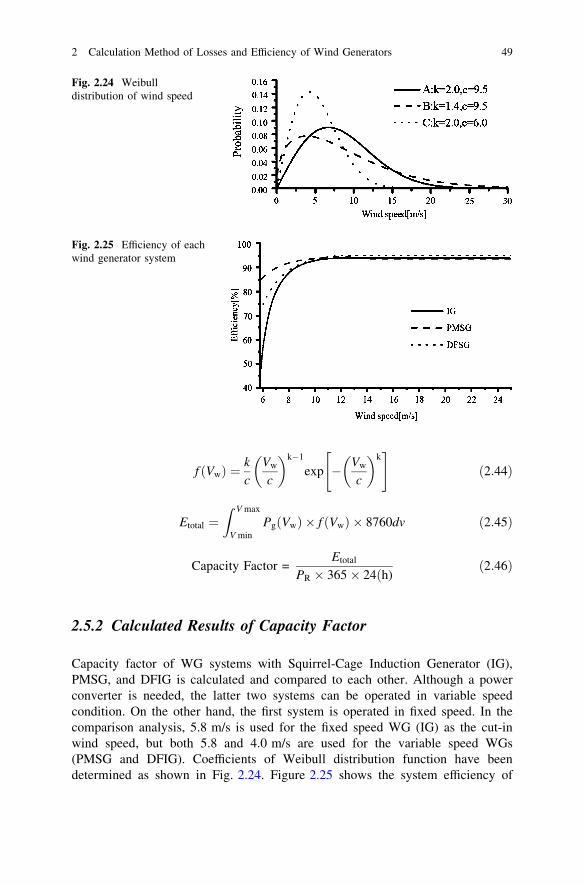
Capacity factor of WG systems with Squirrel-Cage Induction Generator (IG),PMSG, and DFIG is calculated and compared to each other. Although a powerconverter is needed, the latter two systems can be operated in variable speedcondition. On the other hand, the first system is operated in fixed speed. In thecomparison analysis, 5.8 m/s is used for the fixed speed WG (IG) as the cut-inwind speed, but both 5.8 and 4.0 m/s are used for the variable speed WGs(PMSG and DFIG). Coefficients of Weibull distribution function have beendetermined as shown in Fig. 2.24. Figure 2.25 shows the system efficiency of
Fig. 2.24 Weibulldistribution of wind speed
Fig. 2.25 Efficiency of eachwind generator system
2 Calculation Method of Losses and Efficiency of Wind Generators 49
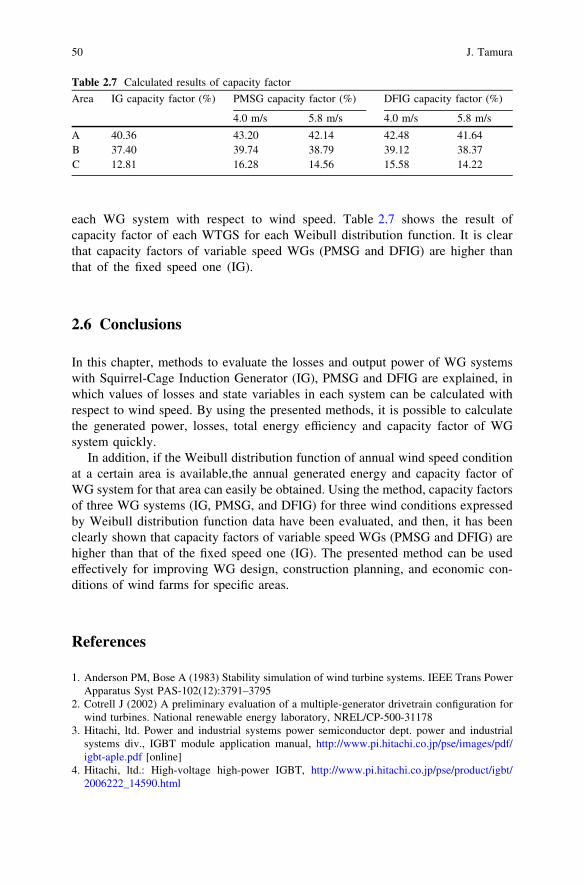
each WG system with respect to wind speed. Table 2.7 shows the result ofcapacity factor of each WTGS for each Weibull distribution function. It is clearthat capacity factors of variable speed WGs (PMSG and DFIG) are higher thanthat of the fixed speed one (IG).
2.6 Conclusions
In this chapter, methods to evaluate the losses and output power of WG systemswith Squirrel-Cage Induction Generator (IG), PMSG and DFIG are explained, inwhich values of losses and state variables in each system can be calculated withrespect to wind speed. By using the presented methods, it is possible to calculatethe generated power, losses, total energy efficiency and capacity factor of WGsystem quickly.
In addition, if the Weibull distribution function of annual wind speed conditionat a certain area is available,the annual generated energy and capacity factor ofWG system for that area can easily be obtained. Using the method, capacity factorsof three WG systems (IG, PMSG, and DFIG) for three wind conditions expressedby Weibull distribution function data have been evaluated, and then, it has beenclearly shown that capacity factors of variable speed WGs (PMSG and DFIG) arehigher than that of the fixed speed one (IG). The presented method can be usedeffectively for improving WG design, construction planning, and economic con-ditions of wind farms for specific areas.
References
1. Anderson PM, Bose A (1983) Stability simulation of wind turbine systems. IEEE Trans PowerApparatus Syst PAS-102(12):3791–3795
2. Cotrell J (2002) A preliminary evaluation of a multiple-generator drivetrain configuration forwind turbines. National renewable energy laboratory, NREL/CP-500-31178
3. Hitachi, ltd. Power and industrial systems power semiconductor dept. power and industrialsystems div., IGBT module application manual, http://www.pi.hitachi.co.jp/pse/images/pdf/igbt-aple.pdf [online]
4. Hitachi, ltd.: High-voltage high-power IGBT, http://www.pi.hitachi.co.jp/pse/product/igbt/2006222_14590.html
Table 2.7 Calculated results of capacity factor
Area IG capacity factor (%) PMSG capacity factor (%) DFIG capacity factor (%)
4.0 m/s 5.8 m/s 4.0 m/s 5.8 m/s
A 40.36 43.20 42.14 42.48 41.64B 37.40 39.74 38.79 39.12 38.37C 12.81 16.28 14.56 15.58 14.22
50 J. Tamura

5. I.E.E. Japan (1988) Electric machinery design. Ohm Publisher, Scottsdale6. Johnson GL Wind energy systems. Electronic edition, http://www.rpc.com.au/products/
windturbines/wind-book/WindTOC.html [online]7. Polinder H, Van der Pijl FFA, De Vilder GJ, Tavner PJ (2006) Comparison of direct-drive and
geared generator concepts for wind turbines. IEEE Trans Energy Convers 21(3):725–733
2 Calculation Method of Losses and Efficiency of Wind Generators 51

http://www.springer.com/978-1-4471-2200-5