calcium deoxidation equilibrium in liquid iron
TRANSCRIPT
Calcium Deoxidation Equilibrium in Liquid Iron
TAKASHI KIMURA and HIDEAKI SUITO
Calcium-oxygen equilibrium was studied at 1873 K under normal pressure by the method of immersing a pure iron capsule containing calcium metal into liquid iron, which was equilibrated with CaO-A1203 slags in Al203 and CaO crucibles. On the basis of these and previous results obtained in the equilibrium experiments between liquid iron and CaO-containing slags, the equi- librium constant, Kca, for the reaction, CaO (s) = Ca + O, and the first-order interaction pa-
Ca rameter, e0 , were estimated. The measured value for Kca reported in previous experiments, which was found to be significantly different from that calculated from the reliable thermo- dynamic data, was discussed. Nitrogen distribution ratios between CaO-A1203 slags and liquid iron were also measured.
I. INTRODUCTION
C A L C I U M alloys are used to control the composition of the remaining oxide and sulfide inclusions, for ex- ample, to ensure a good flowability of aluminum-killed steel and to improve deformability. Although experi- mental studies on calcium deoxidation equilibrium have been made by several investigators, the solubility product of calcium oxide, [mass pct Ca] �9 [mass pct O] (-- 2 x 10 sin), and the equilibrium constant, Kca, for the reaction CaO (s) = C_aa + O_ ( - 10 -6 to 10 -m[2-6]) are observed to be several orders of magnitude greater than those calculated from the reliable thermodynamic data (9.3 x 10⁻¹~, tTl 4.6 x 10-~1, tSl and 1.45 x 10⁻¹ttsJ). This discrepancy was discussed based on the experi- mental errors involved in (1) oxygen and calcium anal- ysis, (2) emf measurement by an oxygen sensor, and (3) thermodynamic values for the Gibbs free energy of formation of CaO. However, recently Turkdogan t81 pointed out, based on the independent check on the free- energy data, that the standard free energy of CaO given in the compiled thermodynamic tables is correct within perhaps 10 to 30 kJ/g-mol.
Gustafsson and Mellberg 141 emphasize the importance of the relationship between the interaction parameter and the equilibrium constant in the case of high-mutual af- finity of solutes with oxygen. This implies that a partic- ular value of an interaction coefficient is based on the specific value of the equilibrium constant. Furthermore, the applicability of only the first-order interaction pa- rameter is limited to a certain range of composition.
The purpose of this study is to obtain the equilibrium constant, Kca, and the first-order interaction parameter,
Ca (eOa) in the equilibrium experiments between CaO- e0 A1203 slags and liquid iron, using lime and alumina cru- cibles at 1873 K. The previous results obtained in the equilibrium experiments using CaO-SiO2, I91 CaO- A1203, [t~ CaO-SiO2-Al203, [1H and CaO-A1203-Mgu" ,--1~21 slags are also used for the estimation of the values for Kca and e ca (ec~
TAKASHI KIMURA, formerly Graduate Student, Department of Metallurgical Engineering, Tohoku University, is with Kashima Steel Works, Sumitomo Metal Industries Ltd., Kashima, Japan. HIDEAKI SUITO, Professor, is with the Institute for Advanced Materials Processing, Tohoku University, Sendai, Japan.
Manuscript submitted November 19, 1992.
II. E X P E R I M E N T A L
A. Apparatus and Procedure
A vertical resistance furnace with heating bars of LaCrO3 was used. Triple reaction tubes (outer A1203 tube: ~b60 x ~b50 x 850 mm; middle graphite tube: 4~48 x qb44 x 700 mm; inner AlzO3 tube: ~b42 x ~b35 x 800 ram) were used in order to prevent the re- action of the outer reaction tube with calcium vapor, re- sulting in a hole by the formation of liquid calcium aluminate. The flow rate of argon gas, which was de- hydrated through magnesium perchlorate as well as phosphorous pentoxide and deoxidized by Ti (973 K) and Mg (723 K), was chosen as 0.2 to 1.0 1/min.
Twenty-five grams of high-purity electrolytic iron starting with 500 to 1000 mass ppm oxygen (C = 10 ppm, Si < l0 ppm, A1 = 3 ppm, S = 5 ppm, and Ca < 1 ppm) contained in a CaO crucible (~b25 x thl9 x 50 mm, Yoshizawa Lime Ind., Tokyo) was melted at 1873 K, and after that, 1 g of calcium, en- closed in a pure iron capsule (~b12 x &10 • 10 mm), was added by dropping. The melt was kept for 4 to 120 minutes, and then the crucible containing a sample was quenched rapidly by helium gas blowing, followed by a water quenching. This experiment is designated as the experiment without slags, hereafter.
However, in most of the present work, the following equilibrium and supersaturation experiments, using CaO-AlzO3 slags saturated with CaO (CA) and A1203 (AC) crucibles, were carried out at 1873 K. The equi- librium phases using CaO and A1203 crucibles are CaO and calcium aluminate, respectively. Reagent grade A1N (0.05 g) was added to the slags for nitrogen distribution experiments.
It should be noted that the experimental conditions such as initial solute contents are crucial to obtain the equilibrium value in deoxidation reaction accompanying a nucleation process of new oxide phase. Therefore, the following two different types of experiments were car- ried out by choosing high and low levels of oxygen at a given aluminum content.
Equilibrium experiment: high-purity electrolytic iron (O = 500 to 1000 mass ppm) and CaO-AI203 slags (7 g) were first melted in CaO and A1203 crucibles. An Fe-2 (10) mass pct aluminum alloy (0.7 to 1.4 g) was added by dropping, and immediately
METALLURGICAL AND MATERIALS TRANSACTIONS B VOLUME 25B, FEBRUARY 1994--33
after that, an appropriate amount of calcium (0.1 to 1 g) enclosed in a pure iron capsule was immersed. Then, the melts in CaO and A1203 crucibles were stirred by an A1203 rod for 30 seconds and 5 min- utes, respectively, at 30-minute intervals. The melts were kept for at least 1 hour without stirring to elim- inate oxide inclusions by flotation. Then, the sam- ple was quenched rapidly.
Supersaturation experiment: the slag and Fe-0.01 to 1.2 mass pct aluminum alloy starting with 30 to 60 mass ppm oxygen, which was premelted in deoxi- dized argon atmosphere using an arc furnace, were melted, and a pure iron capsule containing calcium (0.1 to 1 g) was added by dropping. The melts were kept for a desirable duration, and then the sample was quenched rapidly.
B. Analysis
The details of chemical analysis, except for the anal- ysis of calcium in metal, were previously de- scribed. I9'1~ The very low content of calcium in metal cannot be determined by the usual analytical method due to the fluctuation of the blank value. There- fore, the following method was used to lower the blank value.
A teflon test tube with a teflon lid was washed by boiling, using HCI(1 + 1) and ultra pure water in a block heater. A measuring flask was rinsed with HCI(1 + 1) and ultra pure water at room temperature. This proce- dure was repeated until the calcium content of the water in both analytical instruments, measured by induction coupled plasma (ICP) emission spectrometry, reached a constant low level. Then, a metal sample (0.5 g) was washed in the teflon test tube by ultra pure water three times, and dissolved by heating it to 352 K in 5 cm 3 of HCI(1 + 1) and 0.5 cm 3 of HNO3(1 + 1). After dis- solving, the sample solution was transferred to the washed measuring flask, using ultra pure water without filtration. The content of calcium was analyzed by ICP emission spectrometry. The accuracy of the analysis of calcium was 1 + 0.03 mass ppm.
The oxygen content was measured with an accuracy of 1 --- 0.7 mass ppm by inert gas fusion-infrared ab- sorptiometry, ll41 using the standard sample of steel con- taining 3.4 mass ppm oxygen, which was supplied by the Iron and Steel Institute of Japan, Tokyo.
III. RESULTS AND DISCUSSION
The chemical compositions of CaO-A1203 slag and metal phases obtained in the present experiments using lime (CA) and alumina (AC) crucibles are summarized in Table I, along with the results obtained in the exper- iments without slags. The acid-insoluble calcium was not detected. The chemical compositions of the fol- lowing slags and metal phases given in previous reports tg-teJ were also used in the present discussion: CaO-SiO2 slags (CS) saturated with a CaO crucible, t91 CaO-AI203 slags (AC, CA) saturated with AI203 and CaO crucibles, lwl CaO-SiOz-A1203 slags (CAS-5,8,9, ACS-2,4) whose compositions are plotted in Figure 1 of Reference 11, and CaO-AlzO3-MgO slags (CAM, CMA,
MAC, and ACM) whose compositions are plotted by different marks A, B, C, and D, respectively, in Figure 1 of Reference 12.
A. Experiments without Slags
Previous studies on the calcium-oxygen equilibrium in liquid iron were carried out in static experiments, in which the melts with liquid calcium were equilibrated under high argon pressures 13'41 or in a sealed containerJ 61 Studies were also made in dynamic experiments in which equilibrium was attained by adding calcium metal t~,51 or bubbling argon gas containing calcium vapor ~2~ at normal pressure.
In the preliminary experiments, the variation of the calcium and oxygen content in liquid iron, with time, was studied after immersing a pure iron capsule con- taining calcium metal into liquid iron at 1873 K under argon atmosphere (1 atm). As a result, the calcium (132 mass ppm) and oxygen (88 mass ppm) content obtained 4 minutes after addition, decreased to 22 and 13 mass ppm, respectively, at 120 minutes. The constant values for calcium and oxygen content were not attained in the present experiments without slags, as given in Table I.
B. Equilibrium Relation in Metal Phase
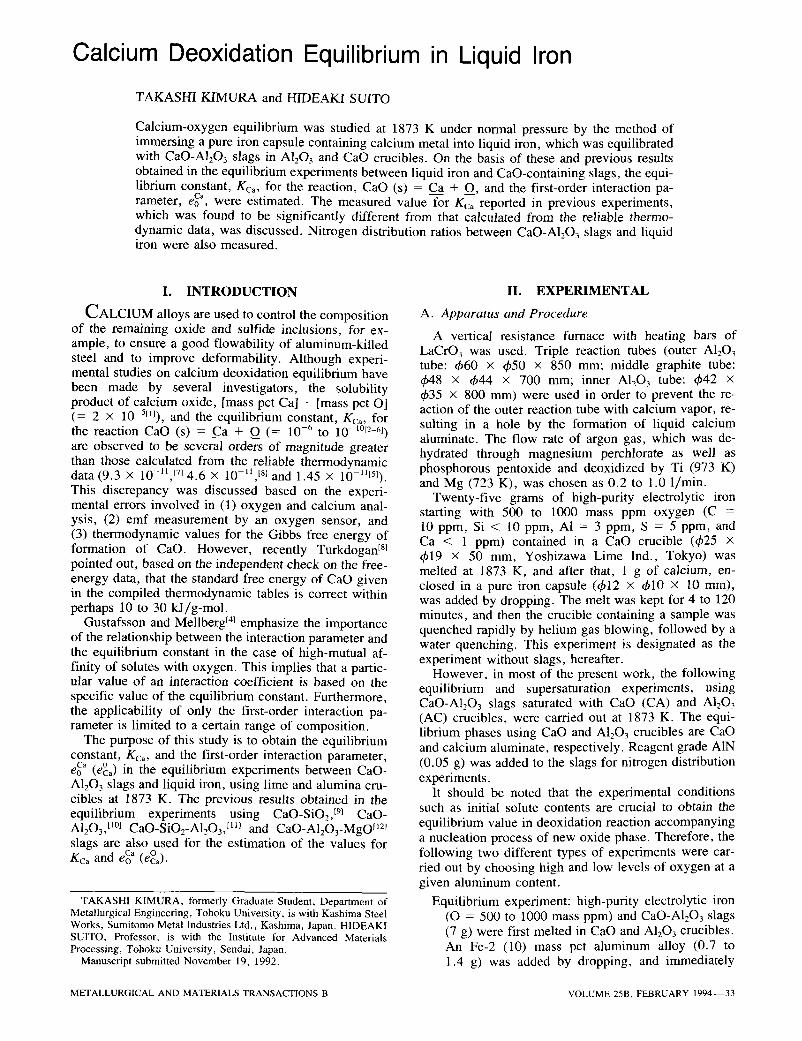
1. Time for attainment of equilibrium The contents of metal elements and nitrogen distri-
bution ratio, LN {= (mass pet N)/[mass pct N]}, obtained in the supersaturation experiments using a CaO crucible are plotted against time in Figure 1. These results for two different initial contents of aluminum indicate that time for attainment of equilibrium is sufficiently short, except for oxygen. It is not clear why oxygen does not reach equilibrium before 60 minutes. Experimental times for CaO and A1203 crucibles were chosen as 90 to 100 and 180 minutes, respectively.
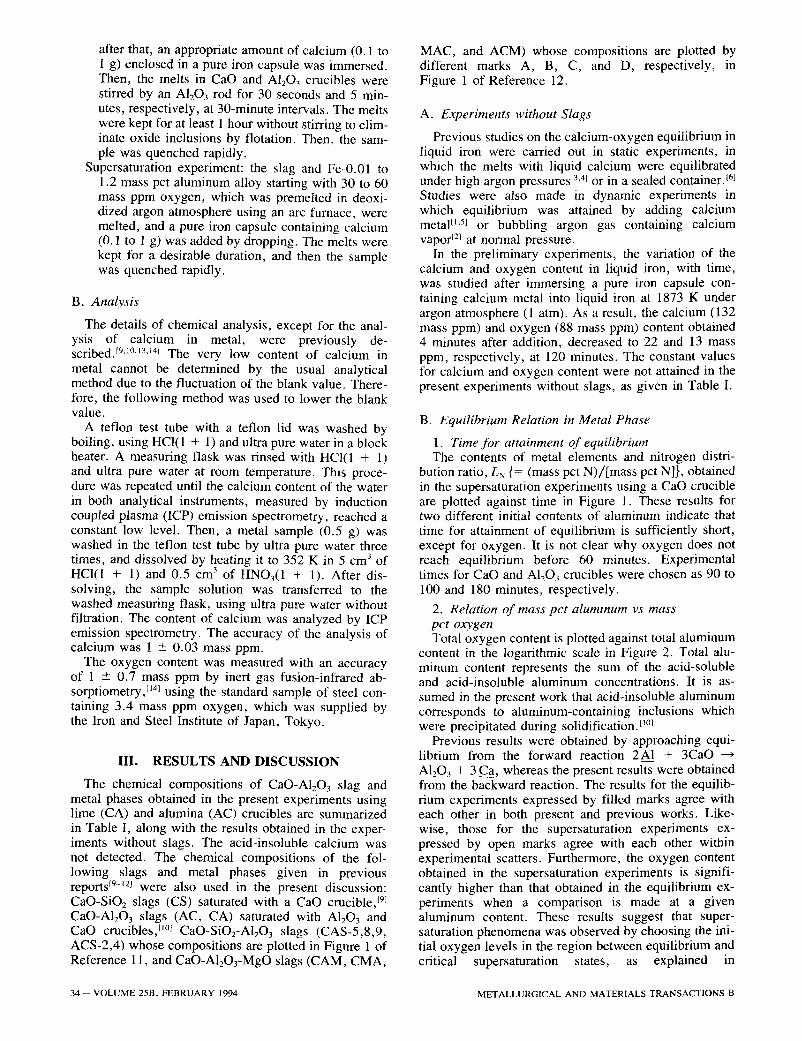
2. Relation of mass pct aluminum vs mass pct oxygen Total oxygen content is plotted against total aluminum
content in the logarithmic scale in Figure 2. Total alu- minum content represents the sum of the acid-soluble and acid-insoluble aluminum concentrations. It is as- sumed in the present work that acid-insoluble aluminum corresponds to aluminum-containing inclusions which were precipitated during solidificationJ 1~
Previous results were obtained by approaching equi- librium from the forward reaction 2A1 + 3CaO A1203 + 3 Ca, whereas the present results were obtained from the backward reaction. The results for the equilib- rium experiments expressed by filled marks agree with each other in both present and previous works. Like- wise, those for the supersaturation experiments ex- pressed by open marks agree with each other within experimental scatters. Furthermore, the oxygen content obtained in the supersaturation experiments is signifi- cantly higher than that obtained in the equilibrium ex- periments when a comparison is made at a given aluminum content. These results suggest that super- saturation phenomena was observed by choosing the ini- tial oxygen levels in the region between equilibrium and critical supersaturation states, as explained in
3 4 - - V O L U M E 25B, FEBRUARY 1994 METALLURGICAL AND MATERIALS TRANSACTIONS B
Table I. Chemica l Compos i t ions of Metal and Slag Phases at 1873 K
[A1] [Ca] Time Soluble Insoluble Total (Min) (Pct) (Ppm) (Ppm)
[O]
Average (Maximum/Minimum) [N] (Ca) (Ppm) (Ppm) (Pct)
(AI) (N) (Pct) (Ppm)
4 - - - - 132 6 - - - - 115
41 - - - - 75.0 120 - - - - 22.3
CA slag (CaO crucible)
44* 0.608 1.7 11.6 60* 0.617 3.3 10.6 92* 0.554 0.4 10.5 92* 0.605 0.3 10.0 21" 0.408 1.0 7.3 43* 0.477 0.3 7.1 65* 0.451 0.2 9.1 91 0.245 0.7 3.1 90 0.333 2.5 5.5
100 0.0717 3.0 2.1 100 0.0939 <0.1 2.1 100 0.135 0.8 3.1 100 0.0996 1.8 2.9 100 0.501 3.7 2.3 100 0.505 0.4 3.7 100 0.884 0.8 7.3
100 0.134 <0.1 2.5 100 0.116 <0.1 2.3 100 0.0508 0.1 1.2 100 0.0592 0.6 1.4 100 0.462 0.5 10.1 100 0.522 0.3 11.2 100 0.566 0.3 13.8 I00 0.933 1.0 14.4
AC slag (A1203 crucible)
180 0.119 2.5 1.1 180 0.153 2.9 1.5 180 0.162 1.8 0.9 180 0.174 2.3 1.2 180 0.345 4.3 1.6 180 0.476 3.0 1.1 180 1.07 1.7 1.5 180 1.07 1.2 1.9 180 0.713 0.9 1.9 180 1.19 1.7 2.3
180 0.146 0.3 1.0 180 0.176 0.8 1.0 180 0.169 <0.1 0.9 180 0.0159 2.2 0.3 180 0.331 <0.1 1.5 180 0.577 0,2 1.4 180 0.921 <0, I 1.8 180 1.17 0.7 2.3
Experiment without Slag (CaO Crucible)
87.8 (90.6/84.7) - - - - 67.2 (70.2/65.0) - - - - 47.0 (49.8/45.0) - - - - 12.7 (15.2/10.2) - - - -
Supersaturation
9.3 (13.7/ 6.7) 25.2 41.1 3.0 ( 3.5/ 2.8) 32.4 41.2 2.4 ( 2.5/ 2.3) 31.4 41.7 3.4 ( 4 .0 / 2.6) 32.6 40.5 7.2 ( 7.4/ 7.0) 34.6 40.7 3.2 ( 3.3/ 2.9) 26.6 40.7 3.0 ( 3 .4/ 2.3) - - 41.7 6.1 ( 6 .7/ 5.3) - - 40.8 5.8 ( 7.0/ 4.4) 37.9 41.4 7.2 ( 8.1/ 6.3) 19.1 40.8 4.4 ( 4 .8 / 4.1) 33.6 41.3 7.9 ( 9.0/ 6.4) - - 40.7 8.1 ( 9 .3/ 7.3) 28.0 40.8 8.1 (12.4/ 4.7) 8.4 41.4 2.8 ( 4 ,5 / 1.8) 14.3 40.6 3.4 ( 7.3/ 1.4) 3.9 40.3
Equilibrium
1.8 ( 2.3/ 1.2) 15.3 41.3 1.6 ( 2.0/ 1.11 22.3 41.1 1.2 ( 1.6/ 0.7) 26.6 41.2 2.1 ( 2.5/ 1.8) 41.0 41.2 2.5 ( 2.6/ 2.2) 4.6 41.2 3.3 ( 3.8/ 2.8) 1.5 41.2 2.2 ( 2.7/ 1.3) 11.6 41.4 2.9 ( 3 .3/ 2.5) 3.4 40.7
Supersaturation
13.4 (16.6/11.8) 99.3 25.8 11.3 (12.8/ 9.9) 117 26.9 11.8 (12.3/ 9.9) 92.9 24.6 12.5 (15.6/ 8.7) 85.7 25.7 17.4 (19.5/16.3) 58.2 25.7 12.9 (14.1/11.6) 49.6 25.1 7.5 (10.3/ 6.1) 22.8 25.1 5.6 ( 8.9/ 1.6) 20.1 24.9
10.1 (10.8/ 9.4) 37.9 24.3 11.3 (12.1/ 9.9) 23.6 24.4
Equilibrium
3.2 ( 4 .3 / 2.1) 103 24.5 3.4 ( 4 .1/ 2.2) 101 25.0 2.6 ( 3.1/ 2.2) 94.5 24.3 6.2 ( 7 .2/ 4.8) 106 25.1 4.4 ( 5.3/ 3.9) 63 25.2 3.1 ( 4 .6/ 2.0) 14.9 24.9 5.2 ( 6 .4 / 3.6) 13.8 23.8 5.4 ( 6 .3/ 4.8) 9.8 24.2
22.4 497 22,2 1180 22.0 472 22.3 634 22.5 406 22.5 476 22.1 22.9 22.5 499 22.3 41.0 22.7 98.4 23.0 22.9 51.6 22.6 162 22.8 229 22.8 121
22.9 89.4 22.5 82.6 22.3 51.8 22.9 76.0 22.6 136 22.4 103 22.3 209 22.4 194
34.0 238 33.2 245 35.0 369 33.4 304 34.4 433 35.0 411 33.9 498 34.6 485 34.6 274 34.5 376
34.5 220 35.5 298 34.6 303 34.4 27.2 34.8 337 34.7 128 35.2 153 34.4 155
*Experiment for time dependence,
METALLURGICAL AND MATERIALS TRANSACTIONS B VOLUME 25B, FEBRUARY 1 9 9 4 - - 3 5
�9
0.6
0.4
10
10
0
Z 1.5 ,.d ~o 1.0 o
0.5
O
I I
�9 0 - -
I C A ~ s $ .
I
- 0 �9 --C~-
I I I
I I
---o-____~__ o o _ 8
1873 K i I I
0 30 60 90 120
Time (min) Fig. 1 - - T i m e for attainment of equilibrium.
Section II-A. The broken lines shown in Figure 2 cor- respond to the results calculated by the iterative method, using the Rein and Chipman's values 1151 for activities of A1203 with respect to a solid standard state (AC = 0.33 and CA = 0.0048), the value for AG~I given by Eq. [I], and the respective interaction parameters given in Table II.
A1203 (s) = 2 a l + 3 0
AG~I = 1 , 2 0 2 , 0 0 0 - 386 .3TJ /mol tl6'lTJ [1]
The solid line in Figure 2 corresponds to the calcu- lated results using the value for aAi~O~ = 0.0006,1181 which was estimated from the nitrogen distribution ratio and nitride capacity defined in Section III-E. The mea- sured contents of oxygen in the equilibrium experiments of slag AC, expressed by filled marks, fall well on the calculated line in the range of [mass pct All < 0.3, while those of slag CA were located above the two calculated lines described earlier. This difference is considered to be within the error limit of the analytical method for ox- ygen (1 - 0.7 mass ppm).
3. Relation o f mass pct oxygen vs mass pct calcium Figure 3 shows the relation between oxygen and cal-
cium content, observed in the equilibrium and super- saturation experiments, denoted by filled and open circles, respectively. The results from previous work jmJ are also shown in Figure 3 by square, open and filled marks. It can be seen that the present results for the supersaturation experiments (open circles) agree with those of previous ones (open squares), and the present results for equilibrium experiments (filled circles) agree
-1
-2
-3
-4
O
-3
-4
-5
AC S u i t o e t al . T h i s work
eq. �9 �9 ss. D 0
[]
- . Ojo
1873 K
I t I
... [313 [] [] 000 r . ~ FI
- - - - - Rein & Chipman CA
Suito et al. J i i
-3 -2 - 1 0
log [% AI]
Fig. 2 - - A l u m i n u m v s oxygen content in logarithmic scale for CaO- A1203 slags.
T a b l e I I . I n t e r a c t i o n P a r a m e t e r s U s e d i n t h e P r e s e n t W o r k I171
i j ~ (~)
O O -0 .2 AI -3 .9 (1.7) Si -0.131 N 0.057
AI O -6 .6 A1 0.045 (-0.001) Si 0.056 Ca -0.047 N -0.058
Si O -0.23 AI 0.058 Si 0.11 (-0.0021) Ca -0.067 N 0.09
Ca A1 -0.072 Si -0.097 Ca -0.002
N O 0.05 A1 -0.028 N 0
with those of previous ones (filled squares), although the data points scatter to a considerable degree. The oxygen content obtained in the supersaturation experiments is greater than that of the equilibrium experiments.
Previous results obtained by using CaO-SiO2 (CS) I9~ and CaO-SiO2-A1203 (CAS, ACS) t111 slags are plotted in Figure 4, indicating that the difference between equilib- rium and supersaturation experiments is apparently ob- served in the slags ACS-4 and CAS-5, 8, although the
36--VOLUME 25B, FEBRUARY 1994 METALLURGICAL AND MATERIALS TRANSACTIONS B

-1
-2
-3
-4 �9
-2
-3
I
AC
- o t 3
e q .
s s .
I
Suito et al. This work
[] �9
CA 1873 K
�9
I I - 4
-5 -4 -3 -2 - 1
log [%Ca]
Fig. 3 - -Ca lc ium v s oxygen content in logarithmic scale for CaO- A1203 slags.
�9
-1
-2
-3
-4
! I
1873 K
0 This work rq Q.Han et al. l> Gustafsson & Mellberg ~7 Miyashita & Nishikawa ix Ototani et al.
[] Kobayashi et al. (1823 K) v q ~ �9
�9
X7
0 CAM + CMA z2 MAC 7 ACM
I I -5 i -5 -4 -3 -2 - 1
log [% Ca]
Fig. 5 - -Ca l c ium v s oxygen content in logarithmic scale for CaO- MgO-Al203 slags and for the experiments without slags.
-1
�9
-2
-3
-4
1873 K
/x CS
x ~ s s .
, ,-[-~, • ACS-2 [] CAS-8, eq.
~7 ACS-4, eq. ~ s s .
V s s . + CAS-9 I I I
-1
-2
-3
-4 -5 -4 -3 -2 -1
log [% Ca]
Fig. 4 - - C a l c i u m v s oxygen content in logarithmic scale for CaO- SiO2 and CaO-SiOz-AI203 slags.
data points in the supersaturation experiments are con- siderably scattered.
The relation between log [mass pct O] and log [mass pct Ca] obtained in the equilibrium experiments using CaO-A1203-MgO slags (CAM, CMA, MAC, and ACM) t121 is shown in Figure 5. The results obtained in the present (open circles) and previous experiments without slags are also plotted in Figure 5 for comparison.
The values of Ototani et al., TM Gustafsson and
Mellberg, ~4~ and Han et al. ~61 were obtained under high argon pressure. When these results, which are supposed to be in equilibrium, are compared with those obtained by using the present CaO-saturated slags (CA in Figure 3, CAS-8 in Figure 4, and CAM in Figure 5), the content of calcium and oxygen under high argon pressure is considerably higher than that obtained using CaO-saturated slags. However, the calcium content ob- served in the present experiments using slags tends to systematically vary with the oxygen content as compared with the results of the experiments without slags.
4. Relations of [mass pct Ca] vs [mass pct All and [mass pct Ca] vs [mass pct Si] The relations between log [mass pct Ca] and log [mass
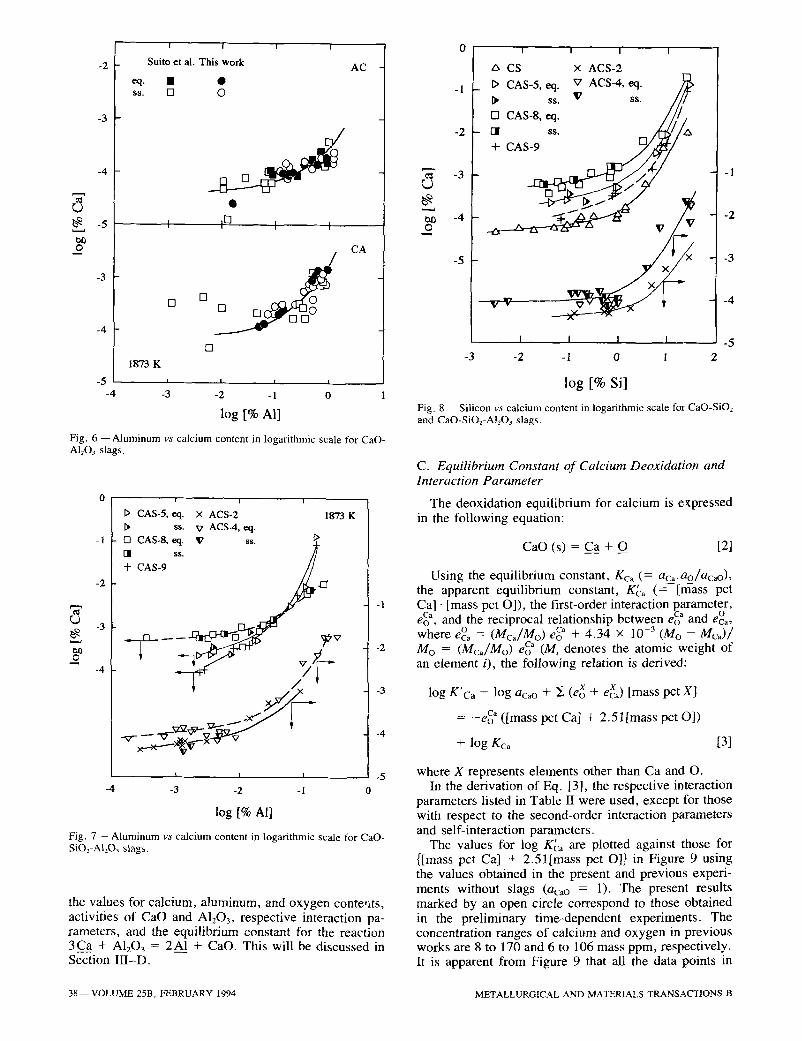
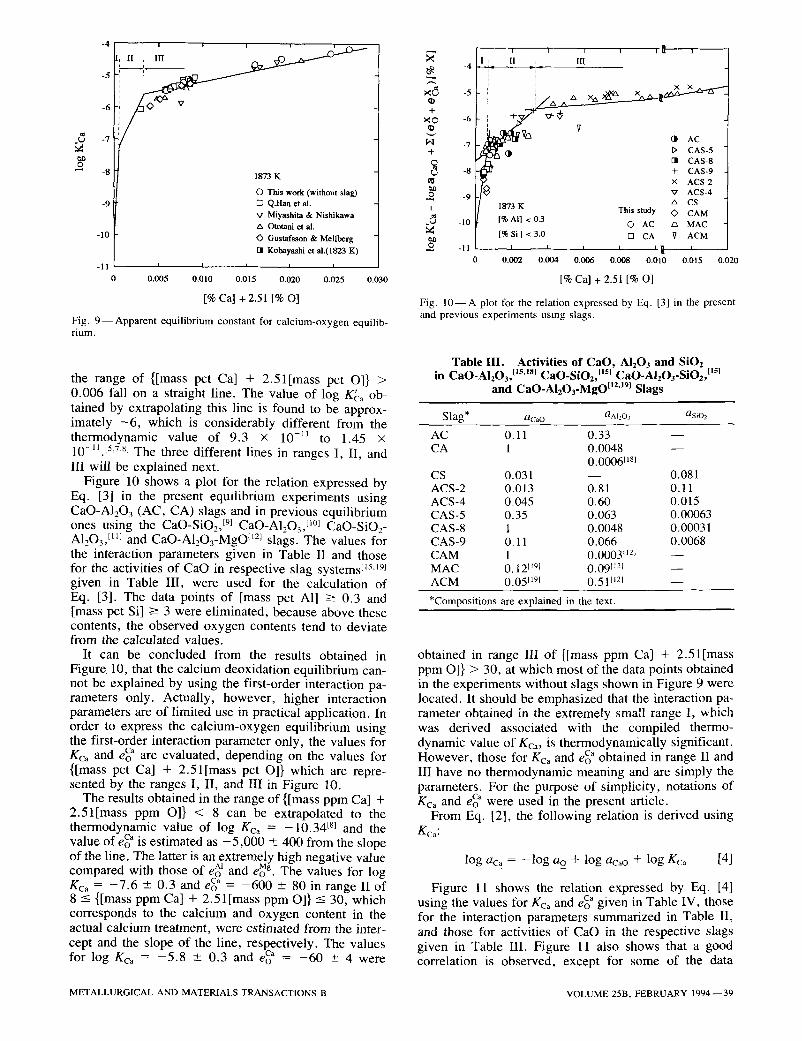
pct All for CaO-A1203 (AC, CA) and CaO-SiO2-A1203 (ACS, CAS) slags are shown in Figures 6 and 7, re- spectively, and those between log [mass pct Ca] and log [mass pct Si] for CaO-SiO2 (CS) and CaO-SiOz-Al203 (ACS, CAS) slags are shown in Figure 8.
It can be seen that the data obtained in both super- saturation and equilibrium experiments fall well on the same # line. These results suggest that the equilibria given by the following exchange reactions 2A1 + 3(CaO) = (A1203) + 3C__aa and 2C_aa + (S iO2) = 2(CaO) + S i are attained even in the supersaturation experi- ments, in which only oxygen in liquid iron is supersa- turated (Figures 2 through 4). It is also clear from Figure 6 that the results obtained in both supersaturation and equilibrium experiments are independent of the ex- perimental method of approaching the equilibrium 3 C___~a + (AlzO3) = 2A1 + 3(CaO).
The results obtained for slag AC are slightly lower than those for slag CA. This small difference can be seen more clearly in the plot of aca vs aA~ calculated by using
METALLURGICAL AND MATERIALS TRANSACTIONS B VOLUME 25B, FEBRUARY 1994--37
O
O
-2
-3
-4
-5
-3
-4
-5
$$.
! I
Suito et al. This work
[] o
!
AC
I ~ I t
[-1
1873 K
I
-3
D
J
I I I
-2 -1 0
log [% All
CA
Fig. 6 - - A l u m i n u m v s calcium content in logarithmic scale for CaO- A1203 slags.
L)
o
-1
-2
-3
-4
-1
I I I
l> CAS-5, ee I. x ACS-2 1873 K s s . V ACS-4, ~:1.
D CAS-8, r V ss.
I I I
-3 -2 - 1
-2
-3
-4
-5 -4 0
log [% A1]
Fig. 7 - - A l u m i n u m v s calcium content in logarithmic scale for CaO- SiO=-Al203 slags.
the values for calcium, aluminum, and oxygen conte,ats, activities of CaO and A1203, respective interaction pa- rameters, and the equilibrium constant for the reaction 3C___a_a + A1203 = 2A1 + CaO. This will be discussed in Section I I I -D .
-I
-2
-3
- 4
-5
I I I I
A CS • ACS-2 t> CAS-5, eq. v ACS-4, eq. / ~
�9 X X X
-1
- 2
-3
- 4
I I I I - 5
-3 -2 - 1 0 1 2
log [% Si]
Fig. 8 - -S i l icon v s calcium content in logarithmic scale for CaO-SiO2 and CaO-SiO~-AI203 slags.
C. Equilibrium Constant of Calcium Deoxidation and Interaction Parameter
The deoxidation equilibrium for calcium is expressed in the following equation:
CaO (s) = Ca + O [2]
Using the equilibrium constant, Kc~ (= aca.ao/ac,o), the apparent equilibrium constant, gca (= [mass pct Ca] �9 [mass pct O]), the first-order interaction parameter,
ca and the reciprocal relationship between e~ a and e~ eo , c~ + 4.34 • 10 -3 (Mo - Mca)/ where ec~ = (Mca/Mo) eo
Ca Mo = (McJMo) eo (Mi denotes the atomic weight of an element i), the following relation is derived:
log K'ca - log acao + ~ (e x + e~a) [mass pct X]
-- -eoCa ([mass pct Ca] + 2.51[mass pct O])
+ log Kca [3]
where X represents elements other than Ca and O. In the derivation of Eq. [3], the respective interaction
parameters listed in Table II were used, except for those with respect to the second-order interaction parameters and self-interaction parameters.
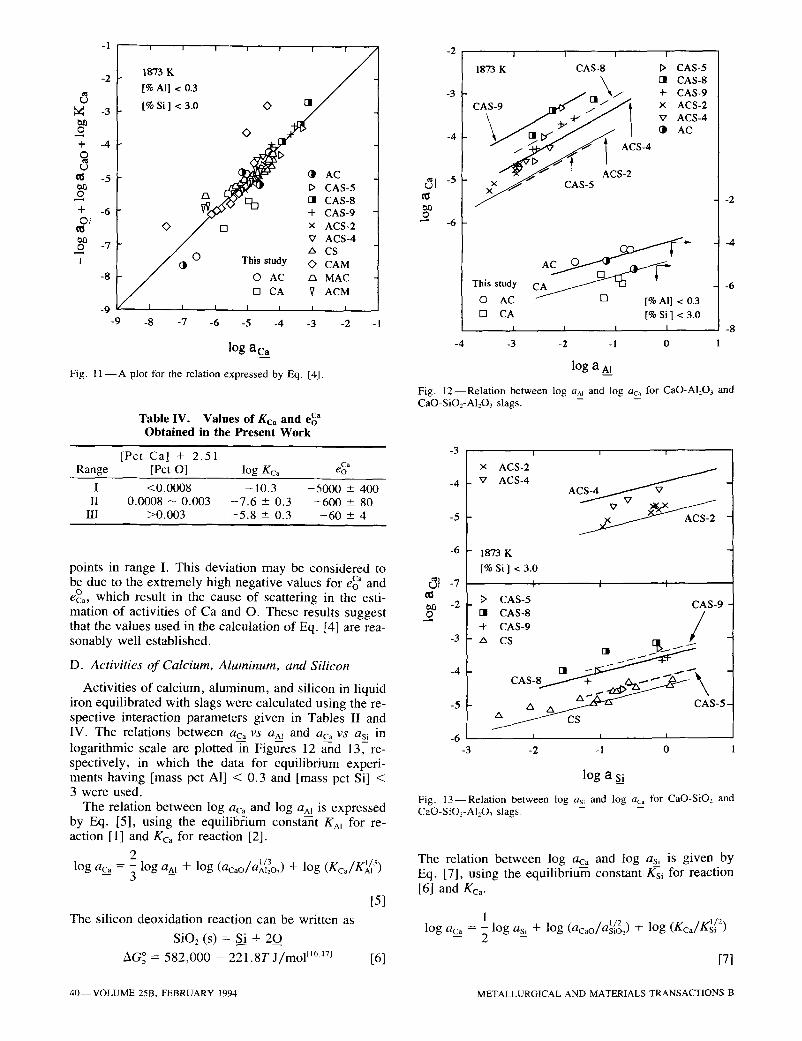
The values for log K~, are plotted against those for {[mass pct Ca] + 2.51[mass pct O]} in Figure 9 using the values obtained in the present and previous experi- ments without slags (ac,o = 1). The present results marked by an open circle correspond to those obtained in the preliminary time-dependent experiments. The concentration ranges of calcium and oxygen in previous works are 8 to 170 and 6 to 106 mass ppm, respectively. It is apparent from Figure 9 that all the data points in
38--VOLUME 25B, FEBRUARY 1994 METALLURGICAL AND MATERIALS TRANSACTIONS B
O
o
-4
i -5
-6
-7
-8
-9
-10
-11 0
I i I i
I I , I n
1873 K
O This work (without slag) [] Q.Ban et al. V Miyashita & Nishikawa A Ototani et al. O Gustafsson & Mellberg [] Kobayashi et a1.(1823 K)
I I I I I
0.005 0,010 0,015 0.020 0.025 0,030
[% Ca] + 2.51 [% O]
Fig. 9--Apparent equilibrium constant for calcium-oxygen equilib- rium.
the range of {[mass pct Ca] + 2.51[mass pct O]} > 0.006 fall on a straight line. The value of log K~a ob- tained by extrapolating this line is found to be approx- imately - 6 , which is considerably different from the thermodynamic value of 9.3 • 10 -1~ to 1.45 • 10-11. [5'7'8] The three different lines in ranges I, II, and III will be explained next.
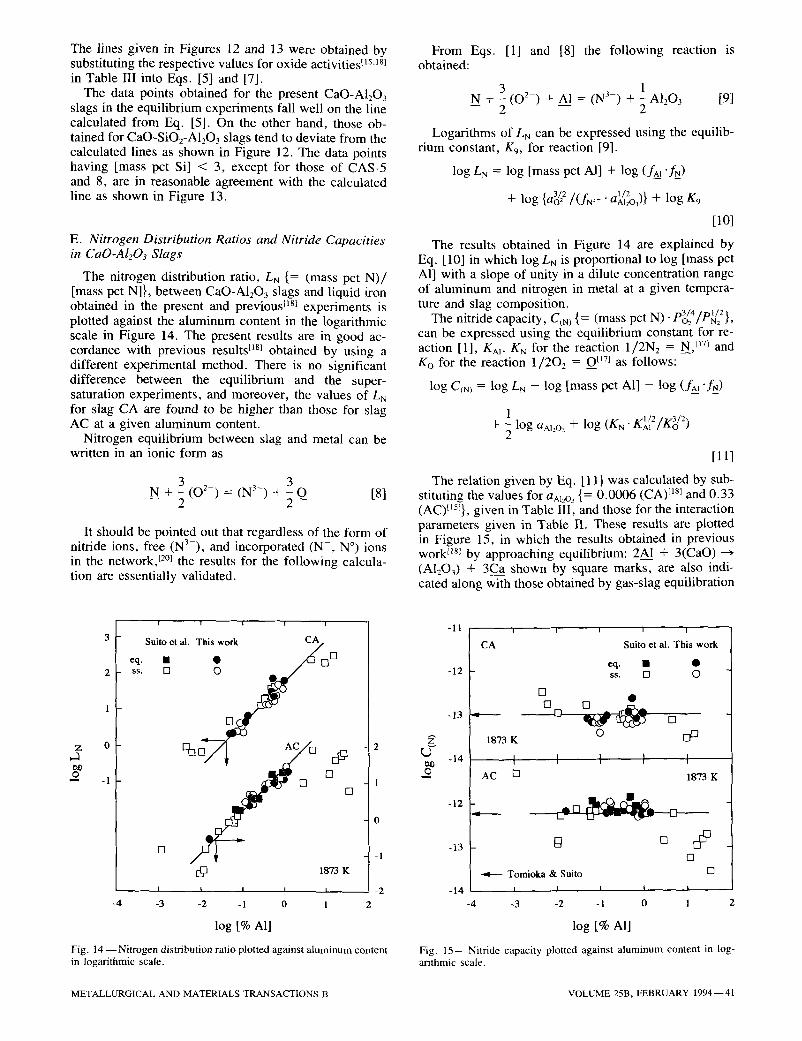
Figure 10 shows a plot for the relation expressed by Eq. [3] in the present equilibrium experiments using CaO-Al:O3 (AC, CA) slags and in previous equilibrium ones using the CaO-SiO2,19~ CaO-Al203, H~ CaO-SiO2- A1203, I~u and CaO-A1203-MgO I121 slags. The values for the interaction parameters given in Table II and those for the activities of CaO in respective slag systems vSJg~ given in Table III, were used for the calculation of Eq. [3]. The data points of [mass pct A1] -> 0.3 and [mass pct Si] -- 3 were eliminated, because above these contents, the observed oxygen contents tend to deviate from the calculated values.
It can be concluded from the results obtained in Figure, 10, that the calcium deoxidation equilibrium can- not be explained by using the first-order interaction pa- rameters only. Actually, however, higher interaction parameters are of limited use in practical application. In order to express the calcium-oxygen equilibrium using the first-order interaction parameter only, the values for
Ca Kca and eo are evaluated, depending on the values for {[mass pct Ca] + 2.51[mass pct O]} which are repre- sented by the ranges I, II, and III in Figure 10.
The results obtained in the range of {[mass ppm Ca] + 2.51[mass ppm O]} < 8 can be extrapolated to the thermodynamic value of log Kc~ = - 1 0 . 3 4 tSl and the value of e c~ is estimated as - 5 , 0 0 0 +__ 400 from the slope of the line. The latter is an extremely high negative value compared with those of e~ ~ and eo Mg. The values for log g c a = - 7 . 6 --- 0.3 and e ca = - 6 0 0 --- 80 in range II of 8 --< {[mass ppm Ca] + 2.51[mass ppm O]} ----- 30, which corresponds to the calcium and oxygen content in the actual calcium treatment, were estimated from the inter- cept and the slope of the line, respectively. The values for log Kca = - 5 . 8 - 0.3 and e ca = - 6 0 -+ 4 were
-4
N ~ -5
+ X�9 -6
-7 +
L) -8
I
e l _U -10 ad
-11
I 1 I I I I ~ I
II ~ 111 ,, i
~ 7 c ' , �9 AC 7
~t- (It D CAS-5 [] CAS-8 + CAS-9 • ACS-2 v ACS-4 A CS
1873 K This study Q CAM
[%AI] <0.3 O AC :~ MAC [ % S i ] < 3 . 0 [] CA 7 ACM
I I I I 1 8 I
0.002 0.004 0.1306 0.008 0.010 0.015 0.020
[% Ca] + 2.51 [% O]
Fig. 1 0 - - A plot fo r the re la t ion exp re s sed b y Eq. [3] in the presen t and p rev ious e x p e r i m e n t s u s ing s lags .
Table I11. Activities of CaO, A1203 and SiO2 l / ~ [ 1 5 ] i n C a O - A I 2 0 3 , Os'lsJ C a O - S i O 2 , [is1 C a O - A l z O 3 - S ' . J 2 ,
and CaO-Al203-MgO [12A9] Slags
Slag* aca O aA12% asioz
0.081 0.11 0.015 0.00063 0.00031 0.0068
AC 0.11 0.33 - - CA 1 0.0048 - -
0.00061181 CS 0.031 - - ACS-2 0.013 0.81 ACS-4 0.045 0.60 CAS-5 0.35 0.063 CAS-8 1 0.0048 CAS-9 0.11 0.066 CAM 1 0.0003 q121 MAC 0.12 H91 0.09 H21 - - ACM 0.051191 0 . 5 1 [121 - -
* C o m p o s i t i o n s are exp l a ined in the text.
obtained in range III of {[mass ppm Ca] + 2.51[mass ppm O]} > 30, at which most of the data points obtained in the experiments without slags shown in Figure 9 were located. It should be emphasized that the interaction pa- rameter obtained in the extremely small range I, which was derived associated with the compiled thermo- dynamic value of Kca, is thermodynamically significant.
Ca However, those for Kca and eo obtained in range II and III have no thermodynamic meaning and are simply the parameters. For the purpose of simplicity, notations of
Ca g f a and eo were used in the present article.
From Eq. [2], the following relation is derived using K c a :
log ac. = - l o g ao + log ac~o + log Kc~ [4]
Figure 11 shows the relation expressed by Eq. [4] Ca given in Table IV, those using the values for Kc~ and eo
for the interaction parameters summarized in Table II, and those for activities of CaO in the respective slags given in Table III. Figure 11 also shows that a good correlation is observed, except for some of the data
METALLURGICAL AND MATERIALS TRANSACTIONS B VOLUME 25B, FEBRUARY 1 9 9 4 - - 3 9
t~
.20 +
o + �9
e~ o
I
-1
-2
-3
-4
-5
-6
-7
-8
-9 -9
I I I I I I I
1873 K /
[% AI] < 0.3
[% Si ] < 3.0 O ~
(~ AC I> CAS-5
~>"J IE~ rll CAS-8 ~ / < ~ v ~ + CAS-9
O / [] • ACS-2 / x7 ACS-4
/ ,., A CS / 0 0 Thisstudy (>-- ~A M
/ O AC ~ MAC / [] CA V ACM
I I I I I I I
-8 -7 -6 -5 -4 -3 -2 - I
log a c a
Fig. l l - - A plot for the relation expressed by Eq. [4].
Table IV. V a l u e s o f Kca and e ca Obta ined in the Present W o r k
[Pct Ca] + 2.51 Ca Range [Pct O] log Kca eo
I < 0 . 0 0 0 8 - 1 0 . 3 - 5 0 0 0 --- 400 II 0 .0008 -- 0 .003 - 7 . 6 -+ 0.3 - 6 0 0 _+ 80
III > 0 . 0 0 3 - 5 . 8 -+ 0.3 - 6 0 -+ 4
points in range I. This deviation may be considered to Ca be due to the extremely high negative values for eo and
ec~ which result in the cause of scattering in the esti- mation of activities of Ca and O. These results suggest that the values used in the calculation of Eq. [4] are rea- sonably well established.
D. Activities o f Calcium, Aluminum, and Silicon
Activities of calcium, aluminum, and silicon in liquid iron equilibrated with slags were calculated using the re- spective interaction parameters given in Tables II and IV. The relations between aca vs aAz and aca vs asi in logarithmic scale are plotted in Figures 12 and 13, re- spectively, in which the data for equilibrium experi- ments having [mass pct A1] < 0.3 and [mass pct Si] < 3 were used,
The relation between log ac~ and log aA, is expressed by Eq. [5], using the equiliff~um constafit KA~ for re- action [1] and Kca for reaction [2].
2 = 1 / 3 ] / 3
log ac~ 3 log aA_ l + log (acao/aAz2O3) + log (Kca/K); I )
[5]
The silicon deoxidation reaction can be written as
SiO2 (s) = Si + 2 0
AG~ = 582,000 - 221.8T J/ tool [16371 [6]
-2
-3
-4
r~l -5
o - 6
I I I I
1873 K CAS-8 D CAS-5
+ CAS-9 CA S-9 x ACS-2
�9
~ . ~ CAS-5
This study
0 AC [] CA
I -4 -3
% - [] [% AI] < 0.3 [% Si ] < 3.0
I I I -2 -1 0
log a AI
-2
-4
-6
-8
Fig. 12--Rela t ion between log aA~ and log aca for CaO-A1203 and CaO-SiO~-A1203 slags. - --
-3
-4
-5
-6
31 -7
~ -2 2
-3
-4
-5
-6 -3
• ACS-2 X7 ACS-4
1873 K
[% Si ] < 3.0 I
x7
I f
D CAS-5 CAS-9
+" /
\ A zx ~ CAS-5
~ c s . . . . . I I I
-2 -1 0
log a s_i
Fig. 13--Rela t ion between log as~ and log ac~ for CaO-SiOz and CaO-SiO~-AlzO~ slags. - --
The relation between log aca and log asi is given by Eq. [7], using the equilibriuna constant K~i for reaction [6] and Kca.
1 log ac~ = - log asj + log (acaolaliJ~,) + log (KcalK~(2)
2
[7]
40--VOLUME 25B, FEBRUARY 1994 METALLURGICAL AND MATERIALS TRANSACTIONS B
The lines given in Figures 12 and 13 were obtained by substituting the respective values for oxide activities t~,lsl in Table III into Eqs. [5] and [7].
The data points obtained for the present CaO-A1203 slags in the equilibrium experiments fall well on the line calculated from Eq. [5]. On the other hand, those ob- tained for CaO-SiO2-AI203 slags tend to deviate from the calculated lines as shown in Figure 12. The data points having [mass pct Si] < 3, except for those of CAS-5 and 8, are in reasonable agreement with the calculated line as shown in Figure 13.
E. Nitrogen Distribution Ratios and Nitride Capacities in CaO-Alz03 Slags
The nitrogen distribution ratio, LN {= (mass pct N) / [mass pct N]}, between CaO-A1203 slags and liquid iron obtained in the present and previous t~8~ experiments is plotted against the aluminum content in the logarithmic scale in Figure 14. The present results are in good ac- cordance with previous results l~8~ obtained by using a different experimental method. There is no significant difference between the equilibrium and the super- saturation experiments, and moreover, the values of LN for slag CA are found to be higher than those for slag AC at a given aluminum content.
Nitrogen equilibrium between slag and metal can be written in an ionic form as
3 3 N + - (02-) = (N 3-) + - O [8] - - 2 2 - -
It should be pointed out that regardless of the form of nitride ions, free (N3-), and incorporated (N-, N ~ ions in the network, ~2~ the results for the following calcula- tion are essentially validated.
From Eqs. [1] and [8] the following reaction is obtained:
3 1 N + - (02 ) + A1 = ( N 3-) + _- A1203 [9] - - 2 2
Logarithms of LN can be expressed using the equilib- rium constant, K9, for reaction [9].
log LN = log [mass pct A I ] + log (fAl "fro
+ log {a3o~2/(fN3 - " 1 / 2 "~l. q_ log K 9 t * A l 2 0 3 } J
[101
The results obtained in Figure 14 are explained by Eq. [10] in which log LN is proportional to log [mass pct A1] with a slope of unity in a dilute concentration range of aluminum and nitrogen in metal at a given tempera- ture and slag composition.
The nitride capacity, C(N) {= (mass pct N) o3/4/o~/2t �9 I O 2 / ~ N 2 J ~
can be expressed using the equilibrium constant for re- action [1], KAI, KN for the reaction 1/2N2 = N, t~71 and Ko for the reaction 1/202 = 0 [17] as follows:
log C~N) = log LN -- log [mass pct All - log (fAl "fro
1 l~-Al / l x O ) + 2 log aAl:O3 + log (KN" wJ/2/~3/2~
[ i l l
The relation given by Eq. [ 11 ] was calculated by sub- stituting the values for aa~,o3 {= 0.0006 (CA) L181 and 0.33 (AC)I~sI}, given in Table III, and those for the interaction parameters given in Table II. These results are plotted in Figure 15, in which the results obtained in previous work l~Sj by approaching equilibrium: 2A] + 3(CaO) --+ (AIzO3) + 3C_~a shown by square marks, are also indi- cated along with those obtained by gas-slag equilibration
Z ,-a la0
o
I I I I I
Snito et al. This work CA /
eq. �9 �9 ~ ss. [] 0 Q O D ~ / I
D~UD[] ~ f D [] []
[] (~ 1873 K
I I I I I
-3 -2 - 1 0 1
log [% All
-4
-1
-2
2
Fig. 1 4 - - N i t r o g e n distribution ratio plotted against a luminum content in logarithmic scale.
~0 o
-11
-12
-13
-14
-12
-13
CA
1873 K
t AC []
I I I i i
Suito et al. This work
[] o eq. s$.
[] D El
O
t 1 )
[]
t
1873 K
g El 6P []
[] Tomioka & Suito
-14 i I t t t
-4 -3 -2 - 1 0 1 2
log [% All
Fig. 1 5 - - N i t r i d e capacity plotted against a luminum content in log- arithmic scale.
METALLURGICAL AND MATERIALS TRANSACTIONS B VOLUME 25B, FEBRUARY 1994--41
experiments. 121] These results agree well with each other. This implies that the nitrogen distribution between slag and metal is not influenced by the supersaturated oxygen in bulk metal. An explanation of this interesting phe- nomena is necessary for the future.
IV. CONCLUSIONS
Calcium-oxygen equilibrium was studied at 1873 K by immersing a pure iron capsule containing calcium metal into liquid iron, which was equilibrated with CaO-A1203 slags in A1203 and CaO crucibles. On the basis of these results, along with previous ones obtained in the equi- librium experiments between liquid iron and CaO- containing slags, the following conclusions were derived:
Ca 1. The values for Kca and eo obtained in the range of {[mass ppm Ca] + 2.51[mass ppm O]} < 8, 8 to 30, and >30 , were estimated to be log /(ca = - 1 0 . 3 ,
Ca eCo a = - 5 0 0 0 + 400, log Kca = - 7 . 6 -+ 0.3, eo = Ca - 6 0 0 -+ 80, and log g c a = - 5 . 8 -+- 0.3, co = - 6 0
-+ 4, respectively. 2. No significant difference between equilibrium and
supersaturation experiments was observed in [mass pct Ca] v s [mass pct A1] and [mass pct Ca] v s [mass pct Si] relations.
3. The relations between aca v s aA~ and aca v s asi could be explained using respe~ive oxide actNities and de- oxidation equilibrium constants.
4. Nitride capacities in CaO-AI203 slags were obtained from the results for the nitrogen distribution ratios and those for activities of AleO3. These results agreed well with the values obtained by a gas-slag equili- bration technique.
REFERENCES
1. Y. Miyashita and K. Nishikawa: Tetsu-to-Hagan~, 1971, vol. 57, pp. 1969-75.
2. S. Kobayashi, Y. Omori, and K. Sanbongi: Trans. Iron Steel Inst. Jpn., 1971, vol. 11, pp. 260-69.
3. T. Ototani, Y. Kataura, and T. Degawa: Trans. Iron Steel Inst. Jpn., 1976, vol. 16, pp. 275-82.
4. S. Gustafsson and P.-O. Mellberg: Scand. J. Metall., 1980, vol. 9, pp. 111-16.
5. M. Nadif and C. Gatellier: Rev. Metall.-C1T, 1986, vol. 83, pp. 377-94.
6. Q. Han, X. Zhang, D. Chen, and P. Wang: Metall. Trans. B, 1988, vol. 19B, pp. 617-22.
7. I.S. Kulikov: lzv. Akad. NaukSSSR, Met., 1985, no. 6, pp. 9-15. 8. E.T. Turkdogan: Steel Res., 1991, vol. 62, pp. 379-84. 9. R. Inoue and H. Suito: Metall. Trans. B, 1992, vol. 23B,
pp. 613-21. 10. H. Suito, H. Inoue, and R. Inoue: Iron Steellnst. Jpn. Int., 1991,
vol. 31, pp. 1381-88. 11. F. Tamura and H. Suito: Metall. Trans. B, 1993, vol. 24B,
pp. 121-30. 12. R. Inoue, H. Suito, and T. Kimura: CAMP-Iron Steellnst. Jpn.,
1992, vol. 5, p. 1003. 13. R. Inoue, T. Kozono, R. Goto, and H. Suito: Mater. Trans. JIM,
1991, vol. 32, pp. 489-94. 14. R. Inoue and H. Suito: Mater. Trans. JIM, 1991, vol. 32,
pp. 1164-69. 15. R.H. Rein and J. Chiprnan: Trans. TMS-AIME, 1965, vol. 233,
pp. 415-25. 16. J.F. Elliott, M. Gleiser, and V. Ramakrishna: Thermochemistry
for Steelrnaking, A d d i s o n - W e s l e y , Reading, MA, 1963, vol. 2. 17. G.K. Sigworth and J.F. Elliott: Met. Sci., 1974, vol. 8,
pp. 298-310. 18. R. lnoue, H. Inoue, and H. Suito: Iron Steellnst. Jpn. Int., 1991,
vol. 31, pp. 1389-95. 19. G.J.W. Kor: Elliott Syrup. Proc., 1990, pp. 479-96. 20. K. Ito and R.J. Fruehan: Metall. Trans. B, 1988, vol. 19B,
pp. 419-25. 21. K. Tomioka and H. Stlito: Iron Steel Inst. Jpn. Int., 1991,
vol. 31, pp. 1316-21.
42--VOLUME 25B, FEBRUARY 1994 METALLURGICAL AND MATERIALS TRANSACTIONS B