cadmium contents of oats ( avena sativa l.) in official variety, organic...
TRANSCRIPT
Cadmium Contents of Oats (Avena sativa L.) in Official Variety,Organic Cultivation, and Nitrogen Fertilization Trials during
1997−1999
MERJA EUROLA,*,† VELI HIETANIEMI ,† MARKKU KONTTURI,† HANNU TUURI,†
JUHA-MATTI PIHLAVA ,† MARKETTA SAASTAMOINEN,‡ OLLI RANTANEN,†
ARJO KANGAS,† AND MARKKU NISKANEN†
Agrifood Research Finland (MTT), FIN-31600 Jokioinen, Finland, and Satafood DevelopmentAssociation/Suomen Viljava Ltd., Siilokatu 3 FIN-32830 Riste, Finland
The cadmium (Cd) contents of oats (Avena sativa L.) in Finland were examined over a 3 year periodin three types of trials: official variety, organic vs conventional cultivation, and nitrogen fertilizationtrials. Large seasonal and regional variations were found in the Cd concentrations. In official varietytrials, the mean Cd contents in 1997, 1998, and 1999 were 0.046, 0.029, and 0.052 mg kg-1 dryweight (dw), respectively, ranging from 0.008 to 0.120 mg kg-1 dw. The concentrations were generallywell below the maximum permitted level of 0.100 mg kg-1 fresh weight. No significant differenceswere found between the organic and the conventional cultivation techniques. Nitrogen (N) fertilizationincreased the Cd contents of oats especially at high nitrogen rates (160 kg N hectare-1 (ha)). Significantcultivar differences (p < 0.001) were determined in all trials. Cultivars Salo and Kolbu had consistentlyhigher contents, and Belinda and Roope had lower Cd contents among the different growing conditions.Hence, it is possible to cultivate and develop oat cultivars less likely to accumulate Cd.
KEYWORDS: Avena sativa ; cadmium; oats; cereals; Finland; organic cultivation; nitrogen fertilization;
cultivar differences; variety
INTRODUCTION
Finland produces extensive amounts of oats and exports oatsto many countries. A large market for oats has been developedfor increasing human consumption of oats as a functionallyhealthy food. Oats are also high-quality feed for horses, hens,broilers, sheep, and milking cows. However, it is also importantto determine the risk factors associated with intake of foodsand feeds. Cadmium (Cd) is considered a risk factor in cerealcrops for humans and animals due to its toxicity and accumula-tion in the body. Increasing concern has been shown over Cdcontamination in soils and its impacts on health.
The Cd contents of cereals can be problematic for interna-tional trade if concentrations exceed the limit values. The maincontamination sources are atmospheric deposition, use of animalmanures, phosphorus fertilizers, or sewage sludges that maycontain Cd as impurities (1, 2). Cereals are the major sourcesof dietary Cd through their large consumption. In 1995, thecalculated mean Cd intake in Finland was 10.8µg d-1, fromwhich cereals contributed 60% (3).
Cd availability to plants is affected by factors such as totalsoil Cd, solubility of soil Cd, pH, soil type (clay, organic matter),
soil fertility, use of fertilizers, and climatic conditions duringthe growing season, especially precipitation (4-11). Liming isusually assumed to reduce Cd concentrations in plants. However,Andersson and Siman (5) and He and Singh (7) reported thathigh soil pH enchances Cd uptake in oats; the reasons for thisremain unclear. It is also well-documented that plant speciesdiffer in their ability to absorb Cd and transport it from rootsto shoots (12-16). Fewer studies concerning cultivar differencesare available.
Typical features of Finnish agricultural soils include theirrelatively strong natural acidity, low electrical conductivities,and CaCO3 equivalents (17). The mean soil pH was 5.75 in1987 and 5.76 in 1998. pH varies regionally, decreasing fromsouth to north (1, 18-19). The mean soluble Cd content in soilswas 0.08 mg L-1 in 1998 (19). Cd contents of soils tend to behigher in southern Finland where clay soils predominate andwhere population densities and industrial activities are alsohigher (1, 18, 19). Abundant phosphorus fertilization has beenpracticed. During 1974-1987, AAAc (ammonium acetate aceticacid solution, pH 4.65) extractable P in Finnish agricultural soilsincreased about 14% and in coastal areas by as much as 50%.Meanwhile, AAAc ethylenediaminetetraacetic acid (EDTA)extractable Cd increased about 30%, averaging 0.079 mg L-1
in 1987. This was mainly because the P fertilizers hadexceptionally high contents of Cd during 1975-1981. However,
* To whom correspondence should be addressed. Tel: 358 3 41883234.Fax: 358 3 41883266. E-mail: [email protected].
† Agrifood Research Finland (MTT).‡ Satafood Development Association/Suomen Viljava Ltd.
2608 J. Agric. Food Chem. 2003, 51, 2608−2614
10.1021/jf020893+ CCC: $25.00 © 2003 American Chemical SocietyPublished on Web 03/27/2003
domestic, very low Cd raw phosphates have been used infertilizer production since 1986 (1). Since 1995, the use of Pfertilizers has been limited to 15 kg ha-1 per year forenvironmental reasons (20). Thus, the Cd load from fertilizershas decreased markedly from levels observed during the 1970sand early 1980s and it was about 0.5 g ha-1 in 1987 (1).
The objectives of the present work were to examine the Cdcontents and its variation in Finnish oats and thus assess therisk of appearance of high Cd oat products in the market. Thepurpose was also to obtain information on the effects of thecultivars and cultivation techniques on the Cd uptake in oats,which may aid in directing future plant breeding programs.
MATERIALS AND METHODS
Oat Samples.Oat (A. satiVa L.) samples were collected in 1997-1999 from official variety and two types of agronomy trials (organiccultivation and nitrogen fertilization trials) conducted by the AgrifoodResearch Finland. The total number of samples analyzed was 141, 150,and 125 in 1997, 1998, and 1999, respectively.
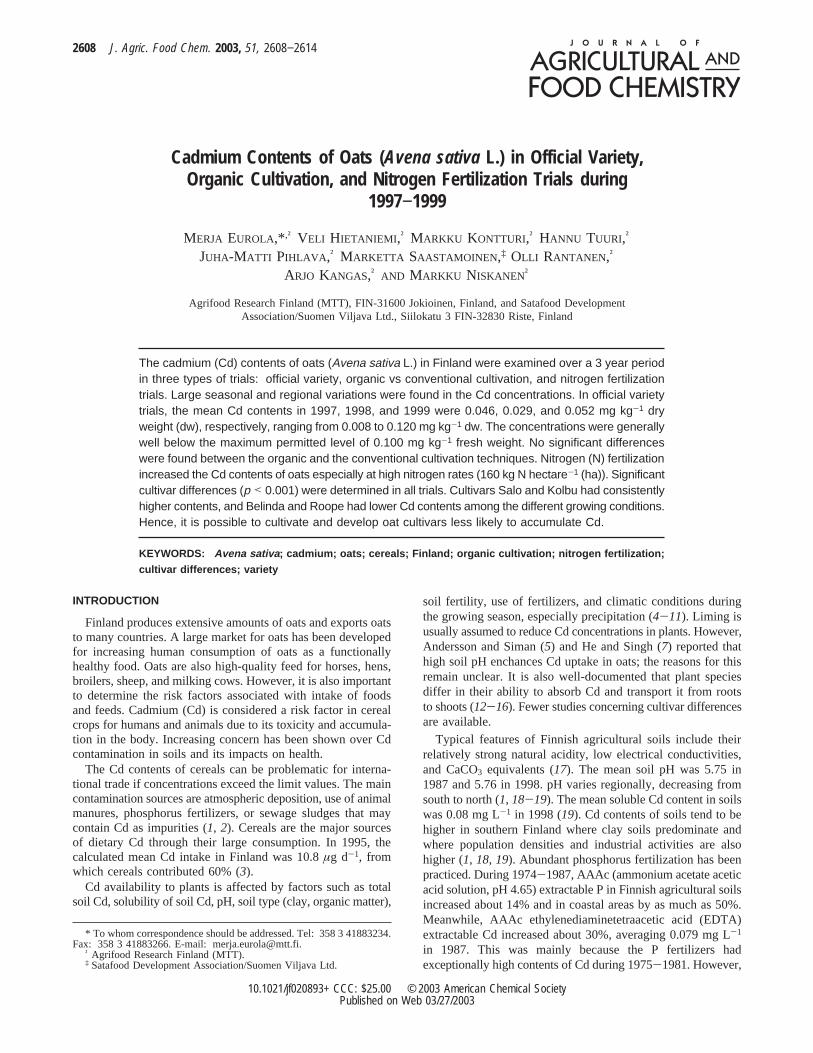
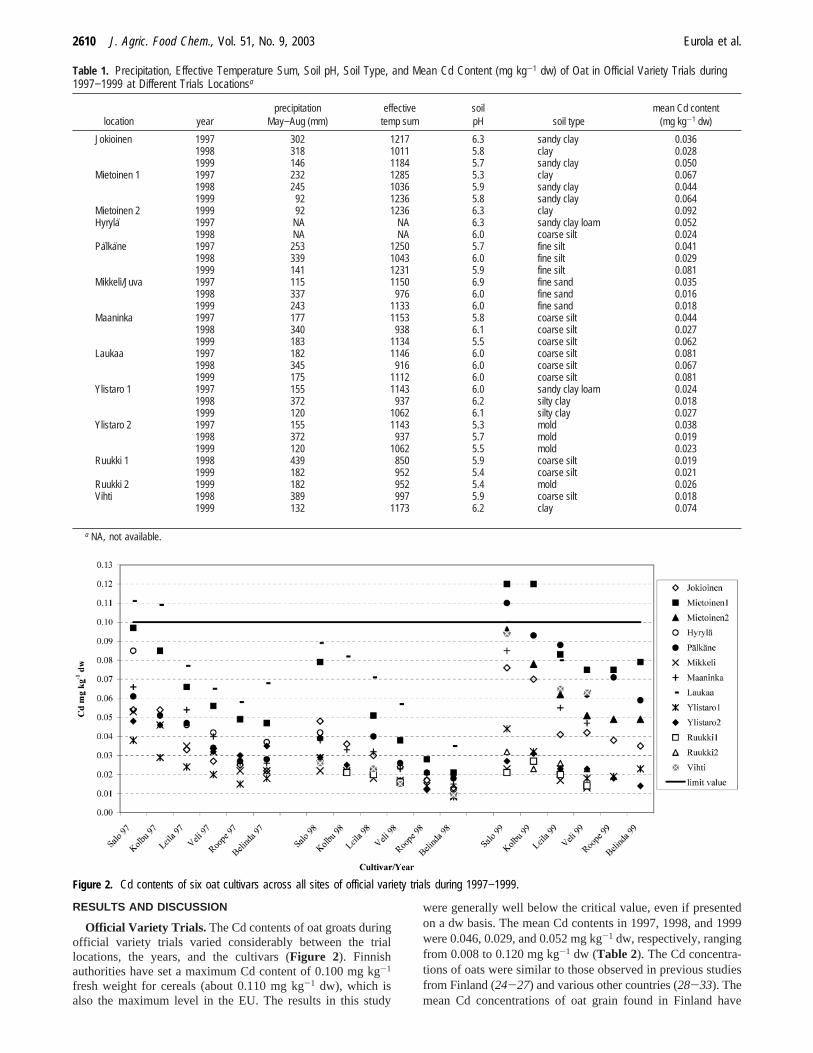
The official variety trials were managed according to standardprotocol in 8-10 locations throughout Finland (Figure 1). Moredetailed information on the trials is published elsewhere (21). Soil pH,soil types, precipitation, and effective temperature sums in 1997-1999are presented inTable 1. Soil fertility analyses were also performedevery year. The varieties studied were Leila, Salo, Veli, Kolbu, Roope,and Belinda. Kolbu and Roope have yellow husks, and the othervarieties have white husks. Roope and Veli are Finnish, Leila and Kolbuare Norwegian, and Belinda and Salo are Swedish cultivars.
Organic cultivation trials were conducted as two types of trials:comparison of organic and conventional cultivation (six locations) andorganic cultivation variety trials (seven locations). All trials wereperformed at the same field location. Conventional and organiccultivation were compared with two oat cultivars (Veli and Puhti) grownin organic and conventional farming systems at six locations (Figure1). In organic cultivation variety trials, six additional cultivars were
also studied as follows: Aarre, Katri, Kolbu, Leila, Roope, and Yty.Leila and Kolbu are Norwegian cultivars, and Veli, Puhti, Aarre, Katri,Roope, and Yty are Finnish cultivars. The conventional and organicfarming system trials were carried out on the same field: conventionalin the middle and organic on both sides; a 6 year rotation of crops wasused. In organic cultivation, the preceding crop was clover to improvethe nitrogen status of the soil, and in conventional systems, cereal cropspreceded the trial. Organic and conventional cultivation trials were heldon the main plots, and cultivars were held on subplots with 3-4replications. In all experimental fields, organic cultivation was initiatedduring the early 1990s. Precipitation and effective temperature sumsat different locations are presented inTable 1.
The nitrogen fertilization trial employed 5 N rates as calciumammonium nitrate (0, 40, 80, 120, and 160 kg N ha-1) with four oatcultivars (Aarre, Katri, Kolbu, and Salo) at two locations (Jokioinenand Ylistaro) during 1997-1999. N fertilization was done beforesowing. The experimental design was split plot with four replications.Rates of N uptake were determined in main plots and oat cultivars insubplots.
Sample Pretreatment.After harvest, the grains were immediatelydried with warm air in a flatbed grain dryer to a moisture content below14%. Yields were sorted with a 1.5 mm sieve to remove shrunken grainsand impurities. A representative grain sample was taken with a grainsample divider. For quality measurements, grain samples were furthersorted with a 2.0 mm sieve and hulled with a laboratory hulling machineBT 459 using air pressure. Broken groats were discarded. Oat groatswere milled with a falling number hammer mill using a 1.0 mm sieve.The samples were stored in plastic containers in a freezer until analysis.
Analytical Methods. Dry weight (dw) was determined by oven-drying (135( 2 °C) 2 g of oatsample for 2 h. Cd was determinedwith the electrothermal atomic absorption (ETAAS) method describedpreviously (22). The method was accredited in 1995. A total of 1-2 gof oat samples were digested in concentrated nitric acid (p.a. Baker)and diluted to 50 mL with MILLI-Q purified water. Cd concentrationswere measured with ETAAS, using a Varian SpectrAA 400 atomicabsorption spectrometer with Zeeman effect background correction.Ammonium phosphate ((NH4)H2 PO4) was used as the matrix modifierand method of additions for calibration. The accuracy of the analyticalmethod was tested by determining certified reference materials in everybatch of samples. The Cd concentrations in ARC/CL wheat flourreference were 0.041( 0.003 mg kg-1 dw (n ) 26) and in NBS 1568arice flour 0.021( 0.003 mg kg-1 dw (n ) 12), certified values being0.039( 0.004 and 0.0225( 0.004 mg kg-1 dw, respectively.
Statistical Methods. The data from different trials were analyzedin four separate parts. In the first part, the differences between thevarieties (data from variety trials) were analyzed, using mixed linearmodels. In the model year, location and trial were analyzed as therandom factor and varieties were analyzed as the fixed factor (23). Inthe second part, differences between six additional cultivars in organiccultivation were analyzed as in part 1. In the third part, the main effectsof farming systems (organic and conventional), cultivars (Veli andPuhti), and their interactions were determined by analyses of varianceaccording to the split plot design. In the analyses, the farming system(as the main plot factor) and cultivar (as the split plot factor) wereanalyzed as the fixed and location (as block factor) and year as therandom factor. In the fourth part, the main effects of N fertilization,cultivars, and their interactions were determined by analyses of varianceaccording to the split plot design. In the analyses, the N fertilization(the main plot factor) and cultivars (subplot factor) were analyzed asthe fixed effects factor and replications and year and location wereanalyzed as random effects. In general, when multiple comparisonprocedures were needed in all parts, Tukey’s HSD method ort-typecontrast examination with 95% confidence intervals was used.
Before performing analysis of variance, assumptions of groupvariances were checked in Box-Cox diagnostic plots. In addition, thenormality assumption of errors was assessed with stem-and-leaf displayand normal probability plot. All analyses were performed by means ofthe SAS statistical package. The MIXED, UNIVARIATE, and GPLOTprocedures were used.
Figure 1. Locations of the trial sites in Finland.
Cadmium Contents of Oat Cultivars J. Agric. Food Chem., Vol. 51, No. 9, 2003 2609
RESULTS AND DISCUSSION
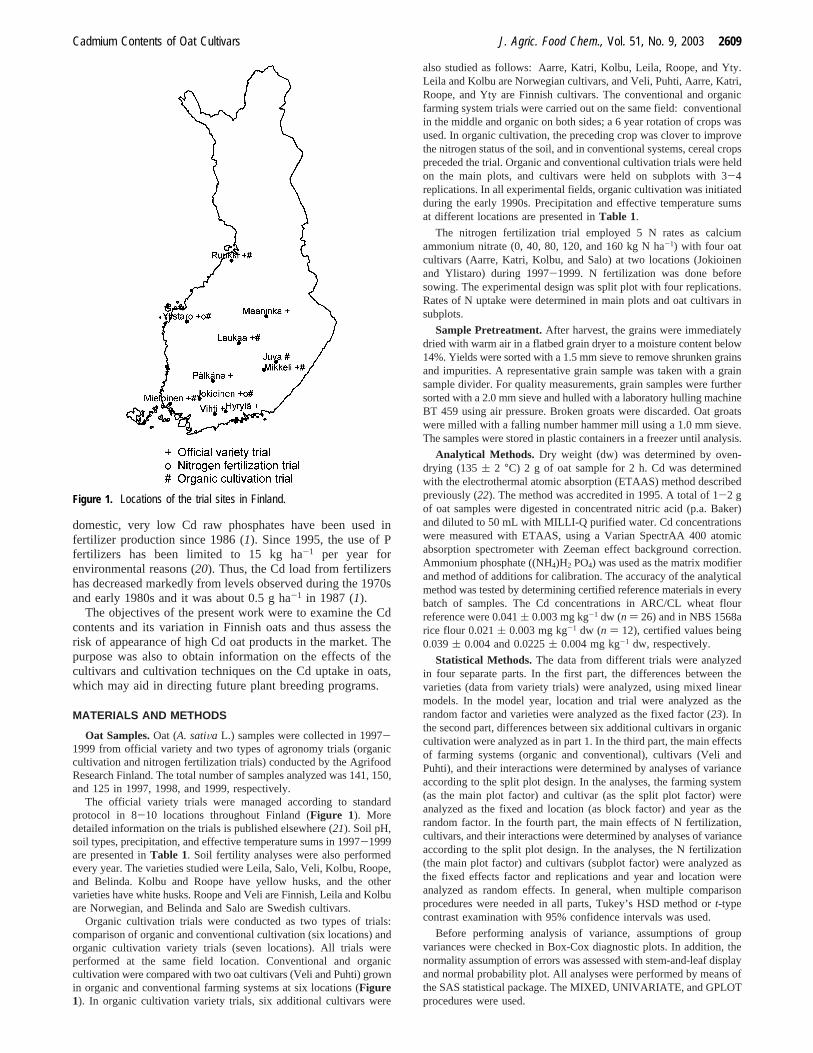
Official Variety Trials. The Cd contents of oat groats duringofficial variety trials varied considerably between the triallocations, the years, and the cultivars (Figure 2). Finnishauthorities have set a maximum Cd content of 0.100 mg kg-1
fresh weight for cereals (about 0.110 mg kg-1 dw), which isalso the maximum level in the EU. The results in this study
were generally well below the critical value, even if presentedon a dw basis. The mean Cd contents in 1997, 1998, and 1999were 0.046, 0.029, and 0.052 mg kg-1 dw, respectively, rangingfrom 0.008 to 0.120 mg kg-1 dw (Table 2). The Cd concentra-tions of oats were similar to those observed in previous studiesfrom Finland (24-27) and various other countries (28-33). Themean Cd concentrations of oat grain found in Finland have
Table 1. Precipitation, Effective Temperature Sum, Soil pH, Soil Type, and Mean Cd Content (mg kg-1 dw) of Oat in Official Variety Trials during1997−1999 at Different Trials Locationsa
location yearprecipitation
May−Aug (mm)effective
temp sumsoilpH soil type
mean Cd content(mg kg-1 dw)
Jokioinen 1997 302 1217 6.3 sandy clay 0.0361998 318 1011 5.8 clay 0.0281999 146 1184 5.7 sandy clay 0.050
Mietoinen 1 1997 232 1285 5.3 clay 0.0671998 245 1036 5.9 sandy clay 0.0441999 92 1236 5.8 sandy clay 0.064
Mietoinen 2 1999 92 1236 6.3 clay 0.092Hyryla 1997 NA NA 6.3 sandy clay loam 0.052
1998 NA NA 6.0 coarse silt 0.024Palkane 1997 253 1250 5.7 fine silt 0.041
1998 339 1043 6.0 fine silt 0.0291999 141 1231 5.9 fine silt 0.081
Mikkeli/Juva 1997 115 1150 6.9 fine sand 0.0351998 337 976 6.0 fine sand 0.0161999 243 1133 6.0 fine sand 0.018
Maaninka 1997 177 1153 5.8 coarse silt 0.0441998 340 938 6.1 coarse silt 0.0271999 183 1134 5.5 coarse silt 0.062
Laukaa 1997 182 1146 6.0 coarse silt 0.0811998 345 916 6.0 coarse silt 0.0671999 175 1112 6.0 coarse silt 0.081
Ylistaro 1 1997 155 1143 6.0 sandy clay loam 0.0241998 372 937 6.2 silty clay 0.0181999 120 1062 6.1 silty clay 0.027
Ylistaro 2 1997 155 1143 5.3 mold 0.0381998 372 937 5.7 mold 0.0191999 120 1062 5.5 mold 0.023
Ruukki 1 1998 439 850 5.9 coarse silt 0.0191999 182 952 5.4 coarse silt 0.021
Ruukki 2 1999 182 952 5.4 mold 0.026Vihti 1998 389 997 5.9 coarse silt 0.018
1999 132 1173 6.2 clay 0.074
a NA, not available.
Figure 2. Cd contents of six oat cultivars across all sites of official variety trials during 1997−1999.
2610 J. Agric. Food Chem., Vol. 51, No. 9, 2003 Eurola et al.
varied between 0.019 and 0.041 mg kg-1 (24-27); in Sweden,0.031-0.042 mg kg-1 (28, 35); The Netherlands, 0.09 mg kg-1
dw (29); and Poland, 0.086-0.108 mg kg-1 (31). However,direct comparison with this study is not possible, because inmany of the studies whole grains instead of hulled grains wereanalyzed. The fertilization levels at research stations also tendto be higher than generally occur in Finland, which may leadto slight misinterpretation of the Cd situation among normalfarming situations.
The variation in the Cd contents of oats between the triallocations and the cultivation years was large. It can be seenthat all of the samples near or exceeding the maximum permittedvalue occurred in the dry, warm growing seasons of 1997 and1999, in cultivars Salo and Kolbu and in southern or centralFinland (Figure 2). The soluble Cd content at the cultivationzone in the trial locations has been monitored during 1992 and1997 (34). In 1997, the mean soluble Cd contents varied between0.03 and 0.15 mg L-1. The lowest Cd concentrations were foundfrom the northern trial locations, Ylistaro and Ruukki (0.03 mgL-1), and highest from the southern and central locations,Palkane (0.15 mg L-1) and Mietoinen (0.11 mg L-1). Thesouthern parts of the country also receive a three times higherdeposition of Cd (0.3 g ha-1, 1997-1999) as compared withnorthern Finland (2). These partly explain the higher Cd contentsobserved in southern trial locations. The soil type, pH, andenvironmental conditions are probably also important factorsaffecting the Cd contents of oats but could not be statisticallytested as variables that were not independent.
In Ylistaro (1997-1999), Ruukki (1999), and Mietoinen(1999), official variety trials were performed in two soil types(Table 1). In Ylistaro (1997-1998) and Ruukki, mold soilsresulted in slightly higher Cd contents of oats than clay or coarse
silt soils, the differences varying between 5 and 30%. However,in Ylistaro (1999), oats grown on mold soils had 19% lowerCd concentrations than clay soil. In Mietoinen (1999), Cdcontents were 30% higher in clay soil than in sandy clay. Thehighest mean Cd concentrations were found in Laukaa (coarsesilt, pH 6.0).
The cool, rainy growing season in 1998 resulted in lower Cdcontents than the dry, warm seasons of 1997 and 1999 (Table1); the reason behind this observation is not clear. In dry growingseasons, the biomass of the oat plant stays smaller than normaland the Cd may be more concentrated in the tissues. Plant rootsystems also may become smaller in waterlogged soils, and thus,Cd uptake may be less. This result is in contrast with Eriksson’s(4) studies, which showed that in high precipitation areas inSweden, the Cd contents of oats tend to be higher than in lowprecipitation parts of the country. According to our results, therisk of higher Cd contents in oats in Finland appears to growduring dry and warm growing seasons. However, further studiesare needed.
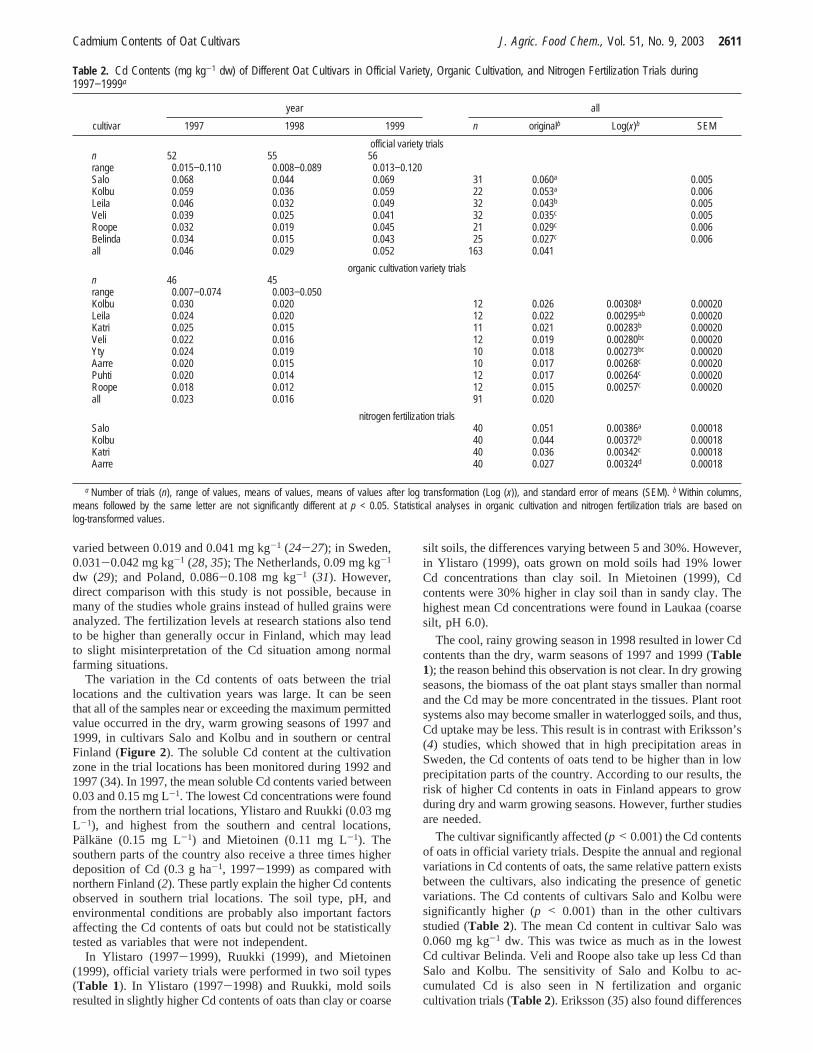
The cultivar significantly affected (p < 0.001) the Cd contentsof oats in official variety trials. Despite the annual and regionalvariations in Cd contents of oats, the same relative pattern existsbetween the cultivars, also indicating the presence of geneticvariations. The Cd contents of cultivars Salo and Kolbu weresignificantly higher (p < 0.001) than in the other cultivarsstudied (Table 2). The mean Cd content in cultivar Salo was0.060 mg kg-1 dw. This was twice as much as in the lowestCd cultivar Belinda. Veli and Roope also take up less Cd thanSalo and Kolbu. The sensitivity of Salo and Kolbu to ac-cumulated Cd is also seen in N fertilization and organiccultivation trials (Table 2). Eriksson (35) also found differences
Table 2. Cd Contents (mg kg-1 dw) of Different Oat Cultivars in Official Variety, Organic Cultivation, and Nitrogen Fertilization Trials during1997−1999a
year all
cultivar 1997 1998 1999 n originalb Log(x)b SEM
official variety trialsn 52 55 56range 0.015−0.110 0.008−0.089 0.013−0.120Salo 0.068 0.044 0.069 31 0.060a 0.005Kolbu 0.059 0.036 0.059 22 0.053a 0.006Leila 0.046 0.032 0.049 32 0.043b 0.005Veli 0.039 0.025 0.041 32 0.035c 0.005Roope 0.032 0.019 0.045 21 0.029c 0.006Belinda 0.034 0.015 0.043 25 0.027c 0.006all 0.046 0.029 0.052 163 0.041
organic cultivation variety trialsn 46 45range 0.007−0.074 0.003−0.050Kolbu 0.030 0.020 12 0.026 0.00308a 0.00020Leila 0.024 0.020 12 0.022 0.00295ab 0.00020Katri 0.025 0.015 11 0.021 0.00283b 0.00020Veli 0.022 0.016 12 0.019 0.00280bc 0.00020Yty 0.024 0.019 10 0.018 0.00273bc 0.00020Aarre 0.020 0.015 10 0.017 0.00268c 0.00020Puhti 0.020 0.014 12 0.017 0.00264c 0.00020Roope 0.018 0.012 12 0.015 0.00257c 0.00020all 0.023 0.016 91 0.020
nitrogen fertilization trialsSalo 40 0.051 0.00386a 0.00018Kolbu 40 0.044 0.00372b 0.00018Katri 40 0.036 0.00342c 0.00018Aarre 40 0.027 0.00324d 0.00018
a Number of trials (n), range of values, means of values, means of values after log transformation (Log (x)), and standard error of means (SEM). b Within columns,means followed by the same letter are not significantly different at p < 0.05. Statistical analyses in organic cultivation and nitrogen fertilization trials are based onlog-transformed values.
Cadmium Contents of Oat Cultivars J. Agric. Food Chem., Vol. 51, No. 9, 2003 2611
among Cd contents of oat cultivars. These differences permitdevelopment of cultivars with lower tendency to accumulateCd.
The effect of hulling on the Cd content was tested byanalyzing both groats and whole grains of the same sample.The groats resulted in about 16% higher Cd contents than wholegrains (Table 3). This means that the husks do not contain asmuch Cd as groats and that it is not possible to reduce the Cdcontent of oats by hulling.
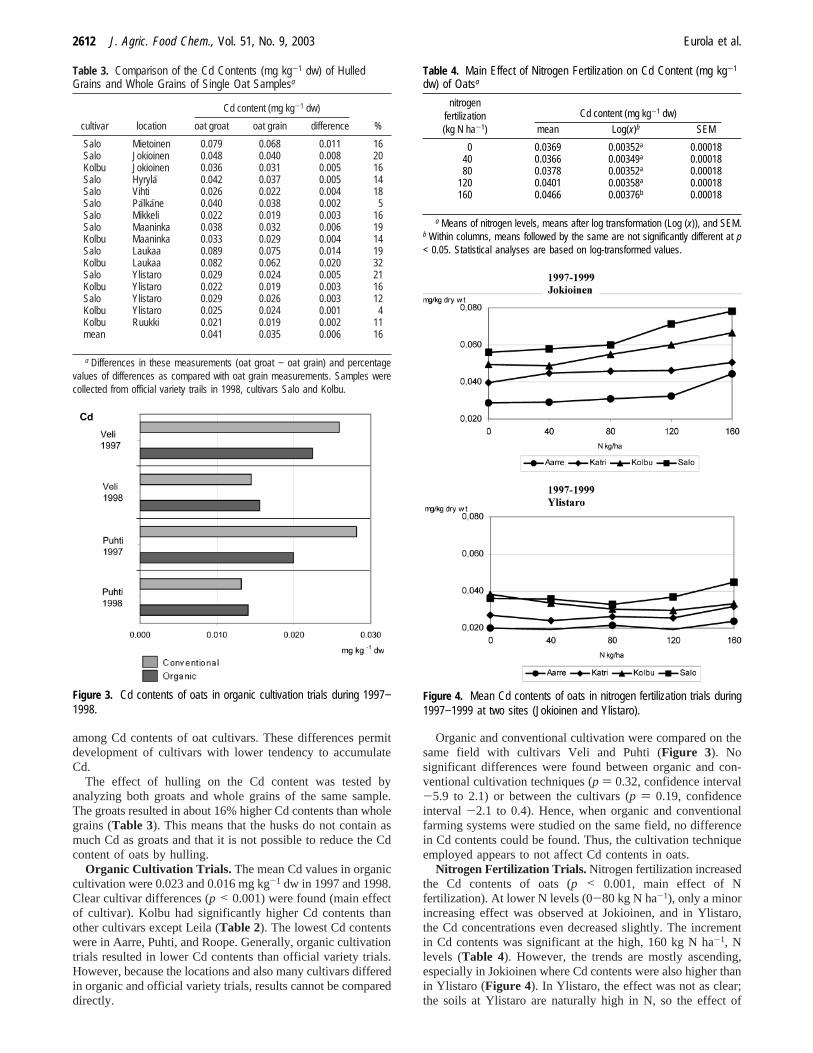
Organic Cultivation Trials. The mean Cd values in organiccultivation were 0.023 and 0.016 mg kg-1 dw in 1997 and 1998.Clear cultivar differences (p < 0.001) were found (main effectof cultivar). Kolbu had significantly higher Cd contents thanother cultivars except Leila (Table 2). The lowest Cd contentswere in Aarre, Puhti, and Roope. Generally, organic cultivationtrials resulted in lower Cd contents than official variety trials.However, because the locations and also many cultivars differedin organic and official variety trials, results cannot be compareddirectly.
Organic and conventional cultivation were compared on thesame field with cultivars Veli and Puhti (Figure 3). Nosignificant differences were found between organic and con-ventional cultivation techniques (p ) 0.32, confidence interval-5.9 to 2.1) or between the cultivars (p ) 0.19, confidenceinterval -2.1 to 0.4). Hence, when organic and conventionalfarming systems were studied on the same field, no differencein Cd contents could be found. Thus, the cultivation techniqueemployed appears to not affect Cd contents in oats.
Nitrogen Fertilization Trials. Nitrogen fertilization increasedthe Cd contents of oats (p < 0.001, main effect of Nfertilization). At lower N levels (0-80 kg N ha-1), only a minorincreasing effect was observed at Jokioinen, and in Ylistaro,the Cd concentrations even decreased slightly. The incrementin Cd contents was significant at the high, 160 kg N ha-1, Nlevels (Table 4). However, the trends are mostly ascending,especially in Jokioinen where Cd contents were also higher thanin Ylistaro (Figure 4). In Ylistaro, the effect was not as clear;the soils at Ylistaro are naturally high in N, so the effect of
Table 3. Comparison of the Cd Contents (mg kg-1 dw) of HulledGrains and Whole Grains of Single Oat Samplesa
Cd content (mg kg-1 dw)
cultivar location oat groat oat grain difference %
Salo Mietoinen 0.079 0.068 0.011 16Salo Jokioinen 0.048 0.040 0.008 20Kolbu Jokioinen 0.036 0.031 0.005 16Salo Hyryla 0.042 0.037 0.005 14Salo Vihti 0.026 0.022 0.004 18Salo Palkane 0.040 0.038 0.002 5Salo Mikkeli 0.022 0.019 0.003 16Salo Maaninka 0.038 0.032 0.006 19Kolbu Maaninka 0.033 0.029 0.004 14Salo Laukaa 0.089 0.075 0.014 19Kolbu Laukaa 0.082 0.062 0.020 32Salo Ylistaro 0.029 0.024 0.005 21Kolbu Ylistaro 0.022 0.019 0.003 16Salo Ylistaro 0.029 0.026 0.003 12Kolbu Ylistaro 0.025 0.024 0.001 4Kolbu Ruukki 0.021 0.019 0.002 11mean 0.041 0.035 0.006 16
a Differences in these measurements (oat groat − oat grain) and percentagevalues of differences as compared with oat grain measurements. Samples werecollected from official variety trails in 1998, cultivars Salo and Kolbu.
Figure 3. Cd contents of oats in organic cultivation trials during 1997−1998.
Table 4. Main Effect of Nitrogen Fertilization on Cd Content (mg kg-1
dw) of Oatsa
Cd content (mg kg-1 dw)nitrogen
fertilization(kg N ha-1) mean Log(x)b SEM
0 0.0369 0.00352a 0.0001840 0.0366 0.00349a 0.0001880 0.0378 0.00352a 0.00018
120 0.0401 0.00358a 0.00018160 0.0466 0.00376b 0.00018
a Means of nitrogen levels, means after log transformation (Log (x)), and SEM.b Within columns, means followed by the same are not significantly different at p< 0.05. Statistical analyses are based on log-transformed values.
Figure 4. Mean Cd contents of oats in nitrogen fertilization trials during1997−1999 at two sites (Jokioinen and Ylistaro).
2612 J. Agric. Food Chem., Vol. 51, No. 9, 2003 Eurola et al.
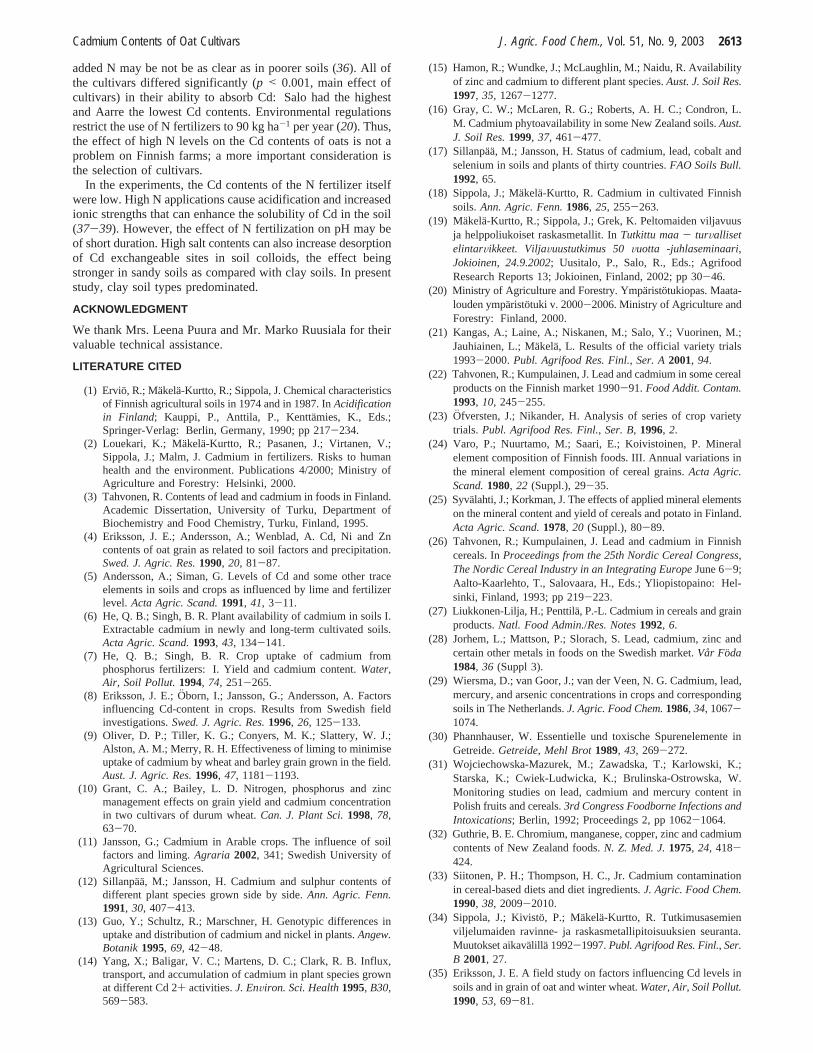
added N may be not be as clear as in poorer soils (36). All ofthe cultivars differed significantly (p < 0.001, main effect ofcultivars) in their ability to absorb Cd: Salo had the highestand Aarre the lowest Cd contents. Environmental regulationsrestrict the use of N fertilizers to 90 kg ha-1 per year (20). Thus,the effect of high N levels on the Cd contents of oats is not aproblem on Finnish farms; a more important consideration isthe selection of cultivars.
In the experiments, the Cd contents of the N fertilizer itselfwere low. High N applications cause acidification and increasedionic strengths that can enhance the solubility of Cd in the soil(37-39). However, the effect of N fertilization on pH may beof short duration. High salt contents can also increase desorptionof Cd exchangeable sites in soil colloids, the effect beingstronger in sandy soils as compared with clay soils. In presentstudy, clay soil types predominated.
ACKNOWLEDGMENT
We thank Mrs. Leena Puura and Mr. Marko Ruusiala for theirvaluable technical assistance.
LITERATURE CITED
(1) Ervio, R.; Makela-Kurtto, R.; Sippola, J. Chemical characteristicsof Finnish agricultural soils in 1974 and in 1987. InAcidificationin Finland; Kauppi, P., Anttila, P., Kentta¨mies, K., Eds.;Springer-Verlag: Berlin, Germany, 1990; pp 217-234.
(2) Louekari, K.; Makela-Kurtto, R.; Pasanen, J.; Virtanen, V.;Sippola, J.; Malm, J. Cadmium in fertilizers. Risks to humanhealth and the environment. Publications 4/2000; Ministry ofAgriculture and Forestry: Helsinki, 2000.
(3) Tahvonen, R. Contents of lead and cadmium in foods in Finland.Academic Dissertation, University of Turku, Department ofBiochemistry and Food Chemistry, Turku, Finland, 1995.
(4) Eriksson, J. E.; Andersson, A.; Wenblad, A. Cd, Ni and Zncontents of oat grain as related to soil factors and precipitation.Swed. J. Agric. Res.1990, 20, 81-87.
(5) Andersson, A.; Siman, G. Levels of Cd and some other traceelements in soils and crops as influenced by lime and fertilizerlevel. Acta Agric. Scand.1991, 41, 3-11.
(6) He, Q. B.; Singh, B. R. Plant availability of cadmium in soils I.Extractable cadmium in newly and long-term cultivated soils.Acta Agric. Scand.1993, 43, 134-141.
(7) He, Q. B.; Singh, B. R. Crop uptake of cadmium fromphosphorus fertilizers: I. Yield and cadmium content.Water,Air, Soil Pollut. 1994, 74, 251-265.
(8) Eriksson, J. E.; O¨ born, I.; Jansson, G.; Andersson, A. Factorsinfluencing Cd-content in crops. Results from Swedish fieldinvestigations.Swed. J. Agric. Res.1996, 26, 125-133.
(9) Oliver, D. P.; Tiller, K. G.; Conyers, M. K.; Slattery, W. J.;Alston, A. M.; Merry, R. H. Effectiveness of liming to minimiseuptake of cadmium by wheat and barley grain grown in the field.Aust. J. Agric. Res.1996, 47, 1181-1193.
(10) Grant, C. A.; Bailey, L. D. Nitrogen, phosphorus and zincmanagement effects on grain yield and cadmium concentrationin two cultivars of durum wheat.Can. J. Plant Sci.1998, 78,63-70.
(11) Jansson, G.; Cadmium in Arable crops. The influence of soilfactors and liming.Agraria 2002, 341; Swedish University ofAgricultural Sciences.
(12) Sillanpaa, M.; Jansson, H. Cadmium and sulphur contents ofdifferent plant species grown side by side.Ann. Agric. Fenn.1991, 30, 407-413.
(13) Guo, Y.; Schultz, R.; Marschner, H. Genotypic differences inuptake and distribution of cadmium and nickel in plants.Angew.Botanik1995, 69, 42-48.
(14) Yang, X.; Baligar, V. C.; Martens, D. C.; Clark, R. B. Influx,transport, and accumulation of cadmium in plant species grownat different Cd 2+ activities.J. EnViron. Sci. Health1995, B30,569-583.
(15) Hamon, R.; Wundke, J.; McLaughlin, M.; Naidu, R. Availabilityof zinc and cadmium to different plant species.Aust. J. Soil Res.1997, 35, 1267-1277.
(16) Gray, C. W.; McLaren, R. G.; Roberts, A. H. C.; Condron, L.M. Cadmium phytoavailability in some New Zealand soils.Aust.J. Soil Res.1999, 37, 461-477.
(17) Sillanpaa, M.; Jansson, H. Status of cadmium, lead, cobalt andselenium in soils and plants of thirty countries.FAO Soils Bull.1992, 65.
(18) Sippola, J.; Ma¨kela-Kurtto, R. Cadmium in cultivated Finnishsoils.Ann. Agric. Fenn.1986, 25, 255-263.
(19) Makela-Kurtto, R.; Sippola, J.; Grek, K. Peltomaiden viljavuusja helppoliukoiset raskasmetallit. InTutkittu maa- turVallisetelintarVikkeet. ViljaVuustutkimus 50Vuotta -juhlaseminaari,Jokioinen, 24.9.2002; Uusitalo, P., Salo, R., Eds.; AgrifoodResearch Reports 13; Jokioinen, Finland, 2002; pp 30-46.
(20) Ministry of Agriculture and Forestry. Ympa¨ristotukiopas. Maata-louden ympa¨ristotuki v. 2000-2006. Ministry of Agriculture andForestry: Finland, 2000.
(21) Kangas, A.; Laine, A.; Niskanen, M.; Salo, Y.; Vuorinen, M.;Jauhiainen, L.; Ma¨kela, L. Results of the official variety trials1993-2000.Publ. Agrifood Res. Finl., Ser. A2001, 94.
(22) Tahvonen, R.; Kumpulainen, J. Lead and cadmium in some cerealproducts on the Finnish market 1990-91.Food Addit. Contam.1993, 10, 245-255.
(23) Ofversten, J.; Nikander, H. Analysis of series of crop varietytrials. Publ. Agrifood Res. Finl., Ser. B, 1996, 2.
(24) Varo, P.; Nuurtamo, M.; Saari, E.; Koivistoinen, P. Mineralelement composition of Finnish foods. III. Annual variations inthe mineral element composition of cereal grains.Acta Agric.Scand.1980, 22 (Suppl.), 29-35.
(25) Syvalahti, J.; Korkman, J. The effects of applied mineral elementson the mineral content and yield of cereals and potato in Finland.Acta Agric. Scand.1978, 20 (Suppl.), 80-89.
(26) Tahvonen, R.; Kumpulainen, J. Lead and cadmium in Finnishcereals. InProceedings from the 25th Nordic Cereal Congress,The Nordic Cereal Industry in an Integrating EuropeJune 6-9;Aalto-Kaarlehto, T., Salovaara, H., Eds.; Yliopistopaino: Hel-sinki, Finland, 1993; pp 219-223.
(27) Liukkonen-Lilja, H.; Penttila¨, P.-L. Cadmium in cereals and grainproducts.Natl. Food Admin./Res. Notes1992, 6.
(28) Jorhem, L.; Mattson, P.; Slorach, S. Lead, cadmium, zinc andcertain other metals in foods on the Swedish market.Vår Foda1984, 36 (Suppl 3).
(29) Wiersma, D.; van Goor, J.; van der Veen, N. G. Cadmium, lead,mercury, and arsenic concentrations in crops and correspondingsoils in The Netherlands.J. Agric. Food Chem.1986, 34, 1067-1074.
(30) Phannhauser, W. Essentielle und toxische Spurenelemente inGetreide.Getreide, Mehl Brot 1989, 43, 269-272.
(31) Wojciechowska-Mazurek, M.; Zawadska, T.; Karlowski, K.;Starska, K.; Cwiek-Ludwicka, K.; Brulinska-Ostrowska, W.Monitoring studies on lead, cadmium and mercury content inPolish fruits and cereals.3rd Congress Foodborne Infections andIntoxications; Berlin, 1992; Proceedings 2, pp 1062-1064.
(32) Guthrie, B. E. Chromium, manganese, copper, zinc and cadmiumcontents of New Zealand foods.N. Z. Med. J.1975, 24, 418-424.
(33) Siitonen, P. H.; Thompson, H. C., Jr. Cadmium contaminationin cereal-based diets and diet ingredients. J. Agric. Food Chem.1990, 38, 2009-2010.
(34) Sippola, J.; Kivisto¨, P.; Makela-Kurtto, R. Tutkimusasemienviljelumaiden ravinne- ja raskasmetallipitoisuuksien seuranta.Muutokset aikava¨lilla 1992-1997.Publ. Agrifood Res. Finl., Ser.B 2001, 27.
(35) Eriksson, J. E. A field study on factors influencing Cd levels insoils and in grain of oat and winter wheat.Water, Air, Soil Pollut.1990, 53, 69-81.
Cadmium Contents of Oat Cultivars J. Agric. Food Chem., Vol. 51, No. 9, 2003 2613
(36) Kankanen, H.; Kangas, A.; Mela, T.; Nikunen, U.; Tuuri, H.;Vuorinen, M. Timing incorporation of different green manurecrops to minimize the risk of nitrogen leaching.Agric. FoodSci. Finl. 1998, 7, 553-567.
(37) Grant, C. A.; Bailey, L. D. Nitrogen, phosphorus and zincmanagement effects on grain yields and cadmium concentrationin two cultivars of durum wheat.Can. J. Plant Sci.1998, 78,63-70.
(38) Eriksson, J. E. Factors influencing adsorption and plant uptakeof cadmium from Agricultural soils.Swed. UniV. Agric. Sci.,Rep. Dissertations1990, 4.
(39) Jahn-Deesbach, W.; Schipper, A.; Heck, H. Cadmium-Gehaltein Weizen in Abha¨ngigkeit von Sorte und Umwelt.Getreide,Mehl Brot 1994, 48, 26-30.
Received for review August 14, 2002. Accepted January 27, 2003. Thisstudy was financially supported by the Ministry of Agriculture andForestry and the Finnish food and feed industry: Kemira Agro Oy,Suomen Viljava Ltd. and Raisio Group.
JF020893+
2614 J. Agric. Food Chem., Vol. 51, No. 9, 2003 Eurola et al.