cadbury plc creating local brands globally€¦ · cadbury has been ranked as the fifth most...
TRANSCRIPT

Cadbury Plc –
Creating Local
Brands Globally
__________________
www.solvemyassignment.com
2
I, the undersigned, assert that this dissertation is my own work, and I give the authorization to photocopy it or use it for inter-library loan.
Signature:…………………………. Date:………………………
www.solvemyassignment.com
3
ACKNOWLEDGEMENTS
I would take this opportunity to thank all my tutors for extending their invaluable
support over this period of 4 years and my parents for their encouragement, without
which this work seemed impossible.
I would like to heartily thank my teacher whose enormous support, belief and
motivation has been a guiding force for me throughout this dissertation.
I am also grateful to my family, friends and everyone who helped me in my research
and dedicated their time to answer the questionnaires of this project.
Last, but not the least, I wish to thank all the marketing lecturers and ASK, for their
advice and presentations which made my marketing concepts crystal clear.
Thank You.
www.solvemyassignment.com
4
ABSTRACT
Today‟s era is characterized by rapidly changing consumer tastes and preferences. In
this scenario, marketers strive to delight the customers, rather than merely satisfying
them, by delivering more than the consumer can expect. This study aims to analyze
the effectiveness of the branding & marketing strategies of the top confectionery
brand in the UK – Cadbury Plc, and the competitive advantage that accrues to
Cadbury, because of its differentiation strategy, in this oligopoly market.
Cadbury has been ranked as the fifth most popular brand in the UK as per a survey
conducted by Nielsen (2010). It operates in more than sixty markets, and occupies the
top or the second slot in more than a score of the world‟s confectionery markets. This
report is focused on the UK market and utilizes primary research data to gain insights
about the attributes of the brand which make it a popular household name.
www.solvemyassignment.com
5
Table of Contents 1. Introduction
1.1 Landscape of UK‟s confectionery market…………………………………..……8
1.2 The Journey of Cadbury Plc………………………………………………..…9-10
1.3 Aims & Objectives…………………………………………………………...…10
1.4 Dissertation Structure…………………………………………………………...11
2. Literature Review
2.1 Defining Brand………………………………………………………………12-13
2.2 Dimensions of Brand…………………… …………………………………13-15
2.3 Benefits of Branding… ………………………………………………………. 16
2.4 Capitalizing Brand Equity through Brand Extensions…… ……………….16-18
3. Research Methodology
3.1 Data Collection Methods……………………………………………………… 19
3.2 Use of Ordinal Data… ……………… …………… …………………………. 19
3.3 Designing the questionnaire ……………………………………………………..20
3.4 Pilot tests……………… …………………………………………………….20-21
3.5 Administering the final questionnaire……………………………………………21
www.solvemyassignment.com
6
4. Data Analysis
4.1 Demographics of the sample surveyed……………………………………….22-23
4.2 Consumption patterns of the sample surveyed ………………………………23-25
4.3 Consumer‟s Preference of Brands …………… ………………… ………… 25-27
4.4 The Top Chocolate Brands of the UK………………….. ………………….27-29
4.5 Analyzing the Brand Building Process of Cadbury
4.5.1 Analyzing the Brand Attributes contributing to Cadbury‟s popularity
4.5.1.1 Statistical Tools Used …………… ……….. ……………..30-32
4.5.1.2 Results computed from the survey data …………………..32-35
4.5.2 Brand Positioning of Cadburys… ……………………….. ……35-36
4.5.3 Brand Extension by Cadburys…………… …………………………37- 38
4.6 A Snapshot of the 4-Ps of marketing of Cadburys… ……………………. …38-39
5. Conclusion
5.1 Summary of the findings…………………… . …………………………………40
5.2 The Road Ahead for Cadbury……………….. ………………………………40-41
5.3 Limitations & Recommendations………………. ………………………………42
References………….. ………………. ………………………. …… ………….43-46
www.solvemyassignment.com
7
Appendix
1. Product Map of Cadbury……… …………………………………………… …47
2. Pilot Questionnaire………… ….. …………………………………………..48-53
3. Final Questionnaire……………………………………. …………………….54-59
4. Computation of Rank Correlation Coefficient between rank to Cadbury & its attribute Packaging…… ………………………………………………60-61
5. Computation of Rank Correlation Coefficient between rank to Cadbury
& its attribute Quick Reach……………………………………………… … 62-63
6. Computation of Rank Correlation Coefficient between rank to Cadbury
& its attribute Quality ………………………………………………………64-65
7. Computation of Rank Correlation Coefficient between rank to Cadbury & its attribute Budget Friendly……………………………………………….66-67
8. Computation of Rank Correlation Coefficient between rank to Cadbury & its attribute Availability in Various Sizes…… …………………………..68-69
9. Computation of Rank Correlation Coefficient between rank to Cadbury
& its attribute Taste…… ……………………………………………………70-71
10. Computation of Rank Correlation Coefficient between rank to Cadbury
& its attribute Nutrition & Health…………………………………………… 72-73
11. Computation of Rank Correlation Coefficient between rank to Cadbury
& its attribute Availability of Variants………… …………………………..74-75
12. Computation of Rank Correlation Coefficient between rank to Cadbury & its attribute Innovation…… ……………………………………………...76-77
13. Brand Positioning Map of Cadbury………………………………………… …78
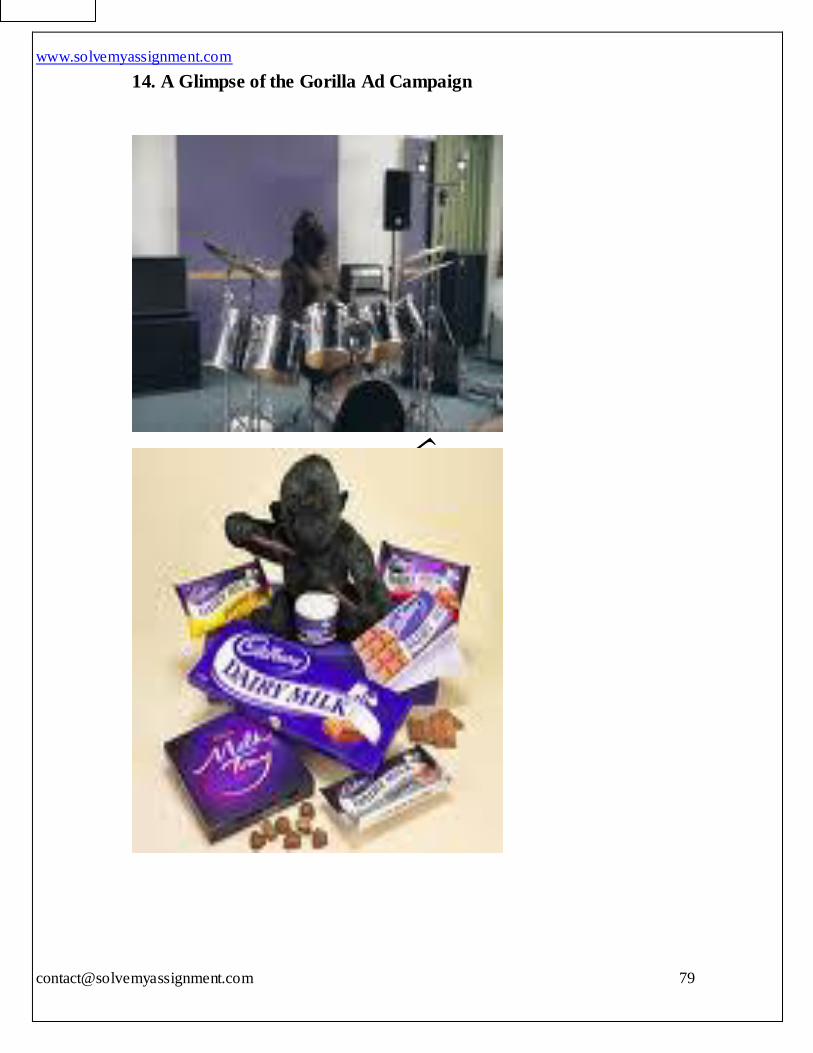
14. A Glimpse of the Gorilla Ad Campaign…… ………………… ………………79
www.solvemyassignment.com
8
1. Introduction
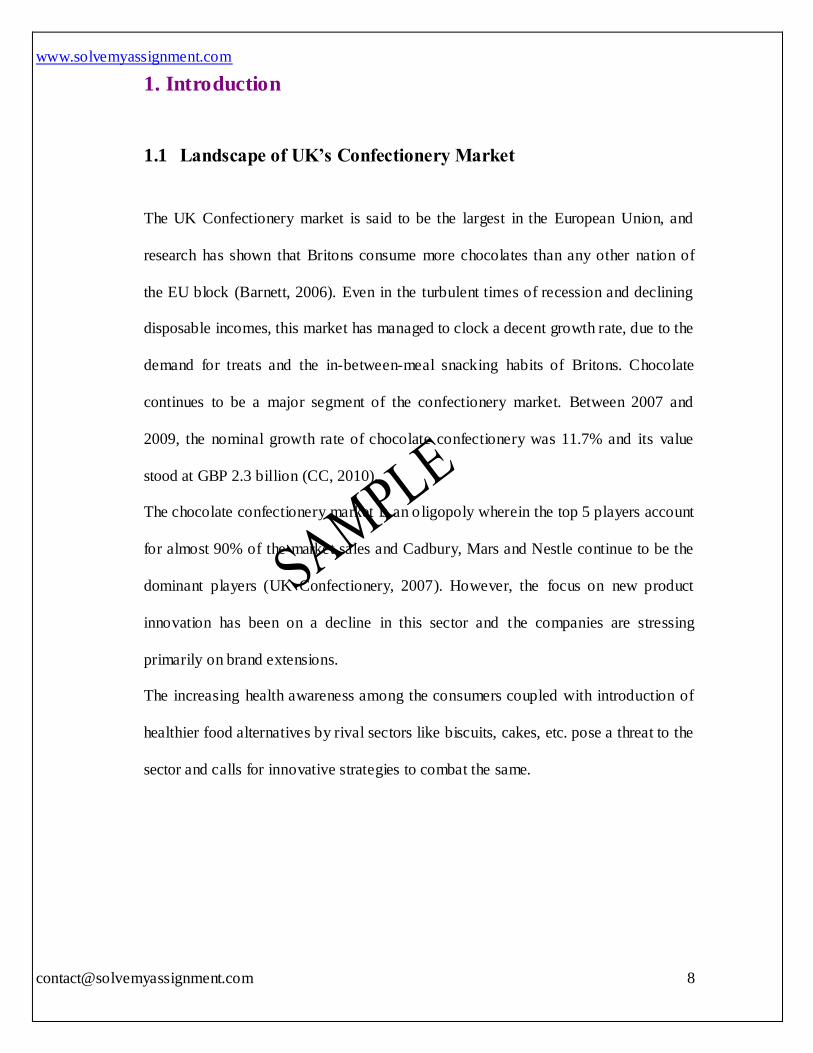
1.1 Landscape of UK’s Confectionery Market
The UK Confectionery market is said to be the largest in the European Union, and
research has shown that Britons consume more chocolates than any other nation of
the EU block (Barnett, 2006). Even in the turbulent times of recession and declining
disposable incomes, this market has managed to clock a decent growth rate, due to the
demand for treats and the in-between-meal snacking habits of Britons. Chocolate
continues to be a major segment of the confectionery market. Between 2007 and
2009, the nominal growth rate of chocolate confectionery was 11.7% and its value
stood at GBP 2.3 billion (CC, 2010).
The chocolate confectionery market is an oligopoly wherein the top 5 players account
for almost 90% of the market sales and Cadbury, Mars and Nestle continue to be the
dominant players (UK Confectionery, 2007). However, the focus on new product
innovation has been on a decline in this sector and the companies are stressing
primarily on brand extensions.
The increasing health awareness among the consumers coupled with introduction of
healthier food alternatives by rival sectors like biscuits, cakes, etc. pose a threat to the
sector and calls for innovative strategies to combat the same.
www.solvemyassignment.com
9
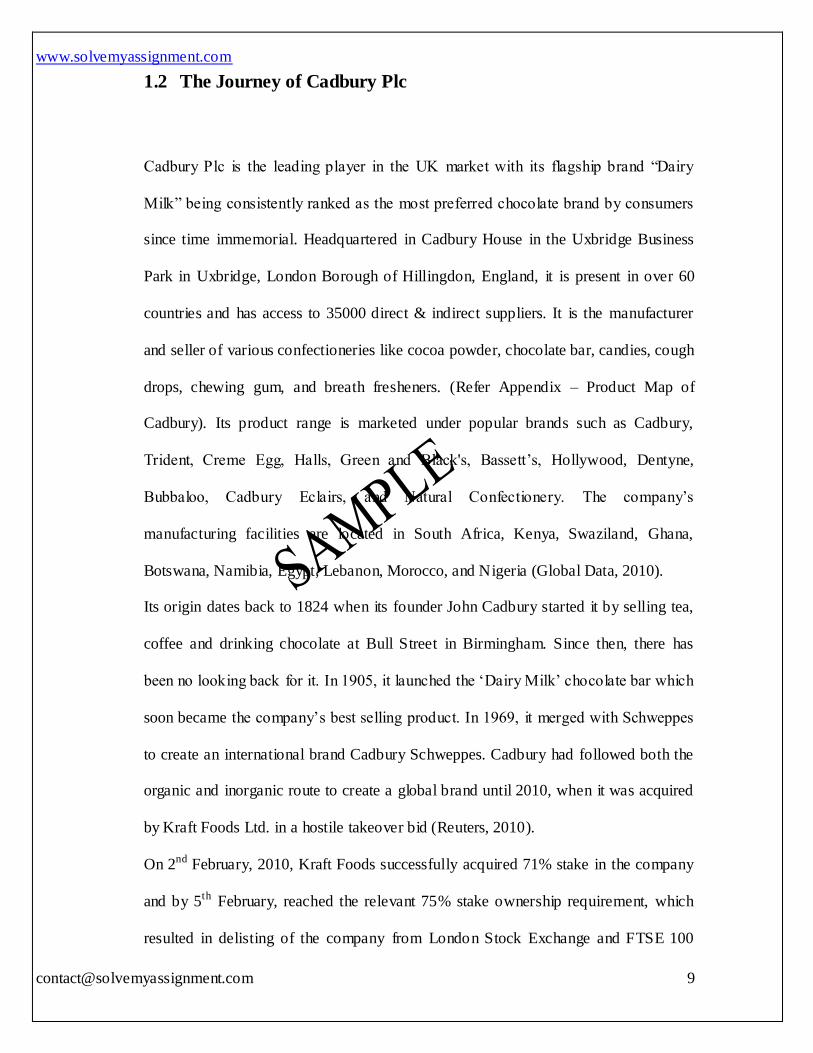
1.2 The Journey of Cadbury Plc
Cadbury Plc is the leading player in the UK market with its flagship brand “Dairy
Milk” being consistently ranked as the most preferred chocolate brand by consumers
since time immemorial. Headquartered in Cadbury House in the Uxbridge Business
Park in Uxbridge, London Borough of Hillingdon, England, it is present in over 60
countries and has access to 35000 direct & indirect suppliers. It is the manufacturer
and seller of various confectioneries like cocoa powder, chocolate bar, candies, cough
drops, chewing gum, and breath fresheners. (Refer Appendix – Product Map of
Cadbury). Its product range is marketed under popular brands such as Cadbury,
Trident, Creme Egg, Halls, Green and Black's, Bassett‟s, Hollywood, Dentyne,
Bubbaloo, Cadbury Eclairs, and Natural Confectionery. The company‟s
manufacturing facilities are located in South Africa, Kenya, Swaziland, Ghana,
Botswana, Namibia, Egypt, Lebanon, Morocco, and Nigeria (Global Data, 2010).
Its origin dates back to 1824 when its founder John Cadbury started it by selling tea,
coffee and drinking chocolate at Bull Street in Birmingham. Since then, there has
been no looking back for it. In 1905, it launched the „Dairy Milk‟ chocolate bar which
soon became the company‟s best selling product. In 1969, it merged with Schweppes
to create an international brand Cadbury Schweppes. Cadbury had followed both the
organic and inorganic route to create a global brand until 2010, when it was acquired
by Kraft Foods Ltd. in a hostile takeover bid (Reuters, 2010).
On 2nd February, 2010, Kraft Foods successfully acquired 71% stake in the company
and by 5th February, reached the relevant 75% stake ownership requirement, which
resulted in delisting of the company from London Stock Exchange and FTSE 100
www.solvemyassignment.com
10
Index (BBC News, 2010). The company was a constituent of the index since the
index‟s inception in 1984. The deal was valued at a whooping $18.9 billion.
Today the combined Cadbury-Kraft entity is the second largest confectionery giant
globally after Mars – Wrigley (Kraft Foods, 2010). Kraft has retained the Cadbury
brand and is aiming to capitalize on the synergistic benefits of the deal and the
Cadbury brand.
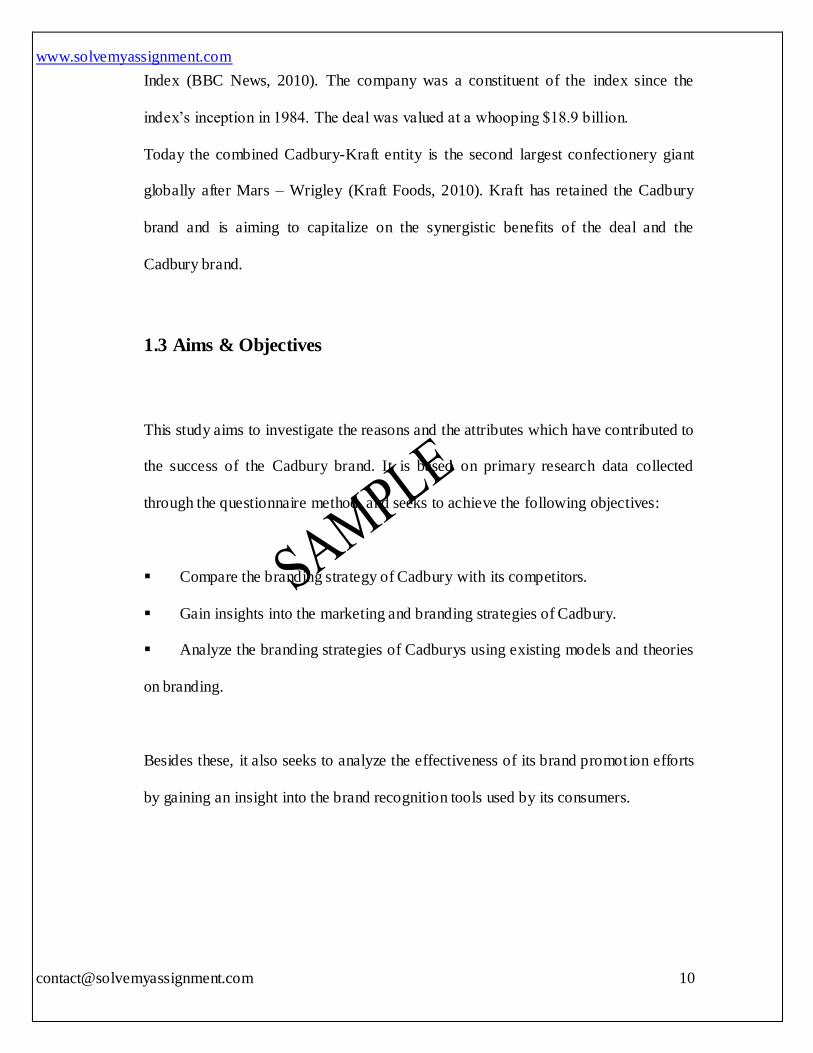
1.3 Aims & Objectives
This study aims to investigate the reasons and the attributes which have contributed to
the success of the Cadbury brand. It is based on primary research data collected
through the questionnaire method, and seeks to achieve the following objectives:
Compare the branding strategy of Cadbury with its competitors.
Gain insights into the marketing and branding strategies of Cadbury.
Analyze the branding strategies of Cadburys using existing models and theories
on branding.
Besides these, it also seeks to analyze the effectiveness of its brand promotion efforts
by gaining an insight into the brand recognition tools used by its consumers.
www.solvemyassignment.com
11
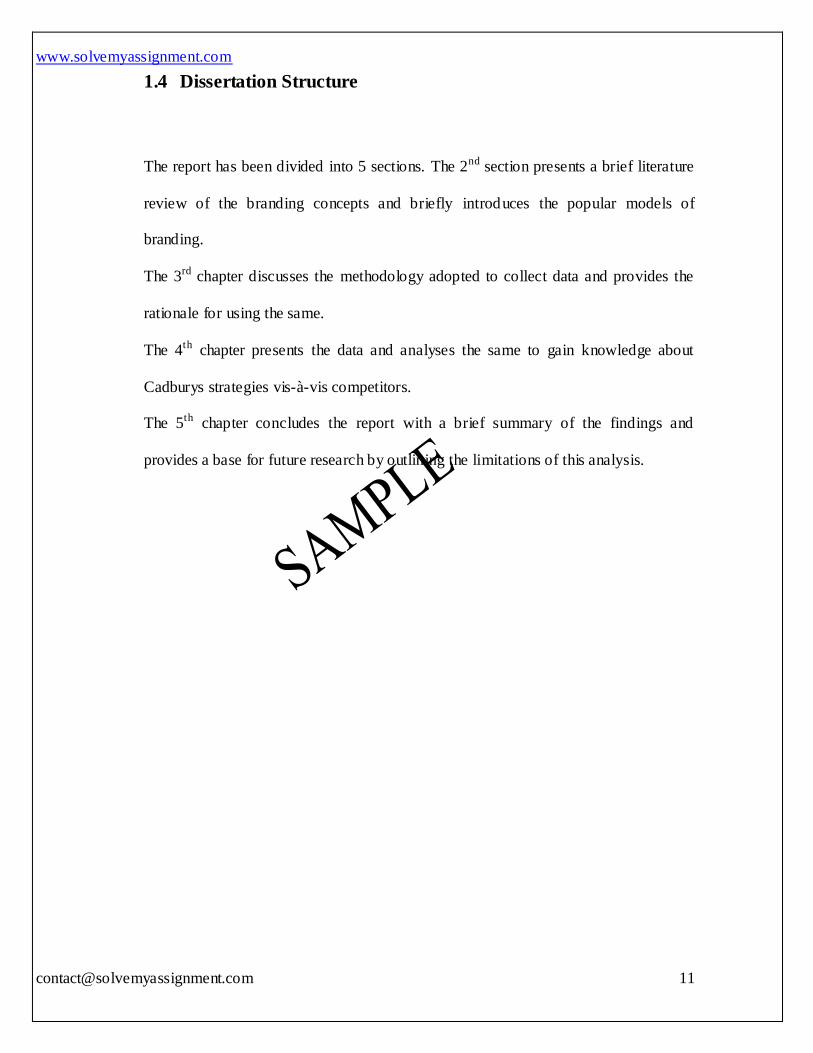
1.4 Dissertation Structure
The report has been divided into 5 sections. The 2nd section presents a brief literature
review of the branding concepts and briefly introduces the popular models of
branding.
The 3rd chapter discusses the methodology adopted to collect data and provides the
rationale for using the same.
The 4th chapter presents the data and analyses the same to gain knowledge about
Cadburys strategies vis-à-vis competitors.
The 5th chapter concludes the report with a brief summary of the findings and
provides a base for future research by outlining the limitations of this analysis.
www.solvemyassignment.com
12
2. Literature Review
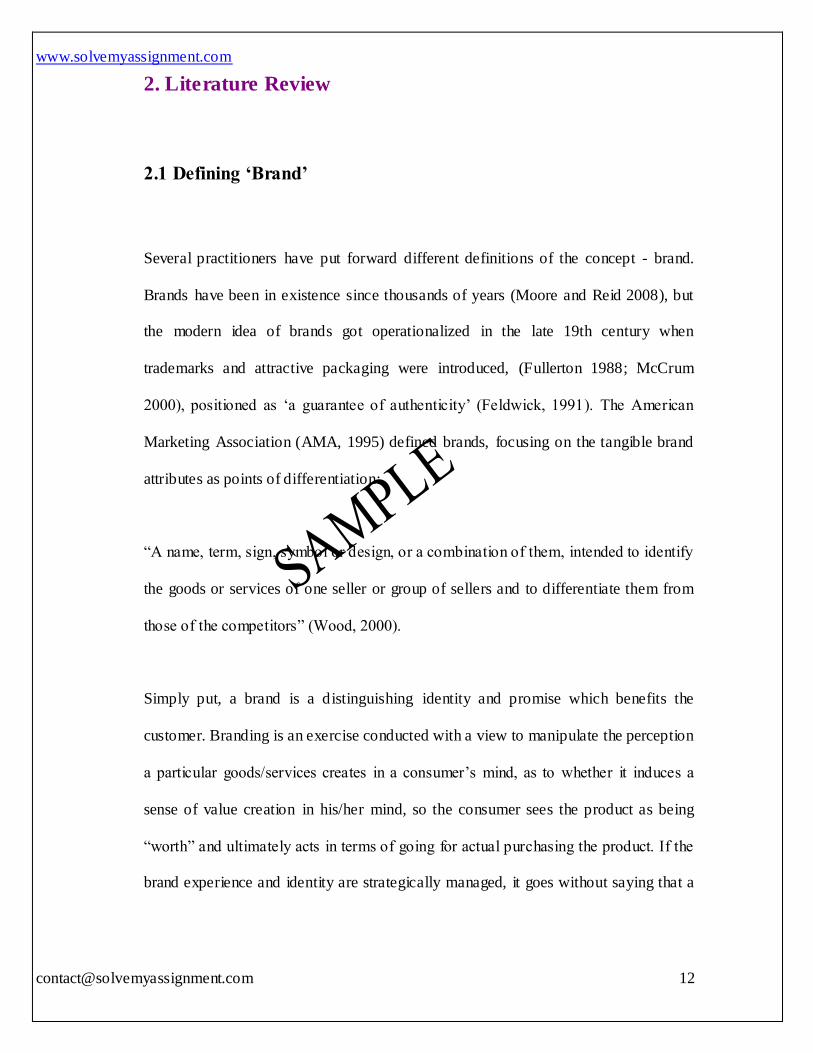
2.1 Defining ‘Brand’
Several practitioners have put forward different definitions of the concept - brand.
Brands have been in existence since thousands of years (Moore and Reid 2008), but
the modern idea of brands got operationalized in the late 19th century when
trademarks and attractive packaging were introduced, (Fullerton 1988; McCrum
2000), positioned as „a guarantee of authenticity‟ (Feldwick, 1991). The American
Marketing Association (AMA, 1995) defined brands, focusing on the tangible brand
attributes as points of differentiation:
“A name, term, sign, symbol or design, or a combination of them, intended to identify
the goods or services of one seller or group of sellers and to differentiate them from
those of the competitors” (Wood, 2000).
Simply put, a brand is a distinguishing identity and promise which benefits the
customer. Branding is an exercise conducted with a view to manipulate the perception
a particular goods/services creates in a consumer‟s mind, as to whether it induces a
sense of value creation in his/her mind, so the consumer sees the product as being
“worth” and ultimately acts in terms of going for actual purchasing the product. If the
brand experience and identity are strategically managed, it goes without saying that a
www.solvemyassignment.com
13
consumer can be convinced to pay a differential price premium for associating
himself/herself with the brand. (Glenn Sasscer, 2009)
2.2 Dimensions of Brand
Experts have classified brand definitions under six headings:
1. Visual,
2. Perceptual,
3. Positioning,
4. Image,
5. Added Value, and
6. Personality. (Hankinson and Cowking, 1993).
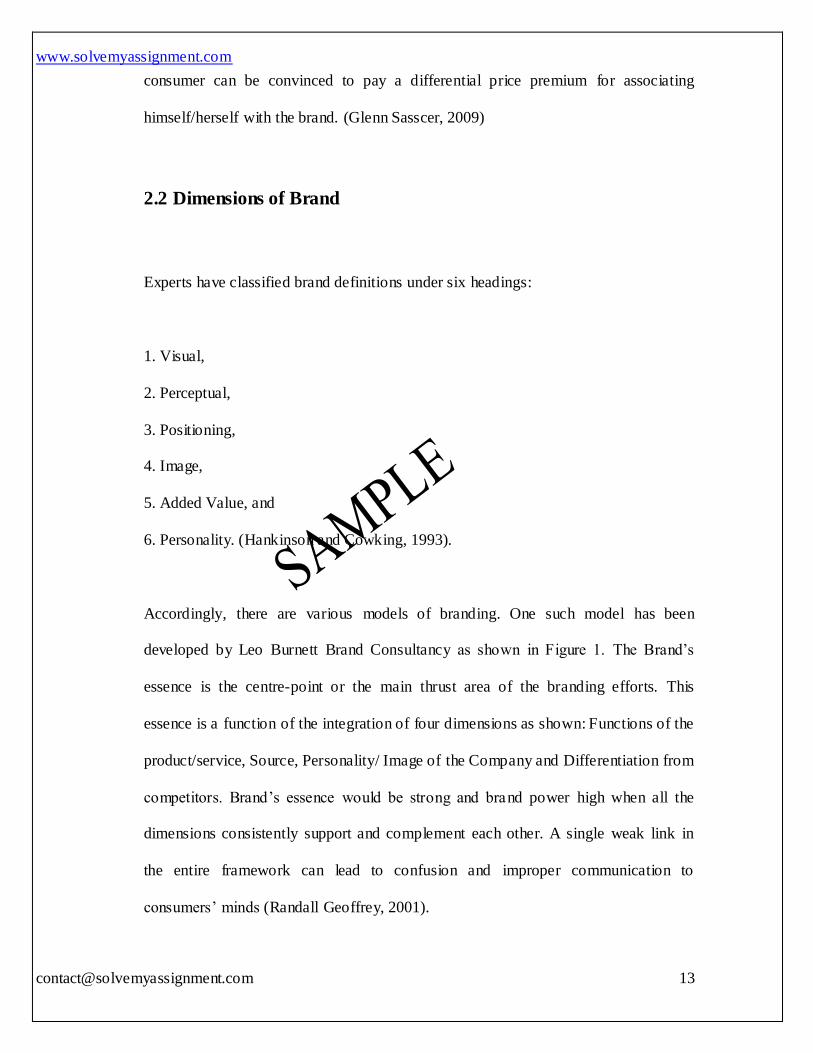
Accordingly, there are various models of branding. One such model has been
developed by Leo Burnett Brand Consultancy as shown in Figure 1. The Brand‟s
essence is the centre-point or the main thrust area of the branding efforts. This
essence is a function of the integration of four dimensions as shown: Functions of the
product/service, Source, Personality/ Image of the Company and Differentiation from
competitors. Brand‟s essence would be strong and brand power high when all the
dimensions consistently support and complement each other. A single weak link in
the entire framework can lead to confusion and improper communication to
consumers‟ minds (Randall Geoffrey, 2001).
www.solvemyassignment.com
14
Functions Personality/Image
W
What is it
Differences Source
What is it?
What is it for?
What does it do?
Essence
How is it better?
How is it different?
How do people feel about it?
Do they like/respect it?
User Imagery
What does the company stand
for?
What are its aims?
Figure 1 : Burnett model of Brand Dimensions
Source: Leo Burnett Brand Consultancy
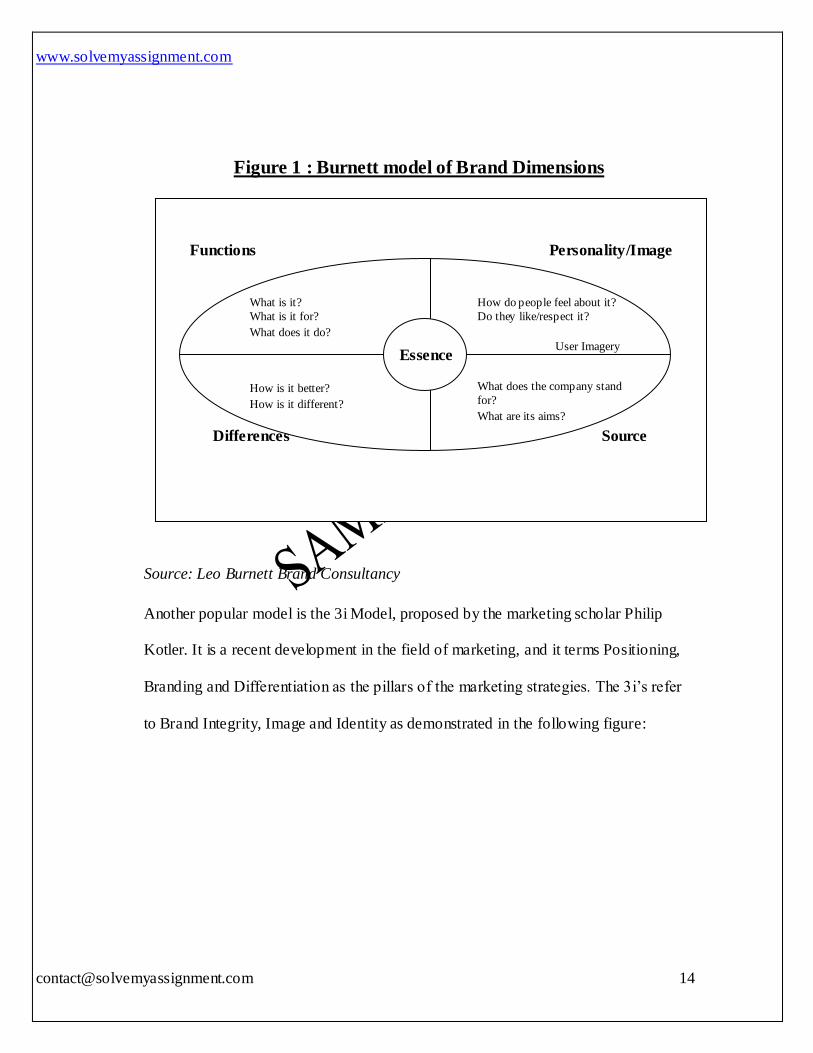
Another popular model is the 3i Model, proposed by the marketing scholar Philip
Kotler. It is a recent development in the field of marketing, and it terms Positioning,
Branding and Differentiation as the pillars of the marketing strategies. The 3i‟s refer
to Brand Integrity, Image and Identity as demonstrated in the following figure:
www.solvemyassignment.com
15
Figure 2: The 3i Model
Source: http://emanuelschachinger.blogspot.com/2010/12/3is-matrix-and-10-credos.html
Brand identity refers to the positioning of the brand in the minds of the consumer.
The positioning should be unique so as to have a noticeable impact on the minds of
the consumers.
Brand Image refers to the acquisition of a share in the consumer‟s minds. The brand
value should be such that it should appeal to the consumer‟s needs and aspirations
beyond the traditional concepts of product features and functionalities.
Brand Integrity is a type of test of authenticity which develops as the brand fulfills
what it had communicated to fulfill. It refers to credibility and honesty of the brand. It
targets the spirit of the customer and aims to instill trust and faith in it for the
company‟s brand (Kotler, 2010).
www.solvemyassignment.com
16
2.3 Benefits of Branding
The benefits of branding can be discussed under two broad heads: financial benefits
and social benefits.
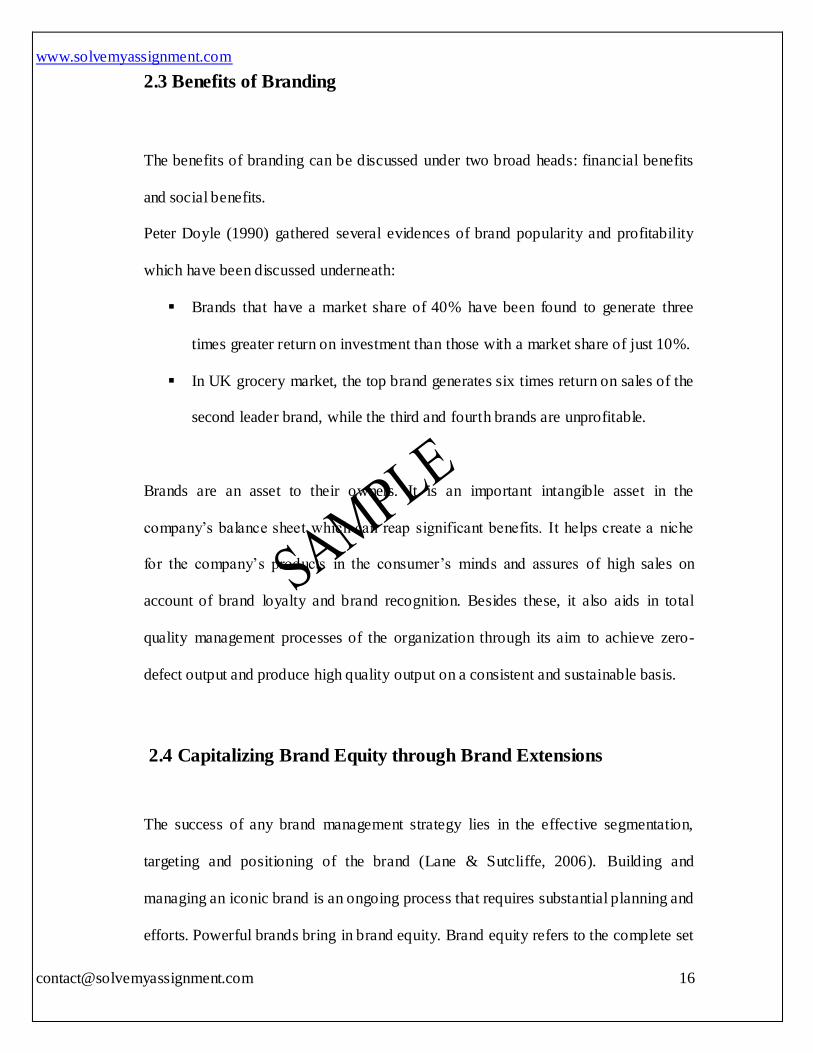
Peter Doyle (1990) gathered several evidences of brand popularity and profitability
which have been discussed underneath:
Brands that have a market share of 40% have been found to generate three
times greater return on investment than those with a market share of just 10%.
In UK grocery market, the top brand generates six times return on sales of the
second leader brand, while the third and fourth brands are unprofitable.
Brands are an asset to their owners. It is an important intangible asset in the
company‟s balance sheet which can reap significant benefits. It helps create a niche
for the company‟s products in the consumer‟s minds and assures of high sales on
account of brand loyalty and brand recognition. Besides these, it also aids in total
quality management processes of the organization through its aim to achieve zero-
defect output and produce high quality output on a consistent and sustainable basis.
2.4 Capitalizing Brand Equity through Brand Extensions
The success of any brand management strategy lies in the effective segmentation,
targeting and positioning of the brand (Lane & Sutcliffe, 2006). Building and
managing an iconic brand is an ongoing process that requires substantial planning and
efforts. Powerful brands bring in brand equity. Brand equity refers to the complete set
www.solvemyassignment.com
17
of associations and behaviors on the part of all of the brand‟s consumers, channel
members, and the parent corporation that helps the brand command greater volume or
higher margins than it could, had the brand name not existed. Brand Equity provides
the brand with a stronger, sustainable, and competitive differential advantage in the
market (Chay 1988). Well established brands can command premiums in similar
diversified lines of business provided the customer base remains the same, through
brand extensions (Tauber, 1981). Brand Extensions in simple terms implies using an
existing brand to market a new product to a similar customer base the brand was
catering to. There exists the risk of cannibalization of the existing sales (Aaker &
Keller, 1990), but the strong brand equity helps avoid this as shown by research.
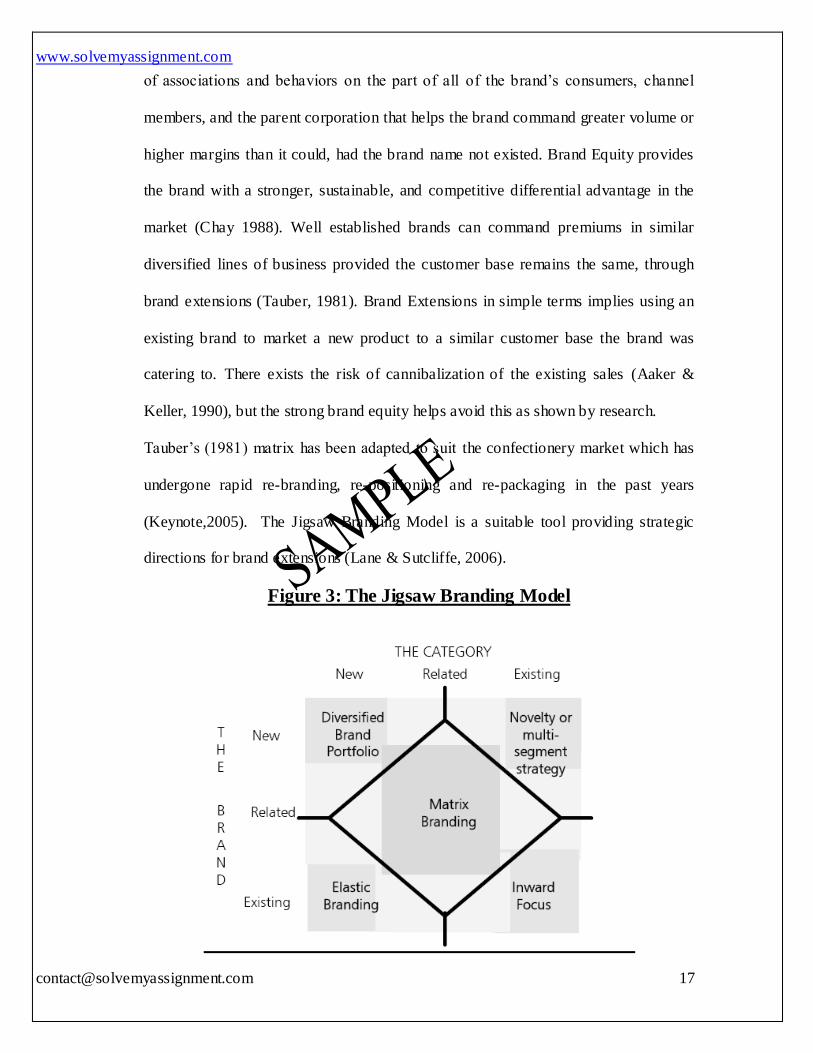
Tauber‟s (1981) matrix has been adapted to suit the confectionery market which has
undergone rapid re-branding, re-positioning and re-packaging in the past years
(Keynote,2005). The Jigsaw Branding Model is a suitable tool providing strategic
directions for brand extensions (Lane & Sutcliffe, 2006).
Figure 3: The Jigsaw Branding Model
www.solvemyassignment.com
18
Source: The Marketing Review 2006, p 99
As the model shows, inward focus is the most conservative strategy and diversified
brand portfolio the riskiest. Matrix Branding utilizes elements of both brand and
category extensions, but without taking much risk.
De Chernatony (2001) assert that the value of the brand‟s personality is a significant
differentiation tool and research has furthered on this by establishing that brand
personalities functionality is the primary driver of customer‟s preference and usage.
These factors further contribute to a strong brand with significant brand equity which
can be used for future growth and diversification.
www.solvemyassignment.com
19
3. Research Methodology
This report is based primarily on data collected through primary research data
collection methods, along with data collected from secondary sources.
3.1 Data Collection Method
Various methods are available to collect primary data like focus groups, group
discussion techniques like Delphi Technique, questionnaire method etc (Primary Data
Collection Methods, 2010). Since this study aims to analyze data about consumer‟s
individualistic perceptions and images of the brand Cadbury, the questionnaire
method was deemed suitable.
3.2 Use of Ordinal Data
Data can be classified into various types, the primary classification being ordinal and
cardinal (Types of Data, 2010). This report seeks to gain insight into the relative
ranking of the various brands and the respective attributes in the consumer‟s minds
and is based on qualitative data. These factors cannot are not quantifiable, for
example, a person cannot quantify how much he/she likes chocolates (Fink, 2003).
Hence the Likert scale approach to collect ordinal data has been used. Here,
respondents are asked to rate the options on a scale with the most preferred attribute
being ranked as No. 1 and so on (Kumar Ranjit, 2005).
www.solvemyassignment.com
20
3.3 Designing the Questionnaire
The questionnaire is the primary tool of research in this report and hence has to be
planned carefully and logically. The major problem with the questionnaire method is
that data is not collected through personal contact, but through other forms of
communication. Hence, there are several risks involved including risks of no
response, misinterpretation of questions, to name a few. The problem gets amplified
when the data to be collected is mainly subjective. While designing the questionnaire,
the approach followed was to keep it simple, objective, and less time-consuming.
Open ended questions were avoided, and it emphasized on ranking of various
attributes so as to minimize misinterpretation (Oppenheim, 1992). Pilot tests were
conducted to determine the objectivity of the questionnaire.
3.4 Pilot Tests
The questionnaire was initially administered to a small group of 10 people and their
feedback was collected as to how simple and objective they found the questionnaire.
Accordingly, changes were made and the final questionnaire was prepared. For
example, initially the questionnaire did not list the various brands, but asked for the
companies only. It was found that companies were more aware of the brand, rather
than the company promoting that brand. Due to confusion among the respondents, it
www.solvemyassignment.com
21
was amended and the second question explicitly stated the names of the popular
chocolate brands.
3.5 Administering the final questionnaire
Due to time and geographical constraints, this survey was restricted to a sample of 50
persons. The Simple Random Sampling Approach was deployed to obtain the data.
Accordingly, the data collected was tabulated through the use of tally marks, and their
median values were obtained to get a general overview of the demographics of the
sample surveyed.
www.solvemyassignment.com
22
4. Data Analysis
A brand is a metaphor which is used to denote the complex pattern of associations
that exists in the mind of the consumers (or users) rather than the minds of the
marketing personnel (Gordon Wendy and Ford-Hutchinson Sally, 2002). Thus, I
intend to begin my analysis by analyzing the demographics of the sample surveyed.
4.1 Demographics of the Sample Surveyed
The questionnaire was electronically administered to a large sample in a random
manner, and 80% of the target sample responded back. We ignore the non-
respondents and take our sample size as 50. Cadbury Plc is a global brand that
practices the strategy of wide differentiation and is not focused on any particular
consumer section. Its products are targeted across all ages and all locations, without
any bias.
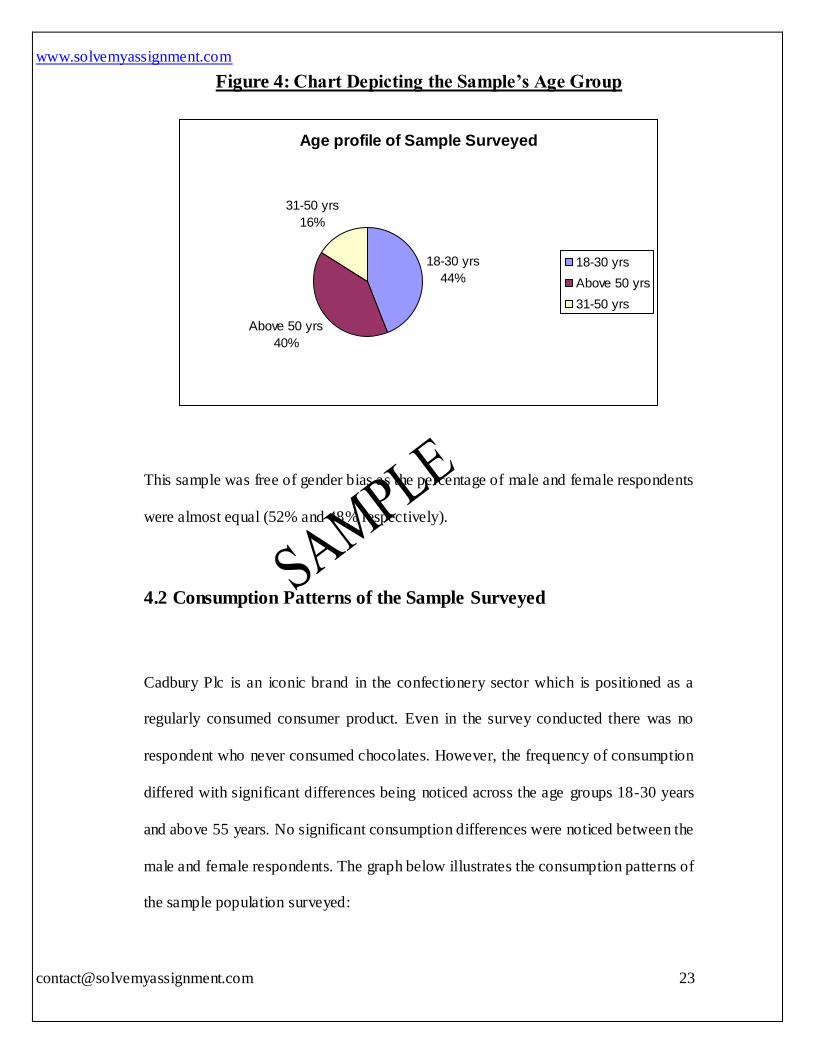
The age profile of the survey respondents has been shown in the following chart. We
see that the respondents belong mainly to the age group 18-30 years and above 50
years. There was no response from the teenagers group.
www.solvemyassignment.com
23
Figure 4: Chart Depicting the Sample’s Age Group
Age profile of Sample Surveyed
18-30 yrs
44%
Above 50 yrs
40%
31-50 yrs
16%
18-30 yrs
Above 50 yrs
31-50 yrs
This sample was free of gender bias as the percentage of male and female respondents
were almost equal (52% and 48% respectively).
4.2 Consumption Patterns of the Sample Surveyed
Cadbury Plc is an iconic brand in the confectionery sector which is positioned as a
regularly consumed consumer product. Even in the survey conducted there was no
respondent who never consumed chocolates. However, the frequency of consumption
differed with significant differences being noticed across the age groups 18-30 years
and above 55 years. No significant consumption differences were noticed between the
male and female respondents. The graph below illustrates the consumption patterns of
the sample population surveyed:
www.solvemyassignment.com
24
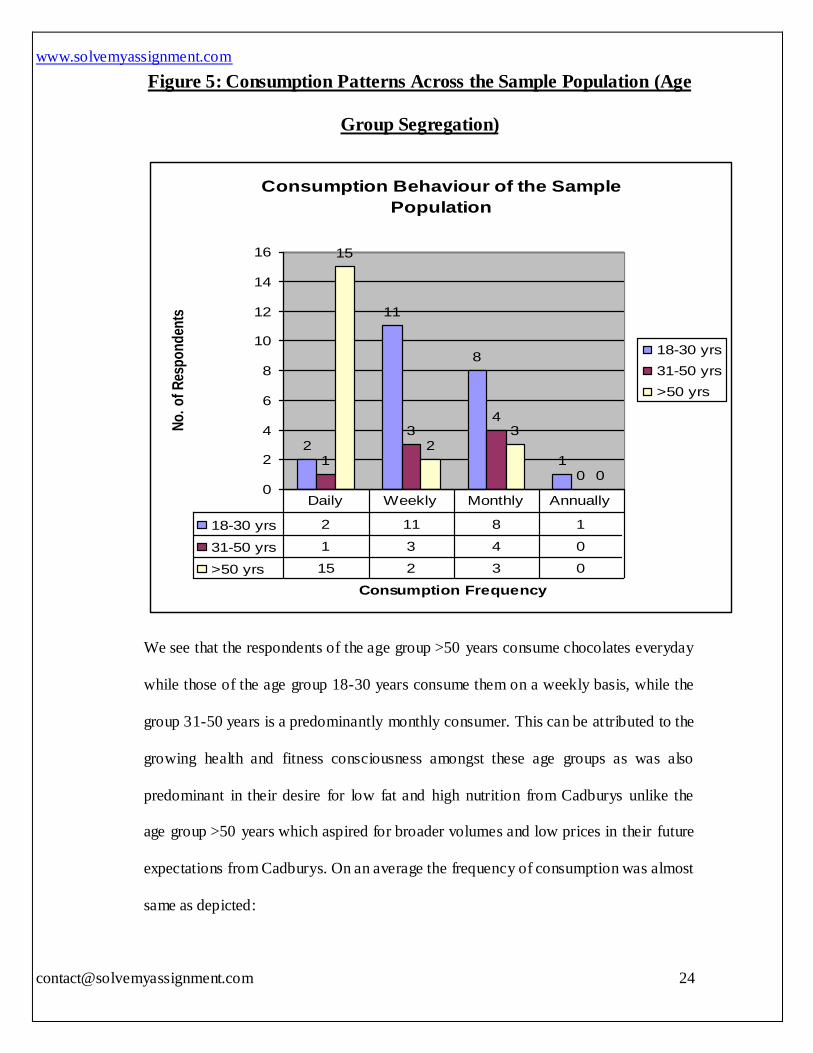
Figure 5: Consumption Patterns Across the Sample Population (Age
Group Segregation)
Consumption Behaviour of the Sample
Population
2
11
8
11
34
0
15
23
00
2
4
6
8
10
12
14
16
Consumption Frequency
No
. o
f R
esp
on
den
ts
18-30 yrs
31-50 yrs
>50 yrs
18-30 yrs 2 11 8 1
31-50 yrs 1 3 4 0
>50 yrs 15 2 3 0
Daily Weekly Monthly Annually
We see that the respondents of the age group >50 years consume chocolates everyday
while those of the age group 18-30 years consume them on a weekly basis, while the
group 31-50 years is a predominantly monthly consumer. This can be attributed to the
growing health and fitness consciousness amongst these age groups as was also
predominant in their desire for low fat and high nutrition from Cadburys unlike the
age group >50 years which aspired for broader volumes and low prices in their future
expectations from Cadburys. On an average the frequency of consumption was almost
same as depicted:
www.solvemyassignment.com
25
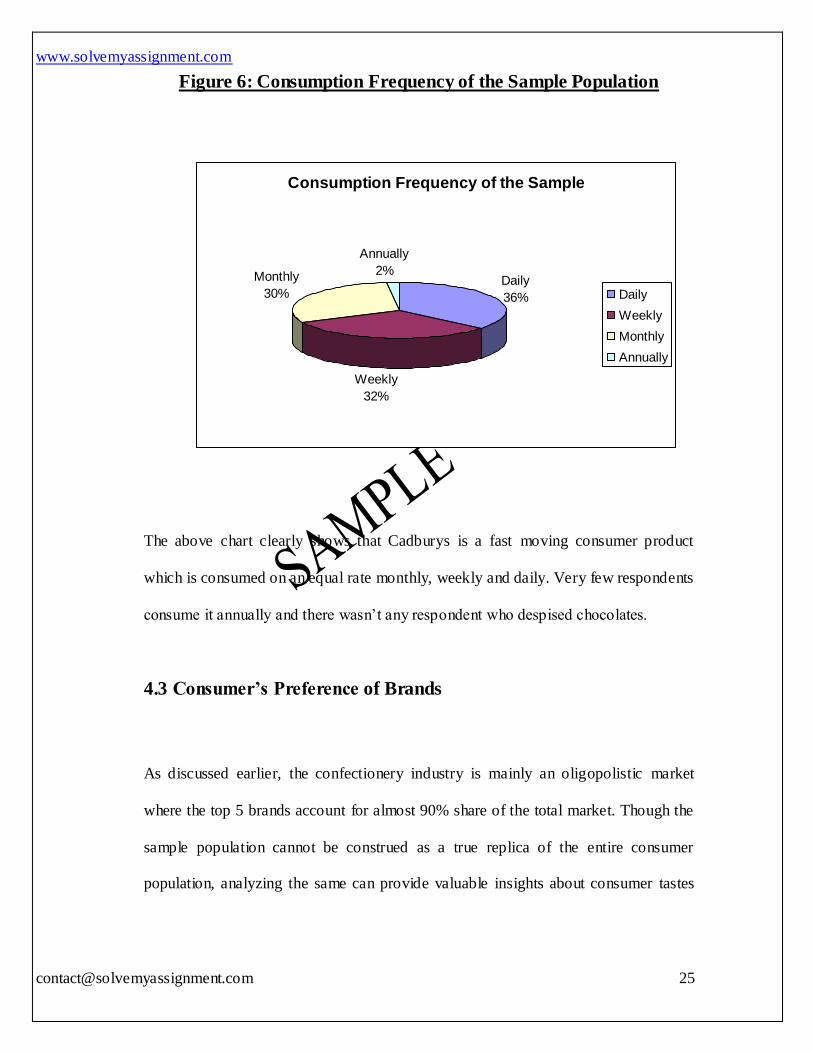
Figure 6: Consumption Frequency of the Sample Population
The above chart clearly shows that Cadburys is a fast moving consumer product
which is consumed on an equal rate monthly, weekly and daily. Very few respondents
consume it annually and there wasn‟t any respondent who despised chocolates.
4.3 Consumer’s Preference of Brands
As discussed earlier, the confectionery industry is mainly an oligopolistic market
where the top 5 brands account for almost 90% share of the total market. Though the
sample population cannot be construed as a true replica of the entire consumer
population, analyzing the same can provide valuable insights about consumer tastes
Consumption Frequency of the Sample
Daily
36%
Weekly
32%
Monthly
30%
Annually
2%
Daily
Weekly
Monthly
Annually
www.solvemyassignment.com
26
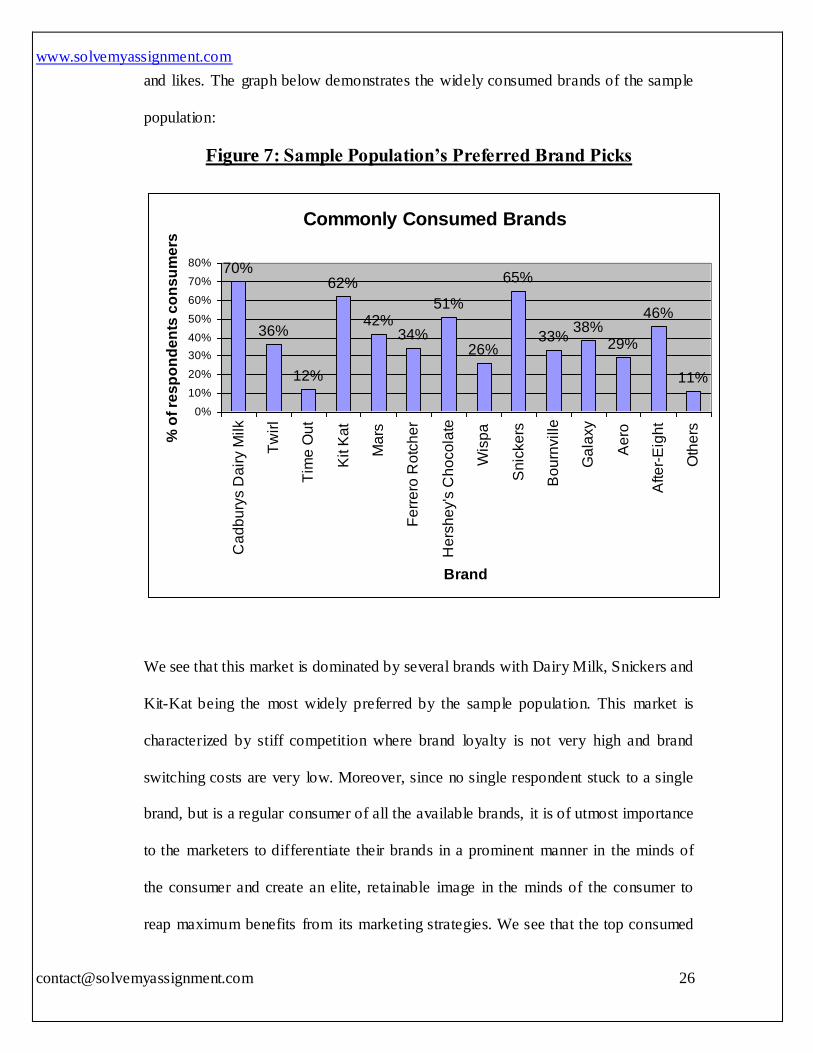
and likes. The graph below demonstrates the widely consumed brands of the sample
population:
Figure 7: Sample Population’s Preferred Brand Picks
Commonly Consumed Brands
70%
36%
12%
62%
42%34%
51%
26%
65%
33%38%
29%
46%
11%
0%
10%
20%
30%
40%
50%
60%
70%
80%
Ca
db
ury
s D
air
y M
ilk
Tw
irl
Tim
e O
ut
Kit K
at
Ma
rs
Fe
rre
ro R
otc
he
r
He
rsh
ey's
Ch
oco
late
Wis
pa
Sn
icke
rs
Bo
urn
ville
Ga
laxy
Ae
ro
Afte
r-E
igh
t
Oth
ers
Brand
% o
f re
sp
on
de
nts
co
ns
um
ers
We see that this market is dominated by several brands with Dairy Milk, Snickers and
Kit-Kat being the most widely preferred by the sample population. This market is
characterized by stiff competition where brand loyalty is not very high and brand
switching costs are very low. Moreover, since no single respondent stuck to a single
brand, but is a regular consumer of all the available brands, it is of utmost importance
to the marketers to differentiate their brands in a prominent manner in the minds of
the consumer and create an elite, retainable image in the minds of the consumer to
reap maximum benefits from its marketing strategies. We see that the top consumed
www.solvemyassignment.com
27
brand was Dairy Milk, the iconic brand from the Cadbury‟s stable, with 70% of the
respondents claiming to be a consumer of this brand. However, it also faces stiff
competition from Snickers, which is the choice of about 65% consumers followed by
Nestlé‟s Kit-Kat which is preferred by about 62% respondents. Even from the
Cadbury‟s stable, Dairy Milk was the most preferred pick, while Wispa, Time-Out
were also consumed by few respondents. This intense competition calls for out-of-
the-box thinking and innovative strategic initiative by Cadbury‟s to maintain and
enhance its market share. Now we move on to analyze the favorite consumer brands
and the attributes of Cadburys which makes it the most preferred brand across all
ages.
4.4 The top chocolate brands in the UK
This survey was conducted to determine the popularity of confectionery brands in the
United Kingdom. The respondents were asked to list their top three preferred
chocolate brands. It was observed that Cadburys is preferred in the top three brands‟
list for 90% of the total respondents. Only 10% of the respondents did not rate
Cadburys in the first three brands list. Cadburys was seen to be a bigger hit in the >55
age group, with almost 60% of the total respondents in this category claiming
Cadburys to be their favorite brand. About 32% of the total respondents in the age
category 18-30 years listed Cadburys as their favorite brand and 40% in the category
of 31-50 years rated Cadburys as the top brand.
www.solvemyassignment.com
28
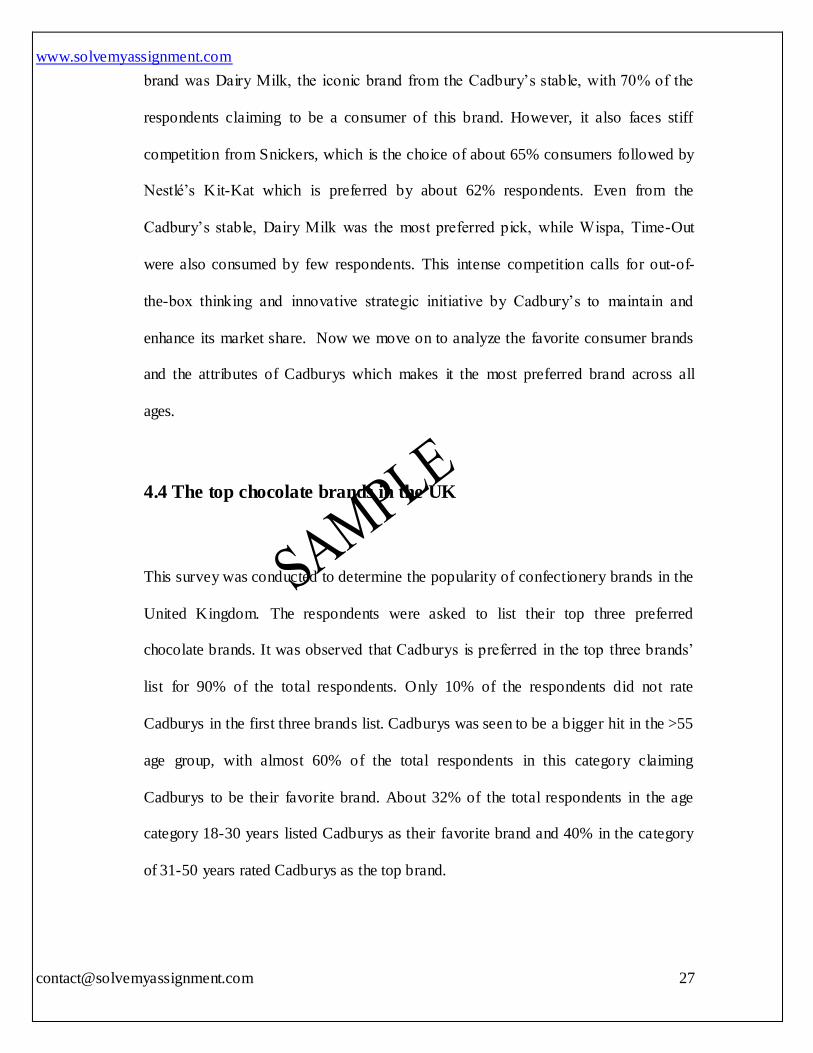
Figure 8: Rating of Cadburys by respondents
Rating of Cadburys by sample respondents
46%
24%
20%
10%
Top Brand
Second Preferred Brand
Third Most Preferred
Brand
Don’t Like
In the 18-30 years category, Snickers was seen to be the top preferred brand with 50%
of the respondents from this category rating it as the top chocolate brand. Other top
chocolate brands were Hershey‟s Milk Chocolate, Ferrero Rotcher, Kit-Kat and
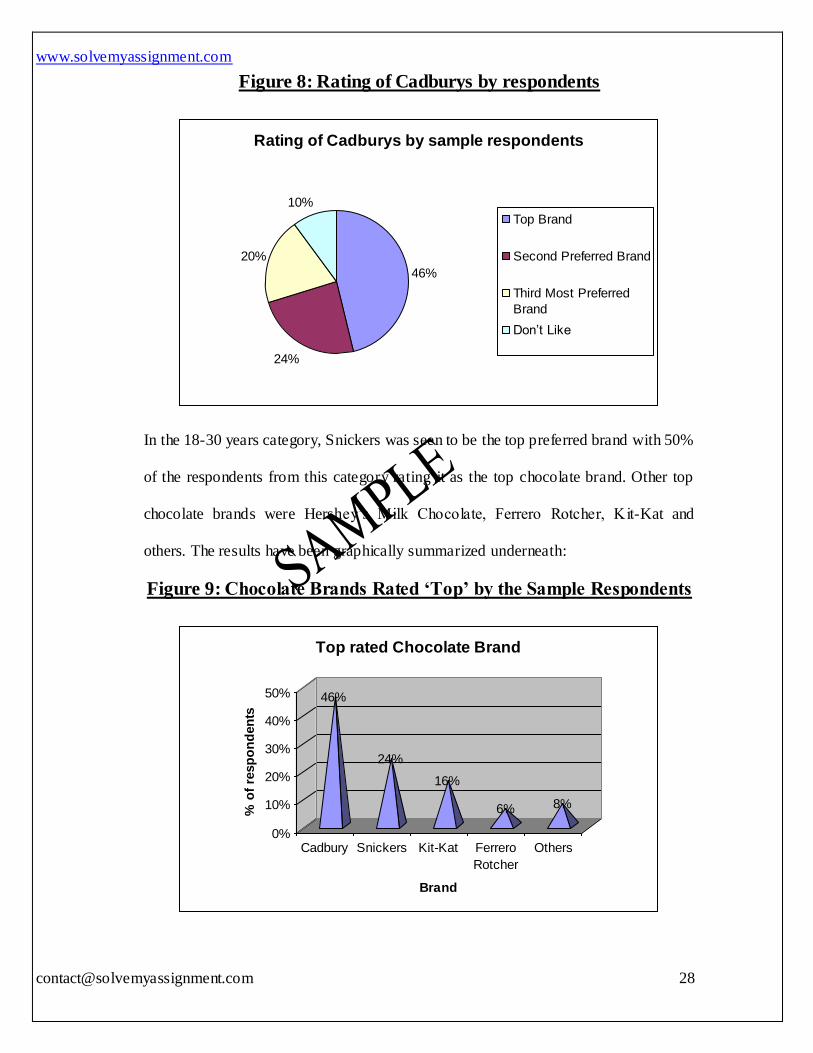
others. The results have been graphically summarized underneath:
Figure 9: Chocolate Brands Rated ‘Top’ by the Sample Respondents
46%
24%
16%
6% 8%
0%
10%
20%
30%
40%
50%
% o
f re
sp
on
den
ts
Cadbury Snickers Kit-Kat Ferrero
Rotcher
Others
Brand
Top rated Chocolate Brand
www.solvemyassignment.com
29
A look at the above graph indicates a rosy situation for Cadburys but if we look at the
figures in a segregate manner, we see that the brand popularity of Cadburys is less in
the age group 18-30 years and the brand popularity is highest in the age group >50
years. Cadburys is facing tough competition from Mars‟ Snickers in reta ining its
customer base belonging to the group 18-30 years.
4.5 Analyzing the Brand Building Process of Cadburys
More than just being a marketing concept, branding has an emotional and
psychological appeal to it. Branding is not just a tool deployed by the company to
market its products and charge a premium for the same, but it represents a joint
wherein the company tries to connect with its consumer and delight them and instill a
sense of faith and trust towards the company‟s products. Brand Building is a
consistent exercise which requires attention to the minutest detail and patience
(Williams Roy H., 2005). It is not a yearly or monthly exercise, but it takes years for
any company to build a brand. Branding is not confined to just colorful logos, fonts or
symbols but it has both an emotional appeal and a psychological dimension to it.
In this report, we intend to analyze the process of brand building deployed by
Cadburys. Its flag-ship brand “Dairy Milk” has won accolades from consumers over
several decades. In the survey conducted, the respondents were asked to rate the
different factors on a rating scale, which in their opinion, are the unique selling
proposition of Cadburys. Accordingly, the results were tabulated and inferences about
www.solvemyassignment.com
30
the brand‟s popularity from these qualitative factors were determined through the use
of various statistical tools.
4.5.1 Analyzing the Brand Attributes Contributing to Cadbury‟s
Popularity
4.5.1.1 Statistical Tools Used
As discussed earlier, this report is based on ordinal and not cardinal data. Ordinal data
is used to quantify qualitative factors and hence the traditional statistical measures
like mean, standard deviation cannot be computed. Thus we have to go beyond the
traditional tools and accordingly the following tools were selected:
Spearman‟s Co-efficient of Rank Correlation,
Co-efficient of Determination,
Hypothesis testing (using T-tests due to small sample size).
Correlation measures the degree of association and interdependence between two
variables (Fink Arlene, 1995). There are different types of correlation co-efficient.
However, for analyzing rank data, the two most widely used methods are to calculate
Edward Spearman‟s co-efficient of rank correlation and Kendall‟s co-efficient of rank
correlation (Dixon, W.J., 1992).
Spearman‟s rank correlation coefficient is most widely used to analyze ordinal data
(Nolan Bryan, 1994). Named after the pioneer of the concept of Charles Spearman, it
is regarded as the non-parametric counterpart of Pearson‟s correlation coefficient
www.solvemyassignment.com
31
(Vaughan Liwen, 2003). It does not assume any distribution pattern of the data. It is
calculated by using the following formula:
Correlation Co-efficient = 1 – [6 * ∑D2]/[N(N2 – 1 )]
Here,
N is the number of observations.
∑D2 represents the difference between the ranks of the ordinal variables.
Though the sample size is 50, only 90% of the respondents rated Cadburys in their
top three brands list. Thus the number of observations here is 45, and the rankings by
these respondents is used to calculate the degree of association between the rank
assigned to Cadburys by them (dependent variable) and the corresponding relative
ranking of the brand‟s attributes (independent variable).
While correlation measures the degree of association, correlation squared explains the
percentage of the variability in the value of the dependent variable that is explained
by the independent variable. This factor is commonly known as Co-efficient of
Determination (Gravetter & Wallnau, 2009).
In statistics, mere computation of correlation co-efficients is not sufficient. It is
essential to establish the statistical significance of the co-efficients and determine
whether they significantly explain the dependent variable. Two tailed T-tests were
conducted at 5% significance level, to deduce whether the null hypothesis holds good.
The null hypothesis stated that the rank correlation is almost irrelevant, while the
alternate hypothesis stated that there was significant correlation between the two
variables. The value of the t-statistic was computed as:
www.solvemyassignment.com
32
T-value = r * [(N – 2)/(1 – r2)] ^ 0.5
Where, r is the rank correlation coefficient.
The relevant degrees of freedom were N – 2 or 43 for this case.
If the computed T-value falls outside the critical region of 5% significance level, the
null hypothesis is rejected and the coefficient of rank correlation is deduced to be
statistically significant.
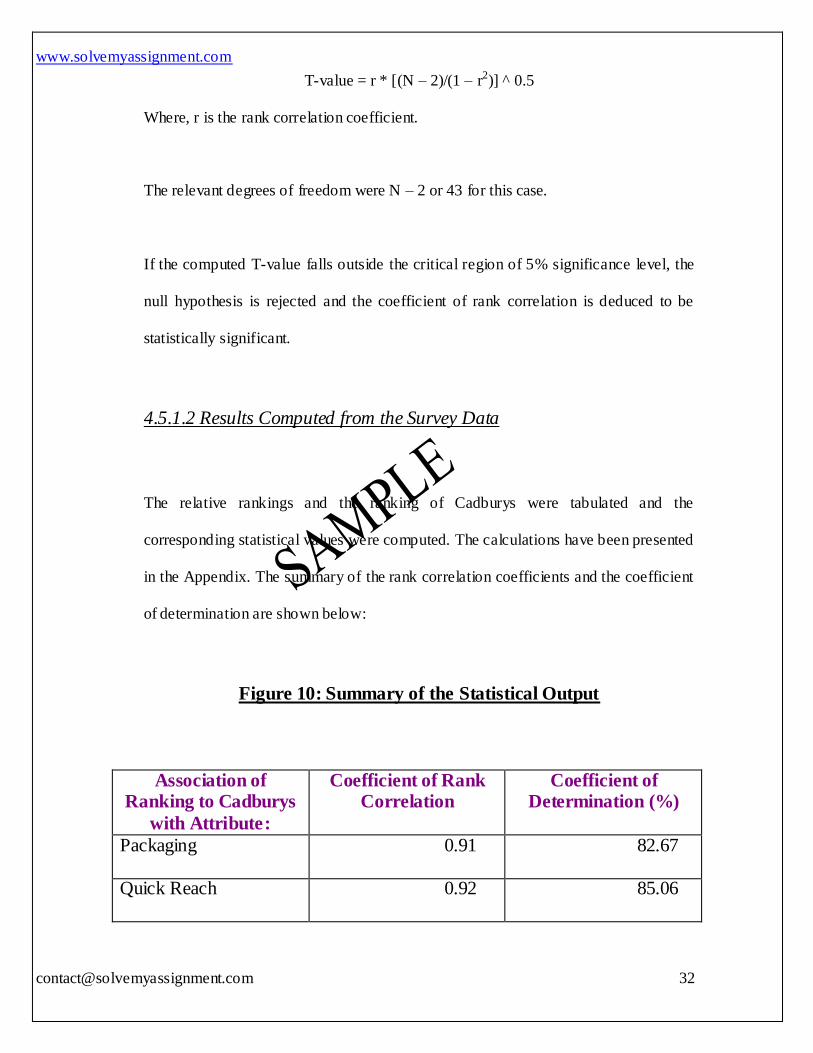
4.5.1.2 Results Computed from the Survey Data
The relative rankings and the ranking of Cadburys were tabulated and the
corresponding statistical values were computed. The calculations have been presented
in the Appendix. The summary of the rank correlation coefficients and the coefficient
of determination are shown below:
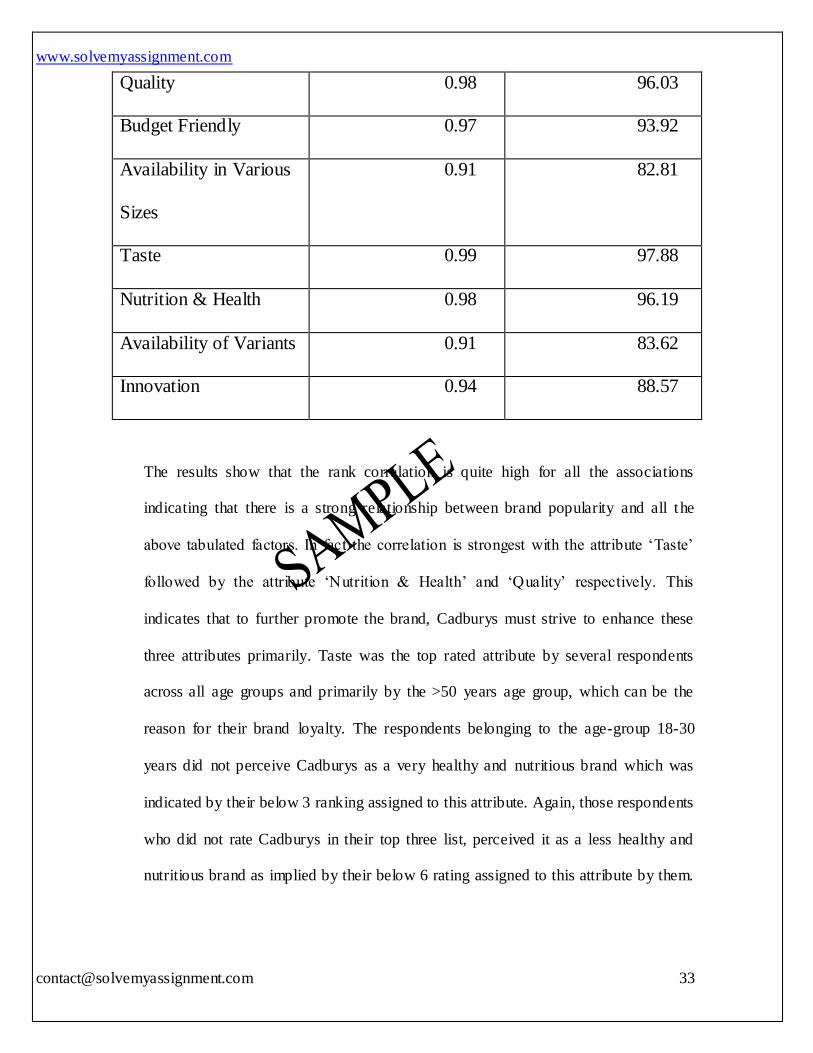
Figure 10: Summary of the Statistical Output
Association of Ranking to Cadburys
with Attribute:
Coefficient of Rank Correlation
Coefficient of Determination (%)
Packaging 0.91 82.67
Quick Reach 0.92 85.06
www.solvemyassignment.com
33
Quality 0.98 96.03
Budget Friendly 0.97 93.92
Availability in Various
Sizes
0.91 82.81
Taste 0.99 97.88
Nutrition & Health 0.98 96.19
Availability of Variants 0.91 83.62
Innovation 0.94 88.57
The results show that the rank correlation is quite high for all the associations
indicating that there is a strong relationship between brand popularity and all the
above tabulated factors. In fact the correlation is strongest with the attribute „Taste‟
followed by the attribute „Nutrition & Health‟ and „Quality‟ respectively. This
indicates that to further promote the brand, Cadburys must strive to enhance these
three attributes primarily. Taste was the top rated attribute by several respondents
across all age groups and primarily by the >50 years age group, which can be the
reason for their brand loyalty. The respondents belonging to the age-group 18-30
years did not perceive Cadburys as a very healthy and nutritious brand which was
indicated by their below 3 ranking assigned to this attribute. Again, those respondents
who did not rate Cadburys in their top three list, perceived it as a less healthy and
nutritious brand as implied by their below 6 rating assigned to this attribute by them.
www.solvemyassignment.com
34
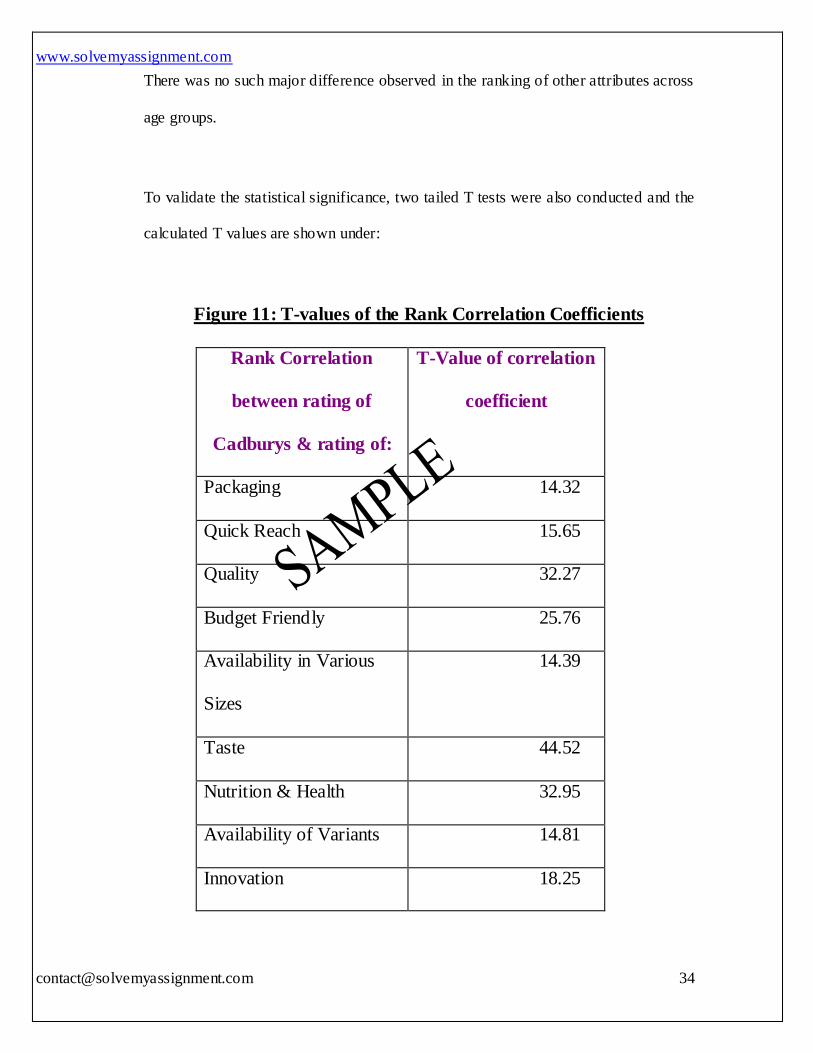
There was no such major difference observed in the ranking of other attributes across
age groups.
To validate the statistical significance, two tailed T tests were also conducted and the
calculated T values are shown under:
Figure 11: T-values of the Rank Correlation Coefficients
Rank Correlation
between rating of
Cadburys & rating of:
T-Value of correlation
coefficient
Packaging 14.32
Quick Reach 15.65
Quality 32.27
Budget Friendly 25.76
Availability in Various
Sizes
14.39
Taste 44.52
Nutrition & Health 32.95
Availability of Variants 14.81
Innovation 18.25
www.solvemyassignment.com
35
All the T-values fall outside the critical region leading to rejection of the null
hypothesis that the correlation coefficients are close to zero, indicating that the
correlation coefficients are statistically significant and this also seems logical because
brand power is a result of the intersection of several factors across psychological,
emotional, functional and physical dimensions.
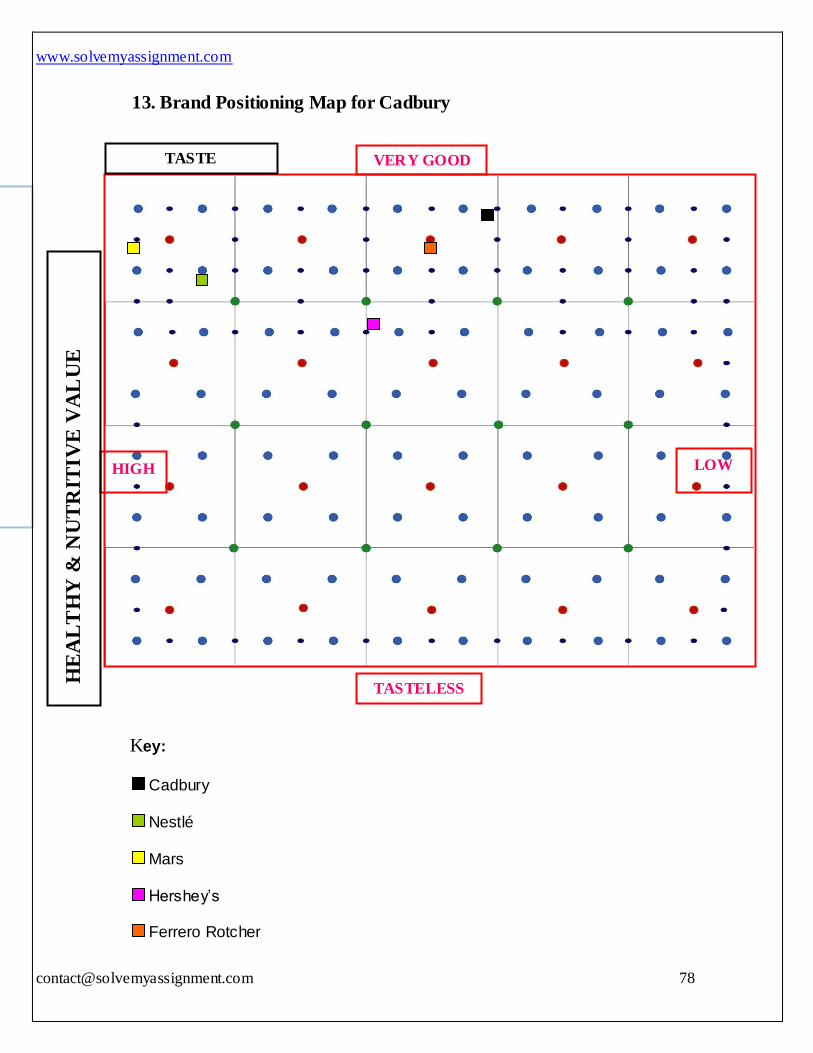
4.5.2 Brand Positioning of Cadburys
The sole purpose of positioning brands in the consumer‟s minds is to create the
desired associations for the company‟s brand with respect to the competitive brands
(Kotler, Michi & Pfoerstch, 2006). Through positioning tactics, marketers intend to
create a brand identity which helps the brand to be observed and retained in the
cluttered market place. The brand is positioned to meet the rational needs and wants
of the consumer.
Successful marketers thrive to simultaneously touch both the mind as well as the
heart of the consumer through effective brand positioning (which triggers the buying
decision) and authentic differentiation to confirm the buying decision. However, the
final and the most influential force is the hearts, which makes the consumer act and
take the buying decision (Setiawan et al, 2010).
Cadburys is operating in an oligopolistic chocolate confectionery market. In this
market, consumers are mainly concerned about the health and the nutritional value of
www.solvemyassignment.com
36
the products they consume along with its appeal to the taste buds. Price war is not that
predominant in this industry because the confectioners can charge a premium for their
products, provided that they enumerate a substantial differentiation aspect about their
products that convinces the consumers.
To evaluate the brand positioning of Cadburys in the current marketplace, the
position of the brands have been compared against two primary attributes namely:
Taste,
Health and Nutritional Values.
In the survey conducted, consumers were asked to rate the to chocolate brands -
Cadburys, Nestle, Mars, Hershey‟s - they perceive as healthiest, and accordingly
assign ratings to them. Moreover, the questionnaire also included an open-ended
question that asked consumers to elaborate the reasons why they would prefer
Cadburys over other brands. Surprisingly, about three-quarters of the respondents
stated taste as the superior differentiating factor for Cadburys when compared to other
brands. However, the results for health and nutritional value were again mixed across
age-groups. While the median rating assigned by the age group >50 years was 1.5 to
Cadburys, the age group 18-30 years assigned a rating of 2.5 which indicates that they
perceive the brand as less healthy. For the age group 31-50 years, the median rating
was 2. Compared to Cadburys, Mars and Nestle fared well amongst the age group 18-
30 years with a median rating of 1.5 and 2 respectively. Thus this is a potential area
for improvement. The brand positioning map of Cadburys with respect to its
competitors has been included in the Appendix.
www.solvemyassignment.com
37
4.5.3 Brand Extension by Cadburys
The intense competition in the confectionery market coupled with rapidly changing
consumer tastes has led to shortening of the life-cycle of both products and the
brands. Thus brands with shorter life cycles need to have a low pay-back period so as
to reap benefits. The scenario calls for rapid innovation, especially at the maturity
phase of the product life-cycles, to stay profitable. Similar approach has been
practiced by Cadburys.
Cadburys has effectively practiced brand extension by extending its Dairy Milk brand
into ice-cream with the launch of three variants: chocolate, shortcake biscuit and
caramel (The Grocer, 2003). In 2004, Cadbury undertook several re-branding
initiatives to create a strong brand and maintain strategic brand fit among existing
brands, which also included withdrawal of the brand „Wispa‟.
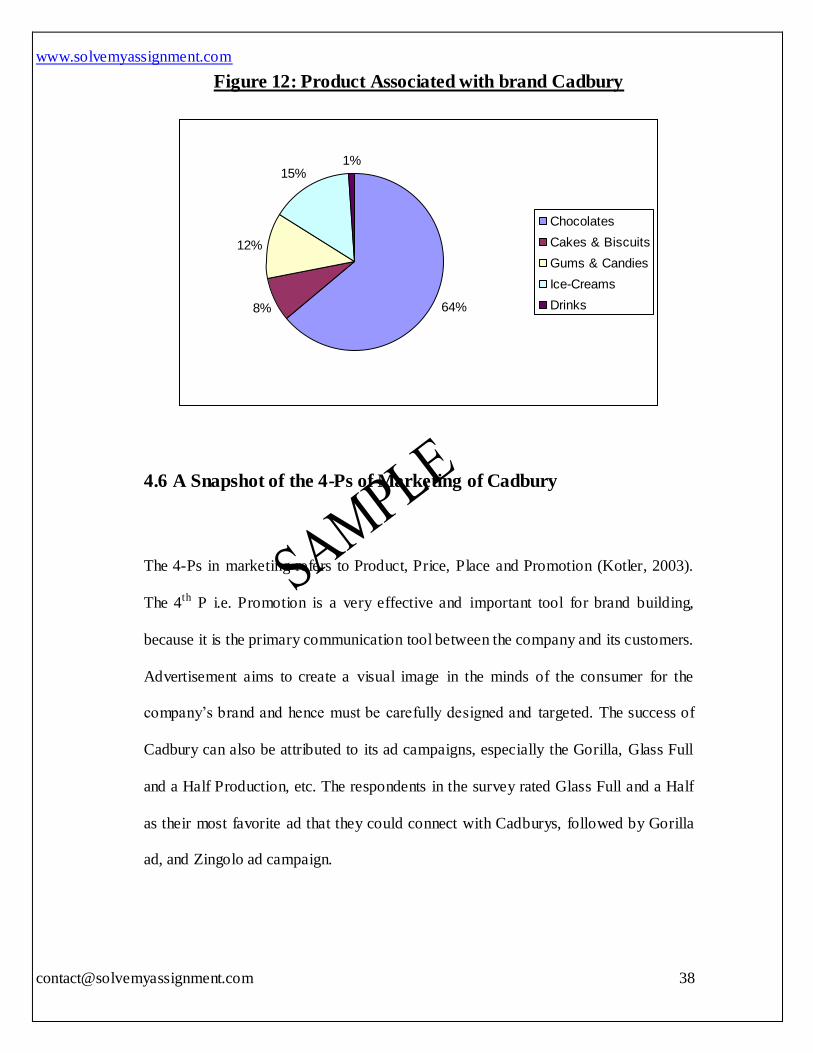
In the survey, respondents were asked as to what they associated with the brand
Cadbury – chocolates, ice-cream, drinks, cakes or biscuits. It was surprising to see
that though a majority rated chocolates as their choice, Cadbury is popular for its ice-
cream and cakes too. The results have been condensed underneath:
www.solvemyassignment.com
38
Figure 12: Product Associated with brand Cadbury
64%8%
12%
15%1%
Chocolates
Cakes & Biscuits
Gums & Candies
Ice-Creams
Drinks
4.6 A Snapshot of the 4-Ps of Marketing of Cadbury
The 4-Ps in marketing refers to Product, Price, Place and Promotion (Kotler, 2003).
The 4th P i.e. Promotion is a very effective and important tool for brand building,
because it is the primary communication tool between the company and its customers.
Advertisement aims to create a visual image in the minds of the consumer for the
company‟s brand and hence must be carefully designed and targeted. The success of
Cadbury can also be attributed to its ad campaigns, especially the Gorilla, Glass Full
and a Half Production, etc. The respondents in the survey rated Glass Full and a Half
as their most favorite ad that they could connect with Cadburys, followed by Gorilla
ad, and Zingolo ad campaign.
www.solvemyassignment.com
39
The most significant purchasing point were supermarkets and convenience stores as
35% and 32% respondents respectively, rated these venues as their preferred point of
purchase. Very few (5%) purchased their products through the internet which seems
logical as small value items are generally picked up from stores. Accordingly,
promotion efforts should be directed to these venues to stimulate consumer buying.
The Cadbury Gifts Direct (the online purchase terminal of Cadbury gift packs) was
also not a big hit among the survey respondents. Only 2% chose this terminal to buy
gifts although about 75% of the survey respondents chose to gift chocolates on all
major occasions. Thus besides personal consumption, consumers also prefer to gift
chocolates. Cadbury has several initiatives designed to meet this „gift‟ segment and
comes up with innovative ideas during occasions like Christmas, Easter etc. It also
has a wide variety of gift packs in its product portfolio suitable for all occasions like
birthdays, etc (Cadburys Gift Direct, 2010).
Its products have been competitively priced in the market. This has been deduced
from the survey respondents who replied for the subjective question by stating that
Cadbury products do not take a toll on their pockets. Moreover, the attribute „budget-
friendly‟ was rated as the fourth most preferred attribute of Cadbury with the mean
and median ranking of 4.09 and 4 respectively.
www.solvemyassignment.com
40
5. Conclusion
5.1 Summary of the findings
This research was carried out with the primary motive to determine the reasons
behind the brand popularity of Cadburys, along with a brief analysis of the tools and
techniques deployed by Cadbury to create such a successful iconic brand.
In the survey conducted, Cadbury was found to be the most preferred brand by a
majority of the sample. However, the classification differed across age groups with
the age group >50 years, being the most brand loyal category. This can also be
attributed to the difference in consumption habits across the age groups with the 18-
30 years age category being a less frequent consumer of chocolates than the >50
years age group. Cadbury faces stiff competition from Nestlé‟s Kit-Kat and Mars‟
chocolate bars, as the 18-30 years age category perceived these brands to be healthier
than Cadbury. On an overall basis, the superior positioning of Cadbury can be
attributed to its good taste, quality and nutritional values as indicated by the rank
correlation analysis of the data sampled. It has undertaken several innovative
strategies to maintain and strengthen its brand position in the market.
5.2 The Road Ahead for Cadbury
The confectionery market thrives on the in-between meal snacking habits of the
population. However, with an increasing awareness amongst people to stay healthy
www.solvemyassignment.com
41
and shed that extra weight away to stay fit and look good, there needs to be
substantial investment in healthy and tasty items rather than merely tasty items.
Cadbury needs to re-position itself in the minds of consumers of 18-30 years age
category and attend their call of low fat and high nutrition.
In the survey, the respondents were asked to express their expectations about
Cadburys. 64% & 76% of the sample voiced their need for low fat and high nutrition
respectively. Cadbury needs to re-position itself to capture this segment as have other
sectors like cakes & biscuits, and ice-creams done by introducing low-fat variants.
Several strategic initiatives like replacing flour with wheat, etc have been deployed
by segments within the confectionery sector and hence Cadbury can innovate on such
lines.
Word of mouth advertising is the most powerful promotional tool amongst all used
(Professional Advertising, 2010). In the survey conducted, the respondents claimed to
be introduced to the brand Cadbury primarily through friends and family. 64%
respondents accepted that they were introduced to Cadbury through family and
friends. Thus word of mouth advertising is of great relevance and Cadbury must focus
to delight-not just satisfy- its existing customers because one happy customer steers in
a dozen new ones (Word of mouth Advertising, 2009).
www.solvemyassignment.com
42
5.3 Limitations & Recommendations
Cadbury Plc is a global brand with its footprints spanning several continents. But this
report was written based on the responses of a small sample of 50 people from a
single location due to time and geographical constraints. Hence it suffers from
sampling bias (Sampling Bias, 2009). A better approach can be to increase the size
and distribution of the sample.
Moreover, the interview method to collect data can be more suitable (Research
Methods – Interview, 2008) as body language also communicates a lot about the
interviewee‟s thoughts and ideas (Fast, 2002). Thus this can also be incorporated to
collect data from the sample.
www.solvemyassignment.com
43
References
Aaker, D. and Keller, K.L. (1990), “Consumer evaluations of brand extensions”, Journal of Marketing, 45, pp 27-41.
AMA (1995), "AMA Dictionary", Available at: http://www.marketingpower.com/_layouts/Dictionary.aspx?dLetter=B," AMA. [Accessed on 10th December, 2010)
BBC News (2010), Cadbury Shares to be De- listed, Available at: http://news.bbc.co.uk/2/hi/business/8499853.stm, [Accessed on 6th December, 2010].
Barnett (2006), Britons are Europe's biggest chocolate-lovers; Louise Barnett – 13/04/2006,
Available at: http://www.independent.co.uk/news/uk/this-britain/britons-are-europes-biggest-chocolatelovers-473928.html, [Accessed on 1st December, 2010]
Cadbury Gifts Direct (2010), Available at: http://www.cadburygiftsdirect.co.uk/asp/default.asp, [Accessed on 16th December,
2010]
CC(2010), Chocolate Confectionery – UK – April 2010, Available at: http://oxygen.mintel.com/sinatra/oxygen/display/id=523351?select_section=479964, [Accessed on 3rd December, 2010]
Chay (1988), Marketing Science Institute 1988, p 30.
De Chernatony (2001), From Brand Vision to Brand Evaluation: the strategic process
of growing and strengthening brands, Elsevier Ltd, 1st ed, pp 95-99.
Dixon W.J. (1992), BMDP Statistical Software Manual, University Press of
California, Vol I, p 457.
Fast Julius (2002), Body Language, Barnes and Noble Books, pp 1-12. Feldwick, P (1991), "Defining a Brand," in Understanding Brands, D Cowley, Ed.
London: Kogan Page. http://www.duplication.net.au/ANZMAC09/papers/ANZMAC2009-682.pdf
[Accessed on 10th December, 2010]
Fink Arlene (2003), The Survey Kit: How to Manage, Analyze and Interpret Survey Data, Sage Publications Inc, 2nd ed, pp 28-34.
Fink Arlene (1995), How to Analyze Survey Data, Sage Publications, pp 38-39.
www.solvemyassignment.com
44
Fullerton, R. (1988), "How modern is modern marketing? Marketing's evolution and the myth of the 'production era'," Journal of Marketing, 52 (1), 108-25. Available at:
http://www.duplication.net.au/ANZMAC09/papers/ANZMAC2009-682.pdf [Accessed on December 9th, 2010]
Glenn Sasscer (2009) , The Brand Experience ,2010, Available at:
http://www.glennsasscer.com/wordpress/2009/10/23/the-brand-experience [Accessed on December 9th, 2010]
Global Data (2010), Cadbury plc (CBRY) - Financial and Strategic SWOT Analysis
Review, pp 5 -13.
Gordon Wendy and Ford-Hutchinson Sally (2002), Brains and Brands: Re-Thinking The Consumer, Admap, January 2002, Issue 424.
Gravetter & Wallnau (2009), Statistics for Behavioral Sciences, Cengage Learning, 8th ed, p 524.
Hankinson and Cowking (1993), Branding in Action: Cases and strategies for profitable brand management, pp 5 – 25.
Keynote (2005), Confectionery.
Kotler (2003), Marketing Insights from A to Z: 80 concepts every manager needs to know, John Wiley & Sons Inc, pp 108-110.
Kotler, Michi & Pfoerstch (2006), B2B Brand Management, Springer Publications, p
124.
Kotler (2010), The 3i‟s, the matrix and the 10 credos, Available at: http://emanuelschachinger.blogspot.com/2010/12/3is-matrix-and-10-credos.html [Accessed on December 16th ,2010]
Kraft Foods (2010), Available at: http://www.kraftfoodscompany.com/assets/pdf/kraft_foods_fact_sheet.pdf, [Accessed on 4th December, 2010]
Kumar Ranjit (2005), Research Methodology: A step-by-step guide for beginners,
Sage Publications Ltd, 2nd ed, pp 145-149.
Lane & Sutcliffe (2006), Brand Extensions in Cadbury, The Marketing Review 2006, Westburn Publishers Ltd, pp 85-102.
McCrum, A. (2000), "Brand names today compared to those 100 years ago," Journal
of BrandManagement, 8 (2), 111-21. Available at: http://www.duplication.net.au/ANZMAC09/papers/ANZMAC2009-682.pdf
[Accessed on December 9th, 2010]
www.solvemyassignment.com
45
Moore, K. and S. Reid (2008), "The Birth of Brand: 4000 Years of Branding History,"Business History, 50 (4), 419-32.
http://www.duplication.net.au/ANZMAC09/papers/ANZMAC2009-682.pdf [Accessed on December 9th, 2010]
Nielsen (2010), Britain‟s 100 biggest brands 2010, Available at:
www.thegrocer.co.uk, [Accessed on 4th December, 2010]. Nolan Bryan (1994), Data Analysis: An Introduction, Polity Press, pp147-149.
Oppenheim Abraham N. (1992), Questionnaire Design, interviewing and attitude measurement, Biddles Ltd, New ed, pp 100-113.
Peter Doyle (1990), Building Successful Brands: The Strategic Options, Journal of Consumer Marketing, Vol 6 No. 2, pp 2-48.
Primary Data Collection Methods (2010), Available at:
http://brent.tvu.ac.uk/dissguide/hm1u3/hm1u3text3.htm, [Accessed on 14th December, 2010]
Professional Advertising (2010), Available at:
http://www.myprofessionaladvertising.com/Word%20of%20Mouth%201.htm, [Accessed on 23rd December, 2010]
Randall Geoffrey (2001), Branding: A practical Guide to planning your strategy, 2nd
ed, pp 7-10.
Research Methods – Interview (2008), Available at: http://www.sasked.gov.sk.ca/docs/social/psych30/support_materials/research_methods.htm, [Accessed on 27th December, 2010]
Reuters (2010), Factbox : British Confectioner Cadbury, Available at:
http://uk.reuters.com/article/idINTRE60D1XX20100114, [Accessed on 5th December, 2010].
Sampling Bias (2009), Available at:
http://4h.uwex.edu/evaluation/documents/Whatissamplingbias.pdf, [Accessed on 26th December, 2010].
Setiawan et al (2010), From Products to Customers to the Human Spirit: Marketing
3.0, John Wiley & Sons Inc, pp 36-39. Tauber, E.M. (1981), “Brand franchise extension: new product benefits from
existing brand names”, Business Horizons, Vol. 24, No. 2, pp. 36-41.
Types of Data (2010), Available at: www.blacksacademy.net/content/3185.html, [Accessed on 12th December, 2010].
www.solvemyassignment.com
46
The Grocer, September 2003, p 47.
UK Confectionery (2007), Key Note Publications Ltd, Available at http://www.reportlinker.com/p046202/UK-Confectionery.html, [Accessed on 3rd
December, 2010] Vaughan Liwen (2003), Statistical Measures for the Information Professional, ASIST
Monograph Series, p 140.
Williams Roy H. (2005), How to Write Ads that build brands, Available at: http://www.entrepreneur.com/advertising/adcolumnistroyhwilliams/article75922.html [15th December, 2010].
Wood, L. (2000), "Brands and brand equity: definition and management,"
Management Decision, 38 (9), 662-69.
Word of Mouth Advertising (2009), Available at:
http://www.entrepreneur.com/encyclopedia/term/82660.html, [Accessed on 21st December, 2010]
www.solvemyassignment.com
47
Appendix
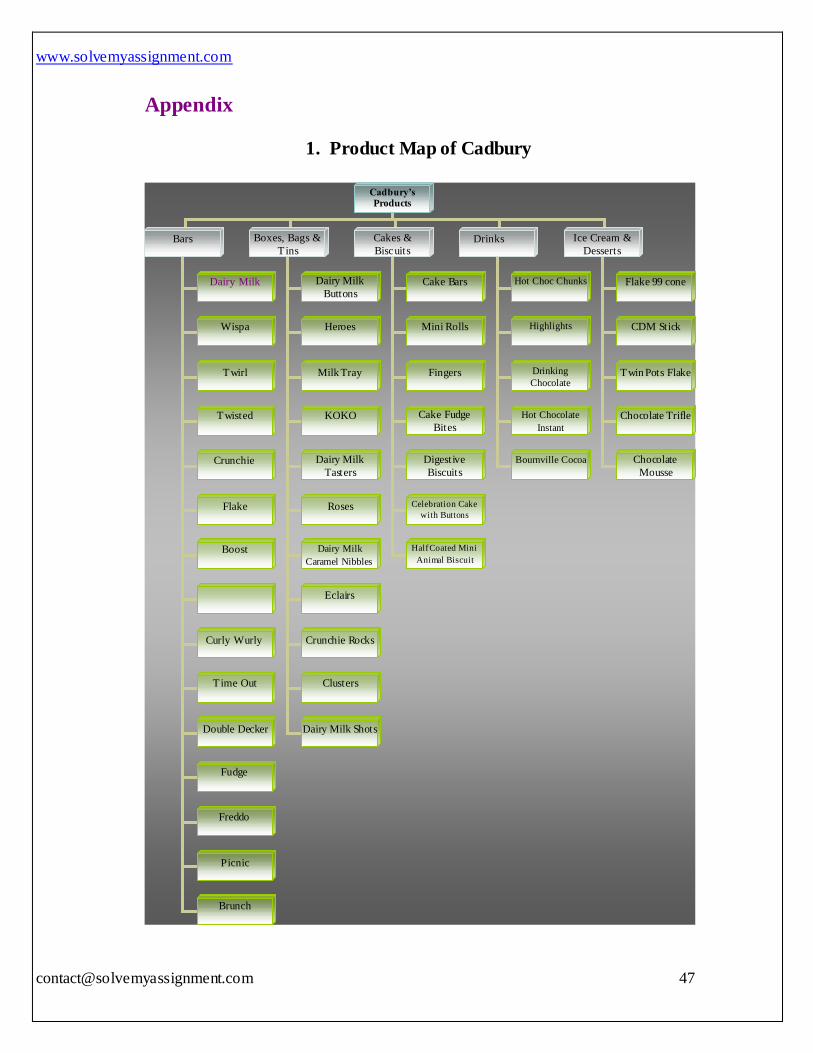
1. Product Map of Cadbury
Cadbury’s Products
Bars Boxes, Bags &
Tins
Cakes &
Biscuits Drinks Ice Cream &
Desserts
Dairy Milk
Wispa
Twirl
Twisted
Dairy Milk
Buttons
Heroes
Milk Tray
KOKO
Dairy Milk
Tasters
Cake Bars
Mini Rolls
Hot Choc Chunks
Crunchie
Flake
Boost
Curly Wurly
Flake 99 cone
CDM Stick
Twin Pots Flake
T ime Out
Double Decker
Fudge
Freddo
Picnic
Brunch
Roses
Dairy Milk
Caramel Nibbles
Eclairs
Crunchie Rocks
Clusters
Dairy Milk Shots
Fingers
Cake Fudge
Bites
Digestive
Biscuits
Celebration Cake
with Buttons
Highlights
Drinking
Chocolate
Hot Chocolate
Instant
Bournville Cocoa
Half Coated Mini
Animal Biscuit
Chocolate Trifle
Chocolate
Mousse
www.solvemyassignment.com
49
QUESTIONNAIRE
CADBURY PLC
Dear Sir/Madam
As part of a final year dissertation project, we are conducting a survey to
determine the brand popularity of Cadbury‟s. Your response would serve
as an invaluable input in our project better. Please spare a few minutes to
finish this questionnaire accurately.
The information collected during the survey would be kept confidential
and used for the stated purpose only. If you have any queries regarding
this project or any other concerns, please feel free to contact us at
_____________ and we‟ll get back to you as soon as possible.
www.solvemyassignment.com
50
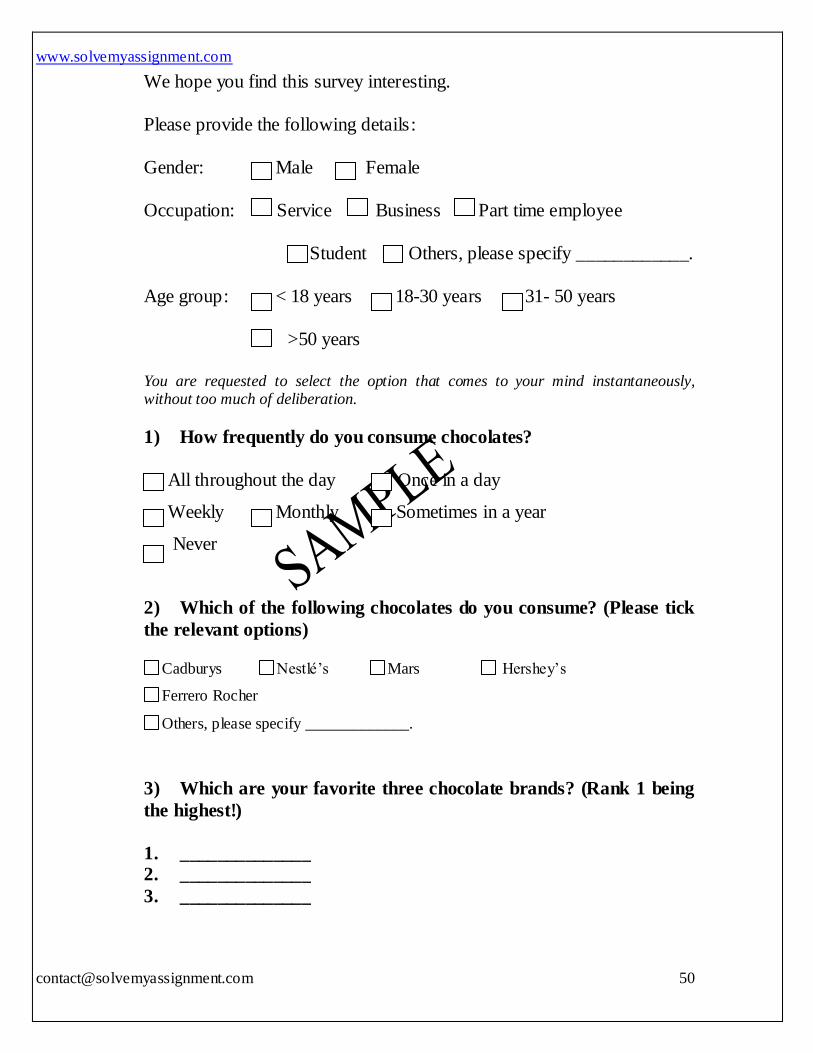
We hope you find this survey interesting.
Please provide the following details:
Gender: Male Female
Occupation: Service Business Part time employee
Student Others, please specify ____________.
Age group: < 18 years 18-30 years 31- 50 years
>50 years
You are requested to select the option that comes to your mind instantaneously, without too much of deliberation.
1) How frequently do you consume chocolates?
All throughout the day Once in a day
Weekly Monthly Sometimes in a year
Never
2) Which of the following chocolates do you consume? (Please tick
the relevant options)
Cadburys Nestlé‟s Mars Hershey‟s
Ferrero Rocher
Others, please specify _____________.
3) Which are your favorite three chocolate brands? (Rank 1 being
the highest!)
1. ______________ 2. ______________
3. ______________
www.solvemyassignment.com
51
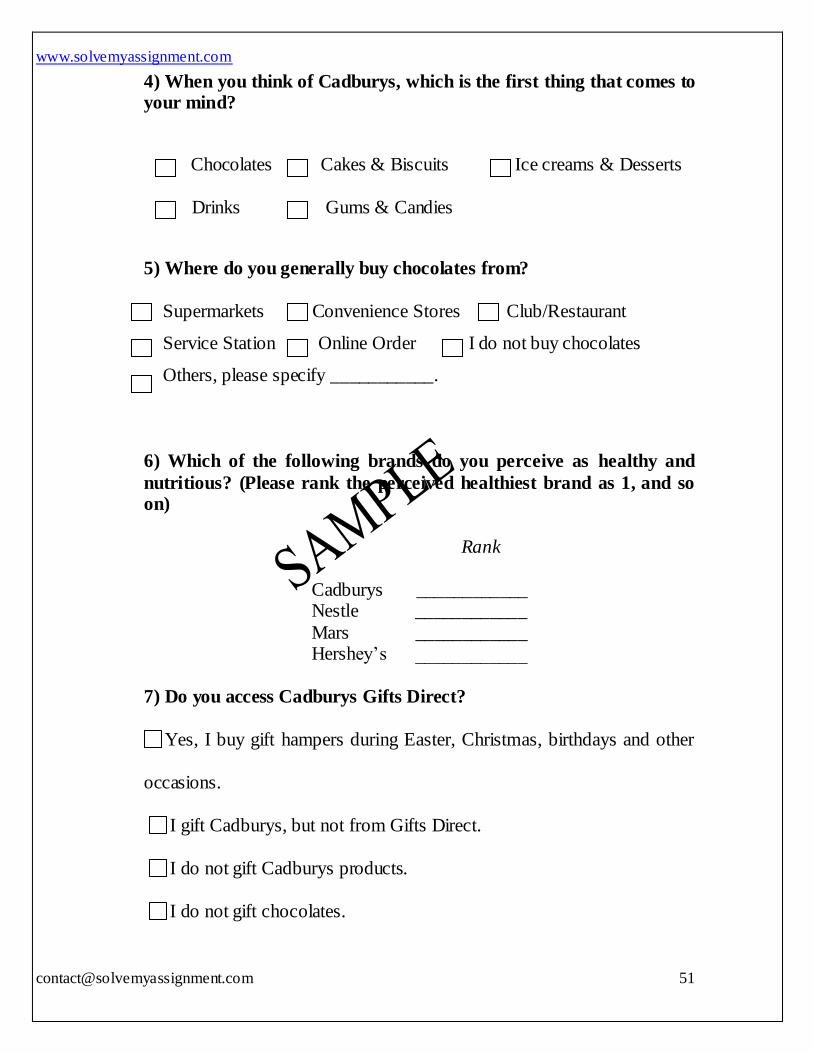
4) When you think of Cadburys, which is the first thing that comes to your mind?
Chocolates Cakes & Biscuits Ice creams & Desserts
Drinks Gums & Candies
5) Where do you generally buy chocolates from?
Supermarkets Convenience Stores Club/Restaurant
Service Station Online Order I do not buy chocolates
Others, please specify ___________.
6) Which of the following brands do you perceive as healthy and
nutritious? (Please rank the perceived healthiest brand as 1, and so on)
Rank
Cadburys ____________ Nestle ____________
Mars ____________ Hershey‟s ____________
7) Do you access Cadburys Gifts Direct?
Yes, I buy gift hampers during Easter, Christmas, birthdays and other
occasions.
I gift Cadburys, but not from Gifts Direct.
I do not gift Cadburys products.
I do not gift chocolates.
www.solvemyassignment.com
52
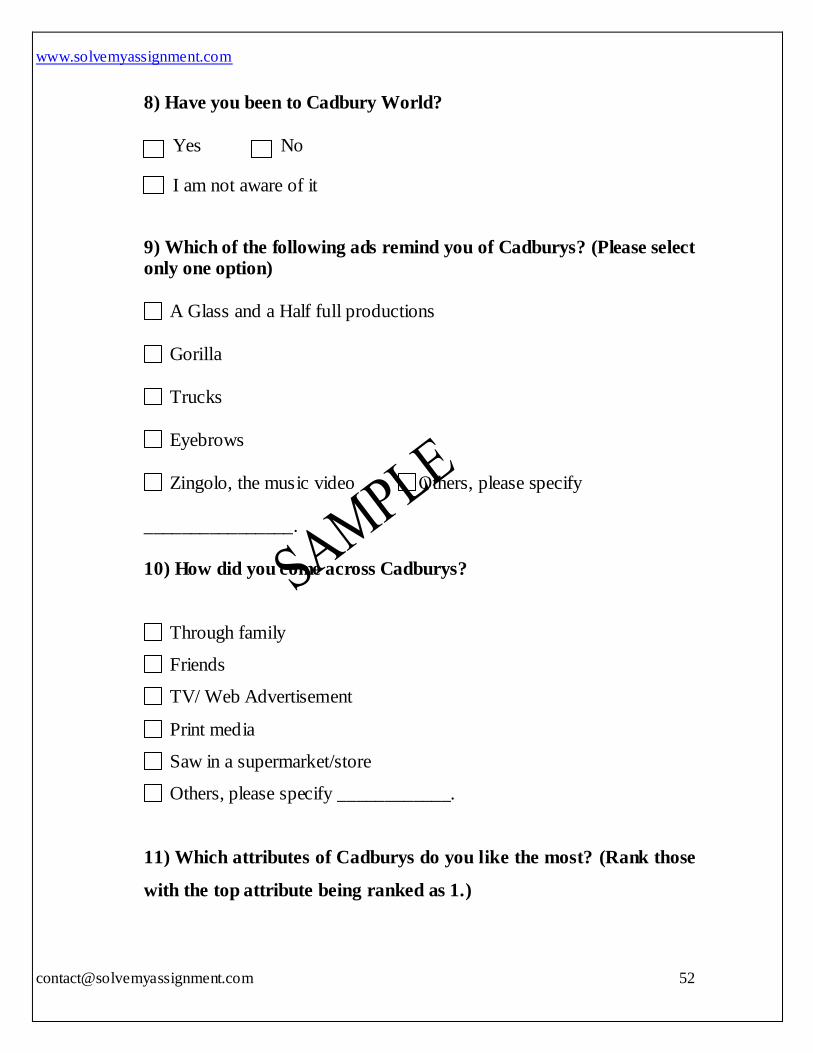
8) Have you been to Cadbury World?
Yes No
I am not aware of it
9) Which of the following ads remind you of Cadburys? (Please select only one option)
A Glass and a Half full productions
Gorilla
Trucks
Eyebrows
Zingolo, the music video Others, please specify
________________.
10) How did you come across Cadburys?
Through family
Friends
TV/ Web Advertisement
Print media
Saw in a supermarket/store
Others, please specify ____________.
11) Which attributes of Cadburys do you like the most? (Rank those
with the top attribute being ranked as 1.)
www.solvemyassignment.com
53
Rank
Packaging _______________
Quick Reach _______________
Superior Quality _______________
Budget friendly _______________
Availability in various sizes _______________
Nutrition & Health _______________
Taste _______________
Availability of Several Variants _______________
Innovative _______________
12) What more do you desire from Cadburys’ products?
Low fat
High Nutrition
Availability in broader volumes
Others, please specify
___________________________________________.
13) Why do you prefer Cadburys over other brands?
___________________________________________________________
___________________________________________________________
___________________________________________________________
Thanks for your support. For any queries, please feel free to contact us at _______________ and we will get back to you as soon as possible.
www.solvemyassignment.com
55
QUESTIONNAIRE
CADBURY PLC
Dear Sir/Madam
As part of a final year dissertation project, we are conducting a survey to
determine the brand popularity of Cadbury‟s. Your response would serve
as an invaluable input in our project better. Please spare a few minutes to
finish this questionnaire accurately.
The information collected during the survey would be kept confidential
and used for the stated purpose only. If you have any queries regarding
this project or any other concerns, please feel free to contact us at
_____________ and we‟ll get back to you as soon as possible.
We hope you find this survey interesting.
www.solvemyassignment.com
56
Please provide the following details:
Gender: Male Female
Occupation: Service Business Part time employee Student Retired Others, please specify
___________________.
Age group: < 18 years 18-30 years 31- 50 years
>50 years You are requested to select the option that comes to your mind instantaneously, without too much of deliberation.
1) How frequently do you consume chocolates?
All throughout the day Once in a day
Weekly Monthly Sometimes in a year
Never
2) Which of the following chocolates do you consume? (Please tick the relevant options)
Cadbury‟s Dairy Milk Nestle‟s Kit Kat Twirl TimeOut
Mars Snickers Wispa Aero
Nestle‟s After Eight Bournville Galaxy Milky
Way
Hershey‟s Chocolate Ferrero Rocher
Others, please specify _____________.
3) Which are your favorite three chocolate brands? (Rank 1 being the highest!)
1. ______________ 2. ______________
www.solvemyassignment.com
57
3. ______________
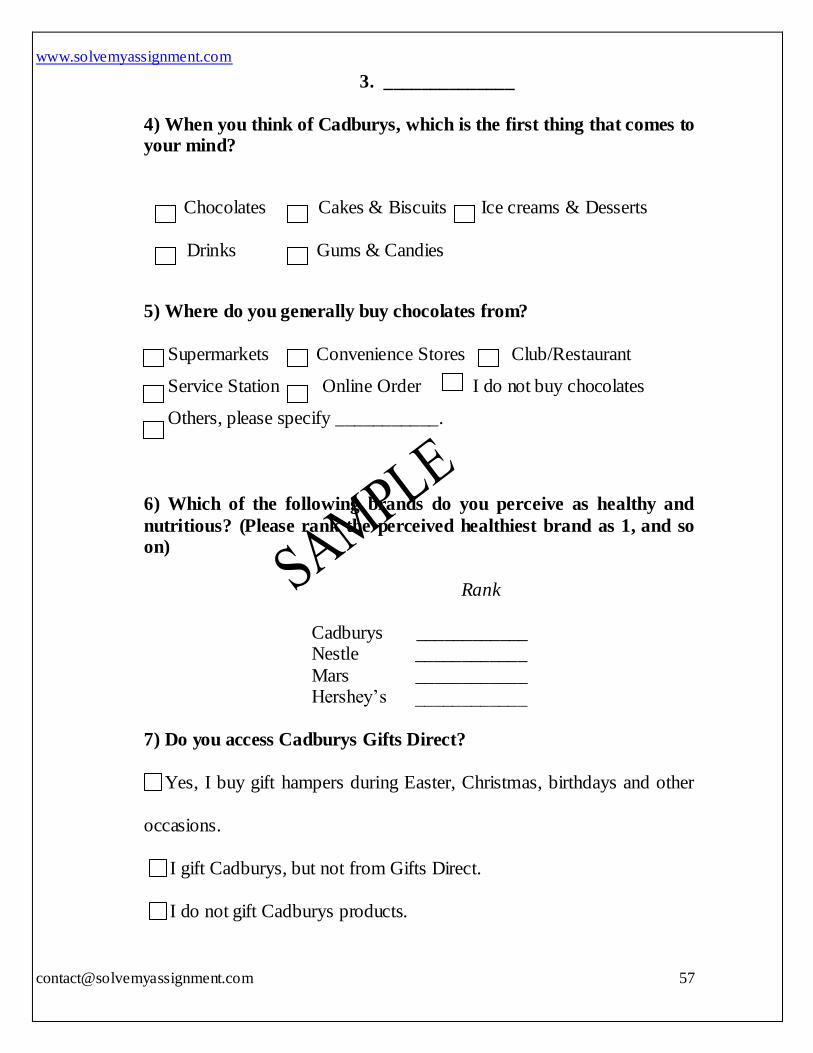
4) When you think of Cadburys, which is the first thing that comes to your mind?
Chocolates Cakes & Biscuits Ice creams & Desserts
Drinks Gums & Candies
5) Where do you generally buy chocolates from?
Supermarkets Convenience Stores Club/Restaurant
Service Station Online Order I do not buy chocolates
Others, please specify ___________.
6) Which of the following brands do you perceive as healthy and
nutritious? (Please rank the perceived healthiest brand as 1, and so on)
Rank
Cadburys ____________ Nestle ____________
Mars ____________ Hershey‟s ____________
7) Do you access Cadburys Gifts Direct?
Yes, I buy gift hampers during Easter, Christmas, birthdays and other
occasions.
I gift Cadburys, but not from Gifts Direct.
I do not gift Cadburys products.
www.solvemyassignment.com
58
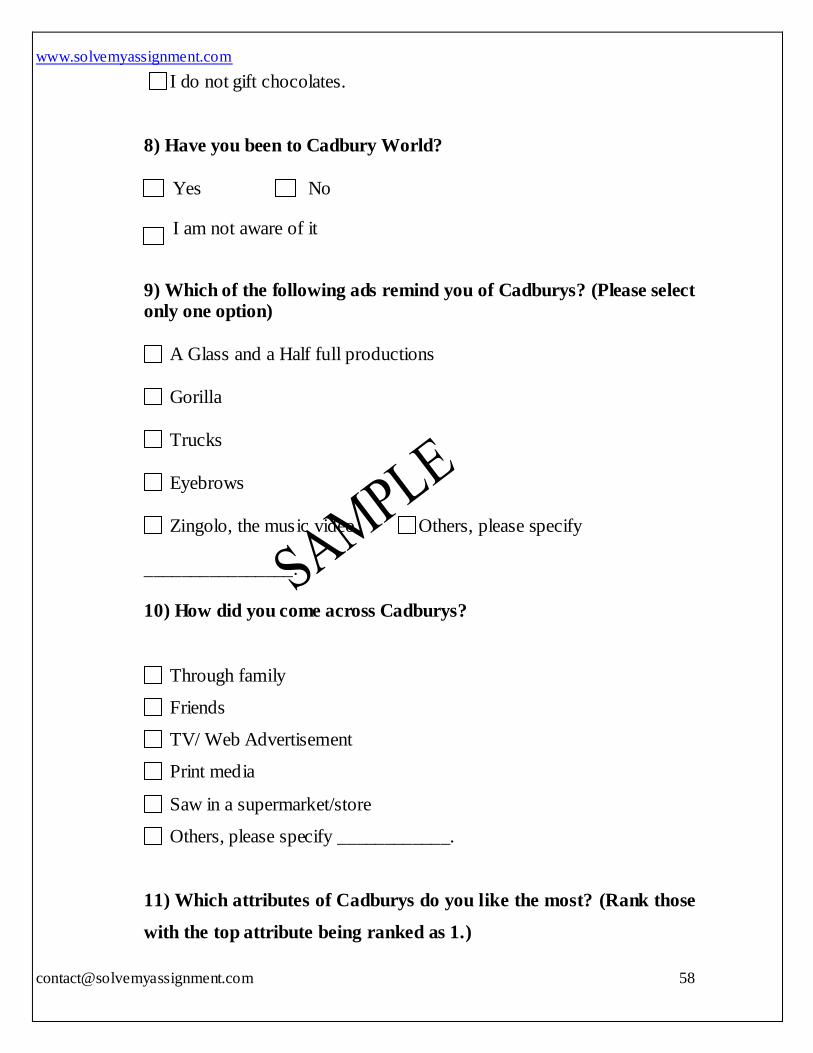
I do not gift chocolates.
8) Have you been to Cadbury World?
Yes No
I am not aware of it
9) Which of the following ads remind you of Cadburys? (Please select only one option)
A Glass and a Half full productions
Gorilla
Trucks
Eyebrows
Zingolo, the music video Others, please specify
________________.
10) How did you come across Cadburys?
Through family
Friends
TV/ Web Advertisement
Print media
Saw in a supermarket/store
Others, please specify ____________.
11) Which attributes of Cadburys do you like the most? (Rank those
with the top attribute being ranked as 1.)
www.solvemyassignment.com
59
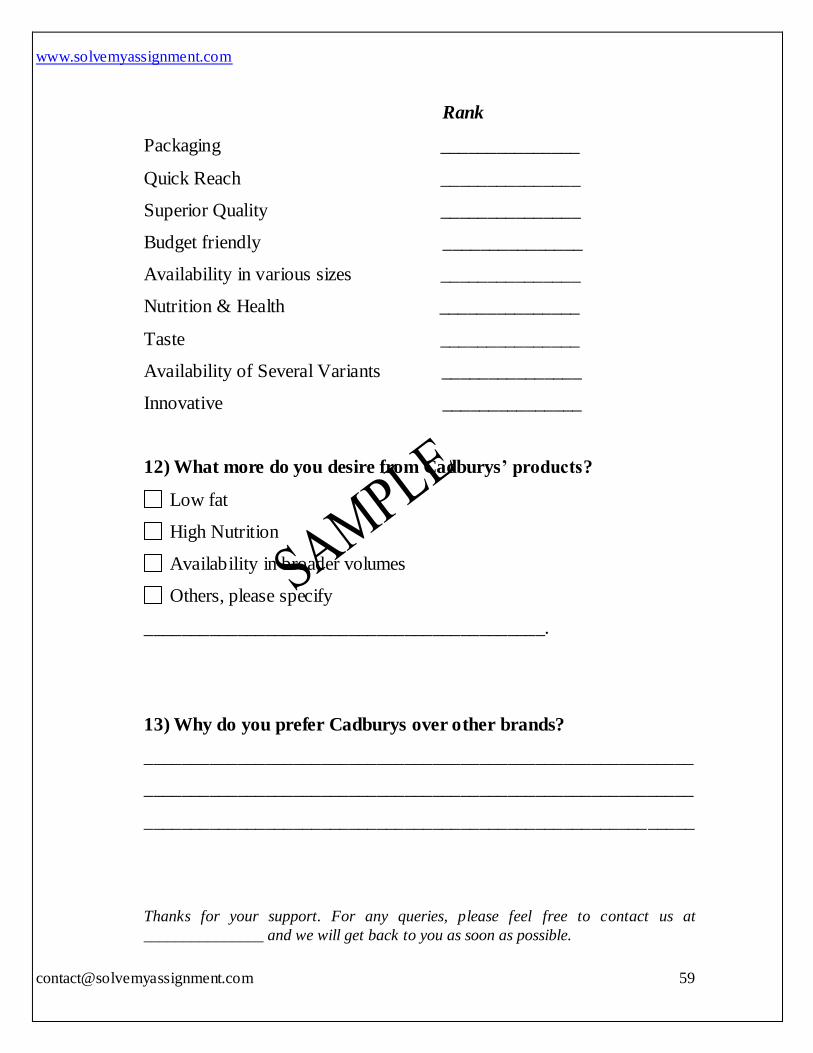
Rank
Packaging _______________
Quick Reach _______________
Superior Quality _______________
Budget friendly _______________
Availability in various sizes _______________
Nutrition & Health _______________
Taste _______________
Availability of Several Variants _______________
Innovative _______________
12) What more do you desire from Cadburys’ products?
Low fat
High Nutrition
Availability in broader volumes
Others, please specify
___________________________________________.
13) Why do you prefer Cadburys over other brands?
___________________________________________________________
___________________________________________________________
___________________________________________________________
Thanks for your support. For any queries, please feel free to contact us at
_______________ and we will get back to you as soon as possible.
www.solvemyassignment.com
60
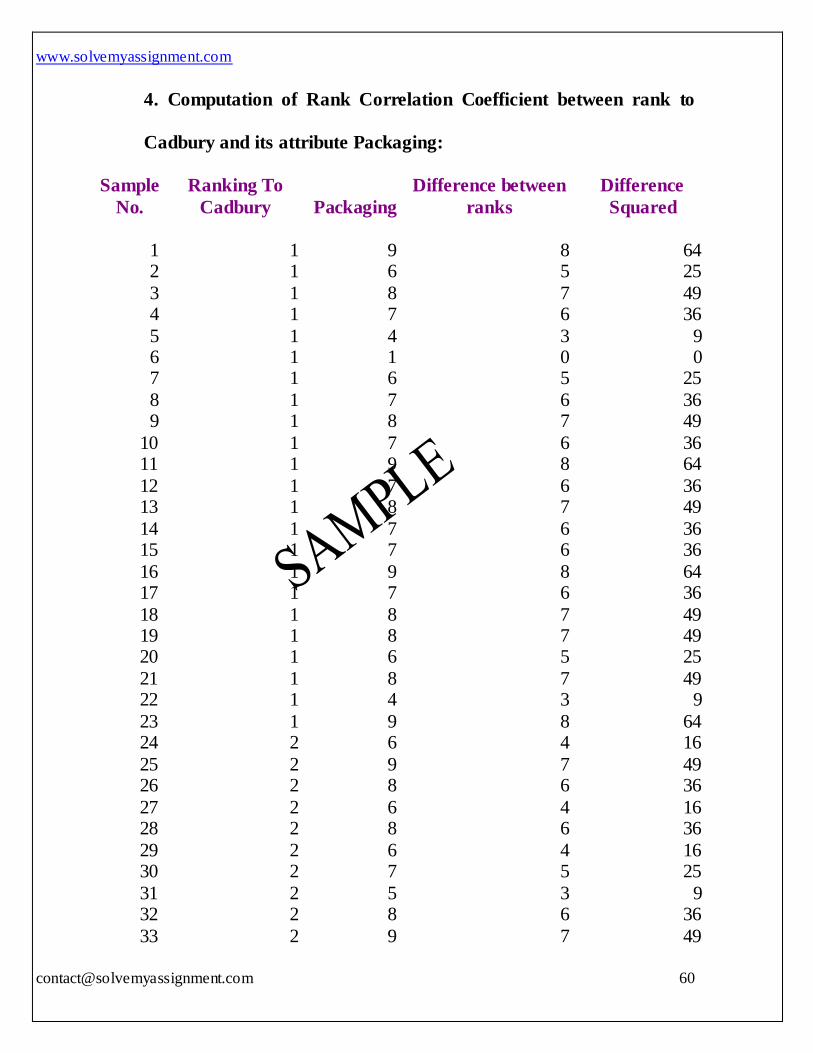
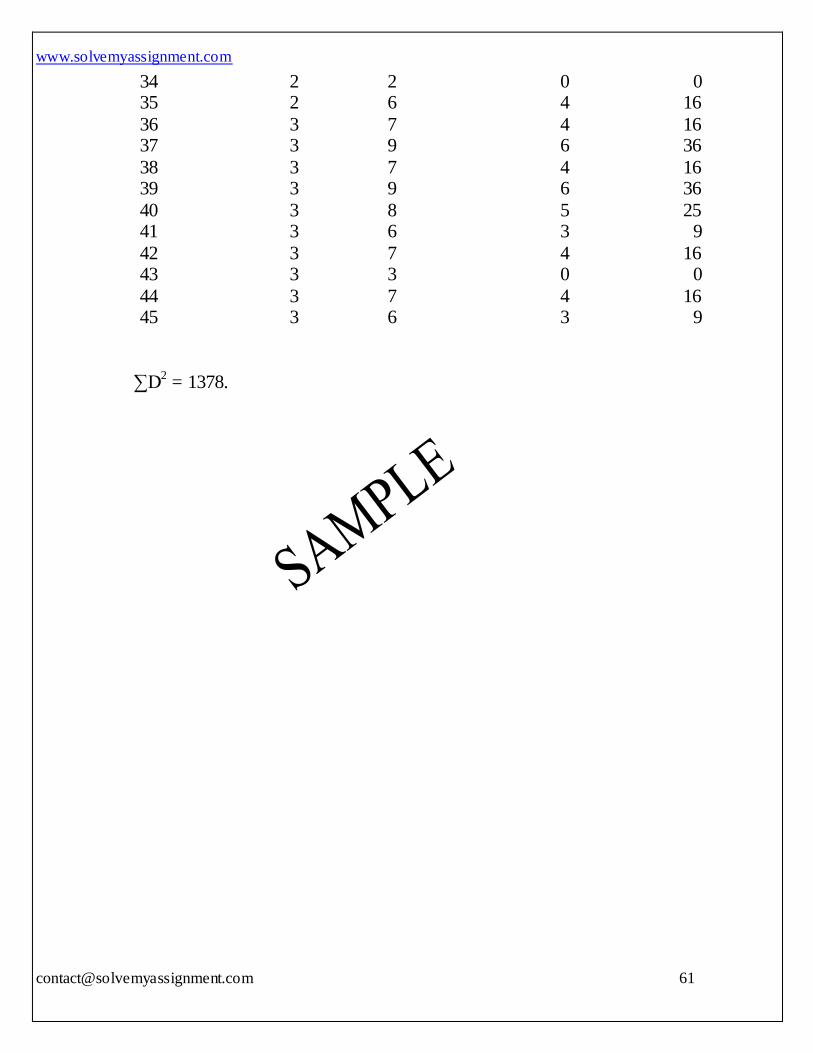
4. Computation of Rank Correlation Coefficient between rank to
Cadbury and its attribute Packaging:
Sample
No.
Ranking To
Cadbury Packaging
Difference between
ranks
Difference
Squared
1 1 9 8 64 2 1 6 5 25
3 1 8 7 49 4 1 7 6 36
5 1 4 3 9 6 1 1 0 0 7 1 6 5 25
8 1 7 6 36 9 1 8 7 49
10 1 7 6 36 11 1 9 8 64
12 1 7 6 36 13 1 8 7 49
14 1 7 6 36 15 1 7 6 36
16 1 9 8 64 17 1 7 6 36
18 1 8 7 49 19 1 8 7 49 20 1 6 5 25
21 1 8 7 49 22 1 4 3 9
23 1 9 8 64 24 2 6 4 16
25 2 9 7 49 26 2 8 6 36
27 2 6 4 16 28 2 8 6 36
29 2 6 4 16 30 2 7 5 25
31 2 5 3 9 32 2 8 6 36
33 2 9 7 49
www.solvemyassignment.com
61
34 2 2 0 0 35 2 6 4 16
36 3 7 4 16 37 3 9 6 36
38 3 7 4 16 39 3 9 6 36
40 3 8 5 25 41 3 6 3 9
42 3 7 4 16 43 3 3 0 0
44 3 7 4 16 45 3 6 3 9
∑D2 = 1378.
www.solvemyassignment.com
62
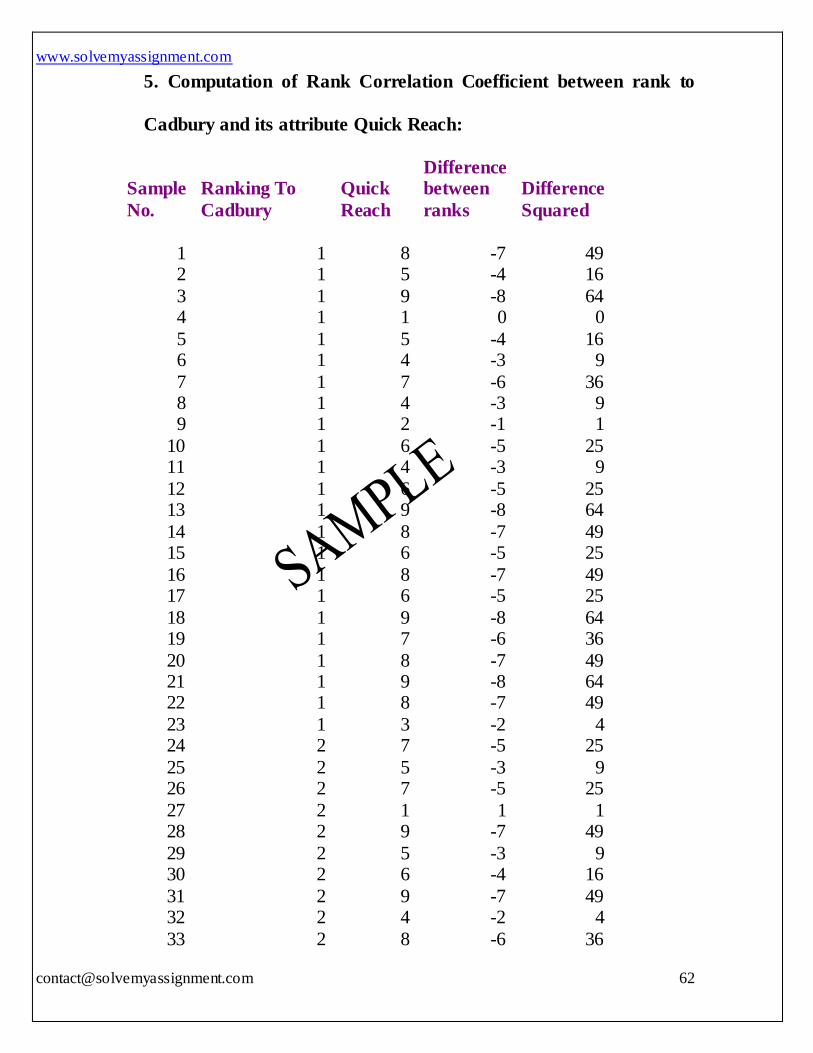
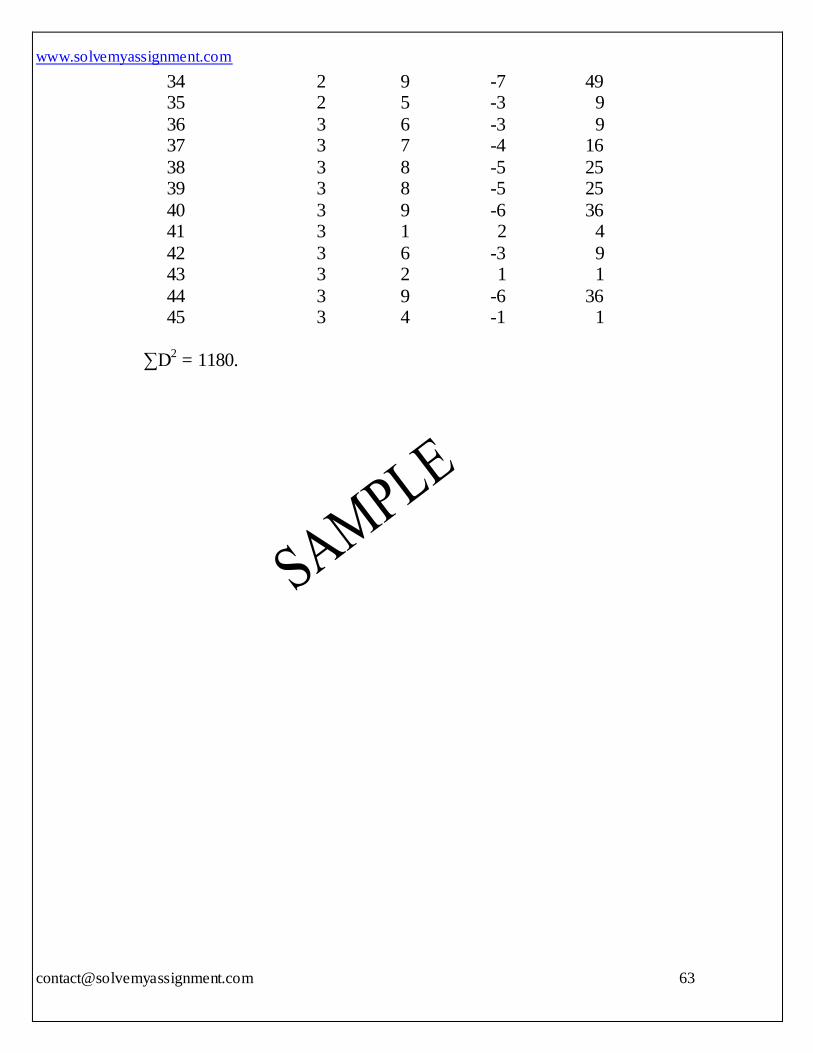
5. Computation of Rank Correlation Coefficient between rank to
Cadbury and its attribute Quick Reach:
Sample
No.
Ranking To
Cadbury
Quick
Reach
Difference between
ranks
Difference
Squared
1 1 8 -7 49 2 1 5 -4 16
3 1 9 -8 64 4 1 1 0 0
5 1 5 -4 16 6 1 4 -3 9
7 1 7 -6 36 8 1 4 -3 9 9 1 2 -1 1
10 1 6 -5 25 11 1 4 -3 9
12 1 6 -5 25 13 1 9 -8 64
14 1 8 -7 49 15 1 6 -5 25
16 1 8 -7 49 17 1 6 -5 25
18 1 9 -8 64 19 1 7 -6 36
20 1 8 -7 49 21 1 9 -8 64 22 1 8 -7 49
23 1 3 -2 4 24 2 7 -5 25
25 2 5 -3 9 26 2 7 -5 25
27 2 1 1 1 28 2 9 -7 49
29 2 5 -3 9 30 2 6 -4 16
31 2 9 -7 49 32 2 4 -2 4
33 2 8 -6 36
www.solvemyassignment.com
63
34 2 9 -7 49 35 2 5 -3 9
36 3 6 -3 9 37 3 7 -4 16
38 3 8 -5 25 39 3 8 -5 25
40 3 9 -6 36 41 3 1 2 4
42 3 6 -3 9 43 3 2 1 1
44 3 9 -6 36 45 3 4 -1 1
∑D
2 = 1180.
www.solvemyassignment.com
64
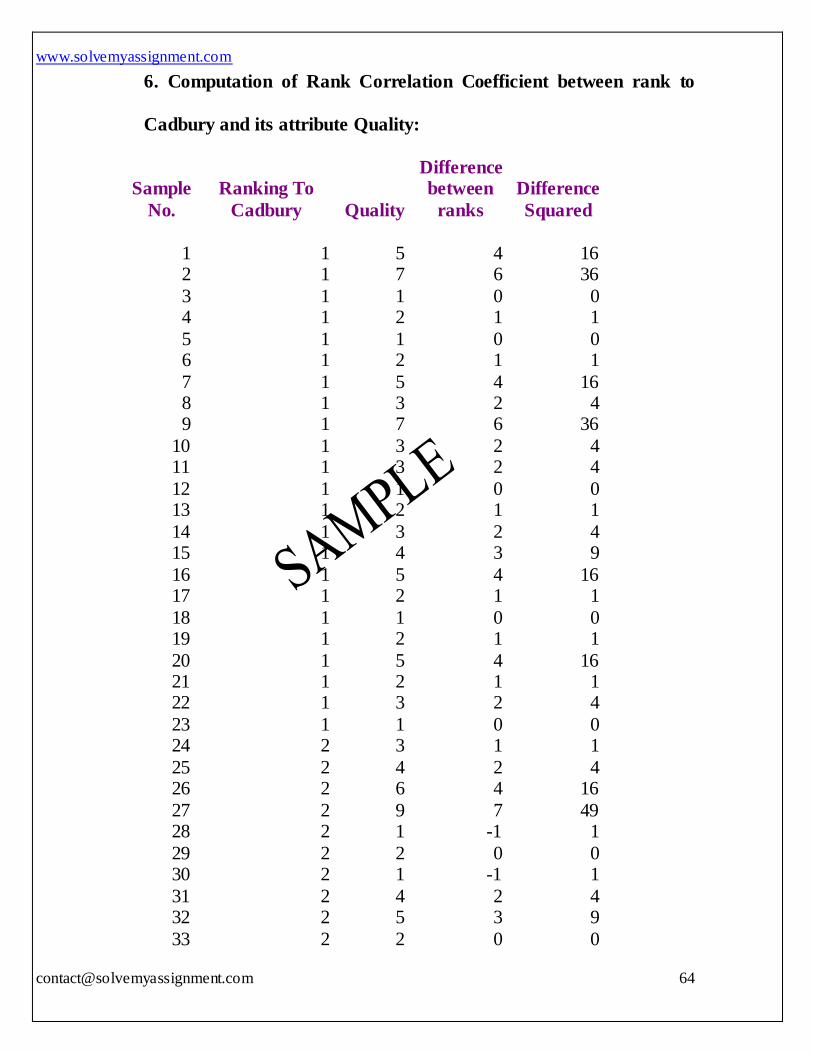
6. Computation of Rank Correlation Coefficient between rank to
Cadbury and its attribute Quality:
Sample
No.
Ranking To
Cadbury Quality
Difference between
ranks
Difference
Squared
1 1 5 4 16 2 1 7 6 36
3 1 1 0 0 4 1 2 1 1
5 1 1 0 0 6 1 2 1 1
7 1 5 4 16 8 1 3 2 4 9 1 7 6 36
10 1 3 2 4 11 1 3 2 4
12 1 1 0 0 13 1 2 1 1
14 1 3 2 4 15 1 4 3 9
16 1 5 4 16 17 1 2 1 1
18 1 1 0 0 19 1 2 1 1
20 1 5 4 16 21 1 2 1 1 22 1 3 2 4
23 1 1 0 0 24 2 3 1 1
25 2 4 2 4 26 2 6 4 16
27 2 9 7 49 28 2 1 -1 1
29 2 2 0 0 30 2 1 -1 1
31 2 4 2 4 32 2 5 3 9
33 2 2 0 0
www.solvemyassignment.com
65
34 2 1 -1 1 35 2 3 1 1
36 3 1 -2 4 37 3 2 -1 1
38 3 6 3 9 39 3 1 -2 4
40 3 2 -1 1 41 3 3 0 0
42 3 3 0 0 43 3 4 1 1
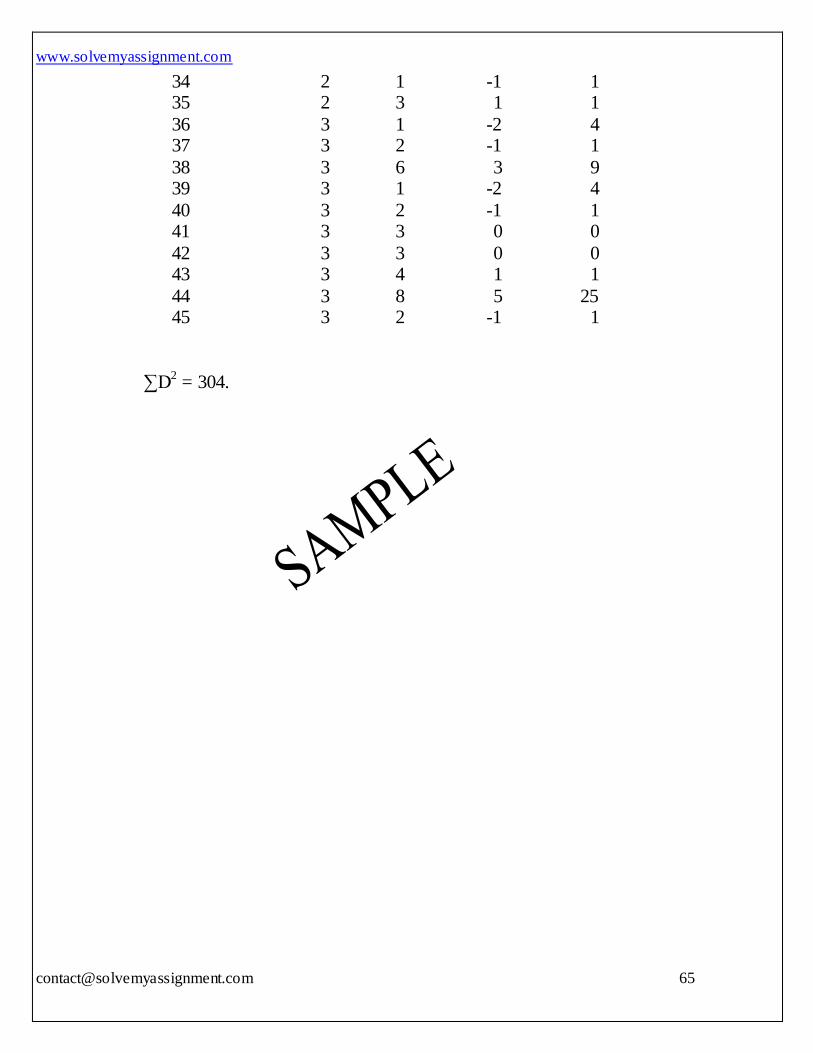
44 3 8 5 25 45 3 2 -1 1
∑D2 = 304.
www.solvemyassignment.com
66
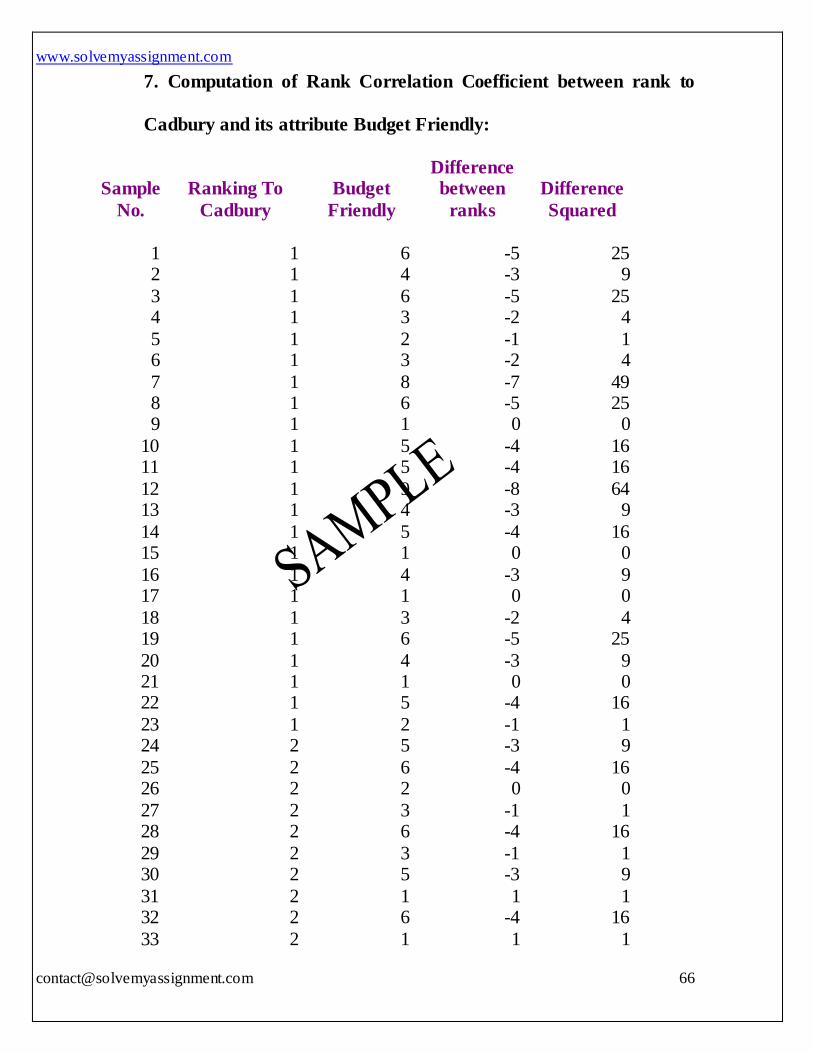
7. Computation of Rank Correlation Coefficient between rank to
Cadbury and its attribute Budget Friendly:
Sample
No.
Ranking To
Cadbury
Budget
Friendly
Difference between
ranks
Difference
Squared
1 1 6 -5 25 2 1 4 -3 9
3 1 6 -5 25 4 1 3 -2 4
5 1 2 -1 1 6 1 3 -2 4
7 1 8 -7 49 8 1 6 -5 25 9 1 1 0 0
10 1 5 -4 16 11 1 5 -4 16
12 1 9 -8 64 13 1 4 -3 9
14 1 5 -4 16 15 1 1 0 0
16 1 4 -3 9 17 1 1 0 0
18 1 3 -2 4 19 1 6 -5 25
20 1 4 -3 9 21 1 1 0 0 22 1 5 -4 16
23 1 2 -1 1 24 2 5 -3 9
25 2 6 -4 16 26 2 2 0 0
27 2 3 -1 1 28 2 6 -4 16
29 2 3 -1 1 30 2 5 -3 9
31 2 1 1 1 32 2 6 -4 16
33 2 1 1 1
www.solvemyassignment.com
67
34 2 4 -2 4 35 2 4 -2 4
36 3 3 0 0 37 3 5 -2 4
38 3 5 -2 4 39 3 7 -4 16
40 3 6 -3 9 41 3 8 -5 25
42 3 4 -1 1 43 3 1 2 4
44 3 2 1 1 45 3 3 0 0
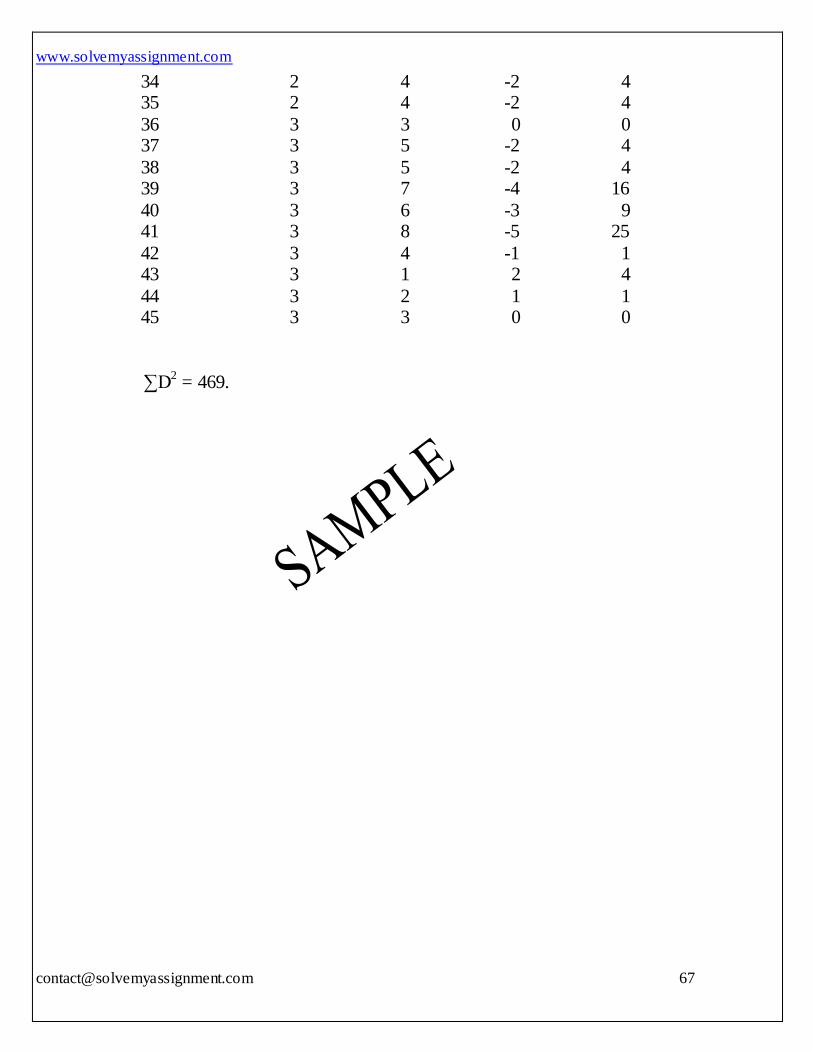
∑D2 = 469.
www.solvemyassignment.com
68
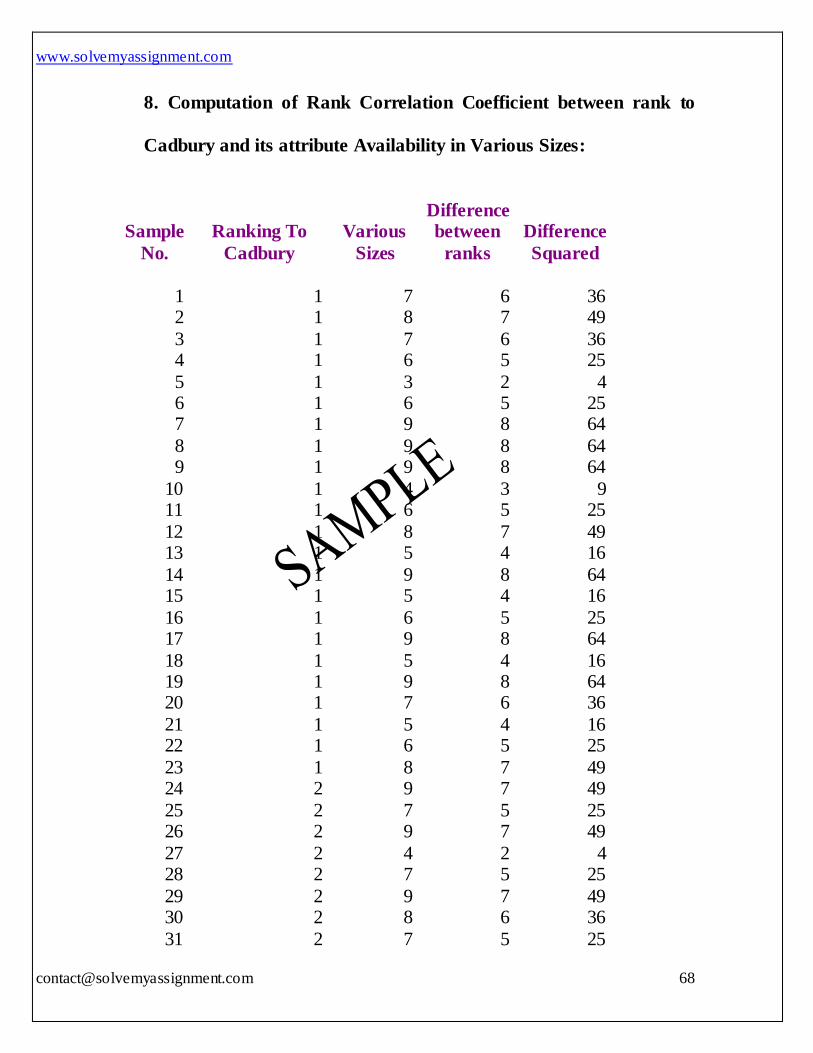
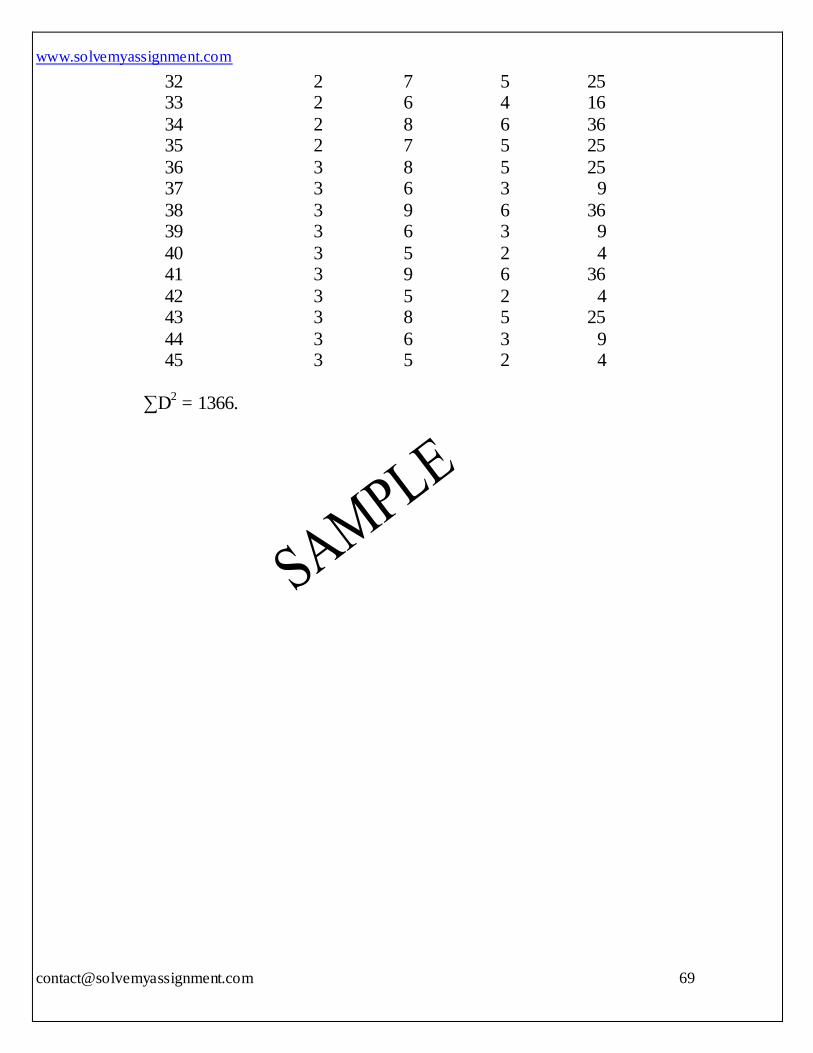
8. Computation of Rank Correlation Coefficient between rank to
Cadbury and its attribute Availability in Various Sizes:
Sample
No.
Ranking To
Cadbury
Various
Sizes
Difference between
ranks
Difference
Squared
1 1 7 6 36 2 1 8 7 49
3 1 7 6 36 4 1 6 5 25
5 1 3 2 4 6 1 6 5 25 7 1 9 8 64
8 1 9 8 64 9 1 9 8 64
10 1 4 3 9 11 1 6 5 25
12 1 8 7 49 13 1 5 4 16
14 1 9 8 64 15 1 5 4 16
16 1 6 5 25 17 1 9 8 64
18 1 5 4 16 19 1 9 8 64 20 1 7 6 36
21 1 5 4 16 22 1 6 5 25
23 1 8 7 49 24 2 9 7 49
25 2 7 5 25 26 2 9 7 49
27 2 4 2 4 28 2 7 5 25
29 2 9 7 49 30 2 8 6 36
31 2 7 5 25
www.solvemyassignment.com
69
32 2 7 5 25 33 2 6 4 16
34 2 8 6 36 35 2 7 5 25
36 3 8 5 25 37 3 6 3 9
38 3 9 6 36 39 3 6 3 9
40 3 5 2 4 41 3 9 6 36
42 3 5 2 4 43 3 8 5 25
44 3 6 3 9 45 3 5 2 4
∑D
2 = 1366.
www.solvemyassignment.com
70
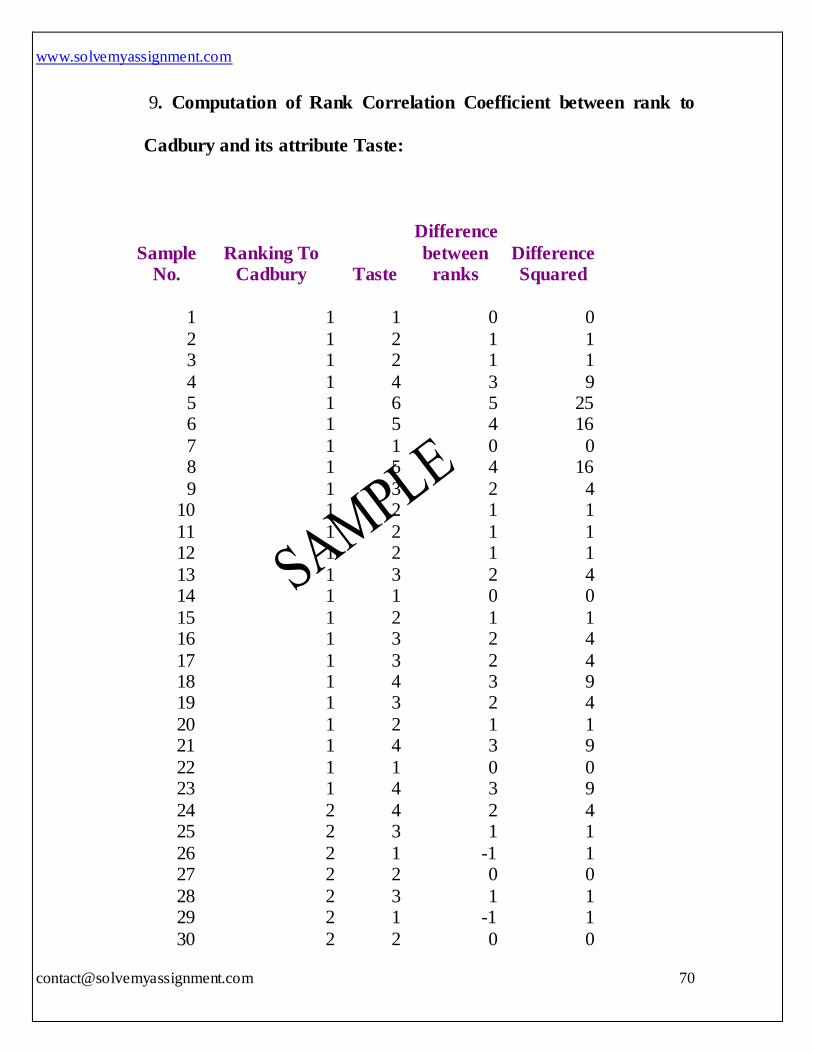
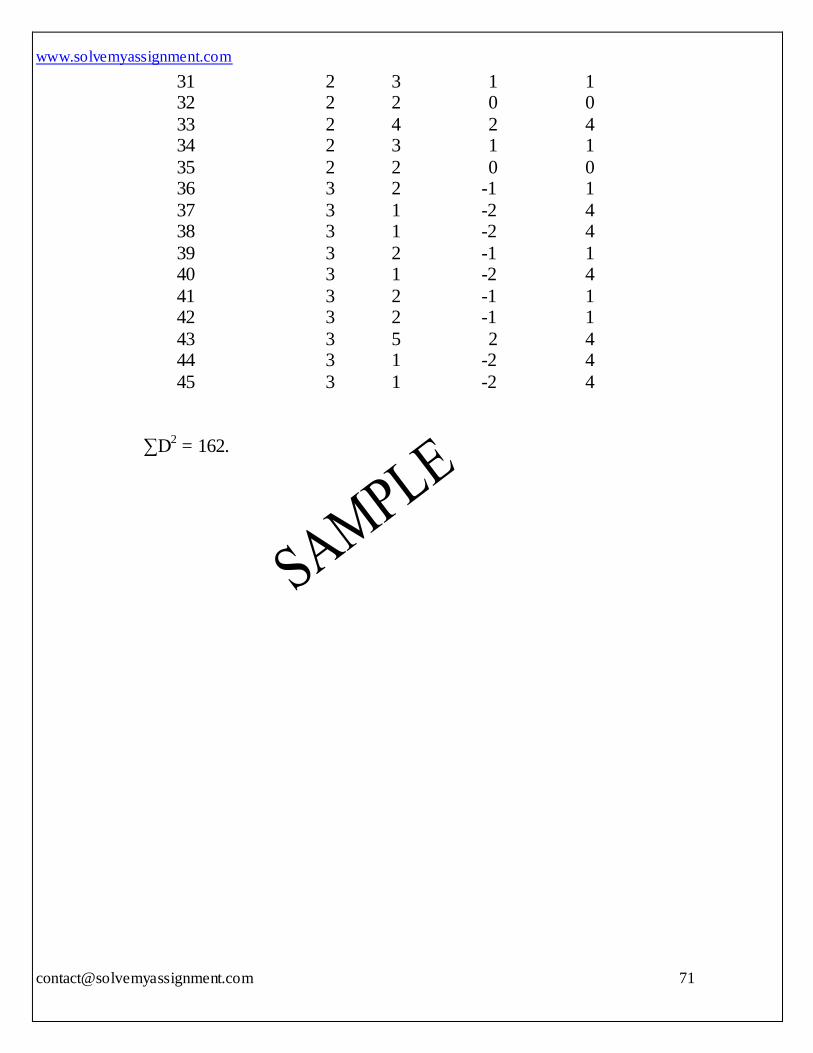
9. Computation of Rank Correlation Coefficient between rank to
Cadbury and its attribute Taste:
Sample No.
Ranking To Cadbury Taste
Difference
between ranks
Difference Squared
1 1 1 0 0
2 1 2 1 1 3 1 2 1 1
4 1 4 3 9 5 1 6 5 25 6 1 5 4 16
7 1 1 0 0 8 1 5 4 16
9 1 3 2 4 10 1 2 1 1
11 1 2 1 1 12 1 2 1 1
13 1 3 2 4 14 1 1 0 0
15 1 2 1 1 16 1 3 2 4
17 1 3 2 4 18 1 4 3 9 19 1 3 2 4
20 1 2 1 1 21 1 4 3 9
22 1 1 0 0 23 1 4 3 9
24 2 4 2 4 25 2 3 1 1
26 2 1 -1 1 27 2 2 0 0
28 2 3 1 1 29 2 1 -1 1
30 2 2 0 0
www.solvemyassignment.com
71
31 2 3 1 1 32 2 2 0 0
33 2 4 2 4 34 2 3 1 1
35 2 2 0 0 36 3 2 -1 1
37 3 1 -2 4 38 3 1 -2 4
39 3 2 -1 1 40 3 1 -2 4
41 3 2 -1 1 42 3 2 -1 1
43 3 5 2 4 44 3 1 -2 4
45 3 1 -2 4
∑D2 = 162.
www.solvemyassignment.com
72
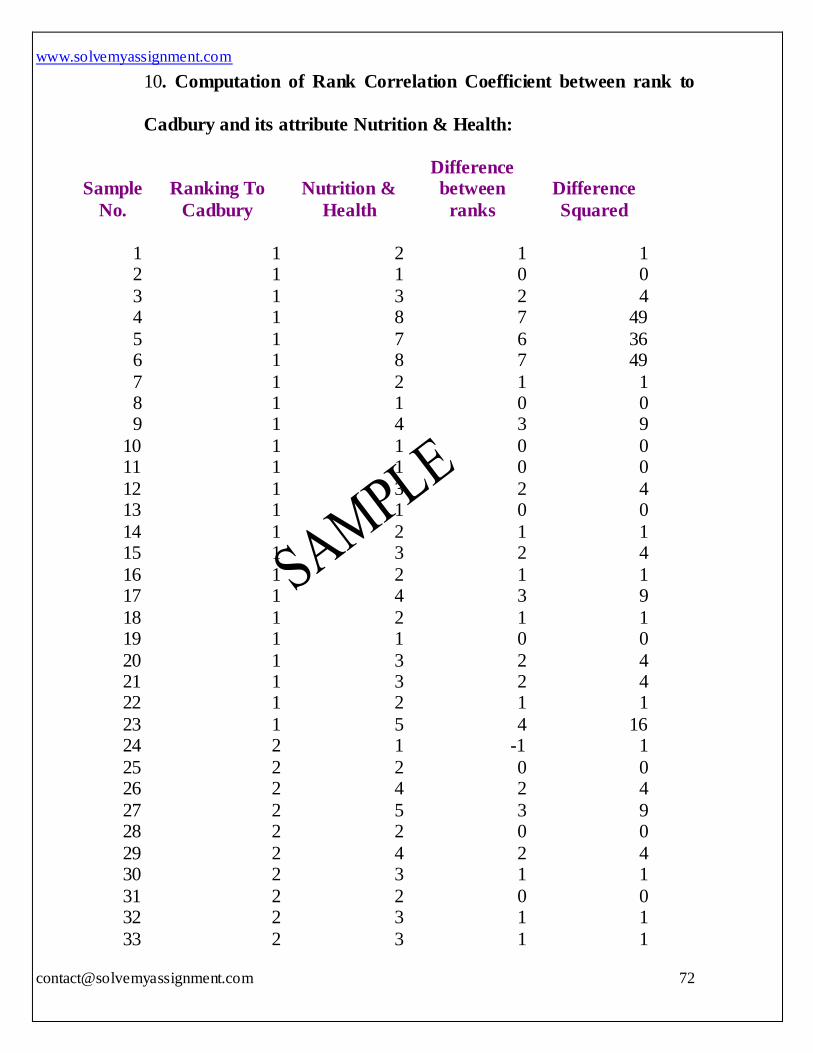
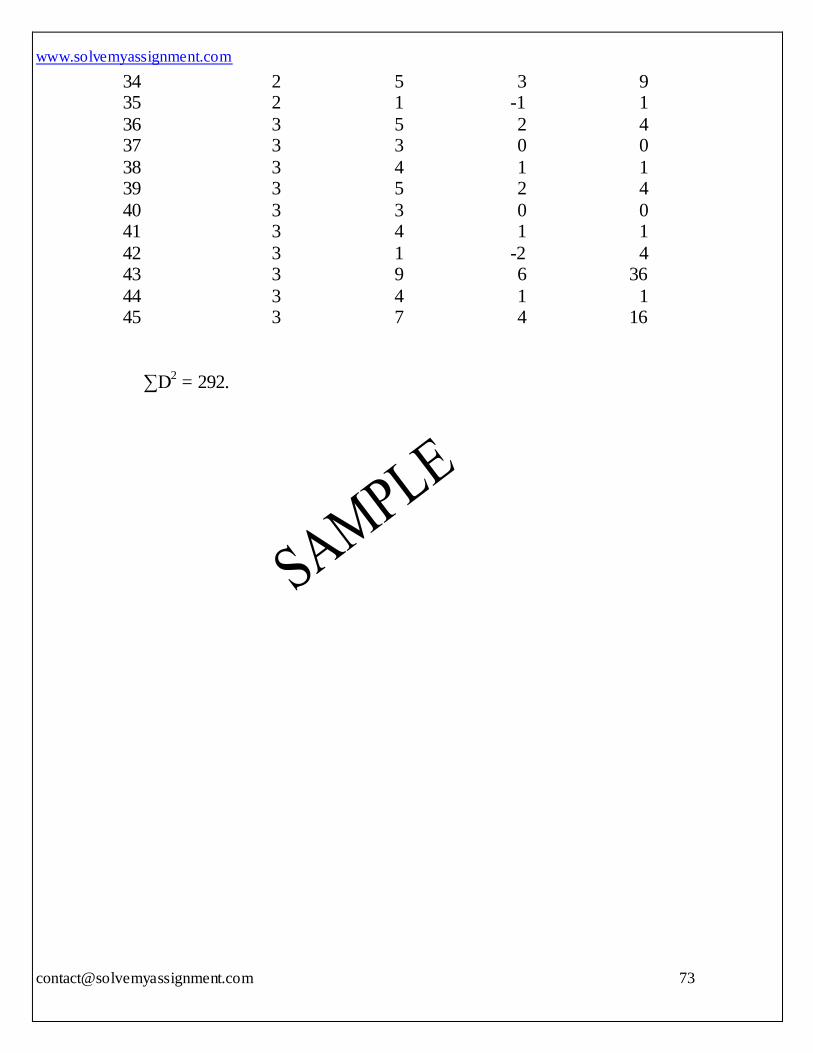
10. Computation of Rank Correlation Coefficient between rank to
Cadbury and its attribute Nutrition & Health:
Sample
No.
Ranking To
Cadbury
Nutrition &
Health
Difference between
ranks
Difference
Squared
1 1 2 1 1 2 1 1 0 0
3 1 3 2 4 4 1 8 7 49
5 1 7 6 36 6 1 8 7 49
7 1 2 1 1 8 1 1 0 0 9 1 4 3 9
10 1 1 0 0 11 1 1 0 0
12 1 3 2 4 13 1 1 0 0
14 1 2 1 1 15 1 3 2 4
16 1 2 1 1 17 1 4 3 9
18 1 2 1 1 19 1 1 0 0
20 1 3 2 4 21 1 3 2 4 22 1 2 1 1
23 1 5 4 16 24 2 1 -1 1
25 2 2 0 0 26 2 4 2 4
27 2 5 3 9 28 2 2 0 0
29 2 4 2 4 30 2 3 1 1
31 2 2 0 0 32 2 3 1 1
33 2 3 1 1
www.solvemyassignment.com
73
34 2 5 3 9 35 2 1 -1 1
36 3 5 2 4 37 3 3 0 0
38 3 4 1 1 39 3 5 2 4
40 3 3 0 0 41 3 4 1 1
42 3 1 -2 4 43 3 9 6 36
44 3 4 1 1 45 3 7 4 16
∑D2 = 292.
www.solvemyassignment.com
74
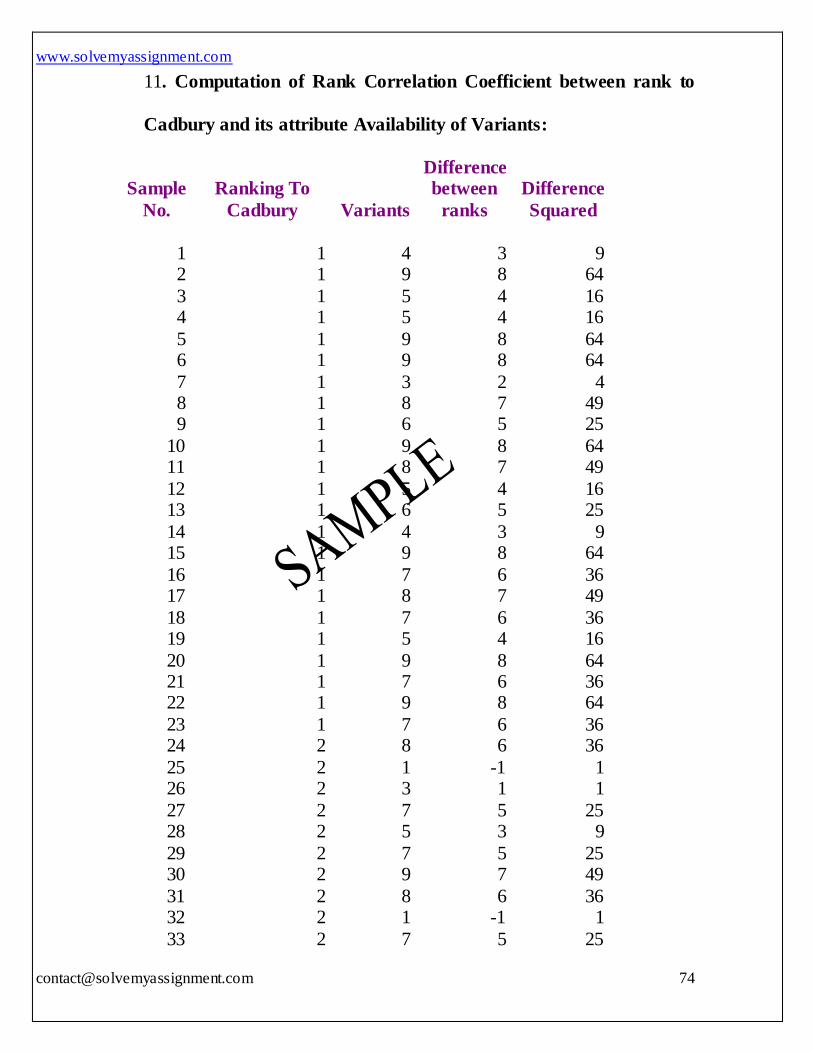
11. Computation of Rank Correlation Coefficient between rank to
Cadbury and its attribute Availability of Variants:
Sample
No.
Ranking To
Cadbury Variants
Difference between
ranks
Difference
Squared
1 1 4 3 9 2 1 9 8 64
3 1 5 4 16 4 1 5 4 16
5 1 9 8 64 6 1 9 8 64
7 1 3 2 4 8 1 8 7 49 9 1 6 5 25
10 1 9 8 64 11 1 8 7 49
12 1 5 4 16 13 1 6 5 25
14 1 4 3 9 15 1 9 8 64
16 1 7 6 36 17 1 8 7 49
18 1 7 6 36 19 1 5 4 16
20 1 9 8 64 21 1 7 6 36 22 1 9 8 64
23 1 7 6 36 24 2 8 6 36
25 2 1 -1 1 26 2 3 1 1
27 2 7 5 25 28 2 5 3 9
29 2 7 5 25 30 2 9 7 49
31 2 8 6 36 32 2 1 -1 1
33 2 7 5 25

www.solvemyassignment.com
75
34 2 6 4 16 35 2 8 6 36
36 3 9 6 36 37 3 8 5 25
38 3 3 0 0 39 3 4 1 1
40 3 7 4 16 41 3 7 4 16
42 3 8 5 25 43 3 7 4 16
44 3 5 2 4 45 3 8 5 25
∑D2 = 1299.
www.solvemyassignment.com
76
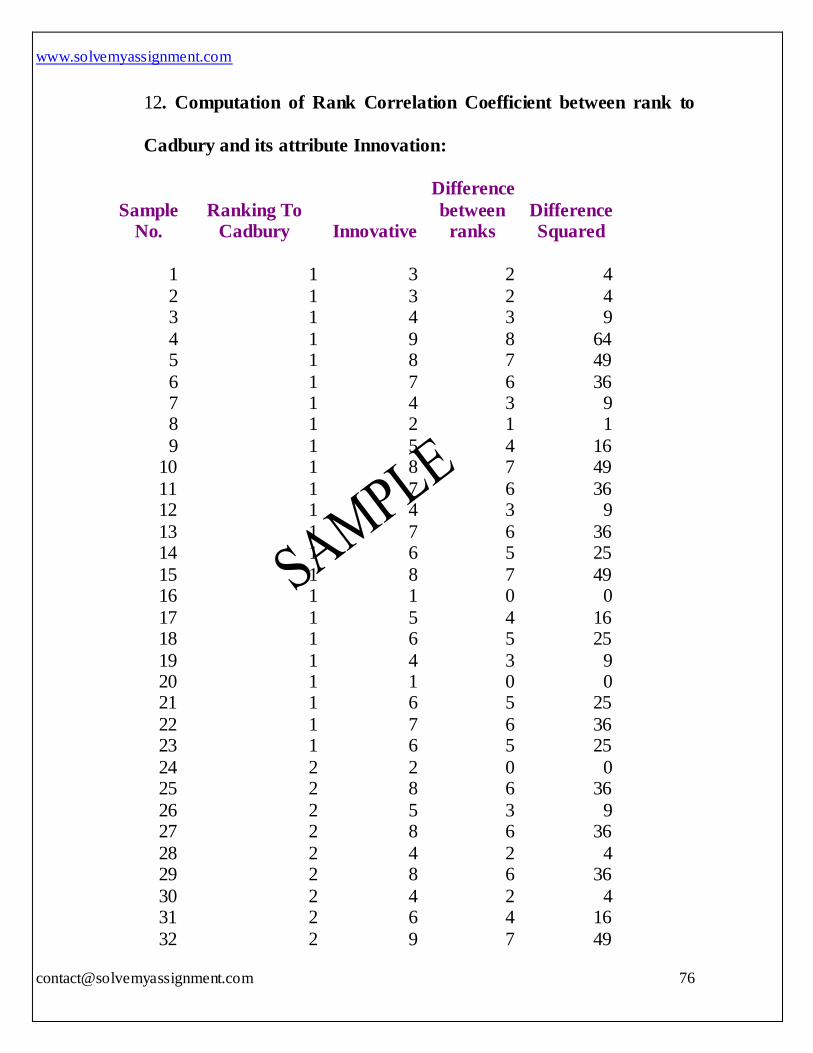
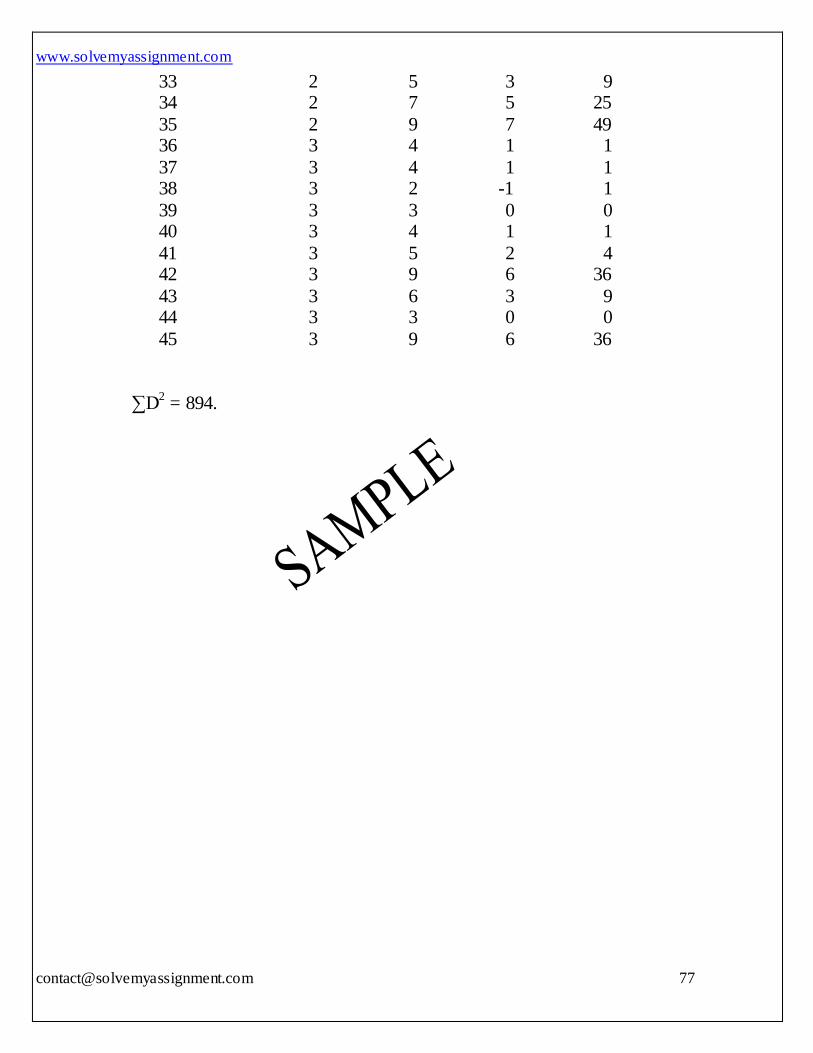
12. Computation of Rank Correlation Coefficient between rank to
Cadbury and its attribute Innovation:
Sample No.
Ranking To Cadbury Innovative
Difference
between ranks
Difference Squared
1 1 3 2 4
2 1 3 2 4 3 1 4 3 9
4 1 9 8 64 5 1 8 7 49
6 1 7 6 36 7 1 4 3 9 8 1 2 1 1
9 1 5 4 16 10 1 8 7 49
11 1 7 6 36 12 1 4 3 9
13 1 7 6 36 14 1 6 5 25
15 1 8 7 49 16 1 1 0 0
17 1 5 4 16 18 1 6 5 25
19 1 4 3 9 20 1 1 0 0 21 1 6 5 25
22 1 7 6 36 23 1 6 5 25
24 2 2 0 0 25 2 8 6 36
26 2 5 3 9 27 2 8 6 36
28 2 4 2 4 29 2 8 6 36
30 2 4 2 4 31 2 6 4 16
32 2 9 7 49
www.solvemyassignment.com
77
33 2 5 3 9 34 2 7 5 25
35 2 9 7 49 36 3 4 1 1
37 3 4 1 1 38 3 2 -1 1
39 3 3 0 0 40 3 4 1 1
41 3 5 2 4 42 3 9 6 36
43 3 6 3 9 44 3 3 0 0
45 3 9 6 36
∑D2 = 894.
www.solvemyassignment.com
78
13. Brand Positioning Map for Cadbury
Key:
Cadbury
Nestlé
Mars
Hershey’s
Ferrero Rotcher
VERY GOOD
HIGH LOW
TASTELESS HE
AL
TH
Y &
NU
TR
ITIV
E V
AL
UE
TASTE