c1109 evidence in real world final e
DESCRIPTION
real world evidenceTRANSCRIPT
Using Evidence in the Real World
John Doe
Date
Outline
• Evidence-Based Medicine Framework
• Assessing Evidence: The Science of Critiquing Papers
• Basic Medical Statistics
• Insulin Analogues: Systematic Review
• Economics: Additional Evidence
• Blood Glucose Test Strips for Self-Monitoring of Blood Glucose
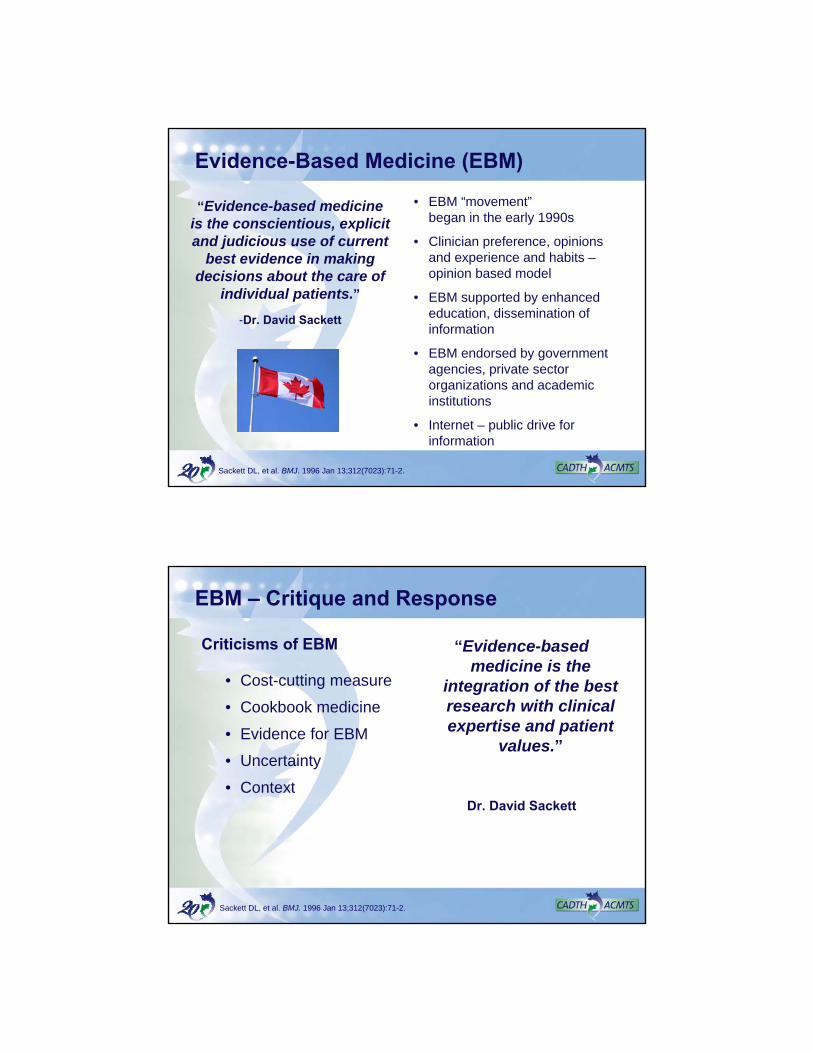
Evidence-Based Medicine (EBM)
“Evidence-based medicine is the conscientious, explicit and judicious use of current
best evidence in making decisions about the care of
individual patients.”
-Dr. David Sackett
• EBM “movement”began in the early 1990s
• Clinician preference, opinions and experience and habits –opinion based model
• EBM supported by enhanced education, dissemination of information
• EBM endorsed by government agencies, private sector organizations and academic institutions
• Internet – public drive for information
Sackett DL, et al. BMJ. 1996 Jan 13;312(7023):71-2.
EBM – Critique and Response
Criticisms of EBM
• Cost-cutting measure
• Cookbook medicine
• Evidence for EBM
• Uncertainty
• Context
“Evidence-based medicine is the
integration of the best research with clinical expertise and patient
values.”
Dr. David Sackett
Sackett DL, et al. BMJ. 1996 Jan 13;312(7023):71-2.
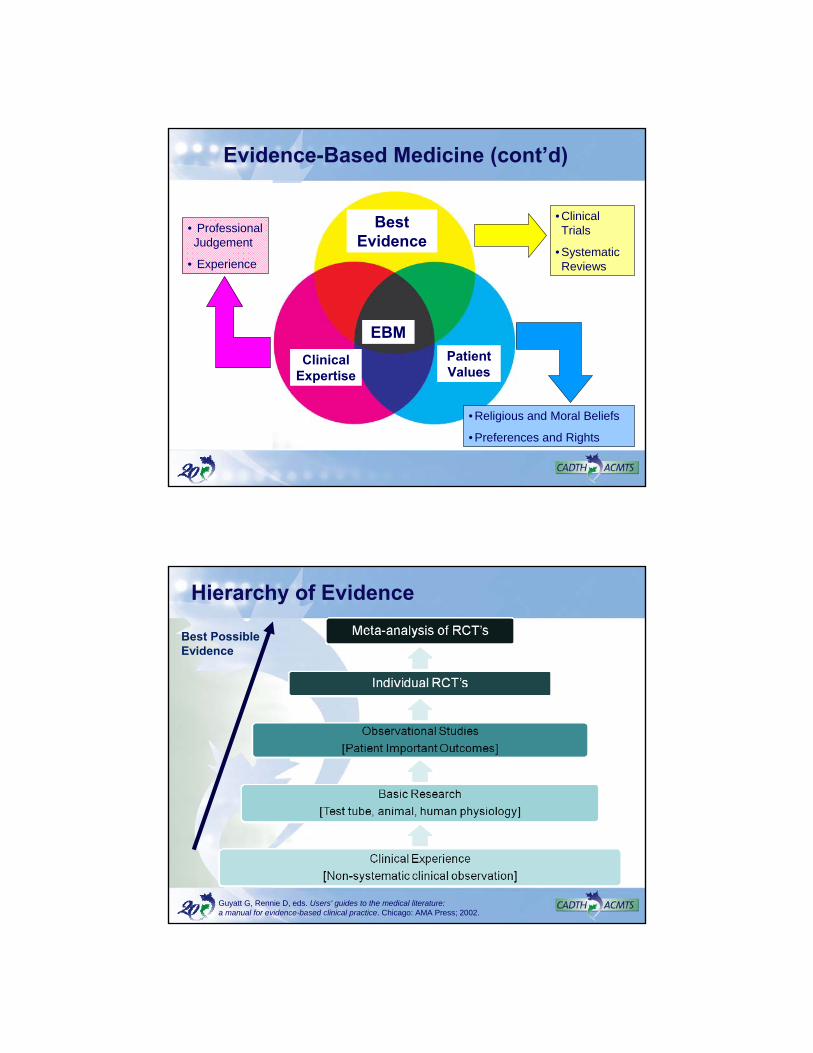
Patient Values
Best Evidence
Clinical Expertise
• Professional Judgement
• Experience
EBM
• Religious and Moral Beliefs
• Preferences and Rights
• Clinical Trials
• Systematic Reviews
Evidence-Based Medicine (cont’d)
Hierarchy of Evidence
Best Possible Evidence
Guyatt G, Rennie D, eds. Users' guides to the medical literature: a manual for evidence-based clinical practice. Chicago: AMA Press; 2002.
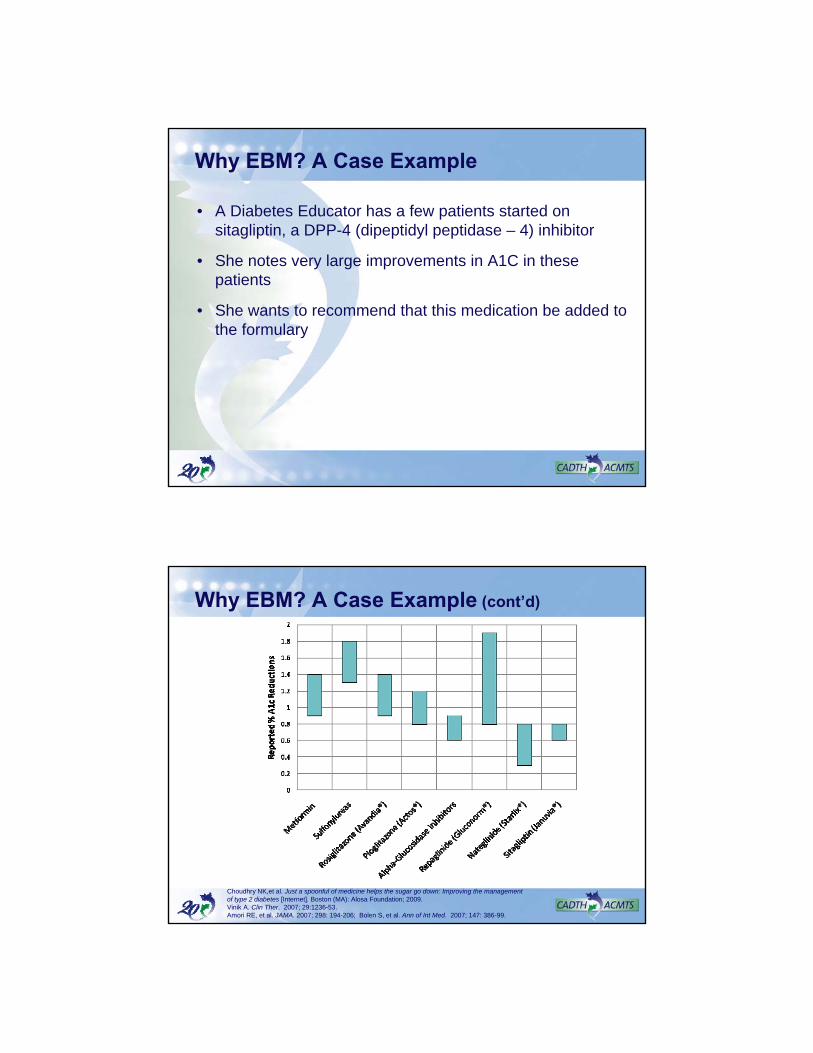
Why EBM? A Case Example
• A Diabetes Educator has a few patients started on sitagliptin, a DPP-4 (dipeptidyl peptidase – 4) inhibitor
• She notes very large improvements in A1C in these patients
• She wants to recommend that this medication be added to the formulary
Why EBM? A Case Example (cont’d)
Choudhry NK,et al. Just a spoonful of medicine helps the sugar go down: Improving the management of type 2 diabetes [Internet]. Boston (MA): Alosa Foundation; 2009. Vinik A. Clin Ther. 2007; 29:1236-53.Amori RE, et al. JAMA. 2007; 298: 194-206; Bolen S, et al. Ann of Int Med. 2007; 147: 386-99.
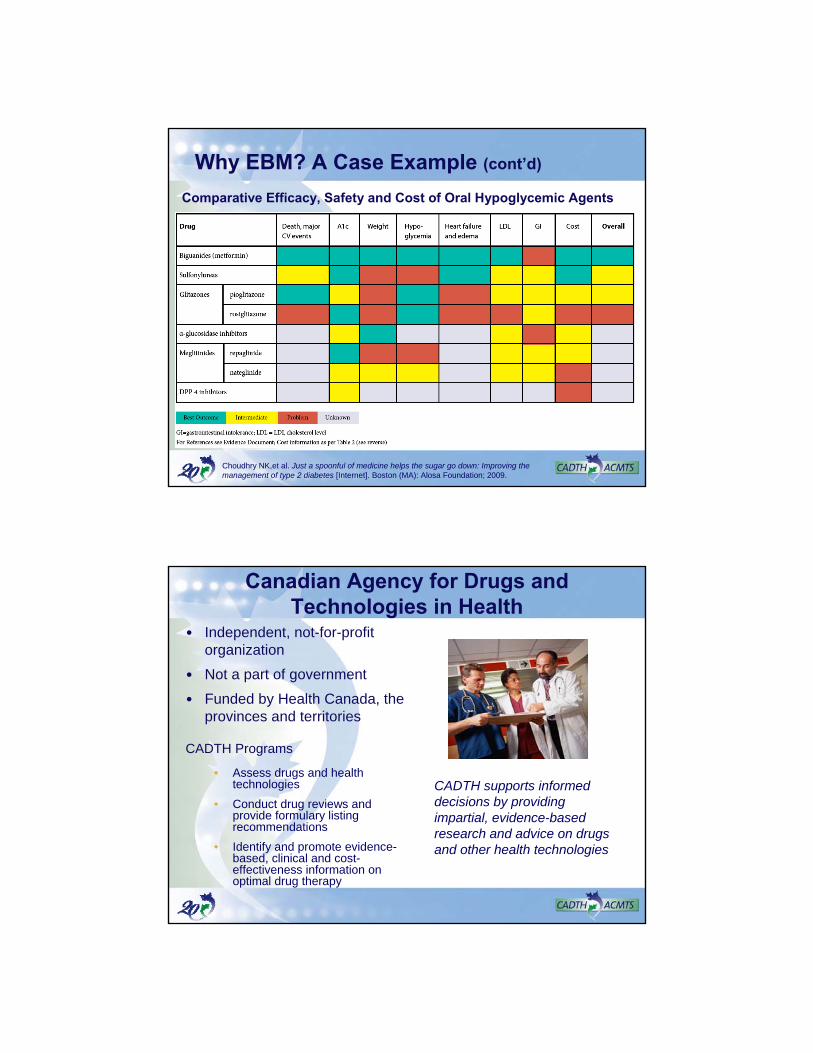
Why EBM? A Case Example (cont’d)
Comparative Efficacy, Safety and Cost of Oral Hypoglycemic Agents
Choudhry NK,et al. Just a spoonful of medicine helps the sugar go down: Improving the management of type 2 diabetes [Internet]. Boston (MA): Alosa Foundation; 2009.
Canadian Agency for Drugs and Technologies in Health
CADTH supports informed decisions by providing impartial, evidence-based research and advice on drugs and other health technologies
• Independent, not-for-profit organization
• Not a part of government
• Funded by Health Canada, the provinces and territories
CADTH Programs
• Assess drugs and health technologies
• Conduct drug reviews and provide formulary listing recommendations
• Identify and promote evidence-based, clinical and cost-effectiveness information on optimal drug therapy
Assessing Evidence:The Science of Critiquing Papers
• What is the study about?
• Was the study design reasonable?
• Was the comparator appropriate?
• How was the outcome measured?
• Were patients randomized?
• Was the randomization concealed?
• Were patients analyzed in the groups to which they were randomized?
• Was follow-up complete?
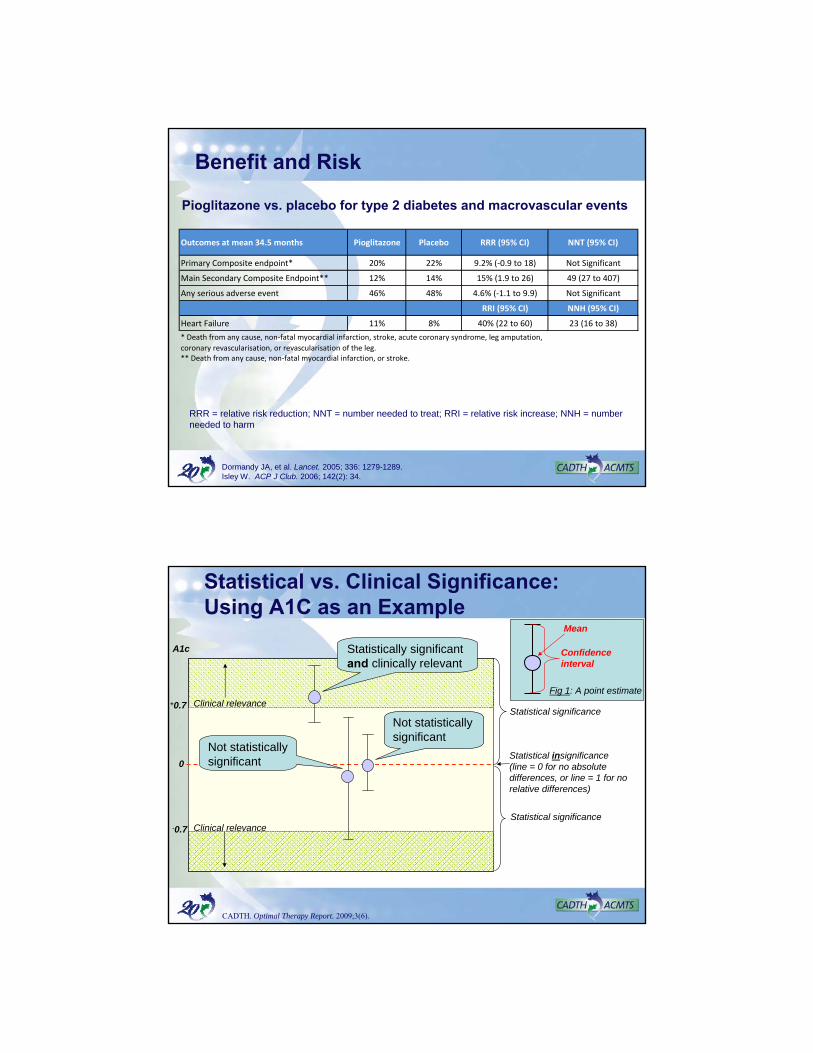
Basic Statistics
= 1/ARR
= 1/ARI
Number Needed to Treat (NNT)
Number Needed to Harm (NNH)
= CER – TERAbsolute Risk Reduction (ARR)
= (1-RR) x 100%Relative Risk Reduction (RRR)
= TER / CERRelative Risk (RR)
(TER)Treatment Event Rate
(CER)Control Event Rate
An Example: Hypoglycemia
• RCT of 20 patients comparing a new diabetes treatment (drug A) vs. the control
Risk of experiencing hypoglycemia:
• Drug A: 2 out of 10 pts
Risk = 2/10 = 0.2 or 20%
• Control: 4 out of 10 pts
Risk = 4/10 = 0.4 or 40%
Relative Risk (RR) = risk in Drug A / risk in Control = 0.2/0.4 = 0.5
proportion of people having the event in the treatment group compared to the control group
Examining ARR, RRR, and NNT
Event RateEvent Rate(Treatment vs. Placebo)(Treatment vs. Placebo)
RRRRRR ARRARR NNTNNT
1% vs. 2% 50% 1% 100
10% vs. 20% 50% 10% 10
40% vs. 80% 50% 40% 2.5
RRR = relative risk reduction; ARR = absolute risk reduction; NNT = number needed to treat
Benefit and Risk
Pioglitazone vs. placebo for type 2 diabetes and macrovascular events
Outcomes at mean 34.5 months Pioglitazone Placebo RRR (95% CI) NNT (95% CI)
Primary Composite endpoint* 20% 22% 9.2% (‐0.9 to 18) Not Significant
Main Secondary Composite Endpoint** 12% 14% 15% (1.9 to 26) 49 (27 to 407)
Any serious adverse event 46% 48% 4.6% (‐1.1 to 9.9) Not Significant
RRI (95% CI) NNH (95% CI)
Heart Failure 11% 8% 40% (22 to 60) 23 (16 to 38)
* Death from any cause, non‐fatal myocardial infarction, stroke, acute coronary syndrome, leg amputation,
coronary revascularisation, or revascularisation of the leg.** Death from any cause, non‐fatal myocardial infarction, or stroke.
RRR = relative risk reduction; NNT = number needed to treat; RRI = relative risk increase; NNH = number needed to harm
Dormandy JA, et al. Lancet. 2005; 336: 1279-1289.Isley W. ACP J Club. 2006; 142(2): 34.
Statistical vs. Clinical Significance:Using A1C as an Example
Statistical significance
Statistical significanceClinical relevance
Clinical relevance
Statistically significantand clinically relevant
Statistical insignificance(line = 0 for no absolute differences, or line = 1 for norelative differences)
Not statistically significant
Confidenceinterval
Mean
Fig 1: A point estimate
Not statisticallysignificant
+0.7
-0.7
A1c
0
CADTH. Optimal Therapy Report. 2009;3(6).
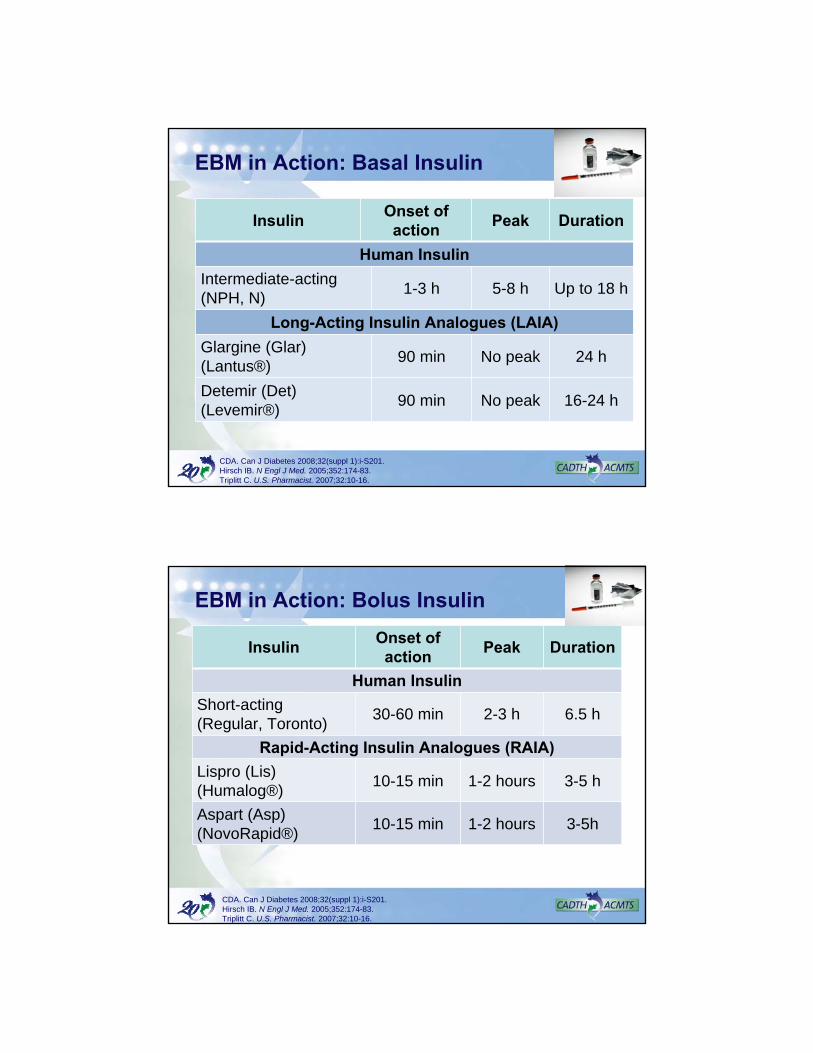
EBM in Action: Basal Insulin
InsulinOnset of action
Peak Duration
Human Insulin
Intermediate-acting (NPH, N)
1-3 h 5-8 h Up to 18 h
Long-Acting Insulin Analogues (LAIA)
Glargine (Glar) (Lantus®)
90 min No peak 24 h
Detemir (Det) (Levemir®)
90 min No peak 16-24 h
CDA. Can J Diabetes 2008;32(suppl 1):i-S201.Hirsch IB. N Engl J Med. 2005;352:174-83.Triplitt C. U.S. Pharmacist. 2007;32:10-16.
EBM in Action: Bolus Insulin
InsulinOnset of action
Peak Duration
Human Insulin
Short-acting (Regular, Toronto)
30-60 min 2-3 h 6.5 h
Rapid-Acting Insulin Analogues (RAIA)
Lispro (Lis) (Humalog®)
10-15 min 1-2 hours 3-5 h
Aspart (Asp) (NovoRapid®)
10-15 min 1-2 hours 3-5h
CDA. Can J Diabetes 2008;32(suppl 1):i-S201.Hirsch IB. N Engl J Med. 2005;352:174-83.Triplitt C. U.S. Pharmacist. 2007;32:10-16.
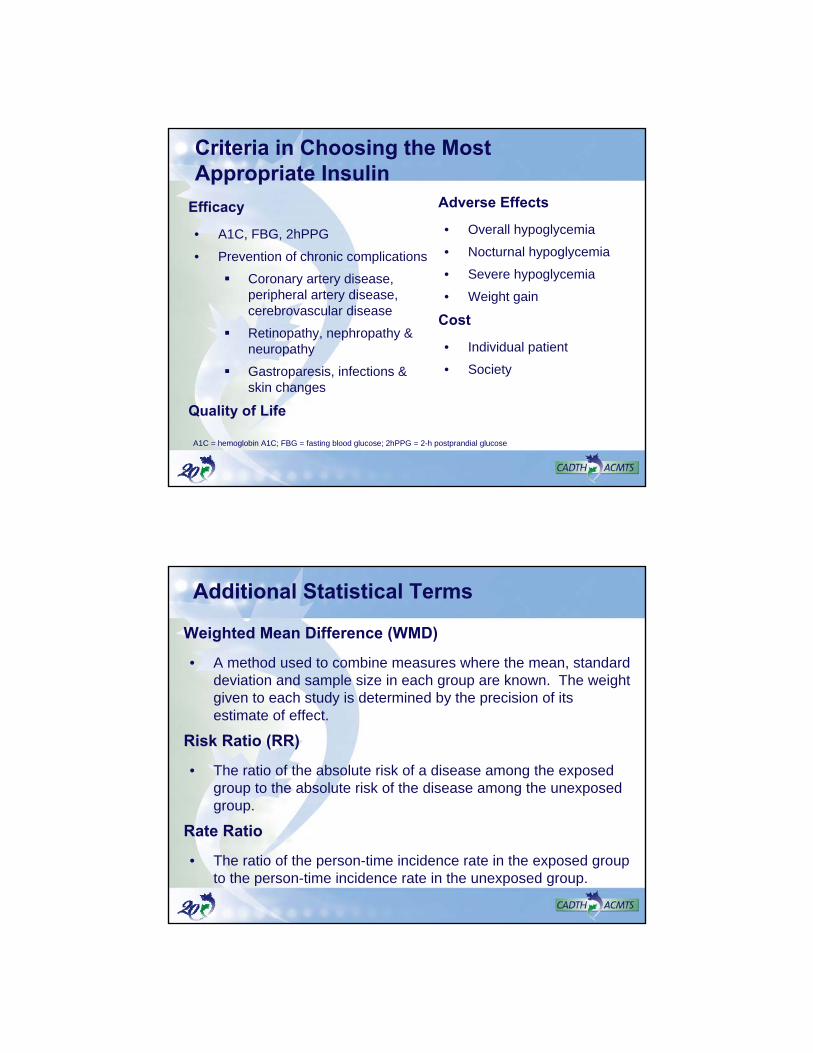
Criteria in Choosing the Most Appropriate Insulin
Efficacy
• A1C, FBG, 2hPPG
• Prevention of chronic complications
Coronary artery disease, peripheral artery disease, cerebrovascular disease
Retinopathy, nephropathy & neuropathy
Gastroparesis, infections & skin changes
Quality of Life
Adverse Effects
• Overall hypoglycemia
• Nocturnal hypoglycemia
• Severe hypoglycemia
• Weight gain
Cost
• Individual patient
• Society
A1C = hemoglobin A1C; FBG = fasting blood glucose; 2hPPG = 2-h postprandial glucose
Additional Statistical Terms
Weighted Mean Difference (WMD)
• A method used to combine measures where the mean, standard deviation and sample size in each group are known. The weight given to each study is determined by the precision of its estimate of effect.
Risk Ratio (RR)
• The ratio of the absolute risk of a disease among the exposed group to the absolute risk of the disease among the unexposed group.
Rate Ratio
• The ratio of the person-time incidence rate in the exposed group to the person-time incidence rate in the unexposed group.
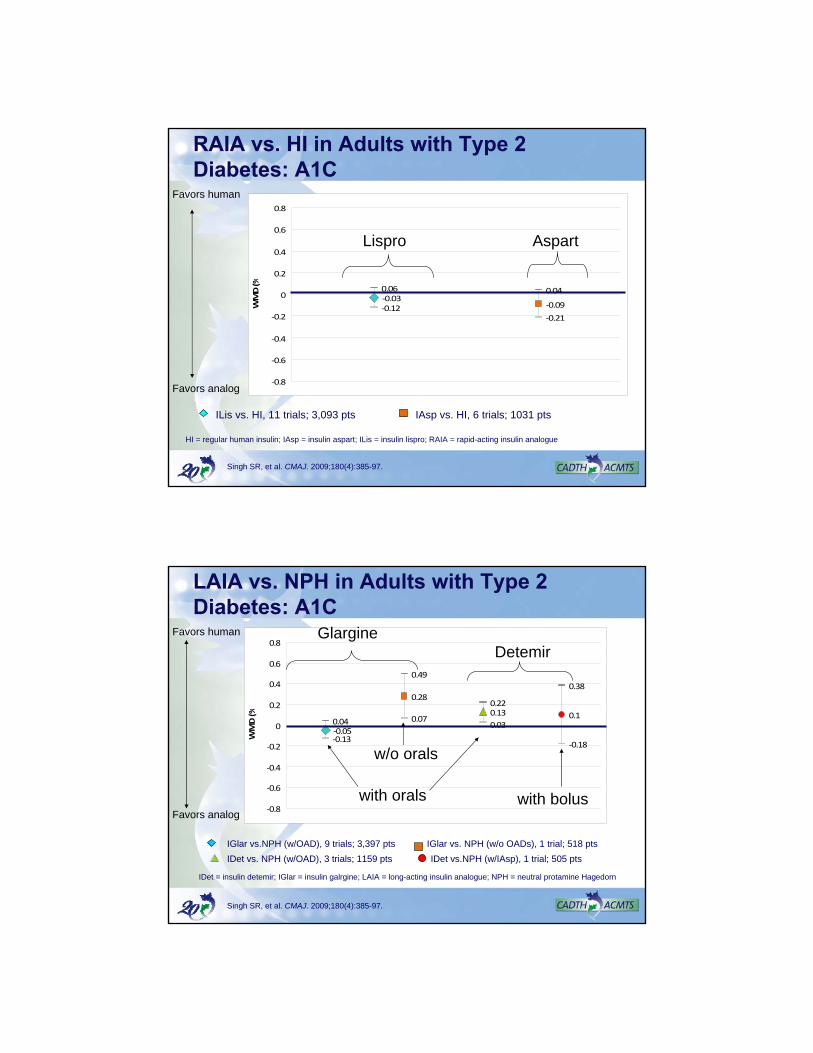
‐0.03‐0.09‐0.12‐0.21
0.06 0.04
‐0.8
‐0.6
‐0.4
‐0.2
0
0.2
0.4
0.6
0.8
WMD (%
RAIA vs. HI in Adults with Type 2 Diabetes: A1C
IAsp vs. HI, 6 trials; 1031 pts ILis vs. HI, 11 trials; 3,093 pts
Singh SR, et al. CMAJ. 2009;180(4):385-97.
HI = regular human insulin; IAsp = insulin aspart; ILis = insulin lispro; RAIA = rapid-acting insulin analogue
Favors human
Favors analog
Lispro Aspart
‐0.05
0.28
0.13 0.1
‐0.13
0.07
‐0.18
0.04
0.49
0.22
0.38
0.03
‐0.8
‐0.6
‐0.4
‐0.2
0
0.2
0.4
0.6
0.8
WMD (%
LAIA vs. NPH in Adults with Type 2 Diabetes: A1C
Singh SR, et al. CMAJ. 2009;180(4):385-97.
IGlar vs.NPH (w/OAD), 9 trials; 3,397 pts
IDet vs. NPH (w/OAD), 3 trials; 1159 pts
IGlar vs. NPH (w/o OADs), 1 trial; 518 pts
IDet vs.NPH (w/IAsp), 1 trial; 505 pts
IDet = insulin detemir; IGlar = insulin galrgine; LAIA = long-acting insulin analogue; NPH = neutral protamine Hagedorn
Favors analog
Favors human
DetemirGlargine
with orals with bolus
w/o orals

LAIA vs. HI in Adults: Weight Gain
HI = human insulin; IGlar = insulin glargine; IDet = insulin detemir; LAIA = long-acting insulin analogue;
NPH = Neutral Protamine Hagedorn
Type 2 Diabetes
IGlar vs NPH 0.18 kg (95% CI: -0.11, 0.47)
IDet vs NPH -0.96 kg (95% CI: -1.69, -0.23)** statistically significant
CADTH. Optimal Therapy Report. 2008;2(1).
Hypoglycemia Fear of HypoglycemiaBlood Glucose < 4 mmol/L• Mild
- Tremor, palpitations, sweating & excessive hunger. Able to self-treat.
• Moderate- Headache, irritability, paresthesias, decreased attentiveness,
mood changes. May be able to self treat.
• Severe- Unresponsiveness, unconsciousness, seizure or coma.
Unable to self treat, requires assistance. Nocturnal
- Symptoms at night (2400-0600h), 50% symptomatic, memory impairment, warning signs inhibited
CDA. Can J Diabetes. 2008;32(suppl 1):i-S201.CADTH. Optimal Therapy Report. 2008;2(1).
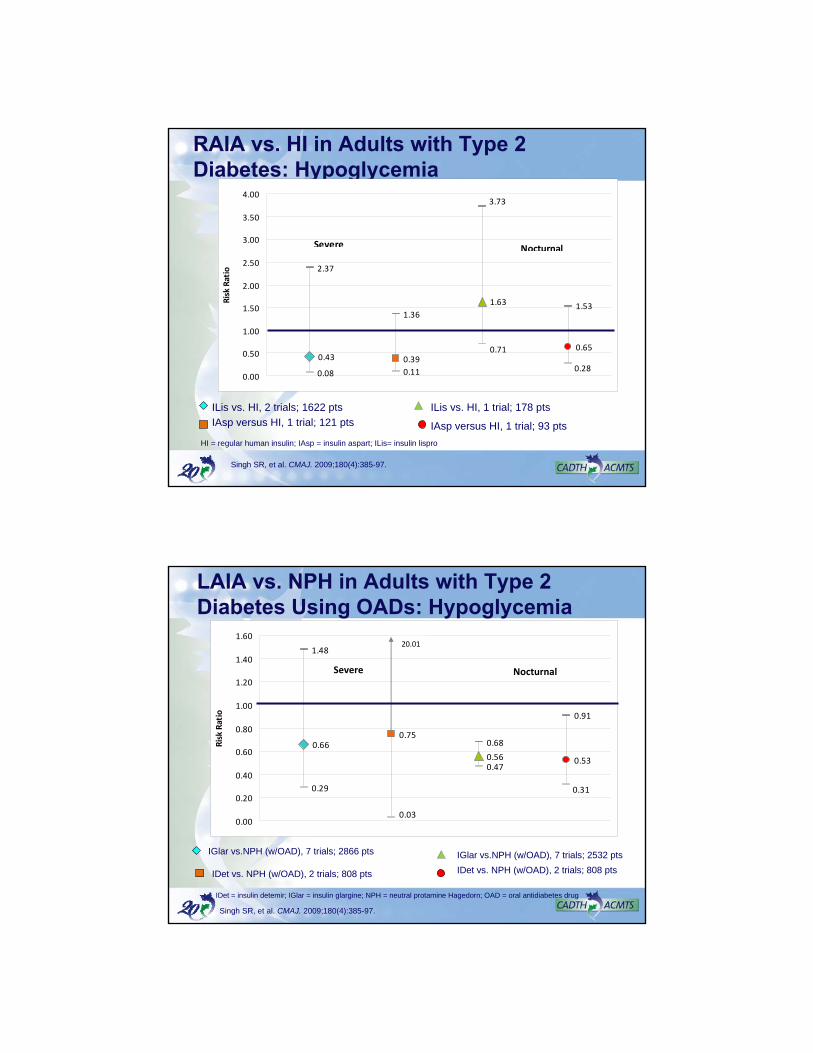
RAIA vs. HI in Adults with Type 2 Diabetes: Hypoglycemia
0.43 0.39
0.65
0.08 0.11
2.37
1.36
1.63
0.71
0.28
3.73
1.53
0.00
0.50
1.00
1.50
2.00
2.50
3.00
3.50
4.00
Risk Ratio
Severe Nocturnal
ILis vs. HI, 2 trials; 1622 pts
IAsp versus HI, 1 trial; 121 pts
ILis vs. HI, 1 trial; 178 pts
IAsp versus HI, 1 trial; 93 pts
Singh SR, et al. CMAJ. 2009;180(4):385-97.
HI = regular human insulin; IAsp = insulin aspart; ILis= insulin lispro
LAIA vs. NPH in Adults with Type 2 Diabetes Using OADs: Hypoglycemia
0.660.75
0.56 0.53
0.29
0.47
1.48
0.68
0.31
0.03
0.91
0.00
0.20
0.40
0.60
0.80
1.00
1.20
1.40
1.60
Risk Ratio
20.01
Severe Nocturnal
IGlar vs.NPH (w/OAD), 7 trials; 2866 pts
IDet vs. NPH (w/OAD), 2 trials; 808 pts
IGlar vs.NPH (w/OAD), 7 trials; 2532 pts
IDet vs. NPH (w/OAD), 2 trials; 808 pts
Singh SR, et al. CMAJ. 2009;180(4):385-97.
IDet = insulin detemir; IGlar = insulin glargine; NPH = neutral protamine Hagedorn; OAD = oral antidiabetes drug
Expanding Evidence
Evidence
Efficacy
Effectiveness
Economics
Efficiency
Ethics
Equity
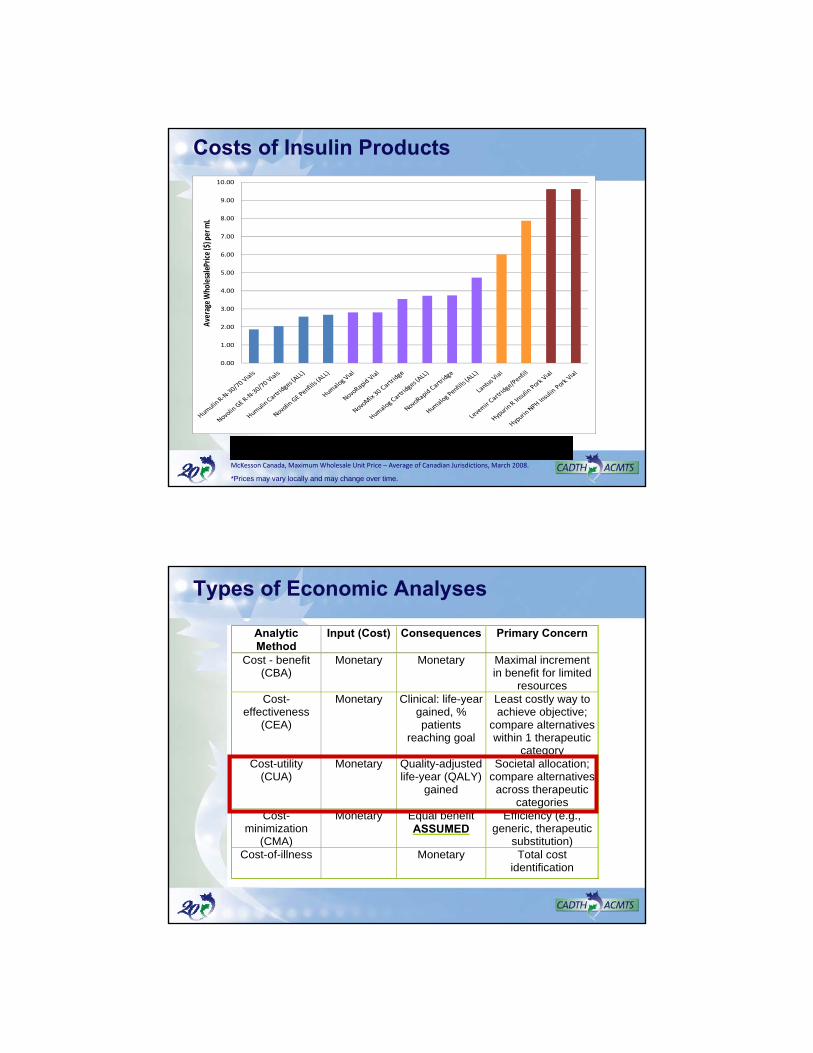
Summary of Insulin Analogues
Cameron C, et al. CMAJ. 2009; 180(4): 400-7.
0.00
1.00
2.00
3.00
4.00
5.00
6.00
7.00
8.00
9.00
10.00
Average W
holesalePrice ($) per mL
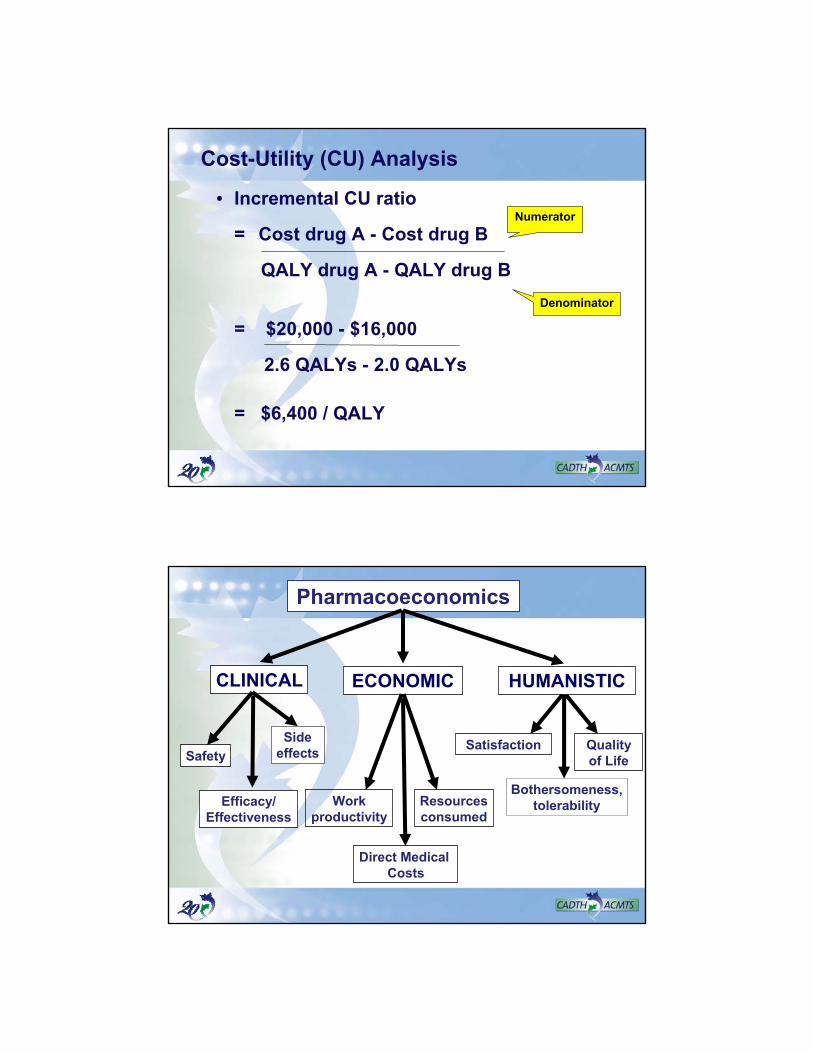
Long Acting Insulin Analogues
Pork Insulins
Human Insulins
Rapid Acting Insulin Analogues
Costs of Insulin Products
McKesson Canada, Maximum Wholesale Unit Price – Average of Canadian Jurisdictions, March 2008.
*Prices may vary locally and may change over time.
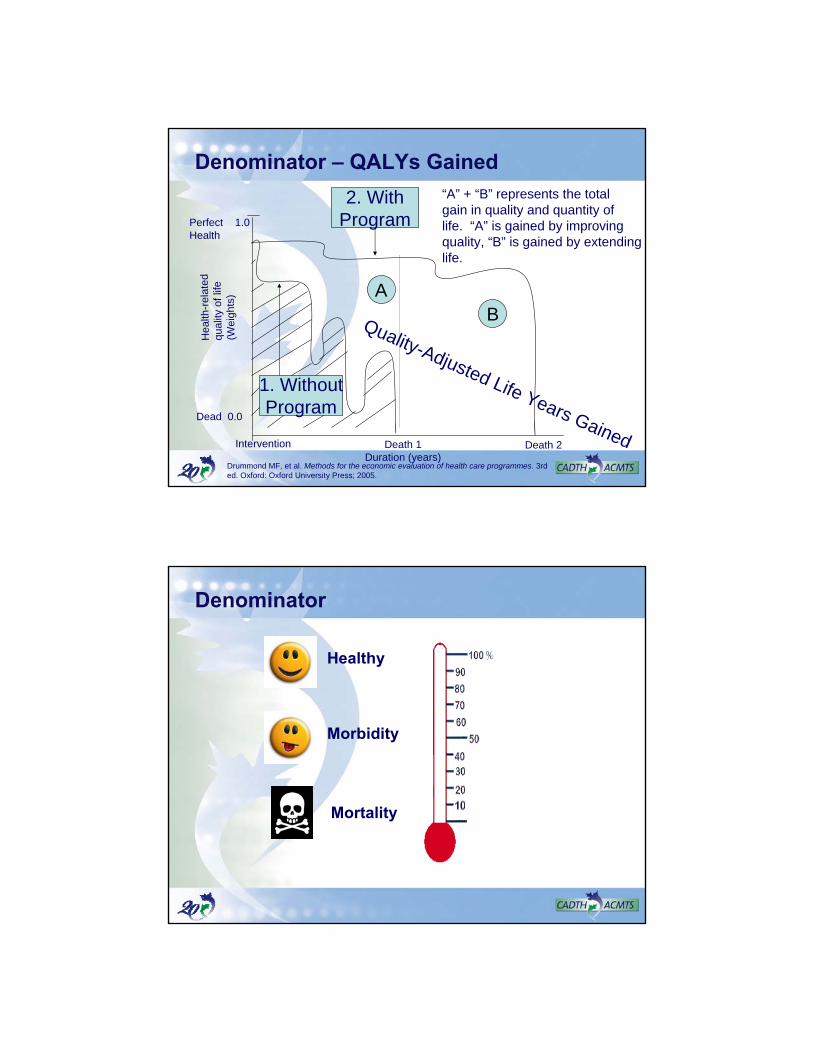
Types of Economic Analyses
Analytic Method
Input (Cost) Consequences Primary Concern
Cost - benefit (CBA)
Monetary Monetary Maximal increment in benefit for limited
resources Cost-
effectiveness (CEA)
Monetary Clinical: life-year gained, % patients
reaching goal
Least costly way to achieve objective;
compare alternatives within 1 therapeutic
category Cost-utility
(CUA) Monetary Quality-adjusted
life-year (QALY) gained
Societal allocation; compare alternatives across therapeutic
categories Cost-
minimization (CMA)
Monetary Equal benefit ASSUMED
Efficiency (e.g., generic, therapeutic
substitution) Cost-of-illness Monetary Total cost
identification
Cost-Utility (CU) Analysis
• Incremental CU ratio
= Cost drug A - Cost drug B
QALY drug A - QALY drug B
= $20,000 - $16,000
2.6 QALYs - 2.0 QALYs
= $6,400 / QALY
Numerator
Denominator
Pharmacoeconomics
CLINICAL ECONOMIC
Safety
Workproductivity
Direct Medical Costs
Quality of Life
Bothersomeness,tolerability
HUMANISTIC
Satisfaction
Efficacy/Effectiveness
Resourcesconsumed
Sideeffects
Denominator – QALYs Gained
Perfect 1.0Health
Dead 0.0
Hea
lth-r
elat
edqu
ality
of
life
(Wei
ghts
)
Intervention Death 1Duration (years)
Death 2
2. WithProgram
ABQuality-Adjusted Life Years Gained
1. WithoutProgram
“A” + “B” represents the totalgain in quality and quantity of life. “A” is gained by improving quality, “B” is gained by extendinglife.
Drummond MF, et al. Methods for the economic evaluation of health care programmes. 3rd ed. Oxford: Oxford University Press; 2005.
Morbidity
Mortality
Healthy
Denominator
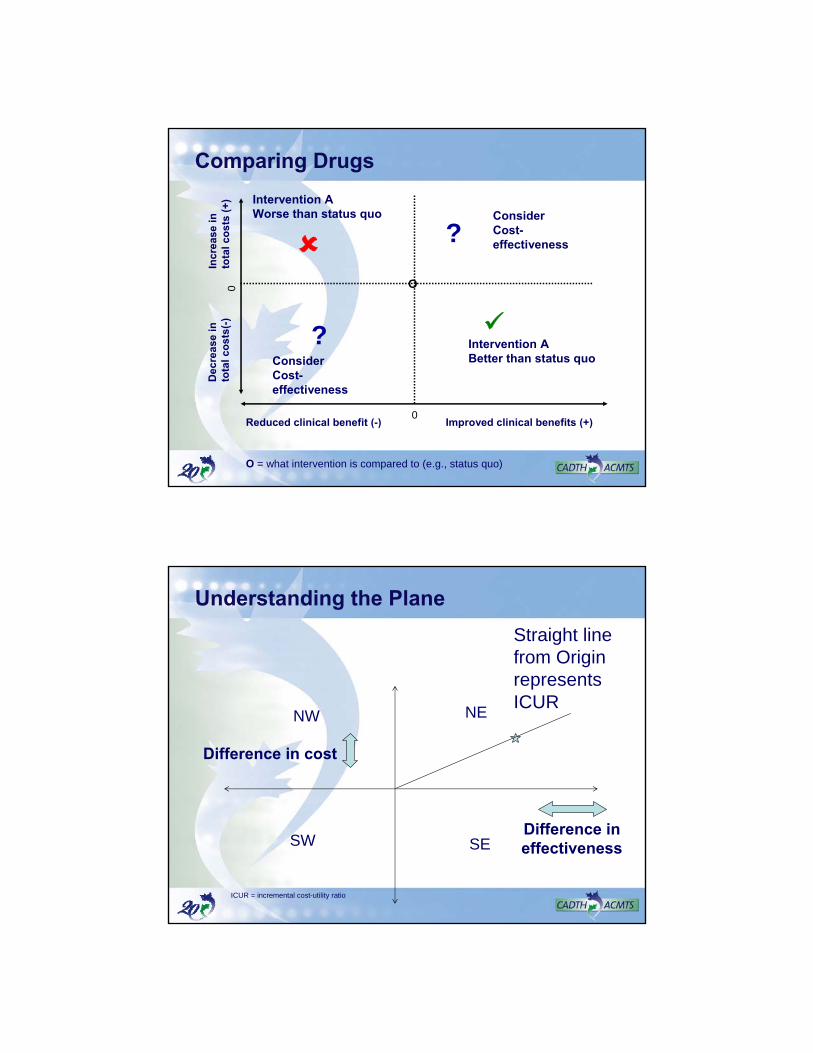
Comparing Drugs
Improved clinical benefits (+)
Incr
ease
in
to
tal
cos
ts (
+)
O
Consider Cost-effectiveness
Consider Cost-effectiveness
Intervention A Better than status quo
?
?Intervention A Worse than status quo
O = what intervention is compared to (e.g., status quo)
Reduced clinical benefit (-)
Dec
reas
e in
to
tal
cos
ts(-
)
0
0
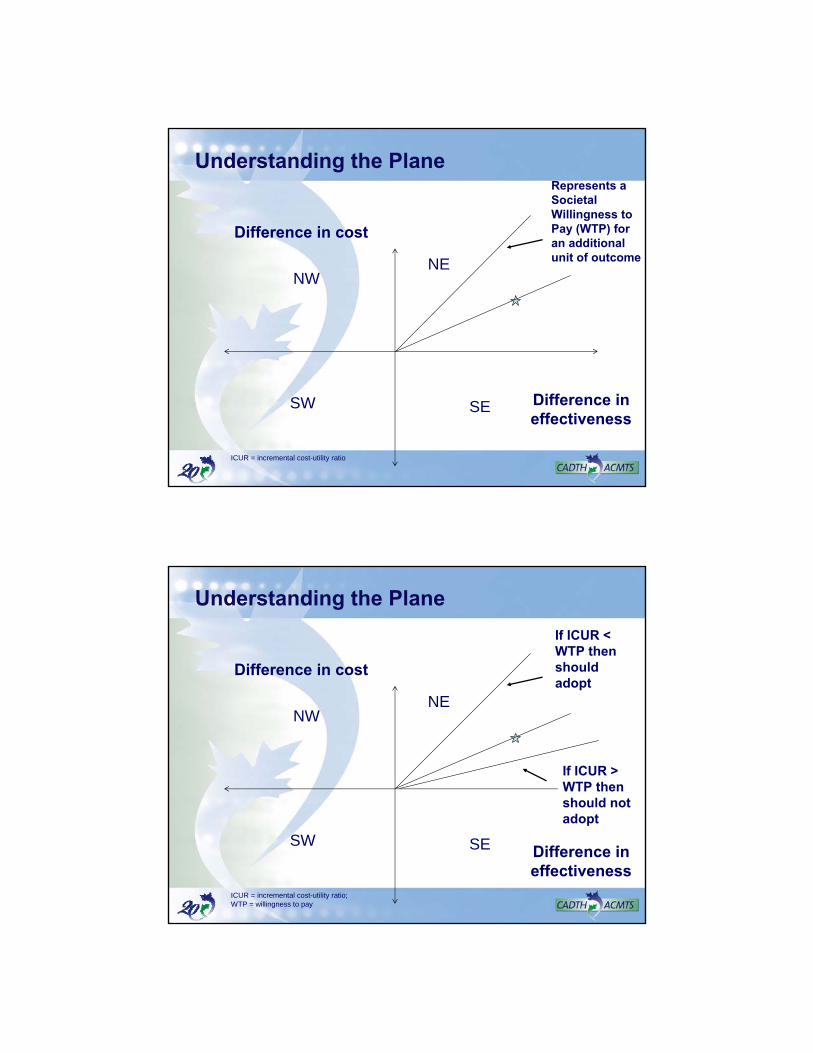
NE
SW
NW
SE
Difference in cost
Difference in effectiveness
Straight line from Origin represents ICUR
Understanding the Plane
ICUR = incremental cost-utility ratio
NE
SW
NW
SE
Difference in cost
Difference in effectiveness
Represents a Societal Willingness to Pay (WTP) for an additional unit of outcome
Understanding the Plane
ICUR = incremental cost-utility ratio
Understanding the Plane
NE
SW
NW
SE
Difference in cost
Difference in effectiveness
If ICUR < WTP then should adopt
If ICUR > WTP then should not adopt
ICUR = incremental cost-utility ratio; WTP = willingness to pay
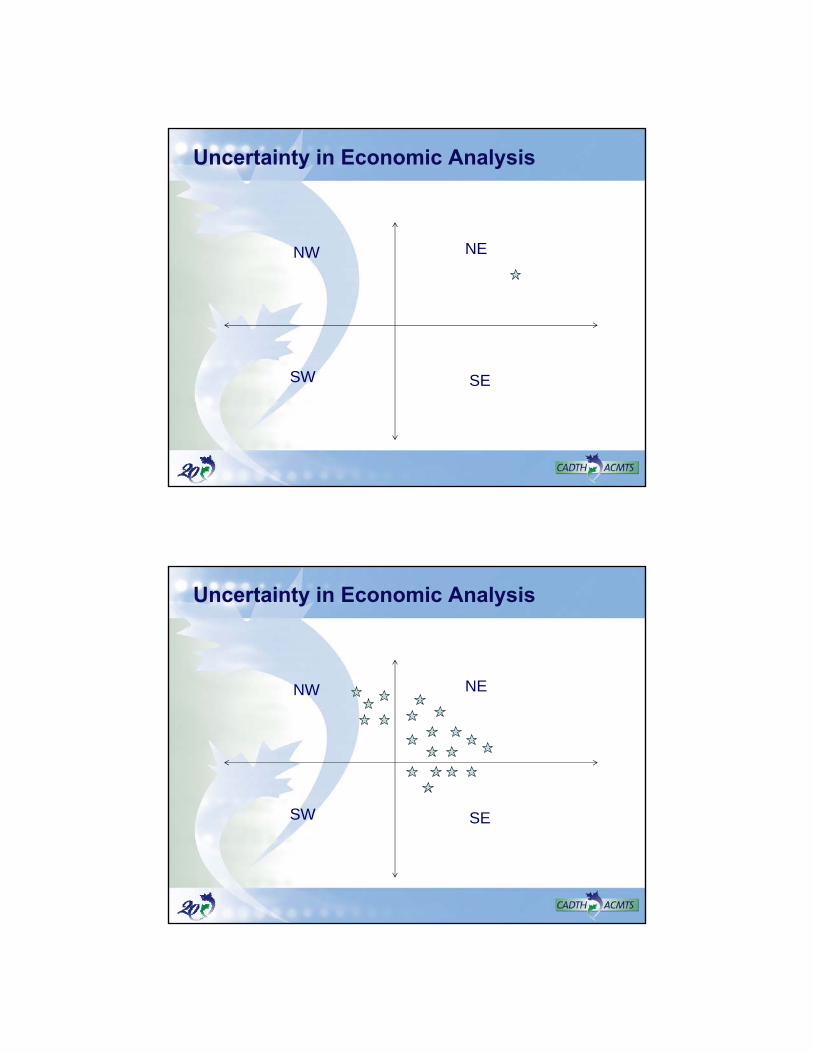
NE
SW
NW
SE
Uncertainty in Economic Analysis
NE
SW
NW
SE
Uncertainty in Economic Analysis
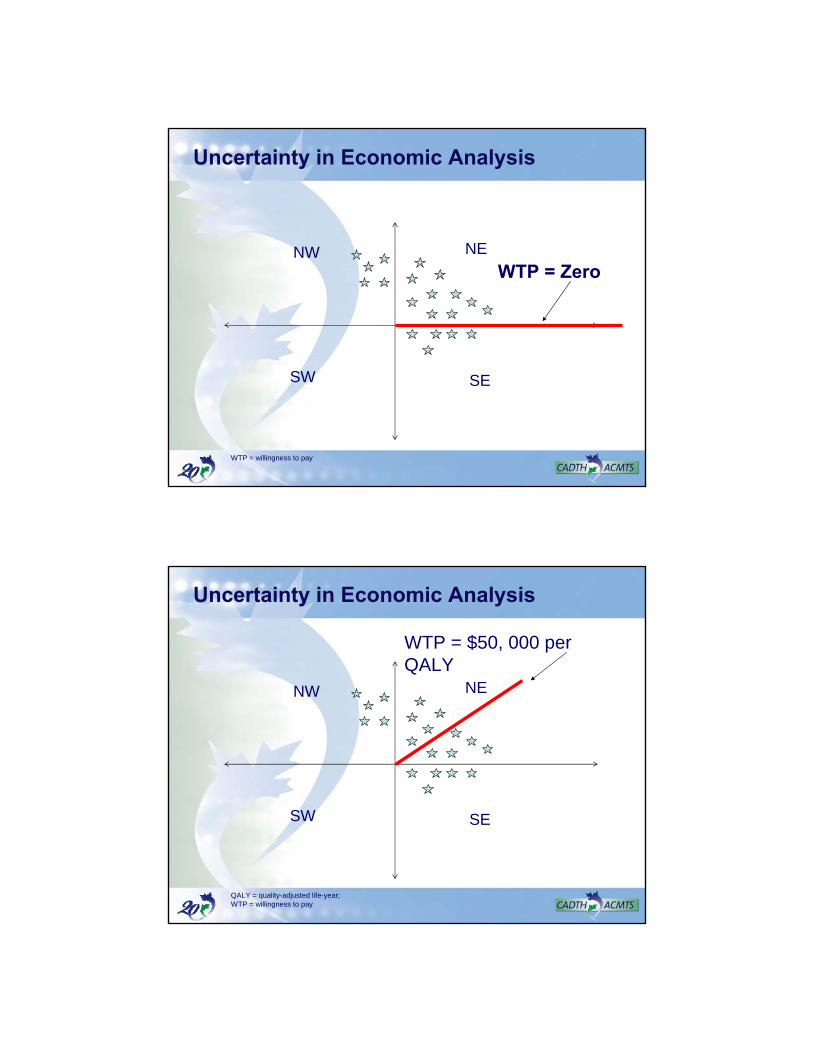
NE
SW
NW
SE
WTP = Zero
Uncertainty in Economic Analysis
WTP = willingness to pay
Uncertainty in Economic Analysis
NE
SW
NW
SE
WTP = $50, 000 per QALY
QALY = quality-adjusted life-year; WTP = willingness to pay
Uncertainty in Economic Analysis
NE
SW
NW
SE
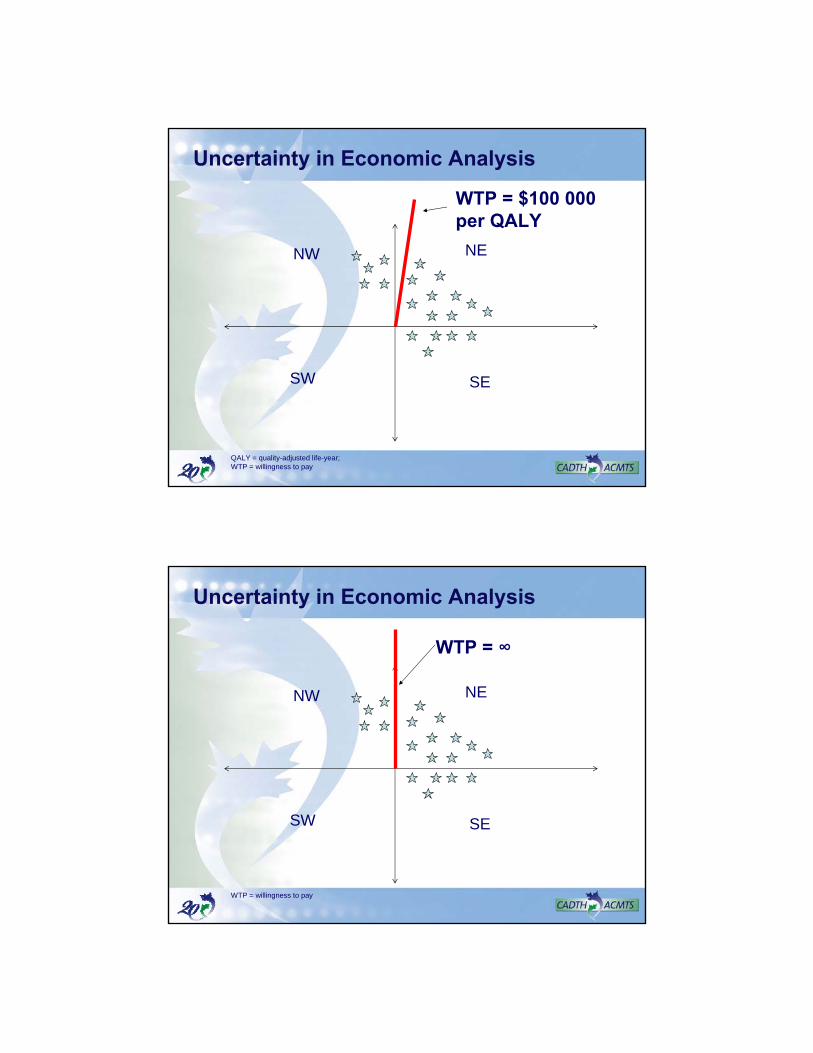
WTP = $100 000 per QALY
QALY = quality-adjusted life-year; WTP = willingness to pay
Uncertainty in Economic Analysis
NE
SW
NW
SE
WTP = ∞
WTP = willingness to pay
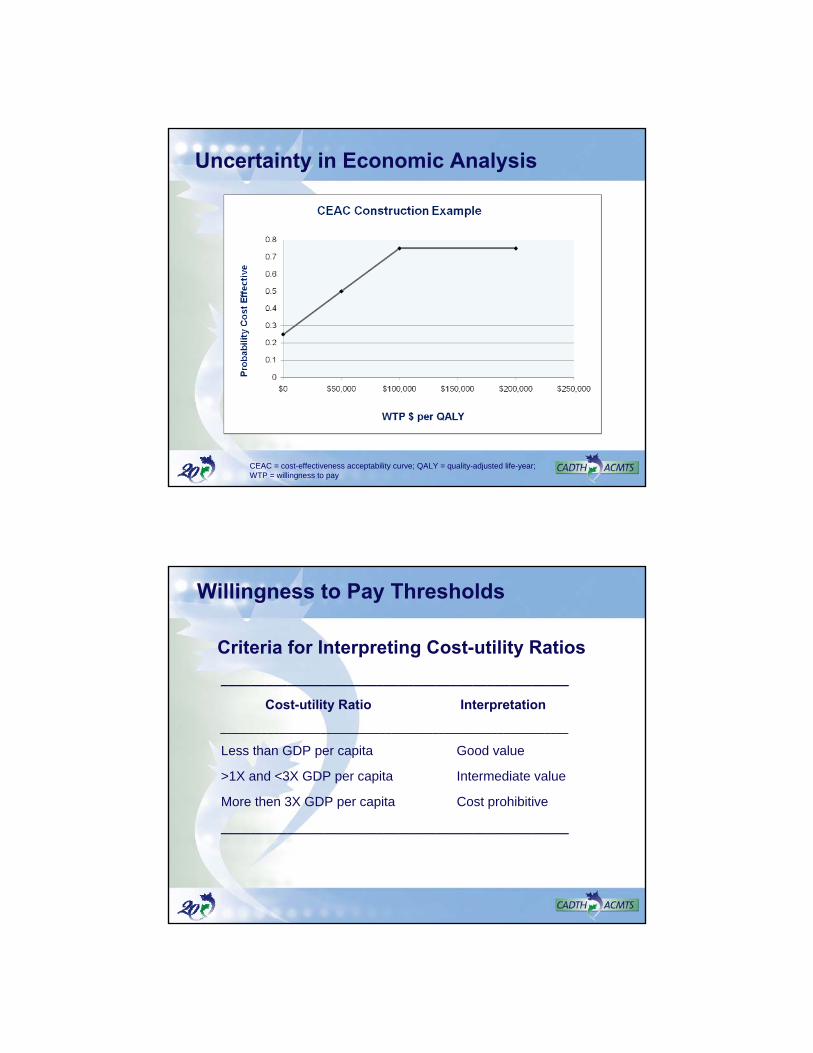
Uncertainty in Economic Analysis
CEAC = cost-effectiveness acceptability curve; QALY = quality-adjusted life-year; WTP = willingness to pay
Willingness to Pay Thresholds
Criteria for Interpreting Cost-utility Ratios
_______________________________________________
Cost-utility Ratio Interpretation
___________________________________________________________
Less than GDP per capita Good value
>1X and <3X GDP per capita Intermediate value
More then 3X GDP per capita Cost prohibitive
_______________________________________________
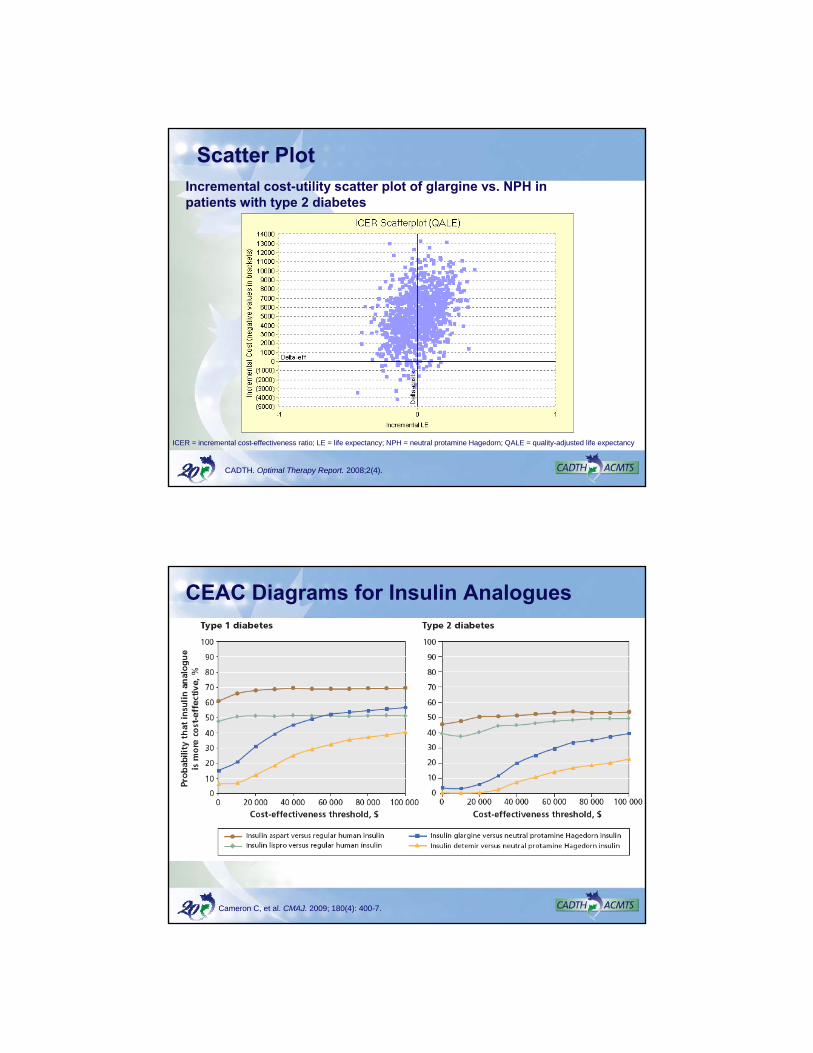
Scatter PlotIncremental cost-utility scatter plot of glargine vs. NPH in patients with type 2 diabetes
CADTH. Optimal Therapy Report. 2008;2(4).
ICER = incremental cost-effectiveness ratio; LE = life expectancy; NPH = neutral protamine Hagedorn; QALE = quality-adjusted life expectancy
CEAC Diagrams for Insulin Analogues
Cameron C, et al. CMAJ. 2009; 180(4): 400-7.
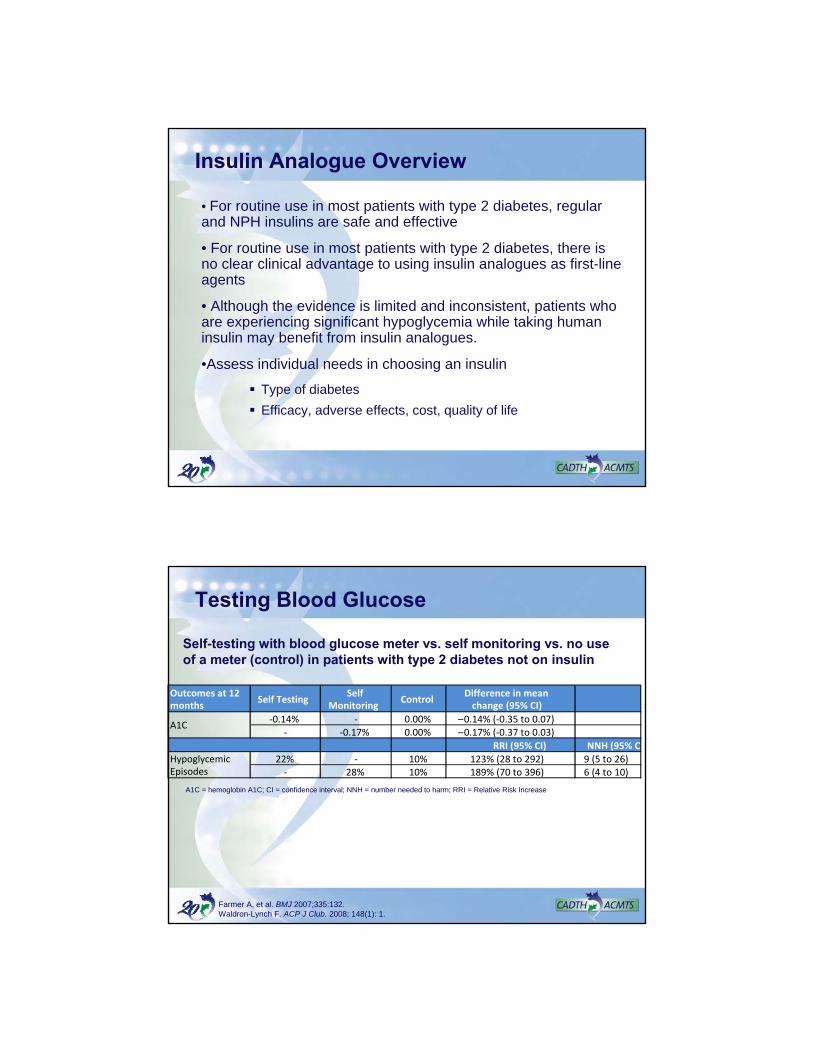
Insulin Analogue Overview
• For routine use in most patients with type 2 diabetes, regular and NPH insulins are safe and effective
• For routine use in most patients with type 2 diabetes, there isno clear clinical advantage to using insulin analogues as first-line agents
• Although the evidence is limited and inconsistent, patients who are experiencing significant hypoglycemia while taking human insulin may benefit from insulin analogues.
•Assess individual needs in choosing an insulin
Type of diabetes
Efficacy, adverse effects, cost, quality of life
Testing Blood Glucose
Self-testing with blood glucose meter vs. self monitoring vs. no use of a meter (control) in patients with type 2 diabetes not on insulin
Outcomes at 12 months
Self TestingSelf
MonitoringControl
Difference in mean change (95% CI)
‐0.14% ‐ 0.00% –0.14% (‐0.35 to 0.07)‐ ‐0.17% 0.00% –0.17% (‐0.37 to 0.03)
RRI (95% CI) NNH (95% CI)
22% ‐ 10% 123% (28 to 292) 9 (5 to 26)‐ 28% 10% 189% (70 to 396) 6 (4 to 10)
A1C
Hypoglycemic Episodes
Farmer A, et al. BMJ 2007;335:132.Waldron-Lynch F. ACP J Club. 2008; 148(1): 1.
A1C = hemoglobin A1C; CI = confidence interval; NNH = number needed to harm; RRI = Relative Risk Increase
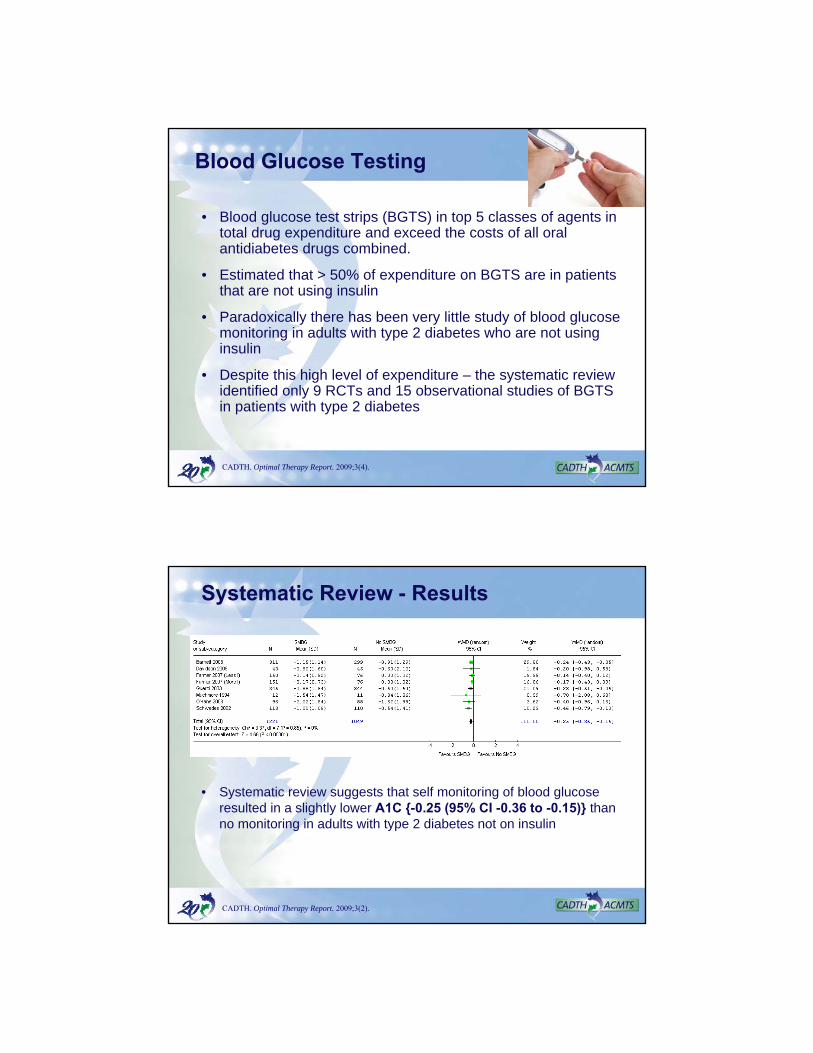
Blood Glucose Testing
• Blood glucose test strips (BGTS) in top 5 classes of agents in total drug expenditure and exceed the costs of all oral antidiabetes drugs combined.
• Estimated that > 50% of expenditure on BGTS are in patients that are not using insulin
• Paradoxically there has been very little study of blood glucose monitoring in adults with type 2 diabetes who are not using insulin
• Despite this high level of expenditure – the systematic review identified only 9 RCTs and 15 observational studies of BGTS in patients with type 2 diabetes
CADTH. Optimal Therapy Report. 2009;3(4).
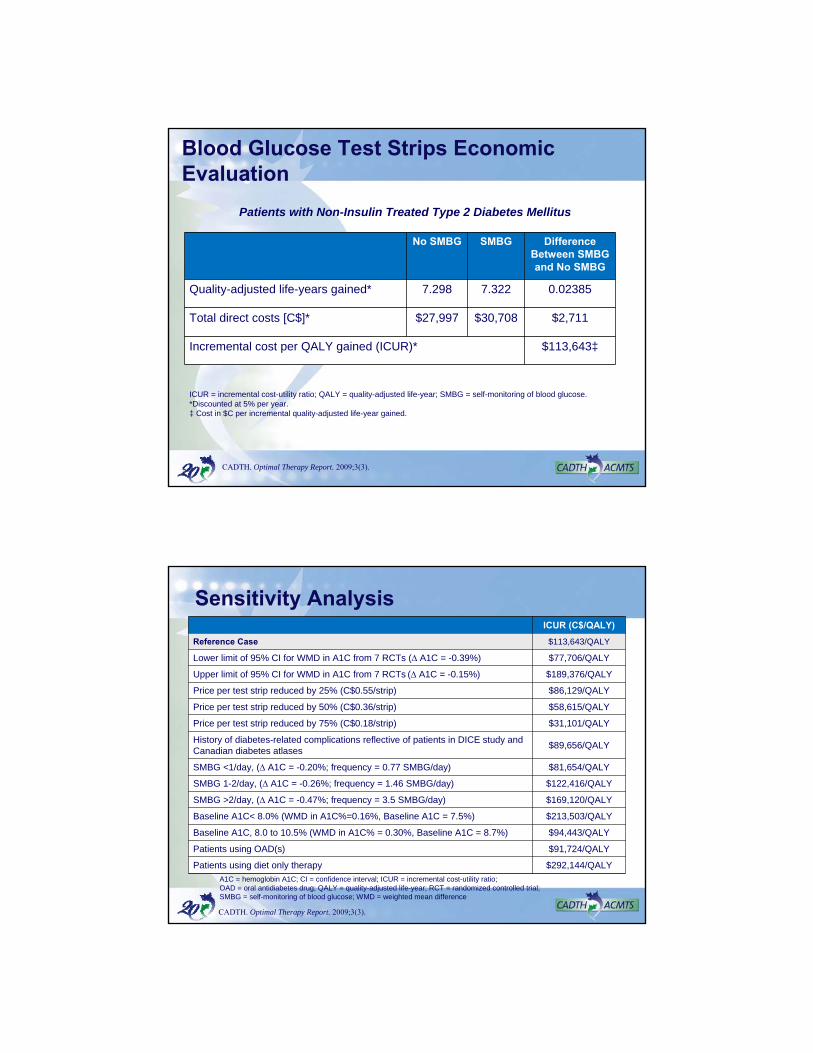
Systematic Review - Results
• Systematic review suggests that self monitoring of blood glucoseresulted in a slightly lower A1C {-0.25 (95% CI -0.36 to -0.15)} than no monitoring in adults with type 2 diabetes not on insulin
CADTH. Optimal Therapy Report. 2009;3(2).
Blood Glucose Test Strips Economic Evaluation
No SMBG SMBG Difference Between SMBG and No SMBG
Quality-adjusted life-years gained* 7.298 7.322 0.02385
Total direct costs [C$]* $27,997 $30,708 $2,711
Incremental cost per QALY gained (ICUR)* $113,643‡
ICUR = incremental cost-utility ratio; QALY = quality-adjusted life-year; SMBG = self-monitoring of blood glucose.*Discounted at 5% per year.‡ Cost in $C per incremental quality-adjusted life-year gained.
Patients with Non-Insulin Treated Type 2 Diabetes Mellitus
CADTH. Optimal Therapy Report. 2009;3(3).
Sensitivity AnalysisICUR (C$/QALY)
Reference Case $113,643/QALY
Lower limit of 95% CI for WMD in A1C from 7 RCTs (∆ A1C = -0.39%) $77,706/QALY
Upper limit of 95% CI for WMD in A1C from 7 RCTs (∆ A1C = -0.15%) $189,376/QALY
Price per test strip reduced by 25% (C$0.55/strip) $86,129/QALY
Price per test strip reduced by 50% (C$0.36/strip) $58,615/QALY
Price per test strip reduced by 75% (C$0.18/strip) $31,101/QALY
History of diabetes-related complications reflective of patients in DICE study and Canadian diabetes atlases
$89,656/QALY
SMBG <1/day, (∆ A1C = -0.20%; frequency = 0.77 SMBG/day) $81,654/QALY
SMBG 1-2/day, (∆ A1C = -0.26%; frequency = 1.46 SMBG/day) $122,416/QALY
SMBG >2/day, (∆ A1C = -0.47%; frequency = 3.5 SMBG/day) $169,120/QALY
Baseline A1C< 8.0% (WMD in A1C%=0.16%, Baseline A1C = 7.5%) $213,503/QALY
Baseline A1C, 8.0 to 10.5% (WMD in A1C% = 0.30%, Baseline A1C = 8.7%) $94,443/QALY
Patients using OAD(s) $91,724/QALY
Patients using diet only therapy $292,144/QALY
A1C = hemoglobin A1C; CI = confidence interval; ICUR = incremental cost-utility ratio; OAD = oral antidiabetes drug; QALY = quality-adjusted life-year; RCT = randomized controlled trial; SMBG = self-monitoring of blood glucose; WMD = weighted mean difference
CADTH. Optimal Therapy Report. 2009;3(3).
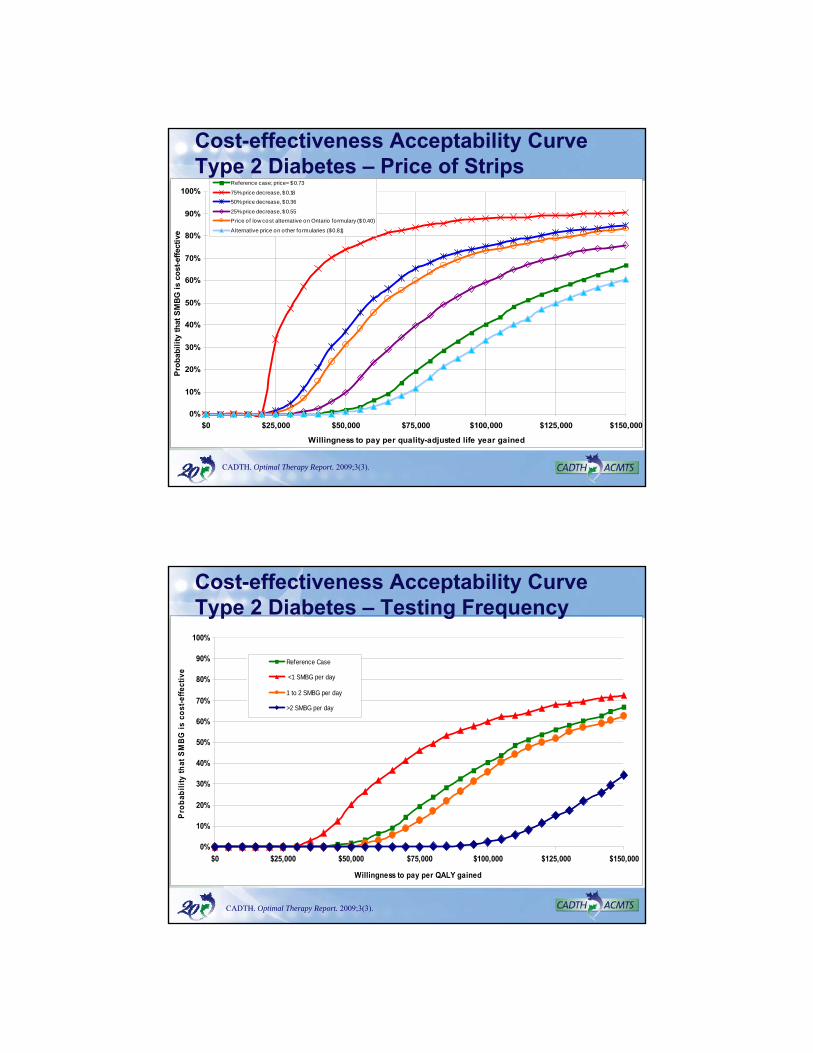
Cost-effectiveness Acceptability Curve Type 2 Diabetes – Price of Strips
0%
10%
20%
30%
40%
50%
60%
70%
80%
90%
100%
$0 $25,000 $50,000 $75,000 $100,000 $125,000 $150,000
Willingness to pay per quality-adjusted life year gained
Pro
bab
ilit
y th
at S
MB
G i
s co
st-e
ffec
tive
Reference case; price= $0.73
75% price decrease, $0.18
50% price decrease, $0.36
25% price decrease, $0.55
Price of low cost alternative on Ontario fo rmulary ($0.40)
Alternative price on o ther formularies ($0.81)
CADTH. Optimal Therapy Report. 2009;3(3).
0%
10%
20%
30%
40%
50%
60%
70%
80%
90%
100%
$0 $25,000 $50,000 $75,000 $100,000 $125,000 $150,000
Willingness to pay per QALY gained
Pro
bab
ilit
y th
at S
MB
G i
s co
st-e
ffec
tive
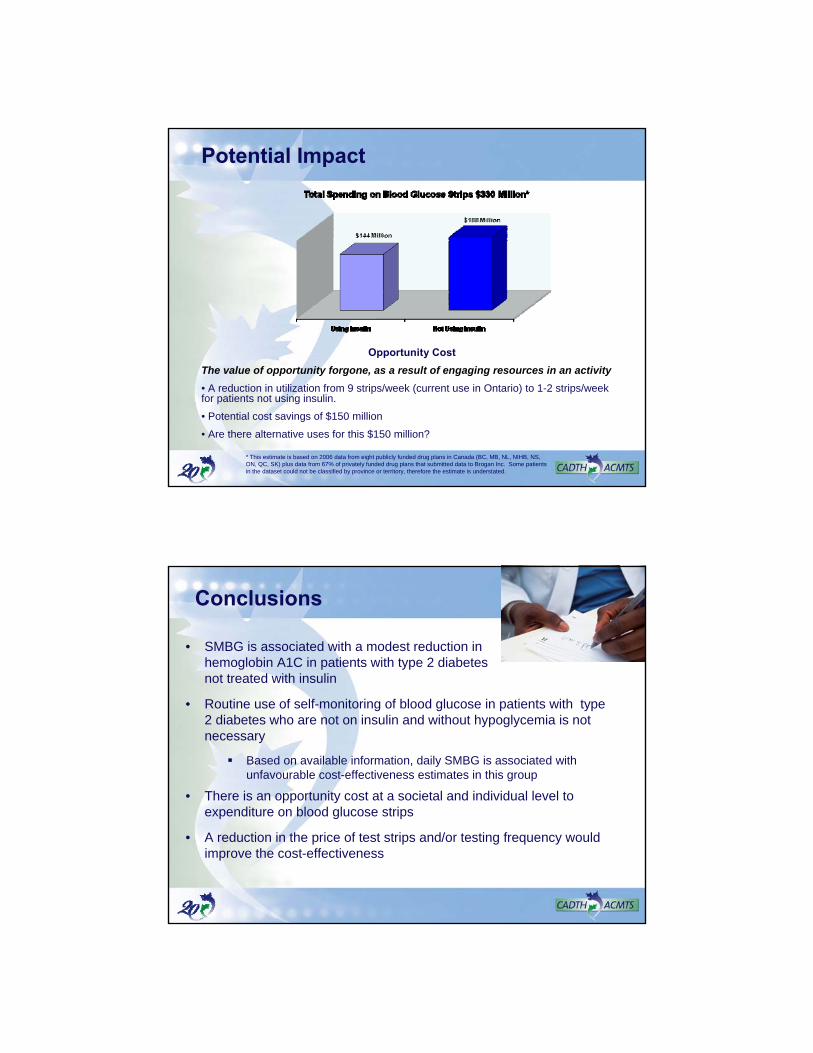
Reference Case
<1 SMBG per day
1 to 2 SMBG per day
>2 SMBG per day
Cost-effectiveness Acceptability Curve Type 2 Diabetes – Testing Frequency
CADTH. Optimal Therapy Report. 2009;3(3).
Potential Impact
Opportunity Cost
The value of opportunity forgone, as a result of engaging resources in an activity
• A reduction in utilization from 9 strips/week (current use in Ontario) to 1-2 strips/week for patients not using insulin.
• Potential cost savings of $150 million
• Are there alternative uses for this $150 million?
* This estimate is based on 2006 data from eight publicly funded drug plans in Canada (BC, MB, NL, NIHB, NS, ON, QC, SK) plus data from 67% of privately funded drug plans that submitted data to Brogan Inc. Some patients in the dataset could not be classified by province or territory, therefore the estimate is understated.
Conclusions
• SMBG is associated with a modest reduction in hemoglobin A1C in patients with type 2 diabetes not treated with insulin
• Routine use of self-monitoring of blood glucose in patients with type 2 diabetes who are not on insulin and without hypoglycemia is not necessary
Based on available information, daily SMBG is associated with unfavourable cost-effectiveness estimates in this group
• There is an opportunity cost at a societal and individual level to expenditure on blood glucose strips
• A reduction in the price of test strips and/or testing frequency would improve the cost-effectiveness
References
Amori RE, Lau J, Pittas AG. Efficacy and safety of incretin therapy in type 2 diabetes: systematic review and meta-analysis. JAMA. 2007 Jul 11;298(2):194-206.
Bolen S, Feldman L, Vassy J, Wilson L, Yeh HC, Marinopoulos S, et al. Systematic review: comparative effectiveness and safety of oral medications for type 2 diabetes mellitus. Ann Intern Med. 2007 Jul 16;147(6):386-99. Available from: http://www.annals.org/cgi/reprint/147/6/386.pdf
Cameron CG, Bennett HA. Cost-effectiveness of insulin analogues for diabetes mellitus. CMAJ. 2009 Feb 17;180(4):400-7.
Canadian Agency for Drugs and Technologies in Health. An economic evaluation of insulin analogues for the treatment of patients with type 1 and type 2 diabetes mellitus in Canada [Internet]. Ottawa: The Agency; 2008. (Optimal therapy report; vol. 2 no. 4) [cited 2008 Apr 11]. Available from: http://cadth.ca/media/compus/reports/compus_Economic_IA_Report.pdf
Canadian Agency for Drugs and Technologies in Health. Current utilization of blood glucose test strips in Canada [Internet]. Ottawa: The Agency; 2009 Mar. (Optimal therapy report; vol. 3 no. 4) [cited 2009 Mar 31]. Available from: http://www.cadth.ca/media/pdf/compus_CU_Report-BGTS.pdf
References
Canadian Agency for Drugs and Technologies in Health. Long-acting insulin analogues for the treatment of diabetes mellitus: meta-analyses of clinical outcomes [Internet]. Ottawa: The Agency; 2008 Mar. (Optimal therapy report; vol. 2 no. 1) [cited 2008 Apr 9]. Available from: http://cadth.ca/media/compus/reports/compus_Long-Acting-Insulin-Analogs-Report_Clinical-Outcomes.pdf
Canadian Agency for Drugs and Technologies in Health. Optimal therapy recommendations for the prescribing and use of blood glucose test strips [Internet]. Ottawa: The Agency; 2009 Jul. [cited 2009 Jul 31]. (Optimal therapy report; vol. 3 no. 6). Available from: http://www.cadth.ca/media/pdf/compus_BGTS_OT_Rec_e.pdf
Canadian Diabetes Association 2008 clinical practice guidelines for the prevention and management of diabetes in Canada. Can J Diabetes [Internet]. 2008 [cited 2009 Mar 20];32(suppl 1):i-S201. Available from: http://www.diabetes.ca/files/cpg2008/cpg-2008.pdf
Choudhry NK, Fischer MA, Jackowski L, Shrank WH. Just a spoonful of medicine helps the sugar go down: Improving the management of type 2 diabetes[Internet]. Boston (MA): Alosa Foundation; 2009 [cited 2010 Jan 20]. Available from: http://www.rxfacts.org/pdf/Diabetes.ev.doc.UPDATED.2009.03.06.pdf
References
Dormandy JA, Charbonnel B, Eckland DJ, Erdmann E, Massi-Benedetti M, Moules IK, et al. Secondary prevention of macrovascular events in patients with type 2 diabetes in the PROactive Study (PROspectivepioglitAzone Clinical Trial in macroVascular Events): a randomised controlled trial. Lancet. 2005;366(9493):1279-89.
Drummond MF, Sculpher MJ, Torrance GW, O'Brien BJ, Stoddart GL. Methods for the economic evaluation of health care programmes. 3rd ed. Oxford: Oxford University Press; 2005.
Farmer A, Wade A, Goyder E, Yudkin P, French D, Craven A, et al. Impact of self monitoring of blood glucose in the management of patients with non-insulin treated diabetes: open parallel group randomised trial. BMJ. 2007 Jul 21;335(7611):132.
Guyatt G, Rennie D, eds. Users' guides to the medical literature: a manual for evidence-based clinical practice. Chicago: AMA Press; 2002.
Hirsch IB. Insulin analogues. N Engl J Med. 2005;352(2):174-83.
References
Isley WL. Pioglitazone did not reduce a composite endpoint of macrovascularcomplications and increased risk for heart failure in type 2 diabetes with macrovascular disease. ACP J Club. 2006 Mar;144(2):34.
Sackett DL, Rosenberg WM, Gray JA, Haynes RB, Richardson WS. Evidence based medicine: what it is and what it isn't. BMJ. 1996 Jan 13;312(7023):71-2.
Singh SR, Ahmad F, Lal A, Yu C, Bai Z, Bennett H. Efficacy and safety of insulin analogues for the management of diabetes mellitus: a meta-analysis. CMAJ.2009 Feb 17;180(4):385-97.
Triplitt C. How to initiate, titrate, and intensify insulin treatment in type 2 diabetes. US Pharm. 2007 [cited 2009 Feb 2];32(10):10-6. Available from: http://www.uspharmacist.com/content/t/diabetes/c/10215/
Vinik A. Advancing therapy in type 2 diabetes mellitus with early, comprehensive progression from oral agents to insulin therapy. Clin Ther. 2007;29 Spec No:1236-53.
Waldron-Lynch F, Dinneen S. Self-monitoring of blood glucose did not improve glycemic control in patients with type 2 diabetes not treated with insulin. ACP J Club. 2008 Jan;148(1):1.