c. arden pope iii, phd mary lou fulton professor of...
TRANSCRIPT

Particulate Air Pollution and Human Health
C. Arden Pope III, PhD Mary Lou Fulton Professor of Economics
Presented at the National Tribal Forum on Air Quality
Anacortes, WA May 12-15, 2014
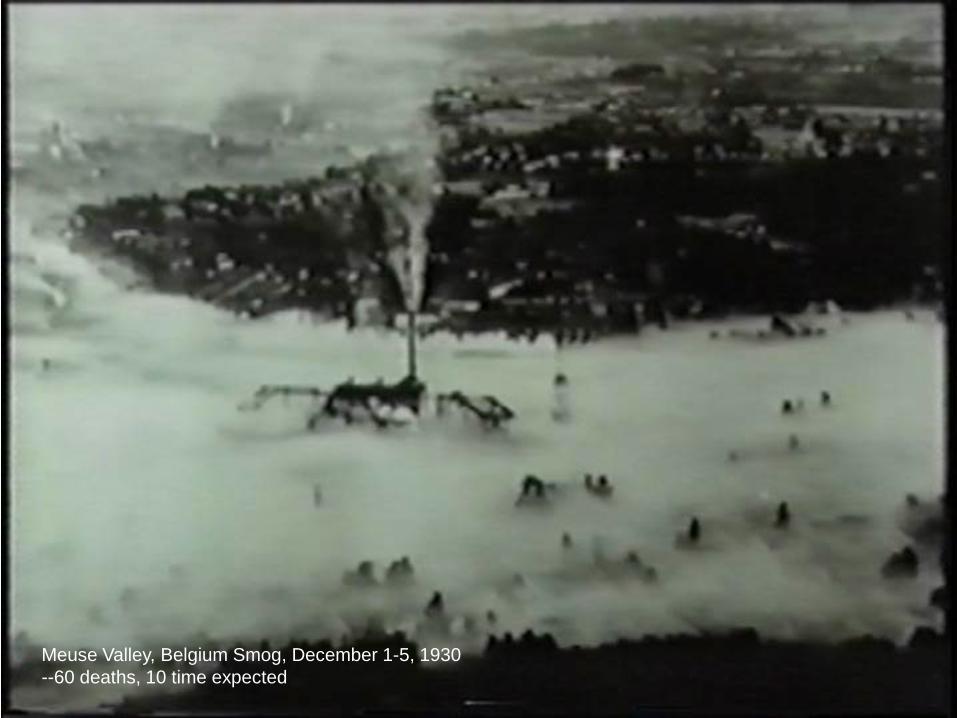
Meuse Valley, Belgium Smog, December 1-5, 1930 --60 deaths, 10 time expected

Donora, PA (Severe episode, Oct. 27-31, 1948)
From, Public Health Service, Bulletin No. 306, 1949

Danora, PA. Noon, Oct 29, 1948. http://www.weather.com/multimedia/videoplayer.html?clip=12603&collection=257&fro

Donora, PA—administering oxygen --Approx. 20 deaths, 6 times expected

London, England (Dec. 5-9, 1952)

London Fog Episode, Dec. 1952
From: Brimblecombe P. The Big Smoke, Methuen 1987

The killer episodes spurred air pollution policies in the U.S.
Killer Smog (and related research)
Public Policy Results 1955-1967: Air pollution control acts 1967, 1970: Clean Air Act, Major Amendments, National Environmental Policy Act 1977 & 1990: Major Amendments to Clean Air Act
1980’s: Elimination of extreme “Killer Smog” episodes & Improved air quality
1930: Meuse Valley, Belgium 1948: Donora, PA 1952: London, England
By the 1980’s, many thought the air pollution problem had been solved…

Geneva Steel, Utah Valley, 1989 (PM10 = 150 µg/m3)

Utah Valley, 1989, (PM10 = 220 µg/m3)

Moapa River Reservation (Moapa Band of Paiutes) Reid-Gardner Power Plant

Preliminary findings include high of: • Respiratory disease: Asthma (24%) Cough (38%) Phlegm (30%) Wheeze (44%) • Cardiometabolic disease: High Blood Pressure (38%) Diabetes (34%)
Moapa Band of Paiutes Chairman William Anderson From Recharge Magazine 03 13

Particulate matter air pollution is a mixture of particles suspended in the air. These particles vary in:
-Size, -Shape, -Surface area, -Chemical composition, -Solubility, and -Origin.
Electron Microscope images of soot particles From: Park K, Cao F, Kittelson DB, McMurry PH. Environ Sci Technol 2003

How small are fine particles?
Human Hair (60 µm diameter)
PM10 (10 µm)
PM2.5 (2.5 µm)

Magnified ambient particles (www.nasa.gov/vision/earth/environment)
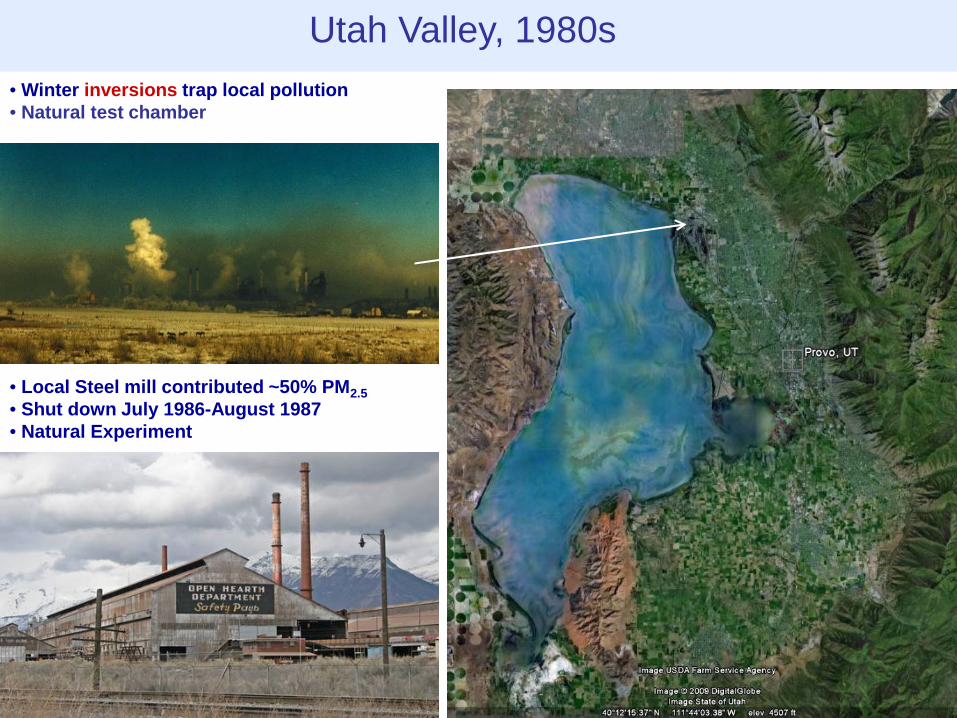
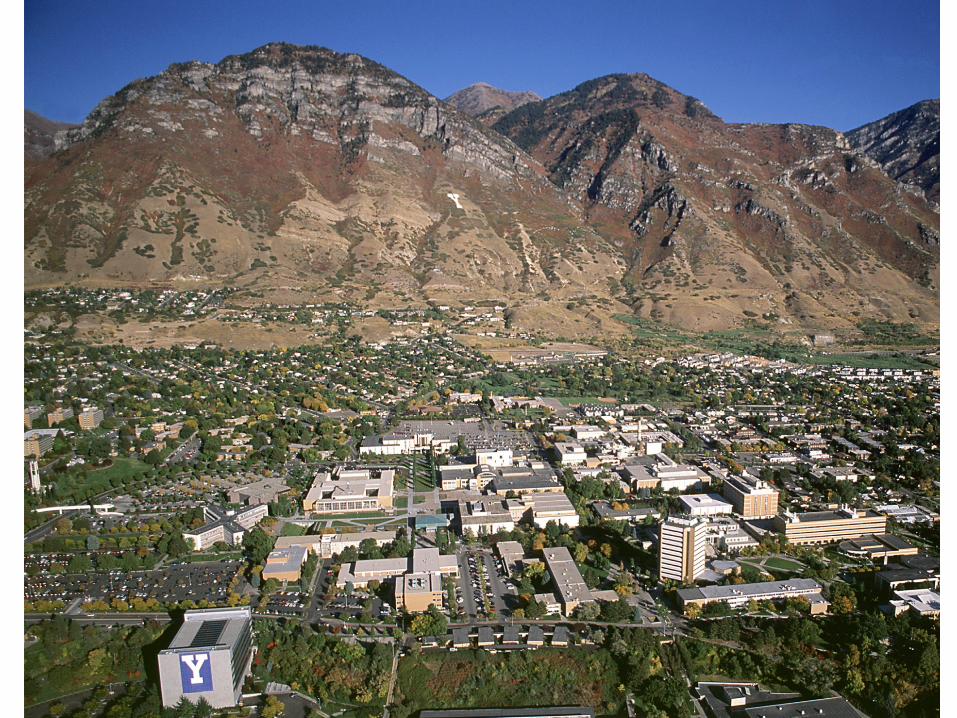
Utah Valley, 1980s • Winter inversions trap local pollution • Natural test chamber
• Local Steel mill contributed ~50% PM2.5 • Shut down July 1986-August 1987 • Natural Experiment

Sources: Pope. Am J Pub Health.1989; Pope. Arch Environ Health. 1991
When the steel mill was open, total children’s hospital admissions for respiratory conditions approx. doubled.
µ g/m
3 /Num
bers
of A
dmis
sion
s
0
50
100
150
200
250
300
PM10 concentrations Children's respiratory hospital admissions
Mean PM10
levels forMonthsIncluded
Mean HighPM10
levels forMonthsIncluded
PneumoniaandPleurisy
Bronchitisand Asthma
Total
Mill Open
Mill Closed

Health studies take advantage of highly variable air pollution levels that result from inversions.
98 99 00 01 02 03 04 05 06 07 08 09 100
10
20
30
40
50
60
70
80
90
100
Utah Valley (Lindon Monitor)
Salt Lake Valley (Hawthorn Monitor)
g/
m3

Daily changes in air pollution daily death counts
Time (days)
# of
Dea
ths
Utah Valley

Poisson Regression Count data (non-negative integer values). Counts of independent and random occurrences classically modeled as being generated by a Poisson process with a Poisson distribution: Prob (Y = r) = e(-λ) Note: λ = mean and variance. If λ is constant across time, we have a stationary Poisson process. If λ changes over time due to changes in pollution (P), time trends, temperature, etc., this non-stationary Poisson process can model as: ln λt = α + β(w0Pt + w1Pt-1 + w2Pt-2 + . . .) + s1(t) + s2(tempt) + . . .
λr r!
How to construct the lag structure? (MA, PDL, etc.)
How aggressive do you fit time? (harmonics vs GAMs, df, span, loess, cubic spline, etc.)
How to control for weather? (smooths of temp & RH, synoptic weather, etc.)
Modeling controversies
Also: How to combine or integrate information from multiple cities

% in
crea
se in
mor
talit
y
0
1
2
3
Estimates frommeta analysis
Estimates from Multicity studies
29 c
ities
(Lev
y et
al.
2000
)
GA
M-b
ased
stu
dies
(Stie
b et
al.
2002
, 200
3)
Una
djus
ted
(And
erso
n et
al.
2005
)
6 U
.S. c
ities
(Kle
mm
and
Mas
on 2
003)
8 C
anad
ian
citie
s(B
urne
tt an
d G
oldb
erg
2003
)
9 C
alifo
rnia
n ci
ties
(Ost
ro e
t al.
2006
)
10 U
.S c
ities
(Sch
war
tz 2
000,
200
3)
14 U
.S c
ities
, cas
e-cr
osso
ver
(Sch
war
tz 2
004)
NM
MA
PS
, 20-
100
U.S
. citi
es(D
omin
ici e
t al.
2003
)A
PH
EA
-2, 1
5-29
Eur
opea
n ci
ties
(Kat
souy
anni
et a
l. 20
03)
9 Fr
ench
citi
es(L
e Te
rtre
et a
l. 20
02)
13 J
apan
ese
citie
s(O
mor
i et a
l. 20
03)
Non
GA
M-b
ased
stu
dies
(Stie
b et
al.
2002
, 200
3)
Pub
licat
ion
bias
adj
uste
d (A
nder
son
et a
l. 20
05)
7 K
orea
n ci
ties
(Lee
et a
l. 20
00)
20
g/m
3 PM
10
20
g/m
3 PM
10
20
g/m
3 PM
10
20
g/m
3 PM
10
20
g/m
3 PM
10
10
g/m
3 PM
2.5
20
g/m
3 PM
10
10
g/m
3 PM
2.5
10
g/m
3 PM
2.5
20
g/m
3 PM
10
20
g/m
3 PM
10
20
g/m
3 PM
10
20
g/m
3 BS
40
g/m
3 TS
P
20
g/m
3 SP
M
Rev
iew
of A
sian
Lit.
--8
stud
ies
(HE
I Rep
ort,
Tabl
e TS
2)20
g/
m3 P
M10
20
g/m
3 PM
10
20
g/m
3 PM
10
Estimates frommeta analysisfrom Asian Lit
PA
PA
Stu
dies
--4
stud
ies
(HE
I Rep
ort,
Tabl
e TS
2)
Asi
an L
it. in
corp
orat
ing
PA
PA
stu
dies
(HE
I Rep
ort,
Tabl
e TS
2)
18 L
atin
Am
. stu
dies
(P
AH
O 2
005)
20
g/m
3 PM
10
10 µg/m3 PM2.5 or 20 µg/m3 PM10 → 0.4% to 1.5% increase in relative risk of mortality—Small but remarkably consistent across meta-analyses and multi-city studies.
Daily time-series studies ***of over 200 cities***
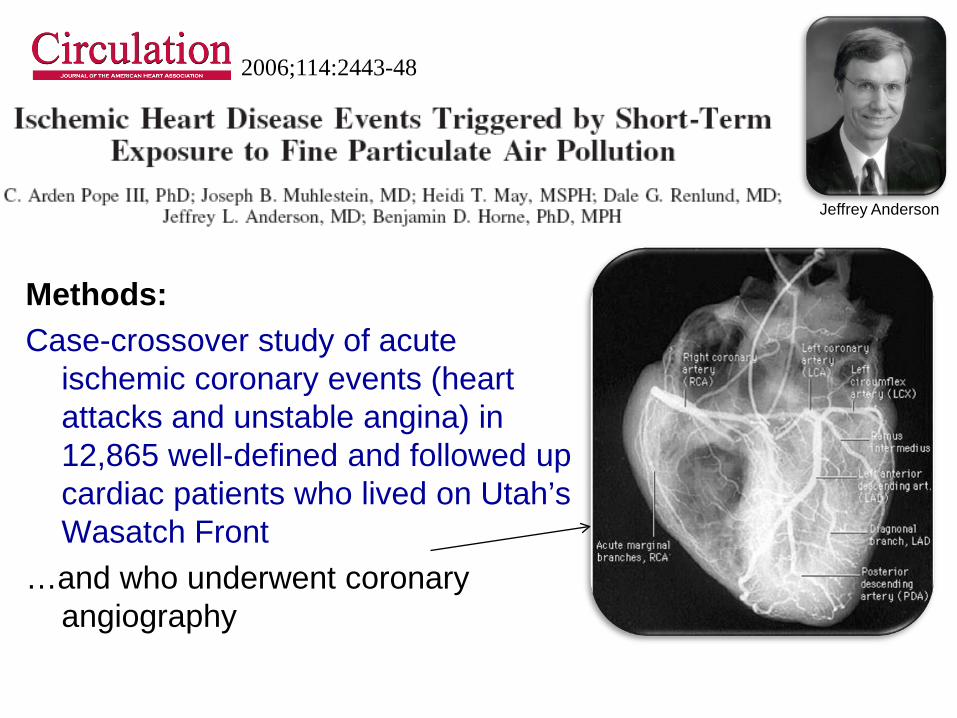
Methods: Case-crossover study of acute
ischemic coronary events (heart attacks and unstable angina) in 12,865 well-defined and followed up cardiac patients who lived on Utah’s Wasatch Front
…and who underwent coronary angiography
Jeffrey Anderson
2006;114:2443-48

y t
0
1
t
Binary Data, classic time-series
y t
0
1
t
Binary Data, case-crossover
Conditional Logistic Reg.
Each subject serves as his/her own control. Control for subject-specific effects, day of week, season, time-trends, etc.—by matching

Prob (Yt = 1) 1 - Prob (Yt = 1)
α1 + α2 + α3 + . . . + α12,865 + β(w0Pt + w1Pt-1 + w2Pt-2 + . . .) Control by matching for: All cross-subject differences (in this case, 12,865 subject-level fixed effects), Season and/or month of year, Time trends, Day of week
( ) = ln
Conditional logistic regression:
Modeling controversies: How to select control or referent periods. Time stratified referent selection approach (avoids bias that can occur due to time trends in exposure) (Holly Janes, Lianne Sheppard, Thomas Lumley Statistics in Medicine and Epidemiology 2005)

%
0.00
5.00
10.00
15.00
Figure 1. Percent increase in risk (and 95% CI) of acute coronary events associated with 10 g/m3 of PM2.5, or PM10 for different lag structures.
Con
curr
ent d
ay
Con
curr
ent d
ay
1-da
y la
g
1-da
y la
g
2-da
y la
g
2-da
y la
g
3-da
y la
g
3-da
y la
g
2-da
y m
ovin
g av
.
2-da
y m
ovin
g av
.
4-da
y m
ovin
g av
.
3-da
y m
ovin
g av
.
3-da
y m
ovin
g av
.
4-da
y m
ovin
g av
.
PM2.5
PM10

%
-10.00
-5.00
0.00
5.00
10.00
15.00
20.00
Figure 2. Percent increase in risk (and 95% CI) of acute coronary events associated with 10 µg/m3 of PM2.5, stratified by various characteristics.
All a
cute
cor
onar
y
Subs
eque
nt M
I
Uns
tabl
e An
gina
Age<
65 Age>
=65
Mal
eFe
mal
e
Smok
ing
Non
Sm
okin
g
BMI<
30BM
I>=3
0 CH
F,ye
sC
HF,
no Hyp
erte
nsio
n,ye
sH
yper
tens
ion,
no
Hyp
erlip
idem
ia,y
esH
yper
lipid
emia
,no
Dia
bete
s,ye
sD
iabe
tes,
no
Fam
ily h
isto
ry,y
esFa
mily
his
tory
,no
# ofDiseasedVessels
# of Risk Factors
0 12
3
0
1
2
3
4+
Inde
x M
I
Short-term PM exposures contributed to acute coronary events, especially among patients with underlying coronary artery disease.

Short-term changes in air pollution exposure are associated with:
• Daily death counts (respiratory and cardiovascular)
• Hospitalizations
• Lung function
• Symptoms of respiratory illness
• School absences
• Ischemic heart disease
• Etc.

Longer-term air pollution exposure has been linked to even substantially larger health effects.

Median PM2.5 for aprox. 1980
8 10 12 14 16 18 20 22 24 26 28 30 32 34
Adj
uste
d M
orta
lity
for 1
980
(Dea
ths/
Yr/1
00,0
00)
600
650
700
750
800
850
900
950
1000
Age-, sex-, and race- adjusted population-based mortality rates in U.S. cities for 1980 plotted over various indices of particulate air pollution (From Pope 2000).

An Association Between Air Pollution and Mortality in Six U.S. Cities
1993
Dockery DW, Pope CA III, Xu X, Spengler JD, Ware JH, Fay ME, Ferris BG Jr, Speizer FE.
Methods: 14-16 yr prospective follow-up of 8,111adults living in six U.S. cities.
Monitoring of TSP PM10, PM2.5, SO4, H+, SO2, NO2, O3 .
Data analyzed using survival analysis, including Cox Proportional Hazards Models.
Controlled for individual differences in: age, sex, smoking, BMI, education, occupational exposure.

Average Polluted cities
Highly Polluted cities
Clean cities

Cox Proportional Hazards Survival Model Cohort studies of outdoor air pollution have commonly used the CPH Model to relate survival experience to exposure while simultaneously controlling for other well known mortality risk factors. The model has the form
( ))()()( )(0
)()( txexptt li
Tlli βλλ =
Hazard function or instantaneous probability of death for the ith subject in the lth strata.
Baseline hazard function, common to all subjects within a strata.
Regression equation that modulates the baseline hazard. The vector Xi
(l) contains the risk factor information related to the hazard function by the regression vector β which can vary in time.

Adjusted risk ratios (and 95% CIs) for cigarette smoking and PM2.5
Cause of Death
Current Smoker, 25 Pack years
Most vs. Least Polluted City
All 2.00 (1.51-2.65)
1.26 (1.08-1.47)
Lung Cancer
8.00 (2.97-21.6)
1.37 (0.81-2.31)
Cardio-pulmonary
2.30 (1.56-3.41)
1.37 (1.11-1.68)
All other
1.46 (0.89-2.39)
1.01 (0.79-1.30)


Particulate Air Pollution as a Predictor of Mortality in a Prospective Study of U.S. Adults
Pope CA III, Thun MJ, Namboodiri MM, Dockery DW, Evans JS, Speizer FE, Heath CW Jr.
1995
Methods: Linked and analyzed ambient air pollution data from 51-151 U.S. metro areas with risk factor data for over 500,000 adults enrolled in the ACS-CPSII cohort.
Clark Heath Michael Thun

Adjusted mortality risk ratios (and 95% CIs) for cigarette smoking the range of sulfates and fine particles
Cause of Death
Current Smoker
Sulfates Fine Particles
All 2.07 (1.75-2.43)
1.15 (1.09-1.22)
1.17 (1.09-1.26)
Lung Cancer
9.73 (5.96-15.9)
1.36 (1.11-1.66)
1.03 (0.80-1.33)
Cardio- Pulmonary
2.28 (1.79-2.91)
1.26 (1.16-1.37)
1.31 (1.17-1.46)
All other 1.54 (1.19-1.99)
1.01 (0.92-1.11)
1.07 (0.92-1.24)

25 July 1997

Dan Krewski Rick Burnett Mark Goldberg and 28 others

Legal uncertainty largely resolved with 2001 unanimous ruling by the U.S. Supreme Court.

Reduction in fine particulate air pollution: Extended follow-up of the Harvard Six Cities Study (Laden, Schwartz, Speizer, Dockery. AJRCCM 2006)
0.70.80.91.01.11.21.31.4
0 5 10 15 20 25 30 35
PM2.5 (µg/m3)
Mo
rtal
ity
Ris
k R
atio
Steubenville Topeka
Watertown
Kingston
St. Louis Portage
Francine Laden Joel Schwartz


2004. R
R (9
5% C
I)
0.650.700.750.800.850.900.951.001.051.101.151.201.251.301.351.40
All
Car
diov
ascu
lar
plus
Dia
bete
s
Isch
emic
hea
rtdi
seas
e
Dys
rhyt
hmia
s,H
eart
failu
re, C
ardi
ac a
rrest
Hyp
erte
nsiv
edi
seas
e
Oth
er A
ther
oscl
eros
is,
aorti
c an
eury
sms
Cer
ebro
-va
scul
ar
Oth
er C
ardi
o-va
scul
arDia
bete
s
Res
pira
tory
Dis
ease
s
CO
PD
and
allie
d co
nditi
ons
Pne
umon
ia,
Influ
enza
All
othe
rre
spira
tory
John Godleski
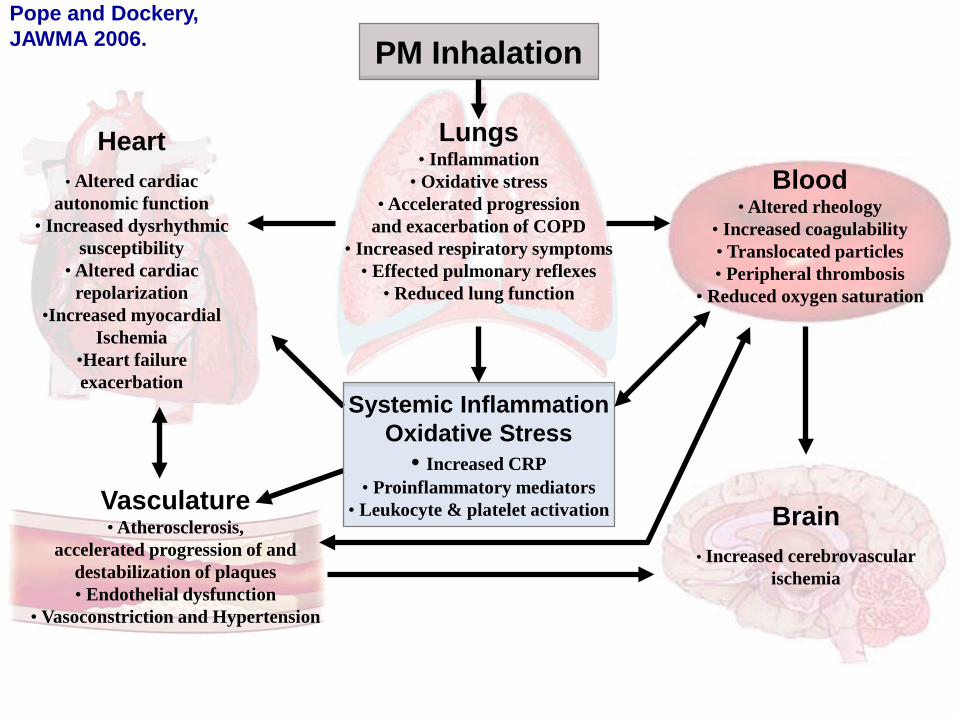
Blood • Altered rheology
• Increased coagulability • Translocated particles • Peripheral thrombosis
• Reduced oxygen saturation
Systemic Inflammation Oxidative Stress
• Increased CRP • Proinflammatory mediators
• Leukocyte & platelet activation
PM Inhalation
Brain
• Increased cerebrovascular ischemia
Heart
• Altered cardiac autonomic function
• Increased dysrhythmic susceptibility
• Altered cardiac repolarization
•Increased myocardial Ischemia
•Heart failure exacerbation
Vasculature • Atherosclerosis,
accelerated progression of and destabilization of plaques • Endothelial dysfunction
• Vasoconstriction and Hypertension
Lungs • Inflammation
• Oxidative stress • Accelerated progression
and exacerbation of COPD • Increased respiratory symptoms
• Effected pulmonary reflexes • Reduced lung function
Pope and Dockery, JAWMA 2006.

The Global Burden of Disease 2010
Bre
athi
ng
Con
tam
inan
ts

The Global Burden of Disease 2010
Breathing contaminates contributes to global burden of disease (GBD)
Number of attributable
deaths
Disability adjusted life-years (DALYs)
Tobacco Smoking 5.7 mil. 5.7% Second Hand Smoke 0.6 mil. 0.6% Household air pollution from solid fuels 3.5 mil. 4.5% Ambient PM air pollution 3.2 mil. 3.1% Ambient Ozone 0.2 mil. 0.1%

So, an obvious question—
Has reducing air pollution resulted in substantial and measurable improvements in human health?

- Matching PM2.5 data for 1979-1983 and 1999-2000 in 51 Metro Areas - Life Expectancy data for 1978-1982 and 1997-2001 in 211 counties in 51 Metro areas - Evaluate changes in Life Expectancy with changes in PM2.5 for the 2-decade period of approximately 1980-2000.
Fine-Particulate Air Pollution and Life Expectancy in the United States
C. Arden Pope, III, Ph.D., Majid Ezzati, Ph.D., and Douglas W. Dockery, Sc.D.
January 22, 2009
Do cities with bigger improvements in air quality have bigger improvements in health, measured by life expectancy?
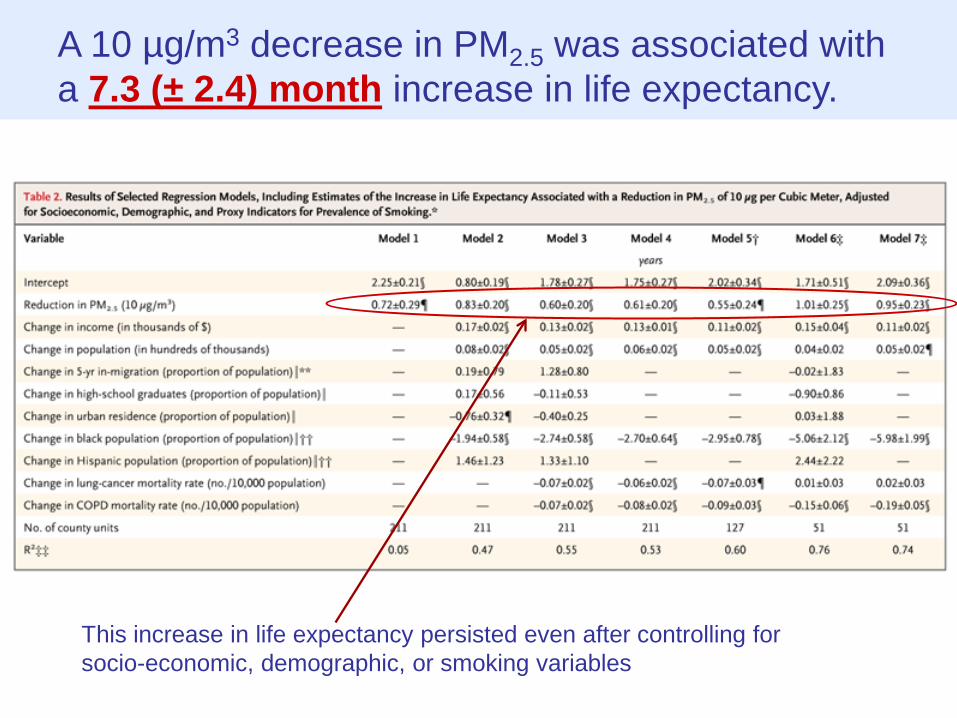
A 10 µg/m3 decrease in PM2.5 was associated with a 7.3 (± 2.4) month increase in life expectancy.
This increase in life expectancy persisted even after controlling for socio-economic, demographic, or smoking variables


Finally—
We seem to be making major progress understanding the health effects of air pollution.
In the U.S. reducing air pollution has
resulted in substantial and measurable improvements in human health.
Good News, Right?

Smith and Stewart Subpoena EPA’s Secret Science Aug 2, 2013 Press Release (http://stewart.house.gov/)
Washington, D.C. – Science, Space, and Technology Committee Chairman Lamar Smith (R-Texas) and Environment Subcommittee Chairman Chris Stewart (R-Utah) issued a subpoena to the EPA, forcing the agency to release the secret science it uses as the basis for costly air regulations
House Subpoenas Personal Medical Information in Continued Assault on Clean Air Policies by Sam Abbott, 8/6/2013 Citizen Health & Safety, Safeguarding Public Health and the Environment, Setting and Enforcing Regulations, Fostering Scientific Integrity, Environmental Protection Agency (EPA)
Will House Science Panel Need an Ethical Review? Kelly Servick, Aug. 12, 2013
Eddie Bernice Johnson and Lamar Smith
Two Utahns have stake in pollution health data fight Environment » Is congressional inquiry into pollution-health studies after truth or partisan gain? By Judy Fahys The Salt Lake Tribune Aug 27 2013
Chris Stewart

Harvard Six-Cities Study Dockery et al. New England Journal of Medicine (NEJM), 1993
ACS CPS-II Cohort Study Pope, et al. Am J Respir Crit Care Med (AJRCCM), 1995
Independent Re-analyses of Harvard Six-Cities and ACS CPS-II Studies Krewski et al. HEI Special Report , 2000; J Tox Enviro Health, Special Issue, 2003 3-yr reanalysis by a team of 31 independent researchers with oversight from a 9-member expert panel and peer review by a special panel of the HEI Health Review Committee. Included full data access that insured the privacy and confidentiality of research participants. Reanalyses include data audits, full replication and validation, and extensive sensitivity analyses.
Harvard Six-Cities and ACS CPS-II Cohort Studies of Air Pollution and Mortality: Initial, Independent, Extended, and Replicative Analyses
Extended analyses of Harvard Six-Cities study Laden et al. AJRCCM, 2006 Schwartz et al. EHP, 2008 Lepeule et al. EHP, 2012
Extended analyses of ACS CPS-II study Pope et al. JAMA, 2002; Pope et al. Circulation, 2004; Jerrett et al. Epidemiology, 2005; Krewski et al. HEI Rep. 2009 Jerrett et al. NEJM, 2009; Smith et al. Lancet, 2009 Turner et al. AJRCCM, 2011; Jerrett et al. AJRCCM, 2013
Replicative studies in other cohorts: Miller et al. (Women’s Health Initiative) NEJM, 2007; Beelen et al. (Netherlands) EHP, 2008; Zeger et al. (U.S. National Medicare) EHP, 2008; Puett et al. (Nurses Health Study) EHP, 2009; Puett et al. (Health Professionals) EHP, 2011; Hart et al. (U.S. Truckers) AJRCCM, 2011; Lipsett et al. (California Teachers) AJRCCM, 2011; Crouse et al. (Canadian ) EHP, 2012; Cesaroni et al. (Rome) EHP, 2013
**See recent meta-analytic review by Hoek et al. Environ Health, 2013** Working Draft, Aug. 2, 2013, C. Arden Pope III,

Episode studies of morbidity and mortality Meuse Valley, Belgium, 1930 Donora, PA, 1948 London Smog, 1952
Cohort-based Mortality Studies
Population-based cross-sectional mortality studies Lave, Seskin. Science, 1970 Evans et al. Environ Int, 1984 Ozkaynak, Thurston. Risk Anal, 1987 --and others
Time-series and case-crossover daily mortality studies Dominici et al. (NMMAPS) HEI, 2003 Zanobetti et al. (112 US cities) EHP, 2009 Analitis et al. (15-29 Euro cities) Epi, 2006 Anderson et al. (meta anal) Epi. 2005 --and many, many others
Intervention/Natural Experiment studies -Intermittent operation of a steel mill. Pope AJPH, 1989, Ghio JAM, 2004 -US Life Expectancy and pollution reduction. Pope et al. NEJM, 2009 -Ireland coal ban. Dockery et al. HEI, 2013 -China Huai river RD. Chen et al. PNAS, 2013 --and others
Time-series and case-crossover hospitalization studies Schwartz (8 cities). Epi, 1999 Dominici et al. (204 US counties) JAMA, 2006 --and many others
Lung function/resp. symptoms studies Dockery et al. JAWMA, 1982 Pope et al. ARRD, 1991 Hoek et al. Eur Respir J, 1998 Gauderman et al. NEJM, 2004 --and many others
Others The literature is large, complex, and growing.
Cardio- and cerebrovascular disease events studies Peters et al. Circulation 2001 Pope et al. Circulation 2006 Wellenius, et al. Arch Intern Med, 2012 --and many others
Subclinical markers of cardiovascular health studies Including systemic inflammation, oxidative stress, endothelial cell activation, thrombosis and coagulation, vascular dysfunction and atherosclerosis, blood pressure, altered cardiac autonomic function/HRV, etc.) For overview see Brook et al. Circulation 2010
Controlled human exposure and animal toxicological studies For overview see Brook et al. Circulation 2010
A Broader View of the PM Air Pollution and Human Health Scientific Literature
Working Draft, Aug. 2, 2013, C. Arden Pope III, PhD
Biggest criticisms regarding the overall results: 1. The effects aren’t big enough to be compelling (need RR > 2.0)
2. The effects are too large to be biologically plausible based on
an extrapolation of smoking literature.
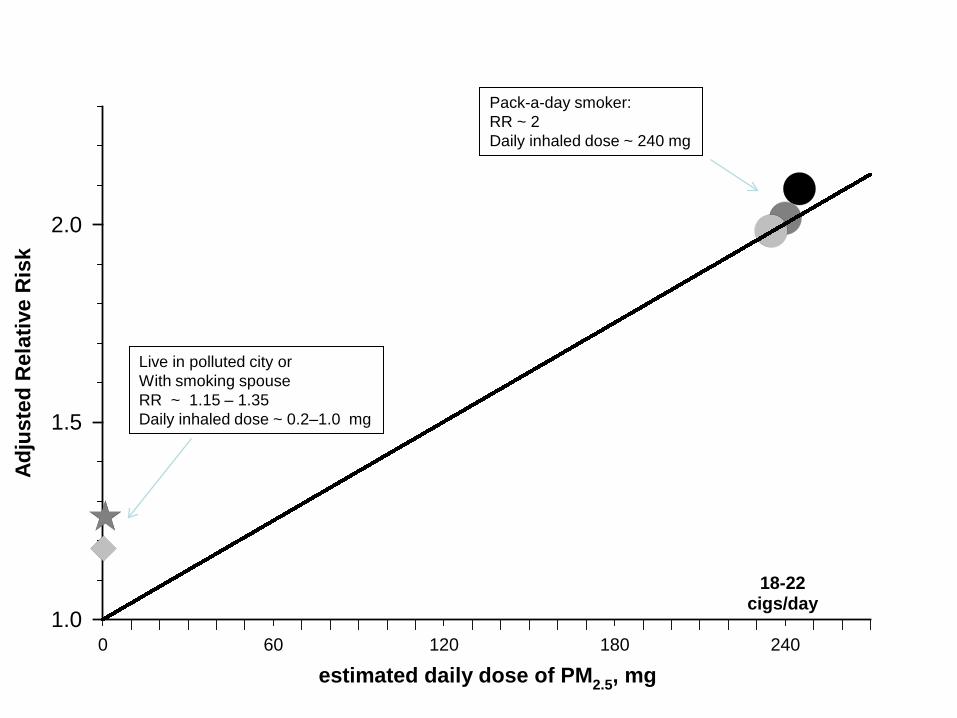
0 60 120 180 240
Adju
sted
Rel
ativ
e R
isk
1.0
1.5
2.0
estimated daily dose of PM2.5, mg
18-22cigs/day
Pack-a-day smoker: RR ~ 2 Daily inhaled dose ~ 240 mg
Live in polluted city or With smoking spouse RR ~ 1.15 – 1.35 Daily inhaled dose ~ 0.2–1.0 mg


0 60 120 180 240 300
Adju
sted
Rel
ativ
e R
isk
1.0
1.5
2.0
2.5
<3cigs/day
estimated daily dose of PM2.5, mg
23+cigs/day
8-12cigs/day
13-17cigs/day
18-22cigs/day
4-7cigs/day
Pope, Burnett, Krewski, et al. 2009.
Figure 1. Adjusted relative risks (and 95% CIs) of IHD (light gray), CVD (dark gray), and CPD (black) mortality plotted over estimated daily dose of PM2.5 from different increments of current cigarette smoking. Diamonds represent comparable mortality risk estimates for PM2.5 from air pollution. Stars represent comparable pooled relative risk estimates associated with SHS exposure from the 2006 Surgeon General’s report and from the INTERHEART study.

0.1 1.0 10.0 100.0
Adju
sted
Rel
ativ
e R
isk
1.0
1.5
2.0
2.5
estimated daily dose of PM2.5, mg
Exposure from
Second hand cigarette smoke: Stars, from 2006 Surgeon General Report and INTERHEART studyAnd air pollution: Hex, from Womens Health Initiative cohort Diamonds, from ACS cohort Triangles, Harvard Six Cities cohort
Exposure from smoking<3, 4-7, 8-12, 13-17, 18-22, and 23+
cigarettes/day
Figure 2. Adjusted relative risks (and 95% CIs) of ischemic heart disease (light gray), cardiovascular (dark gray), and cardiopulmonary (black) mortality plotted over baseline estimated daily dose (using a log scale) of PM2.5 from current cigarette smoking (relative to never smokers), SHS, and air pollution.

0 60 120 180 240 300 360 420 480 540
Adju
sted
Rel
ativ
e R
isk
1.0
1.5
2.0
2.5
3.0
(<3)
Estimated daily dose of PM2.5, mg (cigarettes smoked per day)
(4-7)
Adju
sted
Rel
ativ
e R
isk
5
10
15
20
25
30
35
40
(8-12) (13-17) (18-22) (23-27) (28-32) (33-37) (38-42) (>42)
Lung Cancer
Ischemic heart (light gray)Cardiovascular (dark gray)Cardiopulmonary (black)
0.0 0.5 1.01.00
1.25
1.50
0.0 0.5 1.01.00
1.25
1.50