by nancy c. benjamin and ahmadou aly mbaye · pdf fileand ahmadou aly mbaye 3 ... a...
TRANSCRIPT
African Economic Conference 2010, Tunis, Tunisia
Informality and productivity in West Africa: a firm level analysis1
By
Nancy C. Benjamin2
And
Ahmadou Aly MBAYE3
Abstract:
In this study, we investigate the relationship between the informal sector and productivity in West-Africa,
using firm-level data collected on 900 formal and informal businesses in the capital cities of Benin, Burkina
Faso and Senegal. In our sample design, we have avoided the narrow definition of informality as small
scale individual or household firms, and thus included large informal firms. Our results confirm the
heterogeneity of the informal sector and the significance of large informal businesses in West Africa.
Specifically, they confirm the importance of distinguishing the latter from the small informal firms in
describing behavior and identifying obstacles in the investment climate. The productivity gap between
formal and informal firms is found to be important for small informal businesses but much less so for large
informal ones. The factors shown to be associated with this gap include a number of state failures to
provide public services and enforce regulations more systematically.
July, 2010
Preliminary, please do not quote.
1 The results we present in this paper are from a broader study on informality, the business climate and economic growth in West Africa,
funded by the Research Department of the World Bank. We are grateful to several anonymous Bank referees for helpful comments during
the design of the project. We also thank very much experts form UEMOA, and the national governments for helpful assistance during the
data collection phase. Dominique Haughton provided very helpful assistance during the sample design and data analysis phases. A
substantial contribution from Steve Golub is also acknowledged. Of course, the usual disclaimer applies.
2 The World Bank
3 University Cheikh Anta Diop of Dakar
Introduction In recent years there has been a renewed interest in examining the trends and determinants of productivity, both in the economic literature and among policymakers. Krugman (1994) stated, “Productivity isn’t everything, but in the long run, it is almost everything. A country’s ability to improve its standard of living over time depends almost entirely on its ability to raise its output per worker.” Indeed, there is no disputing that productivity is central to a country’s growth and standard of living. Furthermore, productivity affects international competitiveness, employment, and overall social well-being. Previous research has shown that informality is associated with lower growth and productivity, though the channels of influence may vary across regions. For example, in his model of endogenous growth, Loayza posits that the negative effect of informality on growth is due to the fact the informal sector creates a sort of congestion in the use of certain public goods. Informal actors consume these goods, but do not contribute to their financing through taxes. He finds support for his model with empirical tests on Latin American data. Many other empirical studies of developing countries have found that informal businesses are less productive than formal ones (Perry et al. 2009, for example, emphasizes choices made by informal operators; Gelb et al. 2009, points to the poor matching of skilled entrepreneurs with more productive firms). Regarding the negative association of informality and productivity, West Africa is no exception, as we extensively document in this paper, but certain particular influences may be distinct to the region. The predominance of the informal sector in Africa, and the existence of large informal firms in particular, highlight some major issues inhibiting African development. Benjamin and Mbaye (2010) define informality as a continuum, using a spectrum of criteria including: the size of businesses, the type of tax paid (corporate income tax or presumptive tax), access to bank loans, mobility of workplace, and registration. They extensively document the existence of large informal businesses who choose to remain in the ambit of the informal sector, even though they meet all the criteria for formal status. The existence of these firms is a clear manifestation of state failures in Africa: corruption, the governments’ weak enforcement capabilities, and adverse business environments, all of which increase the costs and reduce the benefits of operating formally. High taxes and onerous regulations on formal firms make formalization unappealing while corruption and lack of enforcement enable politically well-connected and influential actors to operate informally with impunity. In this study, we use firm-level data collected on 900 formal and informal businesses in the capital cities of Benin, Burkina Faso and Senegal, to investigate the relationship between informality and productivity. The information obtained from these surveys was complemented by more qualitative information gathered from semi- structured interviews of major stakeholders in the three cities as well as secondary data compiled from the national income accounts. The initial 900 interviews in the three cities were conducted in 2007. A second phase of more in-depth interviews with selected major stakeholders focusing on the large informal sector was carried out in 2009.
I. Informality and productivity: a brief literature survey In the empirical literature on growth accounting, total factor productivity growth (TFP) is estimated to account for one-third to one-half of the observed growth rate of GDP per capita (Nehru and Dhareshwar 1994). The OECD (2008) estimates that contribution of TFP to GDP growth averaged somewhere between 1 and 3 percentage points between 1985 and 2006 for G7 countries, and up to 6 points for other OECD countries. Some economists, such as Nordhaus (2001) and Krugman (1990), consider productivity a good indicator of the standard of living. Causa and Cohen (2005) note, “the industrial productivity of a country is one of the key determinants of its prosperity.” Many studies have also focused on the relationship between productivity and international competitiveness. Mbaye and Golub (2003) define competitiveness in terms of relative unit labor costs, the ratio of wages to labor productivity in one country compared to others. If productivity grows more rapidly than labor compensation, cost competitiveness tends to improve, boosting exports. Mbaye and Golub confirm that relative unit labor costs affect exports of manufactured products for Senegal. Golub and Edwards (2004) obtain similar results for South Africa using the same metholology. Likewise, Causa and Cohen (2005) find a correlation between low productivity levels in developing countries and difficulties in exporting. The OECD (2008) also finds that increasing productivity boosts competitiveness by lowering unit labor costs. Productivity also largely determines the standard of living, since per capita income is clearly associated with output per worker. Poverty tends to decline with output and therefore productivity growth. For example, in Senegal, the elasticity of poverty with respect to per capita income is much greater than with respect to inequality, as measured by the Gini coefficient (Mbaye et al., 2006).4
Among the many factors that are highly correlated with productivity particularly in Africa, informality is found to be paramount. A large literature shows that there is a strong negative correlation between firm formal/informal status and productivity in developing countries. In their review of factors explaining firm growth, Steel and Snodgrass (2008) distinguish between factors external to the firm (market demand for goods produced by the firm, a favorable business environment, quality of infrastructure, access to resources, financing, inputs, training and other firm development services, information on the market) and factors internal to the firm (quality of staff, management, and supervisors). They find that the productivity differential between the two categories of firms is due mainly to unequal access to public services. Gelb et al (2009) compare the productivity of formal firms and informal firms using surveys on the investment climate for a number of countries in southern and eastern Africa. Their results confirm that formal sector firms are on 4 This study found that the elasticity of poverty headcount with respect to per capita income was -1.38 and
with respect to the Gini coefficient is 0.89.
average more productive than informal ones but the gap between formal and informal firms is much less for east African countries than for southern African countries. They attribute this to the difference in the quality of the business environment and the enforcement of rules. The relative weakness of the state in East Africa undermines the performance of formal firms, thereby lowering the gap between formal and informal firm productivity. That is, the benefits of formalization are low in terms of productivity differentials, if business services are of poor quality, or if governments have problem enforcing taxes and regulations pertaining to private businesses. La Porta and Shleifer (2008) obtain related results using World Bank informal sector surveys covering registered and unregistered firms in 13 countries, six from Africa, and micro-enterprise surveys covering 14 countries including India and 13 from Africa. Their most salient result is that the productivity of formal firms is substantially greater than that of informal firms, although most strongly in India. However, once they control for expenditure on inputs, human capital of the top manager and firm size, being unregistered has little additional impact on productivity. Perry et al. (2007), using aggregated data, find that the connection between informality and low productivity to be nuanced in Latin America. According to them, informal entrepreneurs are well aware of their limitations in terms of access to capital and skilled labor. Therefore, they tend to operate in sectors where it is possible to produce more efficiently on a small scale. This is facilitated by the fact that product demand in those sectors where the informal sector thrives tends to be negatively correlated with per capita income, and thus those sectors predominate in most developing countries. Moreover, even in instances where there is an observed productivity differential favoring formal businesses, evasion of taxes and other charges levied on formal firms allows informal business to compete successfully. Perry et al also cast doubt on the negative effect of informality on growth, finding that the coefficient of informality is not robust in a regression on per capita income. The problem is that most of the variables used to explain growth are also correlated with the informal sector. Thus, it is quite difficult distinguish their direct impact on growth from that of informality. When they consider the relationship between informality and productivity using firm-level data, they find a 29% difference on average in labor productivity between the formal and informal sectors of seven Latin American and Caribbean countries in his sample. They found that the productivity levels of firms which started up as informal actors but later formalized were higher than firms which started out and remained informal, suggesting that formalization may have a positive effect on productivity and growth. None of these studies, however, consider large informal firms, which the current study finds to be a major distinguishing feature of West Africa’s informal sector. [Large informal firms are defined as those firms that pay the presumptive lump-sum tax while having revenues above 20 million CFA francs per year (about $40,000). ] Even though these firms are large as measured by sales, their administrative structures are weak and resemble those of small informal firms. Formal firms of the same size have distinct departments and a coherent organizational structure, but informal firms do not. In fact, apart from the owner and a few permanent employees

(rarely more than five), the rest of the personnel are temporary. A single individual manages the firm with little assistance from others. Managerial style is similar to that of small informal firms. None of the usual departments in formal firms (sales, input sourcing, finance, human resources, etc) exist in large informal firms, despite their high levels of sales. Even the accounting function is outsourced to an independent firm, while all medium-size formal firms have in-house accounting departments. In addition, the accounting for these large informal firms is typically highly dishonest, massively underreporting sales and profits. The absence of honest accounting is one of the determining features of the informal sector, particularly for the large informal sector. The fragility of large informal firms distinguishes them from their formal counterparts. Their longevity is strongly linked to that of their owners; most firms disintegrate after the death of the proprietor. Often, those who inherit the firm cannot come to an agreement on how to operate the firm and it collapses. In other cases, a dramatic scandal leads to the imprisonment of the owner of the firm. It is also frequent that conflicts with customs or with suppliers or creditors lead to the demise of the firm. Large informal firms are like a giant with a clay foot. On the one hand, these firms operate on a large scale comparable to that of firms in the formal sector. On the other hand, a simple disagreement with a customs official can put an end to activities. Often these firms benefit from political or religious connections, but this support itself can also be fragile and is not unlimited. As soon as firms lose their political support, or are entangled in incriminating public scandals, or cannot resolve a disagreement with customs, imprisonment or the disappearance of the firm usually follows.
II. State Failures and the informal sector in West Africa
Government policies and institutions, and their failures, shape the informal sector in West African countries. All of the following contribute to informal sector growth: the length and complexity of registration procedures; the failings of the judicial system; the inadequacy of organizations charged with recovering loans and providing support to small enterprises (informal enterprises in particular); and, the ability of large and influential actors—often with the government’s help—to by-pass regulations. In this section, we analyze a few of these obstacles to formality.
a. The Business Climate
The quality of services (infrastructure, judiciary, finance) affects the choices of firms insofar as one of the benefits of formal sector status is greater access to these services; if these services are of poor quality what is the point of being formal? Likewise if formal firms must comply with onerous regulations and high taxes, informal sector status is more appealing. Most studies on the investment climate confirm that countries in the sub-region experience a more adverse business environment than do other developing countries (see rankings from the World Economic Forum’s World Competitiveness Report and the World Bank’s Doing Business Indicators). Countries in West Africa are generally ranked well below those
of the other developing countries. Steel and Snodgrass (2008) conclude that in the African context, getting registered and becoming formal are not advantageous for informal firms.
Our findings largely confirm the results of these surveys, but with certain
variations. Few enterprises saw registration as an obstacle. Of all the enterprises included in the second phase of our study, which focused on formal and large informal firms, only 12 percent had encountered obstacles in registering. Enterprises did, however, cite many other inadequacies in public services.
b. Inadequate public services
Discrimination against the informal sector in access to services does not seem to be a major problem in West Africa. Public services are poor for both formal and informal firms. All firms suffer from similar constraints in this respect.
Education. The problem with education is not so much lack of resources, but misdirected focus. Governments devote a large share of their resources to education and training services. In Senegal, for example, over 40 percent—the largest budgetary allocation for any one sector—is allocated towards education and training. These resources, however, are mainly devoted to general education, with very little for practical training for enterprises. Formal enterprises suffer as much as informal enterprises from this lack practical orientation. Training is mostly on the job, and for most informal firms in the form of apprenticeships. Young people who drop out of school are often pushed by their parents towards informal firms, where they can be enrolled as apprentices. They are used for small tasks, and are paid so little (or not paid at all) that they are basically a source of free labor. The same apprenticeship training occurs in formal enterprises. All formal and informal actors, regardless of whether they work in textiles, fishing, or other manufacturing sectors, decry governments’ failures to providing much-needed practical training for workers (Golub and Mbaye 2002). Financial services. Most informal firms, and almost all small firms, have little access to credit. These enterprises must resort to informal forms of credit, such as loans from family, friends, or tontines, where they generally face high levels of interest (Johnson 2004; Akoten et al. 2006). The failings of the judicial system and the inadequacy of organizations charged with recovering loans cause banks to avoid loans to the domestic private sector without a public guarantee.
The lack of access to credit, however, is not confined to the informal sector, since several formal firms face the same problem. Tax incentives. Discrimination against small informal firms occurs, with regard to exemptions and subsidies for which informal firms are ineligible. The VAT, which is collected by the firm and transferred to the government, is an example of this type of tax. Firms are supposed to pay the VAT in advance, when purchasing inputs, and are then supposed to be reimbursed by the fiscal administration for exemptions. Firms must, however, present credible documents for reimbursement,
which most informal enterprises cannot do. Informal firms also do not benefit exemptions on other inputs, like machines and equipment, which formal firms can obtain under several regimes such as the investment code and the free zones. One should note, however, that many formal firms also frequently fail to receive refunds owed to them. Large informal firms, on the other hand, usually have little trouble obtaining exemptions and refunds. The investment code regime excludes small informal firms because the minimum amount that firms must invest to benefit from the exemption is above what most small firms are capable of. The free trade zone regime, the free trade point regime, and the free status regime also exclude informal firms because of investment minimums. As with the other exemptions, small informal firms are excluded; large informal firms, however, have the necessary connections and have no trouble providing the required paperwork to benefit from the exemption. c. Corruption and the power of large, influential actors Corruption and failure to enforce rules and regulations are also major determinants of informality. The corruption that exists in all rungs of society contributes to the flourishing of large informal actors. Often, they are well connected politically, which offers them some impunity. Court decisions are frequently challenged, and the press often reports corruption scandals in the courts. Large informal actors are supported by a chain of collusion that involves customs, the administration, and the courts. A customs authority from one of the countries we visited confided to us that, “When we arrest a person for fraud, we quickly offer him a deal and do our best to ensure that the case does not get to the tribunal or to the police; once there, one is never sure what the outcome will be.”
Some large informal firms also rely on Islamic brotherhoods for support. Cross-border trade between Senegal and The Gambia offers a good illustration, as described by Golub and Mbaye (2009). This trade has long been dominated by well-identified social and religious groups, such as: the ‘baol baol’—traders from the Mouride brotherhood—, Guineans, and Mauritians. Gambian importers of food products (tomatoes, rice, tea, etc.) are linked to intermediate wholesalers who dominate the distribution chain. The Mouride brotherhood plays an important role in this process. Mouridisme is based on clientelistic relations that connect these business networks. The Mouride disciple proves his allegiance and submission to his marabout (religious leader) by serving him in several ways, including cultivating his land and offerings in kind and in cash. In return, the marabout offers protection by intervening on behalf of disciplines with the authorities, and through provision of an informal social safety net and financial network. This allows Mouride traders from the Senegalese cities of Prokhane and Kaolack to openly engage in smuggling products from The Gambia. In 1986, after the partial deregulation of rice imports, with 25 percent of the market allocated to private enterprises; one of the largest transporters benefiting from the clientelistic allocation of market shares was none other than the personal secretary to the Caliph of the Mourides.
III. Methodology and Data
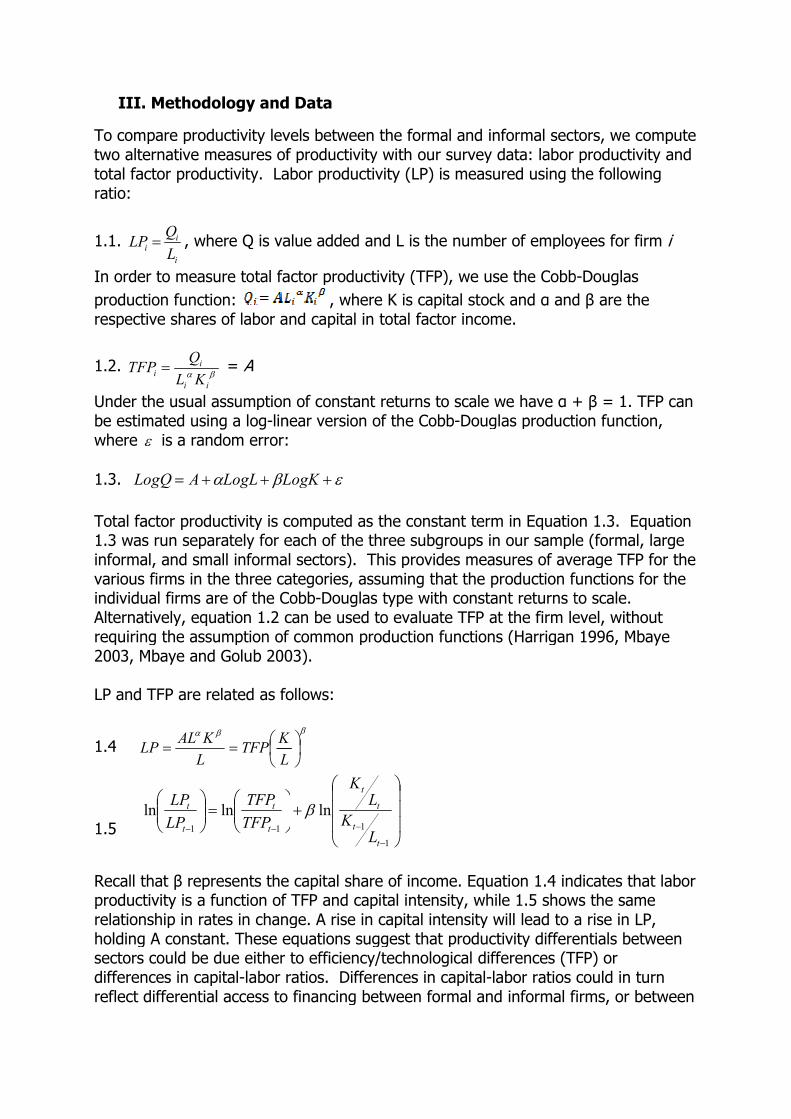
To compare productivity levels between the formal and informal sectors, we compute two alternative measures of productivity with our survey total factor productivity. Labor productivity (LP) is measured using the following ratio:
1.1.
i
i
i
QLP
L= , where Q is value added and L is the number of employees for firm
In order to measure total factor productivity (TFP), we use the Cobb
production function:respective shares of labor and capital in total factor income.
1.2.
= A
Under the usual assumption of constant returns to be estimated using a log-linear version of the Cobbwhere ε is a random error: 1.3. βα ++= LogKLogLALogQ
Total factor productivity is computed as the constant term in 1.3 was run separately for each of the three subgroups in our sample (formal, large informal, and small informal sectors). This provides measures of average TFP for the various firms in the three categories, assuming that the produindividual firms are of the CobbAlternatively, equation 1.2 can be used to evaluate TFP at the firm level, without requiring the assumption of common production functions2003, Mbaye and Golub 2003) LP and TFP are related as follows:
1.4 βα
==L
KTFP
L
KALLP
1.5
=
−− 11
lnlnt
t
t
t
TFP
TFP
LP
LP
Recall that β represents the capital share of income.productivity is a function of TFP and capital intensity, while 1.5 shows the same relationship in rates in change. A rise in capital intensity will lead to a rise in LP, holding A constant. These equations suggest that productivity differentials between sectors could be due either to efficiency/technological differences (TFP) or differences in capital-labor ratios. Differences in capitalreflect differential access to financing between formal and informal firms, or between
ii
i i
QTFP
L Kα β=
Methodology and Data
To compare productivity levels between the formal and informal sectors, we compute two alternative measures of productivity with our survey data: labor productivity and total factor productivity. Labor productivity (LP) is measured using the following
, where Q is value added and L is the number of employees for firm
factor productivity (TFP), we use the Cobb
, where K is capital stock and α and respective shares of labor and capital in total factor income.
Under the usual assumption of constant returns to scale we have α + linear version of the Cobb-Douglas production function,
is a random error:
ε+LogK
Total factor productivity is computed as the constant term in Equation 1.3. Equation 1.3 was run separately for each of the three subgroups in our sample (formal, large informal, and small informal sectors). This provides measures of average TFP for the various firms in the three categories, assuming that the production functions for the individual firms are of the Cobb-Douglas type with constant returns to scale. Alternatively, equation 1.2 can be used to evaluate TFP at the firm level, without requiring the assumption of common production functions (Harrigan 1996,2003, Mbaye and Golub 2003).
LP and TFP are related as follows:
β
L
K
+
−
−
1
1
ln
t
t
t
t
LK
LK
β
represents the capital share of income. Equation 1.4 indicates that labor is a function of TFP and capital intensity, while 1.5 shows the same
relationship in rates in change. A rise in capital intensity will lead to a rise in LP, holding A constant. These equations suggest that productivity differentials between
e due either to efficiency/technological differences (TFP) or labor ratios. Differences in capital-labor ratios could in turn
reflect differential access to financing between formal and informal firms, or between
To compare productivity levels between the formal and informal sectors, we compute data: labor productivity and
total factor productivity. Labor productivity (LP) is measured using the following
, where Q is value added and L is the number of employees for firm i
factor productivity (TFP), we use the Cobb-Douglas
and β are the
+ β = 1. TFP can Douglas production function,
Equation 1.3. Equation 1.3 was run separately for each of the three subgroups in our sample (formal, large informal, and small informal sectors). This provides measures of average TFP for the
ction functions for the Douglas type with constant returns to scale.
Alternatively, equation 1.2 can be used to evaluate TFP at the firm level, without (Harrigan 1996, Mbaye
Equation 1.4 indicates that labor is a function of TFP and capital intensity, while 1.5 shows the same
relationship in rates in change. A rise in capital intensity will lead to a rise in LP, holding A constant. These equations suggest that productivity differentials between
e due either to efficiency/technological differences (TFP) or labor ratios could in turn
reflect differential access to financing between formal and informal firms, or between
large and small firms. Our results indicate that productivity differences between formal and informal firms reflect differences in both efficiency and capital intensity. Data collection is a main challenge facing researchers on the informal economy. This difficulty arises for two main reasons:
1. Lack of a clear definition of informality is a significant caveat in research on the informal sector.
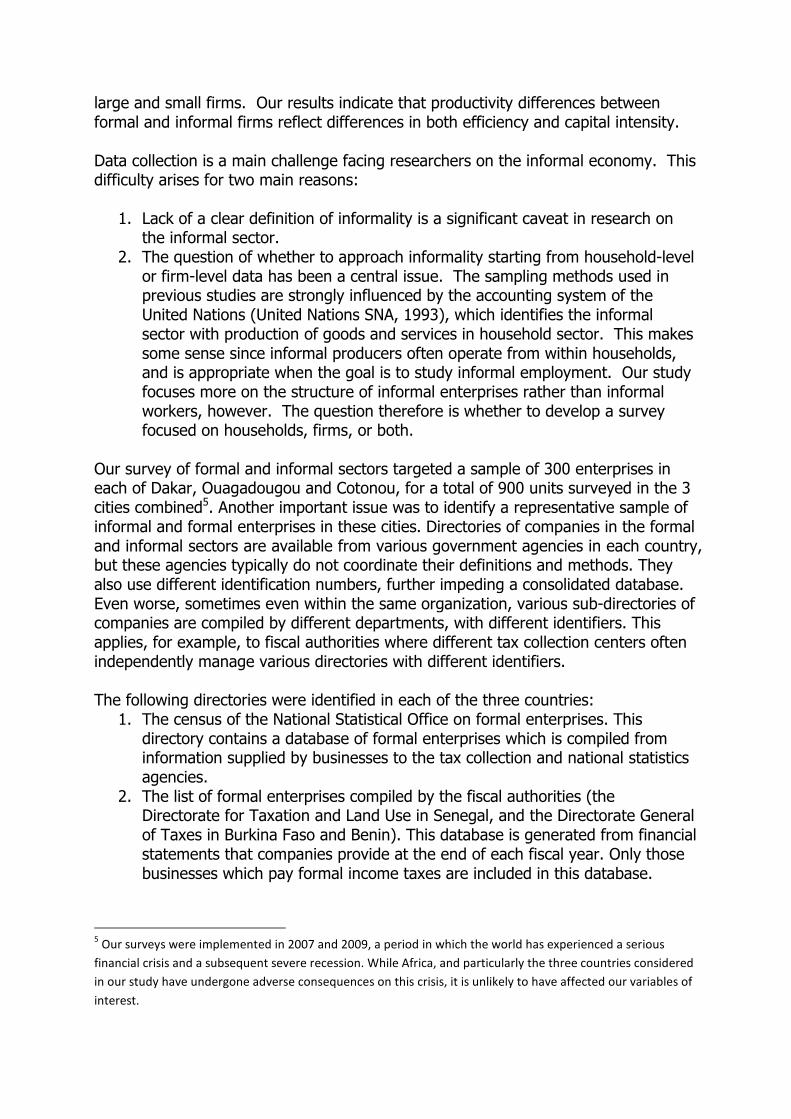
2. The question of whether to approach informality starting from household-level or firm-level data has been a central issue. The sampling methods used in previous studies are strongly influenced by the accounting system of the United Nations (United Nations SNA, 1993), which identifies the informal sector with production of goods and services in household sector. This makes some sense since informal producers often operate from within households, and is appropriate when the goal is to study informal employment. Our study focuses more on the structure of informal enterprises rather than informal workers, however. The question therefore is whether to develop a survey focused on households, firms, or both.
Our survey of formal and informal sectors targeted a sample of 300 enterprises in each of Dakar, Ouagadougou and Cotonou, for a total of 900 units surveyed in the 3 cities combined5. Another important issue was to identify a representative sample of informal and formal enterprises in these cities. Directories of companies in the formal and informal sectors are available from various government agencies in each country, but these agencies typically do not coordinate their definitions and methods. They also use different identification numbers, further impeding a consolidated database. Even worse, sometimes even within the same organization, various sub-directories of companies are compiled by different departments, with different identifiers. This applies, for example, to fiscal authorities where different tax collection centers often independently manage various directories with different identifiers. The following directories were identified in each of the three countries:
1. The census of the National Statistical Office on formal enterprises. This directory contains a database of formal enterprises which is compiled from information supplied by businesses to the tax collection and national statistics agencies.
2. The list of formal enterprises compiled by the fiscal authorities (the Directorate for Taxation and Land Use in Senegal, and the Directorate General of Taxes in Burkina Faso and Benin). This database is generated from financial statements that companies provide at the end of each fiscal year. Only those businesses which pay formal income taxes are included in this database.
5 Our surveys were implemented in 2007 and 2009, a period in which the world has experienced a serious
financial crisis and a subsequent severe recession. While Africa, and particularly the three countries considered
in our study have undergone adverse consequences on this crisis, it is unlikely to have affected our variables of
interest.
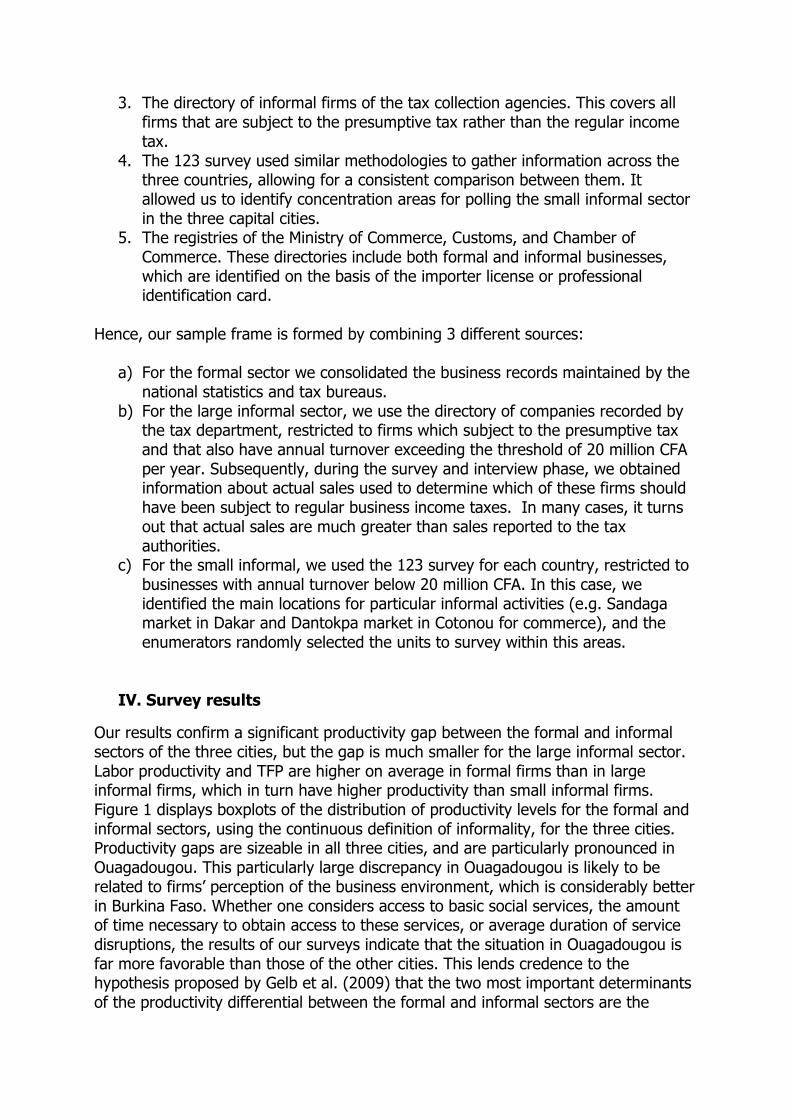
3. The directory of informal firms of the tax collection agencies. This covers all firms that are subject to the presumptive tax rather than the regular income tax.
4. The 123 survey used similar methodologies to gather information across the three countries, allowing for a consistent comparison between them. It allowed us to identify concentration areas for polling the small informal sector in the three capital cities.
5. The registries of the Ministry of Commerce, Customs, and Chamber of Commerce. These directories include both formal and informal businesses, which are identified on the basis of the importer license or professional identification card.
Hence, our sample frame is formed by combining 3 different sources:
a) For the formal sector we consolidated the business records maintained by the national statistics and tax bureaus.
b) For the large informal sector, we use the directory of companies recorded by the tax department, restricted to firms which subject to the presumptive tax and that also have annual turnover exceeding the threshold of 20 million CFA per year. Subsequently, during the survey and interview phase, we obtained information about actual sales used to determine which of these firms should have been subject to regular business income taxes. In many cases, it turns out that actual sales are much greater than sales reported to the tax authorities.
c) For the small informal, we used the 123 survey for each country, restricted to businesses with annual turnover below 20 million CFA. In this case, we identified the main locations for particular informal activities (e.g. Sandaga market in Dakar and Dantokpa market in Cotonou for commerce), and the enumerators randomly selected the units to survey within this areas.
IV. Survey results
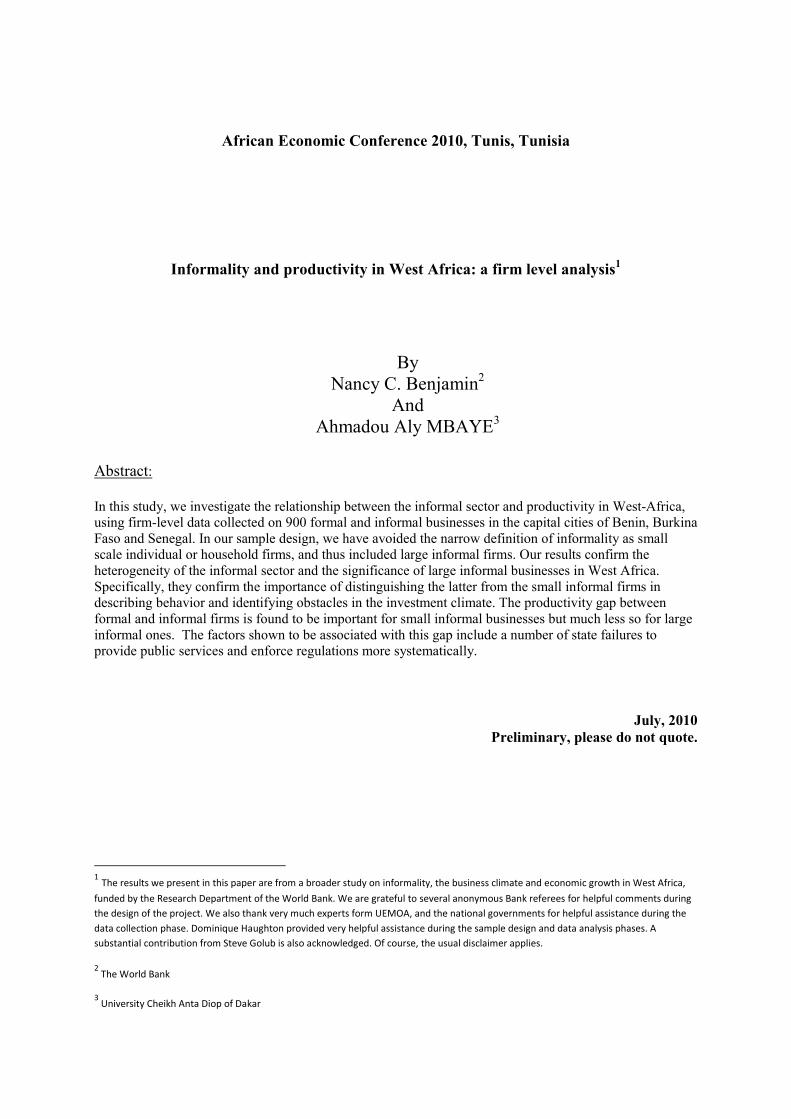
Our results confirm a significant productivity gap between the formal and informal sectors of the three cities, but the gap is much smaller for the large informal sector. Labor productivity and TFP are higher on average in formal firms than in large informal firms, which in turn have higher productivity than small informal firms. Figure 1 displays boxplots of the distribution of productivity levels for the formal and informal sectors, using the continuous definition of informality, for the three cities. Productivity gaps are sizeable in all three cities, and are particularly pronounced in Ouagadougou. This particularly large discrepancy in Ouagadougou is likely to be related to firms’ perception of the business environment, which is considerably better in Burkina Faso. Whether one considers access to basic social services, the amount of time necessary to obtain access to these services, or average duration of service disruptions, the results of our surveys indicate that the situation in Ouagadougou is far more favorable than those of the other cities. This lends credence to the hypothesis proposed by Gelb et al. (2009) that the two most important determinants of the productivity differential between the formal and informal sectors are the

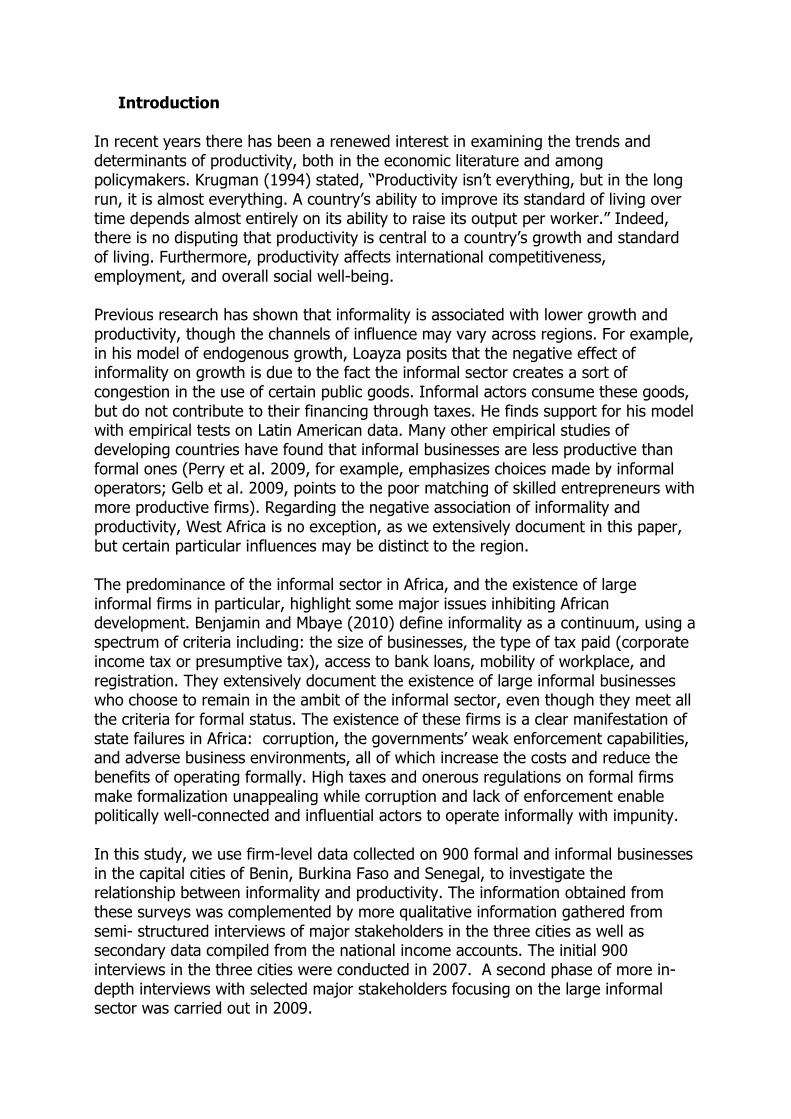
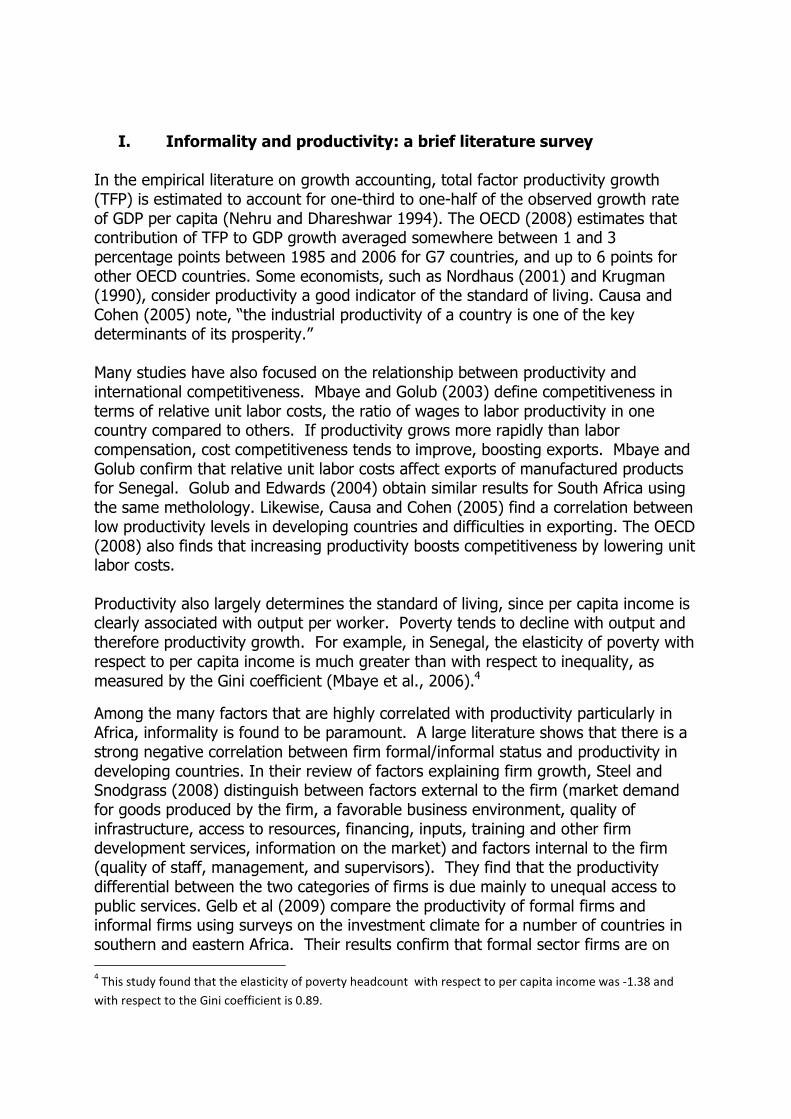
quality of the business environment and the ability of the state to establish and enforce laws and regulations. Figure 2 shows the distribution of productivity for formal, large and small informal sectors for the three cities. Formal firms account for the bulk of firms with the highest labor productivity levels, whereas informal firms constitute a large majority of firms with low productivity. For example, in the case of Senegal, among the companies with a productivity level between 100 million and 300 million CFA francs per worker, 77 percent are in the formal sector, with 23 percent and 0 percent in the large and small informal sectors respectively. Conversely, among the firms with productivity levels below 5 million CFA francs, only 13 percent are in the formal sector, while 7 percent are in the large informal and the remaining 80 percent are in the small informal. As it turns out, productivity differential is actually relatively small between the formal and large informal sectors, whereas the gaps between either of those subgroups and the small informal are quite pronounced. These productivity differences are robust to alternative indicators or correlates of informality such as social insurance contributions for employees, access to bank credit, and maintenance of honest accounts (Figure 3). For example, firms which offer their employees social security coverage (i.e., mainly formal firms) have markedly higher productivity than those which do not offer such coverage. Thus, among firms with productivity levels below 5 million CFA francs, 76 percent offer no social insurance coverage for employees (Figure 3a). Conversely, among firms that achieve a productivity level superior to CFA 300 millions, 75 percent have social security coverage, while the remainder certainly belonging to the large informal6 does not have it. Access to bank credit is correlated with productivity although less so than other factors: among firms with productivity levels below 5 million CFA francs, 84 percent had not received bank credit within the past 5 years, while for firms with high productivity (between 100 and 300 million CFA francs) the rate drops to a still rather-high 62 percent (Figure 3b). A firm’s failure to keep systematic and accurate accounts is strongly associated with productivity levels (Figure 3c): 46 percent of companies with low productivity levels (less than 5 million CFA francs) do not keep regularly updated accounts, as compared to 92 percent of firms with higher productivity levels (100 million – 300 million CFA francs). The story is similar when we consider formal registration (Figure 3d): 100 percent of firms with productivity levels exceeding 50 million CFA francs were registered, as opposed to 86 percent of firms with productivity levels below 50 million CFA francs. V. Factors explaining the productivity gap As mentioned in the previous section, many factors have been identified to explain the productivity differentials between the formal and informal sectors. Here we provide a discussion of a few of them and then proceed to a multivariate
6 By definition, no small informal firm can achieve a level of turnover, and thus a level of productivity above this
threshold.
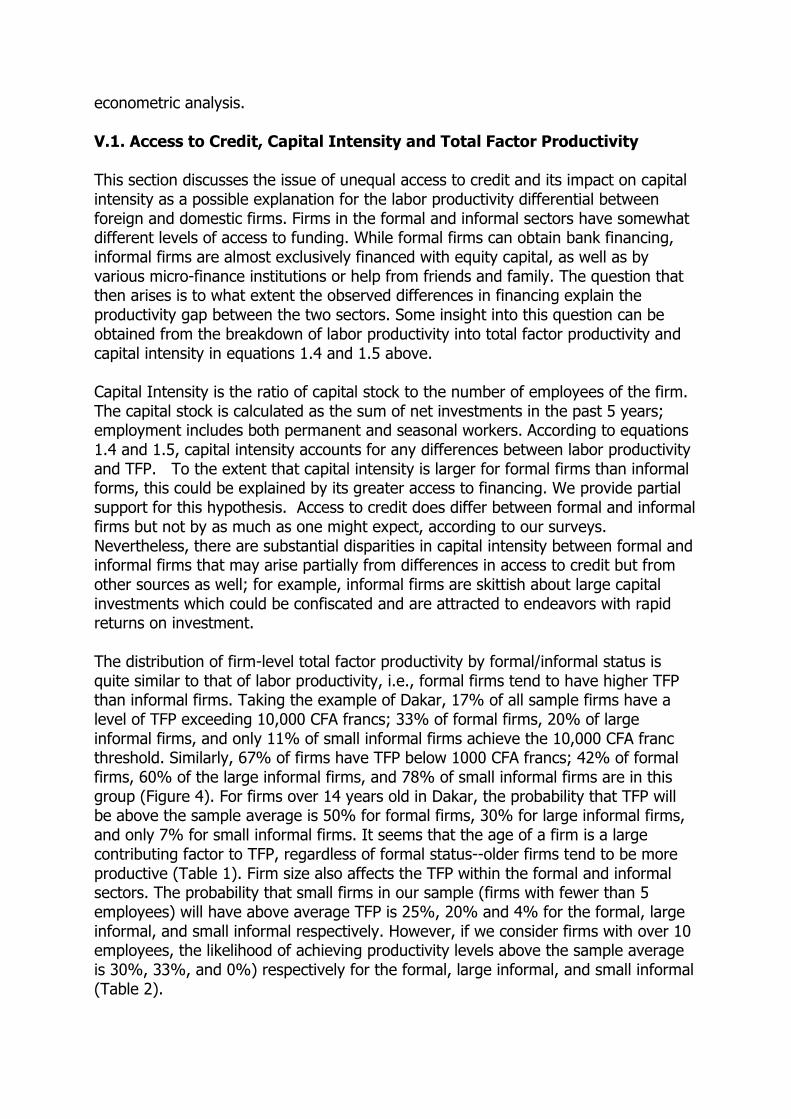
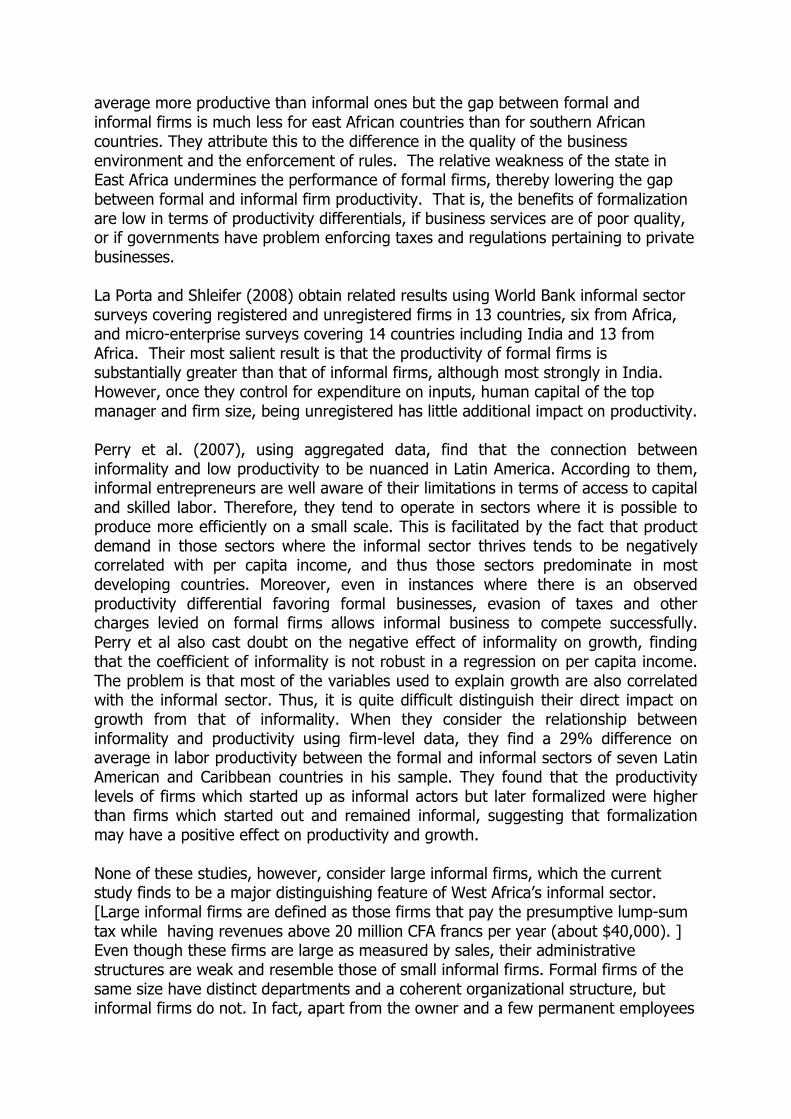
econometric analysis. V.1. Access to Credit, Capital Intensity and Total Factor Productivity This section discusses the issue of unequal access to credit and its impact on capital intensity as a possible explanation for the labor productivity differential between foreign and domestic firms. Firms in the formal and informal sectors have somewhat different levels of access to funding. While formal firms can obtain bank financing, informal firms are almost exclusively financed with equity capital, as well as by various micro-finance institutions or help from friends and family. The question that then arises is to what extent the observed differences in financing explain the productivity gap between the two sectors. Some insight into this question can be obtained from the breakdown of labor productivity into total factor productivity and capital intensity in equations 1.4 and 1.5 above. Capital Intensity is the ratio of capital stock to the number of employees of the firm. The capital stock is calculated as the sum of net investments in the past 5 years; employment includes both permanent and seasonal workers. According to equations 1.4 and 1.5, capital intensity accounts for any differences between labor productivity and TFP. To the extent that capital intensity is larger for formal firms than informal forms, this could be explained by its greater access to financing. We provide partial support for this hypothesis. Access to credit does differ between formal and informal firms but not by as much as one might expect, according to our surveys. Nevertheless, there are substantial disparities in capital intensity between formal and informal firms that may arise partially from differences in access to credit but from other sources as well; for example, informal firms are skittish about large capital investments which could be confiscated and are attracted to endeavors with rapid returns on investment. The distribution of firm-level total factor productivity by formal/informal status is quite similar to that of labor productivity, i.e., formal firms tend to have higher TFP than informal firms. Taking the example of Dakar, 17% of all sample firms have a level of TFP exceeding 10,000 CFA francs; 33% of formal firms, 20% of large informal firms, and only 11% of small informal firms achieve the 10,000 CFA franc threshold. Similarly, 67% of firms have TFP below 1000 CFA francs; 42% of formal firms, 60% of the large informal firms, and 78% of small informal firms are in this group (Figure 4). For firms over 14 years old in Dakar, the probability that TFP will be above the sample average is 50% for formal firms, 30% for large informal firms, and only 7% for small informal firms. It seems that the age of a firm is a large contributing factor to TFP, regardless of formal status--older firms tend to be more productive (Table 1). Firm size also affects the TFP within the formal and informal sectors. The probability that small firms in our sample (firms with fewer than 5 employees) will have above average TFP is 25%, 20% and 4% for the formal, large informal, and small informal respectively. However, if we consider firms with over 10 employees, the likelihood of achieving productivity levels above the sample average is 30%, 33%, and 0%) respectively for the formal, large informal, and small informal (Table 2).
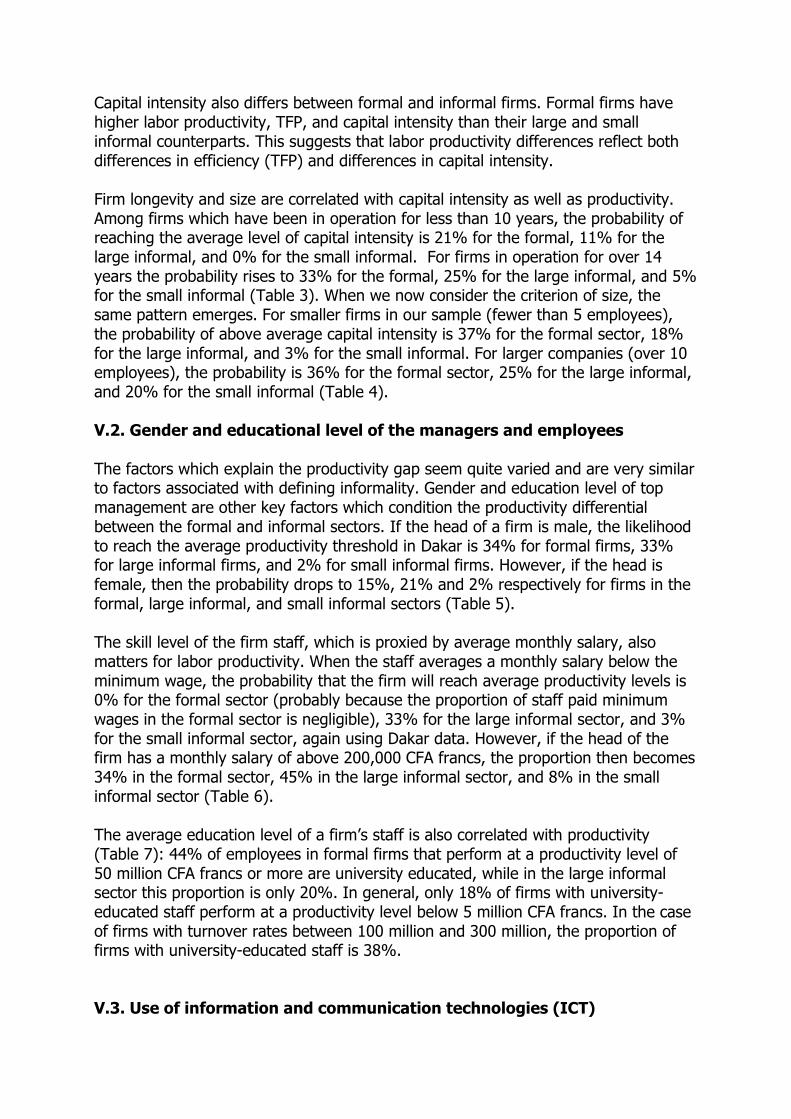
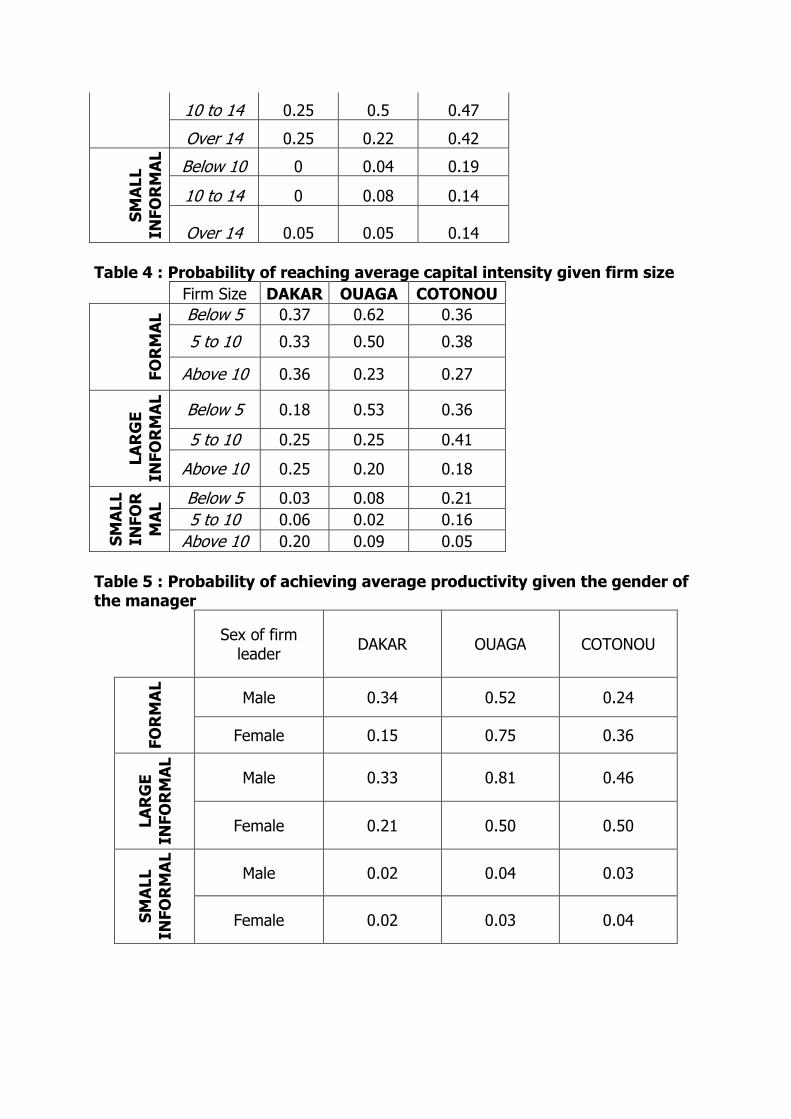
Capital intensity also differs between formal and informal firms. Formal firms have higher labor productivity, TFP, and capital intensity than their large and small informal counterparts. This suggests that labor productivity differences reflect both differences in efficiency (TFP) and differences in capital intensity. Firm longevity and size are correlated with capital intensity as well as productivity. Among firms which have been in operation for less than 10 years, the probability of reaching the average level of capital intensity is 21% for the formal, 11% for the large informal, and 0% for the small informal. For firms in operation for over 14 years the probability rises to 33% for the formal, 25% for the large informal, and 5% for the small informal (Table 3). When we now consider the criterion of size, the same pattern emerges. For smaller firms in our sample (fewer than 5 employees), the probability of above average capital intensity is 37% for the formal sector, 18% for the large informal, and 3% for the small informal. For larger companies (over 10 employees), the probability is 36% for the formal sector, 25% for the large informal, and 20% for the small informal (Table 4). V.2. Gender and educational level of the managers and employees The factors which explain the productivity gap seem quite varied and are very similar to factors associated with defining informality. Gender and education level of top management are other key factors which condition the productivity differential between the formal and informal sectors. If the head of a firm is male, the likelihood to reach the average productivity threshold in Dakar is 34% for formal firms, 33% for large informal firms, and 2% for small informal firms. However, if the head is female, then the probability drops to 15%, 21% and 2% respectively for firms in the formal, large informal, and small informal sectors (Table 5). The skill level of the firm staff, which is proxied by average monthly salary, also matters for labor productivity. When the staff averages a monthly salary below the minimum wage, the probability that the firm will reach average productivity levels is 0% for the formal sector (probably because the proportion of staff paid minimum wages in the formal sector is negligible), 33% for the large informal sector, and 3% for the small informal sector, again using Dakar data. However, if the head of the firm has a monthly salary of above 200,000 CFA francs, the proportion then becomes 34% in the formal sector, 45% in the large informal sector, and 8% in the small informal sector (Table 6). The average education level of a firm’s staff is also correlated with productivity (Table 7): 44% of employees in formal firms that perform at a productivity level of 50 million CFA francs or more are university educated, while in the large informal sector this proportion is only 20%. In general, only 18% of firms with university-educated staff perform at a productivity level below 5 million CFA francs. In the case of firms with turnover rates between 100 million and 300 million, the proportion of firms with university-educated staff is 38%. V.3. Use of information and communication technologies (ICT)
The use of new information and communication technologies is strongly correlated to informal status and productivity levels. Among firms with revenue levels below 5 million CFA francs, 76% do not use email to communicate with customers, as opposed to 38% percent in the case of firms with turnover between 100 and 300 million CFA francs. Likewise, among firms with productivity levels below 5 million CFA francs, 85% do not use websites to interact with customers, as opposed to 77% of firms with turnover levels between 100 and 300 million CFA francs.
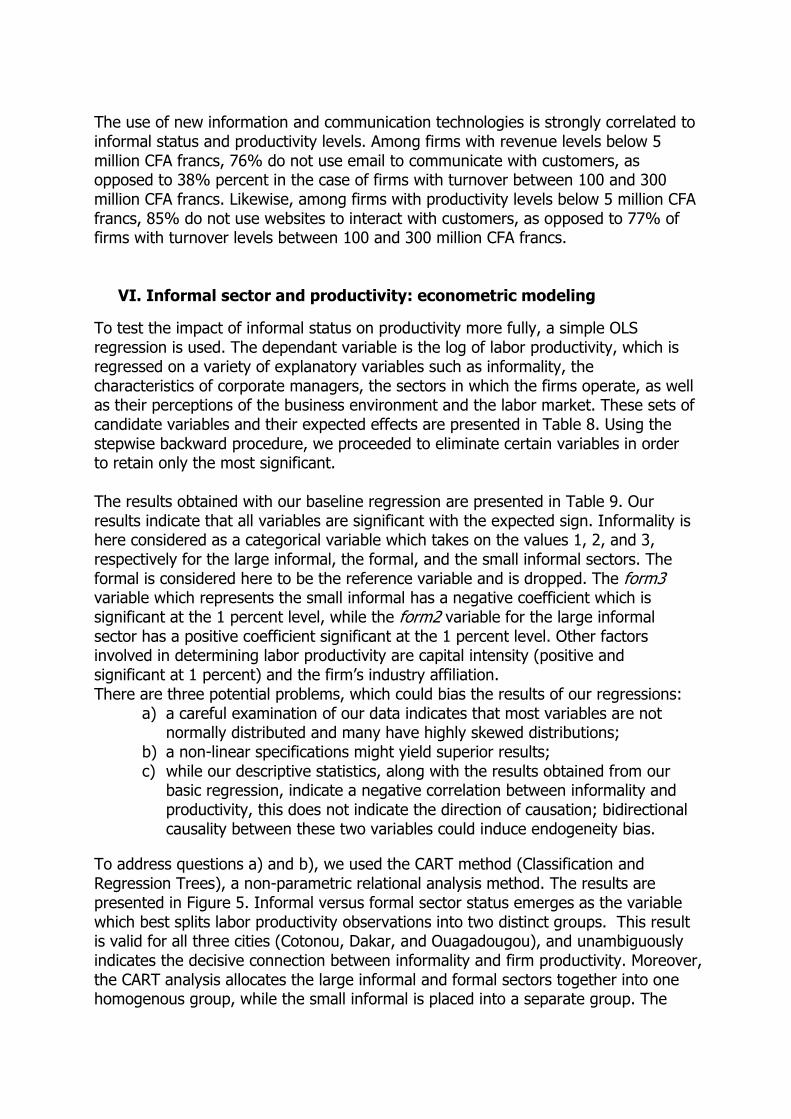
VI. Informal sector and productivity: econometric modeling
To test the impact of informal status on productivity more fully, a simple OLS regression is used. The dependant variable is the log of labor productivity, which is regressed on a variety of explanatory variables such as informality, the characteristics of corporate managers, the sectors in which the firms operate, as well as their perceptions of the business environment and the labor market. These sets of candidate variables and their expected effects are presented in Table 8. Using the stepwise backward procedure, we proceeded to eliminate certain variables in order to retain only the most significant. The results obtained with our baseline regression are presented in Table 9. Our results indicate that all variables are significant with the expected sign. Informality is here considered as a categorical variable which takes on the values 1, 2, and 3, respectively for the large informal, the formal, and the small informal sectors. The formal is considered here to be the reference variable and is dropped. The form3 variable which represents the small informal has a negative coefficient which is significant at the 1 percent level, while the form2 variable for the large informal sector has a positive coefficient significant at the 1 percent level. Other factors involved in determining labor productivity are capital intensity (positive and significant at 1 percent) and the firm’s industry affiliation. There are three potential problems, which could bias the results of our regressions:
a) a careful examination of our data indicates that most variables are not normally distributed and many have highly skewed distributions;
b) a non-linear specifications might yield superior results; c) while our descriptive statistics, along with the results obtained from our
basic regression, indicate a negative correlation between informality and productivity, this does not indicate the direction of causation; bidirectional causality between these two variables could induce endogeneity bias.
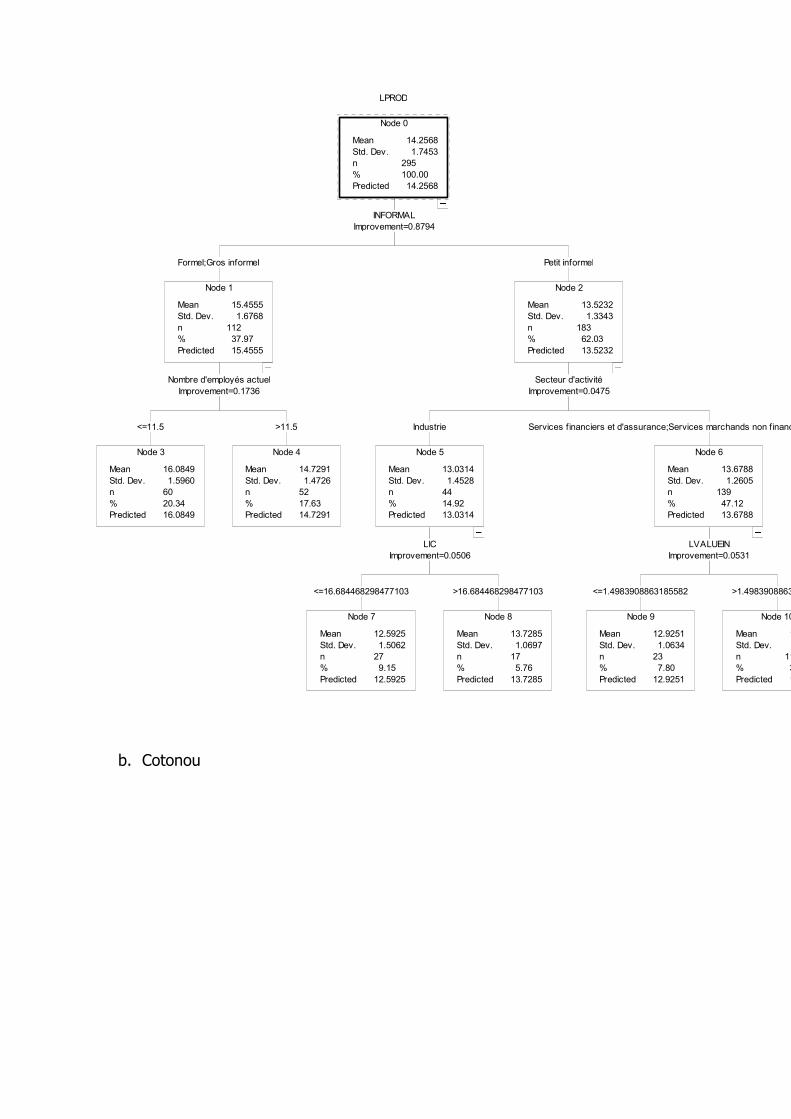
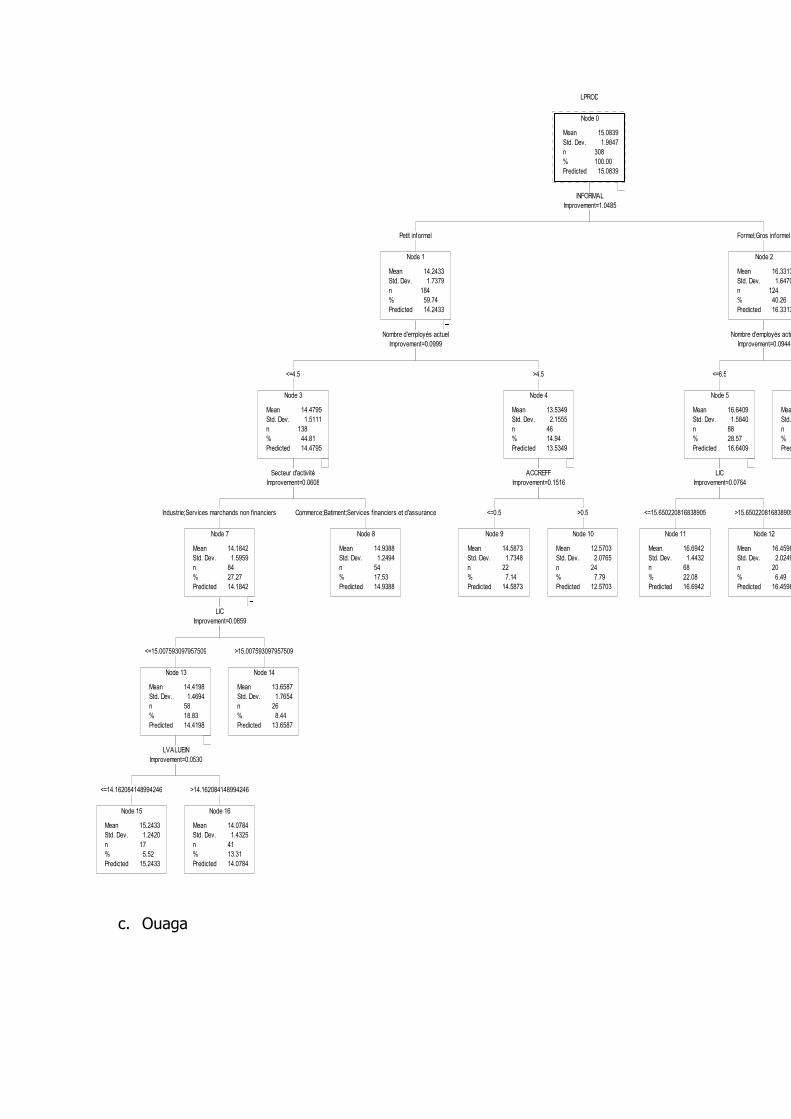
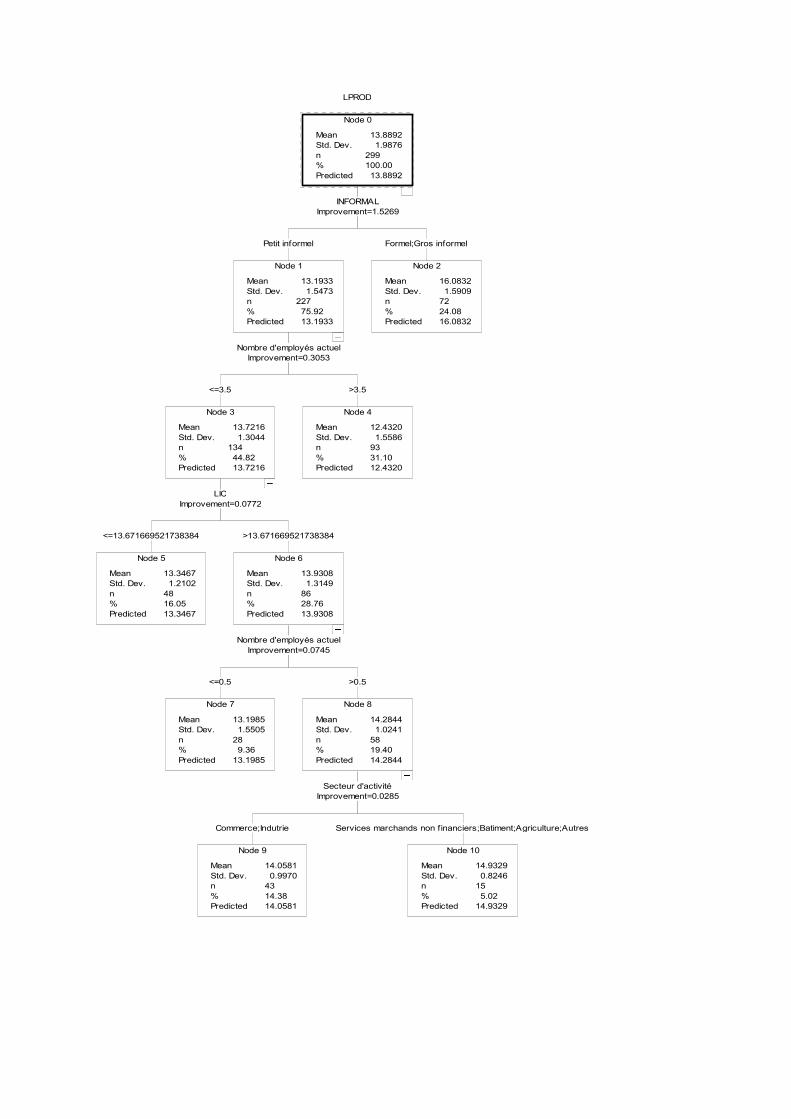
To address questions a) and b), we used the CART method (Classification and Regression Trees), a non-parametric relational analysis method. The results are presented in Figure 5. Informal versus formal sector status emerges as the variable which best splits labor productivity observations into two distinct groups. This result is valid for all three cities (Cotonou, Dakar, and Ouagadougou), and unambiguously indicates the decisive connection between informality and firm productivity. Moreover, the CART analysis allocates the large informal and formal sectors together into one homogenous group, while the small informal is placed into a separate group. The
gap in the average log productivity between the grouped formal and large informal sectors relative to the small informal is 2.09, 1.93, and 2.89 for Dakar, Cotonou, and Ouagadougou respectively. In addition to informal sector classification, other factors also affect labor productivity according to the CART analysis, namely industry in which the firm operates, firm size, and capital intensity. These findings are quite consistent with the findings from our regressions and the descriptive statistics. However, there seemed to be strong correlations between certain explanatory variables, particularly industry and size. We therefore interacted these two variables in a second model, the results of which are presented in Table 10. This new specification improved the results while confirming the main findings. Capital intensity is still significant at 1 percent, with the expected positive sign. The coefficient on form3, which represents the small informal sector, remains significant at 1 percent with negative sign. Industry classification is also significant, most notably affiliation with trade and service sectors. The R-squared statistic also improved. In order to address whether or not the existence of a bidirectional relationship could cause residuals to be correlated with explanatory variables, most econometrics textbooks recommend the use of estimation with instrumental variables. However, we refrained from searching for appropriate instruments in view of recent research which casts doubt on the validity of instrumental variable procedures and their alleged superiority over OLS methods (Murray 2005, Larcker and Rusticus, 2005). Instead, we have resorted to non parametric procedures (Directed Acylic Graphs and CART) to cross check robustness of our results.
VII. Conclusion
Our results confirm the heterogeneity of the informal sector. Specifically, they confirm the importance of distinguishing the large from the small informal firms in describing behavior and identifying obstacles in the investment climate. The productivity gap between formal and informal firms is found to be important for small informal businesses but much less so for large informal ones. The factors shown to be associated with this gap include a number of state failures to provide public services and enforce regulations more systematically. Indeed we find a variety of state failures to be associated with the predominance of informality, and in particular of large informal firms. But we also find the fragility of informal firms and their choices on internal organization to be likely factors affecting their productivity.
Reference
1. Akoten, J.E, Sawada, Y and Otsuka, K. (2006), ‘The Determinants of Credit Access and Impacts on Micro and Small Enterprises: The Case of Garment Producers in Kenya’, Economic Development and Cultural Change, Vol. 54 No. 4. pp.927-944.
2. Benjamin N. & Mbaye A. A. (2010), “Le secteur Informel en Afrique de l’Ouest : Quelques éléments de définition”.edited by Mbaye and Benjamin. International Policy Center Working Paper number 100.
3. Causa, O and D. Cohen (2006), “Industrial Productivity in 51 Countries, Rich and Poor”, CEPR Discussion Papers 5549, Discussion paper
4. Dabla-Norris, E, M. Gradstein and G. Inchauste, (2008), « What cause firms to hide output? the determinants of informality”, Journal of Development Economics 85, pp 1-27
5. Gelb, A., Mengistae, T., Ramachandran, V. et Shah M. K. (2009), ‘To Formalize or not to Formalize? Comparisons of microenterprise data from Southern and East Africa’, Gelb Mengistae Ramachandran Shah, Draft 1292009, January
6. Golub, S.S and L. Edwards (2004),"South Africa’s International Cost Competitiveness and Exports in Manufacturing" (with Lawrence Edwards), World Development, Elsevier, vol. 32(8), pages 1323-1339, August
7. Golub, S.S. and A.A. Mbaye (2009), “National Policies and Smuggling in Africa: the case of the Gambia and Senegal” World Development Vol 37, n°37,pp.595-606
8. Harrigan, J. (1996),"Technology, Factor Supplies and International Specialization: Estimating the Neoclassical Model”, NBER Working Paper 5722, National Bureau of Economic Research, Inc
9. Johnson, J.E. (2004), "Factors Influencing the Early Internationalisation of High-Technology Start-Ups," Journal of International Enterpreneurship 2, nos. 1/2: 139-54.
10. Krugman, P. (1990), "Increasing, Returns and Economic Geography”, NBER Working Papers 3275, National Bureau of Economic Research, Inc
11. Krugman, P., (1994), "Fluctuatios, Instability and Agglomaration”, NBER Working Papers 4616, National Bureau of Economic Research, Inc
12. La Porta, R. and Shleifer, A. (2008)“The Unofficial Economy and Economic development”, Brookings Papers on Economic Activity, Available at http://www.brookings.edu/economics/bpea/bpea.aspx
13. Larcker, David F. and Rusticus, Tjomme O., 2005, On the use of instrumental variables in accounting research, Stanford University working paper
14. Loayza, N.A., (1997), "The Economics of the informal sector: a simple model and some empirical evidence from latin America,” Policy Research Working Paper Series 1727, The World Bank
15. Mbaye A. A. et al (2006), « Mise à jour des indicateurs de niveau de vie au Sénégal » document préparé pour l’élaboration de la deuxième phase du
Document de stratégie de réduction de la pauvreté au Sénégal. Centre de Recherches Economiques Appliquées, Université de Dakar.
16. Mbaye, A.A. (2003), Competitiveness, manufacturing and exports in Senegal”. in Senegal: Policies and strategies for accelerated growth and poverty reduction. A country economic memorandum. The World Bank, AFTP4.
17. Mbaye, A.A. and S. Golub, (2002), "Obstacles and Opportunities for Senegal's International Competitiveness: Case Studies of the Peanut Oil, Fishing and Textile Industries", World Bank Africa Region Working Paper Series No. 37, September
18. Mbaye, A.A. and S. Golub, (2003), “Relative Unit Labor Costs, International Competitiveness and Exports: The Case of Senegal”, Journal of African Economies, vol. 2 no11
19. Murray, M.J (2005), Murray, Michael P. 2005. “The Bad, the Weak, and the Ugly: Avoiding the Pitfalls of Instrumental Variables Estimation.” Social Science Research Network Working Paper No. 843185.
20. Nehru, W et Dhareshwar A. (1994), “New Estimates of Total Factor Productivity Growth for developing and Industrial Countries”, Policy Research Working Paper N°1313, International Economic Departement, The World Bank, Washington, DC.
21. Nordhaus, W.D (2001). "Productivity Growth and the New Economy”, NBER Working Papers 8096, National Bureau of Economic Research, Inc
22. Nordhauss, W. (2001), “Alternative Methods for measuring Productivity Growth”, NBER Working Paper Series n°8095
23. OCDE (2008), Productivity measurement and analysisi: proceedings, OCDE Workshop
24. Perry G. E., W.F. Maloney, O.S. Arias, P. Fajnzyblber, A. Mason, J. Saavedra-Chanduvi (2007), Informality: Exit and Exclusion, The World Bank,Washington DC
25. Schreyer, Paul and Dirk Pilat (2001), “Measuring Productivity”, OECD Economic Studies No. 33, pp. 127-169, OECD, Paris.
26. Sharpe, A.(1997), "The Productivity Paradox: An Evaluation of Competing Explanations," Canadian Business Economics, Fall, Volume 6, Number 1, pp. 32-47.
27. Stell, W.F. and D. Snodgrass (2008), “Raising Productivity and Reducing Risks of Household Enterprises: Diagnostic Methodology Framework”, World Bank Africa Region Analysis on the Informal Economy with the support of the WIEGO network System of National
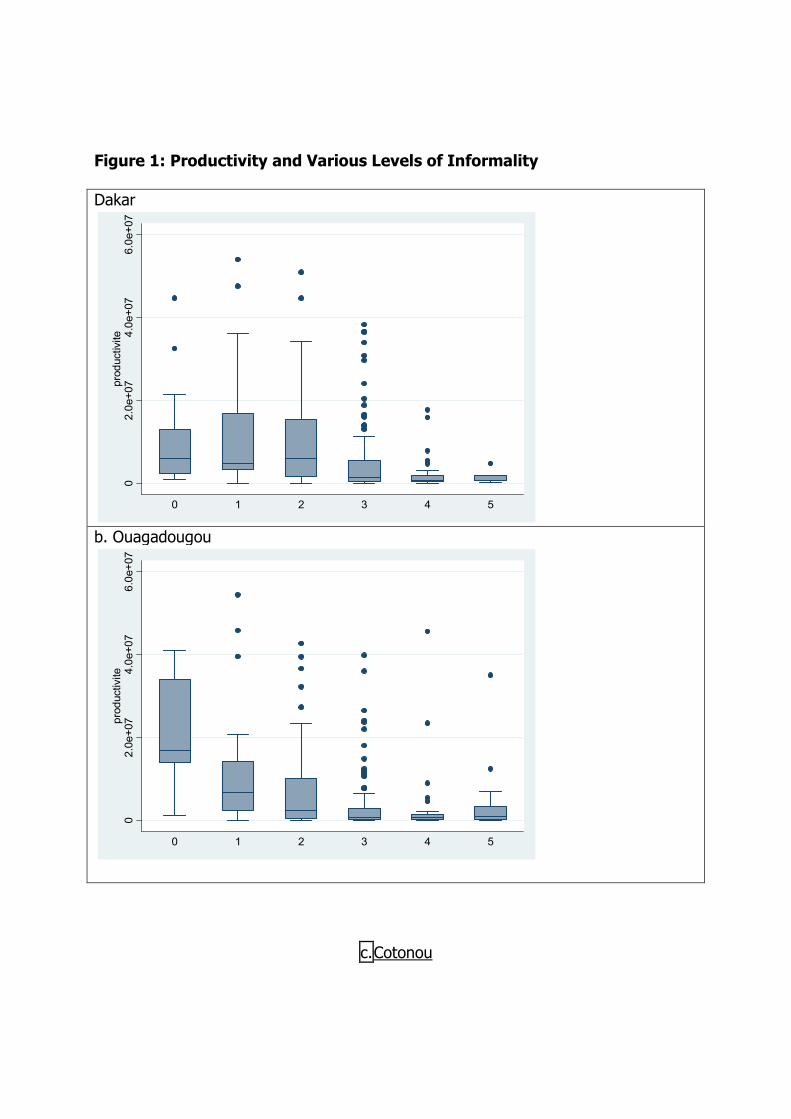
Figure 1: Productivity and Various Levels of Informality Dakar
b. Ouagadougou
c.Cotonou
02.0e+07
4.0e+07
6.0e+07
productivite
0 1 2 3 4 5
02.0e+07
4.0e+07
6.0e+07
productivite
0 1 2 3 4 5
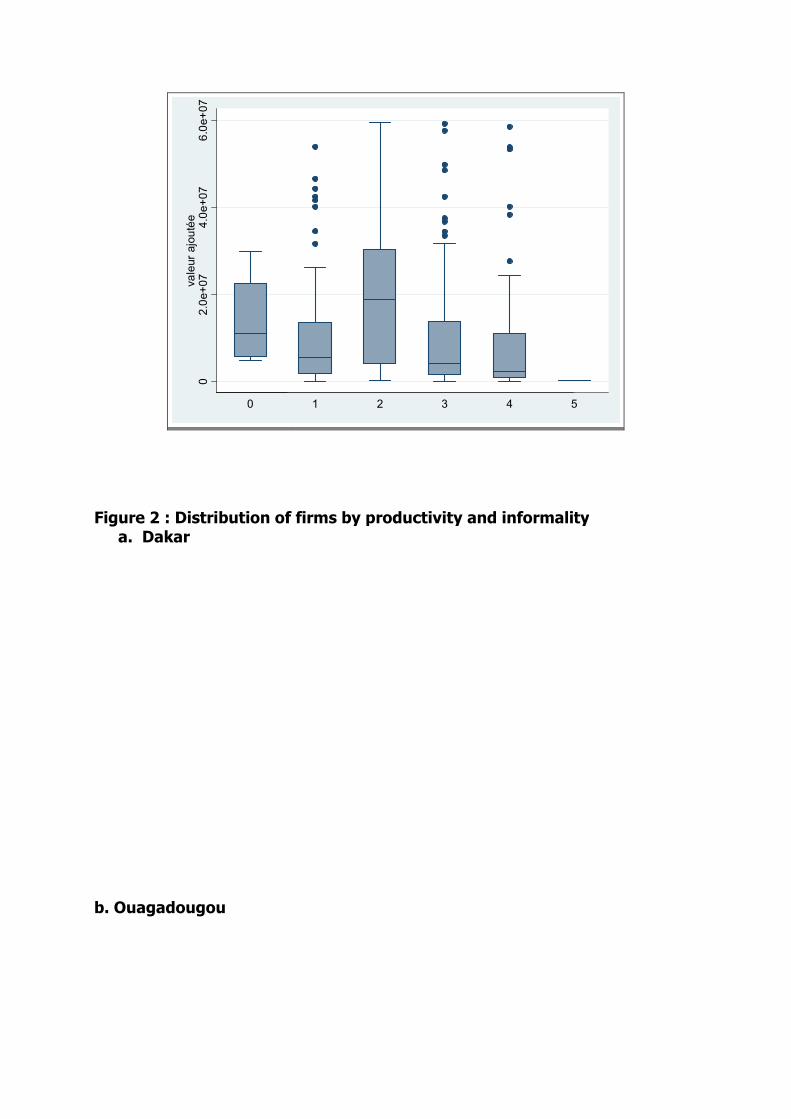
Figure 2 : Distribution of firms by productivity and informality
a. Dakar
b. Ouagadougou
02.0e+07
4.0e+07
6.0e+07
valeur ajoutée
0
Distribution of firms by productivity and informality
1 2 3 4 5
Distribution of firms by productivity and informality
5

c : Cotonou
Figure 3 : Distribution of firms by labor productivity and various criteria of informality
a. compliance with social security obligations
Distribution of firms by labor productivity and various criteria of
compliance with social security obligations
Distribution of firms by labor productivity and various criteria of

b. Access to bank credit
c. Maintaining honest accounts.
Access to bank credit
Maintaining honest accounts.
d. Registration
Figure 4 : Distribution of firms by TFP and : Distribution of firms by TFP and formal/informal status
formal/informal status

Figure 5: Classification and Regression Trees
a. Dakar
lassification and Regression Trees
b. Cotonou
Node 0
Mean
Std. Dev.
n
%
Predicted
14
1
295
100
14
.2568
.7453
.00
.2568
Node 2
Mean
Std. Dev.
n
%
Predicted
13
1
183
62
13
.5232
.3343
.03
.5232
Node 6
Mean
Std. Dev.
n
%
Predicted
13
1
139
47
13
.6788
.2605
.12
.6788
Node 10
Mean
Std. Dev.
n
%
Predicted
13
116
39
13
Node 9
Mean
Std. Dev.
n
%
Predicted
12
1
23
7
12
.9251
.0634
.80
.9251
Node 5
Mean
Std. Dev.
n
%
Predicted
13
1
44
14
13
.0314
.4528
.92
.0314
Node 8
Mean
Std. Dev.
n
%
Predicted
13
1
17
5
13
.7285
.0697
.76
.7285
Node 7
Mean
Std. Dev.
n
%
Predicted
12
1
27
9
12
.5925
.5062
.15
.5925
Node 1
Mean
Std. Dev.
n
%
Predicted
15
1
112
37
15
.4555
.6768
.97
.4555
Node 4
Mean
Std. Dev.
n
%
Predicted
14
1
52
17
14
.7291
.4726
.63
.7291
Node 3
Mean
Std. Dev.
n
%
Predicted
16
1
60
20
16
.0849
.5960
.34
.0849
LPROD
INFORMAL
Improvement=0.8794
Petit informel
Secteur d'activité
Improvement=0.0475
Services financiers et d'assurance;Services marchands non f inanciers;Commerce;Batiment
LVALUEIN
Improvement=0.0531
>1.4983908863185582<=1.4983908863185582
Industrie
LIC
Improvement=0.0506
>16.684468298477103<=16.684468298477103
Formel;Gros informel
Nombre d'employés actuel
Improvement=0.1736
>11.5<=11.5
c. Ouaga
Node 0
Mean
Std. Dev.
n
%
Predicted
15
1
308
100
15
.0839
.9847
.00
.0839
Node 2
Mean
Std. Dev.
n
%
Predicted
16
1
124
40
16
.3313
.6470
.26
.3313
Mean
Std. Dev.
n
%
Predicted
Node 5
Mean
Std. Dev.
n
%
Predicted
16
1
88
28
16
.6409
.5840
.57
.6409
Node 12
Mean
Std. Dev.
n
%
Predicted
16
2
20
6
16
.4598
.0249
.49
.4598
Node 11
Mean
Std. Dev.
n
%
Predicted
16
1
68
22
16
.6942
.4432
.08
.6942
Node 1
Mean
Std. Dev.
n
%
Predicted
14
1
184
59
14
.2433
.7379
.74
.2433
Node 4
Mean
Std. Dev.
n
%
Predicted
13
2
46
14
13
.5349
.1555
.94
.5349
Node 10
Mean
Std. Dev.
n
%
Predicted
12
2
24
7
12
.5703
.0765
.79
.5703
Node 9
Mean
Std. Dev.
n
%
Predicted
14
1
22
7
14
.5873
.7348
.14
.5873
Node 3
Mean
Std. Dev.
n
%
Predicted
14
1
138
44
14
.4795
.5111
.81
.4795
Node 8
Mean
Std. Dev.
n
%
Predicted
14
1
54
17
14
.9388
.2494
.53
.9388
Node 7
Mean
Std. Dev.
n
%
Predicted
14
1
84
27
14
.1842
.5959
.27
.1842
Node 14
Mean
Std. Dev.
n
%
Predicted
13
1
26
8
13
.6587
.7654
.44
.6587
Node 13
Mean
Std. Dev.
n
%
Predicted
14
1
58
18
14
.4198
.4694
.83
.4198
Node 16
Mean
Std. Dev.
n
%
Predicted
14
1
41
13
14
.0784
.4325
.31
.0784
Node 15
Mean
Std. Dev.
n
%
Predicted
15
1
17
5
15
.2433
.2420
.52
.2433
LPROD
INFORMAL
Improvement=1.0485
Formel;Gros informel
Nombre d'employés actuel
Improvement=0.0944
<=6.5
LIC
Improvement=0.0764
>15.650220816838905<=15.650220816838905
Petit informel
Nombre d'employés actuel
Improvement=0.0999
>4.5
ACCREFF
Improvement=0.1516
>0.5<=0.5
<=4.5
Secteur d'activité
Improvement=0.0608
Commerce;Batiment;Services financiers et d'assuranceIndustrie;Services marchands non f inanciers
LIC
Improvement=0.0859
>15.007593097957509<=15.007593097957509
LVALUEIN
Improvement=0.0530
>14.162084148994246<=14.162084148994246
Node 0
Mean
Std. Dev.
n
%
Predicted
13
1
299
100
13
.8892
.9876
.00
.8892
Node 2
Mean
Std. Dev.
n
%
Predicted
16
1
72
24
16
.0832
.5909
.08
.0832
Node 1
Mean
Std. Dev.
n
%
Predicted
13
1
227
75
13
.1933
.5473
.92
.1933
Node 4
Mean
Std. Dev.
n
%
Predicted
12
1
93
31
12
.4320
.5586
.10
.4320
Node 3
Mean
Std. Dev.
n
%
Predicted
13
1
134
44
13
.7216
.3044
.82
.7216
Node 6
Mean
Std. Dev.
n
%
Predicted
13
1
86
28
13
.9308
.3149
.76
.9308
Node 8
Mean
Std. Dev.
n
%
Predicted
14
1
58
19
14
.2844
.0241
.40
.2844
Node 10
Mean
Std. Dev.
n
%
Predicted
14
0
15
5
14
.9329
.8246
.02
.9329
Node 9
Mean
Std. Dev.
n
%
Predicted
14
0
43
14
14
.0581
.9970
.38
.0581
Node 7
Mean
Std. Dev.
n
%
Predicted
13
1
28
9
13
.1985
.5505
.36
.1985
Node 5
Mean
Std. Dev.
n
%
Predicted
13
1
48
16
13
.3467
.2102
.05
.3467
LPROD
INFORMAL
Improvement=1.5269
Formel;Gros informelPetit informel
Nombre d'employés actuel
Improvement=0.3053
>3.5<=3.5
LIC
Improvement=0.0772
>13.671669521738384
Nombre d'employés actuel
Improvement=0.0745
>0.5
Secteur d'activité
Improvement=0.0285
Services marchands non financiers;Batiment;Agriculture;AutresCommerce;Indutrie
<=0.5
<=13.671669521738384
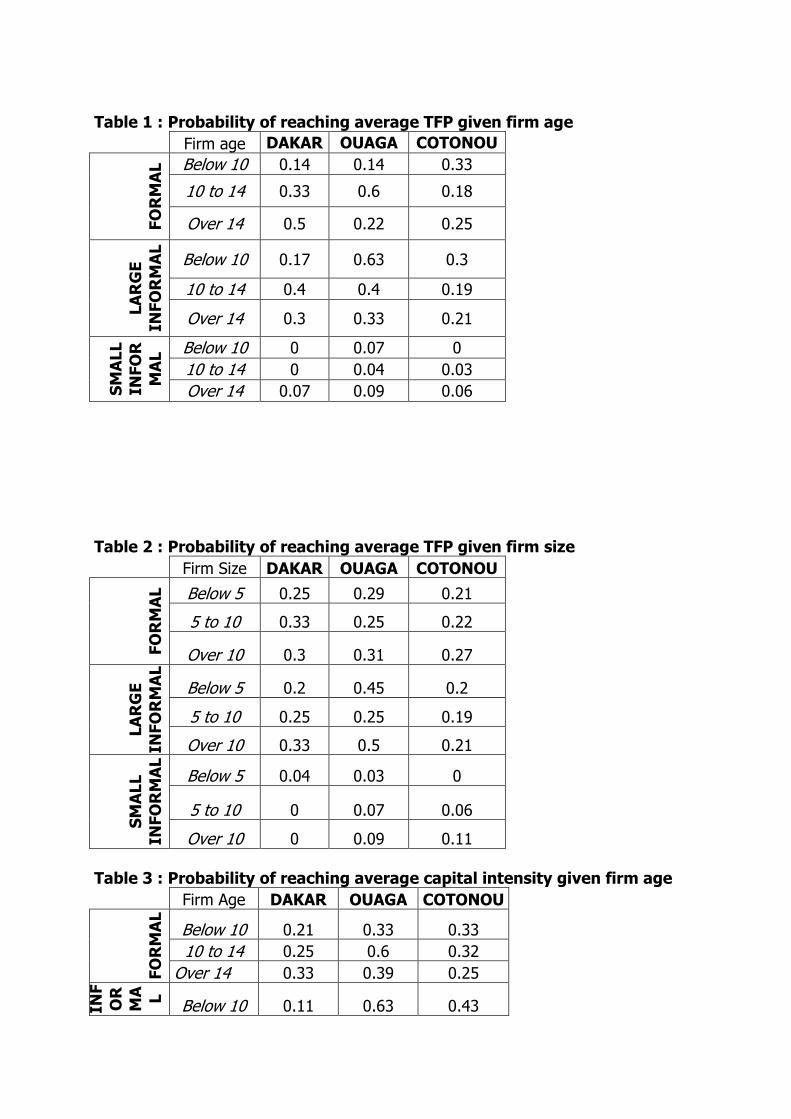
Table 1 : Probability of reaching average TFP given firm age
Firm age DAKAR OUAGA COTONOU FORMAL Below 10 0.14 0.14 0.33
10 to 14 0.33 0.6 0.18
Over 14 0.5 0.22 0.25
LARGE
INFORMAL
Below 10 0.17 0.63 0.3
10 to 14 0.4 0.4 0.19
Over 14 0.3 0.33 0.21
SMALL
INFOR
MAL Below 10 0 0.07 0
10 to 14 0 0.04 0.03
Over 14 0.07 0.09 0.06
Table 2 : Probability of reaching average TFP given firm size
Firm Size DAKAR OUAGA COTONOU
FORMAL
Below 5 0.25 0.29 0.21
5 to 10 0.33 0.25 0.22
Over 10 0.3 0.31 0.27
LARGE
INFORMAL
Below 5 0.2 0.45 0.2
5 to 10 0.25 0.25 0.19
Over 10 0.33 0.5 0.21
SMALL
INFORMAL
Below 5 0.04 0.03 0
5 to 10 0 0.07 0.06
Over 10 0 0.09 0.11 Table 3 : Probability of reaching average capital intensity given firm age
Firm Age DAKAR OUAGA COTONOU
FORMAL
Below 10 0.21 0.33 0.33
10 to 14 0.25 0.6 0.32
Over 14 0.33 0.39 0.25
INF
OR
MA L
Below 10 0.11 0.63 0.43
10 to 14 0.25 0.5 0.47
Over 14 0.25 0.22 0.42 SMALL
INFORMAL
Below 10 0 0.04 0.19
10 to 14 0 0.08 0.14
Over 14 0.05 0.05 0.14 Table 4 : Probability of reaching average capital intensity given firm size
Firm Size DAKAR OUAGA COTONOU
FORMAL Below 5 0.37 0.62 0.36
5 to 10 0.33 0.50 0.38
Above 10 0.36 0.23 0.27
LARGE
INFORMAL
Below 5 0.18 0.53 0.36
5 to 10 0.25 0.25 0.41
Above 10 0.25 0.20 0.18
SMALL
INFOR
MAL Below 5 0.03 0.08 0.21
5 to 10 0.06 0.02 0.16
Above 10 0.20 0.09 0.05
Table 5 : Probability of achieving average productivity given the gender of the manager
Sex of firm
leader DAKAR OUAGA COTONOU
FORMAL
Male 0.34 0.52 0.24
Female 0.15 0.75 0.36
LARGE
INFORMAL
Male 0.33 0.81 0.46
Female 0.21 0.50 0.50
SMALL
INFORMAL
Male 0.02 0.04 0.03
Female 0.02 0.03 0.04
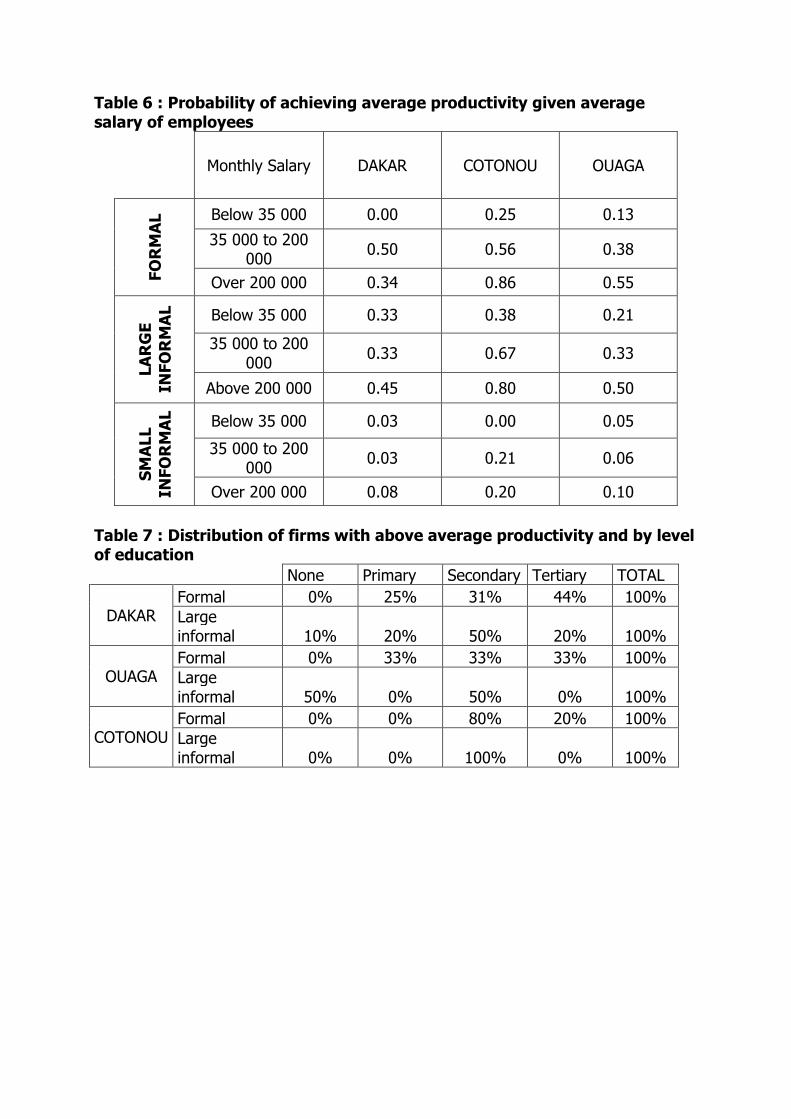
Table 6 : Probability of achieving average productivity given average salary of employees
Monthly Salary DAKAR COTONOU OUAGA FORMAL Below 35 000 0.00 0.25 0.13
35 000 to 200 000
0.50 0.56 0.38
Over 200 000 0.34 0.86 0.55
LARGE
INFORMAL
Below 35 000 0.33 0.38 0.21
35 000 to 200 000
0.33 0.67 0.33
Above 200 000 0.45 0.80 0.50
SMALL
INFORMAL
Below 35 000 0.03 0.00 0.05
35 000 to 200 000
0.03 0.21 0.06
Over 200 000 0.08 0.20 0.10
Table 7 : Distribution of firms with above average productivity and by level of education
None Primary Secondary Tertiary TOTAL
DAKAR Formal 0% 25% 31% 44% 100% Large informal 10% 20% 50% 20% 100%
OUAGA Formal 0% 33% 33% 33% 100% Large informal 50% 0% 50% 0% 100%
COTONOU Formal 0% 0% 80% 20% 100% Large informal 0% 0% 100% 0% 100%
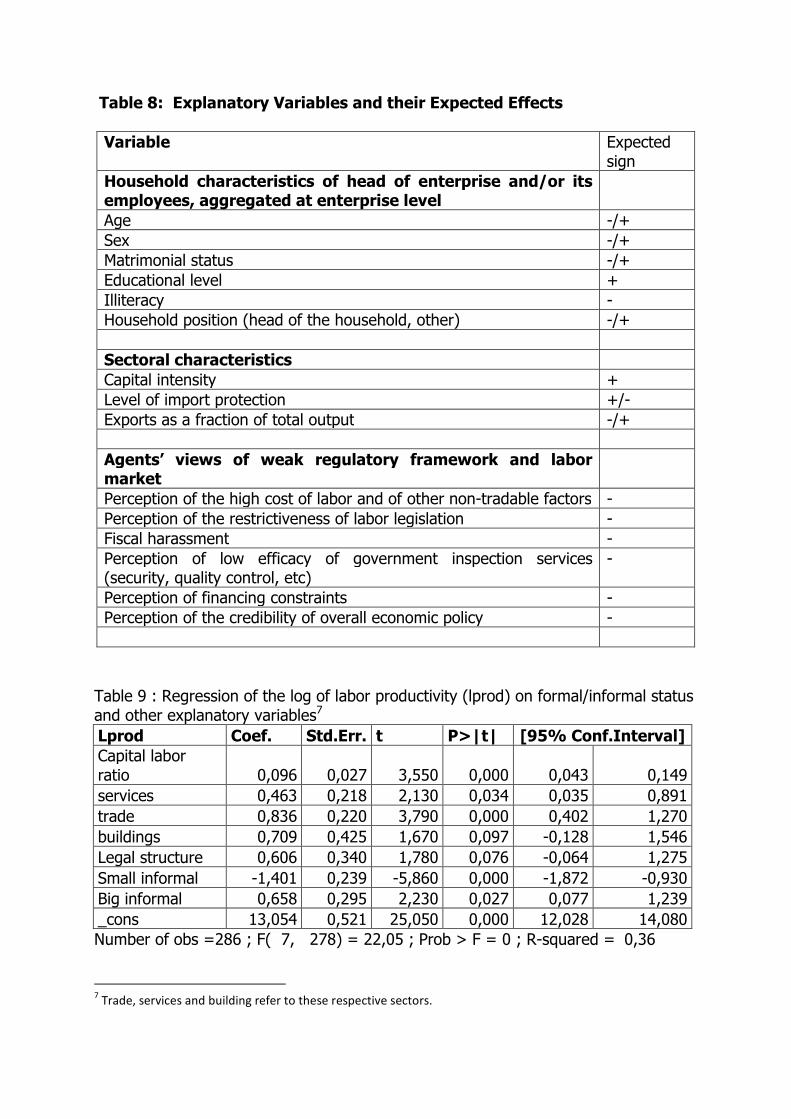
Table 8: Explanatory Variables and their Expected Effects Variable Expected
sign Household characteristics of head of enterprise and/or its employees, aggregated at enterprise level
Age -/+ Sex -/+ Matrimonial status -/+ Educational level + Illiteracy - Household position (head of the household, other) -/+ Sectoral characteristics Capital intensity + Level of import protection +/- Exports as a fraction of total output -/+ Agents’ views of weak regulatory framework and labor market
Perception of the high cost of labor and of other non-tradable factors - Perception of the restrictiveness of labor legislation - Fiscal harassment - Perception of low efficacy of government inspection services (security, quality control, etc)
-
Perception of financing constraints - Perception of the credibility of overall economic policy -
Table 9 : Regression of the log of labor productivity (lprod) on formal/informal status and other explanatory variables7
Lprod Coef. Std.Err. t P>|t| [95% Conf.Interval]
Capital labor ratio 0,096 0,027 3,550 0,000 0,043 0,149
services 0,463 0,218 2,130 0,034 0,035 0,891
trade 0,836 0,220 3,790 0,000 0,402 1,270
buildings 0,709 0,425 1,670 0,097 -0,128 1,546
Legal structure 0,606 0,340 1,780 0,076 -0,064 1,275
Small informal -1,401 0,239 -5,860 0,000 -1,872 -0,930
Big informal 0,658 0,295 2,230 0,027 0,077 1,239
_cons 13,054 0,521 25,050 0,000 12,028 14,080 Number of obs =286 ; F( 7, 278) = 22,05 ; Prob > F = 0 ; R-squared = 0,36
7 Trade, services and building refer to these respective sectors.
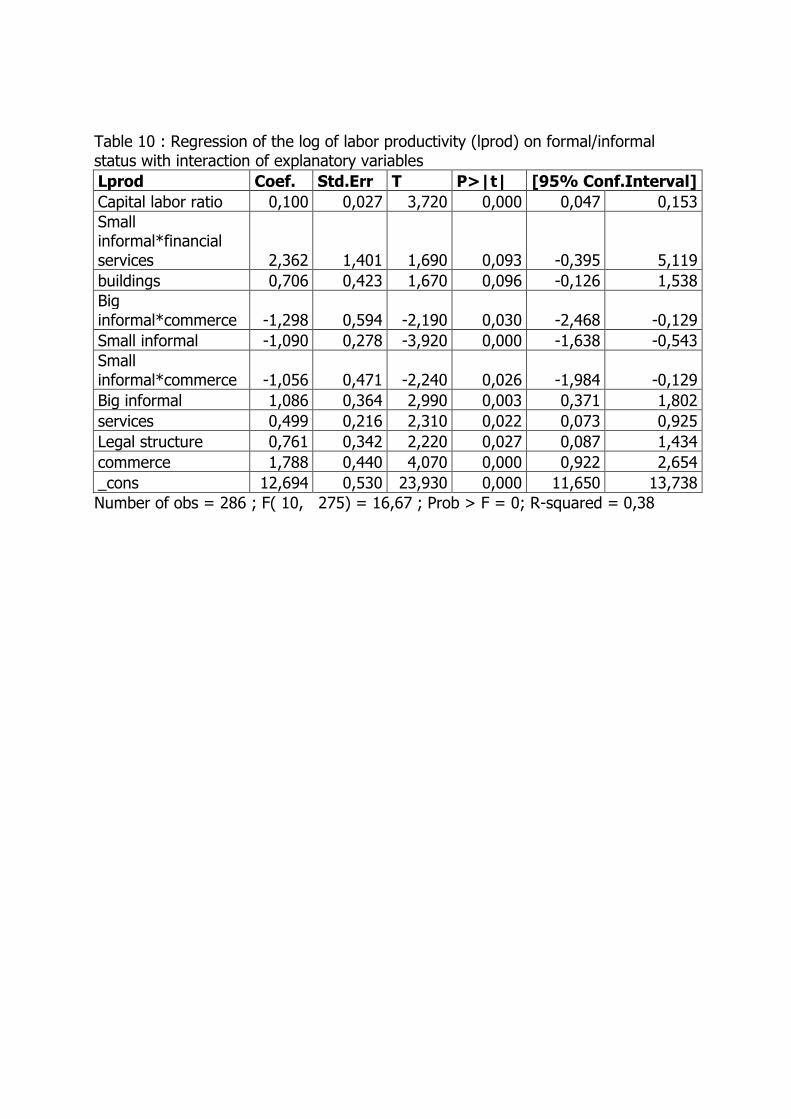
Table 10 : Regression of the log of labor productivity (lprod) on formal/informal status with interaction of explanatory variables
Lprod Coef. Std.Err T P>|t| [95% Conf.Interval]
Capital labor ratio 0,100 0,027 3,720 0,000 0,047 0,153 Small informal*financial services 2,362 1,401 1,690 0,093 -0,395 5,119
buildings 0,706 0,423 1,670 0,096 -0,126 1,538 Big informal*commerce -1,298 0,594 -2,190 0,030 -2,468 -0,129
Small informal -1,090 0,278 -3,920 0,000 -1,638 -0,543 Small informal*commerce -1,056 0,471 -2,240 0,026 -1,984 -0,129
Big informal 1,086 0,364 2,990 0,003 0,371 1,802
services 0,499 0,216 2,310 0,022 0,073 0,925
Legal structure 0,761 0,342 2,220 0,027 0,087 1,434
commerce 1,788 0,440 4,070 0,000 0,922 2,654
_cons 12,694 0,530 23,930 0,000 11,650 13,738 Number of obs = 286 ; F( 10, 275) = 16,67 ; Prob > F = 0; R-squared = 0,38