by marketgauge · bigger profits are easier when your trades are immediately profitable welcome, if...
TRANSCRIPT
By MarketGauge.com
Bigger Profits Are Easier When Your
Trades Are Immediately Profitable
Welcome, if you’re a day trader, swing trader or options trader this ebook is for
you because…
You’re about to discover a focused approach to anticipating the markets’ next
move, along with trading tactics that lead to immediate profits and trade
entries you can be confident in trading whether you are a new trader or have
years of experience.
Think about how you feel, and how you tend to trade, when a new trade is
substantially profitable immediately after you enter it.
Now contrast that feeling with how you feel, and tend to trade, when the market
is about to close and you’ve been in a trade for a few hours that is trading at a
loss.
If you’re like most traders the immediately profitable trade creates a desire
to “trade this one right”. You’re thoughts are on how to make the most of
the apparent opportunity. You’re also enjoying trading.
The losing trade scenario, on the other hand, is disappointing. You’re more likely
to be thinking about how to change the trade, rather than confidently sticking
with your initial plan. This is common even among experienced and disciplined
traders who know that losses, when managed properly, are not a problem.
Regardless of our trading style or instrument (day trading, swing trading,
investing, stocks, ETFs, options, forex, etc.) I believe that we all enjoy trading
more when our trades are immediately profitable.
More importantly, I also believe that immediate profitability makes it easier to be
more disciplined, which in turn leads to more trading success.
Immediate profits are only one important result of having great entry
strategies and tactics.
Even more important than immediate profits is having enough confidence in
your trade to ensure you trade with discipline. When you have enough
confidence in your trade, “immediate” profits becomes a relative term. This
means that even if a trade initially trades at an unrealized loss, you won’t have
that feeling of disappointment.
How To Create The Confidence In Your Trade That
Eliminates The Frustrating Feelings Of Unrealized Losses
And Reduces Real Losses!
Successful traders confidently believe they are doing the right thing when they
take a loss.
Since beginning my trading career in 1990 on the floor of the New York
commodities exchanges, and spending years in a multi-billion dollar hedge
fund, I’ve worked with hundreds of professional traders and thousands of
active individual investors. In this time I’ve found that confidently taking a
loss is a common theme among successful traders at every level – floor
traders, fund managers, and active individual traders.
One goal of this ebook is to show you how you can have the confidence of a pro
in determining and executing on your stop losses, so you can improve your
profitability. There are several ways to accomplish this level of confidence, but
this book is narrowly focused on very a specific way of identifying great trade
entries with stops you can have confidence in.
A great trade entry is one that has a risk level (a stop loss) has three important
qualities:
1. You believe that you should exit the trade when the stop level is hit. This
leads to consistently executing your plan.
2. The potential loss is small relative to the expected return when profit
targets are hit. This leads to more profitable system.
3. The frequency of getting stopped out is in line with frequency and expected
return when profit targets are hit. This leads to a more predicable equity
curve and more confidence in trade execution.
A simple starting point for selecting a stop level that can provide all
three of these critical qualities of a great trade entry is to have your stop
loss be outside of the current day’s range.
The low or high of the day creates an emotionally powerful “line in the sand” that
seems to naturally command the respect of traders. Think about how you feel
when markets make new highs or lows. Are you more inclined to pay attention
and respect the “trend of the day” at this point?
In my experience of working with successful traders, most traders are more likely
to feel confident that their stop is safe when it’s beyond the current day’s trading
range. This alone can improve your trading because it leads to less second
guessing and moving stops prematurely.
Additionally, traders tend to feel more accepting of the fact that their trade is
not working and exit the trade as they planned when it corresponds with a
break of the current day’s range. This leads to more disciplined trading and less
second guessing your stops when they are hit.
However, better trading is not simply placing your stop below the low of the day
if you’re long, or above the high of the day if you’re short! You need more of an
edge to determine when the high or the low of the day has been put in, and which
days you should use this tactic.
In other words, you must identify the RIGHT DAY and TIME to use the
day’s range as your stop.
You’re about to discover a reliable way to determine the day’s high or low early
in the day. This creates powerful opportunities for all trading styles to use these
levels for great stops that are quick and easy to identify, and, as discussed
above… leads to less second guessing.
For example:
If you’re a day trader… when you are able to buy near the low of the day,
you’ll find many opportunities for trades that will have very profitable reward-
to-risk ratios that don’t require the market to do much more than simply return
to the high of the day!
If you’re a swing trader… you’ll be able to pinpoint the exact days to take very
low risk trades that are more likely to enable you to avoid holding positions
overnight that are not yet profitable. In addition to having more of your first days
in the trade be profitable, you’ll be able to identify trades that have multi-day or
more trend potential, creating huge profits relative to your initial stop level.
If you’re an option trader… you’ll be able to identify market turning points for
precise timing of directional option strategies, and enjoy the benefits just listed
for the day traders and swing traders.
Use This Floor Trader’s Secret Charting Tactic To
Anticipate The Market’s Highs, Lows, Trends & Reversals
It may seem hard to believe, but this trading tactic can be so simple that I used
it to “chart the market” without a computer! I didn’t have a computer standing
on the trading floor in the early 1990’s.
Despite its simplicity, the principle works because it is based on the driving
force behind the most important price points of any trading day. That force is
human emotion – fear and greed.
Remember your feeling of excitement when the market in which you hold a
position goes racing your way right as the market opens? How about the feeling
when the market gaps open in the direction of your position? Nice way to start
the day.
And have you also had the frustrating experience of the excitement from a market
open in your direction turn to disappointment as the market suddenly reversed?
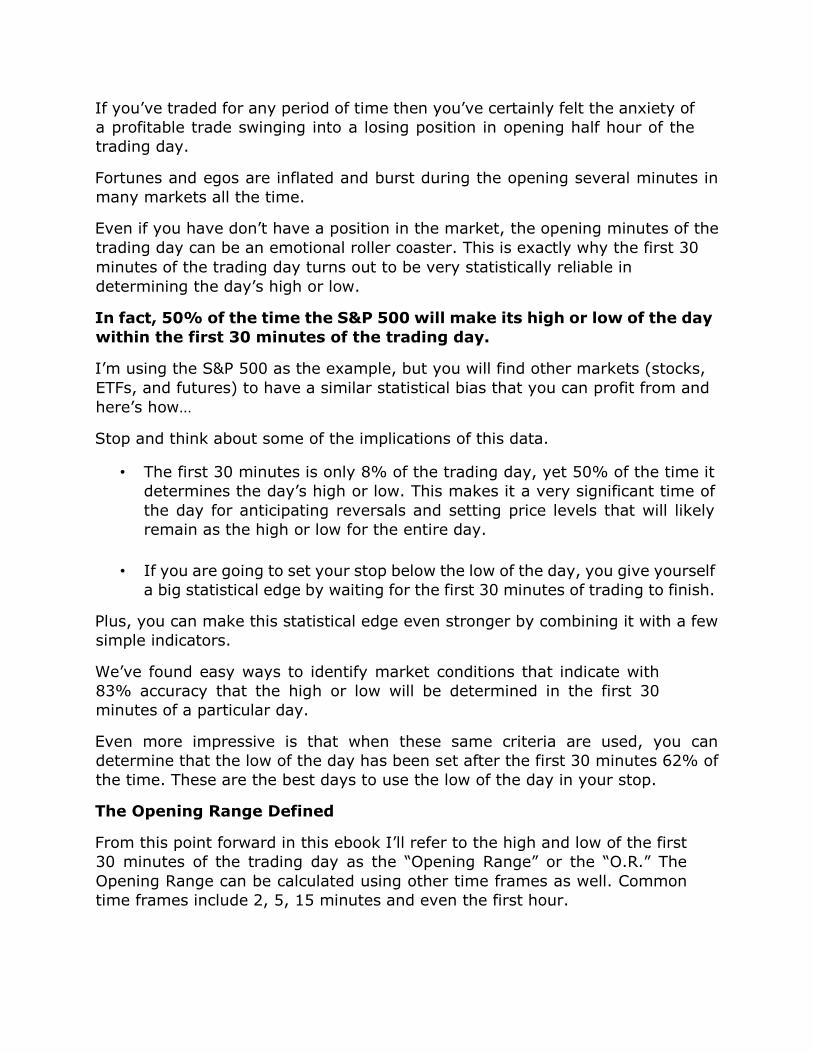
If you’ve traded for any period of time then you’ve certainly felt the anxiety of
a profitable trade swinging into a losing position in opening half hour of the
trading day.
Fortunes and egos are inflated and burst during the opening several minutes in
many markets all the time.
Even if you have don’t have a position in the market, the opening minutes of the
trading day can be an emotional roller coaster. This is exactly why the first 30
minutes of the trading day turns out to be very statistically reliable in
determining the day’s high or low.
In fact, 50% of the time the S&P 500 will make its high or low of the day
within the first 30 minutes of the trading day.
I’m using the S&P 500 as the example, but you will find other markets (stocks,
ETFs, and futures) to have a similar statistical bias that you can profit from and
here’s how…
Stop and think about some of the implications of this data.
• The first 30 minutes is only 8% of the trading day, yet 50% of the time it
determines the day’s high or low. This makes it a very significant time of
the day for anticipating reversals and setting price levels that will likely
remain as the high or low for the entire day.
• If you are going to set your stop below the low of the day, you give yourself
a big statistical edge by waiting for the first 30 minutes of trading to finish.
Plus, you can make this statistical edge even stronger by combining it with a few
simple indicators.
We’ve found easy ways to identify market conditions that indicate with
83% accuracy that the high or low will be determined in the first 30
minutes of a particular day.
Even more impressive is that when these same criteria are used, you can
determine that the low of the day has been set after the first 30 minutes 62% of
the time. These are the best days to use the low of the day in your stop.
The Opening Range Defined
From this point forward in this ebook I’ll refer to the high and low of the first
30 minutes of the trading day as the “Opening Range” or the “O.R.” The
Opening Range can be calculated using other time frames as well. Common
time frames include 2, 5, 15 minutes and even the first hour.
In our trading at MarketGauge we focus on the 2, 5 and 30-minute Opening
Ranges. They all serve specific purposes. For example, the 30-minute O.R. is the
best place to start for buying against the low of the day (or selling against the
high) for day traders and swing traders.
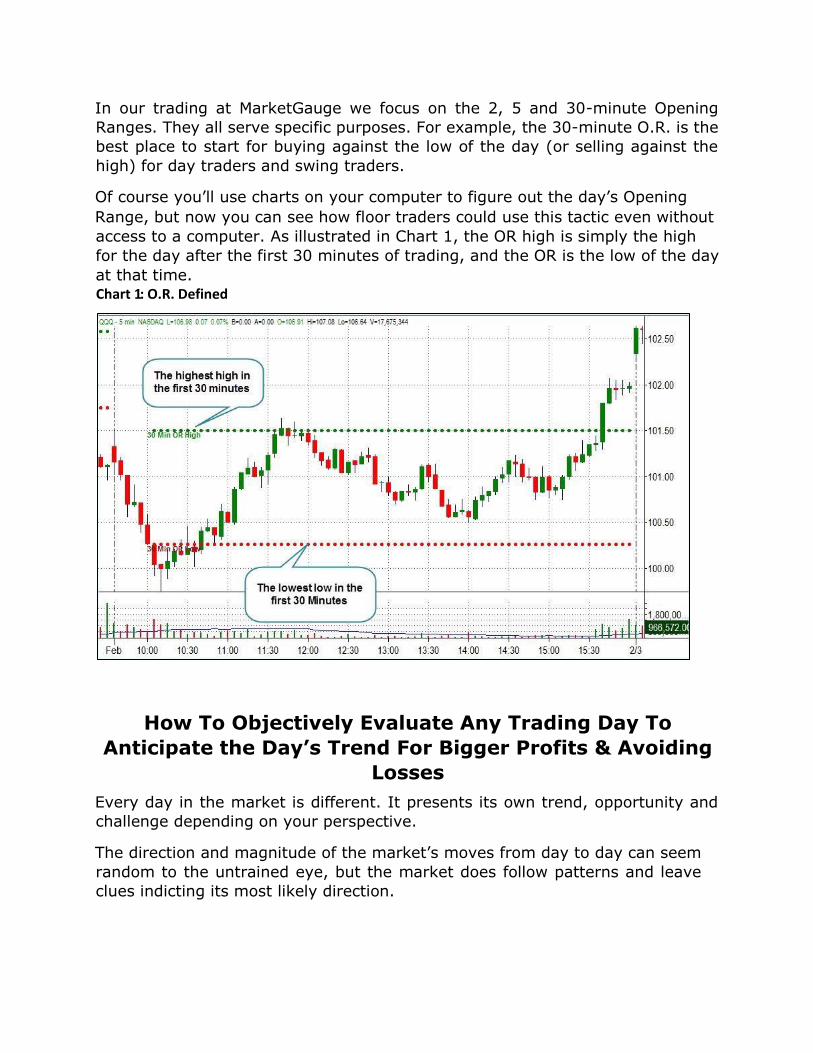
Of course you’ll use charts on your computer to figure out the day’s Opening
Range, but now you can see how floor traders could use this tactic even without
access to a computer. As illustrated in Chart 1, the OR high is simply the high
for the day after the first 30 minutes of trading, and the OR is the low of the day
at that time.
How To Objectively Evaluate Any Trading Day To
Anticipate the Day’s Trend For Bigger Profits & Avoiding
Losses
Every day in the market is different. It presents its own trend, opportunity and
challenge depending on your perspective.
The direction and magnitude of the market’s moves from day to day can seem
random to the untrained eye, but the market does follow patterns and leave
clues indicting its most likely direction.
Chart 1 : O.R. Defined
The Opening Range is a trading tactic that pros have used for decades to read
the market’s mood so they can anticipate and profit from the market’s intra-day
moves.
When you “chart the market” or look at it through the lens of the Opening Range,
you’ll have an objective perspective on whether the bulls or bears are in control
on any given day. This perspective begins with a very powerful understanding
that the O.R. high and O.R. low levels will be critical support and
resistance levels for the rest of the day.
With this understanding of market behavior you can anticipate that these levels
will also represent levels where markets will reverse or accelerate into big moves.
If you look at the trading day with this process you will be on the right side of
the biggest market moves, and avoid getting hurt by them.
How Read The Market With The O.R.
To begin using the O.R. to anticipate the market’s next move follow these simple
rules.
First, let the market establish its 30-minute O.R. high and low. Even after the
Opening Range period, keep a neutral bias while the market trades within its
O.R. As you learn more you’ll know if an O.R. has a bullish or bearish bias.
Don’t Miss, or Get Hurt By Trend Days
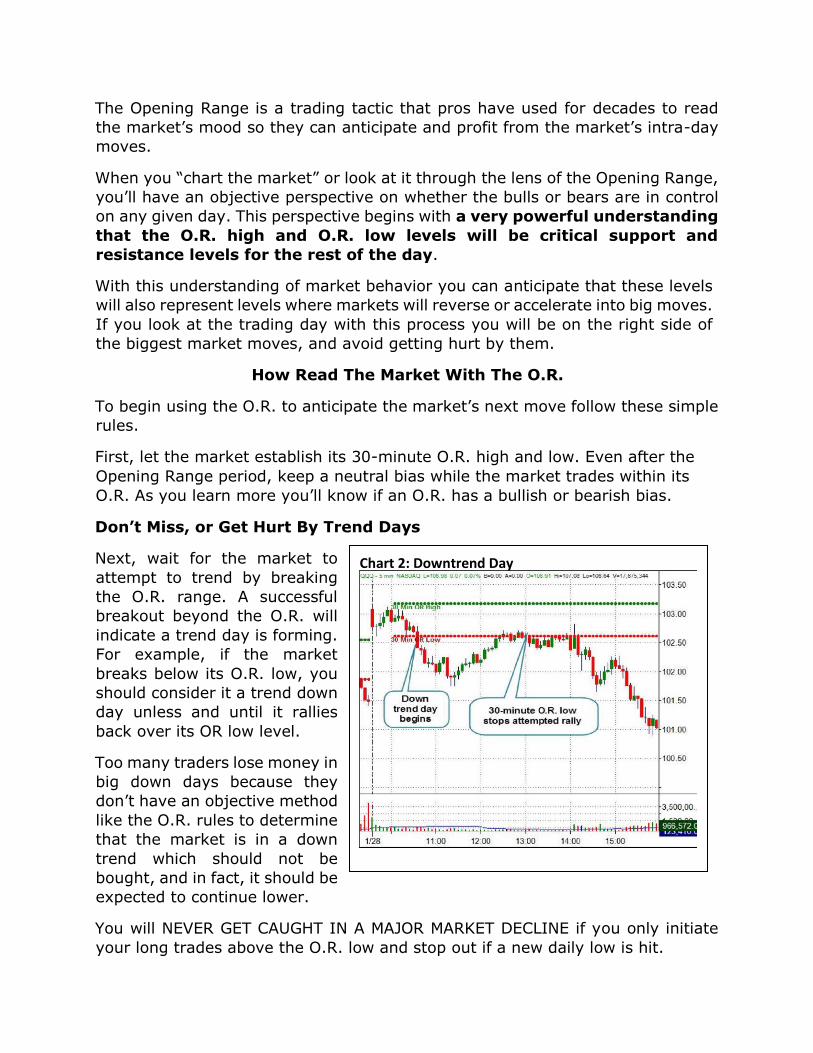
Next, wait for the market to
attempt to trend by breaking
the O.R. range. A successful
breakout beyond the O.R. will
indicate a trend day is forming.
For example, if the market
breaks below its O.R. low, you
should consider it a trend down
day unless and until it rallies
back over its OR low level.
Too many traders lose money in
big down days because they
don’t have an objective method
like the O.R. rules to determine
that the market is in a down
trend which should not be
bought, and in fact, it should be
expected to continue lower.
You will NEVER GET CAUGHT IN A MAJOR MARKET DECLINE if you only initiate
your long trades above the O.R. low and stop out if a new daily low is hit.
Chart 2: Downtrend Day
Buying markets that are under the OR low is equivalent to trying to find a
bottom when the bears are in control. This is much riskier than finding a bottom
when the market is in a neutral to bullish mode (i.e. over the OR low).
Additionally, any rally from below the O.R. low will have to get through the
resistance of the O.R. low (see chart 2). As you now know, the O.R. low is often
significant support until it is broken, and becomes a significant area of
resistance once broken. As a result, it is very common for rallies during a down
trending day to roll over at the O.R. low, and resume the day’s down trend.
Use Opening Range Reversals To Buy Near The Low, Or
Short Near The High
When you combine Opening Range Reversal tactics with the emotional benefit,
and statistical edge of placing your stops outside the day’s range as discussed
earlier…
You have a very effective approach to entering low risk trades that have
a high probability of working consistently!
An Opening Range Reversal (ORR) describes a condition when the market has
reversed against an O.R. high or low sufficiently to anticipate that the low or
high of the day has been set, and it can therefore be used effectively as a stop
for your trade.
The basic ORR trade setup that I’ll cover here occurs when the O.R. low is
touched or broken followed by a rally back over the O.R. low. As you become
more familiar with how markets trade near their O.R. lows you’ll discover many
profitable trading patterns, but to get started you only need to know one simple
pattern.
A Simple Pattern That Puts Money In Your Trading
Account Quickly Because It Pinpoints Reversals
This pattern is so effective at spotting intra-day reversals that I use it for more
than identifying O.R. Reversals, but right now our objective is to understand
when to buy markets near their low of the day using the ORR and this pattern.
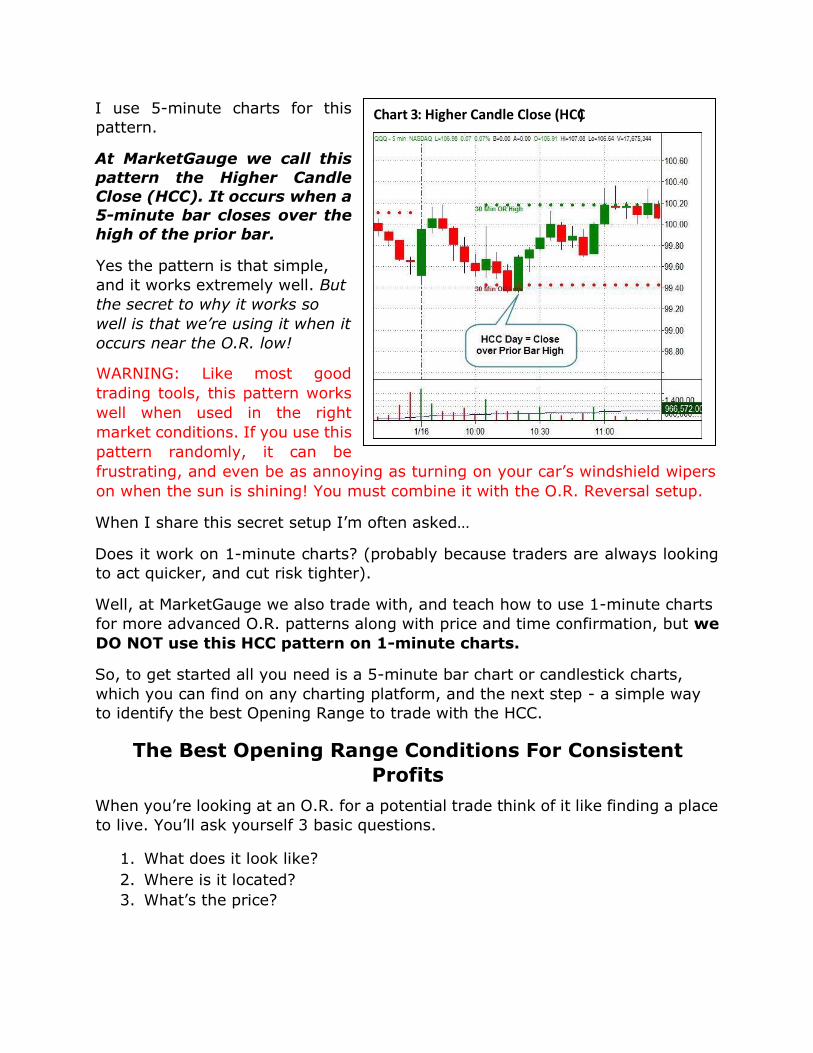
I use 5-minute charts for this
pattern.
At MarketGauge we call this
pattern the Higher Candle
Close (HCC). It occurs when a
5-minute bar closes over the
high of the prior bar.
Yes the pattern is that simple,
and it works extremely well. But
the secret to why it works so
well is that we’re using it when it
occurs near the O.R. low!
WARNING: Like most good
trading tools, this pattern works
well when used in the right
market conditions. If you use this
pattern randomly, it can be
frustrating, and even be as annoying as turning on your car’s windshield wipers
on when the sun is shining! You must combine it with the O.R. Reversal setup.
When I share this secret setup I’m often asked…
Does it work on 1-minute charts? (probably because traders are always looking
to act quicker, and cut risk tighter).
Well, at MarketGauge we also trade with, and teach how to use 1-minute charts
for more advanced O.R. patterns along with price and time confirmation, but we
DO NOT use this HCC pattern on 1-minute charts.
So, to get started all you need is a 5-minute bar chart or candlestick charts,
which you can find on any charting platform, and the next step - a simple way
to identify the best Opening Range to trade with the HCC.
The Best Opening Range Conditions For Consistent
Profits
When you’re looking at an O.R. for a potential trade think of it like finding a place
to live. You’ll ask yourself 3 basic questions.
1. What does it look like?
2. Where is it located?
3. What’s the price?
C h art 3 : Higher Candle Close (HCC )
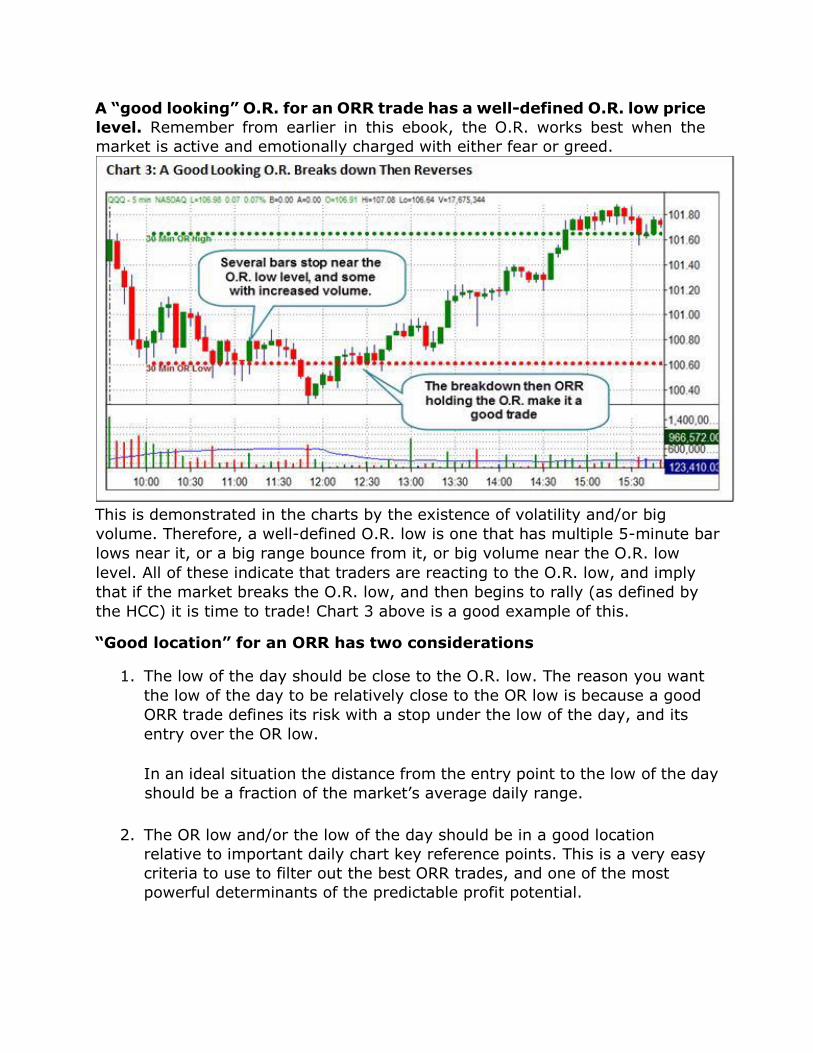
A “good looking” O.R. for an ORR trade has a well-defined O.R. low price
level. Remember from earlier in this ebook, the O.R. works best when the
market is active and emotionally charged with either fear or greed.
This is demonstrated in the charts by the existence of volatility and/or big
volume. Therefore, a well-defined O.R. low is one that has multiple 5-minute bar
lows near it, or a big range bounce from it, or big volume near the O.R. low
level. All of these indicate that traders are reacting to the O.R. low, and imply
that if the market breaks the O.R. low, and then begins to rally (as defined by
the HCC) it is time to trade! Chart 3 above is a good example of this.
“Good location” for an ORR has two considerations
1. The low of the day should be close to the O.R. low. The reason you want
the low of the day to be relatively close to the OR low is because a good
ORR trade defines its risk with a stop under the low of the day, and its
entry over the OR low.
In an ideal situation the distance from the entry point to the low of the day
should be a fraction of the market’s average daily range.
2. The OR low and/or the low of the day should be in a good location
relative to important daily chart key reference points. This is a very easy
criteria to use to filter out the best ORR trades, and one of the most
powerful determinants of the predictable profit potential.
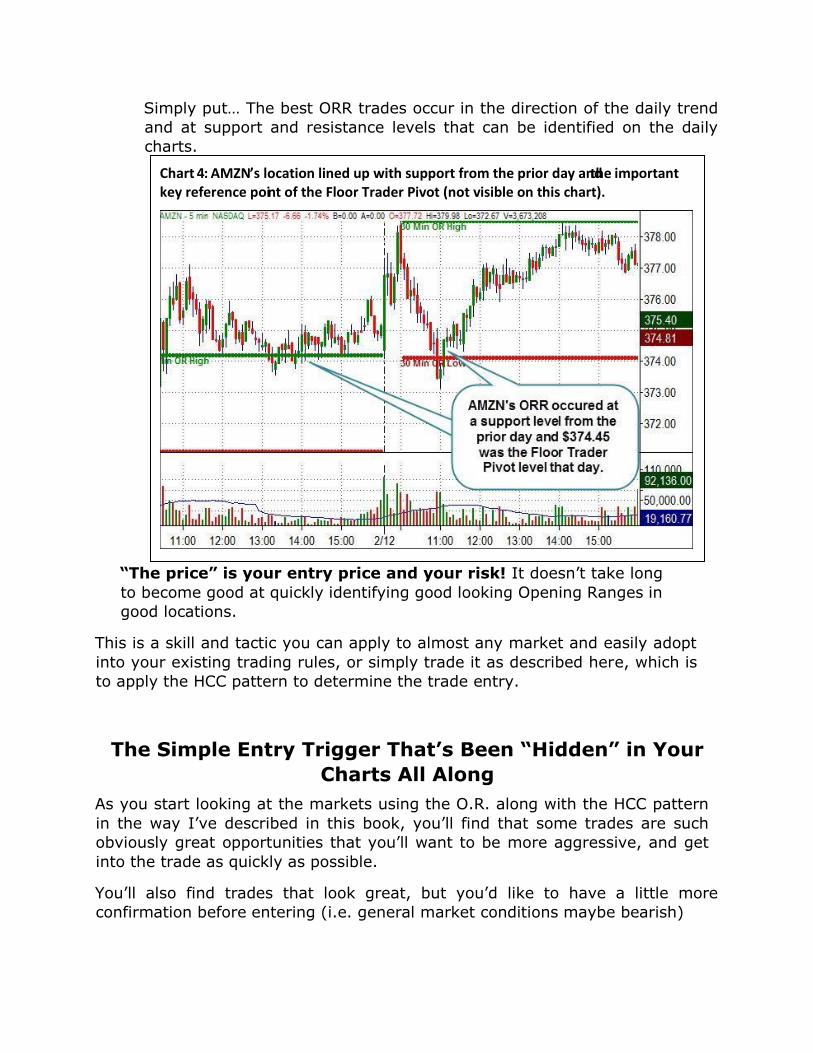
Simply put… The best ORR trades occur in the direction of the daily trend
and at support and resistance levels that can be identified on the daily
charts.
“The price” is your entry price and your risk! It doesn’t take long
to become good at quickly identifying good looking Opening Ranges in
good locations.
This is a skill and tactic you can apply to almost any market and easily adopt
into your existing trading rules, or simply trade it as described here, which is
to apply the HCC pattern to determine the trade entry.
The Simple Entry Trigger That’s Been “Hidden” in Your
Charts All Along
As you start looking at the markets using the O.R. along with the HCC pattern
in the way I’ve described in this book, you’ll find that some trades are such
obviously great opportunities that you’ll want to be more aggressive, and get
into the trade as quickly as possible.
You’ll also find trades that look great, but you’d like to have a little more
confirmation before entering (i.e. general market conditions maybe bearish)
Chart 4 : AMZN ’ s location lined up with support from the prior day and the important key reference poi n t of the Floor Trader Pivot (not visible on this chart).
Now that you know what the HCC pattern is, and where to best apply it, we can
focus on the actual “entry price” trigger point for what I’ll describe as the HCC-
ORR trade.
There are actually 3 potential trigger points for an entry. They are all slight
variations of the same basic pattern of trading over the prior bar’s high, but
they give you the ability to be more aggressive vs. waiting for more
confirmation that the market has turned up.
IMPORTANT: For the purposes of this lesson, it is assumed that any entry trigger point described here is also above the OR low.
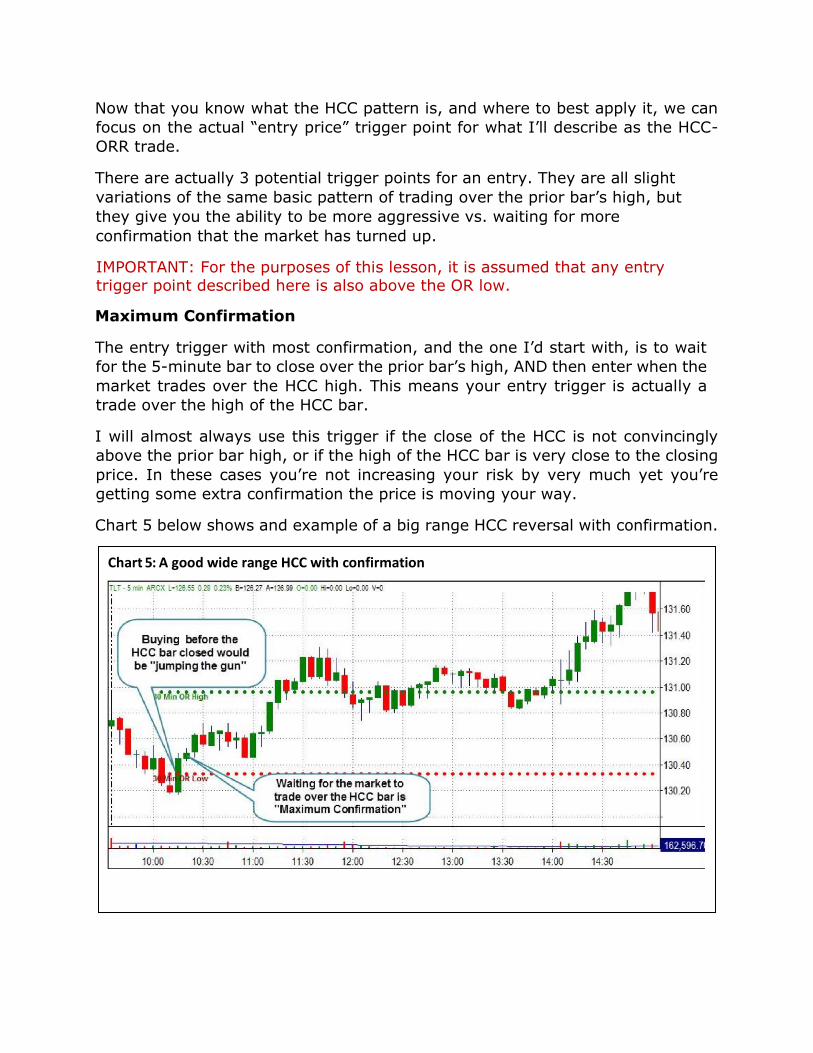
Maximum Confirmation
The entry trigger with most confirmation, and the one I’d start with, is to wait
for the 5-minute bar to close over the prior bar’s high, AND then enter when the
market trades over the HCC high. This means your entry trigger is actually a
trade over the high of the HCC bar.
I will almost always use this trigger if the close of the HCC is not convincingly
above the prior bar high, or if the high of the HCC bar is very close to the closing
price. In these cases you’re not increasing your risk by very much yet you’re
getting some extra confirmation the price is moving your way.
Chart 5 below shows and example of a big range HCC reversal with confirmation.
Chart 5 : A good wide range HCC with confirmation
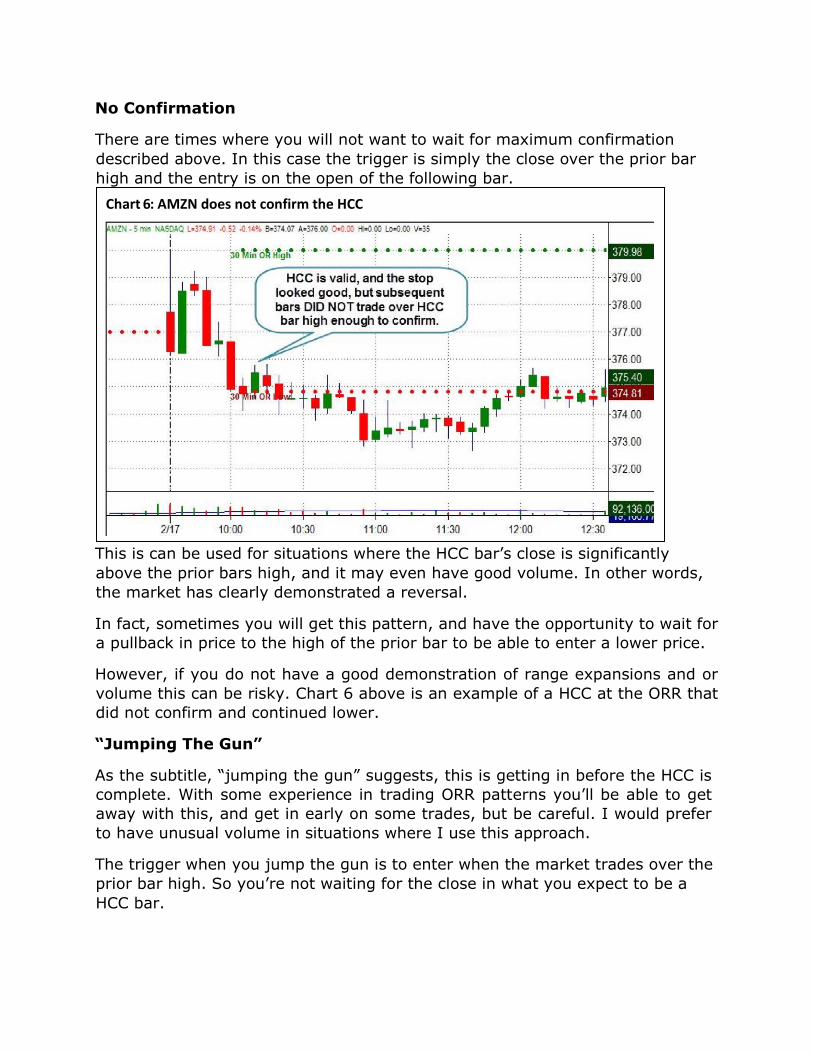
No Confirmation
There are times where you will not want to wait for maximum confirmation
described above. In this case the trigger is simply the close over the prior bar
high and the entry is on the open of the following bar.
This is can be used for situations where the HCC bar’s close is significantly
above the prior bars high, and it may even have good volume. In other words,
the market has clearly demonstrated a reversal.
In fact, sometimes you will get this pattern, and have the opportunity to wait for
a pullback in price to the high of the prior bar to be able to enter a lower price.
However, if you do not have a good demonstration of range expansions and or
volume this can be risky. Chart 6 above is an example of a HCC at the ORR that
did not confirm and continued lower.
“Jumping The Gun”
As the subtitle, “jumping the gun” suggests, this is getting in before the HCC is
complete. With some experience in trading ORR patterns you’ll be able to get
away with this, and get in early on some trades, but be careful. I would prefer
to have unusual volume in situations where I use this approach.
The trigger when you jump the gun is to enter when the market trades over the
prior bar high. So you’re not waiting for the close in what you expect to be a
HCC bar.
Chart 6 : AMZN does not confirm the HCC
6 Steps To Identifying and Executing Low Risk, High
Profit Potential ORR Trades With Confidence
It’s time to pull everything together, summarize the key steps to initiating an
Opening Range Reversal trade.
1. Let the 30-minute O.R. form
2. Focus first on the Opening Ranges that are in a good location relative to
the daily chart’s trend and support levels.
3. Identify the Opening Ranges in a good location that also look good for an
ORR trade. This means they have well-defined support at the O.R. low.
4. Use the HCC as your entry trigger
5. Define your risk as being under the low of the day. Give the market room
to break the low of the day by a small margin and reverse without stopping
you out!
6. Set your initial profit targets. If you are a day trader, take at least partial
profits near the high of the day, and move your stop to no loss after the
market moves in your favor. If you’re a swing trader, you’re initial target
may be higher (and your stop may be lower).
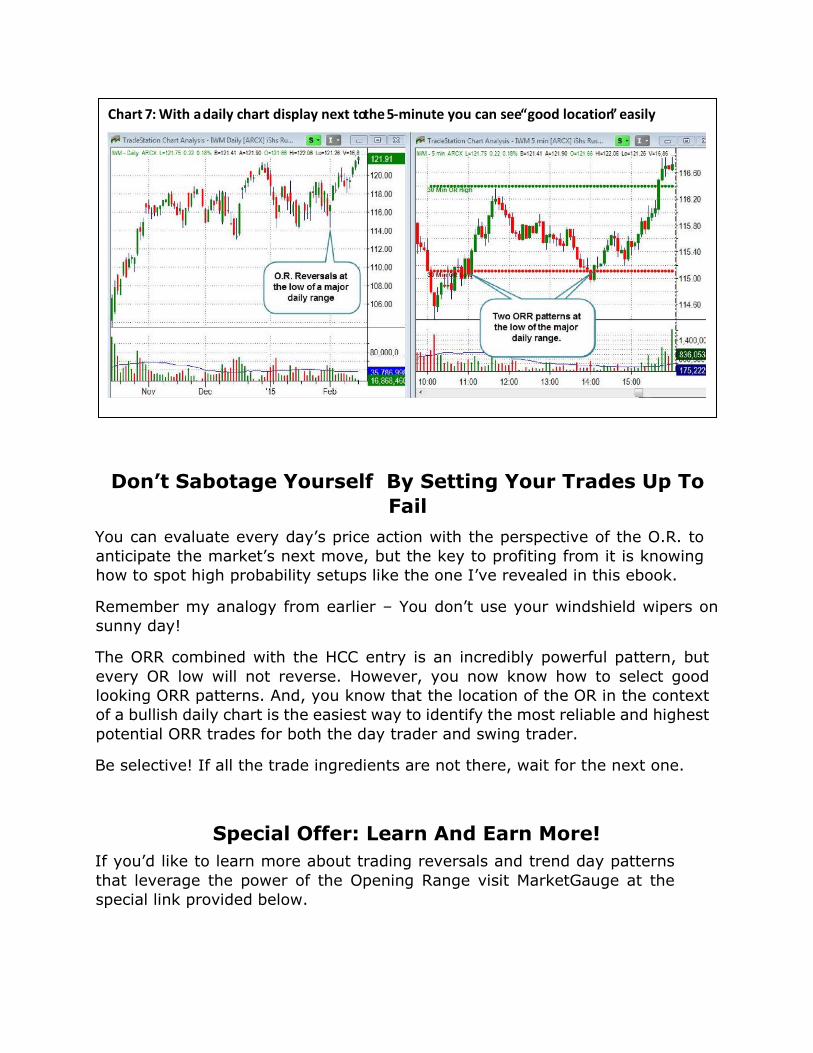
Identifying Trade Opportunities In Seconds
With This Simple Chart Display
In my charting platform I have a window that shows both the daily chart and a
5minute candle chart with volume. As you know the candles on the 5-minute
chart are not required, but they make it easier to see where a bar closes relative
to the prior bar high.
With these two charts in plain view it only takes a few seconds to spot when the
O.R. low lines up with key daily levels, and when a HCC forms.
Don’t Sabotage Yourself By Setting Your Trades Up To
Fail
You can evaluate every day’s price action with the perspective of the O.R. to
anticipate the market’s next move, but the key to profiting from it is knowing
how to spot high probability setups like the one I’ve revealed in this ebook.
Remember my analogy from earlier – You don’t use your windshield wipers on
sunny day!
The ORR combined with the HCC entry is an incredibly powerful pattern, but
every OR low will not reverse. However, you now know how to select good
looking ORR patterns. And, you know that the location of the OR in the context
of a bullish daily chart is the easiest way to identify the most reliable and highest
potential ORR trades for both the day trader and swing trader.
Be selective! If all the trade ingredients are not there, wait for the next one.
Special Offer: Learn And Earn More!
If you’d like to learn more about trading reversals and trend day patterns
that leverage the power of the Opening Range visit MarketGauge at the
special link provided below.
Chart 7 : W ith a daily chart display next to the 5 - minute you can see “ good location ” easily

MarketGauge provides free webinars, and more advanced O.R. training that will
show you:
How to determine volatility based stops that help to avoid frustrating
stop losses
How to profit from big trend day breakouts, and avoid false breakouts
Which indicators dramatically increase the statistical edge of the O.R.
Rules for more precise reversal patterns for quicker entries
Time and price confirmation rules to minimize failed trades
How to trade quicker O.R. time frames to profit from gaps and moves
within the first 30-minutes of the day And more!
For a limited time, you will find more training and a special offer here:
http://www.marketgauge.com/orr/
About The Author
Geoff Bysshe, co-founder of MarketGauge, began trading in 1990
on the floor of the NY commodities exchanges. He spent several
years as an independent floor trader.
He left the floor to trade and develop quantitatively based
strategies for equities at Millennium Partners, a multi-billion dollar
hedge fund in NY. In 1997 he co-founded MarketGauge.com to
provide market analysis and trading tools to professional traders.
MarketGauge has since expanded into providing individual active traders and
investors with trading systems, tools, education and actionable market analysis.