by antony green - parliament of nsw antony green related publications 2011 new south wales election:...
TRANSCRIPT

NSW Legislative Assembly election 2011:
Two-party preferred results by polling place
Background Paper No 1/2012
by Antony Green

RELATED PUBLICATIONS
2011 New South Wales Election: Analysis of Results by
Antony Green (Background Paper No 3/2011)
2011 NSW Election Preview – Analysis of past voting patterns
by electorate by Antony Green (Background Paper No 1/2011)
NSW Legislative Assembly Elections 2007: Two-Candidate Preferred Results by Polling Place Antony Green (Background Paper No 2/2009)
NSW Legislative Assembly Elections 2003: Two-Candidate
Preferred Results by Polling Place Antony Green (Background Paper No 7/2003)
ISSN 1325-4456
ISBN 978 0 7313 1886 5
February 2012
© 2012
Except to the extent of the uses permitted under the Copyright Act 1968, no part of this document may be reproduced or transmitted in any form or by any means including information storage and retrieval systems, without the prior written consent from the New South Wales Parliamentary Library, other than by Members of the New South Wales Parliament in the course
of their official duties.

NSW Legislative Assembly election 2011:
Two-party preferred results by polling place
by
Antony Green

NSW PARLIAMENTARY LIBRARY RESEARCH SERVICE
Gareth Griffith (BSc (Econ) (Hons), LLB (Hons), PhD), Manager, Politics & Government/Law .......................................... (02) 9230 2356 Lenny Roth (BCom, LLB), Senior Research Officer, Law ....................................................... (02) 9230 3085 Daniel Montoya (BEnvSc (Hons), PhD), Research Officer, Environment/Planning ..................................... (02) 9230 2003 Nathan Wales (BSc/BA, PhD) Research Officer, Environment/Planning..................................... (02) 9230 2906 Talina Drabsch (BA, LLB (Hons)), Research Officer, Social Issues/Law ........................................... (02) 9230 2484 Elsa Koleth (BA Comm (Hons), LLB (Hons) Research Officer, Social Issues/Law ........................................... (02) 9230 2484 John Wilkinson (MA, PhD), Research Officer, Economics ........... (02) 9230 2006
Should Members or their staff require further information about this publication please contact the author.
Information about Research Publications can be found on the Internet at:
http://www.parliament.nsw.gov.au/prod/parlment/publications.nsf/V3LIstRPSubject
Advice on legislation or legal policy issues contained in this paper is provided for use in parliamentary debate and for related parliamentary purposes. This paper is not professional legal opinion.

The Author
Antony Green is the Election Analyst for ABC Television and has worked for the ABC on every federal, state and territory election coverage since 1989. Antony studied at Sydney University and holds a Bachelor of Science in mathematics and computing and a Bachelor of Economics with Honours in politics.
Antony produces regular publications on electoral matters for the NSW Parliamentary Library.
Acknowledgments
I would like to thank the NSW Electoral Commissioner Mr Colin Barry and the staff of his Commission for making results of the 2011 election available by polling place in computer readable format.
The author takes responsibility for the calculations in tables shown as including estimated two-candidate or two-party preferred results.
Abbreviations
Exhst Exhausted
ALP Australian Labor Party
IND Independent
GRN Greens
LIB Liberal Party
NAT The Nationals

Table of Contents
Highest Primary Vote Tables Page
Liberal Party 1
The Nationals 2
Australian Labor Party 3
The Greens 4
Christian Democratic Party 5
Family First 6
Independents 7
Lowest Primary Vote Tables
Liberal Party 8
The Nationals 9
Australian Labor Party 10
Vote by Vote Type
Percentage Party Vote by Vote Type at 2011 Election 11
Percentage of Votes Cast by Vote Type - NSW Elections 1984-2011 11
Two Party Preferred Tables
Albury 13
Auburn 14
Ballina 15
Balmain (with additional 2-candidate preferred table) 16
Bankstown 18
Barwon 19
Bathurst 20
Baulkham Hills 21
Bega 22
Blacktown 23
Blue Mountains 24
Burrinjuck 25
Cabramatta 26
Camden 27
Campbelltown 28
Canterbury 29
Castle Hill 30
Cessnock 31
Charlestown 32
Clarence 33
Coffs Harbour 34
Coogee 35
Cronulla 36
Davidson 37
Drummoyne 38

Two Party Preferred Tables Page
Dubbo (with additional 2-candidate preferred table) 39
East Hills 41
Epping 42
Fairfield 43
Gosford 44
Goulburn 45
Granville 46
Hawkesbury 47
Heathcote 48
Heffron 49
Hornsby (with additional 2-candidate preferred table) 50
Keira 52
Kiama 53
Kogarah 54
Ku-ring-gai 55
Lake Macquarie (with additional 2-candidate preferred table) 56
Lakemba 58
Lane Cove 59
Lismore 60
Liverpool 61
Londonderry 62
Macquarie Fields 63
Maitland 64
Manly 65
Maroubra 66
Marrickville (with additional 2-candidate preferred table) 67
Menai 69
Miranda 70
Monaro 71
Mount Druitt 72
Mulgoa 73
Murray-Darling 74
Murrumbidgee 75
Myall Lakes 76
Newcastle 77
North Shore 78
Northern Tablelands (with additional 2-candidate preferred table) 79
Oatley 81
Orange 82
Oxley 83
Parramatta 84
Penrith 85
Pittwater 86
Port Macquarie (with additional 2-candidate preferred table) 87
Port Stephens 89
Riverstone 90

Two Party Preferred Tables Page
Rockdale 91
Ryde 92
Shellharbour 93
Smithfield 94
South Coast 95
Strathfield 96
Swansea 97
Sydney (with additional 2-candidate preferred table) 98
Tamworth (with additional 2-candidate preferred table) 100
Terrigal 102
The Entrance 103
Toongabbie 104
Tweed 105
Upper Hunter 106
Vaucluse 107
Wagga Wagga 108
Wakehurst 109
Wallsend 110
Willoughby 111
Wollondilly 112
Wollongong (with additional 2-candidate preferred table) 113
Wyong 115

Introduction
This publication provides detailed analysis of two-party and two-candidate preferred results by polling place for the 2011 New South Wales election. The publication is the latest in a series first published by the Parliamentary Library after the 1991 election, and is a companion to last year's publication "2011 New South Wales Election: Analysis of Results", (Background Paper No 3/2011).
As well as two-party and two-candidate preferred results, several tables of first preference results by polling place are provided on pages 1-10. These tables highlight polling places across the state where selected registered parties recorded their highest and lowest percentage first preference vote.
Two tables are provided on page 11 detailing the proportion of vote by vote type. The first table provides a detailed breakdown of the 2011 election, showing percentage first preference, informal and two-party preferred vote by party by vote type. The second table shows the changing proportion of vote by vote type at New South Wales elections since 1984. This table highlights the declining proportion of the vote taken on polling day as well as the rise in postal and pre-poll voting.
Two-Candidate versus Two-Party Preferred results.
The two-candidate preferred count in a contest is defined as the final tally of votes for the two remaining candidates in a contest after the successive exclusion and distribution of preferences from ballot papers for other candidates in the contest. In most cases, the final pairing of candidates will represent a contest between the Labor Party and the Liberal-National Party Coalition, a pairing that is also referred as a two-party preferred count.
At the 2011 election, 66 of the 93 two-candidate preferred contests were two-party preferred contests between Labor and Coalition candidates. There were 27 contests that did not finish as two-party preferred contests, and additional preference counts were performed after the election to determine separate two-party preferred totals. A full summary of two-party and two-candidate preferred results by electorate can be found on pages 31-33 of "2011 New South Wales Election: Analysis of Results", (Background Paper No 3/2011).
This publication concentrates on actual preference counts conducted by polling place, with a limited number of additional tables providing estimated polling place preference counts.
A table of two-party preferred results by polling place is provided for each of the state’s 93 Legislative Assembly districts, along with an additional 10 tables of two-candidate preferred results by polling place. Of the 103 tables, 92 are based on actual preference counts by polling places. The remaining 11 tables provide estimated counts after preferences by polling place. Estimates have been calculated by applying an electorate's distribution of preferences to the first preference votes recorded by candidate in each polling place.
The 10 tables of estimated two-party preferred results are for Balmain, Dubbo, Hornsby, Lake Macquarie, Marrickville, Northern Tablelands, Port Macquarie, Sydney, Tamworth and Wollongong. Estimated two-candidate preferred results by polling place are provided for Balmain, where the closeness of the contest prevented the Electoral Commission from carrying out preference counts by polling place.
Changes to Counting Procedures
As at past elections, the NSW Electoral Commission conducted indicative preference counts in polling places on election night between pairings of candidates nominated before the close of polls. For the first time, at the 2011 election these indicative preference counts were check-counted for accuracy after polling day, and in several electorates re-done to reflect the order in which candidates finished. These check-counted totals are the basis of this publication.
Having provided more accurate polling place preference counts, the Electoral Commission dispensed with conducting a formal distribution of preferences in electorates where it was not required to determine a winning candidate.

If a distribution of preferences was not undertaken for an electorate, the final two-candidate preferred result for the electorate was derived by accumulating the check-counted polling place and declaration vote results.
In a number of electorates the Electoral Commission conducted additional preference counts after the declaration of poll to determine alternative two-party and two-candidate preferred results.
Reading the Tables
Each table includes a line labelled “Grand Total”. This is the final result for each electorate, whether derived by a formal distribution of preferences or by totalling individual polling place results. The line labelled “Ordinary Votes” has been calculated by totalling the preference count in each polling place, while the line labelled “Declaration Votes” is the sum of the preference counts for the different categories of declaration vote.
In electorates where preference counts were conducted by polling place and a formal distribution of preferences undertaken, there can be minor discrepancies between the totals derived from polling places and the totals produced by the formal distribution of preferences. The same comment applies to tables where the polling place results are estimates rather than actual counts. This means that there can be minor discrepancies between the "Grand Total" line and the sum of "Ordinary Votes" and "Declaration Votes".
Polling Place Names
The NSW Electoral Commission adopted a new naming convention for polling places at the 2011 election. All polling place venues are now uniquely identified by an abbreviated name. Names as provided by the Electoral Commission have been used throughout the publication. These names do not always correspond to polling place names used at previous elections.
Antony Green
February 2012

1
Highest First Preference Vote by Polling Place – Liberal Party
Votes Formal % Votes Electorate Polling Place
150 166 90.4 Albury Lowesdale Public 780 895 87.2 Vaucluse St Michaels Vaucluse 115 137 83.9 Albury Walbundrie Public 314 375 83.7 Hawkesbury Sth Maroota Comm. Hall 69 83 83.1 Wagga Wagga Humula Public 617 744 82.9 Hawkesbury Maraylya Public 960 1158 82.9 Vaucluse Cooper Park Comm. Hall 1617 1960 82.5 Vaucluse Rose Bay Secondary Cllg 967 1175 82.3 Hawkesbury Ironbark Ridge Public 274 334 82.0 Hawkesbury Maroota Public 73 89 82.0 Albury Tooma Hall 1084 1322 82.0 Hawkesbury Annangrove Public 959 1175 81.6 Hawkesbury Oakville Public 1573 1931 81.5 Davidson St Ives Park Public 1061 1317 80.6 Vaucluse St Andrews Rose Bay 297 369 80.5 Hawkesbury Hillside Public 2151 2675 80.4 Hawkesbury Glenhaven Public 815 1014 80.4 Davidson St Martins Killara 1927 2400 80.3 Manly Balgowlah Hghts Public 2003 2506 79.9 Ku-ring-gai Wahroonga Public 841 1053 79.9 Pittwater Loquat Valley Prep 295 371 79.5 Davidson St Ives Comm. Access Service 1843 2325 79.3 Davidson St Ives Nth Public 1647 2082 79.1 Davidson Pymble Public 1991 2518 79.1 Ku-ring-gai Wahroonga Presbyterian 1355 1715 79.0 Davidson St Ives Comm. Hall 1685 2137 78.8 Willoughby Northbridge Public 578 734 78.7 Ku-ring-gai Sacred Heart Pymble 596 757 78.7 Hawkesbury Middle Dural Public 1623 2062 78.7 Manly Balgowlah Boys High 374 476 78.6 Ku-ring-gai Pymble Public 1066 1357 78.6 Willoughby Castle Cove Public 298 380 78.4 Cronulla Port Hacking Comm. Cntr 662 845 78.3 North Shore Balmoral Scout Hall 1422 1817 78.3 Hawkesbury Kellyville High 86 110 78.2 Albury Jingellic Showgrounds 332 425 78.1 Castle Hill Mowll Village 771 987 78.1 Pittwater Palm Beach Kindy 346 443 78.1 Davidson Sacred Heart Pymble 1301 1666 78.1 Vaucluse St Marks Darling Pt 226 290 77.9 Wagga Wagga Tarcutta Hall 618 794 77.8 Hawkesbury Dural Public 214 275 77.8 Hawkesbury Cattai Public 1875 2410 77.8 Hawkesbury Kenthurst Public 374 481 77.8 Ku-ring-gai St Martins Killara 929 1197 77.6 North Shore Beauty Pt Public 131 169 77.5 Albury Rosewood Public 99 128 77.3 Baulkham Hills Beaumont Hills Public 742 960 77.3 Davidson St Ives Nth Scout Hall 37 48 77.1 Wagga Wagga Galore Hall 1192 1547 77.1 Lane Cove Hunters Hill Public 311 404 77.0 Londonderry Berkshire Park Hall 1829 2376 77.0 Castle Hill Eurambie Park Child Care 1650 2145 76.9 Ku-ring-gai Turramurra Uniting 1497 1951 76.7 Pittwater Pittwater High 1914 2495 76.7 Ku-ring-gai Turramurra Nth Public 388 506 76.7 Hawkesbury Samuel Gilbert Public 1089 1421 76.6 Hawkesbury Glenorie Public

2
Highest First Preference Vote by Polling Place – National Party
Votes Formal % Votes Electorate Polling Place
83 85 97.6 Barwon Curban Hall 35 36 97.2 Barwon Louth Public 193 199 97.0 Murray-Darling Blighty Public 118 122 96.7 Barwon Baan Baa Hall 78 81 96.3 Barwon Gurley Bellata Hall 100 104 96.2 Barwon Edgeroi Coronation Hall 137 143 95.8 Barwon Burren Junction Public 66 69 95.7 Burrinjuck Milvale Church 84 88 95.5 Barwon Rowena Public 39 41 95.1 Burrinjuck Bongongo Public 68 72 94.4 Barwon Bullarah Public 123 131 93.9 Murray-Darling Coleambally School 166 177 93.8 Barwon Tooraweenah Public 73 78 93.6 Murrumbidgee Mirrool Hall 86 92 93.5 Barwon Carinda Public 161 173 93.1 Murrumbidgee Tullibigeal School 185 201 92.0 Burrinjuck Morongla Crk Hall 170 185 91.9 Murrumbidgee Weethalle Public 156 170 91.8 Barwon Bellata Hall 100 109 91.7 Murray-Darling Bunnaloo Public 218 238 91.6 Murray-Darling Murray Downs RFS 115 126 91.3 Burrinjuck Caragabal Public 83 91 91.2 Barwon Hermidale Public 170 187 90.9 Burrinjuck Quandialla Central 217 239 90.8 Murray-Darling Wakool Public 39 43 90.7 Barwon Nymagee Hall 105 116 90.5 Barwon Pilliga Public 478 530 90.2 Murrumbidgee Coleambally School 64 71 90.1 Burrinjuck Frogmore Hall 91 101 90.1 Barwon Condobolin Public 27 30 90.0 Barwon Coolabah Hall 44 49 89.8 Murrumbidgee Burcher Hall 916 1023 89.5 Barwon Wee Waa Anglican 39 44 88.6 Barwon Girilambone Public 93 105 88.6 Barwon Garah Public 45 51 88.2 Barwon Collie CWA Hall 45 51 88.2 Murrumbidgee Carrathool Public 112 127 88.2 Barwon Boomi Public 118 134 88.1 Burrinjuck Bribbaree Hall 775 882 87.9 Murray-Darling Barham Reception Room 934 1065 87.7 Barwon St Francis Xaviers Moree 269 307 87.6 Murrumbidgee Ariah Park Hall 1175 1342 87.6 Murray-Darling Finley High 102 117 87.2 Bathurst Trunkey Public 310 356 87.1 Murrumbidgee Barellan School 241 277 87.0 Burrinjuck Laggan Public 126 145 86.9 Barwon Nevertire Hall 132 152 86.8 Barwon Ashley Hall 98 113 86.7 Murrumbidgee Murrami Hall 78 90 86.7 Murray-Darling Rand Public 77 89 86.5 Burrinjuck Galong Hall 306 357 85.7 Barwon Tottenham Hall 126 147 85.7 Murray-Darling Curlwaa Scout Hall 48 56 85.7 Barwon Terry Hie Hie Hall 77 90 85.6 Murrumbidgee Tallimba Public 170 199 85.4 Burrinjuck Gooloogong War Memorial 98 115 85.2 Barwon Cumborah Rec Club 149 175 85.1 Murray-Darling Koraleigh Hall

3
Highest First Preference Vote by Polling Place – Labor Party
Votes Formal % Votes Electorate Polling Place
27 33 81.8 Bega Wallaga Lake Koori Village 34 44 77.3 Barwon Toomelah Public 29 40 72.5 Barwon Murrin Bridge Preschool 760 1179 64.5 Shellharbour Warilla Nth Comm Cntr 351 545 64.4 Campbelltown John Warby Public 656 1090 60.2 Liverpool Heckenberg Comm Cntr 701 1178 59.5 Liverpool Cartwright Public 487 822 59.2 Campbelltown Airds High 696 1181 58.9 Liverpool Warwick Farm Public 1393 2366 58.9 Bankstown Bankstown Public 454 772 58.8 Liverpool Liverpool Uniting 1159 1982 58.5 Heffron Eastlakes Comm. Hall 537 919 58.4 Liverpool Sadleir Public 759 1300 58.4 Lakemba Riverwood Public 1360 2332 58.3 Canterbury Campsie Public 382 657 58.1 Liverpool Liverpool Hospital 585 1010 57.9 Keira Holy Spirit Bellambi 816 1419 57.5 Canterbury Canterbury Sth Public 1054 1834 57.5 Bankstown St Pauls Anglican Bankstown 661 1151 57.4 Wollongong Cringila Hall 977 1702 57.4 Liverpool Ashcroft High 886 1552 57.1 Auburn Auburn Girls High 785 1379 56.9 Wollongong Warrawong Public 1227 2167 56.6 Liverpool James Busby High 1184 2109 56.1 Shellharbour Koonawarra Comm. Hall 701 1250 56.1 Liverpool Miller Tech. High 586 1045 56.1 Shellharbour Barrack Hghts Public 1119 1997 56.0 Liverpool Liverpool Public 818 1460 56.0 Mount Druitt Blackett Public 572 1021 56.0 Shellharbour Warilla Public 586 1049 55.9 Heffron Mascot Snr Ctzns Hall 841 1506 55.8 Mount Druitt Bidwill Public 1260 2259 55.8 Bankstown Yagoona Snr Ctzns Cntr 664 1195 55.6 Maroubra Banksmeadow Public 811 1460 55.5 Lakemba Belmore Snr Ctzns Cntr 769 1388 55.4 Mount Druitt Dawson Public 1055 1905 55.4 Cabramatta Canley Vale Public 445 808 55.1 Mount Druitt Willmot Public 1484 2700 55.0 Heffron J J Cahill Mem. High 797 1457 54.7 Wollongong Port Kembla Snr Ctzns Cntr 825 1509 54.7 Macquarie Fields Guise Public 989 1810 54.6 Lakemba St Therese Lakemba 1510 2764 54.6 Kogarah Carlton Public 693 1270 54.6 Canterbury Campsie Baptist 1285 2360 54.4 Maroubra Matraville Public 98 180 54.4 Liverpool Bonnyrigg Public 1152 2116 54.4 Lakemba Wiley Park Public 853 1577 54.1 Shellharbour Mt Warrigal Public 320 592 54.1 Canterbury Canterbury Uniting 935 1732 54.0 Cabramatta Cabramatta Public 473 877 53.9 Mount Druitt Lethbridge Park Public 510 946 53.9 Auburn Auburn Nth Public 876 1626 53.9 Lakemba Belmore Nth Public 1089 2022 53.9 Liverpool Green Valley Public 147 273 53.8 Oatley Beverly Hills Nth Public 1027 1918 53.5 Maroubra Chifley Public 1530 2859 53.5 Liverpool Hoxton Park High 904 1691 53.5 Heffron Mascot Public

4
Highest First Preference Vote by Polling Place – Greens
Votes Formal % Votes Electorate Polling Place
130 179 72.6 Lismore Wilsons Crk Hall 591 927 63.8 Lismore Nimbin School 226 374 60.4 Lismore Cawongla Pre-School 61 116 52.6 Heffron Newtown Mission Chapel 193 370 52.2 Lismore The Channon Hall 293 571 51.3 Lismore Federal Hall 975 1992 48.9 Marrickville Newtown Mission Chapel 125 256 48.8 Lismore Rosebank Public 482 1001 48.2 Marrickville Newtown Public 490 1018 48.1 Marrickville Erskineville Public 605 1260 48.0 Marrickville Camdenville Public 50 105 47.6 Hornsby Dangar Is. Hall 77 164 47.0 Oxley Gleniffer Hall 976 2110 46.3 Marrickville Australia St School 317 691 45.9 Marrickville Bridge Rd Public 348 775 44.9 Lismore Uki Public 43 96 44.8 Oxley Elands Public 67 150 44.7 Bega Tanja Public 162 366 44.3 Ballina Durrumbul Public 191 434 44.0 Marrickville Seymour Cntr 775 1779 43.6 Marrickville Enmore TAFE Design Cntr 108 249 43.4 Oxley Thora Hall 80 191 41.9 Lismore Kunghur Hall 385 926 41.6 Heathcote Austinmer Anglican 65 157 41.4 Cessnock Wollombi Public 560 1354 41.4 Marrickville Darlington Public 819 2026 40.4 Oxley Bellingen Anglican 105 260 40.4 Pittwater Scotland Is. Hall 850 2109 40.3 Ballina St Johns MPC 441 1114 39.6 Ballina Suffolk Park Hall 91 231 39.4 Lismore Jiggi Public 153 389 39.3 Ballina Ewingsdale Hall 1104 2818 39.2 Marrickville Stanmore Public 45 115 39.1 Heffron Crown St Public 44 114 38.6 Marrickville St Peters Town Hall 749 1945 38.5 Heffron Erskineville Public 680 1791 38.0 Ballina Byron Bay Public 329 876 37.6 Heffron St Peters Public 209 564 37.1 Lismore Dunoon Public 106 291 36.4 Marrickville RPA Hospital 267 741 36.0 Strathfield St Andrews Summer Hill 605 1722 35.1 Balmain Forest Lodge Public 1049 3020 34.7 Balmain Rozelle Public 655 1931 33.9 Balmain Annandale Public 530 1564 33.9 Marrickville Petersham Town Hall 334 988 33.8 Balmain Nicholson St Public 482 1439 33.5 Heffron Alexandria Park School - Jnr Campus 287 858 33.4 Marrickville Ferncourt Public 468 1402 33.4 Ballina Brunswick Heads Mem. Hall 1037 3108 33.4 Vaucluse Bondi Beach Public 921 2773 33.2 Balmain Leichhardt Town Hall 257 776 33.1 Ballina Byron Bay High 502 1516 33.1 Balmain Kegworth Public 200 607 32.9 Heathcote Stanwell Park Anglican 74 225 32.9 Ballina Coorabell Public 463 1411 32.8 Balmain St Johns Glebe 540 1649 32.7 Heathcote Thirroul District Cntr 418 1282 32.6 Marrickville Wilkins Public

5
Highest First Preference Vote by Polling Place – Christian Democrats
Votes Formal % Votes Electorate Polling Place
13 74 17.6 Smithfield Pendle Hill Public 343 2174 15.8 Mount Druitt Colyton Public 16 107 15.0 Albury Brocklesby Public 31 225 13.8 Auburn Greenacre YMCA 57 422 13.5 Auburn Greenacre Snr Ctzns Cntr 12 95 12.6 Albury Balldale Rec Reserve 219 1814 12.1 Fairfield Fairfield Public 210 1780 11.8 Smithfield Bossley Park High 32 282 11.3 Macquarie Fields Liverpool Public 29 259 11.2 Smithfield Holroyd High 14 128 10.9 Baulkham Hills Beaumont Hills Public 329 3010 10.9 Smithfield Bossley Park Public 14 130 10.8 Fairfield Canley Vale Public 41 385 10.6 Granville Cardinal Gilroy Village 13 123 10.6 Wagga Wagga Pleasant Hills Public 293 2790 10.5 Mount Druitt Rooty Hill Public 15 143 10.5 Smithfield Ringrose Public 167 1607 10.4 Mount Druitt Mt Druitt Public 14 138 10.1 Kogarah Rockdale Uniting 12 119 10.1 Smithfield St Johns Park Public 15 151 9.9 Upper Hunter Wallarobba Hall 66 667 9.9 Londonderry Richmond Arts Hall 18 183 9.8 Cabramatta Salvo Hall Fairfield West 47 481 9.8 Macquarie Fields W Hoxton Union Church 80 820 9.8 Granville Wentworthville Baptist 125 1292 9.7 Fairfield Fairfield Snr Ctzns Hall 85 880 9.7 Terrigal Green Pt Baptist 270 2850 9.5 Smithfield Greystanes Public 141 1506 9.4 Mount Druitt Bidwill Public 208 2258 9.2 Macquarie Fields Hoxton Park Public 151 1645 9.2 Granville Coolibah Fitness Cntr 13 142 9.2 Cabramatta St Johns Park High 241 2633 9.2 Mount Druitt Minchinbury Public 298 3273 9.1 Liverpool Cecil Hills High 126 1401 9.0 Auburn Greenacre Baptist 27 304 8.9 Fairfield Merrylands Public 175 1974 8.9 Shellharbour Mt Brown Public 118 1337 8.8 Parramatta Gospel Hall Nth Parra 76 866 8.8 Penrith Blaxland E Public 262 3000 8.7 Fairfield Fairfield Hghts Public 161 1864 8.6 Menai St Pauls Barden Ridge 53 614 8.6 Granville Sth Wentworthville Guide Hall 56 649 8.6 Rockdale Bexley Nth Public 90 1051 8.6 Mount Druitt Mt Druitt Hospital 253 2968 8.5 Smithfield William Stimson Public 33 388 8.5 Oatley Hurstville Public 6 71 8.5 Kogarah Beverly Hills Public 267 3165 8.4 Smithfield Smithfield W Public 65 772 8.4 Liverpool Liverpool Uniting 57 678 8.4 Mount Druitt Eastern Ck Public 188 2243 8.4 Mount Druitt Rooty Hill Arts Hall 48 573 8.4 Baulkham Hills The Hills School 79 963 8.2 Mulgoa Mulgoa Comm. Cntr 42 512 8.2 Upper Hunter Gresford Arts Hall 241 2977 8.1 Mount Druitt Hassall Grove Public 309 3825 8.1 Mount Druitt Plumpton Public 230 2849 8.1 Smithfield Edensor Park Public 74 919 8.1 Shellharbour St Lukes Dapto

6
Highest First Preference Vote by Polling Place – Family First
Votes Formal % Votes Electorate Polling Place
164 1336 12.3 Orange Glenroi Hghts Public 9 91 9.9 Orange Lue Public 14 144 9.7 Orange Windeyer Public 21 248 8.5 Orange Cargo Public 8 96 8.3 Orange Gollan Hall 129 1588 8.1 Orange St Barnabas Orange 129 1590 8.1 Orange Calare Public 13 162 8.0 Orange Mumbil Public 220 2825 7.8 Orange Bletchington Public 7 90 7.8 Orange Yeoval Central 224 2919 7.7 The Entrance Brooke Ave Public 18 249 7.2 Orange Cumnock Hall 151 2090 7.2 Orange Orange Public 142 2000 7.1 Orange Bowen Public 127 1795 7.1 Orange Mudgee High 25 354 7.1 Orange Cudal Public 94 1334 7.0 Orange Anson St 23 330 7.0 Orange Manildra Public 14 204 6.9 Orange Orange Hospital 99 1451 6.8 Orange Cudgegong Valley Public 148 2183 6.8 Orange Orange High 151 2330 6.5 Londonderry Cambridge Park Public 48 741 6.5 Camden Blairmount Public 123 1903 6.5 Camden Eagle Vale N'hood Cntr 94 1472 6.4 Londonderry St Marys Nth Public 141 2209 6.4 Camden Currans Hill Public 50 790 6.3 Port Stephens Irrawang Public 104 1665 6.2 Londonderry Hobartville Public 46 756 6.1 The Entrance Chittaway Bay Public 95 1572 6.0 Orange Kenna Hall 23 382 6.0 Orange Mullion Crk Public 97 1612 6.0 Orange Wellington Civic Hall 34 567 6.0 The Entrance Tuggerah Public 82 1388 5.9 The Entrance Killarney Vale Public 78 1326 5.9 Orange Molong Anglican 98 1717 5.7 Londonderry Tregear Public 116 2056 5.6 Camden Mt Annan Public 89 1578 5.6 Orange Gulgong Hall 135 2436 5.5 The Entrance Niagara Park Comm. Cntr 119 2150 5.5 Camden Harrington Park Public 91 1645 5.5 Orange Mudgee PCYC 13 242 5.4 Orange Canobolas Public 127 2368 5.4 Camden Mt Annan High 99 1852 5.3 Londonderry Londonderry N'hood Cntr 45 845 5.3 Orange Wellington Scout Hall 33 627 5.3 Riverstone Quakers Hill Public 95 1814 5.2 The Entrance The Entrance Public 10 192 5.2 The Entrance Myrtle Brush Park Hall 13 253 5.1 Orange Spring Hill Public 160 3115 5.1 Camden Robert Townson Public 51 996 5.1 Londonderry Lethbridge Park Public 89 1754 5.1 Londonderry Werrington County Public 70 1381 5.1 The Entrance Glenvale School 181 3639 5.0 Camden Elizabeth Macarthur High 64 1310 4.9 The Entrance Narara Uniting 8 165 4.8 Orange Hargraves Public 108 2261 4.8 The Entrance Tuggerah Lakes Cllg -The Entrance 20 421 4.8 Londonderry St Dominic's Cllg

7
Highest First Preference Vote by Polling Place – Independents
Votes Formal % Votes Electorate Polling Place
224 305 73.4 Northern Tablelands Emmaville School 341 465 73.3 Northern Tablelands Tingha Public 1422 1989 71.5 Northern Tablelands Inverell Public 500 701 71.3 Northern Tablelands Glen Innes Hospital 42 59 71.2 Northern Tablelands Mingoola Public 300 433 69.3 Northern Tablelands Ashford School 1499 2168 69.1 Northern Tablelands Ross Hill Public 827 1211 68.3 Northern Tablelands Newling Public 953 1407 67.7 Northern Tablelands Glen Innes Public 1448 2141 67.6 Northern Tablelands Drummond Memorial Public 929 1393 66.7 Northern Tablelands Inverell Masonic Hall 1438 2171 66.2 Northern Tablelands Ben Venue Public 261 395 66.1 Northern Tablelands Bundarra School 923 1409 65.5 Northern Tablelands Cameron Mem. Hall 689 1054 65.4 Northern Tablelands Bingara Civic Cntr 430 660 65.2 Northern Tablelands Armidale Hospital 1504 2325 64.7 Northern Tablelands Armidale Town Hall 59 92 64.1 Northern Tablelands Woolbrook Public 848 1342 63.2 Northern Tablelands Armidale City Public 180 285 63.2 Northern Tablelands Arding Uniting 174 277 62.8 Northern Tablelands Austin College 579 928 62.4 Lake Macquarie Sth Lake Macquarie Sailing Club 54 90 60.0 Northern Tablelands Yetman Hall 945 1578 59.9 Northern Tablelands Uralla Anglican 593 998 59.4 Northern Tablelands Warialda Public 38 64 59.4 Northern Tablelands Coolatai Hall 486 829 58.6 Tamworth Werris Crk Public 192 335 57.3 Northern Tablelands Delungra Hall 791 1403 56.4 Northern Tablelands Walcha Anglican 150 269 55.8 Northern Tablelands Rocky River Public 948 1722 55.1 Northern Tablelands Tenterfield Mem. Hall 57 104 54.8 Northern Tablelands Chandler Public 48 88 54.5 Northern Tablelands Ebor Public 713 1324 53.9 Northern Tablelands Guyra School 186 347 53.6 Northern Tablelands Deepwater Public 343 642 53.4 Sydney JJ Carroll Pre-School 76 143 53.1 Northern Tablelands Glencoe Hall 129 243 53.1 Wagga Wagga Wagga Wagga Hospital 50 98 51.0 Northern Tablelands North Star Public 136 268 50.7 Lake Macquarie Awaba Public 760 1500 50.7 Lake Macquarie Dora Crk Arts Hall 40 79 50.6 Northern Tablelands Nowendoc Hall 406 808 50.2 Lake Macquarie Arcadia Vale Public 353 711 49.6 Sydney Unitarian Church Hall 1153 2324 49.6 Lake Macquarie Rathmines Public 299 605 49.4 Lake Macquarie Woodrising Neighbourhood Cntr 108 220 49.1 Sydney Seymour Cntr 1255 2559 49.0 Lake Macquarie Bonnells Bay Public 49 100 49.0 Northern Tablelands Upper Horton Hall 78 160 48.8 Northern Tablelands Kellys Plains/Dangarsleigh CWA Hall 653 1341 48.7 Lake Macquarie Coal Pt Public 87 179 48.6 Northern Tablelands Kentucky Hall 811 1687 48.1 Tamworth Manilla Town Hall 449 937 47.9 Sydney Bourke St Public 667 1395 47.8 Lake Macquarie Morisset Public 487 1026 47.5 Lake Macquarie Kilaben Bay Hall 225 477 47.2 Sydney St Peters Playhouse 433 920 47.1 Lake Macquarie Teralba Public

8
Lowest First Preference Vote by Polling Place – Liberal Party
Votes Formal % Votes Electorate Polling Place
301 1476 20.4 Wollongong Coniston Public 191 937 20.4 Sydney Bourke St Public 157 772 20.3 Liverpool Liverpool Uniting 542 2673 20.3 Wallsend Maryland Public 176 876 20.1 Heffron St Peters Public 132 657 20.1 Liverpool Liverpool Hospital 55 274 20.1 Canterbury Dulwich High 184 920 20.0 Lake Macquarie Teralba Public 288 1482 19.4 Marrickville Dulwich High 196 1010 19.4 Keira Holy Spirit Bellambi 151 787 19.2 Wallsend Argenton Comm. Hall 540 2818 19.2 Marrickville Stanmore Public 166 869 19.1 Canterbury Dulwich Hill Public 288 1509 19.1 Macquarie Fields Guise Public 176 928 19.0 Lake Macquarie Sth Lake Macquarie Sailing Club 255 1354 18.8 Marrickville Darlington Public 86 458 18.8 Wallsend Plattsburg Public 120 642 18.7 Sydney JJ Carroll Pre-School 247 1328 18.6 Marrickville Marrickville Public 202 1090 18.5 Liverpool Heckenberg Comm Cntr 252 1377 18.3 Lake Macquarie Blackalls Park Public 183 1004 18.2 Wollongong Primbee Public 130 714 18.2 Marrickville Salvo Hall Dulwich Hill 219 1203 18.2 Wollongong Wollongong Snr Ctzns Cntr 125 691 18.1 Marrickville Bridge Rd Public 48 268 17.9 Lake Macquarie Awaba Public 227 1282 17.7 Marrickville Wilkins Public 40 226 17.7 Wollongong Keiraville Public 347 1973 17.6 Marrickville Marrickville W Public 110 628 17.5 Marrickville St Clements Marrickville 226 1304 17.3 Wollongong Lake Hghts Public 20 116 17.2 Heffron Newtown Mission Chapel 147 858 17.1 Marrickville Ferncourt Public 190 1120 17.0 Lake Macquarie Biraban Public 119 707 16.8 Marrickville Dulwich Hill Public 73 434 16.8 Marrickville Seymour Cntr 293 1743 16.8 Marrickville Marrickville Uniting 19 114 16.7 Marrickville St Peters Town Hall 155 931 16.6 Wollongong Illawarra Snr Cllg 190 1179 16.1 Shellharbour Warilla Nth Comm Cntr 428 2676 16.0 Marrickville Marrickville Town Hall 162 1018 15.9 Marrickville Erskineville Public 27 171 15.8 Wollongong Wollongong Hospital 279 1779 15.7 Marrickville Enmore TAFE Design Cntr 328 2110 15.5 Marrickville Australia St School 155 1001 15.5 Marrickville Newtown Public 204 1379 14.8 Wollongong Warrawong Public 263 1789 14.7 Wollongong Berkeley Public 292 1992 14.7 Marrickville Newtown Mission Chapel 185 1263 14.6 Wollongong Warrawong Hall 84 605 13.9 Lake Macquarie Woodrising Neighbourhood Cntr 148 1151 12.9 Wollongong Cringila Hall 155 1260 12.3 Marrickville Camdenville Public 176 1457 12.1 Wollongong Port Kembla Snr Ctzns Cntr 195 1688 11.6 Wollongong Berkeley W Public 21 220 9.5 Sydney Seymour Cntr 61 713 8.6 Wollongong Berkeley Comm. Centre 2 33 6.1 Bega Wallaga Lake Koori Village

9
Lowest First Preference Vote by Polling Place – National Party
Votes Formal % Votes Electorate Polling Place
121 395 30.6 Northern Tablelands Bundarra School 78 256 30.5 Lismore Rosebank Public 147 486 30.2 Cessnock Ellalong Public 570 1885 30.2 Cessnock Branxton Hall 176 590 29.8 Cessnock Kearsley Public 80 269 29.7 Northern Tablelands Rocky River Public 312 1054 29.6 Northern Tablelands Bingara Civic Cntr 240 829 29.0 Tamworth Werris Crk Public 394 1409 28.0 Northern Tablelands Cameron Mem. Hall 434 1578 27.5 Northern Tablelands Uralla Anglican 43 157 27.4 Cessnock Wollombi Public 113 413 27.4 Cessnock Kitchener Public 330 1221 27.0 Cessnock Hawkins Ret. Village 116 433 26.8 Northern Tablelands Ashford School 370 1393 26.6 Northern Tablelands Inverell Masonic Hall 570 2168 26.3 Northern Tablelands Ross Hill Public 321 1234 26.0 Cessnock Greta Hall 73 285 25.6 Northern Tablelands Arding Uniting 354 1407 25.2 Northern Tablelands Glen Innes Public 230 916 25.1 Cessnock Stanford Merthyr Infants 112 447 25.1 Cessnock Paxton Public 226 922 24.5 Cessnock Nth Cessnock Comm. Hall 465 1904 24.4 Cessnock Cessnock W Public 170 701 24.3 Northern Tablelands Glen Innes Hospital 257 1066 24.1 Cessnock Bellbird Public 437 1824 24.0 Cessnock Beresfield Public 14 59 23.7 Northern Tablelands Mingoola Public 468 1989 23.5 Northern Tablelands Inverell Public 88 374 23.5 Lismore Cawongla Pre-School 467 2006 23.3 Cessnock Kurri Kurri Guide Hall 308 1342 23.0 Northern Tablelands Armidale City Public 282 1232 22.9 Cessnock Hunter Life Ed. Cntr 229 1017 22.5 Cessnock Barnsley Public 157 706 22.2 Cessnock Cessnock E Public 634 2881 22.0 Cessnock Edgeworth N'hood Cntr 509 2325 21.9 Northern Tablelands Armidale Town Hall 464 2141 21.7 Northern Tablelands Drummond Memorial Public 470 2171 21.6 Northern Tablelands Ben Venue Public 142 660 21.5 Northern Tablelands Armidale Hospital 184 858 21.4 Cessnock Cessnock Scout Hall 97 454 21.4 Cessnock Minmi Hall 65 305 21.3 Northern Tablelands Emmaville School 73 343 21.3 Cessnock Neath RFS 155 730 21.2 Cessnock Tarro Public 338 1613 21.0 Cessnock Cessnock High 255 1232 20.7 Cessnock Abermain Hall 248 1211 20.5 Northern Tablelands Newling Public 390 1920 20.3 Cessnock Weston Civic Cntr 122 603 20.2 Cessnock Pelaw Main Public 56 277 20.2 Northern Tablelands Austin College 181 927 19.5 Lismore Nimbin School 276 1451 19.0 Cessnock Kurri Kurri Comm. Cntr 324 1731 18.7 Cessnock W Wallsend High 13 71 18.3 Northern Tablelands Drake Hall 83 465 17.8 Northern Tablelands Tingha Public 7 40 17.5 Barwon Murrin Bridge Preschool 6 44 13.6 Barwon Toomelah Public 23 179 12.8 Lismore Wilsons Crk Hall

10
Lowest First Preference Vote by Polling Place – Labor Party
Votes Formal % Votes Electorate Polling Place
71 2171 3.3 Northern Tablelands Ben Venue Public 11 347 3.2 Northern Tablelands Deepwater Public 4 127 3.1 Oxley Byabarra Public 8 256 3.1 Wagga Wagga Ladysmith Public 12 385 3.1 Tamworth Attunga Public 8 262 3.1 Oxley Comboyne Public 13 433 3.0 Northern Tablelands Ashford School 3 104 2.9 Barwon Edgeroi Coronation Hall 7 250 2.8 Tamworth Dungowan Hall 4 143 2.8 Barwon Burren Junction Public 3 108 2.8 Tamworth Kelvin Hall 2 72 2.8 Barwon Bullarah Public 1 36 2.8 Barwon Louth Public 33 1200 2.8 Tamworth Carinya School 5 184 2.7 Tamworth Somerton Public 37 1407 2.6 Northern Tablelands Glen Innes Public 52 1989 2.6 Northern Tablelands Inverell Public 5 197 2.5 Dubbo Tullamore Central 33 1324 2.5 Northern Tablelands Guyra School 2 81 2.5 Barwon Gurley Bellata Hall 7 285 2.5 Northern Tablelands Arding Uniting 13 536 2.4 Tamworth Moore Crk Hall 4 174 2.3 Dubbo Tomingley Hall 2 88 2.3 Northern Tablelands Ebor Public 17 752 2.3 Tamworth Nemingha Public 11 488 2.3 Tamworth Moonbi Public 31 1409 2.2 Northern Tablelands Cameron Mem. Hall 46 2168 2.1 Northern Tablelands Ross Hill Public 14 660 2.1 Northern Tablelands Armidale Hospital 8 395 2.0 Northern Tablelands Bundarra School 2 100 2.0 Northern Tablelands Upper Horton Hall 27 1403 1.9 Northern Tablelands Walcha Anglican 2 104 1.9 Northern Tablelands Chandler Public 3 157 1.9 Northern Tablelands Black Mtn Public 3 159 1.9 Dubbo Bedgerebong Public 2 107 1.9 Dubbo Ballimore Public 3 172 1.7 Tamworth Woolomin Public 1 59 1.7 Northern Tablelands Mingoola Public 3 179 1.7 Northern Tablelands Kentucky Hall 1 60 1.7 Burrinjuck Wee Jasper Hall 5 304 1.6 Tamworth Duri Hall 3 199 1.5 Murray-Darling Blighty Public 2 138 1.4 Northern Tablelands Gravesend Public 10 701 1.4 Northern Tablelands Glen Innes Hospital 2 141 1.4 Dubbo Alectown Hall 2 145 1.4 Northern Tablelands Red Range Public 1 78 1.3 Northern Tablelands Kingstown Hall 1 85 1.2 Barwon Curban Hall 1 92 1.1 Northern Tablelands Woolbrook Public 1 100 1.0 Dubbo Wambangalang Edu. Cntr 1 109 0.9 Northern Tablelands Ben Lomond Public 5 590 0.8 Tamworth Timbumburi Public 1 122 0.8 Barwon Baan Baa Hall 1 155 0.6 Port Macquarie Lorne Rec. Cntr 0 160 0.0 Northern Tablelands Kellys Plains/Dangarsleigh CWA Hall 0 79 0.0 Northern Tablelands Nowendoc Hall 0 64 0.0 Northern Tablelands Coolatai Hall 0 63 0.0 Northern Tablelands Bonshaw Hall

11
Percentage Party Vote by Vote Type at 2011 Election
Ordinary Absent Pre-Poll Postal New Declared Provisional Party Votes Votes Votes and iVote Enrolments Institutions /Silent Totals
Liberal Party 38.6 39.7 33.2 43.1 34.0 39.7 39.5 38.6 National Party 12.1 8.5 22.4 11.5 11.3 17.9 8.3 12.6 Labor Party 26.0 24.6 22.9 25.4 25.6 28.1 24.1 25.6 The Greens 10.2 14.8 7.1 8.7 14.7 3.8 15.1 10.3 Christian Democrats 3.2 3.6 2.3 2.8 3.4 2.7 3.5 3.1 Independents 8.9 7.4 11.4 7.6 9.2 7.3 8.5 8.8 Others 1.1 1.5 0.7 0.8 1.8 0.5 1.1 1.0 Informal 3.5 3.0 2.2 1.1 3.5 1.9 3.4 3.2
Two-Party Preferred Coalition 63.7 63.1 68.5 66.2 61.1 66.6 63.1 64.2 Labor 36.3 36.9 31.5 33.8 38.9 33.4 36.9 35.8 % of total state vote 74.3 9.5 8.2 6.8 0.5 0.3 0.3 100.0
Note: Postal Votes and iVotes were amalgamated for counting purposes.
Percentage of Vote by Vote Type - NSW Elections 1984-2011
Ordinary Absent Pre-Poll Postal Declared Provisional New Electiony Votes Votes Votes Votes Institutions /Silent/Section iVotes Enrolments
1984 88.2 9.3 0.8 1.4 0.2 0.2 .. .. 1988 87.5 8.3 1.8 1.9 0.3 0.3 .. .. 1991 88.7 7.7 1.7 1.5 0.3 0.1 .. .. 1995 87.6 7.6 2.3 1.8 0.4 0.2 .. .. 1999 84.6 7.9 3.8 3.2 0.4 0.1 .. .. 2003 83.6 8.3 3.4 4.2 0.3 0.2 .. .. 2007 81.1 7.4 5.5 5.5 0.4 0.1 .. .. 2011 74.3 9.5 8.2 5.7 0.3 0.3 1.1 0.5
Note: iVotes and New Enrolments were categories of declaration votes introduced for the 2011 election.

12

2011 New South Wales Election
POLLING PLACES Total
Exhst Formal Vote
Votes % Votes % %
1 Albury High 398 25.1 1187 74.9 308 1893 68 3.5 1961
2 Albury Masonic Cntr 273 29.4 657 70.6 184 1114 60 5.1 1174
3 Albury Nth Public 328 28.2 836 71.8 250 1414 80 5.4 1494
4 Albury Public 349 22.8 1180 77.2 370 1899 83 4.2 1982
5 Albury Stadium 223 21.4 821 78.6 202 1246 51 3.9 1297
6 Albury Sth Youth Hall 238 23.7 768 76.3 243 1249 52 4.0 1301
7 Albury W Public 313 23.1 1043 76.9 262 1618 58 3.5 1676
8 Balldale Rec Reserve 5 5.7 83 94.3 7 95 0 0.0 95
9 Brocklesby Public 10 10.4 86 89.6 11 107 1 0.9 108
10 Burrumbuttock Public 24 13.1 159 86.9 26 209 1 0.5 210
11 Corowa High 141 29.1 343 70.9 48 532 32 5.7 564
12 Corowa Public 406 26.6 1123 73.4 162 1691 91 5.1 1782
13 Corowa Sth Public 188 25.1 562 74.9 102 852 41 4.6 893
14 Culcairn Public 206 28.3 523 71.7 64 793 23 2.8 816
15 Gerogery Hall 34 13.9 211 86.1 17 262 5 1.9 267
16 Glenroy Public 398 22.1 1399 77.9 394 2191 102 4.4 2293
17 Henty Public 86 15.0 489 85.0 48 623 23 3.6 646
18 Holbrook Public 209 21.1 781 78.9 81 1071 33 3.0 1104
19 Howlong Public 317 26.1 896 73.9 191 1404 72 4.9 1476
20 Hume Public 320 28.9 789 71.1 177 1286 71 5.2 1357
21 Jindera Public 152 16.8 754 83.2 107 1013 30 2.9 1043
22 Jingellic Showgrounds 15 14.6 88 85.4 7 110 2 1.8 112
23 Khancoban Hall 53 28.6 132 71.4 28 213 3 1.4 216
24 Lavington E Public 453 27.6 1191 72.4 260 1904 97 4.8 2001
25 Lavington Public 524 26.2 1475 73.8 368 2367 151 6.0 2518
26 Lowesdale Public 7 4.4 152 95.6 7 166 1 0.6 167
27 Mullengandra Public 8 9.0 81 91.0 13 102 1 1.0 103
28 Mulwala Civic Cntr 234 22.1 826 77.9 58 1118 36 3.1 1154
29 Rosewood Public 26 16.1 135 83.9 8 169 3 1.7 172
30 Springdale Hghts Public 167 28.3 423 71.7 159 749 38 4.8 787
31 Sydney Town Hall 3 33.3 6 66.7 3 12 0 0.0 12
32 Table Top Public 47 12.9 316 87.1 37 400 4 1.0 404
33 Thurgoona Public 440 21.3 1628 78.7 405 2473 104 4.0 2577
34 Tooma Hall 6 7.1 79 92.9 4 89 1 1.1 90
35 Tumbarumba High 339 32.0 721 68.0 123 1183 59 4.8 1242
36 Walbundrie Public 11 8.3 122 91.7 4 137 1 0.7 138
37 Walla Walla Public 53 12.9 357 87.1 33 443 7 1.6 450
38 Woomargama Hall 21 16.3 108 83.7 8 137 1 0.7 138
Ordinary Votes 7025 23.8 22530 76.2 4779 34334 1486 4.1 35820
Absent 310 22.5 1070 77.5 189 1569 38 2.4 1607
Declared Institution 48 23.8 154 76.2 17 219 2 0.9 221
Enrolment New 27 21.4 99 78.6 35 161 10 5.8 171
Postal/iVote 569 23.1 1892 76.9 232 2693 28 1.0 2721
Pre-poll 608 18.0 2779 82.0 578 3965 101 2.5 4066
Provisional/Silent 22 21.2 82 78.8 19 123 2 1.6 125
Declaration Votes 1584 20.7 6076 79.3 1070 8730 181 2.0 8911
Grand Total 8609 23.1 28606 76.9 5849 43064 1667 3.7 44731
ALBURYRoll : 49719 (Turnout 90.0%)
Cameron Aplin
(ALP) (LIB) Informal
13

2011 New South Wales Election
POLLING PLACES Total
Exhst Formal Vote
Votes % Votes % %
1 Auburn Girls High 949 71.4 381 28.6 222 1552 81 5.0 1633
2 Auburn Nth Public 547 66.4 277 33.6 122 946 45 4.5 991
3 Auburn Public 1277 64.2 711 35.8 333 2321 195 7.8 2516
4 Auburn Town Hall 575 64.5 317 35.5 180 1072 76 6.6 1148
5 Auburn W Public 1579 60.8 1017 39.2 450 3046 203 6.2 3249
6 Berala Jubilee Hall 976 54.2 824 45.8 267 2067 103 4.7 2170
7 Berala Public 1532 63.7 873 36.3 340 2745 198 6.7 2943
8 Birrong Public 901 59.2 620 40.8 206 1727 103 5.6 1830
9 Chester Hill Comm. Cntr 262 62.8 155 37.2 99 516 47 8.3 563
10 Chullora Public 467 51.0 448 49.0 178 1093 74 6.3 1167
11 Greenacre Baptist 585 50.3 578 49.7 238 1401 100 6.7 1501
12 Greenacre Snr Ctzns Cntr 175 54.3 147 45.7 100 422 37 8.1 459
13 Greenacre YMCA 96 57.1 72 42.9 57 225 42 15.7 267
14 Immaculate Heart of Mary Primary856 57.8 625 42.2 178 1659 81 4.7 1740
15 Lidcombe Public 2118 63.4 1221 36.6 493 3832 208 5.1 4040
16 Newington Public 689 36.1 1220 63.9 287 2196 54 2.4 2250
17 Pulse Cntr 247 34.5 469 65.5 55 771 16 2.0 787
18 Regents Park Comm. Cntr 848 64.4 469 35.6 234 1551 77 4.7 1628
19 St John Mark's Anglican 273 63.6 156 36.4 57 486 50 9.3 536
20 St Josephs The Worker Primary592 59.7 400 40.3 102 1094 65 5.6 1159
21 St Stephen's Lidcombe 888 58.5 631 41.5 215 1734 81 4.5 1815
22 Sydney Town Hall 41 65.1 22 34.9 16 79 5 6.0 84
Ordinary Votes 16473 58.6 11633 41.4 4429 32535 1941 5.6 34476
Absent 1835 54.7 1518 45.3 733 4086 168 3.9 4254
Declared Institution 29 52.7 26 47.3 8 63 0 0.0 63
Enrolment New 72 61.5 45 38.5 28 145 6 4.0 151
Postal/iVote 1762 56.2 1373 43.8 385 3520 56 1.6 3576
Pre-poll 2014 63.6 1154 36.4 484 3652 146 3.8 3798
Provisional/Silent 14 60.9 9 39.1 4 27 1 3.6 28
Declaration Votes 5726 58.1 4125 41.9 1642 11493 377 3.2 11870
Grand Total 22199 58.5 15758 41.5 6071 44028 2318 5.0 46346
AUBURNRoll : 50994 (Turnout 90.9%)
Perry Attie
(ALP) (LIB) Informal
14

2011 New South Wales Election
POLLING PLACES Total
Exhst Formal Vote
Votes % Votes % %
1 A&I Hall 292 29.9 686 70.1 269 1247 22 1.7 1269
2 Alstonville High 430 19.8 1737 80.2 292 2459 50 2.0 2509
3 Ballina Comm Cntr 153 17.6 718 82.4 127 998 19 1.9 1017
4 Ballina High 567 23.8 1820 76.2 311 2698 74 2.7 2772
5 Ballina Hospital 296 23.5 961 76.5 139 1396 37 2.6 1433
6 Billi Lids LDC Cntr 231 34.9 430 65.1 155 816 23 2.7 839
7 Brunswick Heads Mem. Hall 367 34.5 696 65.5 339 1402 45 3.1 1447
8 Byron Bay High 217 36.9 371 63.1 188 776 18 2.3 794
9 Byron Bay Public 498 38.2 804 61.8 489 1791 54 2.9 1845
10 Coorabell Public 46 26.3 129 73.7 50 225 1 0.4 226
11 Durrumbul Public 118 44.0 150 56.0 98 366 12 3.2 378
12 Emmanuel Ang. Cllg 170 17.4 807 82.6 65 1042 29 2.7 1071
13 Empire Vale Public 38 18.0 173 82.0 32 243 7 2.8 250
14 Ewingsdale Hall 77 26.1 218 73.9 94 389 6 1.5 395
15 Fernleigh Public 43 20.6 166 79.4 36 245 4 1.6 249
16 Lennox Head Public 554 24.0 1754 76.0 378 2686 51 1.9 2737
17 Meerschaum Vale Hall 54 21.5 197 78.5 22 273 7 2.5 280
18 Newrybar Public 91 24.7 277 75.3 86 454 6 1.3 460
19 Ocean Shores Comm. Cntr 600 37.7 990 62.3 467 2057 56 2.7 2113
20 Pimlico Hall 23 14.4 137 85.6 10 170 1 0.6 171
21 Rous Public 91 15.2 507 84.8 52 650 6 0.9 656
22 Southern Cross School 371 20.8 1409 79.2 227 2007 44 2.1 2051
23 St Johns MPC 526 34.4 1005 65.6 578 2109 62 2.9 2171
24 Suffolk Park Hall 335 41.2 478 58.8 301 1114 23 2.0 1137
25 Sydney Town Hall 3 16.7 15 83.3 8 26 0 0.0 26
26 Tintenbar Public 75 16.3 386 83.7 61 522 8 1.5 530
27 Wardell Hall 128 27.1 345 72.9 54 527 16 2.9 543
28 Wollongbar Public 273 18.1 1234 81.9 155 1662 30 1.8 1692
29 Xavier Cllg Skennars Head 110 21.5 402 78.5 75 587 13 2.2 600
Ordinary Votes 6777 26.3 19002 73.7 5158 30937 724 2.3 31661
Absent 688 30.4 1574 69.6 623 2885 59 2.0 2944
Declared Institution 36 20.3 141 79.7 23 200 4 2.0 204
Enrolment New 31 35.6 56 64.4 39 126 2 1.6 128
Postal/iVote 481 18.2 2156 81.8 304 2941 31 1.0 2972
Pre-poll 783 17.4 3705 82.6 577 5065 62 1.2 5127
Provisional/Silent 18 32.1 38 67.9 14 70 4 5.4 74
Declaration Votes 2037 21.0 7670 79.0 1580 11287 162 1.4 11449
Grand Total 8814 24.8 26672 75.2 6738 42224 886 2.1 43110
BALLINA (2-Party Preferred)Roll : 48432 (Turnout 89.0%)
Warnes Page
(ALP) (NAT) Informal
15

2011 New South Wales Election
POLLING PLACES Total
Exhst Formal Vote
Votes % Votes % %
1 Annandale Nth Public 874 44.7 1080 55.3 613 2567 49 1.9 2616
2 Annandale Public 622 41.4 881 58.6 428 1931 45 2.3 1976
3 Balmain Hospital 321 50.4 316 49.6 152 789 11 1.4 800
4 Balmain Public 599 46.8 682 53.2 321 1602 39 2.4 1641
5 Birchgrove Public 940 47.6 1035 52.4 514 2489 48 1.9 2537
6 Dobroyd Pt Public 778 66.2 398 33.8 253 1429 41 2.8 1470
7 Forest Lodge Public 526 39.4 809 60.6 387 1722 42 2.4 1764
8 Haberfield Public 401 58.3 287 41.7 191 879 43 4.7 922
9 Inner City Montessori School 207 47.8 226 52.2 118 551 9 1.6 560
10 Kegworth Public 486 41.6 681 58.4 349 1516 64 4.1 1580
11 Leichhardt Town Hall 956 43.8 1225 56.2 592 2773 85 3.0 2858
12 Nicholson St Public 363 45.5 435 54.5 190 988 25 2.5 1013
13 Orange Grove Public 672 45.7 798 54.3 395 1865 53 2.8 1918
14 Peter Forsyth Hall 319 39.0 499 61.0 290 1108 42 3.7 1150
15 Rozelle Public 1089 44.7 1349 55.3 582 3020 85 2.7 3105
16 SSC - Balmain Campus 312 54.6 259 45.4 119 690 16 2.3 706
17 SSC - Blackwattle Bay Campus325 45.3 392 54.7 225 942 25 2.6 967
18 SSC - Leichhardt Campus 448 46.6 513 53.4 296 1257 36 2.8 1293
19 St Fiacres Church Hall 335 46.9 380 53.1 235 950 20 2.1 970
20 St Johns Glebe 379 36.5 658 63.5 374 1411 44 3.0 1455
21 St Marks Lilyfield 351 46.2 408 53.8 194 953 13 1.3 966
22 St Oswalds Anglican 601 63.9 339 36.1 248 1188 48 3.9 1236
23 St Scholasticas Cllg 355 45.6 423 54.4 286 1064 26 2.4 1090
24 Sydney Town Hall 61 39.6 93 60.4 45 199 4 2.0 203
Ordinary Votes 12320 46.5 14166 53.5 7397 33883 913 2.6 34796
Absent 2042 44.9 2501 55.1 1150 5693 154 2.6 5847
Declared Institution 56 64.4 31 35.6 39 126 4 3.1 130
Enrolment New 19 33.9 37 66.1 13 69 4 5.5 73
Postal/iVote 1520 47.9 1650 52.1 847 4017 43 1.1 4060
Pre-poll 644 48.6 681 51.4 357 1682 31 1.8 1713
Provisional/Silent 63 45.7 75 54.3 30 168 0 0.0 168
Declaration Votes 4344 46.6 4975 53.4 2436 11755 236 2.0 11991
Grand Total 16664 46.5 19141 53.5 9833 45638 1149 2.5 46787
(Estimated two-candidate preferred counts)
BALMAINRoll : 51888 (Turnout 90.2%)
Falk Parker
(LIB) (GRN) Informal
16

2011 New South Wales Election
POLLING PLACES Total
Exhst Formal Vote
Votes % Votes % %
1 Annandale Nth Public 1161 57.1 873 42.9 533 2567 49 1.9 2616
2 Annandale Public 877 58.2 631 41.8 423 1931 45 2.3 1976
3 Balmain Hospital 302 48.0 327 52.0 160 789 11 1.4 800
4 Balmain Public 661 52.0 609 48.0 332 1602 39 2.4 1641
5 Birchgrove Public 1034 52.1 950 47.9 505 2489 48 1.9 2537
6 Dobroyd Pt Public 461 37.3 776 62.7 192 1429 41 2.8 1470
7 Forest Lodge Public 777 59.0 539 41.0 406 1722 42 2.4 1764
8 Haberfield Public 343 46.3 398 53.7 138 879 43 4.7 922
9 Inner City Montessori School 229 52.3 209 47.7 113 551 9 1.6 560
10 Kegworth Public 694 58.5 493 41.5 329 1516 64 4.1 1580
11 Leichhardt Town Hall 1199 55.2 973 44.8 601 2773 85 3.0 2858
12 Nicholson St Public 394 51.3 374 48.7 220 988 25 2.5 1013
13 Orange Grove Public 777 53.1 685 46.9 403 1865 53 2.8 1918
14 Peter Forsyth Hall 558 63.8 317 36.2 233 1108 42 3.7 1150
15 Rozelle Public 1203 51.7 1125 48.3 692 3020 85 2.7 3105
16 SSC - Balmain Campus 239 42.9 318 57.1 133 690 16 2.3 706
17 SSC - Blackwattle Bay Campus446 58.1 321 41.9 175 942 25 2.6 967
18 SSC - Leichhardt Campus 569 56.1 446 43.9 242 1257 36 2.8 1293
19 St Fiacres Church Hall 440 57.1 331 42.9 179 950 20 2.1 970
20 St Johns Glebe 725 65.8 377 34.2 309 1411 44 3.0 1455
21 St Marks Lilyfield 393 52.4 357 47.6 203 953 13 1.3 966
22 St Oswalds Anglican 449 43.2 590 56.8 149 1188 48 3.9 1236
23 St Scholasticas Cllg 525 60.3 345 39.7 194 1064 26 2.4 1090
24 Sydney Town Hall 89 58.6 63 41.4 47 199 4 2.0 203
Ordinary Votes 14545 53.9 12427 46.1 6911 33883 913 2.6 34796
Absent 2301 52.2 2104 47.8 1288 5693 154 2.6 5847
Declared Institution 65 55.6 52 44.4 9 126 4 3.1 130
Enrolment New 29 58.0 21 42.0 19 69 4 5.5 73
Postal/iVote 1681 52.3 1534 47.7 802 4017 43 1.1 4060
Pre-poll 706 52.1 648 47.9 328 1682 31 1.8 1713
Provisional/Silent 65 49.6 66 50.4 37 168 0 0.0 168
Declaration Votes 4847 52.3 4425 47.7 2483 11755 236 2.0 11991
Grand Total 19392 53.5 16850 46.5 9396 45638 1149 2.5 46787
(Estimated two-party preferred counts)
BALMAIN (2-Party Preferred)Roll : 51888 (Turnout 90.2%)
Firth Falk
(ALP) (LIB) Informal
17

2011 New South Wales Election
POLLING PLACES Total
Exhst Formal Vote
Votes % Votes % %
1 Banksia Rd Public 451 53.6 390 46.4 225 1066 94 8.1 1160
2 Bankstown Nth Public 696 63.1 407 36.9 228 1331 105 7.3 1436
3 Bankstown Public 1457 70.1 620 29.9 289 2366 162 6.4 2528
4 Bankstown Snr 556 65.4 294 34.6 122 972 68 6.5 1040
5 Bankstown Snr Ctzns Cntr 560 64.5 308 35.5 154 1022 81 7.3 1103
6 Bankstown Sth Infants 853 64.0 479 36.0 292 1624 138 7.8 1762
7 Bankstown W Public 899 63.6 514 36.4 232 1645 117 6.6 1762
8 Bass High 1252 58.3 897 41.7 484 2633 169 6.0 2802
9 Bass Hill Public 860 54.7 711 45.3 346 1917 146 7.1 2063
10 Birrong Public 493 59.3 339 40.7 199 1031 96 8.5 1127
11 Condell Park Public 213 60.3 140 39.7 101 454 58 11.3 512
12 Georges Hall Public 1267 59.2 872 40.8 362 2501 191 7.1 2692
13 Greenacre Snr Ctzns Cntr 547 53.0 486 47.0 226 1259 103 7.6 1362
14 Greenacre YMCA 1440 55.0 1177 45.0 651 3268 280 7.9 3548
15 Mt Lewis Infants 734 56.3 569 43.7 291 1594 107 6.3 1701
16 Punchbowl Boys 870 64.6 477 35.4 425 1772 132 6.9 1904
17 Punchbowl Public 130 63.1 76 36.9 56 262 21 7.4 283
18 St Marks Yagoona 657 61.6 410 38.4 223 1290 73 5.4 1363
19 St Pauls Anglican Bankstown 1126 69.4 496 30.6 212 1834 113 5.8 1947
20 Sydney Town Hall 24 52.2 22 47.8 6 52 3 5.5 55
21 Yagoona Snr Ctzns Cntr 1361 68.0 639 32.0 259 2259 188 7.7 2447
Ordinary Votes 16446 61.4 10323 38.6 5383 32152 2445 7.1 34597
Absent 1658 54.0 1411 46.0 691 3760 244 6.1 4004
Declared Institution 44 67.7 21 32.3 2 67 0 0.0 67
Enrolment New 37 62.7 22 37.3 27 86 6 6.5 92
Postal/iVote 1481 55.7 1179 44.3 361 3021 51 1.7 3072
Pre-poll 1304 59.8 875 40.2 363 2542 98 3.7 2640
Provisional/Silent 41 56.9 31 43.1 13 85 7 7.6 92
Declaration Votes 4565 56.3 3539 43.7 1457 9561 406 4.1 9967
Grand Total 21011 60.3 13862 39.7 6840 41713 2851 6.4 44564
BANKSTOWNRoll : 48714 (Turnout 91.5%)
Mihailuk Chahine
(ALP) (LIB) Informal
18

2011 New South Wales Election
POLLING PLACES Total
Exhst Formal Vote
Votes % Votes % %
1 Ashley Hall 17 11.3 133 88.7 2 152 2 1.3 154
2 Baan Baa Hall 1 0.8 119 99.2 2 122 1 0.8 123
3 Baradine Central 80 14.7 464 85.3 4 548 7 1.3 555
4 Bellata Hall 10 6.0 156 94.0 4 170 6 3.4 176
5 Binnaway Central 134 32.7 276 67.3 12 422 13 3.0 435
6 Boggabilla Central 74 32.9 151 67.1 6 231 12 4.9 243
7 Boomi Public 14 11.1 112 88.9 1 127 0 0.0 127
8 Bourke TAFE 192 23.0 643 77.0 28 863 31 3.5 894
9 Brewarrina Comm. Cntr 115 30.5 262 69.5 12 389 6 1.5 395
10 Bullarah Public 3 4.2 68 95.8 1 72 1 1.4 73
11 Burren Junction Public 4 2.8 138 97.2 1 143 0 0.0 143
12 Carinda Public 6 6.5 86 93.5 0 92 2 2.1 94
13 Cobar Council Chambers 233 18.4 1033 81.6 35 1301 29 2.2 1330
14 Collarenebri Central 62 25.1 185 74.9 2 249 6 2.4 255
15 Collie CWA Hall 6 11.8 45 88.2 0 51 2 3.8 53
16 Condobolin Public 8 8.1 91 91.9 2 101 2 1.9 103
17 Coolabah Hall 3 10.0 27 90.0 0 30 0 0.0 30
18 Coolah Central 88 14.6 514 85.4 28 630 20 3.1 650
19 Coonabarabran Youth Club 484 22.9 1633 77.1 70 2187 71 3.1 2258
20 Coonamble High 457 32.5 949 67.5 44 1450 35 2.4 1485
21 Cumborah Rec Club 15 13.3 98 86.7 2 115 2 1.7 117
22 Curban Hall 1 1.2 83 98.8 1 85 1 1.2 86
23 Dunedoo Central 100 17.5 473 82.5 13 586 10 1.7 596
24 Edgeroi Coronation Hall 3 2.9 100 97.1 1 104 1 1.0 105
25 Enngonia Public 18 29.5 43 70.5 0 61 2 3.2 63
26 Euabalong W Public 20 23.8 64 76.2 4 88 5 5.4 93
27 Fifield Hall 11 15.1 62 84.9 7 80 3 3.6 83
28 Garah Public 11 10.5 94 89.5 0 105 2 1.9 107
29 Gilgandra Hall 248 23.0 831 77.0 25 1104 38 3.3 1142
30 Girilambone Public 5 11.4 39 88.6 0 44 0 0.0 44
31 Goodooga Central 47 51.1 45 48.9 4 96 1 1.0 97
32 Gulargambone Central 67 21.3 248 78.7 6 321 8 2.4 329
33 Gurley Bellata Hall 2 2.5 79 97.5 0 81 2 2.4 83
34 Gwabegar Public 24 26.1 68 73.9 1 93 5 5.1 98
35 Hermidale Public 6 6.7 83 93.3 2 91 0 0.0 91
36 Leadville Hall 32 30.8 72 69.2 3 107 3 2.7 110
37 Lightning Ridge Central 283 28.6 708 71.4 42 1033 43 4.0 1076
38 Louth Public 1 2.8 35 97.2 0 36 0 0.0 36
39 Mendooran Central 87 21.0 328 79.0 13 428 8 1.8 436
40 Moree College - Albert St 212 13.6 1352 86.4 25 1589 29 1.8 1618
41 Moree PCYC 272 23.7 874 76.3 12 1158 26 2.2 1184
42 Mungindi Central 53 18.0 242 82.0 4 299 6 2.0 305
43 Murrin Bridge Preschool 29 80.6 7 19.4 4 40 0 0.0 40
44 Narrabri Public 250 15.4 1376 84.6 37 1663 56 3.3 1719
45 Nevertire Hall 18 12.4 127 87.6 0 145 1 0.7 146
46 Nurruby OOSH 110 13.7 692 86.3 13 815 16 1.9 831
47 Nymagee Hall 4 9.3 39 90.7 0 43 1 2.3 44
48 Nyngan High 226 22.0 800 78.0 29 1055 46 4.2 1101
49 Pallamallawa Public 54 18.9 232 81.1 4 290 7 2.4 297
50 Pilliga Public 10 8.6 106 91.4 0 116 2 1.7 118
51 Quambone Public 18 20.9 68 79.1 5 91 0 0.0 91
52 Rowena Public 4 4.5 84 95.5 0 88 0 0.0 88
53 St Francis Xaviers Moree 110 10.5 941 89.5 14 1065 18 1.7 1083
54 St Lawrences Anglican 147 15.9 776 84.1 16 939 16 1.7 955
55 Sydney Town Hall 4 20.0 16 80.0 0 20 0 0.0 20
56 Terry Hie Hie Hall 7 12.5 49 87.5 0 56 0 0.0 56
57 Toomelah Public 34 82.9 7 17.1 3 44 0 0.0 44
58 Tooraweenah Public 8 4.6 167 95.4 2 177 6 3.3 183
59 Tottenham Hall 45 12.8 307 87.2 5 357 5 1.4 362
60 Trangie Central 99 15.7 531 84.3 10 640 17 2.6 657
61 Walgett High 188 25.9 538 74.1 33 759 18 2.3 777
62 Wanaaring Public 7 35.0 13 65.0 0 20 0 0.0 20
63 Warren Central 214 22.8 725 77.2 32 971 29 2.9 1000
64 Wee Waa Anglican 90 8.9 920 91.1 13 1023 20 1.9 1043
65 Weilmoringle Public 5 11.9 37 88.1 2 44 0 0.0 44
Ordinary Votes 5190 19.3 21664 80.7 641 27495 699 2.5 28194
Absent 658 16.8 3269 83.2 123 4050 64 1.6 4114
Declared Institution 47 30.9 105 69.1 4 156 2 1.3 158
Enrolment New 41 22.3 143 77.7 10 194 10 4.9 204
Postal/iVote 297 9.9 2715 90.1 37 3049 37 1.2 3086
Pre-poll 621 15.6 3366 84.4 58 4045 61 1.5 4106
Provisional/Silent 29 25.0 87 75.0 2 118 3 2.5 121
Declaration Votes 1693 14.9 9685 85.1 234 11612 177 1.5 11789
Grand Total 6883 18.0 31349 82.0 875 39107 876 2.2 39983
BARWONRoll : 43814 (Turnout 91.3%)
Massarani Humphries
(ALP) (NAT) Informal
19

2011 New South Wales Election
POLLING PLACES Total
Exhst Formal Vote
Votes % Votes % %
1 Barry Hall 17 13.8 106 86.2 3 126 0 0.0 126
2 Bathurst High 174 27.3 463 72.7 32 669 13 1.9 682
3 Bathurst Public 410 26.3 1151 73.7 106 1667 32 1.9 1699
4 Bathurst Sth Public 232 28.1 594 71.9 70 896 16 1.8 912
5 Bathurst W Public 403 23.3 1325 76.7 93 1821 38 2.0 1859
6 Black Springs Public 35 19.9 141 80.1 4 180 0 0.0 180
7 Blayney Public 339 20.3 1332 79.7 46 1717 37 2.1 1754
8 Bowenfels Presbyterian 65 27.7 170 72.3 12 247 5 2.0 252
9 Burraga Hall 13 20.3 51 79.7 0 64 2 3.0 66
10 Capertee Hall 31 29.5 74 70.5 26 131 4 3.0 135
11 Carcoar Public 56 27.2 150 72.8 10 216 1 0.5 217
12 Catholic Centre Bathurst 247 25.3 728 74.7 52 1027 24 2.3 1051
13 Charles Sturt Uni 15 21.7 54 78.3 11 80 3 3.6 83
14 Cooerwull Public 559 36.5 973 63.5 99 1631 49 2.9 1680
15 Cullen Bullen Hall 57 36.8 98 63.2 22 177 3 1.7 180
16 Daffodil Cottage 222 26.0 631 74.0 32 885 15 1.7 900
17 Eglinton Public 250 17.2 1202 82.8 55 1507 28 1.8 1535
18 Fatima Hall 296 37.7 490 62.3 39 825 33 3.8 858
19 Glen Alice Public 21 29.2 51 70.8 7 79 3 3.7 82
20 Hampton Public 24 18.5 106 81.5 13 143 6 4.0 149
21 Hartley Old Public 107 25.7 310 74.3 34 451 8 1.7 459
22 Hermitage Hall 199 37.8 327 62.2 30 556 12 2.1 568
23 Hill End Public 33 37.5 55 62.5 10 98 1 1.0 99
24 Ilford Public 32 18.7 139 81.3 13 184 5 2.6 189
25 Kandos High 322 45.9 379 54.1 66 767 28 3.5 795
26 Kelso Public 474 20.6 1823 79.4 91 2388 48 2.0 2436
27 La Salle Academy 154 33.6 305 66.4 21 480 7 1.4 487
28 Lithgow Public 445 36.6 770 63.4 90 1305 41 3.0 1346
29 Meadow Flat Public 46 24.1 145 75.9 10 201 2 1.0 203
30 Millthorpe Public 139 19.7 567 80.3 46 752 18 2.3 770
31 Neville Public 13 13.7 82 86.3 3 98 0 0.0 98
32 Newbridge Public 17 14.0 104 86.0 9 130 1 0.8 131
33 O'Connell Public 42 15.2 235 84.8 6 283 1 0.4 284
34 Oberon High 296 19.3 1234 80.7 62 1592 47 2.9 1639
35 Perthville Public 91 19.5 375 80.5 25 491 10 2.0 501
36 Portland Central 436 37.4 731 62.6 67 1234 37 2.9 1271
37 Raglan Public 193 24.4 598 75.6 30 821 8 1.0 829
38 Rockley Public 37 24.2 116 75.8 8 161 5 3.0 166
39 Rylstone Hall 158 26.9 430 73.1 46 634 12 1.9 646
40 St Stephens Bathurst 256 21.3 947 78.7 78 1281 23 1.8 1304
41 St Vincents Health Bathurst 81 24.0 257 76.0 12 350 13 3.6 363
42 Sydney Town Hall 7 38.9 11 61.1 1 19 1 5.0 20
43 The Lagoon Public 20 16.8 99 83.2 5 124 1 0.8 125
44 The Old School 25 18.8 108 81.2 8 141 8 5.4 149
45 Trunkey Public 10 8.8 104 91.2 3 117 0 0.0 117
46 Vale of Clwydd Hall 184 37.1 312 62.9 38 534 15 2.7 549
47 Wallerawang Public 390 33.9 762 66.1 52 1204 34 2.7 1238
48 Wattle Flat Public 46 20.4 179 79.6 17 242 2 0.8 244
49 Yetholme Hall 34 21.9 121 78.1 8 163 4 2.4 167
50 Zig Zag Public 148 44.8 182 55.2 19 349 11 3.1 360
Ordinary Votes 7901 26.7 21697 73.3 1640 31238 715 2.2 31953
Absent 634 26.7 1740 73.3 263 2637 96 3.5 2733
Declared Institution 94 37.0 160 63.0 25 279 9 3.1 288
Enrolment New 55 23.4 180 76.6 20 255 2 0.8 257
Postal/iVote 604 23.9 1927 76.1 166 2697 17 0.6 2714
Pre-poll 2123 25.5 6190 74.5 338 8651 143 1.6 8794
Provisional/Silent 15 24.6 46 75.4 5 66 1 1.5 67
Declaration Votes 3525 25.6 10243 74.4 817 14585 268 1.8 14853
Grand Total 11426 26.3 31940 73.7 2457 45823 983 2.1 46806
BATHURSTRoll : 49419 (Turnout 94.7%)
Turner Toole
(ALP) (NAT) Informal
20

2011 New South Wales Election
POLLING PLACES Total
Exhst Formal Vote
Votes % Votes % %
1 Aminya 139 21.1 521 78.9 54 714 16 2.2 730
2 Baulkham Hills High 354 25.1 1055 74.9 124 1533 44 2.8 1577
3 Baulkham Hills Nth Public 530 21.3 1958 78.7 299 2787 108 3.7 2895
4 Beaumont Hills Public 14 11.6 107 88.4 7 128 3 2.3 131
5 Crestwood High 790 23.4 2581 76.6 259 3630 113 3.0 3743
6 Crestwood Public 361 21.1 1353 78.9 125 1839 41 2.2 1880
7 Excelsior Public 243 20.5 941 79.5 81 1265 37 2.8 1302
8 Jasper Rd Public 894 22.8 3019 77.2 356 4269 122 2.8 4391
9 Kellyville Public 169 20.9 638 79.1 72 879 34 3.7 913
10 Matthew Pearce Public 492 25.1 1465 74.9 182 2139 68 3.1 2207
11 Model Farms High 368 22.6 1259 77.4 141 1768 50 2.8 1818
12 Muirfield High 253 24.8 769 75.2 68 1090 28 2.5 1118
13 Northmead High 353 27.2 945 72.8 97 1395 39 2.7 1434
14 Northmead Public 733 29.9 1715 70.1 266 2714 92 3.3 2806
15 Nth Rocks Public 450 23.1 1495 76.9 158 2103 53 2.5 2156
16 Sydney Town Hall 11 23.4 36 76.6 12 59 0 0.0 59
17 The Hills Council 25 16.2 129 83.8 11 165 2 1.2 167
18 The Hills School 142 26.6 391 73.4 40 573 18 3.0 591
19 Village Green Comm. Cntr 244 17.6 1141 82.4 94 1479 33 2.2 1512
20 Winston Hghts Public 459 24.7 1398 75.3 207 2064 71 3.3 2135
21 Winston Hills Public 735 24.7 2239 75.3 281 3255 124 3.7 3379
22 Woodberry Village 86 22.3 300 77.7 20 406 13 3.1 419
Ordinary Votes 7845 23.6 25455 76.4 2954 36254 1109 3.0 37363
Absent 1068 25.8 3073 74.2 470 4611 139 2.9 4750
Declared Institution 72 24.7 220 75.3 10 302 3 1.0 305
Enrolment New 29 23.6 94 76.4 19 142 2 1.4 144
Postal/iVote 708 22.0 2512 78.0 229 3449 37 1.1 3486
Pre-poll 405 21.3 1493 78.7 148 2046 35 1.7 2081
Provisional/Silent 34 22.7 116 77.3 23 173 5 2.8 178
Declaration Votes 2316 23.6 7508 76.4 899 10723 221 2.0 10944
Grand Total 10161 23.6 32963 76.4 3853 46977 1330 2.8 48307
BAULKHAM HILLSRoll : 50946 (Turnout 94.8%)
Hay Elliott
(ALP) (LIB) Informal
21

2011 New South Wales Election
POLLING PLACES Total
Exhst Formal Vote
Votes % Votes % %
1 Batemans Bay Comm Cntr 544 32.8 1115 67.2 152 1811 107 5.6 1918
2 Batemans Bay High 376 27.9 972 72.1 125 1473 53 3.5 1526
3 Batemans Bay SLSC 251 27.8 651 72.2 100 1002 20 2.0 1022
4 Bega High 497 32.9 1012 67.1 122 1631 65 3.8 1696
5 Bermagui Comm Cntr 387 34.0 752 66.0 165 1304 40 3.0 1344
6 Bimbimbie 72 22.4 250 77.6 14 336 8 2.3 344
7 Bodalla Public 172 35.7 310 64.3 63 545 15 2.7 560
8 Boomerang Cntr 88 35.9 157 64.1 22 267 15 5.3 282
9 Bridge Club 381 24.9 1147 75.1 92 1620 43 2.6 1663
10 Brogo Hall 73 42.4 99 57.6 22 194 3 1.5 197
11 Broulee Public 310 38.6 494 61.4 91 895 26 2.8 921
12 Candelo Town Hall 174 38.5 278 61.5 48 500 18 3.5 518
13 Central Tilba Hall 94 43.1 124 56.9 60 278 6 2.1 284
14 Cobargo Arts Hall 183 32.3 383 67.7 97 663 27 3.9 690
15 Dalmeny Sport Club 247 33.7 485 66.3 76 808 22 2.7 830
16 Durras Hall 47 32.9 96 67.1 13 156 7 4.3 163
17 Eden Marine High 492 26.2 1386 73.8 112 1990 58 2.8 2048
18 Long Beach RFS 138 28.8 341 71.2 90 569 26 4.4 595
19 Merimbula Public 424 26.1 1203 73.9 184 1811 84 4.4 1895
20 Moruya Public 963 36.8 1656 63.2 350 2969 127 4.1 3096
21 Narooma Sport Cntr 532 33.4 1062 66.6 178 1772 62 3.4 1834
22 Nelligen Hall 43 23.5 140 76.5 29 212 8 3.6 220
23 Pambula Public 410 28.9 1008 71.1 152 1570 43 2.7 1613
24 Quaama Hall 112 43.8 144 56.2 45 301 14 4.4 315
25 St Johns Anglican Bega 267 31.2 590 68.8 89 946 40 4.1 986
26 Sunshine Bay Public 483 30.8 1086 69.2 149 1718 75 4.2 1793
27 Sydney Town Hall 7 25.9 20 74.1 1 28 0 0.0 28
28 Tanja Public 60 55.6 48 44.4 42 150 0 0.0 150
29 Tathra Public 465 38.1 756 61.9 180 1401 40 2.8 1441
30 Tomakin Comm. Cntr 226 38.7 358 61.3 75 659 25 3.7 684
31 Towamba Public 54 46.6 62 53.4 14 130 2 1.5 132
32 Tuross Head Hall 405 36.2 714 63.8 151 1270 37 2.8 1307
33 Wallaga Lake Koori Village 29 93.5 2 6.5 2 33 0 0.0 33
34 Wolumla Hall 99 21.6 359 78.4 44 502 24 4.6 526
35 Wyndham Public 97 42.9 129 57.1 58 284 15 5.0 299
Ordinary Votes 9202 32.2 19389 67.8 3207 31798 1155 3.5 32953
Absent 788 34.3 1509 65.7 338 2635 57 2.1 2692
Declared Institution 80 34.0 155 66.0 20 255 3 1.2 258
Enrolment New 89 38.4 143 61.6 50 282 12 4.1 294
Postal/iVote 567 24.6 1740 75.4 220 2527 29 1.1 2556
Pre-poll 1760 28.7 4376 71.3 563 6699 166 2.4 6865
Provisional/Silent 19 25.0 57 75.0 14 90 4 4.3 94
Declaration Votes 3303 29.3 7980 70.7 1205 12488 271 2.1 12759
Grand Total 12505 31.4 27369 68.6 4412 44286 1426 3.1 45712
BEGARoll : 49678 (Turnout 92.0%)
Atkinson Constance
(ALP) (LIB) Informal
22

2011 New South Wales Election
POLLING PLACES Total
Exhst Formal Vote
Votes % Votes % %
1 Blacktown Boys High 716 53.2 629 46.8 147 1492 73 4.7 1565
2 Blacktown Christian Reformed 714 54.4 599 45.6 107 1420 51 3.5 1471
3 Blacktown Hospital 234 57.5 173 42.5 50 457 18 3.8 475
4 Blacktown Sth Public 1072 53.3 940 46.7 225 2237 122 5.2 2359
5 Blacktown TAFE 218 52.5 197 47.5 32 447 13 2.8 460
6 Blacktown W Public 1520 57.3 1131 42.7 320 2971 169 5.4 3140
7 Doonside High 1924 59.3 1319 40.7 485 3728 187 4.8 3915
8 Doonside Public 966 62.8 572 37.2 248 1786 97 5.2 1883
9 Evans High 1666 54.1 1414 45.9 410 3490 170 4.6 3660
10 Jim Southee Comm. Cntr 28 33.7 55 66.3 14 97 1 1.0 98
11 Kings Park Childcare Cntr 482 39.4 742 60.6 187 1411 69 4.7 1480
12 Marayong Hghts Public 564 55.8 446 44.2 110 1120 54 4.6 1174
13 Marayong Public 962 56.8 733 43.2 298 1993 122 5.8 2115
14 Marayong Sth Public 532 57.1 399 42.9 109 1040 28 2.6 1068
15 Mitchell High 882 50.7 857 49.3 209 1948 110 5.3 2058
16 Quakers Hill Public 656 53.3 574 46.7 187 1417 86 5.7 1503
17 Seven Hills W Public 149 50.7 145 49.3 25 319 6 1.8 325
18 St Andrews College 923 53.5 802 46.5 188 1913 119 5.9 2032
19 St Johns Ambulance Hall 799 46.6 917 53.4 271 1987 114 5.4 2101
20 St Michaels Primary Blacktown 739 54.3 621 45.7 145 1505 86 5.4 1591
21 Sydney Town Hall 23 54.8 19 45.2 7 49 5 9.3 54
Ordinary Votes 15769 54.3 13284 45.7 3774 32827 1700 4.9 34527
Absent 1525 48.7 1607 51.3 704 3836 185 4.6 4021
Declared Institution 12 34.3 23 65.7 7 42 1 2.3 43
Enrolment New 77 57.0 58 43.0 26 161 10 5.8 171
Postal/iVote 1451 51.8 1349 48.2 345 3145 47 1.5 3192
Pre-poll 1887 55.2 1529 44.8 490 3906 122 3.0 4028
Provisional/Silent 75 55.6 60 44.4 21 156 9 5.5 165
Declaration Votes 5027 52.1 4626 47.9 1593 11246 374 3.2 11620
Grand Total 20796 53.7 17910 46.3 5367 44073 2074 4.5 46147
BLACKTOWNRoll : 49412 (Turnout 93.4%)
Robertson Siljeg
(ALP) (LIB) Informal
23

2011 New South Wales Election
POLLING PLACES Total
Exhst Formal Vote
Votes % Votes % %
1 Blackheath Public 867 51.6 812 48.4 359 2038 53 2.5 2091
2 Blaxland E Public 708 38.2 1144 61.8 296 2148 66 3.0 2214
3 Blaxland High 299 42.9 398 57.1 113 810 18 2.2 828
4 Blue Mtns Grammar Prep 271 38.9 426 61.1 96 793 19 2.3 812
5 Ellison Public 739 37.0 1258 63.0 380 2377 69 2.8 2446
6 Hazelbrook Public 840 55.1 685 44.9 283 1808 46 2.5 1854
7 Katoomba High 164 52.7 147 47.3 58 369 18 4.7 387
8 Katoomba Nth Public 573 59.3 394 40.7 186 1153 52 4.3 1205
9 Katoomba Public 458 63.0 269 37.0 136 863 26 2.9 889
10 Leura Public 576 56.2 448 43.8 276 1300 30 2.3 1330
11 Medlow Bath RFS 212 58.7 149 41.3 68 429 11 2.5 440
12 Mid Mountains Comm. Cntr 796 57.0 600 43.0 256 1652 61 3.6 1713
13 Morven Gardens 206 39.3 318 60.7 115 639 7 1.1 646
14 Mt Riverview Public 439 32.4 915 67.6 160 1514 42 2.7 1556
15 Mt Victoria Public 183 48.0 198 52.0 88 469 16 3.3 485
16 Mt Wilson Hall 27 44.3 34 55.7 10 71 0 0.0 71
17 Springwood Civic Cntr 876 44.0 1116 56.0 357 2349 63 2.6 2412
18 Springwood High 735 39.5 1127 60.5 295 2157 59 2.7 2216
19 Springwood Public 420 41.6 589 58.4 178 1187 28 2.3 1215
20 St Canice's Katoomba 634 63.2 369 36.8 278 1281 45 3.4 1326
21 Sydney Town Hall 12 26.1 34 73.9 7 53 1 1.9 54
22 Warrimoo Ctzns Hall 430 45.4 518 54.6 147 1095 23 2.1 1118
23 Wentworth Falls Public 948 46.8 1078 53.2 373 2399 58 2.4 2457
24 Winmalee High 609 32.5 1263 67.5 288 2160 59 2.7 2219
25 Woodford RFS 569 53.4 496 46.6 218 1283 33 2.5 1316
Ordinary Votes 12591 46.0 14785 54.0 5021 32397 903 2.7 33300
Absent 1350 47.8 1473 52.2 701 3524 77 2.1 3601
Declared Institution 31 57.4 23 42.6 16 70 3 4.1 73
Enrolment New 61 54.5 51 45.5 38 150 5 3.2 155
Postal/iVote 1020 38.9 1604 61.1 427 3051 34 1.1 3085
Pre-poll 2003 42.3 2732 57.7 1088 5823 114 1.9 5937
Provisional/Silent 75 45.2 91 54.8 45 211 5 2.3 216
Declaration Votes 4540 43.2 5974 56.8 2315 12829 238 1.8 13067
Grand Total 17144 45.3 20736 54.7 7346 45226 1141 2.5 46367
BLUE MOUNTAINSRoll : 49326 (Turnout 94.0%)
Doyle Sage
(ALP) (LIB) Informal
24

2011 New South Wales Election
POLLING PLACES Total
Exhst Formal Vote
Votes % Votes % %
1 Bendick Murrell Hall 16 12.4 113 87.6 2 131 3 2.2 134
2 Bigga Hall 16 13.3 104 86.7 2 122 5 3.9 127
3 Billimari Hall 25 16.9 123 83.1 4 152 2 1.3 154
4 Binalong Hall 42 15.1 237 84.9 16 295 5 1.7 300
5 Binda Public 44 24.4 136 75.6 2 182 4 2.2 186
6 Bongongo Public 2 4.9 39 95.1 0 41 0 0.0 41
7 Bookham Hall 5 7.2 64 92.8 1 70 0 0.0 70
8 Boorowa Central 167 16.8 826 83.2 45 1038 29 2.7 1067
9 Bowning Hall 35 15.8 187 84.2 16 238 6 2.5 244
10 Bribbaree Hall 7 5.4 122 94.6 5 134 3 2.2 137
11 Caragabal Public 8 6.5 115 93.5 3 126 0 0.0 126
12 Collector Hall 14 9.5 134 90.5 10 158 2 1.2 160
13 Coolac Hall 25 16.0 131 84.0 0 156 2 1.3 158
14 Cootamundra High 204 21.0 766 79.0 25 995 33 3.2 1028
15 Cootamundra Public 353 22.5 1219 77.5 71 1643 34 2.0 1677
16 Cowra Public 357 22.6 1223 77.4 90 1670 51 3.0 1721
17 Cowra Tennis Club 127 13.4 822 86.6 42 991 25 2.5 1016
18 Crookwell Hall 285 18.6 1247 81.4 60 1592 34 2.1 1626
19 Dalton Public 19 10.6 161 89.4 5 185 2 1.1 187
20 E A Southee Public 134 20.6 515 79.4 14 663 18 2.6 681
21 Frogmore Hall 3 4.4 65 95.6 3 71 0 0.0 71
22 Galong Hall 8 9.4 77 90.6 4 89 3 3.3 92
23 Gooloogong War Memorial 18 9.3 175 90.7 6 199 6 2.9 205
24 Grabben Gullen Hall 27 10.4 232 89.6 11 270 3 1.1 273
25 Greenethorpe Hall 15 10.2 132 89.8 8 155 4 2.5 159
26 Grenfell Uniting 210 14.0 1288 86.0 67 1565 37 2.3 1602
27 Gundagai High 267 27.1 719 72.9 34 1020 47 4.4 1067
28 Gundagai S Public 129 32.4 269 67.6 11 409 18 4.2 427
29 Gundaroo Public 134 28.4 338 71.6 78 550 13 2.3 563
30 Gunning Public 89 18.4 396 81.6 21 506 16 3.1 522
31 Illabo Public 21 11.9 155 88.1 2 178 4 2.2 182
32 Jugiong Hall 36 23.4 118 76.6 5 159 5 3.0 164
33 Koorawatha Public 41 23.4 134 76.6 5 180 6 3.2 186
34 Kruger Centre 166 21.3 613 78.7 21 800 26 3.1 826
35 Laggan Public 23 8.6 245 91.4 9 277 3 1.1 280
36 Lyndhurst Public 37 19.0 158 81.0 6 201 4 2.0 205
37 Mandurama Public 33 20.4 129 79.6 9 171 5 2.8 176
38 Milvale Church 3 4.3 66 95.7 0 69 1 1.4 70
39 Monteagle Public 15 11.9 111 88.1 9 135 2 1.5 137
40 Morongla Crk Hall 12 6.0 188 94.0 1 201 2 1.0 203
41 Mulyan Public 247 23.3 811 76.7 59 1117 32 2.8 1149
42 Murringo Public 25 14.7 145 85.3 7 177 3 1.7 180
43 Murrumbateman Rec. Hall 300 23.4 981 76.6 118 1399 32 2.2 1431
44 Murrumburrah Old Court House156 25.2 462 74.8 23 641 12 1.8 653
45 Nangus Public 29 25.4 85 74.6 0 114 3 2.6 117
46 Quandialla Central 12 6.6 171 93.4 4 187 2 1.1 189
47 Reids Flat Public 10 17.5 47 82.5 2 59 4 6.3 63
48 Rye Park Public 17 14.7 99 85.3 4 120 2 1.6 122
49 Stockinbingal Public 49 23.3 161 76.7 5 215 7 3.2 222
50 Sutton Hall 48 26.5 133 73.5 22 203 5 2.4 208
51 Sydney Town Hall 4 13.8 25 86.2 1 30 1 3.2 31
52 Tuena Hall 15 24.2 47 75.8 1 63 0 0.0 63
53 Tumblong Hall 12 8.5 130 91.5 6 148 2 1.3 150
54 Wallendbeen Hall 23 16.0 121 84.0 3 147 1 0.7 148
55 Wattle Park Church 130 19.9 524 80.1 71 725 20 2.7 745
56 Wee Jasper Hall 4 7.4 50 92.6 6 60 0 0.0 60
57 Wombat Hall 51 21.0 192 79.0 4 247 2 0.8 249
58 Woodstock Public 43 14.4 255 85.6 15 313 3 0.9 316
59 Wyangala Dam Public 19 16.4 97 83.6 0 116 3 2.5 119
60 Yass High 142 21.1 530 78.9 34 706 20 2.8 726
61 Yass Mem. Hall 489 21.4 1800 78.6 160 2449 55 2.2 2504
62 Young Nth Public 229 22.7 781 77.3 39 1049 36 3.3 1085
63 Young Public 172 16.8 850 83.2 52 1074 30 2.7 1104
64 Young Town Hall 476 19.4 1978 80.6 95 2549 88 3.3 2637
Ordinary Votes 5874 19.4 24367 80.6 1454 31695 826 2.5 32521
Absent 655 19.2 2761 80.8 237 3653 67 1.8 3720
Declared Institution 96 31.5 209 68.5 16 321 10 3.0 331
Enrolment New 57 18.0 260 82.0 30 347 5 1.4 352
Postal/iVote 347 14.6 2036 85.4 100 2483 21 0.8 2504
Pre-poll 1047 17.5 4919 82.5 271 6237 93 1.5 6330
Provisional/Silent 17 20.5 66 79.5 9 92 3 3.2 95
Declaration Votes 2219 17.8 10251 82.2 663 13133 199 1.5 13332
Grand Total 8093 18.9 34618 81.1 2117 44828 1025 2.2 45853
BURRINJUCKRoll : 48874 (Turnout 93.8%)
Zivadinovic Hodgkinson
(ALP) (NAT) Informal
25

2011 New South Wales Election
POLLING PLACES Total
Exhst Formal Vote
Votes % Votes % %
1 Bonnyrigg High 773 54.4 648 45.6 71 1492 76 4.8 1568
2 Bonnyrigg Public 739 54.1 626 45.9 84 1449 72 4.7 1521
3 Cabramatta Comm. Hall 634 55.1 516 44.9 76 1226 57 4.4 1283
4 Cabramatta High 674 54.4 565 45.6 54 1293 50 3.7 1343
5 Cabramatta Public 951 58.4 677 41.6 104 1732 70 3.9 1802
6 Cabramatta W Public 710 51.3 674 48.7 101 1485 57 3.7 1542
7 Cabramatta/Fairfield PCYC 217 55.9 171 44.1 30 418 22 5.0 440
8 Cabravale Leisure Cntr 123 48.6 130 51.4 15 268 8 2.9 276
9 Canley Hghts Public 1173 57.6 864 42.4 162 2199 92 4.0 2291
10 Canley Vale High 329 49.3 338 50.7 35 702 34 4.6 736
11 Canley Vale Public 1081 60.6 702 39.4 122 1905 78 3.9 1983
12 Harrington St Public 1214 51.7 1136 48.3 152 2502 111 4.2 2613
13 King Park Public 1330 52.4 1210 47.6 227 2767 155 5.3 2922
14 Lansvale E Public 485 44.2 612 55.8 61 1158 47 3.9 1205
15 Lansvale Public 558 55.0 456 45.0 71 1085 41 3.6 1126
16 Mt Pritchard E Public 716 48.5 760 51.5 98 1574 88 5.3 1662
17 Mt Pritchard Hall 139 52.3 127 47.7 20 286 13 4.3 299
18 Mt Pritchard Public 995 45.7 1181 54.3 168 2344 121 4.9 2465
19 Salvo Hall Fairfield West 86 52.4 78 47.6 19 183 22 10.7 205
20 St Johns Park High 52 46.4 60 53.6 30 142 8 5.3 150
21 St Johns Park Public 1163 52.4 1055 47.6 202 2420 120 4.7 2540
22 Sydney Town Hall 13 48.1 14 51.9 3 30 0 0.0 30
Ordinary Votes 14155 52.9 12600 47.1 1905 28660 1342 4.5 30002
Absent 1690 50.8 1636 49.2 395 3721 153 3.9 3874
Declared Institution 28 71.8 11 28.2 6 45 0 0.0 45
Enrolment New 73 47.4 81 52.6 29 183 23 11.2 206
Postal/iVote 1540 46.8 1748 53.2 236 3524 51 1.4 3575
Pre-poll 4124 52.2 3782 47.8 529 8435 259 3.0 8694
Provisional/Silent 95 53.4 83 46.6 20 198 11 5.3 209
Declaration Votes 7550 50.7 7341 49.3 1215 16106 497 3.0 16603
Grand Total 21702 52.1 19934 47.9 3130 44766 1839 3.9 46605
CABRAMATTARoll : 50127 (Turnout 93.0%)
Lalich Le
(ALP) (LIB) Informal
26

2011 New South Wales Election
POLLING PLACES Total
Exhst Formal Vote
Votes % Votes % %
1 Blairmount Public 324 48.8 340 51.2 77 741 55 6.9 796
2 Camden Hospital 60 27.4 159 72.6 7 226 1 0.4 227
3 Camden Public 376 21.2 1397 78.8 88 1861 35 1.8 1896
4 Camden Sth Public 493 26.7 1354 73.3 119 1966 38 1.9 2004
5 Carrington Centennial Care 141 21.7 510 78.3 27 678 4 0.6 682
6 Catherine Field Comm. Hall 175 21.6 635 78.4 41 851 33 3.7 884
7 Claymore Public 473 58.3 338 41.7 91 902 60 6.2 962
8 Cobbitty Public 97 16.2 501 83.8 23 621 15 2.4 636
9 Currans Hill Public 728 36.3 1278 63.7 203 2209 128 5.5 2337
10 Eagle Vale N'hood Cntr 811 47.1 912 52.9 180 1903 103 5.1 2006
11 Elderslie High 338 27.2 903 72.8 87 1328 30 2.2 1358
12 Elizabeth Macarthur High 1038 31.0 2309 69.0 292 3639 141 3.7 3780
13 Eschol Park Public 806 39.5 1235 60.5 228 2269 116 4.9 2385
14 Harrington Park Comm Cntr 301 22.8 1018 77.2 64 1383 47 3.3 1430
15 Harrington Park Public 526 26.0 1494 74.0 130 2150 65 2.9 2215
16 Leppington Public 245 24.9 739 75.1 81 1065 53 4.7 1118
17 Macarthur Pre-School 333 33.1 673 66.9 41 1047 20 1.9 1067
18 Mt Annan High 649 29.6 1544 70.4 175 2368 96 3.9 2464
19 Mt Annan Public 552 28.8 1365 71.2 139 2056 57 2.7 2113
20 Narellan Public 582 28.9 1433 71.1 140 2155 76 3.4 2231
21 Robert Townson Public 1084 38.2 1755 61.8 276 3115 170 5.2 3285
22 Rossmore Public 283 23.0 945 77.0 117 1345 62 4.4 1407
23 St Andrews Comm. Cntr 97 42.9 129 57.1 28 254 24 8.6 278
24 Sydney Town Hall 11 44.0 14 56.0 4 29 11 27.5 40
Ordinary Votes 10523 31.4 22980 68.6 2658 36161 1440 3.8 37601
Absent 1293 35.9 2307 64.1 413 4013 185 4.4 4198
Declared Institution 8 50.0 8 50.0 0 16 0 0.0 16
Enrolment New 87 30.3 200 69.7 42 329 11 3.2 340
Postal/iVote 667 28.6 1662 71.4 162 2491 33 1.3 2524
Pre-poll 660 23.9 2107 76.1 121 2888 46 1.6 2934
Provisional/Silent 41 29.3 99 70.7 11 151 1 0.7 152
Declaration Votes 2756 30.2 6383 69.8 749 9888 276 2.7 10164
Grand Total 13279 31.1 29363 68.9 3407 46049 1716 3.6 47765
CAMDENRoll : 50362 (Turnout 94.8%)
Corrigan Patterson
(ALP) (LIB) Informal
27

2011 New South Wales Election
POLLING PLACES Total
Exhst Formal Vote
Votes % Votes % %
1 Airds High 522 68.8 237 31.2 63 822 52 5.9 874
2 Blairmount Public 186 50.1 185 49.9 39 410 20 4.7 430
3 Bradbury Public 615 43.2 809 56.8 162 1586 89 5.3 1675
4 Campbellfield Public 621 53.9 531 46.1 95 1247 86 6.5 1333
5 Campbelltown E Public 868 45.9 1022 54.1 230 2120 150 6.6 2270
6 Campbelltown High 292 47.4 324 52.6 56 672 33 4.7 705
7 Campbelltown Public 741 48.8 778 51.2 156 1675 72 4.1 1747
8 Ingleburn High 541 41.3 769 58.7 114 1424 61 4.1 1485
9 Ingleburn Public 1402 50.3 1385 49.7 277 3064 157 4.9 3221
10 John Warby Public 377 74.8 127 25.2 41 545 46 7.8 591
11 Kentlyn Public 269 32.8 552 67.2 85 906 40 4.2 946
12 Leumeah Public 651 41.7 911 58.3 192 1754 67 3.7 1821
13 Leumeah Salvo Hall 691 51.5 651 48.5 136 1478 74 4.8 1552
14 Macquarie Fields Public 90 42.9 120 57.1 20 230 11 4.6 241
15 Minto Public 1003 52.8 896 47.2 172 2071 77 3.6 2148
16 Ruse Public 969 43.5 1261 56.5 277 2507 99 3.8 2606
17 Sackville St Public 893 44.3 1123 55.7 195 2211 88 3.8 2299
18 St Andrews Comm. Cntr 530 46.9 600 53.1 103 1233 74 5.7 1307
19 St Andrews Primary 1061 49.4 1088 50.6 260 2409 102 4.1 2511
20 Sydney Town Hall 19 52.8 17 47.2 6 42 5 10.6 47
21 The Grange Public 579 52.4 525 47.6 120 1224 82 6.3 1306
22 Wedderburn Resource Cntr 54 18.9 231 81.1 29 314 15 4.6 329
23 Woodbine Comm. Cntr 782 41.7 1093 58.3 156 2031 105 4.9 2136
Ordinary Votes 13756 47.4 15235 52.6 2984 31975 1605 4.8 33580
Absent 1348 44.9 1655 55.1 461 3464 142 3.9 3606
Declared Institution 10 55.6 8 44.4 0 18 2 10.0 20
Enrolment New 101 51.5 95 48.5 33 229 5 2.1 234
Postal/iVote 871 41.5 1230 58.5 207 2308 31 1.3 2339
Pre-poll 913 42.3 1244 57.7 166 2323 68 2.8 2391
Provisional/Silent 47 52.2 43 47.8 12 102 1 1.0 103
Declaration Votes 3290 43.5 4275 56.5 879 8444 249 2.9 8693
Grand Total 17048 46.6 19510 53.4 3861 40419 1854 4.4 42273
CAMPBELLTOWNRoll : 45458 (Turnout 93.0%)
Bleasdale Doyle
(ALP) (LIB) Informal
28

2011 New South Wales Election
POLLING PLACES Total
Exhst Formal Vote
Votes % Votes % %
1 Ashbury Public 1150 55.8 911 44.2 168 2229 95 4.1 2324
2 Ashfield Boys High 275 56.9 208 43.1 59 542 29 5.1 571
3 Ashfield Presbyterian 227 59.7 153 40.3 57 437 29 6.2 466
4 Belfield Korean Church 523 43.9 668 56.1 74 1265 60 4.5 1325
5 Belmore Nth Public 166 54.2 140 45.8 26 332 25 7.0 357
6 Campsie Baptist 727 60.6 473 39.4 70 1270 56 4.2 1326
7 Campsie Public 1442 65.3 765 34.7 125 2332 132 5.4 2464
8 Canterbury Public 906 65.1 486 34.9 137 1529 83 5.1 1612
9 Canterbury Sth Public 872 64.9 471 35.1 76 1419 81 5.4 1500
10 Canterbury Uniting 355 62.2 216 37.8 21 592 44 6.9 636
11 Cass Activity Cntr 410 57.0 309 43.0 36 755 40 5.0 795
12 Clemton Park Public 619 59.1 429 40.9 66 1114 63 5.4 1177
13 Croydon Park Public 895 56.7 683 43.3 155 1733 94 5.1 1827
14 Dulwich High 180 73.8 64 26.2 30 274 7 2.5 281
15 Dulwich Hill Public 558 74.6 190 25.4 121 869 20 2.2 889
16 Earlwood Church of Christ 813 53.2 716 46.8 90 1619 72 4.3 1691
17 Earlwood Public 1271 56.4 982 43.6 157 2410 129 5.1 2539
18 Earlwood Uniting 453 53.4 396 46.6 74 923 38 4.0 961
19 Harcourt Public 1661 58.2 1192 41.8 171 3024 179 5.6 3203
20 Lewisham Public 63 58.9 44 41.1 15 122 1 0.8 123
21 Marrickville W Public 90 71.4 36 28.6 19 145 11 7.1 156
22 Our Lady Of Lourdes Hall Earlwood710 53.2 625 46.8 88 1423 66 4.4 1489
23 St Andrews Summer Hill 645 57.4 478 42.6 186 1309 45 3.3 1354
24 St Stephanos 1306 68.2 610 31.8 167 2083 108 4.9 2191
25 Summer Hill Public 922 65.8 479 34.2 173 1574 43 2.7 1617
26 Sydney Town Hall 68 61.3 43 38.7 11 122 3 2.4 125
27 Undercliffe Public 858 53.3 751 46.7 175 1784 77 4.1 1861
28 Yeo Park Infants 950 56.9 721 43.1 166 1837 65 3.4 1902
Ordinary Votes 19115 59.1 13239 40.9 2713 35067 1695 4.6 36762
Absent 2714 56.2 2115 43.8 595 5424 168 3.0 5592
Declared Institution 72 47.4 80 52.6 5 157 2 1.3 159
Enrolment New 95 58.3 68 41.7 22 185 6 3.1 191
Postal/iVote 1598 55.9 1259 44.1 233 3090 23 0.7 3113
Pre-poll 711 56.1 556 43.9 79 1346 34 2.5 1380
Provisional/Silent 71 63.4 41 36.6 10 122 4 3.2 126
Declaration Votes 5261 56.1 4119 43.9 944 10324 237 2.2 10561
Grand Total 24356 58.3 17393 41.7 3642 45391 1932 4.1 47323
CANTERBURYRoll : 51501 (Turnout 91.9%)
Burney Nam
(ALP) (LIB) Informal
29

2011 New South Wales Election
POLLING PLACES Total
Exhst Formal Vote
Votes % Votes % %
1 Baulkham Hills Nth Public 53 20.5 205 79.5 28 286 8 2.7 294
2 Carlingford Public 158 42.5 214 57.5 54 426 17 3.8 443
3 Castle Hill High 301 16.0 1584 84.0 211 2096 89 4.1 2185
4 Castle Hill House 266 16.6 1333 83.4 148 1747 52 2.9 1799
5 Castle Hill Public 555 17.6 2596 82.4 402 3553 83 2.3 3636
6 Cherrybrook Public 306 18.2 1376 81.8 181 1863 56 2.9 1919
7 Community of Christ W Pennant Hills320 17.7 1486 82.3 164 1970 39 1.9 2009
8 Cumberland High 544 34.2 1045 65.8 174 1763 90 4.9 1853
9 Eurambie Park Child Care 306 13.8 1904 86.2 166 2376 78 3.2 2454
10 Excelsior Public 125 18.7 543 81.3 80 748 18 2.3 766
11 Hopetoun Village 66 15.5 360 84.5 30 456 14 3.0 470
12 Mowll Village 47 11.6 359 88.4 19 425 8 1.8 433
13 Murray Farm Public 660 23.8 2110 76.2 314 3084 121 3.8 3205
14 Nth Rocks Child Care 499 25.9 1426 74.1 199 2124 79 3.6 2203
15 Nth Rocks Public 207 24.5 639 75.5 110 956 33 3.3 989
16 Oakhill Dr Public 516 19.2 2175 80.8 285 2976 91 3.0 3067
17 Samuel Gilbert Public 376 13.9 2336 86.1 256 2968 89 2.9 3057
18 Sherwood Ridge Public 159 16.8 785 83.2 82 1026 41 3.8 1067
19 Sydney Town Hall 24 38.7 38 61.3 8 70 4 5.4 74
20 The Hills Council 285 18.2 1284 81.8 178 1747 60 3.3 1807
21 W Pennant Hills Public 229 17.7 1065 82.3 166 1460 46 3.1 1506
22 Wrights Rd Comm. Cntr 136 13.7 856 86.3 88 1080 21 1.9 1101
Ordinary Votes 6138 19.3 25719 80.7 3343 35200 1137 3.1 36337
Absent 1012 21.9 3607 78.1 714 5333 149 2.7 5482
Declared Institution 25 23.6 81 76.4 9 115 5 4.2 120
Enrolment New 39 18.7 170 81.3 38 247 11 4.3 258
Postal/iVote 592 17.4 2812 82.6 347 3751 57 1.5 3808
Pre-poll 327 14.7 1895 85.3 210 2432 44 1.8 2476
Provisional/Silent 30 18.0 137 82.0 27 194 11 5.4 205
Declaration Votes 2025 18.9 8702 81.1 1345 12072 277 2.2 12349
Grand Total 8163 19.2 34421 80.8 4688 47272 1414 2.9 48686
CASTLE HILLRoll : 51963 (Turnout 93.7%)
Tracey Perrottet
(ALP) (LIB) Informal
30

2011 New South Wales Election
POLLING PLACES Total
Exhst Formal Vote
Votes % Votes % %
1 Abermain Hall 556 60.1 369 39.9 307 1232 62 4.8 1294
2 Barnsley Public 393 56.1 308 43.9 316 1017 82 7.5 1099
3 Bellbird Public 462 56.0 363 44.0 241 1066 41 3.7 1107
4 Beresfield Public 753 56.3 585 43.7 486 1824 128 6.6 1952
5 Black Hill Public 57 24.3 178 75.7 75 310 9 2.8 319
6 Branxton Hall 748 49.6 760 50.4 377 1885 86 4.4 1971
7 Cessnock E Public 323 58.5 229 41.5 154 706 28 3.8 734
8 Cessnock High 703 57.6 518 42.4 392 1613 81 4.8 1694
9 Cessnock Scout Hall 385 59.7 260 40.3 213 858 38 4.2 896
10 Cessnock W Public 831 57.1 624 42.9 449 1904 101 5.0 2005
11 Edgeworth N'hood Cntr 1156 55.7 920 44.3 805 2881 243 7.8 3124
12 Ellalong Public 155 42.7 208 57.3 123 486 16 3.2 502
13 Greta Hall 506 54.1 429 45.9 299 1234 64 4.9 1298
14 Hawkins Ret. Village 471 51.9 436 48.1 314 1221 63 4.9 1284
15 Hunter Life Ed. Cntr 503 56.1 393 43.9 336 1232 90 6.8 1322
16 Kearsley Public 207 46.6 237 53.4 146 590 32 5.1 622
17 Kirkton Public 61 37.2 103 62.8 50 214 2 0.9 216
18 Kitchener Public 156 48.6 165 51.4 92 413 7 1.7 420
19 Kurri Kurri Comm. Cntr 641 59.0 446 41.0 364 1451 100 6.4 1551
20 Kurri Kurri Guide Hall 860 56.6 660 43.4 486 2006 120 5.6 2126
21 Millfield Public 119 39.0 186 61.0 111 416 19 4.4 435
22 Minmi Hall 171 53.4 149 46.6 134 454 34 7.0 488
23 Mt View High 182 50.3 180 49.7 86 448 10 2.2 458
24 Mulbring Public 169 39.8 256 60.2 184 609 14 2.2 623
25 Neath RFS 132 52.6 119 47.4 92 343 9 2.6 352
26 Nth Cessnock Comm. Hall 422 56.3 327 43.7 173 922 28 2.9 950
27 Nulkaba Public 165 36.6 286 63.4 118 569 11 1.9 580
28 Paxton Public 161 48.5 171 51.5 115 447 11 2.4 458
29 Pelaw Main Public 262 59.0 182 41.0 159 603 35 5.5 638
30 Pokolbin RFS 59 28.6 147 71.4 37 243 3 1.2 246
31 Stanford Merthyr Infants 391 55.9 308 44.1 217 916 45 4.7 961
32 Sydney Town Hall 6 54.5 5 45.5 6 17 3 15.0 20
33 Tarro Public 294 55.8 233 44.2 203 730 31 4.1 761
34 W Wallsend High 740 60.5 484 39.5 507 1731 152 8.1 1883
35 Weston Civic Cntr 870 63.2 507 36.8 543 1920 120 5.9 2040
36 Wollombi Public 41 40.2 61 59.8 55 157 0 0.0 157
Ordinary Votes 14111 54.5 11792 45.5 8765 34668 1918 5.2 36586
Absent 1330 53.8 1140 46.2 954 3424 150 4.2 3574
Declared Institution 81 61.8 50 38.2 26 157 3 1.9 160
Enrolment New 129 58.4 92 41.6 100 321 14 4.2 335
Postal/iVote 1221 52.7 1095 47.3 631 2947 41 1.4 2988
Pre-poll 1756 54.3 1478 45.7 962 4196 111 2.6 4307
Provisional/Silent 56 57.1 42 42.9 42 140 3 2.1 143
Declaration Votes 4573 54.0 3897 46.0 2715 11185 322 2.8 11507
Grand Total 18679 54.4 15687 45.6 11487 45853 2240 4.7 48093
CESSNOCKRoll : 51035 (Turnout 94.2%)
Barr Davey
(ALP) (NAT) Informal
31

2011 New South Wales Election
POLLING PLACES Total
Exhst Formal Vote
Votes % Votes % %
1 Adamstown Snr Ctzn Cntr 116 34.6 219 65.4 88 423 18 4.1 441
2 Cardiff Public 216 42.9 288 57.1 87 591 48 7.5 639
3 Cardiff Snr Ctzns Cntr 92 47.9 100 52.1 17 209 7 3.2 216
4 Cardiff Sth Public 546 39.1 851 60.9 211 1608 80 4.7 1688
5 Charlestown E Public 542 42.6 729 57.4 262 1533 45 2.9 1578
6 Charlestown Public 744 40.0 1114 60.0 312 2170 85 3.8 2255
7 Charlestown Sth Public 416 40.6 608 59.4 206 1230 36 2.8 1266
8 Dudley Pensioners Hall 392 35.8 704 64.2 228 1324 44 3.2 1368
9 Eleebana Public 767 27.9 1980 72.1 417 3164 92 2.8 3256
10 Floraville Public 129 36.8 222 63.2 73 424 21 4.7 445
11 Garden Suburb Public 315 28.5 789 71.5 183 1287 30 2.3 1317
12 Gateshead Public 366 50.2 363 49.8 206 935 34 3.5 969
13 Gateshead W Public 524 67.5 252 32.5 182 958 58 5.7 1016
14 Hillsborough Public 508 37.0 866 63.0 253 1627 67 4.0 1694
15 Kahibah Public 610 40.1 911 59.9 300 1821 68 3.6 1889
16 Kotara High 580 30.5 1319 69.5 282 2181 59 2.6 2240
17 Kotara Park Hall 159 39.1 248 60.9 60 467 12 2.5 479
18 Kotara Sth Public 518 34.9 965 65.1 223 1706 58 3.3 1764
19 Lakelands Hall 81 45.3 98 54.7 31 210 13 5.8 223
20 Mt Hutton Public 735 42.7 988 57.3 348 2071 90 4.2 2161
21 St Columba's Adamstown 369 39.0 578 61.0 189 1136 44 3.7 1180
22 Sydney Town Hall 8 42.1 11 57.9 9 28 0 0.0 28
23 Warners Bay High 749 40.0 1124 60.0 373 2246 89 3.8 2335
24 Warners Bay Public 337 40.0 505 60.0 120 962 36 3.6 998
25 Whitebridge High 383 38.6 608 61.4 235 1226 54 4.2 1280
26 Windale Comm. Cntr 1031 67.3 502 32.7 301 1834 115 5.9 1949
Ordinary Votes 11233 39.9 16942 60.1 5196 33371 1303 3.8 34674
Absent 1164 42.7 1564 57.3 963 3691 143 3.7 3834
Declared Institution 18 58.1 13 41.9 3 34 2 5.6 36
Enrolment New 89 46.6 102 53.4 11 202 26 11.4 228
Postal/iVote 1387 43.5 1800 56.5 485 3672 36 1.0 3708
Pre-poll 706 34.5 1342 65.5 369 2417 61 2.5 2478
Provisional/Silent 64 40.8 93 59.2 8 165 4 2.4 169
Declaration Votes 3428 41.1 4914 58.9 1839 10181 272 2.6 10453
Grand Total 14661 40.1 21856 59.9 7035 43552 1575 3.5 45127
CHARLESTOWNRoll : 47804 (Turnout 94.4%)
Morris Cornwell
(ALP) (LIB) Informal
32

2011 New South Wales Election
POLLING PLACES Total
Exhst Formal Vote
Votes % Votes % %
1 Baryulgil Public 6 17.6 28 82.4 1 35 0 0.0 35
2 Broadwater Hall 43 14.9 245 85.1 37 325 11 3.3 336
3 Casino Civic Hall 449 20.1 1789 79.9 285 2523 103 3.9 2626
4 Casino High 116 22.7 395 77.3 97 608 12 1.9 620
5 Casino Hospital 25 12.8 170 87.2 18 213 9 4.1 222
6 Casino W Public 138 18.8 595 81.2 94 827 28 3.3 855
7 Chatsworth Island Public 48 15.3 265 84.7 36 349 5 1.4 354
8 Clarence Village Hall 218 15.0 1236 85.0 287 1741 41 2.3 1782
9 Copmanhurst Hall 42 15.5 229 84.5 64 335 5 1.5 340
10 Coraki Public 114 15.8 607 84.2 110 831 26 3.0 857
11 Corindi Public 183 28.1 469 71.9 101 753 26 3.3 779
12 Coutts Crossing Hall 86 16.5 436 83.5 211 733 15 2.0 748
13 Cowper Public 55 19.2 232 80.8 30 317 6 1.9 323
14 Dundurrabin Public 46 39.7 70 60.3 36 152 2 1.3 154
15 Evans Rv School 355 25.6 1030 74.4 184 1569 52 3.2 1621
16 Glenreagh Arts Hall 95 22.0 337 78.0 79 511 20 3.8 531
17 Grafton Comm. Cntr 175 15.2 979 84.8 252 1406 29 2.0 1435
18 Grafton High 281 18.7 1222 81.3 344 1847 41 2.2 1888
19 Grafton Hospital 44 20.0 176 80.0 74 294 5 1.7 299
20 Grafton Scout Hall 80 13.2 527 86.8 136 743 13 1.7 756
21 Gulmarrad Public 88 12.6 610 87.4 115 813 15 1.8 828
22 Harwood Is. Public 58 19.9 234 80.1 44 336 8 2.3 344
23 Iluka Hall 158 17.8 731 82.2 129 1018 9 0.9 1027
24 Junction Hill SES 78 12.4 552 87.6 142 772 7 0.9 779
25 Lawrence Public 91 17.7 423 82.3 78 592 12 2.0 604
26 Maclean Civic Cntr 224 20.6 862 79.4 135 1221 19 1.5 1240
27 Maclean Hospital 73 18.1 330 81.9 61 464 3 0.6 467
28 Nymboida Public 37 31.1 82 68.9 31 150 2 1.3 152
29 Palmers Is. Public 89 17.5 419 82.5 67 575 12 2.0 587
30 Rappville Hall 16 14.3 96 85.7 14 126 5 3.8 131
31 Red Rock Multi-Use Cntr 49 36.6 85 63.4 24 158 1 0.6 159
32 St Josephs Primary Sth Grafton108 17.3 515 82.7 128 751 17 2.2 768
33 St Michaels Cntr 154 16.0 808 84.0 123 1085 27 2.4 1112
34 St Stephens Presb. Sth Grafton234 16.8 1158 83.2 261 1653 40 2.4 1693
35 Sth Grafton Public 350 19.7 1425 80.3 444 2219 45 2.0 2264
36 Sydney Town Hall 3 33.3 6 66.7 1 10 0 0.0 10
37 Treelands Dr Comm. Cntr 252 17.1 1218 82.9 218 1688 29 1.7 1717
38 Tucabia Hall 59 19.9 237 80.1 45 341 3 0.9 344
39 Ulmarra Public 73 13.1 484 86.9 95 652 13 2.0 665
40 Whiporie Hall 14 22.2 49 77.8 22 85 5 5.6 90
41 Woodburn CWA 143 22.0 508 78.0 102 753 13 1.7 766
42 Wooli Hall 86 21.2 320 78.8 49 455 6 1.3 461
43 Woombah RFS 73 19.2 307 80.8 83 463 10 2.1 473
44 Yamba Public 270 21.2 1006 78.8 237 1513 20 1.3 1533
Ordinary Votes 5379 18.6 23502 81.4 5124 34005 770 2.2 34775
Absent 500 25.2 1488 74.8 421 2409 71 2.9 2480
Declared Institution 45 20.8 171 79.2 65 281 2 0.7 283
Enrolment New 58 28.9 143 71.1 43 244 4 1.6 248
Postal/iVote 372 18.1 1684 81.9 303 2359 28 1.2 2387
Pre-poll 855 15.7 4590 84.3 928 6373 83 1.3 6456
Provisional/Silent 28 37.3 47 62.7 10 85 3 3.4 88
Declaration Votes 1858 18.6 8123 81.4 1770 11751 191 1.6 11942
Grand Total 7237 18.6 31625 81.4 6894 45756 961 2.1 46717
CLARENCE (2-Party Preferred)Roll : 50358 (Turnout 92.8%)
Clague Cansdell
(ALP) (NAT) Informal
33

2011 New South Wales Election
POLLING PLACES Total
Exhst Formal Vote
Votes % Votes % %
1 Boambee Public 263 18.1 1188 81.9 142 1593 41 2.5 1634
2 Bonville Hall 182 20.6 703 79.4 62 947 17 1.8 964
3 Cavanbah Hall 410 21.6 1490 78.4 179 2079 60 2.8 2139
4 Coffs Exhibition Halls 340 22.4 1180 77.6 136 1656 32 1.9 1688
5 Coffs Harbour High 378 23.3 1242 76.7 182 1802 65 3.5 1867
6 Coffs Harbour Hospital 97 27.2 260 72.8 50 407 6 1.5 413
7 Coffs Harbour Public 148 23.2 491 76.8 56 695 21 2.9 716
8 Coramba Public 70 22.1 247 77.9 21 338 5 1.5 343
9 Karangi Public 73 17.5 345 82.5 33 451 8 1.7 459
10 Kororo Public 402 19.6 1645 80.4 180 2227 36 1.6 2263
11 Lowanna Public 38 27.5 100 72.5 13 151 1 0.7 152
12 Mullaway Public 330 31.9 704 68.1 126 1160 50 4.1 1210
13 Mylestom Hall 146 31.1 323 68.9 46 515 13 2.5 528
14 Nana Glen Public 155 25.1 463 74.9 52 670 25 3.6 695
15 Narranga Public 460 19.7 1871 80.3 186 2517 83 3.2 2600
16 Raleigh Public 66 29.3 159 70.7 36 261 3 1.1 264
17 Sandy Beach Public 444 26.0 1265 74.0 187 1896 58 3.0 1954
18 Sawtell Public 407 27.1 1097 72.9 159 1663 44 2.6 1707
19 Sydney Town Hall 4 20.0 16 80.0 2 22 1 4.3 23
20 Toormina High 506 23.5 1646 76.5 145 2297 68 2.9 2365
21 Tyalla Public 621 21.9 2220 78.1 225 3066 89 2.8 3155
22 Ulong Public 26 29.5 62 70.5 8 96 1 1.0 97
23 Upper Orara Public 82 32.3 172 67.7 34 288 12 4.0 300
24 Urunga Public 374 25.3 1107 74.7 134 1615 41 2.5 1656
25 William Bayldon Public 621 25.0 1866 75.0 180 2667 80 2.9 2747
26 Woolgoolga Public 647 27.0 1745 73.0 196 2588 94 3.5 2682
Ordinary Votes 7290 23.6 23607 76.4 2770 33667 954 2.8 34621
Absent 621 23.0 2084 77.0 369 3074 73 2.3 3147
Declared Institution 77 21.6 279 78.4 26 382 4 1.0 386
Enrolment New 76 23.1 253 76.9 45 374 11 2.9 385
Postal/iVote 492 20.7 1880 79.3 196 2568 25 1.0 2593
Pre-poll 849 18.3 3802 81.7 314 4965 73 1.4 5038
Provisional/Silent 16 23.9 51 76.1 8 75 0 0.0 75
Declaration Votes 2131 20.3 8349 79.7 958 11438 186 1.6 11624
Grand Total 9421 22.8 31956 77.2 3728 45105 1140 2.5 46245
COFFS HARBOURRoll : 50671 (Turnout 91.3%)
Quinn Fraser
(ALP) (NAT) Informal
34

2011 New South Wales Election
POLLING PLACES Total
Exhst Formal Vote
Votes % Votes % %
1 Bondi Beach Public 70 35.2 129 64.8 28 227 6 2.6 233
2 Bondi Presbyterian 95 39.6 145 60.4 30 270 6 2.2 276
3 Bondi Public 276 43.1 365 56.9 95 736 26 3.4 762
4 Bronte Public 786 46.8 894 53.2 159 1839 43 2.3 1882
5 Claremont College 551 43.4 719 56.6 171 1441 46 3.1 1487
6 Clovelly Public 619 43.4 806 56.6 164 1589 44 2.7 1633
7 Clovelly SLSC 502 47.0 566 53.0 148 1216 27 2.2 1243
8 Coogee Snr Ctzns Hall 837 43.8 1074 56.2 257 2168 54 2.4 2222
9 Kensington Public 307 43.4 401 56.6 92 800 21 2.6 821
10 Prince of Wales 121 54.8 100 45.2 24 245 4 1.6 249
11 Rainbow St Public 418 44.7 517 55.3 130 1065 37 3.4 1102
12 Randwick Girls 505 40.5 741 59.5 148 1394 65 4.5 1459
13 Randwick Literary Inst. 938 40.2 1395 59.8 258 2591 71 2.7 2662
14 Randwick Presbyterian 794 47.3 884 52.7 249 1927 43 2.2 1970
15 Randwick Public 661 44.1 837 55.9 212 1710 38 2.2 1748
16 Randwick Town Hall 480 43.5 624 56.5 121 1225 37 2.9 1262
17 St Brigids Primary Coogee 377 45.1 459 54.9 107 943 21 2.2 964
18 St Clares Cllg 208 40.6 304 59.4 35 547 13 2.3 560
19 St Lukes Clovelly 694 43.3 908 56.7 171 1773 35 1.9 1808
20 St Nicholas Coogee 687 43.4 896 56.6 208 1791 37 2.0 1828
21 Sydney Town Hall 50 52.1 46 47.9 28 124 3 2.4 127
22 Waverley College 312 42.0 430 58.0 88 830 18 2.1 848
23 Waverley Comm. Cntr 702 38.6 1119 61.4 191 2012 78 3.7 2090
24 Waverley Public 650 41.9 900 58.1 220 1770 40 2.2 1810
Ordinary Votes 11640 43.3 15259 56.7 3334 30233 813 2.6 31046
Absent 1873 39.6 2857 60.4 1081 5811 130 2.2 5941
Declared Institution 66 34.7 124 65.3 10 200 5 2.4 205
Enrolment New 82 35.8 147 64.2 68 297 6 2.0 303
Postal/iVote 1350 36.1 2394 63.9 455 4199 44 1.0 4243
Pre-poll 684 37.7 1129 62.3 183 1996 35 1.7 2031
Provisional/Silent 67 46.5 77 53.5 26 170 2 1.2 172
Declaration Votes 4122 38.0 6728 62.0 1823 12673 222 1.7 12895
Grand Total 15762 41.8 21987 58.2 5157 42906 1035 2.4 43941
COOGEERoll : 49131 (Turnout 89.4%)
Pearce Notley-Smith
(ALP) (LIB) Informal
35

2011 New South Wales Election
POLLING PLACES Total
Exhst Formal Vote
Votes % Votes % %
1 Burraneer Bay Public 555 18.6 2429 81.4 186 3170 75 2.3 3245
2 Caringbah High 559 30.7 1261 69.3 206 2026 94 4.4 2120
3 Caringbah Public 632 22.3 2204 77.7 210 3046 77 2.5 3123
4 Cronulla High 331 29.1 808 70.9 111 1250 38 3.0 1288
5 Cronulla Public 411 22.5 1419 77.5 140 1970 65 3.2 2035
6 Cronulla Sth Public 561 24.5 1731 75.5 202 2494 61 2.4 2555
7 Cronulla Uniting 451 35.4 824 64.6 179 1454 46 3.1 1500
8 Frank Vickery Village 95 27.8 247 72.2 24 366 14 3.7 380
9 Kurnell Public 327 31.0 729 69.0 101 1157 57 4.7 1214
10 Laguna St Public 470 25.8 1353 74.2 159 1982 40 2.0 2022
11 Lilli Pilli Guide Hall 315 18.7 1371 81.3 130 1816 46 2.5 1862
12 Miranda Nth Public 430 27.2 1148 72.8 132 1710 62 3.5 1772
13 Port Hacking Comm. Cntr 54 15.1 304 84.9 22 380 4 1.0 384
14 Port Hacking High 85 35.6 154 64.4 23 262 20 7.1 282
15 St Phillips Anglican 320 26.3 897 73.7 95 1312 37 2.7 1349
16 Sutherland Hospital Clinics 114 30.5 260 69.5 22 396 27 6.4 423
17 Sydney Town Hall 16 36.4 28 63.6 3 47 5 9.6 52
18 Sylvania Hghts Public 84 30.4 192 69.6 29 305 10 3.2 315
19 Sylvania Public 269 19.3 1126 80.7 111 1506 64 4.1 1570
20 Taren Pt Public 298 19.1 1263 80.9 101 1662 54 3.1 1716
21 Thornton Hall 376 26.0 1068 74.0 129 1573 27 1.7 1600
22 Woolooware Public 505 28.0 1296 72.0 194 1995 77 3.7 2072
23 Yowie Bay Public 249 17.1 1210 82.9 105 1564 35 2.2 1599
Ordinary Votes 7507 24.4 23322 75.6 2614 33443 1035 3.0 34478
Absent 1134 27.0 3068 73.0 579 4781 122 2.5 4903
Declared Institution 36 26.9 98 73.1 8 142 4 2.7 146
Enrolment New 63 39.4 97 60.6 29 189 6 3.1 195
Postal/iVote 656 21.9 2333 78.1 179 3168 50 1.6 3218
Pre-poll 732 23.8 2345 76.2 215 3292 67 2.0 3359
Provisional/Silent 29 19.6 119 80.4 11 159 7 4.2 166
Declaration Votes 2650 24.7 8060 75.3 1021 11731 256 2.1 11987
Grand Total 10157 24.5 31382 75.5 3635 45174 1291 2.8 46465
CRONULLARoll : 49825 (Turnout 93.3%)
Jones Speakman
(ALP) (LIB) Informal
36

2011 New South Wales Election
POLLING PLACES Total
Exhst Formal Vote
Votes % Votes % %
1 Belrose Public 277 14.4 1648 85.6 178 2103 62 2.9 2165
2 Castle Cove Public 14 12.5 98 87.5 16 128 1 0.8 129
3 Forestville Public 340 20.9 1285 79.1 195 1820 57 3.0 1877
4 Frenchs Forest Public 216 18.9 926 81.1 177 1319 31 2.3 1350
5 Gordon E Public 246 14.4 1460 85.6 235 1941 50 2.5 1991
6 Kambora Public 98 13.3 640 86.7 78 816 16 1.9 832
7 Killara High 233 15.8 1245 84.2 203 1681 40 2.3 1721
8 Ku-ring-gai Council 100 14.9 569 85.1 92 761 17 2.2 778
9 Lindfield E Public 236 13.4 1519 86.6 198 1953 39 2.0 1992
10 Mimosa Public 296 15.4 1632 84.6 217 2145 41 1.9 2186
11 OLGC School 32 17.9 147 82.1 17 196 6 3.0 202
12 Pymble Public 189 9.8 1730 90.2 163 2082 30 1.4 2112
13 Roseville Chase Comm. Hall 115 14.7 668 85.3 90 873 17 1.9 890
14 Roseville Public 137 14.5 811 85.5 98 1046 21 2.0 1067
15 Roseville Uniting 91 12.1 664 87.9 67 822 14 1.7 836
16 Sacred Heart Pymble 41 10.1 365 89.9 37 443 11 2.4 454
17 St Alban's Church 174 12.6 1211 87.4 149 1534 25 1.6 1559
18 St Ives Comm. Access Service 36 10.4 309 89.6 26 371 7 1.9 378
19 St Ives Comm. Hall 192 12.0 1402 88.0 121 1715 29 1.7 1744
20 St Ives High 261 13.1 1733 86.9 207 2201 41 1.8 2242
21 St Ives Nth Public 201 9.5 1916 90.5 208 2325 81 3.4 2406
22 St Ives Nth Scout Hall 115 13.0 768 87.0 77 960 14 1.4 974
23 St Ives Park Public 153 8.6 1633 91.4 145 1931 54 2.7 1985
24 St Martins Killara 83 8.9 849 91.1 82 1014 21 2.0 1035
25 Sydney Town Hall 11 21.6 40 78.4 11 62 2 3.1 64
26 Wakehurst Public 322 16.7 1604 83.3 207 2133 56 2.6 2189
Ordinary Votes 4209 13.5 26872 86.5 3294 34375 783 2.2 35158
Absent 674 15.3 3727 84.7 629 5030 77 1.5 5107
Declared Institution 55 9.6 515 90.4 43 613 6 1.0 619
Enrolment New 19 14.3 114 85.7 26 159 3 1.9 162
Postal/iVote 414 12.6 2870 87.4 270 3554 54 1.5 3608
Pre-poll 73 10.2 645 89.8 47 765 11 1.4 776
Provisional/Silent 12 11.1 96 88.9 10 118 2 1.7 120
Declaration Votes 1247 13.5 7967 86.5 1025 10239 153 1.5 10392
Grand Total 5456 13.5 34839 86.5 4319 44614 936 2.1 45550
DAVIDSON (2-Party Preferred)Roll : 49043 (Turnout 92.9%)
Gilliland O'Dea
(ALP) (LIB) Informal
37

2011 New South Wales Election
POLLING PLACES Total
Exhst Formal Vote
Votes % Votes % %
1 Abbotsford Public 940 31.5 2043 68.5 340 3323 89 2.6 3412
2 All Hallows Hall 376 33.1 760 66.9 78 1214 26 2.1 1240
3 Canada Bay Civic Hall 662 28.6 1650 71.4 253 2565 65 2.5 2630
4 Concord Hospital 24 39.3 37 60.7 11 72 2 2.7 74
5 Concord Public 830 33.3 1665 66.7 262 2757 95 3.3 2852
6 Concord Snr Ctzns Cntr 535 30.1 1240 69.9 152 1927 42 2.1 1969
7 Concord W Public 589 35.8 1054 64.2 198 1841 59 3.1 1900
8 Concord W Uniting 436 35.1 806 64.9 139 1381 34 2.4 1415
9 Domremy College 752 35.3 1378 64.7 189 2319 75 3.1 2394
10 Drummoyne Public 618 34.1 1194 65.9 226 2038 44 2.1 2082
11 Five Dock Public 750 38.2 1211 61.8 214 2175 78 3.5 2253
12 Homebush Public 193 36.9 330 63.1 85 608 12 1.9 620
13 Homebush W Public 105 41.0 151 59.0 29 285 7 2.4 292
14 Mortlake Public 1060 29.8 2498 70.2 265 3823 61 1.6 3884
15 Rhodes Comm. Hall 239 30.1 556 69.9 119 914 28 3.0 942
16 Russell Lea Infants 442 37.9 723 62.1 123 1288 31 2.4 1319
17 St Andrews Anglican Abbotsford526 30.6 1191 69.4 158 1875 46 2.4 1921
18 St Bedes Drummoyne 182 30.4 416 69.6 69 667 17 2.5 684
19 Strathfield Guide Hall 237 39.1 369 60.9 99 705 27 3.7 732
20 Strathfield Nth Public 1106 38.3 1778 61.7 284 3168 100 3.1 3268
21 Sydney Cheil Church 360 40.2 535 59.8 81 976 35 3.5 1011
22 Sydney Town Hall 41 43.2 54 56.8 18 113 5 4.2 118
Ordinary Votes 11003 33.7 21639 66.3 3392 36034 978 2.6 37012
Absent 1319 34.3 2526 65.7 604 4449 157 3.4 4606
Declared Institution 23 33.3 46 66.7 4 73 0 0.0 73
Enrolment New 65 29.1 158 70.9 45 268 11 3.9 279
Postal/iVote 1116 30.2 2581 69.8 352 4049 37 0.9 4086
Pre-poll 607 31.6 1312 68.4 172 2091 38 1.8 2129
Provisional/Silent 50 36.5 87 63.5 16 153 5 3.2 158
Declaration Votes 3180 32.2 6710 67.8 1193 11083 248 2.2 11331
Grand Total 14183 33.3 28349 66.7 4585 47117 1226 2.5 48343
DRUMMOYNERoll : 51706 (Turnout 93.5%)
Tsirekas Sidoti
(ALP) (LIB) Informal
38

2011 New South Wales Election
POLLING PLACES Total
Exhst Formal Vote
Votes % Votes % %
1 Alectown Hall 78 56.1 61 43.9 2 141 1 0.7 142
2 Ballimore Public 67 63.2 39 36.8 1 107 2 1.8 109
3 Bedgerebong Public 119 76.3 37 23.7 3 159 1 0.6 160
4 Bogan Gate Public 104 60.8 67 39.2 4 175 0 0.0 175
5 Buninyong Public 1530 65.0 823 35.0 103 2456 48 1.9 2504
6 Canowindra High 657 64.0 369 36.0 85 1111 26 2.3 1137
7 Dubbo Cllg - Delroy 878 64.5 483 35.5 41 1402 40 2.8 1442
8 Dubbo Cllg - Sth 1083 66.5 545 33.5 69 1697 34 2.0 1731
9 Dubbo Hospital 101 65.2 54 34.8 4 159 4 2.5 163
10 Dubbo Nth Public 1106 65.1 592 34.9 69 1767 41 2.3 1808
11 Dubbo Sth Public 1098 63.0 644 37.0 71 1813 41 2.2 1854
12 Eugowra Public 346 69.2 154 30.8 21 521 8 1.5 529
13 Eumungerie Public 98 71.0 40 29.0 8 146 1 0.7 147
14 Forbes High 637 64.5 350 35.5 55 1042 36 3.3 1078
15 Forbes Tennis Club 616 71.0 252 29.0 28 896 15 1.6 911
16 Forbes Town Hall 1366 65.3 725 34.7 78 2169 45 2.0 2214
17 Lourdes Hospital Dubbo 378 63.3 219 36.7 23 620 15 2.4 635
18 Manildra Public 78 80.4 19 19.6 5 102 1 1.0 103
19 Middleton Public 305 51.0 293 49.0 29 627 17 2.6 644
20 Narromine Public 1352 65.5 713 34.5 95 2160 43 2.0 2203
21 Orana Hghts Public 1606 68.3 747 31.7 88 2441 50 2.0 2491
22 Parkes Assemblies of God 345 50.1 343 49.9 17 705 16 2.2 721
23 Parkes E Public 564 57.3 421 42.7 31 1016 12 1.2 1028
24 Parkes High 436 56.5 335 43.5 34 805 20 2.4 825
25 Parkes Hospital 300 55.2 243 44.8 16 559 10 1.8 569
26 Parkes Library 761 56.5 586 43.5 58 1405 50 3.4 1455
27 Peak Hill Leisure Cntr 275 47.7 301 52.3 17 593 11 1.8 604
28 Sydney Town Hall 10 50.0 10 50.0 3 23 0 0.0 23
29 Tomingley Hall 122 71.8 48 28.2 4 174 1 0.6 175
30 Trundle Central 214 58.8 150 41.2 9 373 3 0.8 376
31 Tullamore Central 126 65.3 67 34.7 4 197 3 1.5 200
32 Wambangalang Edu. Cntr 80 80.8 19 19.2 1 100 1 1.0 101
33 Wesley Cntr Dubbo 684 65.0 369 35.0 37 1090 12 1.1 1102
34 West Dubbo Guides 975 63.4 564 36.6 56 1595 47 2.9 1642
35 Wirrinya Shed 41 75.9 13 24.1 3 57 0 0.0 57
36 Wongarbon Public 219 65.6 115 34.4 12 346 1 0.3 347
37 Yeoval Central 197 68.4 91 31.6 14 302 4 1.3 306
Ordinary Votes 18952 63.5 10901 36.5 1198 31051 660 2.1 31711
Absent 1662 57.6 1225 42.4 258 3145 58 1.8 3203
Declared Institution 133 64.3 74 35.7 20 227 3 1.3 230
Enrolment New 188 63.1 110 36.9 22 320 8 2.4 328
Postal/iVote 1207 62.4 728 37.6 76 2011 11 0.5 2022
Pre-poll 5529 66.7 2758 33.3 210 8497 158 1.8 8655
Provisional/Silent 43 58.1 31 41.9 7 81 0 0.0 81
Declaration Votes 8762 64.0 4926 36.0 593 14281 238 1.6 14519
Grand Total 27714 63.7 15827 36.3 1791 45332 898 1.9 46230
DUBBORoll : 48970 (Turnout 94.4%)
Grant Fardell
(NAT) (IND) Informal
39

2011 New South Wales Election
POLLING PLACES Total
Exhst Formal Vote
Votes % Votes % %
1 Alectown Hall 14 13.0 94 87.0 33 141 1 0.7 142
2 Ballimore Public 10 11.6 76 88.4 21 107 2 1.8 109
3 Bedgerebong Public 10 7.2 129 92.8 20 159 1 0.6 160
4 Bogan Gate Public 21 14.9 120 85.1 34 175 0 0.0 175
5 Buninyong Public 324 15.9 1709 84.1 423 2456 48 1.9 2504
6 Canowindra High 181 19.7 739 80.3 191 1111 26 2.3 1137
7 Dubbo Cllg - Delroy 179 15.5 973 84.5 250 1402 40 2.8 1442
8 Dubbo Cllg - Sth 216 15.2 1205 84.8 276 1697 34 2.0 1731
9 Dubbo Hospital 20 15.2 112 84.8 27 159 4 2.5 163
10 Dubbo Nth Public 220 15.1 1238 84.9 309 1767 41 2.3 1808
11 Dubbo Sth Public 240 16.2 1239 83.8 334 1813 41 2.2 1854
12 Eugowra Public 56 12.7 385 87.3 80 521 8 1.5 529
13 Eumungerie Public 18 14.4 107 85.6 21 146 1 0.7 147
14 Forbes High 169 19.3 705 80.7 168 1042 36 3.3 1078
15 Forbes Tennis Club 95 12.4 674 87.6 127 896 15 1.6 911
16 Forbes Town Hall 273 15.1 1536 84.9 360 2169 45 2.0 2214
17 Lourdes Hospital Dubbo 75 14.8 431 85.2 114 620 15 2.4 635
18 Manildra Public 10 10.8 83 89.2 9 102 1 1.0 103
19 Middleton Public 116 24.1 366 75.9 145 627 17 2.6 644
20 Narromine Public 306 16.9 1504 83.1 350 2160 43 2.0 2203
21 Orana Hghts Public 285 13.8 1775 86.2 381 2441 50 2.0 2491
22 Parkes Assemblies of God 117 21.7 421 78.3 167 705 16 2.2 721
23 Parkes E Public 137 17.1 665 82.9 214 1016 12 1.2 1028
24 Parkes High 118 18.6 515 81.4 172 805 20 2.4 825
25 Parkes Hospital 76 17.5 359 82.5 124 559 10 1.8 569
26 Parkes Library 226 20.3 888 79.7 291 1405 50 3.4 1455
27 Peak Hill Leisure Cntr 101 22.7 344 77.3 148 593 11 1.8 604
28 Sydney Town Hall 4 25.0 12 75.0 7 23 0 0.0 23
29 Tomingley Hall 14 9.4 135 90.6 25 174 1 0.6 175
30 Trundle Central 42 14.2 253 85.8 78 373 3 0.8 376
31 Tullamore Central 19 11.8 142 88.2 36 197 3 1.5 200
32 Wambangalang Edu. Cntr 5 5.6 85 94.4 10 100 1 1.0 101
33 Wesley Cntr Dubbo 128 14.3 765 85.7 197 1090 12 1.1 1102
34 West Dubbo Guides 231 17.5 1089 82.5 275 1595 47 2.9 1642
35 Wirrinya Shed 5 10.0 45 90.0 7 57 0 0.0 57
36 Wongarbon Public 49 16.9 241 83.1 56 346 1 0.3 347
37 Yeoval Central 38 14.8 218 85.2 46 302 4 1.3 306
Ordinary Votes 4148 16.3 21377 83.7 5526 31051 660 2.1 31711
Absent 566 22.7 1929 77.3 650 3145 58 1.8 3203
Declared Institution 37 19.6 152 80.4 38 227 3 1.3 230
Enrolment New 51 19.6 209 80.4 60 320 8 2.4 328
Postal/iVote 253 15.5 1381 84.5 377 2011 11 0.5 2022
Pre-poll 914 12.9 6174 87.1 1409 8497 158 1.8 8655
Provisional/Silent 14 22.2 49 77.8 18 81 0 0.0 81
Declaration Votes 1835 15.6 9894 84.4 2552 14281 238 1.6 14519
Grand Total 5983 16.1 31271 83.9 8078 45332 898 1.9 46230
(Estimated two-party preferred counts)
DUBBO (2-Party Preferred)Roll : 48970 (Turnout 94.4%)
Brooks Grant
(ALP) (NAT) Informal
40
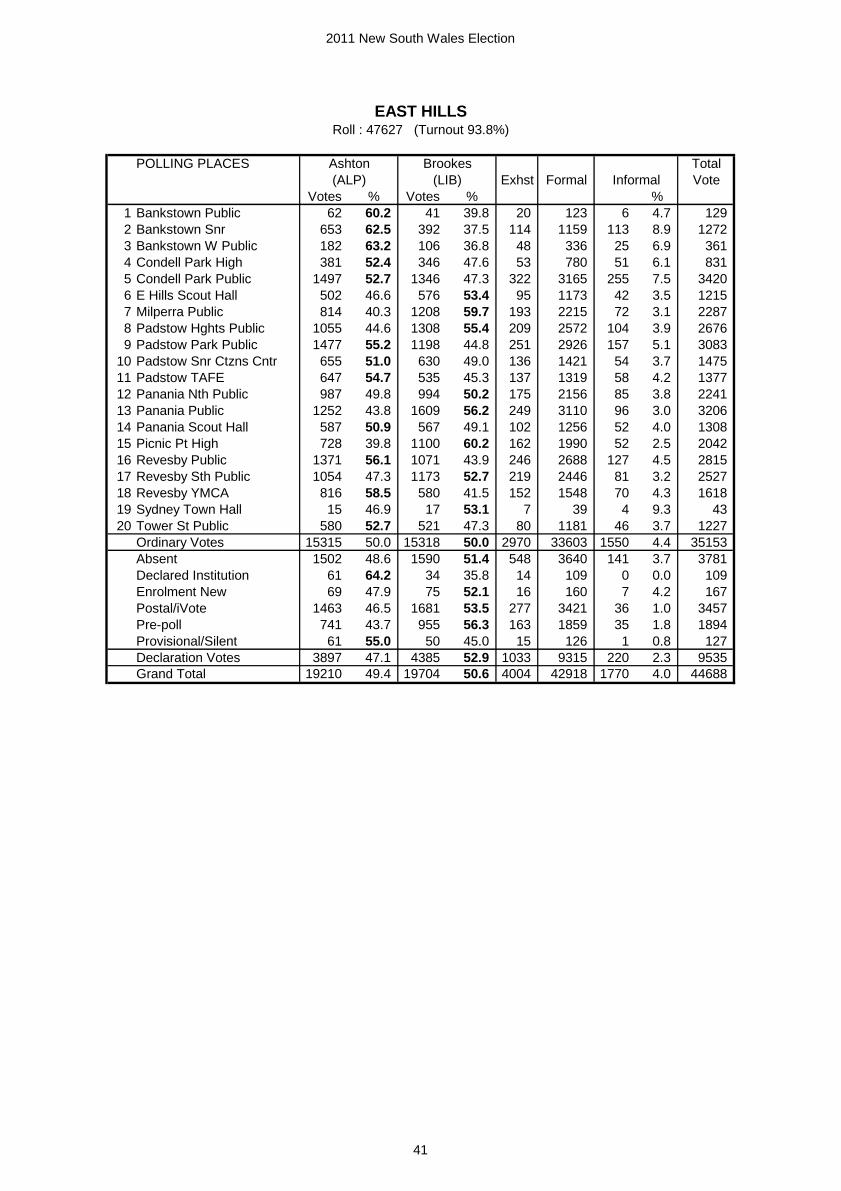
2011 New South Wales Election
POLLING PLACES Total
Exhst Formal Vote
Votes % Votes % %
1 Bankstown Public 62 60.2 41 39.8 20 123 6 4.7 129
2 Bankstown Snr 653 62.5 392 37.5 114 1159 113 8.9 1272
3 Bankstown W Public 182 63.2 106 36.8 48 336 25 6.9 361
4 Condell Park High 381 52.4 346 47.6 53 780 51 6.1 831
5 Condell Park Public 1497 52.7 1346 47.3 322 3165 255 7.5 3420
6 E Hills Scout Hall 502 46.6 576 53.4 95 1173 42 3.5 1215
7 Milperra Public 814 40.3 1208 59.7 193 2215 72 3.1 2287
8 Padstow Hghts Public 1055 44.6 1308 55.4 209 2572 104 3.9 2676
9 Padstow Park Public 1477 55.2 1198 44.8 251 2926 157 5.1 3083
10 Padstow Snr Ctzns Cntr 655 51.0 630 49.0 136 1421 54 3.7 1475
11 Padstow TAFE 647 54.7 535 45.3 137 1319 58 4.2 1377
12 Panania Nth Public 987 49.8 994 50.2 175 2156 85 3.8 2241
13 Panania Public 1252 43.8 1609 56.2 249 3110 96 3.0 3206
14 Panania Scout Hall 587 50.9 567 49.1 102 1256 52 4.0 1308
15 Picnic Pt High 728 39.8 1100 60.2 162 1990 52 2.5 2042
16 Revesby Public 1371 56.1 1071 43.9 246 2688 127 4.5 2815
17 Revesby Sth Public 1054 47.3 1173 52.7 219 2446 81 3.2 2527
18 Revesby YMCA 816 58.5 580 41.5 152 1548 70 4.3 1618
19 Sydney Town Hall 15 46.9 17 53.1 7 39 4 9.3 43
20 Tower St Public 580 52.7 521 47.3 80 1181 46 3.7 1227
Ordinary Votes 15315 50.0 15318 50.0 2970 33603 1550 4.4 35153
Absent 1502 48.6 1590 51.4 548 3640 141 3.7 3781
Declared Institution 61 64.2 34 35.8 14 109 0 0.0 109
Enrolment New 69 47.9 75 52.1 16 160 7 4.2 167
Postal/iVote 1463 46.5 1681 53.5 277 3421 36 1.0 3457
Pre-poll 741 43.7 955 56.3 163 1859 35 1.8 1894
Provisional/Silent 61 55.0 50 45.0 15 126 1 0.8 127
Declaration Votes 3897 47.1 4385 52.9 1033 9315 220 2.3 9535
Grand Total 19210 49.4 19704 50.6 4004 42918 1770 4.0 44688
EAST HILLSRoll : 47627 (Turnout 93.8%)
Ashton Brookes
(ALP) (LIB) Informal
41

2011 New South Wales Election
POLLING PLACES Total
Exhst Formal Vote
Votes % Votes % %
1 Beecroft Public 565 19.7 2299 80.3 373 3237 57 1.7 3294
2 Brush Farm Academy 205 26.5 569 73.5 98 872 26 2.9 898
3 Carlingford Public 332 29.0 811 71.0 128 1271 54 4.1 1325
4 Cheltenham Girls High 315 24.5 971 75.5 156 1442 25 1.7 1467
5 Cherrybrook ELC 158 17.4 749 82.6 85 992 33 3.2 1025
6 Eastwood Public 266 30.9 596 69.1 144 1006 29 2.8 1035
7 Epping Boys 537 29.9 1260 70.1 284 2081 73 3.4 2154
8 Epping Church of Christ 536 25.8 1541 74.2 287 2364 91 3.7 2455
9 Epping Comm. Cntr 685 30.1 1588 69.9 292 2565 73 2.8 2638
10 Epping Hghts Public 391 25.3 1152 74.7 146 1689 46 2.7 1735
11 Epping Nth Public 512 24.7 1564 75.3 225 2301 46 2.0 2347
12 Epping W Public 681 28.8 1680 71.2 258 2619 56 2.1 2675
13 Normanhurst Public 57 26.3 160 73.7 37 254 7 2.7 261
14 Pennant Hills High 669 25.2 1984 74.8 356 3009 97 3.1 3106
15 Roselea Public 521 24.2 1636 75.8 230 2387 69 2.8 2456
16 Sydney Town Hall 24 34.8 45 65.2 10 79 3 3.7 82
17 Thornleigh Comm. Cntr 343 27.6 899 72.4 207 1449 32 2.2 1481
18 Thornleigh W Public 428 21.8 1533 78.2 303 2264 64 2.7 2328
19 W Pennant Hills Public 325 21.5 1189 78.5 187 1701 37 2.1 1738
Ordinary Votes 7550 25.4 22226 74.6 3806 33582 918 2.7 34500
Absent 1048 26.8 2859 73.2 679 4586 134 2.8 4720
Declared Institution 77 18.9 331 81.1 28 436 3 0.7 439
Enrolment New 30 37.0 51 63.0 20 101 3 2.9 104
Postal/iVote 663 20.5 2564 79.5 308 3535 42 1.2 3577
Pre-poll 470 21.0 1765 79.0 245 2480 48 1.9 2528
Provisional/Silent 30 26.1 85 73.9 20 135 2 1.5 137
Declaration Votes 2318 23.2 7655 76.8 1300 11273 232 2.0 11505
Grand Total 9868 24.8 29881 75.2 5106 44855 1150 2.5 46005
EPPINGRoll : 49410 (Turnout 93.1%)
Smith Smith
(ALP) (LIB) Informal
42
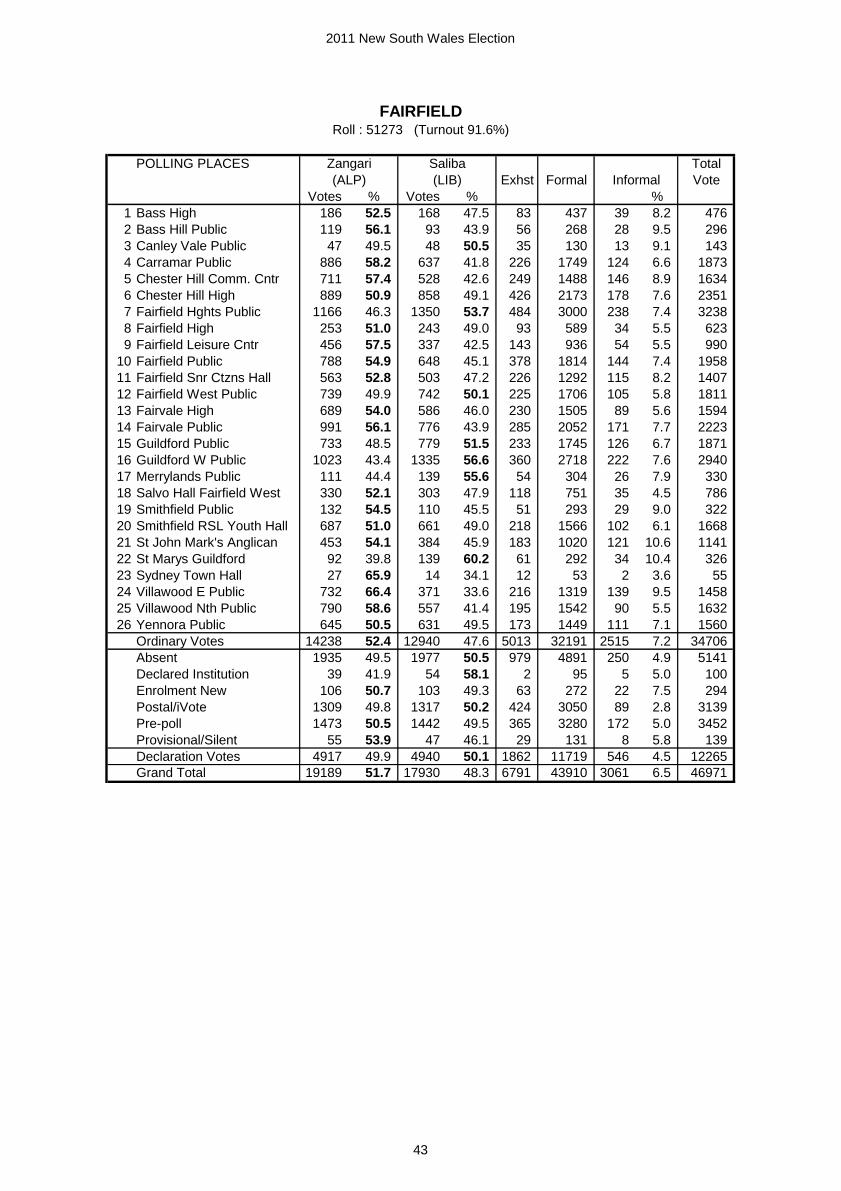
2011 New South Wales Election
POLLING PLACES Total
Exhst Formal Vote
Votes % Votes % %
1 Bass High 186 52.5 168 47.5 83 437 39 8.2 476
2 Bass Hill Public 119 56.1 93 43.9 56 268 28 9.5 296
3 Canley Vale Public 47 49.5 48 50.5 35 130 13 9.1 143
4 Carramar Public 886 58.2 637 41.8 226 1749 124 6.6 1873
5 Chester Hill Comm. Cntr 711 57.4 528 42.6 249 1488 146 8.9 1634
6 Chester Hill High 889 50.9 858 49.1 426 2173 178 7.6 2351
7 Fairfield Hghts Public 1166 46.3 1350 53.7 484 3000 238 7.4 3238
8 Fairfield High 253 51.0 243 49.0 93 589 34 5.5 623
9 Fairfield Leisure Cntr 456 57.5 337 42.5 143 936 54 5.5 990
10 Fairfield Public 788 54.9 648 45.1 378 1814 144 7.4 1958
11 Fairfield Snr Ctzns Hall 563 52.8 503 47.2 226 1292 115 8.2 1407
12 Fairfield West Public 739 49.9 742 50.1 225 1706 105 5.8 1811
13 Fairvale High 689 54.0 586 46.0 230 1505 89 5.6 1594
14 Fairvale Public 991 56.1 776 43.9 285 2052 171 7.7 2223
15 Guildford Public 733 48.5 779 51.5 233 1745 126 6.7 1871
16 Guildford W Public 1023 43.4 1335 56.6 360 2718 222 7.6 2940
17 Merrylands Public 111 44.4 139 55.6 54 304 26 7.9 330
18 Salvo Hall Fairfield West 330 52.1 303 47.9 118 751 35 4.5 786
19 Smithfield Public 132 54.5 110 45.5 51 293 29 9.0 322
20 Smithfield RSL Youth Hall 687 51.0 661 49.0 218 1566 102 6.1 1668
21 St John Mark's Anglican 453 54.1 384 45.9 183 1020 121 10.6 1141
22 St Marys Guildford 92 39.8 139 60.2 61 292 34 10.4 326
23 Sydney Town Hall 27 65.9 14 34.1 12 53 2 3.6 55
24 Villawood E Public 732 66.4 371 33.6 216 1319 139 9.5 1458
25 Villawood Nth Public 790 58.6 557 41.4 195 1542 90 5.5 1632
26 Yennora Public 645 50.5 631 49.5 173 1449 111 7.1 1560
Ordinary Votes 14238 52.4 12940 47.6 5013 32191 2515 7.2 34706
Absent 1935 49.5 1977 50.5 979 4891 250 4.9 5141
Declared Institution 39 41.9 54 58.1 2 95 5 5.0 100
Enrolment New 106 50.7 103 49.3 63 272 22 7.5 294
Postal/iVote 1309 49.8 1317 50.2 424 3050 89 2.8 3139
Pre-poll 1473 50.5 1442 49.5 365 3280 172 5.0 3452
Provisional/Silent 55 53.9 47 46.1 29 131 8 5.8 139
Declaration Votes 4917 49.9 4940 50.1 1862 11719 546 4.5 12265
Grand Total 19189 51.7 17930 48.3 6791 43910 3061 6.5 46971
FAIRFIELDRoll : 51273 (Turnout 91.6%)
Zangari Saliba
(ALP) (LIB) Informal
43

2011 New South Wales Election
POLLING PLACES Total
Exhst Formal Vote
Votes % Votes % %
1 Booker Bay Pre-sch. 260 38.5 415 61.5 79 754 29 3.7 783
2 Brisbane Water-Umina Campus641 43.5 832 56.5 217 1690 63 3.6 1753
3 Brisbane Water-Woy Woy Campus772 44.1 979 55.9 275 2026 87 4.1 2113
4 Chertsey Public 543 36.2 955 63.8 225 1723 64 3.6 1787
5 Empire Bay Public 33 33.7 65 66.3 21 119 4 3.3 123
6 Erina High 102 35.7 184 64.3 56 342 25 6.8 367
7 Ettalong Public 975 45.5 1167 54.5 301 2443 139 5.4 2582
8 Gosford E Public 635 31.7 1369 68.3 276 2280 73 3.1 2353
9 Gosford Public 459 39.7 696 60.3 211 1366 55 3.9 1421
10 Henry Kendall High 181 37.8 298 62.2 98 577 28 4.6 605
11 Kariong Public 724 29.3 1743 70.7 353 2820 113 3.9 2933
12 Kulnura Hall 23 24.7 70 75.3 15 108 8 6.9 116
13 Mangrove Mt Hall 103 23.1 343 76.9 47 493 24 4.6 517
14 Mooney Mooney Public 76 34.1 147 65.9 30 253 5 1.9 258
15 Mt White RFS 47 37.3 79 62.7 31 157 4 2.5 161
16 Patonga Hall 55 41.7 77 58.3 29 161 4 2.4 165
17 Pearl Beach Comm. Cntr 68 25.7 197 74.3 44 309 5 1.6 314
18 Peats Ridge Public 37 17.1 180 82.9 32 249 5 2.0 254
19 Pt Clare Public 622 32.9 1271 67.1 238 2131 62 2.8 2193
20 Somersby Public 104 23.9 331 76.1 41 476 17 3.4 493
21 Spencer Public 53 43.8 68 56.2 33 154 5 3.1 159
22 St Matthews Lutheran Church 337 35.3 617 64.7 114 1068 47 4.2 1115
23 Sth Woy Woy Hall 334 39.8 506 60.2 119 959 37 3.7 996
24 Sydney Town Hall 14 35.0 26 65.0 3 43 2 4.4 45
25 The Bays Comm. Hall 61 24.6 187 75.4 35 283 12 4.1 295
26 Umina Hall 533 46.0 625 54.0 175 1333 45 3.3 1378
27 Umina Public 719 41.3 1022 58.7 302 2043 72 3.4 2115
28 Umina Uniting 787 46.6 902 53.4 246 1935 80 4.0 2015
29 Woy Woy Sth Public 924 48.4 985 51.6 305 2214 80 3.5 2294
30 Wyoming Public 331 39.5 508 60.5 149 988 41 4.0 1029
Ordinary Votes 10553 38.5 16844 61.5 4100 31497 1235 3.8 32732
Absent 1161 36.8 1993 63.2 576 3730 108 2.8 3838
Declared Institution 145 43.7 187 56.3 45 377 10 2.6 387
Enrolment New 73 41.7 102 58.3 40 215 10 4.4 225
Postal/iVote 1114 35.8 1998 64.2 304 3416 29 0.8 3445
Pre-poll 1962 37.9 3220 62.1 608 5790 181 3.0 5971
Provisional/Silent 44 35.2 81 64.8 25 150 0 0.0 150
Declaration Votes 4499 37.2 7581 62.8 1598 13678 338 2.4 14016
Grand Total 15052 38.1 24425 61.9 5698 45175 1573 3.4 46748
GOSFORDRoll : 50140 (Turnout 93.2%)
Smith Holstein
(ALP) (LIB) Informal
44

2011 New South Wales Election
POLLING PLACES Total
Exhst Formal Vote
Votes % Votes % %
1 Avoca Hall 25 19.1 106 80.9 17 148 0 0.0 148
2 Bowral Hall 434 15.7 2337 84.3 403 3174 78 2.4 3252
3 Bowral High 285 21.2 1058 78.8 194 1537 38 2.4 1575
4 Bradfordville Public 331 26.8 906 73.2 112 1349 53 3.8 1402
5 Bundanoon Public 211 19.3 884 80.7 229 1324 32 2.4 1356
6 Bungonia Hall 34 20.1 135 79.9 14 183 5 2.7 188
7 Colo Vale Hall 128 19.2 540 80.8 149 817 29 3.4 846
8 E Bowral Comm. Cntr 222 15.4 1216 84.6 171 1609 34 2.1 1643
9 Exeter Public 70 17.1 339 82.9 69 478 3 0.6 481
10 Goulburn E Public 172 30.7 389 69.3 55 616 22 3.4 638
11 Goulburn High 479 25.4 1406 74.6 199 2084 80 3.7 2164
12 Goulburn Scout Hall 514 26.8 1407 73.2 232 2153 106 4.7 2259
13 Goulburn Uniting 466 28.2 1186 71.8 210 1862 87 4.5 1949
14 Goulburn W Public 283 23.8 908 76.2 106 1297 52 3.9 1349
15 Hill Top Public 355 31.7 765 68.3 176 1296 75 5.5 1371
16 Holy Trinity Berrima 125 19.7 511 80.3 108 744 20 2.6 764
17 Marulan Hall 116 22.0 411 78.0 55 582 47 7.5 629
18 Mittagong Kindy 195 21.4 715 78.6 138 1048 31 2.9 1079
19 Mittagong Public 544 26.2 1531 73.8 331 2406 96 3.8 2502
20 Moss Vale Council 475 25.1 1414 74.9 293 2182 98 4.3 2280
21 Moss Vale Public 285 28.5 716 71.5 186 1187 63 5.0 1250
22 St Josephs Goulburn 299 28.4 755 71.6 135 1189 53 4.3 1242
23 Sutton Forest Hall 70 16.0 367 84.0 50 487 8 1.6 495
24 Sydney Town Hall 7 33.3 14 66.7 1 22 0 0.0 22
25 Tallong Hall 81 26.1 229 73.9 47 357 13 3.5 370
26 Tarago Hall 68 23.4 222 76.6 37 327 13 3.8 340
27 Taralga Hall 45 15.0 255 85.0 24 324 6 1.8 330
28 Welby Hall 188 27.1 505 72.9 115 808 29 3.5 837
29 Wingello Hall 77 25.8 221 74.2 46 344 19 5.2 363
30 Yerrinbool Hall 131 29.6 311 70.4 89 531 26 4.7 557
Ordinary Votes 6715 23.6 21759 76.4 3991 32465 1216 3.6 33681
Absent 605 25.5 1767 74.5 409 2781 76 2.7 2857
Declared Institution 56 27.3 149 72.7 24 229 8 3.4 237
Enrolment New 52 24.4 161 75.6 44 257 9 3.4 266
Postal/iVote 436 20.0 1745 80.0 228 2409 23 0.9 2432
Pre-poll 1419 22.5 4889 77.5 813 7121 173 2.4 7294
Provisional/Silent 29 29.3 70 70.7 11 110 3 2.7 113
Declaration Votes 2597 22.8 8781 77.2 1529 12907 292 2.2 13199
Grand Total 9312 23.4 30540 76.6 5520 45372 1508 3.2 46880
GOULBURNRoll : 50057 (Turnout 93.7%)
Validakis Goward
(ALP) (LIB) Informal
45

2011 New South Wales Election
POLLING PLACES Total
Exhst Formal Vote
Votes % Votes % %
1 Beresford Rd Public 75 42.6 101 57.4 23 199 12 5.7 211
2 Blaxcell St Public 1267 48.9 1324 51.1 155 2746 158 5.4 2904
3 Cardinal Gilroy Village 162 46.4 187 53.6 36 385 11 2.8 396
4 Coolibah Fitness Cntr 662 44.9 814 55.1 169 1645 81 4.7 1726
5 Granville E Public 856 47.7 939 52.3 214 2009 99 4.7 2108
6 Granville Public 695 56.6 534 43.4 127 1356 73 5.1 1429
7 Granville Sth High 451 46.6 516 53.4 186 1153 64 5.3 1217
8 Granville Sth Public 493 44.0 627 56.0 133 1253 70 5.3 1323
9 Granville Town Hall 624 54.3 525 45.7 132 1281 55 4.1 1336
10 Greystanes Public 187 42.8 250 57.2 59 496 30 5.7 526
11 Hilltop Rd Public 1229 43.2 1616 56.8 287 3132 183 5.5 3315
12 Holroyd High 429 50.6 419 49.4 73 921 51 5.2 972
13 Holroyd School 146 47.9 159 52.1 17 322 9 2.7 331
14 Holryod Cntr 653 56.9 495 43.1 123 1271 67 5.0 1338
15 Merrylands E Public 781 51.0 751 49.0 136 1668 80 4.6 1748
16 Merrylands Public 827 45.8 978 54.2 145 1950 100 4.9 2050
17 Parramatta High 168 44.8 207 55.2 63 438 34 7.2 472
18 Parramatta Town Hall 345 51.5 325 48.5 121 791 39 4.7 830
19 Parramatta W Public 677 47.9 737 52.1 153 1567 81 4.9 1648
20 Ringrose Public 1060 45.7 1262 54.3 240 2562 137 5.1 2699
21 Rosehill Public 154 50.8 149 49.2 44 347 14 3.9 361
22 Salvo Hall Granville 362 51.0 348 49.0 72 782 26 3.2 808
23 St Marys Guildford 672 43.5 874 56.5 121 1667 72 4.1 1739
24 St Thomas Merrylands 654 41.5 922 58.5 169 1745 91 5.0 1836
25 Sth Wentworthville Guide Hall 241 43.2 317 56.8 56 614 31 4.8 645
26 Sydney Town Hall 32 50.8 31 49.2 7 70 3 4.1 73
27 Wentworthville Baptist 301 40.5 443 59.5 76 820 36 4.2 856
Ordinary Votes 14203 47.3 15850 52.7 3137 33190 1707 4.9 34897
Absent 1960 47.9 2136 52.1 533 4629 210 4.3 4839
Declared Institution 3 50.0 3 50.0 2 8 0 0.0 8
Enrolment New 132 49.3 136 50.7 78 346 37 9.7 383
Postal/iVote 1630 50.6 1591 49.4 452 3673 32 0.9 3705
Pre-poll 1113 42.6 1500 57.4 208 2821 60 2.1 2881
Provisional/Silent 52 46.4 60 53.6 16 128 11 7.9 139
Declaration Votes 4890 47.4 5426 52.6 1289 11605 350 2.9 11955
Grand Total 19093 47.3 21276 52.7 4426 44795 2057 4.4 46852
GRANVILLERoll : 50957 (Turnout 91.9%)
Borger Issa
(ALP) (LIB) Informal
46

2011 New South Wales Election
POLLING PLACES Total
Exhst Formal Vote
Votes % Votes % %
1 Annangrove Public 128 10.2 1126 89.8 68 1322 35 2.6 1357
2 Arcadia Public 127 16.7 634 83.3 81 842 13 1.5 855
3 Beaumont Hills Public 556 18.4 2471 81.6 187 3214 72 2.2 3286
4 Bilpin Public 77 21.2 286 78.8 45 408 16 3.8 424
5 Cattai Public 35 13.7 221 86.3 19 275 1 0.4 276
6 Comleroy Rd Public 182 19.5 752 80.5 108 1042 44 4.1 1086
7 Dural Public 95 12.8 648 87.2 51 794 21 2.6 815
8 Ebenezer Public 135 17.6 634 82.4 97 866 14 1.6 880
9 Glenhaven Public 260 10.4 2236 89.6 179 2675 65 2.4 2740
10 Glenorie Public 188 14.3 1128 85.7 105 1421 42 2.9 1463
11 Glossodia Public 213 19.0 907 81.0 132 1252 55 4.2 1307
12 Hawkesbury High 102 20.5 395 79.5 56 553 24 4.2 577
13 Hillside Public 32 9.4 310 90.6 27 369 8 2.1 377
14 Horrie Eley Hall 31 25.4 91 74.6 15 137 10 6.8 147
15 Ironbark Ridge Public 140 12.3 996 87.7 39 1175 24 2.0 1199
16 Kellyville High 251 14.5 1479 85.5 87 1817 54 2.9 1871
17 Kellyville Public 393 17.9 1805 82.1 166 2364 83 3.4 2447
18 Kenthurst Public 298 13.2 1954 86.8 158 2410 55 2.2 2465
19 Kurrajong E Public 89 18.4 394 81.6 61 544 23 4.1 567
20 Kurrajong Public 63 18.8 272 81.2 55 390 8 2.0 398
21 Maraylya Public 80 11.2 635 88.8 29 744 14 1.8 758
22 Maroota Public 38 11.9 281 88.1 15 334 8 2.3 342
23 Middle Dural Public 86 12.1 624 87.9 47 757 16 2.1 773
24 Oakville Public 119 10.8 986 89.2 70 1175 31 2.6 1206
25 Pitt Town Public 143 14.2 862 85.8 87 1092 39 3.4 1131
26 Rouse Hill Public 451 16.9 2212 83.1 159 2822 83 2.9 2905
27 Samuel Gilbert Public 64 13.7 403 86.3 39 506 16 3.1 522
28 Sherwood Ridge Public 262 16.2 1358 83.8 110 1730 44 2.5 1774
29 St Albans Arts Hall 31 29.8 73 70.2 26 130 3 2.3 133
30 Sth Maroota Comm. Hall 41 11.2 324 88.8 10 375 5 1.3 380
31 Sydney Town Hall 9 31.0 20 69.0 3 32 2 5.9 34
32 Tennyson RFS 30 12.6 209 87.4 24 263 8 3.0 271
33 Vineyard Public 38 18.4 169 81.6 12 219 6 2.7 225
34 Wilberforce Public 282 18.1 1276 81.9 132 1690 79 4.5 1769
35 Wisemans Ferry Public 54 18.1 245 81.9 20 319 9 2.7 328
Ordinary Votes 5123 15.3 28416 84.7 2519 36058 1030 2.8 37088
Absent 1058 17.7 4908 82.3 582 6548 190 2.8 6738
Declared Institution 3 18.8 13 81.2 1 17 0 0.0 17
Enrolment New 45 18.5 198 81.5 25 268 5 1.8 273
Postal/iVote 354 12.8 2422 87.2 138 2914 41 1.4 2955
Pre-poll 146 9.9 1325 90.1 63 1534 28 1.8 1562
Provisional/Silent 26 17.9 119 82.1 16 161 6 3.6 167
Declaration Votes 1632 15.4 8985 84.6 825 11442 270 2.3 11712
Grand Total 6755 15.3 37401 84.7 3344 47500 1300 2.7 48800
HAWKESBURYRoll : 51331 (Turnout 95.1%)
Wicks Williams
(ALP) (LIB) Informal
47

2011 New South Wales Election
POLLING PLACES Total
Exhst Formal Vote
Votes % Votes % %
1 Austinmer Anglican 331 49.2 342 50.8 253 926 27 2.8 953
2 Bulli PCYC 671 54.1 569 45.9 338 1578 54 3.3 1632
3 Bulli Public 321 54.8 265 45.2 186 772 27 3.4 799
4 Bundeena Comm. Cntr 389 45.6 465 54.4 183 1037 29 2.7 1066
5 Coalcliff Hall 60 57.1 45 42.9 39 144 4 2.7 148
6 Coledale Public 395 49.7 399 50.3 251 1045 31 2.9 1076
7 Engadine High 203 34.2 391 65.8 59 653 27 4.0 680
8 Engadine Public 893 33.7 1760 66.3 472 3125 153 4.7 3278
9 Engadine W Public 715 28.9 1760 71.1 357 2832 102 3.5 2934
10 Heathcote High 303 30.0 708 70.0 216 1227 34 2.7 1261
11 Heathcote Public 562 33.5 1116 66.5 361 2039 63 3.0 2102
12 Helensburgh Comm. Cntr 786 43.7 1012 56.3 483 2281 79 3.3 2360
13 Helensburgh Public 325 44.5 406 55.5 179 910 22 2.4 932
14 Loftus Comm. Cntr 667 31.3 1466 68.7 363 2496 61 2.4 2557
15 Maianbar Hall 70 32.4 146 67.6 40 256 2 0.8 258
16 Marton Public 373 27.5 982 72.5 222 1577 45 2.8 1622
17 Otford Public 66 46.8 75 53.2 61 202 7 3.3 209
18 Scarborough-Wombarra SLSC 90 43.7 116 56.3 53 259 4 1.5 263
19 St John Bosco Cllg 384 30.9 860 69.1 204 1448 63 4.2 1511
20 St Michaels Thirroul 415 48.6 439 51.4 202 1056 43 3.9 1099
21 Stanwell Park Anglican 192 43.7 247 56.3 168 607 23 3.7 630
22 Sutherland Nth Public 223 36.4 390 63.6 89 702 30 4.1 732
23 Sutherland Presbyterian 283 32.8 579 67.2 160 1022 35 3.3 1057
24 Sutherland Uniting 407 36.7 701 63.3 183 1291 49 3.7 1340
25 Sydney Town Hall 21 45.7 25 54.3 13 59 0 0.0 59
26 Thirroul District Cntr 591 48.3 632 51.7 426 1649 68 4.0 1717
27 Waterfall Public 86 39.1 134 60.9 51 271 8 2.9 279
28 Woronora Hghts Comm. Cntr 266 22.9 894 77.1 138 1298 47 3.5 1345
29 Yarrawarrah Public 354 31.0 788 69.0 158 1300 48 3.6 1348
Ordinary Votes 10442 37.1 17712 62.9 5908 34062 1185 3.4 35247
Absent 1458 40.7 2120 59.3 896 4474 143 3.1 4617
Declared Institution 25 45.5 30 54.5 7 62 1 1.6 63
Enrolment New 28 54.9 23 45.1 14 65 3 4.4 68
Postal/iVote 944 34.2 1817 65.8 494 3255 32 1.0 3287
Pre-poll 573 33.4 1143 66.6 274 1990 47 2.3 2037
Provisional/Silent 42 30.9 94 69.1 29 165 8 4.6 173
Declaration Votes 3070 37.0 5227 63.0 1714 10011 234 2.3 10245
Grand Total 13512 37.1 22939 62.9 7622 44073 1419 3.1 45492
HEATHCOTERoll : 48287 (Turnout 94.2%)
McLeay Evans
(ALP) (LIB) Informal
48

2011 New South Wales Election
POLLING PLACES Total
Exhst Formal Vote
Votes % Votes % %
1 Airport - International 27 67.5 13 32.5 7 47 0 0.0 47
2 Airport - T2 13 65.0 7 35.0 3 23 1 4.2 24
3 Airport - T3 17 56.7 13 43.3 3 33 1 2.9 34
4 Alexandria Park School - Jnr Campus631 56.1 494 43.9 314 1439 34 2.3 1473
5 Bourke St Public 297 49.5 303 50.5 171 771 21 2.7 792
6 Crown St Public 43 48.3 46 51.7 26 115 2 1.7 117
7 Daceyville Public 582 51.0 559 49.0 140 1281 73 5.4 1354
8 Eastlakes Comm. Hall 1246 71.2 503 28.8 233 1982 103 4.9 2085
9 Erskineville Public 877 59.5 597 40.5 471 1945 47 2.4 1992
10 Gardeners Rd Public 612 55.4 492 44.6 148 1252 32 2.5 1284
11 Gordon Ibbett Cntr 529 63.2 308 36.8 152 989 42 4.1 1031
12 Green Sq School 319 55.0 261 45.0 124 704 24 3.3 728
13 Green Square Hall 415 47.6 457 52.4 119 991 30 2.9 1021
14 Horner Uniting 557 60.7 360 39.3 100 1017 55 5.1 1072
15 J J Cahill Mem. High 1563 63.2 909 36.8 228 2700 131 4.6 2831
16 Kensington Public 299 45.6 357 54.4 106 762 42 5.2 804
17 Kensington Scout Hall 570 43.2 748 56.8 147 1465 66 4.3 1531
18 Mascot Public 968 63.0 568 37.0 155 1691 58 3.3 1749
19 Mascot Snr Ctzns Hall 626 65.5 329 34.5 94 1049 22 2.1 1071
20 NCIE - Eora Campus 589 64.4 325 35.6 165 1079 63 5.5 1142
21 Newtown Mission Chapel 61 72.6 23 27.4 32 116 3 2.5 119
22 Pagewood Public 139 46.0 163 54.0 35 337 11 3.2 348
23 Redfern Cntr 900 64.3 499 35.7 291 1690 78 4.4 1768
24 Redfern Town Hall 692 61.8 428 38.2 282 1402 39 2.7 1441
25 St James Beaconsfield 352 55.8 279 44.2 89 720 15 2.0 735
26 St Josephs Catholic Roseberry 758 48.2 813 51.8 153 1724 65 3.6 1789
27 St Martins Kensington 779 39.1 1214 60.9 232 2225 60 2.6 2285
28 St Peters Public 475 68.8 215 31.2 186 876 19 2.1 895
29 St Peters Town Hall 395 66.2 202 33.8 198 795 34 4.1 829
30 Sydney Town Hall 123 56.2 96 43.8 61 280 10 3.4 290
31 Tempe High 790 70.5 330 29.5 234 1354 105 7.2 1459
Ordinary Votes 16244 57.7 11911 42.3 4699 32854 1286 3.8 34140
Absent 3165 53.9 2707 46.1 1166 7038 174 2.4 7212
Declared Institution 8 66.7 4 33.3 1 13 0 0.0 13
Enrolment New 127 55.2 103 44.8 76 306 9 2.9 315
Postal/iVote 2024 55.3 1636 44.7 512 4172 45 1.1 4217
Pre-poll 650 63.0 381 37.0 190 1221 28 2.2 1249
Provisional/Silent 84 66.1 43 33.9 36 163 6 3.6 169
Declaration Votes 6058 55.4 4874 44.6 1981 12913 262 2.0 13175
Grand Total 22299 57.1 16780 42.9 6688 45767 1548 3.3 47315
HEFFRONRoll : 53342 (Turnout 88.7%)
Keneally Pandeleos
(ALP) (LIB) Informal
49

2011 New South Wales Election
POLLING PLACES Total
Exhst Formal Vote
Votes % Votes % %
1 Asquith Public 986 53.6 853 46.4 288 2127 73 3.3 2200
2 Berowra Public 1605 59.6 1087 40.4 444 3136 95 2.9 3231
3 Brooklyn Public 189 59.1 131 40.9 69 389 14 3.5 403
4 Cherrybrook Guide Hall 1038 70.0 444 30.0 188 1670 28 1.6 1698
5 Cherrybrook Public 442 66.7 221 33.3 89 752 16 2.1 768
6 Cherrybrook Tech High 1984 67.7 947 32.3 443 3374 114 3.3 3488
7 Cowan Public 162 49.2 167 50.8 52 381 9 2.3 390
8 Dangar Is. Hall 26 37.1 44 62.9 35 105 5 4.5 110
9 Dural Public 951 78.4 262 21.6 117 1330 21 1.6 1351
10 Galston Public 1020 71.5 407 28.5 128 1555 31 2.0 1586
11 Hornsby Girls High 772 54.6 642 45.4 334 1748 68 3.7 1816
12 Hornsby Hghts Public 1167 55.6 931 44.4 293 2391 70 2.8 2461
13 Hornsby Hospital 135 52.1 124 47.9 48 307 10 3.2 317
14 Hornsby Nth Public 880 55.3 712 44.7 249 1841 46 2.4 1887
15 Hornsby RSL Hall 441 55.2 358 44.8 127 926 16 1.7 942
16 Hornsby Salvo Hall 319 54.3 268 45.7 116 703 27 3.7 730
17 Hornsby Sth Public 633 57.2 473 42.8 151 1257 36 2.8 1293
18 Hornsby TAFE 545 52.7 490 47.3 178 1213 43 3.4 1256
19 Middle Dural Public 266 72.5 101 27.5 33 400 8 2.0 408
20 Mt Colah Public 1321 57.7 967 42.3 350 2638 64 2.4 2702
21 Mt Ku-ring-gai Public 642 63.1 376 36.9 168 1186 25 2.1 1211
22 Normanhurst W Public 1110 59.8 747 40.2 316 2173 51 2.3 2224
23 Sydney Town Hall 21 75.0 7 25.0 13 41 4 8.9 45
24 Thornleigh W Public 504 59.8 339 40.2 106 949 13 1.4 962
25 Waitara Public 503 61.3 317 38.7 150 970 35 3.5 1005
26 Wideview Public 945 61.7 586 38.3 282 1813 44 2.4 1857
Ordinary Votes 18607 60.8 12001 39.2 4767 35375 966 2.7 36341
Absent 2373 69.1 1061 30.9 905 4339 98 2.2 4437
Declared Institution 48 62.3 29 37.7 15 92 1 1.1 93
Enrolment New 106 67.9 50 32.1 37 193 8 4.0 201
Postal/iVote 1876 67.9 886 32.1 446 3208 33 1.0 3241
Pre-poll 2068 61.7 1284 38.3 470 3822 116 2.9 3938
Provisional/Silent 80 61.5 50 38.5 35 165 6 3.5 171
Declaration Votes 6551 66.1 3360 33.9 1908 11819 262 2.2 12081
Grand Total 25158 62.1 15361 37.9 6675 47194 1228 2.5 48422
HORNSBYRoll : 51221 (Turnout 94.5%)
Kean Berman
(LIB) (IND) Informal
50

2011 New South Wales Election
POLLING PLACES Total
Exhst Formal Vote
Votes % Votes % %
1 Asquith Public 449 26.9 1221 73.1 457 2127 73 3.3 2200
2 Berowra Public 614 24.5 1892 75.5 630 3136 95 2.9 3231
3 Brooklyn Public 89 29.1 217 70.9 83 389 14 3.5 403
4 Cherrybrook Guide Hall 235 16.6 1184 83.4 251 1670 28 1.6 1698
5 Cherrybrook Public 127 19.8 513 80.2 112 752 16 2.1 768
6 Cherrybrook Tech High 559 19.6 2286 80.4 529 3374 114 3.3 3488
7 Cowan Public 84 29.4 202 70.6 95 381 9 2.3 390
8 Dangar Is. Hall 36 50.0 36 50.0 33 105 5 4.5 110
9 Dural Public 135 11.5 1036 88.5 159 1330 21 1.6 1351
10 Galston Public 168 12.6 1163 87.4 224 1555 31 2.0 1586
11 Hornsby Girls High 413 29.8 971 70.2 364 1748 68 3.7 1816
12 Hornsby Hghts Public 439 23.2 1454 76.8 498 2391 70 2.8 2461
13 Hornsby Hospital 60 25.3 177 74.7 70 307 10 3.2 317
14 Hornsby Nth Public 348 24.0 1101 76.0 392 1841 46 2.4 1887
15 Hornsby RSL Hall 201 27.3 536 72.7 189 926 16 1.7 942
16 Hornsby Salvo Hall 148 26.9 403 73.1 152 703 27 3.7 730
17 Hornsby Sth Public 245 24.1 773 75.9 239 1257 36 2.8 1293
18 Hornsby TAFE 304 31.3 666 68.7 243 1213 43 3.4 1256
19 Middle Dural Public 44 12.7 302 87.3 54 400 8 2.0 408
20 Mt Colah Public 512 24.5 1576 75.5 550 2638 64 2.4 2702
21 Mt Ku-ring-gai Public 235 24.4 730 75.6 221 1186 25 2.1 1211
22 Normanhurst W Public 430 24.7 1309 75.3 434 2173 51 2.3 2224
23 Sydney Town Hall 9 28.1 23 71.9 9 41 4 8.9 45
24 Thornleigh W Public 161 20.9 608 79.1 180 949 13 1.4 962
25 Waitara Public 183 23.2 606 76.8 181 970 35 3.5 1005
26 Wideview Public 356 24.5 1099 75.5 358 1813 44 2.4 1857
Ordinary Votes 6584 23.0 22084 77.0 6707 35375 966 2.7 36341
Absent 839 23.8 2687 76.2 813 4339 98 2.2 4437
Declared Institution 22 27.5 58 72.5 12 92 1 1.1 93
Enrolment New 40 24.8 121 75.2 32 193 8 4.0 201
Postal/iVote 546 20.3 2143 79.7 519 3208 33 1.0 3241
Pre-poll 735 23.3 2424 76.7 663 3822 116 2.9 3938
Provisional/Silent 32 24.6 98 75.4 35 165 6 3.5 171
Declaration Votes 2214 22.7 7531 77.3 2074 11819 262 2.2 12081
Grand Total 8797 22.9 29618 77.1 8779 47194 1228 2.5 48422
(Estimated two-party preferred counts)
HORNSBY (2-Party Preferred)Roll : 51221 (Turnout 94.5%)
Car Kean
(ALP) (LIB) Informal
51

2011 New South Wales Election
POLLING PLACES Total
Exhst Formal Vote
Votes % Votes % %
1 Balgownie Public 497 43.0 658 57.0 170 1325 41 3.0 1366
2 Balgownie Village Comm. Cntr 830 48.5 883 51.5 205 1918 68 3.4 1986
3 Bulli PCYC 382 57.6 281 42.4 146 809 28 3.3 837
4 Corrimal Anglican 1052 58.4 750 41.6 235 2037 88 4.1 2125
5 Corrimal High 1585 67.3 771 32.7 364 2720 110 3.9 2830
6 Edmund Rice College 383 44.3 481 55.7 141 1005 22 2.1 1027
7 Fairy Meadow Public 689 60.1 458 39.9 199 1346 61 4.3 1407
8 Fernhill Guide Hall 316 57.4 235 42.6 79 630 28 4.3 658
9 Figtree Hghts Public 545 42.7 730 57.3 169 1444 29 2.0 1473
10 Figtree High 1110 53.1 981 46.9 284 2375 80 3.3 2455
11 Holy Spirit Bellambi 659 74.5 225 25.5 126 1010 39 3.7 1049
12 Keiraville Public 726 44.4 908 55.6 270 1904 68 3.4 1972
13 Lindsay Park Public 751 44.8 926 55.2 199 1876 72 3.7 1948
14 Mt Ousley Public 598 45.8 708 54.2 183 1489 50 3.2 1539
15 Pioneer Hall Wollongong 117 61.3 74 38.7 27 218 13 5.6 231
16 Russell Vale Public 647 62.2 394 37.8 192 1233 63 4.9 1296
17 Smiths Hill High 75 53.2 66 46.8 49 190 9 4.5 199
18 St Therese W Wollongong 135 56.5 104 43.5 38 277 9 3.1 286
19 Sydney Town Hall 11 47.8 12 52.2 5 28 2 6.7 30
20 Tarrawanna Public 835 58.4 594 41.6 212 1641 58 3.4 1699
21 Towradgi Public 864 62.1 528 37.9 221 1613 69 4.1 1682
22 Wollongong Snr Ctzns Cntr 106 57.3 79 42.7 46 231 8 3.3 239
23 Woonona E Public 919 58.2 660 41.8 261 1840 60 3.2 1900
24 Woonona Guide Hall 613 58.7 432 41.3 175 1220 31 2.5 1251
25 Woonona Public 849 55.3 685 44.7 236 1770 60 3.3 1830
Ordinary Votes 15294 54.8 12623 45.2 4232 32149 1166 3.5 33315
Absent 2208 51.6 2072 48.4 883 5163 144 2.7 5307
Declared Institution 71 54.2 60 45.8 17 148 5 3.3 153
Enrolment New 85 57.4 63 42.6 30 178 3 1.7 181
Postal/iVote 1503 50.0 1501 50.0 370 3374 40 1.2 3414
Pre-poll 1329 51.8 1237 48.2 299 2865 69 2.4 2934
Provisional/Silent 56 58.9 39 41.1 20 115 4 3.4 119
Declaration Votes 5252 51.4 4972 48.6 1619 11843 265 2.2 12108
Grand Total 20530 53.8 17604 46.2 5858 43992 1431 3.2 45423
KEIRARoll : 48301 (Turnout 94.0%)
Park Dorahy
(ALP) (LIB) Informal
52

2011 New South Wales Election
POLLING PLACES Total
Exhst Formal Vote
Votes % Votes % %
1 Albion Park High 965 57.7 706 42.3 278 1949 96 4.7 2045
2 Albion Park Public 765 54.9 629 45.1 243 1637 48 2.8 1685
3 Albion Park Rail Public 1198 65.3 636 34.7 266 2100 90 4.1 2190
4 Avoca Hall 26 28.9 64 71.1 7 97 2 2.0 99
5 Berry Arts Hall 496 28.2 1263 71.8 174 1933 27 1.4 1960
6 Bomaderry Public 624 33.7 1227 66.3 186 2037 81 3.8 2118
7 Burrawang Public 56 20.0 224 80.0 28 308 6 1.9 314
8 Cambewarra Public 178 21.2 663 78.8 88 929 19 2.0 948
9 Gerringong Town Hall 371 38.4 594 61.6 303 1268 27 2.1 1295
10 Gerroa N'hood Cntr 83 29.6 197 70.4 37 317 2 0.6 319
11 Illaroo Rd Public 466 30.1 1084 69.9 198 1748 41 2.3 1789
12 Jamberoo Public 287 35.6 519 64.4 170 976 12 1.2 988
13 Kangaloon Public 26 23.9 83 76.1 10 119 5 4.0 124
14 Kangaroo Valley Hall 165 33.9 322 66.1 108 595 12 2.0 607
15 Kiama Downs SLSC 633 50.8 613 49.2 304 1550 41 2.6 1591
16 Kiama High 567 47.1 636 52.9 245 1448 27 1.8 1475
17 Kiama Leisure Cntr 763 46.5 878 53.5 333 1974 22 1.1 1996
18 Mayflower Ret. Village 72 34.8 135 65.2 31 238 2 0.8 240
19 Minnamurra Public 518 49.5 528 50.5 226 1272 28 2.2 1300
20 Mt Terry Primary 1324 57.1 995 42.9 445 2764 120 4.2 2884
21 Nowra TAFE 194 35.0 361 65.0 47 602 11 1.8 613
22 Nowra Wesley Cntr 55 39.6 84 60.4 27 166 7 4.0 173
23 Nth Nowra Public 242 28.9 594 71.1 100 936 25 2.6 961
24 Robertson Arts Hall 412 44.3 517 55.7 128 1057 29 2.7 1086
25 Shell Cove Public 651 49.7 660 50.3 205 1516 41 2.6 1557
26 Shellharbour Public 77 46.4 89 53.6 25 191 7 3.5 198
27 Shoalhaven Heads Comm. Cntr625 38.6 993 61.4 167 1785 40 2.2 1825
28 Sydney Town Hall 11 61.1 7 38.9 2 20 0 0.0 20
29 Werri Beach Hall 240 35.8 430 64.2 236 906 8 0.9 914
Ordinary Votes 12090 43.5 15731 56.5 4617 32438 876 2.6 33314
Absent 2419 38.3 3889 61.7 1066 7374 129 1.7 7503
Declared Institution 56 41.2 80 58.8 23 159 2 1.2 161
Enrolment New 0 0.0 0 0.0 0 0 0 0.0 0
Postal/iVote 1104 39.3 1706 60.7 432 3242 28 0.9 3270
Pre-poll 1336 45.8 1578 54.2 545 3459 50 1.4 3509
Provisional/Silent 47 50.5 46 49.5 15 108 6 5.3 114
Declaration Votes 4962 40.5 7299 59.5 2081 14342 215 1.5 14557
Grand Total 17052 42.5 23030 57.5 6698 46780 1091 2.3 47871
KIAMARoll : 50626 (Turnout 94.6%)
Brown Ward
(ALP) (LIB) Informal
53

2011 New South Wales Election
POLLING PLACES Total
Exhst Formal Vote
Votes % Votes % %
1 Allawah Snr Ctzn Cntr 718 51.0 689 49.0 127 1534 83 5.1 1617
2 Bald Face Public 390 29.5 933 70.5 76 1399 43 3.0 1442
3 Beverly Hills Public 31 48.4 33 51.6 7 71 4 5.3 75
4 Beverly Hills Uniting 486 53.9 416 46.1 76 978 37 3.6 1015
5 Bexley Baptist 999 59.9 669 40.1 152 1820 102 5.3 1922
6 Bexley Nth Public 241 56.6 185 43.4 37 463 26 5.3 489
7 Bexley Public 176 56.2 137 43.8 43 356 28 7.3 384
8 Blakehurst Baptist 237 37.0 403 63.0 49 689 20 2.8 709
9 Blakehurst Public 398 40.9 575 59.1 84 1057 31 2.8 1088
10 Carlton Public 1612 63.0 946 37.0 206 2764 104 3.6 2868
11 Carlton Sth Public 1013 56.5 781 43.5 212 2006 103 4.9 2109
12 Connells Pt Public 774 31.9 1654 68.1 162 2590 77 2.9 2667
13 Hurstville Public 807 55.3 651 44.7 118 1576 93 5.6 1669
14 Hurstville Snr Ctzns Cntr 248 57.5 183 42.5 51 482 19 3.8 501
15 Hurstville Sth Public 55 42.0 76 58.0 16 147 10 6.4 157
16 Kingsgrove High 591 59.5 403 40.5 96 1090 86 7.3 1176
17 Kingsgrove-Bexley Nth Comm. Cntr578 59.3 397 40.7 73 1048 53 4.8 1101
18 Kingsway Scout Hall 618 55.4 497 44.6 115 1230 72 5.5 1302
19 Kogarah High 567 60.5 370 39.5 86 1023 55 5.1 1078
20 Kogarah Snr Ctzns Cntr 556 60.4 365 39.6 61 982 72 6.8 1054
21 Kogarah Uniting 403 60.6 262 39.4 73 738 27 3.5 765
22 Our Lady of Fatima Kingsgrove775 52.6 697 47.4 102 1574 65 4.0 1639
23 Rockdale Uniting 73 62.9 43 37.1 22 138 7 4.8 145
24 St Bede's Beverly Hills 587 52.4 534 47.6 91 1212 44 3.5 1256
25 St Cuthberts Carlton 739 53.4 645 46.6 123 1507 61 3.9 1568
26 St Gabriel's Bexley 422 57.9 307 42.1 68 797 31 3.7 828
27 St Marks Sth Hurstville 365 42.3 497 57.7 57 919 35 3.7 954
28 St Raphaels Sth Hurstville 448 56.7 342 43.3 77 867 45 4.9 912
29 Sydney Tech. High 388 55.6 310 44.4 63 761 43 5.3 804
30 Sydney Town Hall 37 56.1 29 43.9 11 77 6 7.2 83
31 W Bexley Uniting 1060 55.6 847 44.4 137 2044 109 5.1 2153
Ordinary Votes 16392 52.4 14876 47.6 2671 33939 1591 4.5 35530
Absent 2170 49.7 2197 50.3 544 4911 162 3.2 5073
Declared Institution 75 47.2 84 52.8 11 170 1 0.6 171
Enrolment New 74 45.1 90 54.9 30 194 1 0.5 195
Postal/iVote 1724 50.6 1683 49.4 245 3652 65 1.7 3717
Pre-poll 708 50.8 685 49.2 103 1496 29 1.9 1525
Provisional/Silent 64 56.1 50 43.9 11 125 2 1.6 127
Declaration Votes 4815 50.1 4789 49.9 944 10548 260 2.4 10808
Grand Total 21207 51.9 19665 48.1 3615 44487 1851 4.0 46338
KOGARAHRoll : 49740 (Turnout 93.2%)
Burton Hindi
(ALP) (LIB) Informal
54

2011 New South Wales Election
POLLING PLACES Total
Exhst Formal Vote
Votes % Votes % %
1 Beaumont Rd Public 255 11.4 1980 88.6 306 2541 57 2.2 2598
2 Bowden Brae 59 15.1 332 84.9 44 435 11 2.5 446
3 Fox Valley Kindy 85 11.3 667 88.7 127 879 4 0.5 883
4 Gordon W Public 184 12.5 1286 87.5 194 1664 23 1.4 1687
5 Hornsby Girls High 292 23.4 957 76.6 223 1472 51 3.3 1523
6 Hornsby RSL Hall 48 30.6 109 69.4 14 171 9 5.0 180
7 Ku-ring-gai Council 235 13.7 1485 86.3 233 1953 51 2.5 2004
8 Lindfield Public 307 13.3 1998 86.7 321 2626 53 2.0 2679
9 Normanhurst Public 244 20.2 961 79.8 169 1374 45 3.2 1419
10 Pymble Public 40 9.4 386 90.6 50 476 5 1.0 481
11 Sacred Heart Pymble 62 9.2 614 90.8 58 734 3 0.4 737
12 St Alban's Church 70 16.2 362 83.8 84 516 9 1.7 525
13 St Martins Killara 39 8.9 398 91.1 44 481 8 1.6 489
14 Sth Turramurra Preschool 117 12.9 790 87.1 143 1050 18 1.7 1068
15 Sydney Town Hall 17 25.0 51 75.0 16 84 1 1.2 85
16 Turramurra Nth Public 223 10.0 2011 90.0 261 2495 35 1.4 2530
17 Turramurra Public 301 14.2 1820 85.8 376 2497 44 1.7 2541
18 Turramurra Uniting 185 9.7 1720 90.3 240 2145 27 1.2 2172
19 W Pymble Public 242 13.2 1589 86.8 259 2090 37 1.7 2127
20 Wahroonga Presbyterian 189 8.3 2090 91.7 239 2518 37 1.4 2555
21 Wahroonga Public 182 8.0 2086 92.0 238 2506 37 1.5 2543
22 Waitara Public 223 19.8 905 80.2 129 1257 34 2.6 1291
23 Warrawee Public 203 11.2 1604 88.8 327 2134 29 1.3 2163
Ordinary Votes 3802 12.7 26201 87.3 4095 34098 628 1.8 34726
Absent 847 17.2 4065 82.8 733 5645 96 1.7 5741
Declared Institution 46 9.5 436 90.5 23 505 5 1.0 510
Enrolment New 3 7.3 38 92.7 8 49 0 0.0 49
Postal/iVote 413 12.0 3040 88.0 321 3774 47 1.2 3821
Pre-poll 117 10.0 1049 90.0 149 1315 16 1.2 1331
Provisional/Silent 8 9.6 75 90.4 13 96 2 2.0 98
Declaration Votes 1434 14.1 8703 85.9 1247 11384 166 1.4 11550
Grand Total 5236 13.0 34904 87.0 5342 45482 794 1.7 46276
KU-RING-GAI (2-Party Preferred)Roll : 49900 (Turnout 92.7%)
Armstrong O'Farrell
(ALP) (LIB) Informal
55

2011 New South Wales Election
POLLING PLACES Total
Exhst Formal Vote
Votes % Votes % %
1 Arcadia Vale Public 201 27.8 521 72.2 86 808 26 3.1 834
2 Awaba Public 53 24.4 164 75.6 51 268 7 2.5 275
3 Barnsley Public 93 31.2 205 68.8 61 359 27 7.0 386
4 Biraban Public 220 23.3 726 76.7 174 1120 59 5.0 1179
5 Blackalls Park Public 291 25.4 853 74.6 233 1377 65 4.5 1442
6 Bolton Pt Hall 182 32.2 383 67.8 82 647 24 3.6 671
7 Bonnells Bay Public 717 31.6 1555 68.4 287 2559 75 2.8 2634
8 Booragul Public 314 30.6 712 69.4 195 1221 31 2.5 1252
9 Cardiff Public 558 39.7 846 60.3 269 1673 77 4.4 1750
10 Coal Pt Public 465 37.4 777 62.6 99 1341 27 2.0 1368
11 Cooranbong Public 318 32.8 652 67.2 99 1069 46 4.1 1115
12 Dooralong Public 49 54.4 41 45.6 7 97 3 3.0 100
13 Dora Crk Arts Hall 414 30.6 939 69.4 147 1500 42 2.7 1542
14 Fassifern Public 223 33.2 449 66.8 88 760 26 3.3 786
15 Fennell Bay Public 274 31.4 600 68.6 210 1084 44 3.9 1128
16 Jilliby Public 339 62.2 206 37.8 64 609 20 3.2 629
17 Kilaben Bay Hall 325 35.3 595 64.7 106 1026 18 1.7 1044
18 Kulnura Hall 118 62.1 72 37.9 23 213 6 2.7 219
19 Lake Macquarie Council 604 34.0 1171 66.0 273 2048 74 3.5 2122
20 Lakelands Hall 488 42.7 655 57.3 151 1294 28 2.1 1322
21 Morisset Public 339 27.2 906 72.8 150 1395 47 3.3 1442
22 Ourimbah Public 142 75.1 47 24.9 50 239 8 3.2 247
23 Rathmines Public 641 30.8 1437 69.2 246 2324 70 2.9 2394
24 Sth Lake Macquarie Sailing Club195 22.8 662 77.2 71 928 24 2.5 952
25 Sydney Town Hall 7 41.2 10 58.8 4 21 1 4.5 22
26 Teralba Public 202 26.9 549 73.1 169 920 29 3.1 949
27 Toronto MPC 359 29.2 871 70.8 188 1418 49 3.3 1467
28 Wangi Wangi Public 416 30.0 971 70.0 166 1553 57 3.5 1610
29 Warners Bay High 132 42.2 181 57.8 45 358 11 3.0 369
30 Woodrising Neighbourhood Cntr 94 18.3 420 81.7 91 605 21 3.4 626
31 Wyee Hall 592 44.5 739 55.5 284 1615 69 4.1 1684
32 Wyong Crk Public 120 59.4 82 40.6 20 222 3 1.3 225
33 Wyong Grove Public 125 75.3 41 24.7 25 191 6 3.0 197
34 Yarramalong Public 111 67.7 53 32.3 41 205 7 3.3 212
Ordinary Votes 9721 33.7 19091 66.3 4255 33067 1127 3.3 34194
Absent 1666 46.2 1942 53.8 897 4505 141 3.0 4646
Declared Institution 72 61.5 45 38.5 65 182 2 1.1 184
Enrolment New 78 35.6 141 64.4 77 296 12 3.9 308
Postal/iVote 909 36.0 1617 64.0 370 2896 22 0.8 2918
Pre-poll 1259 33.8 2470 66.2 298 4027 82 2.0 4109
Provisional/Silent 28 35.9 50 64.1 19 97 6 5.8 103
Declaration Votes 4012 39.0 6265 61.0 1726 12003 265 2.2 12268
Grand Total 13733 35.1 25356 64.9 5981 45070 1392 3.0 46462
LAKE MACQUARIERoll : 49757 (Turnout 93.4%)
McDonald Piper
(LIB) (IND) Informal
56

2011 New South Wales Election
POLLING PLACES Total
Exhst Formal Vote
Votes % Votes % %
1 Arcadia Vale Public 230 44.2 290 55.8 288 808 26 3.1 834
2 Awaba Public 87 50.6 85 49.4 96 268 7 2.5 275
3 Barnsley Public 122 49.0 127 51.0 110 359 27 7.0 386
4 Biraban Public 448 58.1 323 41.9 349 1120 59 5.0 1179
5 Blackalls Park Public 506 54.6 421 45.4 450 1377 65 4.5 1442
6 Bolton Pt Hall 212 47.5 234 52.5 201 647 24 3.6 671
7 Bonnells Bay Public 662 39.9 996 60.1 901 2559 75 2.8 2634
8 Booragul Public 409 48.9 427 51.1 385 1221 31 2.5 1252
9 Cardiff Public 522 43.2 687 56.8 464 1673 77 4.4 1750
10 Coal Pt Public 260 29.8 612 70.2 469 1341 27 2.0 1368
11 Cooranbong Public 262 37.5 437 62.5 370 1069 46 4.1 1115
12 Dooralong Public 15 20.8 57 79.2 25 97 3 3.0 100
13 Dora Crk Arts Hall 381 39.3 588 60.7 531 1500 42 2.7 1542
14 Fassifern Public 216 42.1 297 57.9 247 760 26 3.3 786
15 Fennell Bay Public 365 49.1 378 50.9 341 1084 44 3.9 1128
16 Jilliby Public 109 22.7 371 77.3 129 609 20 3.2 629
17 Kilaben Bay Hall 246 35.9 439 64.1 341 1026 18 1.7 1044
18 Kulnura Hall 38 22.5 131 77.5 44 213 6 2.7 219
19 Lake Macquarie Council 642 45.3 775 54.7 631 2048 74 3.5 2122
20 Lakelands Hall 318 34.6 600 65.4 376 1294 28 2.1 1322
21 Morisset Public 418 46.1 489 53.9 488 1395 47 3.3 1442
22 Ourimbah Public 52 26.1 147 73.9 40 239 8 3.2 247
23 Rathmines Public 598 39.9 901 60.1 825 2324 70 2.9 2394
24 Sth Lake Macquarie Sailing Club209 39.2 324 60.8 395 928 24 2.5 952
25 Sydney Town Hall 8 57.1 6 42.9 7 21 1 4.5 22
26 Teralba Public 299 49.7 303 50.3 318 920 29 3.1 949
27 Toronto MPC 452 47.6 498 52.4 468 1418 49 3.3 1467
28 Wangi Wangi Public 437 42.8 584 57.2 532 1553 57 3.5 1610
29 Warners Bay High 80 32.8 164 67.2 114 358 11 3.0 369
30 Woodrising Neighbourhood Cntr226 58.1 163 41.9 216 605 21 3.4 626
31 Wyee Hall 478 39.8 723 60.2 414 1615 69 4.1 1684
32 Wyong Crk Public 34 19.9 137 80.1 51 222 3 1.3 225
33 Wyong Grove Public 36 22.2 126 77.8 29 191 6 3.0 197
34 Yarramalong Public 37 23.1 123 76.9 45 205 7 3.3 212
Ordinary Votes 9414 42.1 12963 57.9 10690 33067 1127 3.3 34194
Absent 1291 39.6 1968 60.4 1246 4505 141 3.0 4646
Declared Institution 65 43.6 84 56.4 33 182 2 1.1 184
Enrolment New 97 48.0 105 52.0 94 296 12 3.9 308
Postal/iVote 688 35.9 1230 64.1 978 2896 22 0.8 2918
Pre-poll 831 32.1 1755 67.9 1441 4027 82 2.0 4109
Provisional/Silent 28 42.4 38 57.6 31 97 6 5.8 103
Declaration Votes 3000 36.7 5180 63.3 3823 12003 265 2.2 12268
Grand Total 12414 40.6 18147 59.4 14509 45070 1392 3.0 46462
(Estimated two-party preferred counts)
LAKE MACQUARIE (2-Party Preferred)Roll : 49757 (Turnout 93.4%)
Mariani McDonald
(ALP) (LIB) Informal
57

2011 New South Wales Election
POLLING PLACES Total
Exhst Formal Vote
Votes % Votes % %
1 Belmore Nth Public 918 63.9 518 36.1 190 1626 128 7.3 1754
2 Belmore Snr Ctzns Cntr 866 64.2 482 35.8 112 1460 82 5.3 1542
3 Belmore Sth Public 1198 58.4 854 41.6 234 2286 146 6.0 2432
4 Beverly Hills Nth Public 1116 52.7 1001 47.3 191 2308 87 3.6 2395
5 Clemton Park Public 985 55.5 791 44.5 155 1931 131 6.4 2062
6 Hampden Park Public 873 56.7 667 43.3 143 1683 130 7.2 1813
7 Hannans Rd Public 1005 59.9 674 40.1 126 1805 85 4.5 1890
8 Kingsgrove Nth High 501 56.0 394 44.0 59 954 45 4.5 999
9 Lakemba Public 644 62.1 393 37.9 109 1146 84 6.8 1230
10 Lakemba Samoan Presbyterian849 60.3 558 39.7 162 1569 117 6.9 1686
11 McCallums Hill Public 1597 53.8 1373 46.2 330 3300 193 5.5 3493
12 Narwee Public 75 48.4 80 51.6 23 178 16 8.2 194
13 Peakhurst Public 704 47.9 765 52.1 142 1611 86 5.1 1697
14 Peakhurst W Public 341 49.0 355 51.0 66 762 38 4.8 800
15 Punchbowl Boys 41 47.7 45 52.3 9 95 8 7.8 103
16 Punchbowl Public 2118 59.8 1422 40.2 334 3874 294 7.1 4168
17 Riverwood Public 778 64.8 422 35.2 100 1300 85 6.1 1385
18 St Andrews Riverwood 821 52.6 740 47.4 143 1704 67 3.8 1771
19 St Therese Lakemba 1050 63.9 592 36.1 168 1810 99 5.2 1909
20 Sydney Town Hall 47 67.1 23 32.9 5 75 7 8.5 82
21 Wiley Park Public 1202 62.7 716 37.3 198 2116 156 6.9 2272
Ordinary Votes 17729 57.9 12865 42.1 2999 33593 2084 5.8 35677
Absent 2256 51.7 2109 48.3 676 5041 196 3.7 5237
Declared Institution 27 67.5 13 32.5 5 45 0 0.0 45
Enrolment New 87 49.4 89 50.6 27 203 8 3.8 211
Postal/iVote 2016 56.3 1562 43.7 270 3848 68 1.7 3916
Pre-poll 817 56.5 629 43.5 119 1565 59 3.6 1624
Provisional/Silent 51 42.1 70 57.9 17 138 4 2.8 142
Declaration Votes 5254 54.0 4472 46.0 1114 10840 335 3.0 11175
Grand Total 22983 57.0 17337 43.0 4113 44433 2419 5.2 46852
LAKEMBARoll : 51583 (Turnout 90.8%)
Furolo Hawatt
(ALP) (LIB) Informal
58

2011 New South Wales Election
POLLING PLACES Total
Exhst Formal Vote
Votes % Votes % %
1 Artarmon Public 355 32.9 725 67.1 136 1216 57 4.5 1273
2 Boronia Park Public 483 25.5 1410 74.5 200 2093 66 3.1 2159
3 Chatswood Guide Hall 25 25.5 73 74.5 14 112 4 3.4 116
4 Chatswood Public 98 29.3 236 70.7 67 401 18 4.3 419
5 Christ Church Gladesville 156 23.9 498 76.1 85 739 30 3.9 769
6 Evangel Bible Church 97 18.5 426 81.5 34 557 10 1.8 567
7 Gladesville Public 647 28.3 1636 71.7 270 2553 94 3.6 2647
8 Gladesville Scout Hall 412 25.2 1220 74.8 145 1777 73 3.9 1850
9 Greenwich Comm. Cntr 312 21.6 1134 78.4 226 1672 43 2.5 1715
10 Greenwich Public 159 22.3 554 77.7 103 816 24 2.9 840
11 Henley LDC Cntr 118 18.6 516 81.4 60 694 18 2.5 712
12 Holy Trinity Chatswood W 47 17.7 218 82.3 32 297 7 2.3 304
13 Hunters Hill Public 187 13.1 1236 86.9 124 1547 30 1.9 1577
14 Lane Cove Civic Cntr 184 25.7 532 74.3 95 811 26 3.1 837
15 Lane Cove Public 595 23.5 1935 76.5 337 2867 63 2.2 2930
16 Lane Cove W Bowling Club 360 20.7 1379 79.3 236 1975 55 2.7 2030
17 Lane Cove W Public 245 19.3 1023 80.7 152 1420 36 2.5 1456
18 Marist Sisters' Cllg 120 16.7 600 83.3 41 761 10 1.3 771
19 Mowbray Public 353 23.2 1170 76.8 161 1684 49 2.8 1733
20 Nth Ryde Public 38 22.9 128 77.1 23 189 10 5.0 199
21 Putney Public 521 20.7 1994 79.3 195 2710 89 3.2 2799
22 RNS Hospital 91 29.2 221 70.8 50 362 5 1.4 367
23 Ryde E Public 417 24.9 1258 75.1 167 1842 75 3.9 1917
24 Ryde Public 89 38.2 144 61.8 28 261 9 3.3 270
25 Ryde Secondary Cllg 87 30.5 198 69.5 23 308 7 2.2 315
26 St Andrews Longueville 236 15.4 1292 84.6 168 1696 34 2.0 1730
27 St Ignatius - Jnr School 148 19.1 627 80.9 94 869 9 1.0 878
28 St Marks Hunters Hill 211 22.1 743 77.9 87 1041 20 1.9 1061
29 Sydney Town Hall 18 32.1 38 67.9 17 73 1 1.4 74
Ordinary Votes 6809 22.7 23164 77.3 3370 33343 972 2.8 34315
Absent 1043 24.6 3204 75.4 580 4827 128 2.6 4955
Declared Institution 73 22.1 257 77.9 23 353 7 1.9 360
Enrolment New 24 22.9 81 77.1 15 120 6 4.8 126
Postal/iVote 632 21.1 2357 78.9 205 3194 34 1.1 3228
Pre-poll 199 17.6 929 82.4 91 1219 16 1.3 1235
Provisional/Silent 39 27.9 101 72.1 20 160 10 5.9 170
Declaration Votes 2010 22.5 6929 77.5 934 9873 201 2.0 10074
Grand Total 8819 22.7 30093 77.3 4304 43216 1173 2.6 44389
LANE COVE (2-Party Preferred)Roll : 47976 (Turnout 92.5%)
Tsang Roberts
(ALP) (LIB) Informal
59

2011 New South Wales Election
POLLING PLACES Total
Exhst Formal Vote
Votes % Votes % %
1 Bentley Hall 38 16.1 198 83.9 19 255 4 1.5 259
2 Bexhill Hall 97 16.2 501 83.8 59 657 14 2.1 671
3 Bonalbo Hall 55 17.8 254 82.2 18 327 5 1.5 332
4 Caniaba Public 53 14.9 302 85.1 32 387 3 0.8 390
5 Casino Civic Hall 71 17.0 346 83.0 24 441 7 1.6 448
6 Cawongla Pre-School 169 63.5 97 36.5 108 374 11 2.9 385
7 Chillingham Public 55 27.2 147 72.8 45 247 4 1.6 251
8 Clovass-McKees Hill Hall 15 8.3 165 91.7 7 187 1 0.5 188
9 Clunes Public 145 31.8 311 68.2 84 540 3 0.6 543
10 Condong Public 51 26.8 139 73.2 35 225 6 2.6 231
11 Crystal Crk Public 65 23.1 216 76.9 38 319 12 3.6 331
12 Dungay Public 51 25.2 151 74.8 31 233 6 2.5 239
13 Dunoon Public 174 38.3 280 61.7 110 564 15 2.6 579
14 Eltham Public 72 27.4 191 72.6 39 302 6 1.9 308
15 Fairy Hill Hall 44 11.6 334 88.4 24 402 6 1.5 408
16 Federal Hall 187 45.6 223 54.4 161 571 8 1.4 579
17 Goolmangar Arts Hall 89 17.8 410 82.2 62 561 7 1.2 568
18 Goonellabah Comm. Cntr 405 20.7 1548 79.3 151 2104 40 1.9 2144
19 Goonellabah Public 459 20.4 1794 79.6 143 2396 52 2.1 2448
20 Grevillia Hall 29 24.4 90 75.6 8 127 4 3.1 131
21 Horseshoe Crk Hall 43 30.5 98 69.5 22 163 5 3.0 168
22 Jiggi Public 88 47.1 99 52.9 44 231 5 2.1 236
23 Jubullum LALC 14 48.3 15 51.7 4 33 0 0.0 33
24 Kunghur Hall 66 42.9 88 57.1 37 191 4 2.1 195
25 Kyogle Hall 311 22.7 1061 77.3 141 1513 28 1.8 1541
26 Kyogle High 122 23.8 390 76.2 35 547 9 1.6 556
27 Legume Hall 12 10.7 100 89.3 9 121 1 0.8 122
28 Lismore Hghts Public 214 23.9 682 76.1 110 1006 20 1.9 1026
29 Lismore High 339 22.3 1184 77.7 143 1666 33 1.9 1699
30 Lismore Hospital 81 31.3 178 68.7 40 299 8 2.6 307
31 Lismore Public 289 25.3 855 74.7 141 1285 33 2.5 1318
32 Lismore Sth Public 341 23.8 1094 76.2 150 1585 45 2.8 1630
33 Liston Hall 18 15.1 101 84.9 12 131 1 0.8 132
34 Mallanganee Hall 33 16.9 162 83.1 20 215 2 0.9 217
35 Modanville Public 65 19.2 274 80.8 43 382 7 1.8 389
36 Murwillumbah Civic Cntr 515 33.3 1030 66.7 339 1884 61 3.1 1945
37 Nimbin School 406 63.3 235 36.7 286 927 21 2.2 948
38 Richmond Rv High 109 25.0 327 75.0 52 488 8 1.6 496
39 Rosebank Public 102 53.1 90 46.9 64 256 1 0.4 257
40 St Josephs Sth Murwillumbah 221 28.6 553 71.4 113 887 29 3.2 916
41 St Pauls Lismore 478 31.2 1053 68.8 300 1831 41 2.2 1872
42 St Vincents Hospital E Lismore 112 20.8 427 79.2 40 579 7 1.2 586
43 Stokers Siding Public 88 34.1 170 65.9 66 324 9 2.7 333
44 Sydney Town Hall 1 12.5 7 87.5 5 13 0 0.0 13
45 Tabulam Public 47 32.4 98 67.6 22 167 5 2.9 172
46 The Channon Hall 130 48.7 137 51.3 103 370 3 0.8 373
47 Tregeagle Public 64 14.7 371 85.3 24 459 8 1.7 467
48 Trinity Cllg -Jnr Campus Lismore279 24.9 840 75.1 143 1262 21 1.6 1283
49 Tyalgum Public 89 23.9 283 76.1 95 467 10 2.1 477
50 Uki Public 247 45.1 301 54.9 227 775 21 2.6 796
51 Urbenville Public 12 7.6 146 92.4 18 176 8 4.3 184
52 Wiangaree Hall 53 20.2 209 79.8 19 281 6 2.1 287
53 Wilsons Crk Hall 62 66.0 32 34.0 85 179 1 0.6 180
54 Wollumbin High 219 25.9 628 74.1 90 937 30 3.1 967
55 Woodenbong School 32 11.6 243 88.4 32 307 11 3.5 318
56 Wyrallah Public 64 15.3 354 84.7 25 443 3 0.7 446
Ordinary Votes 7690 26.2 21612 73.8 4297 33599 719 2.1 34318
Absent 902 31.8 1938 68.2 659 3499 84 2.3 3583
Declared Institution 45 22.3 157 77.7 18 220 8 3.5 228
Enrolment New 63 35.6 114 64.4 52 229 9 3.8 238
Postal/iVote 478 20.0 1912 80.0 243 2633 19 0.7 2652
Pre-poll 817 20.2 3231 79.8 357 4405 78 1.7 4483
Provisional/Silent 46 35.9 82 64.1 32 160 4 2.4 164
Declaration Votes 2351 24.0 7434 76.0 1361 11146 202 1.8 11348
Grand Total 10041 25.7 29046 74.3 5658 44745 921 2.0 45666
LISMORE (2-Party Preferred)Roll : 50286 (Turnout 90.8%)
Moy George
(ALP) (NAT) Informal
60
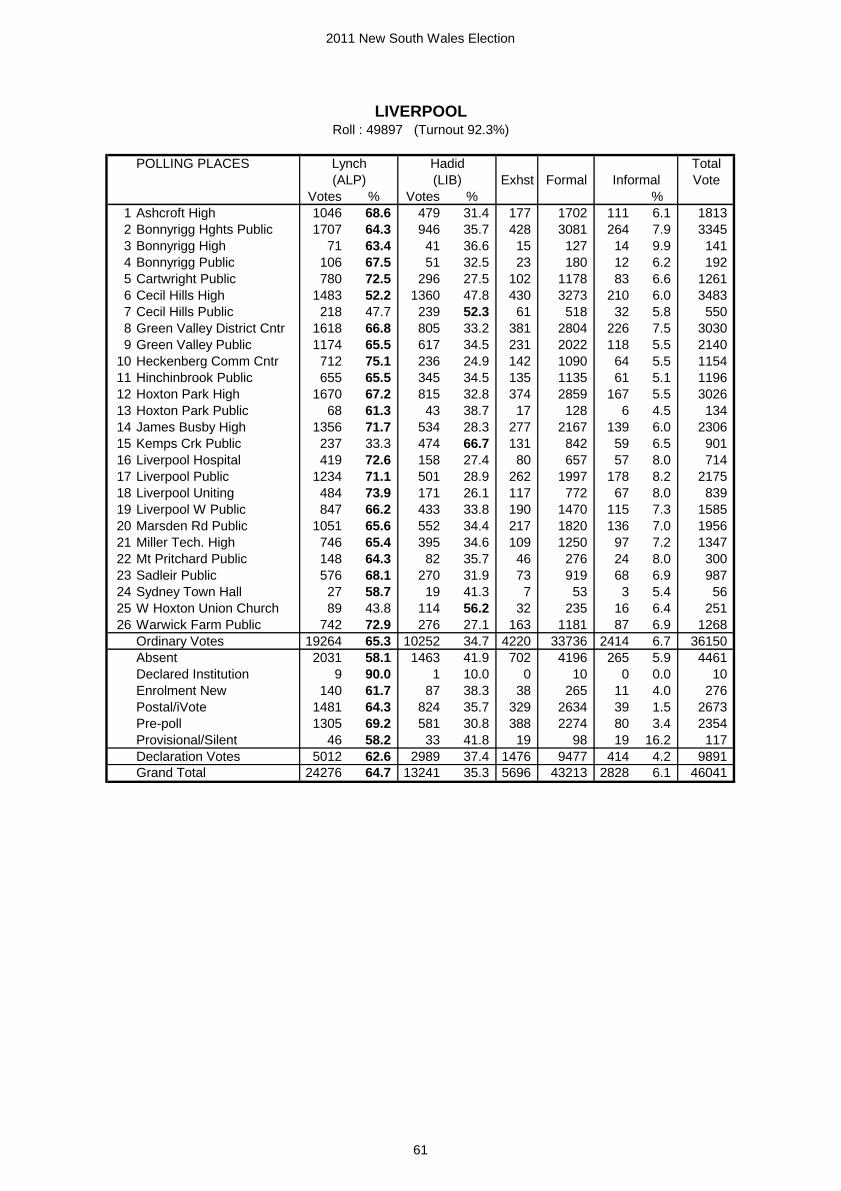
2011 New South Wales Election
POLLING PLACES Total
Exhst Formal Vote
Votes % Votes % %
1 Ashcroft High 1046 68.6 479 31.4 177 1702 111 6.1 1813
2 Bonnyrigg Hghts Public 1707 64.3 946 35.7 428 3081 264 7.9 3345
3 Bonnyrigg High 71 63.4 41 36.6 15 127 14 9.9 141
4 Bonnyrigg Public 106 67.5 51 32.5 23 180 12 6.2 192
5 Cartwright Public 780 72.5 296 27.5 102 1178 83 6.6 1261
6 Cecil Hills High 1483 52.2 1360 47.8 430 3273 210 6.0 3483
7 Cecil Hills Public 218 47.7 239 52.3 61 518 32 5.8 550
8 Green Valley District Cntr 1618 66.8 805 33.2 381 2804 226 7.5 3030
9 Green Valley Public 1174 65.5 617 34.5 231 2022 118 5.5 2140
10 Heckenberg Comm Cntr 712 75.1 236 24.9 142 1090 64 5.5 1154
11 Hinchinbrook Public 655 65.5 345 34.5 135 1135 61 5.1 1196
12 Hoxton Park High 1670 67.2 815 32.8 374 2859 167 5.5 3026
13 Hoxton Park Public 68 61.3 43 38.7 17 128 6 4.5 134
14 James Busby High 1356 71.7 534 28.3 277 2167 139 6.0 2306
15 Kemps Crk Public 237 33.3 474 66.7 131 842 59 6.5 901
16 Liverpool Hospital 419 72.6 158 27.4 80 657 57 8.0 714
17 Liverpool Public 1234 71.1 501 28.9 262 1997 178 8.2 2175
18 Liverpool Uniting 484 73.9 171 26.1 117 772 67 8.0 839
19 Liverpool W Public 847 66.2 433 33.8 190 1470 115 7.3 1585
20 Marsden Rd Public 1051 65.6 552 34.4 217 1820 136 7.0 1956
21 Miller Tech. High 746 65.4 395 34.6 109 1250 97 7.2 1347
22 Mt Pritchard Public 148 64.3 82 35.7 46 276 24 8.0 300
23 Sadleir Public 576 68.1 270 31.9 73 919 68 6.9 987
24 Sydney Town Hall 27 58.7 19 41.3 7 53 3 5.4 56
25 W Hoxton Union Church 89 43.8 114 56.2 32 235 16 6.4 251
26 Warwick Farm Public 742 72.9 276 27.1 163 1181 87 6.9 1268
Ordinary Votes 19264 65.3 10252 34.7 4220 33736 2414 6.7 36150
Absent 2031 58.1 1463 41.9 702 4196 265 5.9 4461
Declared Institution 9 90.0 1 10.0 0 10 0 0.0 10
Enrolment New 140 61.7 87 38.3 38 265 11 4.0 276
Postal/iVote 1481 64.3 824 35.7 329 2634 39 1.5 2673
Pre-poll 1305 69.2 581 30.8 388 2274 80 3.4 2354
Provisional/Silent 46 58.2 33 41.8 19 98 19 16.2 117
Declaration Votes 5012 62.6 2989 37.4 1476 9477 414 4.2 9891
Grand Total 24276 64.7 13241 35.3 5696 43213 2828 6.1 46041
LIVERPOOLRoll : 49897 (Turnout 92.3%)
Lynch Hadid
(ALP) (LIB) Informal
61

2011 New South Wales Election
POLLING PLACES Total
Exhst Formal Vote
Votes % Votes % %
1 Berkshire Park Hall 69 18.0 314 82.0 21 404 18 4.3 422
2 Cambridge Gardens Public 703 37.9 1150 62.1 148 2001 113 5.3 2114
3 Cambridge Park High 465 44.0 592 56.0 97 1154 54 4.5 1208
4 Cambridge Park Public 888 42.6 1196 57.4 246 2330 118 4.8 2448
5 Castlereagh Public 151 19.2 634 80.8 44 829 21 2.5 850
6 Grose View Public 184 23.9 587 76.1 82 853 28 3.2 881
7 Hawkesbury High 126 21.1 470 78.9 68 664 29 4.2 693
8 Hobartville Public 446 29.7 1055 70.3 164 1665 67 3.9 1732
9 Kurmond Public 102 18.9 439 81.1 51 592 20 3.3 612
10 Kurrajong Hghts Uniting 69 22.6 236 77.4 36 341 6 1.7 347
11 Kurrajong Public 275 26.4 766 73.6 137 1178 26 2.2 1204
12 Lethbridge Park Public 523 57.8 382 42.2 91 996 76 7.1 1072
13 Llandilo Public 229 23.8 733 76.2 63 1025 48 4.5 1073
14 Londonderry N'hood Cntr 497 29.0 1217 71.0 138 1852 85 4.4 1937
15 Mt Druitt Public 266 59.6 180 40.4 49 495 29 5.5 524
16 Nth Richmond Comm. Cntr 464 25.6 1347 74.4 159 1970 78 3.8 2048
17 Richmond Arts Hall 164 27.1 441 72.9 62 667 20 2.9 687
18 Richmond Public 440 29.0 1075 71.0 166 1681 61 3.5 1742
19 Samuel Terry Public 468 29.9 1096 70.1 161 1725 88 4.9 1813
20 St Dominic's Cllg 174 46.4 201 53.6 46 421 39 8.5 460
21 St Marys Nth Public 683 52.4 621 47.6 168 1472 81 5.2 1553
22 Sydney Town Hall 10 58.8 7 41.2 2 19 1 5.0 20
23 Tregear Public 916 58.1 660 41.9 141 1717 99 5.5 1816
24 Werrington County Public 630 38.9 990 61.1 134 1754 79 4.3 1833
25 Werrington Public 731 46.2 852 53.8 146 1729 74 4.1 1803
26 Whalan Public 893 62.9 527 37.1 155 1575 82 4.9 1657
27 Windsor Function Cntr 34 32.1 72 67.9 13 119 8 6.3 127
28 Yarramundi Comm. Cntr 41 20.3 161 79.7 12 214 6 2.7 220
Ordinary Votes 10641 37.2 18001 62.8 2800 31442 1454 4.4 32896
Absent 2187 43.3 2859 56.7 681 5727 203 3.4 5930
Declared Institution 0 0.0 0 0.0 0 0 0 0.0 0
Enrolment New 126 40.1 188 59.9 47 361 13 3.5 374
Postal/iVote 1067 40.0 1603 60.0 210 2880 29 1.0 2909
Pre-poll 580 28.6 1448 71.4 130 2158 50 2.3 2208
Provisional/Silent 20 28.6 50 71.4 8 78 3 3.7 81
Declaration Votes 3980 39.3 6148 60.7 1076 11204 298 2.6 11502
Grand Total 14621 37.7 24149 62.3 3876 42646 1752 3.9 44398
LONDONDERRYRoll : 47633 (Turnout 93.2%)
Shearan Bassett
(ALP) (LIB) Informal
62

2011 New South Wales Election
POLLING PLACES Total
Exhst Formal Vote
Votes % Votes % %
1 Austral Public 343 32.5 712 67.5 162 1217 60 4.7 1277
2 Casula High 913 46.3 1060 53.7 310 2283 130 5.4 2413
3 Casula Public 1491 53.6 1292 46.4 512 3295 222 6.3 3517
4 Dalmeny Public 1098 52.6 991 47.4 325 2414 128 5.0 2542
5 Glenfield Public 1004 57.2 752 42.8 303 2059 84 3.9 2143
6 Glenwood Public 676 54.0 576 46.0 242 1494 65 4.2 1559
7 Greenway Park Public 1109 45.8 1314 54.2 507 2930 149 4.8 3079
8 Guise Public 880 72.7 330 27.3 299 1509 94 5.9 1603
9 Hoxton Park Public 1066 55.7 849 44.3 343 2258 139 5.8 2397
10 Ingleburn Nth Public 232 28.4 586 71.6 114 932 37 3.8 969
11 Ingleburn Public 134 48.7 141 51.3 56 331 24 6.8 355
12 John Edmondson High 459 53.1 406 46.9 164 1029 43 4.0 1072
13 Liverpool Public 125 52.1 115 47.9 42 282 25 8.1 307
14 Liverpool W Public 629 56.6 482 43.4 221 1332 125 8.6 1457
15 Lurnea Public 1039 61.3 657 38.7 330 2026 195 8.8 2221
16 Macquarie Fields Baptist 634 55.8 502 44.2 239 1375 65 4.5 1440
17 Macquarie Fields Public 1221 58.1 882 41.9 427 2530 146 5.5 2676
18 Prestons Public 1339 52.4 1217 47.6 517 3073 192 5.9 3265
19 Sydney Town Hall 15 38.5 24 61.5 8 47 3 6.0 50
20 W Hoxton Union Church 145 35.0 269 65.0 67 481 30 5.9 511
21 William Carey School 780 49.0 811 51.0 256 1847 61 3.2 1908
Ordinary Votes 15332 52.3 13968 47.7 5444 34744 2017 5.5 36761
Absent 2169 48.5 2303 51.5 931 5403 235 4.2 5638
Declared Institution 39 54.2 33 45.8 7 79 7 8.1 86
Enrolment New 82 51.2 78 48.8 32 192 5 2.5 197
Postal/iVote 1425 48.7 1502 51.3 442 3369 55 1.6 3424
Pre-poll 570 48.4 607 51.6 264 1441 37 2.5 1478
Provisional/Silent 11 42.3 15 57.7 7 33 0 0.0 33
Declaration Votes 4296 48.6 4538 51.4 1683 10517 339 3.1 10856
Grand Total 19626 51.5 18510 48.5 7125 45261 2356 4.9 47617
MACQUARIE FIELDSRoll : 51735 (Turnout 92.0%)
McDonald Eskaros
(ALP) (LIB) Informal
63

2011 New South Wales Election
POLLING PLACES Total
Exhst Formal Vote
Votes % Votes % %
1 Bolwarra Public 324 30.1 754 69.9 191 1269 24 1.9 1293
2 Bruce Street Hall 235 55.6 188 44.4 96 519 28 5.1 547
3 E Maitland Public 782 43.9 999 56.1 398 2179 73 3.2 2252
4 Hinton Public 210 29.5 503 70.5 144 857 20 2.3 877
5 Irrawang Public 141 34.3 270 65.7 76 487 26 5.1 513
6 Largs Public 296 31.5 645 68.5 197 1138 33 2.8 1171
7 Lochinvar Public 310 35.9 553 64.1 158 1021 27 2.6 1048
8 Maitland Church of Christ 538 37.7 888 62.3 308 1734 50 2.8 1784
9 Maitland High 522 48.9 546 51.1 280 1348 35 2.5 1383
10 Maitland Town Hall 600 49.4 614 50.6 324 1538 50 3.1 1588
11 Metford Public 945 52.2 867 47.8 493 2305 76 3.2 2381
12 Millers Forest Public 56 23.4 183 76.6 35 274 2 0.7 276
13 Morpeth Uniting 359 39.8 542 60.2 237 1138 22 1.9 1160
14 Nillo School 413 37.8 679 62.2 250 1342 34 2.5 1376
15 Oakwood Village 179 47.4 199 52.6 63 441 17 3.7 458
16 Raymond Terrace Public 197 35.1 364 64.9 110 671 24 3.5 695
17 Rutherford Pre-school 442 54.2 373 45.8 177 992 39 3.8 1031
18 Rutherford Tech. High 1349 47.8 1474 52.2 638 3461 149 4.1 3610
19 Seaham Public 263 28.0 677 72.0 232 1172 43 3.5 1215
20 Shamrock Hill MPC 708 37.2 1193 62.8 447 2348 71 2.9 2419
21 Somerset Sports 340 40.3 504 59.7 178 1022 22 2.1 1044
22 St Pauls Rutherford 547 50.9 527 49.1 232 1306 52 3.8 1358
23 Sydney Town Hall 11 42.3 15 57.7 1 27 1 3.6 28
24 Telarah Public 676 57.4 502 42.6 308 1486 56 3.6 1542
25 Tenambit Public 726 47.0 818 53.0 363 1907 69 3.5 1976
26 Thornton Public 1116 47.3 1243 52.7 624 2983 133 4.3 3116
27 Woodberry Public 726 59.1 502 40.9 307 1535 79 4.9 1614
28 Woodville Arts Hall 178 38.0 290 62.0 66 534 18 3.3 552
Ordinary Votes 13189 43.8 16912 56.2 6933 37034 1273 3.3 38307
Absent 1287 42.3 1754 57.7 663 3704 108 2.8 3812
Declared Institution 70 47.6 77 52.4 19 166 7 4.0 173
Enrolment New 126 51.0 121 49.0 82 329 9 2.7 338
Postal/iVote 1315 45.2 1594 54.8 478 3387 45 1.3 3432
Pre-poll 1105 41.6 1552 58.4 627 3284 92 2.7 3376
Provisional/Silent 43 47.8 47 52.2 25 115 1 0.9 116
Declaration Votes 3946 43.4 5145 56.6 1894 10985 262 2.3 11247
Grand Total 17135 43.7 22057 56.3 8827 48019 1535 3.1 49554
MAITLANDRoll : 52441 (Turnout 94.5%)
Terenzini Parker
(ALP) (LIB) Informal
64

2011 New South Wales Election
POLLING PLACES Total
Exhst Formal Vote
Votes % Votes % %
1 All Saints Balgowlah 175 16.9 861 83.1 107 1143 29 2.5 1172
2 Balgowlah Boys High 239 12.5 1677 87.5 146 2062 40 1.9 2102
3 Balgowlah Hghts Public 234 10.4 2010 89.6 156 2400 31 1.3 2431
4 Balgowlah Nth Public 292 16.8 1446 83.2 177 1915 44 2.2 1959
5 Brookvale Public 52 21.7 188 78.3 44 284 21 6.9 305
6 Curl Curl Nth Public 413 18.8 1787 81.2 221 2421 70 2.8 2491
7 Dee Why Public 24 20.7 92 79.3 13 129 7 5.1 136
8 Freshwater SLSC 155 18.1 701 81.9 80 936 23 2.4 959
9 Harbord Public 475 18.1 2152 81.9 255 2882 79 2.7 2961
10 Manly Hospital 77 18.8 333 81.2 33 443 4 0.9 447
11 Manly Vllg Public 574 20.0 2289 80.0 467 3330 95 2.8 3425
12 Manly W Public 449 19.1 1902 80.9 303 2654 64 2.4 2718
13 Queenscliff SLSC 258 16.3 1326 83.7 200 1784 38 2.1 1822
14 Seaforth Public 302 15.1 1697 84.9 154 2153 42 1.9 2195
15 St Johns Dee Why 131 19.1 555 80.9 97 783 33 4.0 816
16 St Kevins Dee Why 170 26.4 473 73.6 94 737 38 4.9 775
17 St Kierans Manly Vale 438 22.8 1480 77.2 259 2177 79 3.5 2256
18 St Mary Manly 134 19.7 546 80.3 80 760 18 2.3 778
19 Sydney Town Hall 17 29.8 40 70.2 6 63 2 3.1 65
20 The Beach School 10 21.3 37 78.7 3 50 1 2.0 51
21 Waves Youth Club 408 19.2 1715 80.8 266 2389 61 2.5 2450
22 William St Studios 202 17.9 928 82.1 142 1272 28 2.2 1300
Ordinary Votes 5229 17.7 24235 82.3 3303 32767 847 2.5 33614
Absent 785 20.5 3045 79.5 519 4349 97 2.2 4446
Declared Institution 13 23.2 43 76.8 6 62 0 0.0 62
Enrolment New 41 18.1 185 81.9 44 270 6 2.2 276
Postal/iVote 370 14.5 2184 85.5 196 2750 24 0.9 2774
Pre-poll 365 14.8 2105 85.2 271 2741 40 1.4 2781
Provisional/Silent 18 18.9 77 81.1 21 116 4 3.3 120
Declaration Votes 1592 17.2 7639 82.8 1057 10288 171 1.6 10459
Grand Total 6821 17.6 31874 82.4 4360 43055 1018 2.3 44073
MANLY (2-Party Preferred)Roll : 48337 (Turnout 91.2%)
Jary Baird
(ALP) (LIB) Informal
65

2011 New South Wales Election
POLLING PLACES Total
Exhst Formal Vote
Votes % Votes % %
1 Banksmeadow Public 698 61.0 447 39.0 50 1195 37 3.0 1232
2 Botany Public 875 56.1 684 43.9 111 1670 66 3.8 1736
3 Chifley Public 1059 57.5 782 42.5 77 1918 69 3.5 1987
4 Daceyville Public 138 53.9 118 46.1 20 276 7 2.5 283
5 Holy Trinity Kingsford 652 53.4 568 46.6 94 1314 56 4.1 1370
6 La Perouse Public 620 54.9 509 45.1 64 1193 44 3.6 1237
7 Malabar Public 1001 52.1 922 47.9 100 2023 58 2.8 2081
8 Maroubra Bay Public 687 51.2 656 48.8 116 1459 47 3.1 1506
9 Maroubra Jtn Public 1604 46.9 1818 53.1 176 3598 115 3.1 3713
10 Maroubra Snr Ctzns Cntr 114 51.1 109 48.9 14 237 3 1.2 240
11 Maroubra Uniting 304 30.9 679 69.1 51 1034 26 2.5 1060
12 Matraville Public 1361 61.3 858 38.7 141 2360 127 5.1 2487
13 Matraville Soldiers Public 664 55.8 527 44.2 67 1258 42 3.2 1300
14 Pagewood Public 774 48.6 818 51.4 90 1682 51 2.9 1733
15 Rainbow St Public 298 44.9 366 55.1 57 721 25 3.4 746
16 St Agnes Matraville 1110 55.4 892 44.6 123 2125 76 3.5 2201
17 St Johns Maroubra 608 45.1 741 54.9 98 1447 48 3.2 1495
18 St Mary & Joseph Primary 1625 56.0 1276 44.0 161 3062 95 3.0 3157
19 Sth Coogee Public 837 41.0 1202 59.0 102 2141 59 2.7 2200
20 Sth Sydney High 942 50.4 927 49.6 116 1985 49 2.4 2034
21 Sydney Town Hall 47 60.3 31 39.7 7 85 5 5.6 90
Ordinary Votes 16018 51.8 14930 48.2 1835 32783 1105 3.3 33888
Absent 1672 50.7 1626 49.3 388 3686 122 3.2 3808
Declared Institution 50 60.2 33 39.8 1 84 2 2.3 86
Enrolment New 115 58.1 83 41.9 27 225 11 4.7 236
Postal/iVote 1725 47.0 1945 53.0 191 3861 42 1.1 3903
Pre-poll 2284 54.1 1935 45.9 165 4384 73 1.6 4457
Provisional/Silent 58 50.9 56 49.1 7 121 4 3.2 125
Declaration Votes 5904 51.0 5678 49.0 779 12361 254 2.0 12615
Grand Total 21930 51.6 20607 48.4 2607 45144 1359 2.9 46503
MAROUBRARoll : 50198 (Turnout 92.6%)
Daley Feneley
(ALP) (LIB) Informal
66

2011 New South Wales Election
POLLING PLACES Total
Exhst Formal Vote
Votes % Votes % %
1 Australia St School 743 40.8 1079 59.2 288 2110 45 2.1 2155
2 Bridge Rd Public 237 39.7 360 60.3 94 691 12 1.7 703
3 Camdenville Public 450 40.5 661 59.5 149 1260 38 2.9 1298
4 Darlington Public 505 44.8 623 55.2 226 1354 28 2.0 1382
5 Dulwich High 777 65.6 408 34.4 297 1482 81 5.2 1563
6 Dulwich Hill Public 396 66.0 204 34.0 107 707 26 3.5 733
7 Enmore TAFE Design Cntr 637 42.8 853 57.2 289 1779 51 2.8 1830
8 Erskineville Public 348 39.5 532 60.5 138 1018 16 1.5 1034
9 Ferncourt Public 408 56.0 320 44.0 130 858 27 3.1 885
10 Lewisham Public 903 57.3 674 42.7 405 1982 52 2.6 2034
11 Marrickville Public 642 59.6 435 40.4 251 1328 64 4.6 1392
12 Marrickville Town Hall 1451 65.4 766 34.6 459 2676 123 4.4 2799
13 Marrickville Uniting 975 67.3 473 32.7 295 1743 91 5.0 1834
14 Marrickville W Public 1054 64.5 581 35.5 338 1973 92 4.5 2065
15 Newtown Mission Chapel 643 37.8 1058 62.2 291 1992 54 2.6 2046
16 Newtown Public 330 37.2 556 62.8 115 1001 17 1.7 1018
17 Petersham TAFE 380 51.7 355 48.3 227 962 56 5.5 1018
18 Petersham Town Hall 655 52.4 595 47.6 314 1564 50 3.1 1614
19 RPA Hospital 103 43.8 132 56.2 56 291 7 2.3 298
20 Salvo Hall Dulwich Hill 349 60.0 233 40.0 132 714 17 2.3 731
21 Seymour Cntr 146 39.6 223 60.4 65 434 5 1.1 439
22 St Clements Marrickville 326 61.6 203 38.4 99 628 28 4.3 656
23 St Peters Town Hall 45 47.9 49 52.1 20 114 3 2.6 117
24 Stanmore Baptist 482 59.1 334 40.9 258 1074 40 3.6 1114
25 Stanmore Public 1078 47.1 1209 52.9 531 2818 70 2.4 2888
26 Sydney Town Hall 62 44.0 79 56.0 45 186 11 5.6 197
27 Wilkins Public 625 57.9 455 42.1 202 1282 36 2.7 1318
Ordinary Votes 14750 52.3 13450 47.7 5821 34021 1140 3.2 35161
Absent 1896 42.4 2575 57.6 1257 5728 127 2.2 5855
Declared Institution 35 92.1 3 7.9 27 65 1 1.5 66
Enrolment New 104 36.2 183 63.8 59 346 4 1.1 350
Postal/iVote 1223 47.6 1344 52.4 629 3196 37 1.1 3233
Pre-poll 977 58.0 708 42.0 450 2135 62 2.8 2197
Provisional/Silent 61 36.3 107 63.7 38 206 6 2.8 212
Declaration Votes 4296 46.6 4920 53.4 2460 11676 237 2.0 11913
Grand Total 19046 50.9 18370 49.1 8281 45697 1377 2.9 47074
MARRICKVILLERoll : 52182 (Turnout 90.2%)
Tebbutt Byrne
(ALP) (GRN) Informal
67

2011 New South Wales Election
POLLING PLACES Total
Exhst Formal Vote
Votes % Votes % %
1 Australia St School 1115 72.6 420 27.4 575 2110 45 2.1 2155
2 Bridge Rd Public 350 69.3 155 30.7 186 691 12 1.7 703
3 Camdenville Public 683 76.3 212 23.7 365 1260 38 2.9 1298
4 Darlington Public 687 68.5 316 31.5 351 1354 28 2.0 1382
5 Dulwich High 903 73.4 328 26.6 251 1482 81 5.2 1563
6 Dulwich Hill Public 452 76.7 137 23.3 118 707 26 3.5 733
7 Enmore TAFE Design Cntr 938 72.4 358 27.6 483 1779 51 2.8 1830
8 Erskineville Public 529 72.1 205 27.9 284 1018 16 1.5 1034
9 Ferncourt Public 498 73.8 177 26.2 183 858 27 3.1 885
10 Lewisham Public 1093 69.3 484 30.7 405 1982 52 2.6 2034
11 Marrickville Public 771 72.7 289 27.3 268 1328 64 4.6 1392
12 Marrickville Town Hall 1687 76.8 510 23.2 479 2676 123 4.4 2799
13 Marrickville Uniting 1106 76.4 341 23.6 296 1743 91 5.0 1834
14 Marrickville W Public 1210 74.9 406 25.1 357 1973 92 4.5 2065
15 Newtown Mission Chapel 1017 72.4 387 27.6 588 1992 54 2.6 2046
16 Newtown Public 505 71.3 203 28.7 293 1001 17 1.7 1018
17 Petersham TAFE 483 63.3 280 36.7 199 962 56 5.5 1018
18 Petersham Town Hall 835 68.2 389 31.8 340 1564 50 3.1 1614
19 RPA Hospital 137 62.3 83 37.7 71 291 7 2.3 298
20 Salvo Hall Dulwich Hill 422 73.3 154 26.7 138 714 17 2.3 731
21 Seymour Cntr 217 69.8 94 30.2 123 434 5 1.1 439
22 St Clements Marrickville 379 74.5 130 25.5 119 628 28 4.3 656
23 St Peters Town Hall 62 72.9 23 27.1 29 114 3 2.6 117
24 Stanmore Baptist 562 63.8 319 36.2 193 1074 40 3.6 1114
25 Stanmore Public 1476 69.3 653 30.7 689 2818 70 2.4 2888
26 Sydney Town Hall 88 64.2 49 35.8 49 186 11 5.6 197
27 Wilkins Public 756 73.9 267 26.1 259 1282 36 2.7 1318
Ordinary Votes 18961 72.0 7369 28.0 7691 34021 1140 3.2 35161
Absent 2718 64.1 1519 35.9 1491 5728 127 2.2 5855
Declared Institution 37 59.7 25 40.3 3 65 1 1.5 66
Enrolment New 167 67.6 80 32.4 99 346 4 1.1 350
Postal/iVote 1616 65.8 840 34.2 740 3196 37 1.1 3233
Pre-poll 1184 68.2 553 31.8 398 2135 62 2.8 2197
Provisional/Silent 94 65.7 49 34.3 63 206 6 2.8 212
Declaration Votes 5816 65.5 3066 34.5 2794 11676 237 2.0 11913
Grand Total 24777 70.4 10435 29.6 10485 45697 1377 2.9 47074
(Estimated two-party preferred counts)
MARRICKVILLE (2-Party Preferred)Roll : 52182 (Turnout 90.2%)
Tebbutt Tyler
(ALP) (LIB) Informal
68

2011 New South Wales Election
POLLING PLACES Total
Exhst Formal Vote
Votes % Votes % %
1 Alfords Pt Public 392 20.2 1549 79.8 152 2093 77 3.5 2170
2 Bangor Public 660 19.6 2709 80.4 298 3667 104 2.8 3771
3 Chipping Norton Comm. Cntr 593 26.4 1652 73.6 268 2513 119 4.5 2632
4 Hammondville Public 484 31.7 1042 68.3 278 1804 62 3.3 1866
5 Holsworthy Public 402 33.1 813 66.9 189 1404 50 3.4 1454
6 Illawong Public 546 19.2 2303 80.8 290 3139 77 2.4 3216
7 Inaburra School 81 19.9 326 80.1 33 440 10 2.2 450
8 Menai Comm. Cntr 572 23.3 1878 76.7 223 2673 68 2.5 2741
9 Menai Primary 517 26.8 1411 73.2 205 2133 69 3.1 2202
10 Newbridge Hghts Public 477 29.0 1166 71.0 228 1871 100 5.1 1971
11 Nuwarra Public 891 30.9 1993 69.1 392 3276 194 5.6 3470
12 Sandy Pt Comm Cntr 75 23.5 244 76.5 46 365 11 2.9 376
13 St Pauls Barden Ridge 313 18.2 1404 81.8 147 1864 45 2.4 1909
14 Sutherland Uniting 135 33.7 266 66.3 56 457 26 5.4 483
15 Sydney Town Hall 14 30.4 32 69.6 5 51 4 7.3 55
16 Tharawal Public 263 21.8 944 78.2 128 1335 50 3.6 1385
17 The Jannali High 183 36.0 326 64.0 72 581 21 3.5 602
18 Voyager Pt Hall 155 27.6 407 72.4 55 617 17 2.7 634
19 W Sutherland Scout Hall 197 32.4 411 67.6 66 674 15 2.2 689
20 Wattle Grove Comm. Cntr 725 27.3 1933 72.7 491 3149 124 3.8 3273
21 Wattle Grove Public 286 30.6 649 69.4 151 1086 27 2.4 1113
22 Woronora River Public 142 25.3 420 74.7 75 637 10 1.5 647
Ordinary Votes 8103 25.3 23878 74.7 3848 35829 1280 3.4 37109
Absent 1170 29.0 2868 71.0 673 4711 142 2.9 4853
Declared Institution 35 47.9 38 52.1 9 82 1 1.2 83
Enrolment New 62 28.7 154 71.3 34 250 6 2.3 256
Postal/iVote 622 24.8 1891 75.2 268 2781 23 0.8 2804
Pre-poll 286 22.2 1002 77.8 115 1403 21 1.5 1424
Provisional/Silent 35 22.2 123 77.8 24 182 6 3.2 188
Declaration Votes 2210 26.7 6076 73.3 1123 9409 199 2.1 9608
Grand Total 10313 25.6 29954 74.4 4971 45238 1479 3.2 46717
MENAIRoll : 49541 (Turnout 94.3%)
Scaysbrook Gibbons
(ALP) (LIB) Informal
69

2011 New South Wales Election
POLLING PLACES Total
Exhst Formal Vote
Votes % Votes % %
1 Bonnet Bay Public 246 20.9 930 79.1 98 1274 31 2.4 1305
2 Como Arts Hall 237 36.9 405 63.1 98 740 23 3.0 763
3 Como W Public 565 32.2 1189 67.8 194 1948 49 2.5 1997
4 Frank Vickery Village 270 25.9 772 74.1 79 1121 37 3.2 1158
5 Grays Pt Public 383 28.0 983 72.0 157 1523 36 2.3 1559
6 Gymea Bay Public 770 24.6 2366 75.4 223 3359 71 2.1 3430
7 Gymea Catholic Hall 769 31.8 1649 68.2 257 2675 92 3.3 2767
8 Gymea Nth Public 325 28.3 824 71.7 89 1238 33 2.6 1271
9 Jannali E Public 542 37.4 907 62.6 177 1626 55 3.3 1681
10 Kareela Public 441 24.4 1368 75.6 151 1960 37 1.9 1997
11 Kirrawee High 424 30.4 972 69.6 120 1516 33 2.1 1549
12 Kirrawee Public 431 29.5 1028 70.5 128 1587 52 3.2 1639
13 Miranda Comm. Cntr 359 36.0 638 64.0 108 1105 47 4.1 1152
14 Miranda Public 200 36.5 348 63.5 70 618 23 3.6 641
15 Oyster Bay Public 721 28.9 1770 71.1 273 2764 87 3.1 2851
16 Port Hacking High 529 31.7 1141 68.3 177 1847 52 2.7 1899
17 Sutherland Nth Public 459 31.1 1019 68.9 160 1638 59 3.5 1697
18 Sutherland Uniting 73 36.3 128 63.7 35 236 11 4.5 247
19 Sydney Town Hall 13 27.7 34 72.3 9 56 3 5.1 59
20 Sylvania Hghts Public 852 24.9 2574 75.1 247 3673 120 3.2 3793
21 The Jannali High 129 35.7 232 64.3 37 398 16 3.9 414
22 Yowie Bay Public 140 24.2 438 75.8 57 635 19 2.9 654
Ordinary Votes 8878 29.0 21715 71.0 2944 33537 986 2.9 34523
Absent 1094 28.0 2808 72.0 519 4421 114 2.5 4535
Declared Institution 55 35.9 98 64.1 6 159 0 0.0 159
Enrolment New 46 30.3 106 69.7 26 178 8 4.3 186
Postal/iVote 881 31.0 1963 69.0 232 3076 28 0.9 3104
Pre-poll 613 27.4 1623 72.6 173 2409 79 3.2 2488
Provisional/Silent 31 27.4 82 72.6 15 128 3 2.3 131
Declaration Votes 2720 28.9 6680 71.1 971 10371 232 2.2 10603
Grand Total 11598 29.0 28395 71.0 3915 43908 1218 2.7 45126
MIRANDARoll : 47586 (Turnout 94.8%)
Cook Annesley
(ALP) (LIB) Informal
70

2011 New South Wales Election
POLLING PLACES Total
Exhst Formal Vote
Votes % Votes % %
1 Adaminaby Public 95 34.5 180 65.5 9 284 2 0.7 286
2 Araluen Hall 46 51.1 44 48.9 5 95 1 1.0 96
3 Bemboka Hall 129 44.3 162 55.7 29 320 7 2.1 327
4 Berridale Comm Cntr 175 31.8 376 68.2 21 572 14 2.4 586
5 Bombala High 443 46.1 518 53.9 26 987 21 2.1 1008
6 Braidwood School 621 53.4 541 46.6 73 1235 27 2.1 1262
7 Bredbo Public 116 41.0 167 59.0 16 299 7 2.3 306
8 Bungendore Public 1117 48.5 1186 51.5 140 2443 66 2.6 2509
9 Captains Flat Hall 190 61.5 119 38.5 21 330 3 0.9 333
10 Cooma Hospital 79 54.5 66 45.5 4 149 4 2.6 153
11 Cooma Lambie St Pre-Sch. 188 39.7 285 60.3 14 487 7 1.4 494
12 Cooma Nth Public 381 47.4 422 52.6 65 868 19 2.1 887
13 Cooma Public 522 44.3 657 55.7 51 1230 35 2.8 1265
14 Dalgety Public 62 34.4 118 65.6 5 185 6 3.1 191
15 Delegate Public 71 34.3 136 65.7 8 215 2 0.9 217
16 Jerrabomberra Comm Cntr 1666 43.5 2161 56.5 142 3969 81 2.0 4050
17 Jindabyne Hall 502 36.9 859 63.1 73 1434 32 2.2 1466
18 Karabar High 1808 56.9 1367 43.1 152 3327 125 3.6 3452
19 Letchworth N'hood Cntr 324 58.0 235 42.0 25 584 18 3.0 602
20 Majors Crk Hall 58 60.4 38 39.6 11 107 3 2.7 110
21 Michelago Public 128 39.5 196 60.5 18 342 4 1.2 346
22 Nimmitabel Public 92 36.2 162 63.8 9 263 2 0.8 265
23 Numeralla Public 45 44.1 57 55.9 7 109 5 4.4 114
24 Queanbeyan Conference Cntr1122 55.5 901 44.5 109 2132 81 3.7 2213
25 Queanbeyan E Public 989 51.4 934 48.6 110 2033 75 3.6 2108
26 Queanbeyan High 736 54.0 628 46.0 80 1444 37 2.5 1481
27 Queanbeyan Hospital 291 50.5 285 49.5 32 608 23 3.6 631
28 Queanbeyan Public 1183 56.8 900 43.2 113 2196 58 2.6 2254
29 Queanbeyan W Public 782 51.1 747 48.9 72 1601 53 3.2 1654
30 Sutton Hall 308 45.3 372 54.7 50 730 19 2.5 749
31 Sydney Town Hall 16 69.6 7 30.4 3 26 1 3.7 27
32 Thredbo Comm. Cntr 37 37.4 62 62.6 10 109 3 2.7 112
33 Wamboin Hall 319 46.0 374 54.0 49 742 25 3.3 767
Ordinary Votes 14641 49.0 15262 51.0 1552 31455 866 2.7 32321
Absent 991 48.7 1044 51.3 425 2460 40 1.6 2500
Declared Institution 103 59.9 69 40.1 1 173 0 0.0 173
Enrolment New 120 47.2 134 52.8 31 285 5 1.7 290
Postal/iVote 1449 44.1 1836 55.9 340 3625 27 0.7 3652
Pre-poll 2818 44.6 3495 55.4 429 6742 142 2.1 6884
Provisional/Silent 56 44.8 69 55.2 10 135 3 2.2 138
Declaration Votes 5537 45.4 6647 54.6 1236 13420 217 1.6 13637
Grand Total 20178 47.9 21918 52.1 2779 44875 1083 2.4 45958
MONARORoll : 50062 (Turnout 91.8%)
Whan Barilaro
(ALP) (NAT) Informal
71

2011 New South Wales Election
POLLING PLACES Total
Exhst Formal Vote
Votes % Votes % %
1 Bidwill Public 890 66.3 452 33.7 164 1506 80 5.0 1586
2 Blackett Public 863 63.9 487 36.1 110 1460 86 5.6 1546
3 Colyton Public 886 47.1 995 52.9 293 2174 105 4.6 2279
4 Dawson Public 804 63.2 469 36.8 115 1388 77 5.3 1465
5 Eastern Ck Public 326 52.1 300 47.9 52 678 28 4.0 706
6 Glendenning Public 1171 55.6 936 44.4 224 2331 137 5.6 2468
7 Hassall Grove Public 1412 53.0 1253 47.0 312 2977 204 6.4 3181
8 Hebersham Public 1084 59.8 729 40.2 169 1982 101 4.8 2083
9 Lethbridge Park Public 503 63.7 287 36.3 87 877 83 8.6 960
10 Minchinbury Public 1109 46.7 1266 53.3 258 2633 212 7.5 2845
11 Mt Druitt Hospital 556 57.6 409 42.4 86 1051 43 3.9 1094
12 Mt Druitt Public 867 59.8 583 40.2 157 1607 118 6.8 1725
13 Plumpton Public 1963 57.0 1479 43.0 383 3825 209 5.2 4034
14 Rooty Hill Arts Hall 1131 55.3 913 44.7 199 2243 134 5.6 2377
15 Rooty Hill Public 1428 56.8 1086 43.2 276 2790 165 5.6 2955
16 Shalvey Public 775 62.7 461 37.3 138 1374 112 7.5 1486
17 Sydney Town Hall 15 40.5 22 59.5 11 48 1 2.0 49
18 Willmot Public 471 64.7 257 35.3 80 808 90 10.0 898
Ordinary Votes 16254 56.8 12384 43.2 3114 31752 1985 5.9 33737
Absent 1685 54.2 1422 45.8 433 3540 134 3.6 3674
Declared Institution 0 0.0 6 100.0 0 6 0 0.0 6
Enrolment New 113 58.5 80 41.5 34 227 5 2.2 232
Postal/iVote 938 54.1 795 45.9 150 1883 43 2.2 1926
Pre-poll 2347 59.8 1576 40.2 344 4267 209 4.7 4476
Provisional/Silent 15 39.5 23 60.5 4 42 2 4.5 44
Declaration Votes 5098 56.6 3902 43.4 965 9965 393 3.8 10358
Grand Total 21352 56.7 16286 43.3 4079 41717 2378 5.4 44095
MOUNT DRUITTRoll : 48234 (Turnout 91.4%)
Amery Priest
(ALP) (LIB) Informal
72

2011 New South Wales Election
POLLING PLACES Total
Exhst Formal Vote
Votes % Votes % %
1 Badgerys Ck Public 77 34.5 146 65.5 27 250 11 4.2 261
2 Banks Public 1485 46.4 1712 53.6 334 3531 159 4.3 3690
3 Bennett Rd Public 1209 42.6 1626 57.4 306 3141 209 6.2 3350
4 Blackwell Public 987 43.3 1292 56.7 307 2586 132 4.9 2718
5 Bringelly Public 204 21.5 747 78.5 82 1033 75 6.8 1108
6 Clairgate Public 802 40.3 1190 59.7 228 2220 93 4.0 2313
7 Claremont Meadows Public 675 42.1 928 57.9 161 1764 63 3.4 1827
8 Glenmore Park High 1063 31.4 2319 68.6 244 3626 143 3.8 3769
9 Glenmore Park Public 1203 37.9 1968 62.1 235 3406 133 3.8 3539
10 James Erskine Public 62 43.4 81 56.6 13 156 11 6.6 167
11 Luddenham Public 96 19.6 395 80.4 50 541 15 2.7 556
12 Mulgoa Comm. Cntr 156 17.3 745 82.7 62 963 39 3.9 1002
13 Orchard Hills Public 125 15.5 684 84.5 47 856 16 1.8 872
14 Oxley Park Public 816 44.9 1002 55.1 210 2028 143 6.6 2171
15 Regentville Public 656 29.4 1572 70.6 136 2364 75 3.1 2439
16 St Clair Public 625 42.8 834 57.2 205 1664 94 5.3 1758
17 St Marys Public 515 49.0 536 51.0 107 1158 60 4.9 1218
18 St Marys South Public 969 47.2 1084 52.8 210 2263 145 6.0 2408
19 Sydney Town Hall 11 35.5 20 64.5 10 41 1 2.4 42
20 Wallacia Public 158 23.0 530 77.0 51 739 26 3.4 765
Ordinary Votes 11894 38.0 19411 62.0 3025 34330 1643 4.6 35973
Absent 1653 36.4 2889 63.6 596 5138 153 2.9 5291
Declared Institution 0 0.0 0 0.0 0 0 0 0.0 0
Enrolment New 152 43.2 200 56.8 33 385 15 3.8 400
Postal/iVote 912 35.9 1629 64.1 279 2820 30 1.1 2850
Pre-poll 786 43.0 1042 57.0 197 2025 54 2.6 2079
Provisional/Silent 40 43.5 52 56.5 7 99 3 2.9 102
Declaration Votes 3543 37.9 5812 62.1 1112 10467 255 2.4 10722
Grand Total 15437 38.0 25223 62.0 4137 44797 1898 4.1 46695
MULGOARoll : 49371 (Turnout 94.6%)
Guillaume Davies
(ALP) (LIB) Informal
73

2011 New South Wales Election
POLLING PLACES Total
Exhst Formal Vote
Votes % Votes % %
1 Balranald School 117 17.8 541 82.2 3 661 17 2.5 678
2 Barham Reception Room 91 10.5 778 89.5 13 882 16 1.8 898
3 Barooga Hall 169 19.3 706 80.7 47 922 41 4.3 963
4 Berrigan Public 107 14.7 623 85.3 10 740 18 2.4 758
5 Blighty Public 4 2.0 193 98.0 2 199 1 0.5 200
6 Boree Crk Public 24 27.3 64 72.7 2 90 3 3.2 93
7 Broken Hill Day Care 419 41.0 604 59.0 52 1075 37 3.3 1112
8 Broken Hill Hospital 221 36.5 385 63.5 21 627 25 3.8 652
9 Broken Hill YMCA 289 36.0 513 64.0 29 831 20 2.4 851
10 Bunnaloo Public 6 5.7 100 94.3 3 109 1 0.9 110
11 Burke Ward Public 443 35.1 820 64.9 51 1314 41 3.0 1355
12 Buronga Public 112 15.1 629 84.9 34 775 30 3.7 805
13 Central Darling Council Hall 70 31.4 153 68.6 10 233 8 3.3 241
14 Coleambally School 6 4.7 123 95.3 2 131 0 0.0 131
15 Curlwaa Scout Hall 15 10.6 127 89.4 5 147 2 1.3 149
16 Dareton Public 75 15.4 411 84.6 5 491 9 1.8 500
17 Deniliquin Dental Clinic 37 14.0 227 86.0 4 268 4 1.5 272
18 Deniliquin High 275 17.0 1345 83.0 19 1639 52 3.1 1691
19 Deniliquin Nth Public 116 15.0 658 85.0 9 783 20 2.5 803
20 Edward Public 187 18.2 841 81.8 30 1058 42 3.8 1100
21 Euston Public 50 15.8 267 84.2 4 321 7 2.1 328
22 Finley High 139 10.4 1192 89.6 11 1342 40 2.9 1382
23 Gol Gol Public 77 13.2 506 86.8 5 588 11 1.8 599
24 Goolgowi Public 39 21.2 145 78.8 4 188 4 2.1 192
25 Hay High 281 23.6 910 76.4 32 1223 34 2.7 1257
26 Hay Hospital 84 29.7 199 70.3 5 288 13 4.3 301
27 Hillston School 137 20.0 549 80.0 12 698 16 2.2 714
28 Ivanhoe School 30 27.8 78 72.2 0 108 2 1.8 110
29 Jerilderie Civic Hall 79 13.3 514 86.7 8 601 13 2.1 614
30 Koraleigh Hall 17 9.9 154 90.1 4 175 4 2.2 179
31 Mathoura Hall 83 16.2 428 83.8 3 514 17 3.2 531
32 Menindee Civic Hall 115 38.5 184 61.5 5 304 15 4.7 319
33 Moama Public 409 16.6 2061 83.4 62 2532 79 3.0 2611
34 Morgan St Public 310 27.7 810 72.3 33 1153 26 2.2 1179
35 Moulamein Public 41 14.6 239 85.4 5 285 8 2.7 293
36 Murray Downs RFS 15 6.4 218 93.6 5 238 6 2.5 244
37 Nth Mine Hall 663 41.2 947 58.8 76 1686 62 3.5 1748
38 Oaklands School 32 17.3 153 82.7 2 187 3 1.6 190
39 Rand Public 8 9.3 78 90.7 4 90 0 0.0 90
40 Sydney Town Hall 0 0.0 7 100.0 0 7 0 0.0 7
41 Tocumwal Public 171 14.0 1053 86.0 17 1241 47 3.6 1288
42 Tooleybuc School 29 14.9 166 85.1 2 197 5 2.5 202
43 Urana School 78 32.8 160 67.2 5 243 4 1.6 247
44 Wakool Public 21 8.8 217 91.2 1 239 1 0.4 240
45 Wentworth Public 138 19.8 558 80.2 24 720 13 1.8 733
46 White House Convention Cntr 591 43.4 770 56.6 63 1424 51 3.5 1475
Ordinary Votes 6420 22.3 22404 77.7 743 29567 868 2.9 30435
Absent 257 21.5 941 78.5 42 1240 29 2.3 1269
Declared Institution 61 46.6 70 53.4 3 134 2 1.5 136
Enrolment New 3 25.0 9 75.0 1 13 2 13.3 15
Postal/iVote 530 16.0 2781 84.0 52 3363 50 1.5 3413
Pre-poll 1406 30.3 3232 69.7 74 4712 118 2.4 4830
Provisional/Silent 7 19.4 29 80.6 3 39 4 9.3 43
Declaration Votes 2264 24.3 7062 75.7 175 9501 205 2.1 9706
Grand Total 8684 22.8 29466 77.2 918 39068 1073 2.7 40141
MURRAY-DARLINGRoll : 45860 (Turnout 87.5%)
Gasmier Williams
(ALP) (NAT) Informal
74

2011 New South Wales Election
POLLING PLACES Total
Exhst Formal Vote
Votes % Votes % %
1 Ardlethan CWA Hall 60 14.7 348 85.3 14 422 8 1.9 430
2 Ariah Park Hall 22 7.3 278 92.7 7 307 4 1.3 311
3 Barellan School 37 10.6 313 89.4 6 356 4 1.1 360
4 Barmedman Old Courthouse 29 14.4 173 85.6 11 213 8 3.6 221
5 Beelbangera Public 78 21.3 289 78.7 5 372 20 5.1 392
6 Bland Masonic Cntr 244 16.5 1236 83.5 10 1490 47 3.1 1537
7 Burcher Hall 4 8.3 44 91.7 1 49 1 2.0 50
8 Carrathool Public 6 11.8 45 88.2 0 51 2 3.8 53
9 Coleambally School 46 8.7 481 91.3 3 530 8 1.5 538
10 Condobolin Public 447 32.0 948 68.0 52 1447 36 2.4 1483
11 Coolamon Shire Hall 265 24.4 820 75.6 30 1115 29 2.5 1144
12 Darlington Pt CWA Hall 183 30.9 410 69.1 12 605 12 1.9 617
13 Ganmain Public 58 16.3 298 83.7 18 374 9 2.3 383
14 Gralee School 167 18.6 731 81.4 37 935 32 3.3 967
15 Griffith E Public 172 21.1 645 78.9 17 834 24 2.8 858
16 Griffith Nth Public 238 20.4 930 79.6 40 1208 30 2.4 1238
17 Griffith PCYC 541 28.5 1355 71.5 71 1967 46 2.3 2013
18 Griffith Public 314 25.9 900 74.1 69 1283 50 3.8 1333
19 Grong Grong Public 38 27.3 101 72.7 0 139 10 6.7 149
20 Hanwood Public 211 21.3 779 78.7 23 1013 32 3.1 1045
21 John O'Brien Hall 349 24.2 1095 75.8 44 1488 45 2.9 1533
22 Junee High 541 31.2 1191 68.8 103 1835 64 3.4 1899
23 Lake Cargelligo School 165 24.4 512 75.6 16 693 27 3.8 720
24 Lake Wyangan Public 135 21.4 495 78.6 19 649 16 2.4 665
25 Leeton Public 99 16.7 495 83.3 13 607 11 1.8 618
26 Madonna Pl Hall 345 23.3 1133 76.7 36 1514 47 3.0 1561
27 Marrar Public 40 18.5 176 81.5 7 223 3 1.3 226
28 Matong Public 24 28.6 60 71.4 2 86 2 2.3 88
29 Mirrool Hall 4 5.2 73 94.8 1 78 0 0.0 78
30 Murrami Hall 9 8.3 100 91.7 4 113 3 2.6 116
31 Narrandera High 201 22.2 703 77.8 36 940 28 2.9 968
32 Parkview Public 159 24.5 489 75.5 19 667 22 3.2 689
33 Rankins Springs Hall 32 23.7 103 76.3 3 138 4 2.8 142
34 St Johns Temora 197 22.0 699 78.0 30 926 34 3.5 960
35 Sydney Town Hall 2 10.0 18 90.0 0 20 0 0.0 20
36 Tallimba Public 9 10.1 80 89.9 1 90 0 0.0 90
37 Temora Town Hall 388 20.2 1536 79.8 92 2016 60 2.9 2076
38 Tullibigeal School 11 6.4 161 93.6 1 173 2 1.1 175
39 Ungarie Hall 46 16.4 234 83.6 4 284 5 1.7 289
40 Wade High 310 22.5 1069 77.5 24 1403 39 2.7 1442
41 Wamoon Public 42 23.1 140 76.9 9 191 5 2.6 196
42 Weethalle Public 13 7.1 170 92.9 2 185 0 0.0 185
43 Whitton Public 71 22.6 243 77.4 9 323 10 3.0 333
44 Wyalong Hall 120 22.2 420 77.8 28 568 17 2.9 585
45 Yanco Hall 146 22.1 514 77.9 25 685 28 3.9 713
46 Yenda Hall 192 23.6 622 76.4 20 834 12 1.4 846
47 Yoogali Public 186 22.1 657 77.9 19 862 21 2.4 883
Ordinary Votes 6996 22.3 24312 77.7 993 32301 917 2.8 33218
Absent 741 22.0 2620 78.0 187 3548 61 1.7 3609
Declared Institution 97 36.3 170 63.7 16 283 4 1.4 287
Enrolment New 63 35.4 115 64.6 13 191 3 1.5 194
Postal/iVote 311 14.5 1829 85.5 66 2206 9 0.4 2215
Pre-poll 928 22.5 3188 77.5 100 4216 74 1.7 4290
Provisional/Silent 13 33.3 26 66.7 0 39 2 4.9 41
Declaration Votes 2153 21.3 7948 78.7 382 10483 153 1.4 10636
Grand Total 9149 22.1 32260 77.9 1375 42784 1070 2.4 43854
MURRUMBIDGEERoll : 47640 (Turnout 92.1%)
Wood Piccoli
(ALP) (NAT) Informal
75

2011 New South Wales Election
POLLING PLACES Total
Exhst Formal Vote
Votes % Votes % %
1 Blue Water Gallery 39 32.8 80 67.2 18 137 0 0.0 137
2 Booral Public 109 28.1 279 71.9 101 489 30 5.8 519
3 Bulahdelah School 200 24.4 618 75.6 150 968 53 5.2 1021
4 Bungwahl Public 46 24.6 141 75.4 52 239 5 2.0 244
5 Burrell Crk Hall 22 12.2 159 87.8 18 199 4 2.0 203
6 Chatham High 289 24.0 914 76.0 148 1351 40 2.9 1391
7 Coolongolook Public 27 11.8 202 88.2 43 272 10 3.5 282
8 Coomba Park Hall 65 22.3 227 77.7 54 346 14 3.9 360
9 Cundletown Public 229 20.7 877 79.3 139 1245 37 2.9 1282
10 Forster Public 241 21.3 889 78.7 124 1254 39 3.0 1293
11 Forster Scout Hall 189 22.8 640 77.2 120 949 29 3.0 978
12 Great Lakes Cllg - Forster 262 17.1 1271 82.9 130 1663 35 2.1 1698
13 Great Lakes Cllg - Tuncurry 23 17.2 111 82.8 13 147 0 0.0 147
14 Great Lakes Council Adm Bldg 476 22.4 1650 77.6 282 2408 76 3.1 2484
15 Green Pt Comm. Cntr 50 21.0 188 79.0 46 284 6 2.1 290
16 Hallidays Pt Comm. Church 188 21.2 700 78.8 135 1023 16 1.5 1039
17 Hallidays Pt Public 88 20.5 342 79.5 77 507 12 2.3 519
18 Krambach Public 53 17.9 243 82.1 35 331 10 2.9 341
19 Manning Gardens Public 240 32.0 510 68.0 95 845 32 3.6 877
20 Manning Hospital 27 20.9 102 79.1 28 157 2 1.3 159
21 Mitchells Is. Hall 39 17.5 184 82.5 28 251 6 2.3 257
22 Mt George Public 16 16.5 81 83.5 8 105 2 1.9 107
23 Nabiac Public 198 20.4 772 79.6 172 1142 18 1.6 1160
24 Old Bar Public 443 23.9 1411 76.1 300 2154 61 2.8 2215
25 Ormsby House 225 21.3 832 78.7 163 1220 43 3.4 1263
26 Oxley Is. Literary Inst. 35 28.9 86 71.1 21 142 3 2.1 145
27 Pacific Palms Comm. Cntr 226 28.0 581 72.0 156 963 22 2.2 985
28 Purfleet Comm. Cntr 33 29.5 79 70.5 19 131 2 1.5 133
29 St Johns Dyers Crossing 46 14.2 277 85.8 45 368 12 3.2 380
30 Sydney Town Hall 3 33.3 6 66.7 2 11 1 8.3 12
31 Taree High 346 23.1 1151 76.9 215 1712 69 3.9 1781
32 Taree W Public 336 18.1 1517 81.9 250 2103 66 3.0 2169
33 Tinonee Arts Hall 131 19.0 557 81.0 117 805 26 3.1 831
34 Tuncurry Public 333 22.8 1127 77.2 226 1686 47 2.7 1733
35 Tuncurry Salvo Hall 195 22.3 680 77.7 118 993 29 2.8 1022
36 Wingham Brush Public 228 18.2 1026 81.8 144 1398 48 3.3 1446
37 Wingham Town Hall 273 18.0 1245 82.0 233 1751 41 2.3 1792
Ordinary Votes 5969 21.5 21755 78.5 4025 31749 946 2.9 32695
Absent 795 28.4 2004 71.6 562 3361 79 2.3 3440
Declared Institution 0 0.0 0 0.0 0 0 0 0.0 0
Enrolment New 0 0.0 0 0.0 0 0 0 0.0 0
Postal/iVote 374 17.9 1711 82.1 213 2298 32 1.4 2330
Pre-poll 1480 19.4 6150 80.6 876 8506 172 2.0 8678
Provisional/Silent 11 22.4 38 77.6 6 55 1 1.8 56
Declaration Votes 2660 21.2 9903 78.8 1657 14220 284 2.0 14504
Grand Total 8629 21.4 31658 78.6 5682 45969 1230 2.6 47199
MYALL LAKES (2-Party Preferred)Roll : 50469 (Turnout 93.5%)
Petroulakis Bromhead
(ALP) (NAT) Informal
76

2011 New South Wales Election
POLLING PLACES Total
Exhst Formal Vote
Votes % Votes % %
1 Adamstown Snr Ctzn Cntr 503 54.8 415 45.2 177 1095 42 3.7 1137
2 Cameron Park Sch 177 50.6 173 49.4 54 404 17 4.0 421
3 Hamilton Nth Public 315 63.4 182 36.6 107 604 18 2.9 622
4 Hamilton Public 716 50.6 699 49.4 242 1657 50 2.9 1707
5 Hamilton Sth Comm. Hall 433 61.7 269 38.3 107 809 59 6.8 868
6 Hamilton Sth Public 692 35.4 1263 64.6 279 2234 48 2.1 2282
7 Islington Public 401 58.2 288 41.8 200 889 30 3.3 919
8 Lambton High 439 55.2 356 44.8 161 956 39 3.9 995
9 Mayfield E Public 683 61.3 431 38.7 222 1336 38 2.8 1374
10 Merewether Hghts Public 308 25.9 879 74.1 134 1321 24 1.8 1345
11 Merewether SLSC 316 31.2 697 68.8 135 1148 19 1.6 1167
12 Merewether Uniting 466 37.9 765 62.1 205 1436 45 3.0 1481
13 New Lambton Public 344 47.6 378 52.4 157 879 33 3.6 912
14 New Lambton Sth Public 352 51.9 326 48.1 159 837 19 2.2 856
15 Newcastle E Public 470 40.0 706 60.0 229 1405 32 2.2 1437
16 Newcastle School 277 42.5 374 57.5 135 786 21 2.6 807
17 Scots Kirk Hamilton 423 48.7 445 51.3 161 1029 39 3.7 1068
18 St Andrews Mayfield 814 60.6 530 39.4 307 1651 66 3.8 1717
19 St Columba's Adamstown 315 37.9 516 62.1 159 990 30 2.9 1020
20 St John the Baptist Lambton 61 40.4 90 59.6 40 191 14 6.8 205
21 St Johns Cooks Hill 629 41.2 896 58.8 288 1813 48 2.6 1861
22 St Marks Islington 340 54.6 283 45.4 156 779 34 4.2 813
23 St Matthews Anglican Georgetown246 56.3 191 43.7 63 500 10 2.0 510
24 St Thomas Carrington 569 57.7 417 42.3 145 1131 32 2.8 1163
25 Stockton Public 604 64.2 337 35.8 120 1061 17 1.6 1078
26 Stockton Uniting 546 61.7 339 38.3 124 1009 43 4.1 1052
27 Sydney Town Hall 17 47.2 19 52.8 11 47 0 0.0 47
28 The Junction Public 774 36.1 1373 63.9 323 2470 64 2.5 2534
29 Tighes Hill Public 517 59.8 348 40.2 263 1128 44 3.8 1172
30 Waratah Public 813 56.7 621 43.3 297 1731 69 3.8 1800
Ordinary Votes 13560 48.1 14606 51.9 5160 33326 1044 3.0 34370
Absent 1524 48.3 1631 51.7 923 4078 98 2.3 4176
Declared Institution 55 67.9 26 32.1 14 95 6 5.9 101
Enrolment New 124 46.1 145 53.9 75 344 12 3.4 356
Postal/iVote 1301 46.2 1517 53.8 464 3282 31 0.9 3313
Pre-poll 816 37.6 1356 62.4 371 2543 68 2.6 2611
Provisional/Silent 79 58.5 56 41.5 20 155 5 3.1 160
Declaration Votes 3899 45.2 4731 54.8 1867 10497 220 2.1 10717
Grand Total 17459 47.4 19337 52.6 7027 43823 1264 2.8 45087
NEWCASTLERoll : 48787 (Turnout 92.4%)
Mckay Owen
(ALP) (LIB) Informal
77

2011 New South Wales Election
POLLING PLACES Total
Exhst Formal Vote
Votes % Votes % %
1 Balmoral Scout Hall 83 10.7 693 89.3 69 845 17 2.0 862
2 Beauty Pt Public 130 11.8 972 88.2 95 1197 14 1.2 1211
3 Cammeray Public 74 17.0 361 83.0 65 500 13 2.5 513
4 Crows Nest Uniting 517 25.4 1515 74.6 306 2338 71 2.9 2409
5 Forsyth Park Comm. Cntr 230 20.1 913 79.9 123 1266 20 1.6 1286
6 McMahons Pt Comm. Cntr 317 23.2 1050 76.8 225 1592 36 2.2 1628
7 Middle Harbour Public 190 14.5 1123 85.5 146 1459 42 2.8 1501
8 Mosman Baptist 115 20.6 442 79.4 61 618 12 1.9 630
9 Mosman High 570 17.5 2689 82.5 362 3621 55 1.5 3676
10 Mosman Public 155 13.8 965 86.2 105 1225 22 1.8 1247
11 Mosman Sq Snrs Cntr 234 18.2 1054 81.8 155 1443 36 2.4 1479
12 Naremburn School 67 19.7 273 80.3 33 373 9 2.4 382
13 Neutral Bay Public 536 20.0 2143 80.0 345 3024 77 2.5 3101
14 Nth Sydney Boys High 281 23.5 913 76.5 161 1355 20 1.5 1375
15 Nth Sydney Girls High 310 22.5 1065 77.5 191 1566 34 2.1 1600
16 Nth Sydney Public 411 26.6 1133 73.4 170 1714 50 2.8 1764
17 RNS Hospital 50 30.3 115 69.7 27 192 8 4.0 200
18 SCECGS Redlands 235 19.2 990 80.8 146 1371 39 2.8 1410
19 St Aloysius Jnr Cllg 471 21.4 1727 78.6 260 2458 61 2.4 2519
20 St Augustine's Neutral Bay 117 18.8 506 81.2 64 687 7 1.0 694
21 St Clements Mosman 300 13.1 1990 86.9 270 2560 66 2.5 2626
22 Sydney Town Hall 37 31.6 80 68.4 29 146 5 3.3 151
23 Waverton Uniting 283 23.9 903 76.1 167 1353 40 2.9 1393
Ordinary Votes 5713 19.5 23615 80.5 3575 32903 754 2.2 33657
Absent 1098 22.5 3783 77.5 715 5596 72 1.3 5668
Declared Institution 51 24.3 159 75.7 8 218 5 2.2 223
Enrolment New 48 24.2 150 75.8 33 231 6 2.5 237
Postal/iVote 660 17.5 3104 82.5 313 4077 36 0.9 4113
Pre-poll 322 18.1 1453 81.9 184 1959 25 1.3 1984
Provisional/Silent 47 23.6 152 76.4 31 230 7 3.0 237
Declaration Votes 2226 20.2 8801 79.8 1284 12311 151 1.2 12462
Grand Total 7939 19.7 32416 80.3 4859 45214 905 2.0 46119
NORTH SHORE (2-Party Preferred)Roll : 51518 (Turnout 89.5%)
Winton Skinner
(ALP) (LIB) Informal
78

2011 New South Wales Election
POLLING PLACES Total
Exhst Formal Vote
Votes % Votes % %
1 Arding Uniting 84 30.5 191 69.5 10 285 2 0.7 287
2 Armidale City Public 335 26.3 941 73.7 66 1342 10 0.7 1352
3 Armidale Hospital 158 25.0 473 75.0 29 660 10 1.5 670
4 Armidale Town Hall 545 24.6 1669 75.4 111 2325 31 1.3 2356
5 Ashford School 117 27.9 303 72.1 13 433 3 0.7 436
6 Austin College 63 23.7 203 76.3 11 277 3 1.1 280
7 Ben Lomond Public 57 52.3 52 47.7 0 109 1 0.9 110
8 Ben Venue Public 500 24.0 1585 76.0 86 2171 22 1.0 2193
9 Bingara Civic Cntr 317 30.8 713 69.2 24 1054 18 1.7 1072
10 Black Mtn Public 77 50.0 77 50.0 3 157 4 2.5 161
11 Bonshaw Hall 33 53.2 29 46.8 1 63 0 0.0 63
12 Bundarra School 124 31.9 265 68.1 6 395 5 1.2 400
13 Cameron Mem. Hall 417 30.3 958 69.7 34 1409 9 0.6 1418
14 Chandler Public 40 39.2 62 60.8 2 104 1 1.0 105
15 Coolatai Hall 25 39.1 39 60.9 0 64 1 1.5 65
16 Croppa Crk Public 43 64.2 24 35.8 4 71 0 0.0 71
17 Deepwater Public 146 43.1 193 56.9 8 347 6 1.7 353
18 Delungra Hall 121 38.1 197 61.9 17 335 2 0.6 337
19 Drake Hall 14 26.9 38 73.1 19 71 2 2.7 73
20 Drummond Memorial Public 489 23.8 1566 76.2 86 2141 29 1.3 2170
21 Ebor Public 37 43.0 49 57.0 2 88 2 2.2 90
22 Emmaville School 66 22.1 233 77.9 6 305 4 1.3 309
23 Glen Innes Hospital 177 25.6 514 74.4 10 701 7 1.0 708
24 Glen Innes Public 368 26.8 1003 73.2 36 1407 21 1.5 1428
25 Glencoe Hall 59 42.1 81 57.9 3 143 1 0.7 144
26 Gravesend Public 78 57.8 57 42.2 3 138 0 0.0 138
27 Guyra School 555 43.0 736 57.0 33 1324 21 1.6 1345
28 Inverell Masonic Hall 383 28.4 964 71.6 46 1393 25 1.8 1418
29 Inverell Public 482 24.8 1458 75.2 49 1989 36 1.8 2025
30 Kellys Plains/Dangarsleigh CWA Hall77 48.7 81 51.3 2 160 1 0.6 161
31 Kentucky Hall 76 43.9 97 56.1 6 179 0 0.0 179
32 Kingstown Hall 44 57.9 32 42.1 2 78 1 1.3 79
33 Mingoola Public 14 25.0 42 75.0 3 59 1 1.7 60
34 Newling Public 259 22.1 911 77.9 41 1211 11 0.9 1222
35 North Star Public 42 45.2 51 54.8 5 98 1 1.0 99
36 Nowendoc Hall 38 48.7 40 51.3 1 79 0 0.0 79
37 Red Range Public 82 57.3 61 42.7 2 145 0 0.0 145
38 Rocky River Public 84 33.7 165 66.3 20 269 5 1.8 274
39 Ross Hill Public 588 27.7 1536 72.3 44 2168 31 1.4 2199
40 Sydney Town Hall 3 15.8 16 84.2 2 21 1 4.5 22
41 Tenterfield Mem. Hall 637 39.1 993 60.9 92 1722 33 1.9 1755
42 Tingha Public 88 19.8 357 80.2 20 465 4 0.9 469
43 Upper Horton Hall 50 50.0 50 50.0 0 100 1 1.0 101
44 Uralla Anglican 476 31.4 1039 68.6 63 1578 21 1.3 1599
45 Walcha Anglican 570 41.3 809 58.7 24 1403 10 0.7 1413
46 Warialda Public 336 34.9 628 65.1 34 998 19 1.9 1017
47 Woolbrook Public 32 35.2 59 64.8 1 92 2 2.1 94
48 Yetman Hall 29 33.3 58 66.7 3 90 2 2.2 92
Ordinary Votes 9435 30.3 21698 69.7 1083 32216 420 1.3 32636
Absent 800 29.3 1932 70.7 165 2897 37 1.3 2934
Declared Institution 53 18.0 241 82.0 17 311 11 3.4 322
Enrolment New 39 20.4 152 79.6 20 211 2 0.9 213
Postal/iVote 1219 35.3 2235 64.7 81 3535 13 0.4 3548
Pre-poll 2178 30.8 4887 69.2 189 7254 62 0.8 7316
Provisional/Silent 32 23.9 102 76.1 14 148 2 1.3 150
Declaration Votes 4321 31.2 9549 68.8 486 14356 127 0.9 14483
Grand Total 13756 30.6 31247 69.4 1569 46572 547 1.2 47119
NORTHERN TABLELANDSRoll : 50535 (Turnout 93.2%)
McCowen Torbay
(NAT) (IND) Informal
79

2011 New South Wales Election
POLLING PLACES Total
Exhst Formal Vote
Votes % Votes % %
1 Arding Uniting 41 24.4 127 75.6 117 285 2 0.7 287
2 Armidale City Public 229 29.2 555 70.8 558 1342 10 0.7 1352
3 Armidale Hospital 106 28.3 269 71.7 285 660 10 1.5 670
4 Armidale Town Hall 402 30.0 938 70.0 985 2325 31 1.3 2356
5 Ashford School 59 23.3 194 76.7 180 433 3 0.7 436
6 Austin College 53 33.1 107 66.9 117 277 3 1.1 280
7 Ben Lomond Public 8 10.3 70 89.7 31 109 1 0.9 110
8 Ben Venue Public 359 29.0 880 71.0 932 2171 22 1.0 2193
9 Bingara Civic Cntr 148 23.1 492 76.9 414 1054 18 1.7 1072
10 Black Mtn Public 17 14.9 97 85.1 43 157 4 2.5 161
11 Bonshaw Hall 4 8.9 41 91.1 18 63 0 0.0 63
12 Bundarra School 48 20.3 189 79.7 158 395 5 1.2 400
13 Cameron Mem. Hall 185 22.1 652 77.9 572 1409 9 0.6 1418
14 Chandler Public 13 19.1 55 80.9 36 104 1 1.0 105
15 Coolatai Hall 6 14.6 35 85.4 23 64 1 1.5 65
16 Croppa Crk Public 7 12.5 49 87.5 15 71 0 0.0 71
17 Deepwater Public 43 18.6 188 81.4 116 347 6 1.7 353
18 Delungra Hall 46 21.1 172 78.9 117 335 2 0.6 337
19 Drake Hall 27 56.2 21 43.8 23 71 2 2.7 73
20 Drummond Memorial Public 352 28.8 871 71.2 918 2141 29 1.3 2170
21 Ebor Public 10 16.9 49 83.1 29 88 2 2.2 90
22 Emmaville School 47 27.6 123 72.4 135 305 4 1.3 309
23 Glen Innes Hospital 91 23.0 304 77.0 306 701 7 1.0 708
24 Glen Innes Public 198 24.3 617 75.7 592 1407 21 1.5 1428
25 Glencoe Hall 18 18.8 78 81.2 47 143 1 0.7 144
26 Gravesend Public 11 10.7 92 89.3 35 138 0 0.0 138
27 Guyra School 145 16.4 741 83.6 438 1324 21 1.6 1345
28 Inverell Masonic Hall 196 23.8 629 76.2 568 1393 25 1.8 1418
29 Inverell Public 271 24.1 855 75.9 863 1989 36 1.8 2025
30 Kellys Plains/Dangarsleigh CWA Hall14 12.6 97 87.4 49 160 1 0.6 161
31 Kentucky Hall 21 17.2 101 82.8 57 179 0 0.0 179
32 Kingstown Hall 6 10.2 53 89.8 19 78 1 1.3 79
33 Mingoola Public 8 24.2 25 75.8 26 59 1 1.7 60
34 Newling Public 208 30.3 479 69.7 524 1211 11 0.9 1222
35 North Star Public 13 19.4 54 80.6 31 98 1 1.0 99
36 Nowendoc Hall 6 11.1 48 88.9 25 79 0 0.0 79
37 Red Range Public 12 11.0 97 89.0 36 145 0 0.0 145
38 Rocky River Public 46 26.9 125 73.1 98 269 5 1.8 274
39 Ross Hill Public 277 22.0 980 78.0 911 2168 31 1.4 2199
40 Sydney Town Hall 5 45.5 6 54.5 10 21 1 4.5 22
41 Tenterfield Mem. Hall 265 23.4 866 76.6 591 1722 33 1.9 1755
42 Tingha Public 81 31.4 177 68.6 207 465 4 0.9 469
43 Upper Horton Hall 9 12.7 62 87.3 29 100 1 1.0 101
44 Uralla Anglican 274 27.9 707 72.1 597 1578 21 1.3 1599
45 Walcha Anglican 149 16.2 773 83.8 481 1403 10 0.7 1413
46 Warialda Public 153 24.1 482 75.9 363 998 19 1.9 1017
47 Woolbrook Public 10 17.5 47 82.5 35 92 2 2.1 94
48 Yetman Hall 14 24.6 43 75.4 33 90 2 2.2 92
Ordinary Votes 4711 24.3 14712 75.7 12793 32216 420 1.3 32636
Absent 479 27.5 1264 72.5 1154 2897 37 1.3 2934
Declared Institution 56 33.1 113 66.9 142 311 11 3.4 322
Enrolment New 47 39.2 73 60.8 91 211 2 0.9 213
Postal/iVote 442 19.9 1774 80.1 1319 3535 13 0.4 3548
Pre-poll 963 22.1 3389 77.9 2902 7254 62 0.8 7316
Provisional/Silent 28 32.9 57 67.1 63 148 2 1.3 150
Declaration Votes 2015 23.2 6670 76.8 5671 14356 127 0.9 14483
Grand Total 6726 23.9 21383 76.1 18463 46572 547 1.2 47119
(Estimated two-party preferred counts)
NORTHERN TABLELANDS (2-Party Preferred)Roll : 50535 (Turnout 93.2%)
Frazier McCowen
(ALP) (NAT) Informal
80

2011 New South Wales Election
POLLING PLACES Total
Exhst Formal Vote
Votes % Votes % %
1 Beverly Hills Nth Public 152 60.6 99 39.4 22 273 11 3.9 284
2 Beverly Hills Public 658 55.3 532 44.7 85 1275 74 5.5 1349
3 Beverly Hills Uniting 108 55.7 86 44.3 16 210 8 3.7 218
4 Hurstville Public 174 49.4 178 50.6 36 388 13 3.2 401
5 Hurstville Snr Ctzns Cntr 896 55.5 719 44.5 130 1745 70 3.9 1815
6 Hurstville Sth Public 469 50.4 461 49.6 62 992 55 5.3 1047
7 Kingsway Scout Hall 485 56.6 372 43.4 69 926 44 4.5 970
8 Lugarno Public 1001 36.6 1735 63.4 142 2878 43 1.5 2921
9 Mortdale Guides Hall 587 54.9 482 45.1 70 1139 21 1.8 1160
10 Mortdale Pensioners Hall 948 55.6 756 44.4 136 1840 69 3.6 1909
11 Mortdale Public 701 53.5 610 46.5 114 1425 35 2.4 1460
12 Narwee Public 1314 52.8 1176 47.2 202 2692 125 4.4 2817
13 Oatley Public 1080 40.6 1581 59.4 151 2812 50 1.7 2862
14 Oatley W Public 962 43.8 1233 56.2 171 2366 48 2.0 2414
15 Peakhurst Public 173 48.3 185 51.7 20 378 20 5.0 398
16 Peakhurst Sth Public 878 49.7 890 50.3 81 1849 29 1.5 1878
17 Peakhurst W Public 772 45.9 911 54.1 98 1781 54 2.9 1835
18 Penshurst Girls 1120 55.9 884 44.1 216 2220 89 3.9 2309
19 Penshurst Public 874 56.0 687 44.0 116 1677 59 3.4 1736
20 Penshurst W Public 1061 55.7 845 44.3 126 2032 62 3.0 2094
21 St Aidans Hurstville Grove 941 42.8 1256 57.2 147 2344 60 2.5 2404
22 Sydney Town Hall 43 46.7 49 53.3 9 101 5 4.7 106
Ordinary Votes 15397 49.5 15727 50.5 2219 33343 1044 3.0 34387
Absent 1590 48.9 1662 51.1 460 3712 228 5.8 3940
Declared Institution 43 45.3 52 54.7 4 99 3 2.9 102
Enrolment New 98 48.0 106 52.0 23 227 10 4.2 237
Postal/iVote 1654 46.5 1906 53.5 266 3826 39 1.0 3865
Pre-poll 1538 54.3 1294 45.7 220 3052 140 4.4 3192
Provisional/Silent 61 45.2 74 54.8 24 159 10 5.9 169
Declaration Votes 4984 49.5 5094 50.5 997 11075 430 3.7 11505
Grand Total 20381 49.5 20821 50.5 3216 44418 1474 3.2 45892
OATLEYRoll : 48982 (Turnout 93.7%)
Greene Coure
(ALP) (LIB) Informal
81

2011 New South Wales Election
POLLING PLACES Total
Exhst Formal Vote
Votes % Votes % %
1 Anson St 306 27.1 824 72.9 204 1334 48 3.5 1382
2 Bletchington Public 614 25.5 1795 74.5 416 2825 75 2.6 2900
3 Borenore Public 66 24.8 200 75.2 16 282 9 3.1 291
4 Bowen Public 469 27.3 1252 72.7 279 2000 57 2.8 2057
5 Calare Public 350 25.2 1040 74.8 200 1590 41 2.5 1631
6 Canobolas Public 44 20.7 169 79.3 29 242 3 1.2 245
7 Cargo Public 69 30.9 154 69.1 25 248 3 1.2 251
8 Cudal Public 71 22.0 252 78.0 31 354 7 1.9 361
9 Cudgegong Valley Public 294 24.8 893 75.2 264 1451 33 2.2 1484
10 Cumnock Hall 42 18.3 187 81.7 20 249 3 1.2 252
11 Euchareena Public 25 28.1 64 71.9 3 92 0 0.0 92
12 Geurie Public 71 19.0 303 81.0 24 398 7 1.7 405
13 Glenroi Hghts Public 524 46.7 597 53.3 215 1336 49 3.5 1385
14 Gollan Hall 8 8.8 83 91.2 5 96 1 1.0 97
15 Goolma Public 14 19.2 59 80.8 7 80 0 0.0 80
16 Gulgong Hall 317 24.3 987 75.7 274 1578 56 3.4 1634
17 Hargraves Public 34 22.7 116 77.3 15 165 4 2.4 169
18 Kenna Hall 327 24.7 999 75.3 246 1572 29 1.8 1601
19 Lucknow Hall 36 16.6 181 83.4 28 245 2 0.8 247
20 Lue Public 12 18.2 54 81.8 25 91 2 2.2 93
21 Manildra Public 91 29.4 219 70.6 20 330 9 2.7 339
22 Molong Anglican 243 19.8 982 80.2 101 1326 50 3.6 1376
23 Mudgee High 383 26.1 1085 73.9 327 1795 74 4.0 1869
24 Mudgee PCYC 282 20.9 1066 79.1 297 1645 45 2.7 1690
25 Mullion Crk Public 72 20.5 279 79.5 31 382 9 2.3 391
26 Mumbil Public 45 31.0 100 69.0 17 162 6 3.6 168
27 Nashdale Public 66 17.8 305 82.2 40 411 5 1.2 416
28 Orange High 452 24.1 1426 75.9 305 2183 53 2.4 2236
29 Orange Hospital 46 26.6 127 73.4 31 204 3 1.4 207
30 Orange Public 480 27.3 1281 72.7 329 2090 73 3.4 2163
31 Spring Hill Public 35 16.8 173 83.2 45 253 3 1.2 256
32 Spring Terrace Public 24 14.2 145 85.8 19 188 0 0.0 188
33 St Barnabas Orange 406 30.4 929 69.6 253 1588 43 2.6 1631
34 Stuart Town Public 40 26.1 113 73.9 31 184 6 3.2 190
35 Sydney Town Hall 4 26.7 11 73.3 5 20 0 0.0 20
36 Wellington Civic Hall 392 27.4 1037 72.6 183 1612 47 2.8 1659
37 Wellington Scout Hall 244 33.9 476 66.1 125 845 35 4.0 880
38 Windeyer Public 23 19.8 93 80.2 28 144 5 3.4 149
39 Yeoval Central 16 19.0 68 81.0 6 90 2 2.2 92
Ordinary Votes 7037 25.9 20124 74.1 4519 31680 897 2.8 32577
Absent 792 29.7 1873 70.3 574 3239 60 1.8 3299
Declared Institution 81 30.2 187 69.8 48 316 18 5.4 334
Enrolment New 62 27.8 161 72.2 66 289 3 1.0 292
Postal/iVote 342 22.5 1177 77.5 210 1729 11 0.6 1740
Pre-poll 1603 24.0 5083 76.0 1238 7924 186 2.3 8110
Provisional/Silent 36 37.9 59 62.1 15 110 2 1.8 112
Declaration Votes 2916 25.5 8540 74.5 2151 13607 280 2.0 13887
Grand Total 9953 25.8 28664 74.2 6670 45287 1177 2.5 46464
ORANGE (2-Party Preferred)Roll : 49305 (Turnout 94.2%)
Duffy Gee
(ALP) (NAT) Informal
82

2011 New South Wales Election
POLLING PLACES Total
Exhst Formal Vote
Votes % Votes % %
1 Aldavilla Public 185 14.9 1058 85.1 100 1343 32 2.3 1375
2 Beechwood Arts Hall 94 15.4 518 84.6 114 726 23 3.1 749
3 Bellbrook Public 31 25.4 91 74.6 21 143 0 0.0 143
4 Bellingen Anglican 586 38.9 919 61.1 521 2026 51 2.5 2077
5 Bellingen Hospital 56 29.8 132 70.2 62 250 3 1.2 253
6 Bostobrick RFS 10 10.8 83 89.2 8 101 2 1.9 103
7 Byabarra Public 10 9.7 93 90.3 24 127 5 3.8 132
8 Comboyne Public 15 6.2 226 93.8 21 262 3 1.1 265
9 Crescent Head Hall 155 22.0 550 78.0 83 788 21 2.6 809
10 Deer Vale Hall 15 17.9 69 82.1 6 90 1 1.1 91
11 Dorrigo Comm. Cntr 166 18.0 754 82.0 136 1056 31 2.9 1087
12 Elands Public 34 47.2 38 52.8 24 96 4 4.0 100
13 Eungai Hall 64 20.3 251 79.7 54 369 13 3.4 382
14 Frank Partridge VC Public 238 25.5 697 74.5 73 1008 29 2.8 1037
15 Frederickton Public 112 16.1 582 83.9 53 747 19 2.5 766
16 Gladstone Hall 74 13.8 464 86.2 27 565 7 1.2 572
17 Gleniffer Hall 45 36.0 80 64.0 39 164 3 1.8 167
18 Hastings Sport and Rec Cntr 223 13.9 1387 86.1 261 1871 58 3.0 1929
19 Hat Head SLSC 45 22.6 154 77.4 14 213 3 1.4 216
20 Hollisdale Hall 13 13.8 81 86.2 29 123 3 2.4 126
21 Huntingdon Public 42 18.3 187 81.7 29 258 1 0.4 259
22 Kempsey CWA Hall 177 17.6 831 82.4 86 1094 37 3.3 1131
23 Kempsey E Public 123 14.7 715 85.3 66 904 13 1.4 917
24 Kempsey High 198 18.3 886 81.7 84 1168 38 3.2 1206
25 Kempsey Hospital 32 28.1 82 71.9 7 121 2 1.6 123
26 Kempsey W Public 132 19.6 543 80.4 77 752 14 1.8 766
27 Killabakh Hall 24 17.9 110 82.1 18 152 2 1.3 154
28 Kundabung Hall 30 15.1 169 84.9 17 216 5 2.3 221
29 Long Flat Public 32 13.6 204 86.4 28 264 4 1.5 268
30 Macksville Snr Ctzns Cntr 373 17.7 1732 82.3 143 2248 52 2.3 2300
31 Marlee Hall 40 24.8 121 75.2 36 197 2 1.0 199
32 Medlow Public 24 15.0 136 85.0 28 188 3 1.6 191
33 Melville Comm. Cntr 151 20.5 584 79.5 75 810 14 1.7 824
34 Missabotti Hall 34 34.3 65 65.7 27 126 0 0.0 126
35 Nambucca Heads Ent. Cntr 602 27.3 1600 72.7 269 2471 77 3.0 2548
36 Pembrooke Hall 17 9.9 154 90.1 11 182 0 0.0 182
37 Rollands Plains Arts Hall 19 12.2 137 87.8 16 172 3 1.7 175
38 Scotts Head SLSC 139 32.7 286 67.3 100 525 8 1.5 533
39 Smithtown Public 69 15.2 386 84.8 24 479 15 3.0 494
40 St James Bowraville 255 27.1 685 72.9 119 1059 22 2.0 1081
41 Sth W Rocks Anglican 288 21.4 1060 78.6 90 1438 35 2.4 1473
42 Sth W Rocks Public 265 20.7 1014 79.3 95 1374 36 2.6 1410
43 Stuarts Pt Hall 170 26.9 463 73.1 96 729 15 2.0 744
44 Sydney Town Hall 8 66.7 4 33.3 6 18 1 5.3 19
45 Telegraph Pt Public 65 16.8 323 83.2 72 460 20 4.2 480
46 Thora Hall 63 33.3 126 66.7 60 249 1 0.4 250
47 Upper Lansdowne Hall 28 26.9 76 73.1 18 122 4 3.2 126
48 Utungun Comm. Cntr 30 18.6 131 81.4 12 173 0 0.0 173
49 Valla Beach Hall 274 30.6 621 69.4 97 992 28 2.7 1020
50 Warrell Crk Hall 25 7.6 306 92.4 23 354 13 3.5 367
51 Wauchope High 177 13.9 1094 86.1 226 1497 45 2.9 1542
52 Wherrol Flat Hall 31 23.0 104 77.0 20 155 7 4.3 162
53 Willawarrin Public 65 16.4 332 83.6 47 444 12 2.6 456
Ordinary Votes 6173 20.8 23494 79.2 3792 33459 840 2.4 34299
Absent 1036 24.7 3158 75.3 699 4893 107 2.1 5000
Declared Institution 42 17.9 192 82.1 22 256 8 3.0 264
Enrolment New 46 22.8 156 77.2 47 249 14 5.3 263
Postal/iVote 357 18.4 1586 81.6 196 2139 14 0.7 2153
Pre-poll 481 17.9 2201 82.1 178 2860 53 1.8 2913
Provisional/Silent 27 29.7 64 70.3 20 111 2 1.8 113
Declaration Votes 1989 21.3 7357 78.7 1162 10508 198 1.8 10706
Grand Total 8162 20.9 30851 79.1 4954 43967 1038 2.3 45005
OXLEY (2-Party Preferred)Roll : 48810 (Turnout 92.2%)
Blackshield Stoner
(ALP) (NAT) Informal
83

2011 New South Wales Election
POLLING PLACES Total
Exhst Formal Vote
Votes % Votes % %
1 Catherine McAuley High 215 34.4 410 65.6 86 711 24 3.3 735
2 Cumberland High 156 35.9 278 64.1 95 529 22 4.0 551
3 Dundas Public 635 35.1 1175 64.9 599 2409 75 3.0 2484
4 Ermington Comm. Cntr 490 41.1 702 58.9 227 1419 70 4.7 1489
5 Ermington W Public 714 39.6 1090 60.4 293 2097 107 4.9 2204
6 Gospel Hall Nth Parra 382 32.6 788 67.4 167 1337 62 4.4 1399
7 Macarthur Girls High 636 42.8 851 57.2 217 1704 76 4.3 1780
8 Melrose Park Public 164 30.9 367 69.1 81 612 19 3.0 631
9 Northmead Public 111 35.6 201 64.4 56 368 17 4.4 385
10 OES Hall 301 38.5 480 61.5 93 874 44 4.8 918
11 Oatlands Public 513 23.9 1636 76.1 317 2466 70 2.8 2536
12 Parramatta E Public 485 39.4 747 60.6 205 1437 62 4.1 1499
13 Parramatta High 176 38.4 282 61.6 63 521 19 3.5 540
14 Parramatta Nth Public 629 44.8 774 55.2 293 1696 91 5.1 1787
15 Parramatta Town Hall 508 46.6 583 53.4 211 1302 58 4.3 1360
16 Reg Byrne Comm. Cntr 63 42.3 86 57.7 18 167 12 6.7 179
17 Rosehill Public 396 36.8 680 63.2 162 1238 45 3.5 1283
18 Rowland Hassall 204 38.3 329 61.7 74 607 29 4.6 636
19 Rydalmere Public 551 40.5 808 59.5 250 1609 66 3.9 1675
20 Salvo Hall Granville 90 44.8 111 55.2 27 228 8 3.4 236
21 St Bernadettes School 302 39.2 469 60.8 169 940 36 3.7 976
22 Sydney Town Hall 32 43.8 41 56.2 20 93 6 6.1 99
23 Telopea Public 743 41.9 1032 58.1 369 2144 123 5.4 2267
24 Toongabbie E Public 144 57.6 106 42.4 33 283 14 4.7 297
25 Wentworthville Public 572 40.8 829 59.2 222 1623 75 4.4 1698
26 Westmead Hospital 139 43.2 183 56.8 45 367 7 1.9 374
27 Westmead Public 996 43.0 1318 57.0 306 2620 110 4.0 2730
28 Yates Ave Public 606 39.9 914 60.1 317 1837 80 4.2 1917
Ordinary Votes 10953 38.8 17270 61.2 5015 33238 1427 4.1 34665
Absent 1446 35.9 2586 64.1 742 4774 173 3.5 4947
Declared Institution 54 44.3 68 55.7 18 140 2 1.4 142
Enrolment New 70 41.7 98 58.3 41 209 4 1.9 213
Postal/iVote 1241 33.1 2503 66.9 538 4282 71 1.6 4353
Pre-poll 631 37.7 1042 62.3 254 1927 71 3.6 1998
Provisional/Silent 69 40.4 102 59.6 37 208 5 2.3 213
Declaration Votes 3511 35.4 6399 64.6 1630 11540 326 2.7 11866
Grand Total 14464 37.9 23669 62.1 6645 44778 1753 3.8 46531
PARRAMATTARoll : 51328 (Turnout 90.7%)
Esber Lee
(ALP) (LIB) Informal
84

2011 New South Wales Election
POLLING PLACES Total
Exhst Formal Vote
Votes % Votes % %
1 Blaxland E Public 211 28.1 540 71.9 115 866 37 4.1 903
2 Blaxland High 214 35.0 398 65.0 106 718 24 3.2 742
3 Braddock Public 967 39.2 1498 60.8 327 2792 150 5.1 2942
4 Emu Hghts Public 457 31.9 974 68.1 195 1626 44 2.6 1670
5 Emu Plains Public 818 31.4 1788 68.6 271 2877 98 3.3 2975
6 Glenbrook Public 558 32.5 1157 67.5 270 1985 55 2.7 2040
7 Jamison High 1136 32.3 2380 67.7 416 3932 190 4.6 4122
8 Jamisontown Public 452 33.2 910 66.8 195 1557 49 3.1 1606
9 Jamisontown Uniting 292 31.5 635 68.5 82 1009 25 2.4 1034
10 Kingswood Pk Public 469 39.0 735 61.0 165 1369 58 4.1 1427
11 Kingswood Public 563 41.7 786 58.3 200 1549 81 5.0 1630
12 Kingswood Sth Public 470 38.7 743 61.3 122 1335 53 3.8 1388
13 Lapstone Public 312 28.3 792 71.7 202 1306 29 2.2 1335
14 Leonay Public 282 21.3 1044 78.7 135 1461 39 2.6 1500
15 Nepean High 424 31.1 938 68.9 153 1515 60 3.8 1575
16 Nepean Hospital 116 42.3 158 57.7 31 305 15 4.7 320
17 Penrith PCYC 464 39.0 727 61.0 145 1336 53 3.8 1389
18 Penrith Sth Public 1009 35.7 1821 64.3 352 3182 156 4.7 3338
19 Samuel Terry Public 478 35.1 883 64.9 228 1589 84 5.0 1673
20 St Dominic's Cllg 285 39.4 438 60.6 97 820 41 4.8 861
21 Sydney Town Hall 9 36.0 16 64.0 5 30 3 9.1 33
Ordinary Votes 9986 34.0 19361 66.0 3812 33159 1344 3.9 34503
Absent 961 35.1 1776 64.9 534 3271 129 3.8 3400
Declared Institution 35 46.1 41 53.9 8 84 2 2.3 86
Enrolment New 59 44.4 74 55.6 27 160 10 5.9 170
Postal/iVote 727 30.8 1634 69.2 265 2626 36 1.4 2662
Pre-poll 885 30.2 2046 69.8 341 3272 64 1.9 3336
Provisional/Silent 51 35.9 91 64.1 17 159 4 2.5 163
Declaration Votes 2718 32.4 5662 67.6 1192 9572 245 2.5 9817
Grand Total 12704 33.7 25023 66.3 5004 42731 1589 3.6 44320
PENRITHRoll : 47194 (Turnout 93.9%)
Thain Ayres
(ALP) (LIB) Informal
85

2011 New South Wales Election
POLLING PLACES Total
Exhst Formal Vote
Votes % Votes % %
1 Avalon Rec Cntr 574 16.9 2819 83.1 617 4010 110 2.7 4120
2 Barrenjoey High 217 17.9 992 82.1 172 1381 31 2.2 1412
3 Bilgola Plateau Public 177 13.0 1184 87.0 178 1539 30 1.9 1569
4 Elanora Hghts Public 268 14.6 1563 85.4 180 2011 50 2.4 2061
5 Loquat Valley Prep 90 9.3 875 90.7 88 1053 13 1.2 1066
6 Mona Vale Hospital 103 21.1 386 78.9 42 531 14 2.6 545
7 Mona Vale Mem. Hall 544 15.0 3088 85.0 316 3948 112 2.8 4060
8 Mona Vale SLSC 147 11.7 1106 88.3 134 1387 32 2.3 1419
9 Narrabeen Lakes Public 231 18.8 995 81.2 160 1386 43 3.0 1429
10 Narrabeen Sports High 359 19.1 1519 80.9 248 2126 64 2.9 2190
11 Newport Public 271 13.4 1758 86.6 194 2223 67 2.9 2290
12 Newport SLSC 274 16.1 1426 83.9 202 1902 52 2.7 1954
13 Palm Beach Kindy 117 12.8 799 87.2 71 987 12 1.2 999
14 Pittwater High 240 13.3 1568 86.7 143 1951 42 2.1 1993
15 RSL Lifecare 86 17.6 403 82.4 21 510 11 2.1 521
16 Scotland Is. Hall 50 24.8 152 75.2 58 260 4 1.5 264
17 Sydney Town Hall 9 29.0 22 71.0 4 35 3 7.9 38
18 Ted Blackwood Comm. Cntr 361 15.9 1911 84.1 205 2477 78 3.1 2555
19 Terrey Hills Public 259 13.8 1620 86.2 156 2035 44 2.1 2079
20 The Lakes Parish Hall 257 19.5 1062 80.5 150 1469 26 1.7 1495
Ordinary Votes 4634 15.5 25248 84.5 3339 33221 838 2.5 34059
Absent 672 18.6 2945 81.4 531 4148 99 2.3 4247
Declared Institution 31 23.5 101 76.5 7 139 2 1.4 141
Enrolment New 26 13.5 166 86.5 28 220 5 2.2 225
Postal/iVote 343 14.6 2012 85.4 176 2531 25 1.0 2556
Pre-poll 524 13.0 3515 87.0 369 4408 76 1.7 4484
Provisional/Silent 14 16.1 73 83.9 16 103 3 2.8 106
Declaration Votes 1610 15.4 8812 84.6 1127 11549 210 1.8 11759
Grand Total 6244 15.5 34060 84.5 4466 44770 1048 2.3 45818
PITTWATER (2-Party Preferred)Roll : 49380 (Turnout 92.8%)
Boydell Stokes
(ALP) (LIB) Informal
86

2011 New South Wales Election
POLLING PLACES Total
Exhst Formal Vote
Votes % Votes % %
1 Bonny Hills Hall 599 51.2 571 48.8 69 1239 19 1.5 1258
2 Camden Haven High 209 52.6 188 47.4 20 417 9 2.1 426
3 Coopernook Arts Hall 190 60.5 124 39.5 24 338 10 2.9 348
4 Dunbogan Jubilee Hall 242 50.5 237 49.5 21 500 10 2.0 510
5 Emerald Downs Comm Cntr 1349 59.6 915 40.4 75 2339 47 2.0 2386
6 Hannam Vale Public 93 52.8 83 47.2 12 188 3 1.6 191
7 Harrington Hall 765 58.8 536 41.2 88 1389 19 1.3 1408
8 Hastings Public 1189 53.8 1021 46.2 92 2302 37 1.6 2339
9 Herons Crk Public 75 49.0 78 51.0 10 163 1 0.6 164
10 Johns River Public 116 58.0 84 42.0 11 211 1 0.5 212
11 Kendall Hall 373 50.1 372 49.9 36 781 27 3.3 808
12 King Crk RFS 461 70.5 193 29.5 22 676 16 2.3 692
13 Lake Cathie Hall 947 61.7 587 38.3 63 1597 24 1.5 1621
14 Lansdowne Public 188 50.3 186 49.7 28 402 11 2.7 413
15 Laurieton Arts Hall 598 52.3 545 47.7 82 1225 24 1.9 1249
16 Lord Howe Is. School 80 43.7 103 56.3 22 205 4 1.9 209
17 Lorne Rec. Cntr 80 51.9 74 48.1 1 155 3 1.9 158
18 Moorland Public 141 54.7 117 45.3 9 267 3 1.1 270
19 Nth Haven Hall 491 49.0 512 51.0 52 1055 32 2.9 1087
20 Nth Shore RFS 186 61.8 115 38.2 13 314 3 0.9 317
21 Old St Josephs Regional High 844 57.5 624 42.5 67 1535 36 2.3 1571
22 Port Macquarie CWA 459 55.6 367 44.4 39 865 24 2.7 889
23 Port Macquarie High 1628 55.2 1321 44.8 169 3118 81 2.5 3199
24 Port Macquarie Hospital 101 52.9 90 47.1 8 199 3 1.5 202
25 Port Macquarie Lions Club 715 60.4 468 39.6 48 1231 37 2.9 1268
26 Port Macquarie Public 841 57.6 619 42.4 84 1544 47 3.0 1591
27 St Columba School Port Mac. 793 62.1 483 37.9 40 1316 21 1.6 1337
28 St Peter The Fisherman 637 51.5 600 48.5 62 1299 29 2.2 1328
29 Sydney Town Hall 13 46.4 15 53.6 3 31 0 0.0 31
30 Tacking Pt Public 1178 57.1 885 42.9 72 2135 41 1.9 2176
31 Telegraph Pt Public 58 69.0 26 31.0 7 91 1 1.1 92
32 Wauchope High 109 59.6 74 40.4 22 205 5 2.4 210
33 Westport High 1542 56.9 1167 43.1 141 2850 80 2.7 2930
Ordinary Votes 17290 56.4 13380 43.6 1512 32182 708 2.2 32890
Absent 1461 52.3 1333 47.7 317 3111 56 1.8 3167
Declared Institution 97 58.4 69 41.6 6 172 0 0.0 172
Enrolment New 6 27.3 16 72.7 1 23 2 8.0 25
Postal/iVote 1412 58.1 1018 41.9 133 2563 17 0.7 2580
Pre-poll 4050 58.3 2896 41.7 351 7297 103 1.4 7400
Provisional/Silent 62 50.0 62 50.0 8 132 3 2.2 135
Declaration Votes 7088 56.8 5394 43.2 816 13298 181 1.3 13479
Grand Total 24378 56.5 18774 43.5 2328 45480 889 1.9 46369
PORT MACQUARIERoll : 49413 (Turnout 93.8%)
Williams Besseling
(NAT) (IND) Informal
87

2011 New South Wales Election
POLLING PLACES Total
Exhst Formal Vote
Votes % Votes % %
1 Bonny Hills Hall 215 24.0 680 76.0 344 1239 19 1.5 1258
2 Camden Haven High 68 22.9 229 77.1 120 417 9 2.1 426
3 Coopernook Arts Hall 51 20.0 204 80.0 83 338 10 2.9 348
4 Dunbogan Jubilee Hall 86 24.0 273 76.0 141 500 10 2.0 510
5 Emerald Downs Comm Cntr 305 17.1 1475 82.9 559 2339 47 2.0 2386
6 Hannam Vale Public 33 23.9 105 76.1 50 188 3 1.6 191
7 Harrington Hall 250 23.1 831 76.9 308 1389 19 1.3 1408
8 Hastings Public 365 21.7 1320 78.3 617 2302 37 1.6 2339
9 Herons Crk Public 29 25.4 85 74.6 49 163 1 0.6 164
10 Johns River Public 33 20.9 125 79.1 53 211 1 0.5 212
11 Kendall Hall 135 24.2 424 75.8 222 781 27 3.3 808
12 King Crk RFS 72 12.9 485 87.1 119 676 16 2.3 692
13 Lake Cathie Hall 216 17.3 1029 82.7 352 1597 24 1.5 1621
14 Lansdowne Public 67 23.8 215 76.2 120 402 11 2.7 413
15 Laurieton Arts Hall 236 25.9 675 74.1 314 1225 24 1.9 1249
16 Lord Howe Is. School 44 31.2 97 68.8 64 205 4 1.9 209
17 Lorne Rec. Cntr 19 17.3 91 82.7 45 155 3 1.9 158
18 Moorland Public 42 21.4 154 78.6 71 267 3 1.1 270
19 Nth Haven Hall 210 27.5 553 72.5 292 1055 32 2.9 1087
20 Nth Shore RFS 46 18.9 197 81.1 71 314 3 0.9 317
21 Old St Josephs Regional High 237 20.4 922 79.6 376 1535 36 2.3 1571
22 Port Macquarie CWA 136 21.1 510 78.9 219 865 24 2.7 889
23 Port Macquarie High 519 22.4 1798 77.6 801 3118 81 2.5 3199
24 Port Macquarie Hospital 31 21.7 112 78.3 56 199 3 1.5 202
25 Port Macquarie Lions Club 181 19.1 769 80.9 281 1231 37 2.9 1268
26 Port Macquarie Public 256 21.9 914 78.1 374 1544 47 3.0 1591
27 St Columba School Port Mac. 165 16.2 856 83.8 295 1316 21 1.6 1337
28 St Peter The Fisherman 240 25.2 714 74.8 345 1299 29 2.2 1328
29 Sydney Town Hall 8 38.1 13 61.9 10 31 0 0.0 31
30 Tacking Pt Public 303 19.0 1294 81.0 538 2135 41 1.9 2176
31 Telegraph Pt Public 13 18.1 59 81.9 19 91 1 1.1 92
32 Wauchope High 33 21.4 121 78.6 51 205 5 2.4 210
33 Westport High 474 22.0 1683 78.0 693 2850 80 2.7 2930
Ordinary Votes 5118 21.2 19012 78.8 8052 32182 708 2.2 32890
Absent 634 28.1 1625 71.9 852 3111 56 1.8 3167
Declared Institution 29 22.3 101 77.7 42 172 0 0.0 172
Enrolment New 4 33.3 8 66.7 11 23 2 8.0 25
Postal/iVote 393 20.2 1550 79.8 620 2563 17 0.7 2580
Pre-poll 1038 18.9 4466 81.1 1793 7297 103 1.4 7400
Provisional/Silent 27 28.4 68 71.6 37 132 3 2.2 135
Declaration Votes 2125 21.4 7818 78.6 3355 13298 181 1.3 13479
Grand Total 7242 21.3 26830 78.7 11408 45480 889 1.9 46369
(Estimated two-party preferred counts)
PORT MACQUARIE (2-Party Preferred)Roll : 49413 (Turnout 93.8%)
Alley Williams
(ALP) (NAT) Informal
88

2011 New South Wales Election
POLLING PLACES Total
Exhst Formal Vote
Votes % Votes % %
1 Anna Bay Public 749 41.8 1045 58.2 227 2021 84 4.0 2105
2 Bobs Farm Hall 78 29.8 184 70.2 29 291 6 2.0 297
3 Corlette Hall 379 24.1 1192 75.9 178 1749 31 1.7 1780
4 Fern Bay Hall 427 48.8 448 51.2 120 995 28 2.7 1023
5 Fingal Bay Tennis Club 148 32.5 308 67.5 55 511 16 3.0 527
6 Hawks Nest Hall 226 32.1 479 67.9 59 764 18 2.3 782
7 Irrawang High 635 43.1 838 56.9 323 1796 91 4.8 1887
8 Irrawang Public 327 50.3 323 49.7 140 790 39 4.7 829
9 Karuah Public 271 40.3 402 59.7 102 775 32 4.0 807
10 Mayfield W Public 768 54.1 652 45.9 307 1727 70 3.9 1797
11 Medowie Public 626 36.2 1102 63.8 235 1963 52 2.6 2015
12 Nelson Bay Baptist 325 27.9 841 72.1 155 1321 51 3.7 1372
13 Nth Arm Cove Comm. Cntr 69 29.5 165 70.5 29 263 4 1.5 267
14 Port Stephens PCYC 292 34.4 558 65.6 95 945 25 2.6 970
15 Raymond Terrace Public 467 42.5 633 57.5 170 1270 62 4.7 1332
16 Raymond Terrace Snr Ctzn Cntr381 43.5 494 56.5 133 1008 38 3.6 1046
17 Salamander Bay Social Club 382 30.2 881 69.8 156 1419 39 2.7 1458
18 Salt Ash Public 217 34.8 407 65.2 101 725 26 3.5 751
19 Shoal Bay Public 313 40.5 459 59.5 116 888 18 2.0 906
20 Soldiers Pt Hall 242 30.6 548 69.4 80 870 12 1.4 882
21 St Andrews Mayfield 241 54.9 198 45.1 119 558 32 5.4 590
22 St Matthews Anglican Georgetown25 58.1 18 41.9 3 46 1 2.1 47
23 Sydney Town Hall 6 46.2 7 53.8 4 17 0 0.0 17
24 Tanilba Bay Public 709 44.2 894 55.8 248 1851 77 4.0 1928
25 Tea Gardens Public 374 27.3 998 72.7 118 1490 29 1.9 1519
26 Tilligerry Comm. Cntr 451 43.0 599 57.0 152 1202 43 3.5 1245
27 Tomaree Ed. Cntr 332 31.0 740 69.0 173 1245 35 2.7 1280
28 Warabrook Comm. Cntr 462 46.2 539 53.8 135 1136 40 3.4 1176
29 Williamtown Hall 153 33.5 304 66.5 66 523 12 2.2 535
30 Wirreanda Public 770 39.3 1189 60.7 254 2213 63 2.8 2276
Ordinary Votes 10845 38.3 17445 61.7 4082 32372 1074 3.2 33446
Absent 1101 38.0 1795 62.0 586 3482 113 3.1 3595
Declared Institution 88 43.1 116 56.9 14 218 4 1.8 222
Enrolment New 108 41.5 152 58.5 87 347 16 4.4 363
Postal/iVote 858 33.4 1713 66.6 285 2856 26 0.9 2882
Pre-poll 1740 34.5 3297 65.5 502 5539 111 2.0 5650
Provisional/Silent 30 41.1 43 58.9 15 88 5 5.4 93
Declaration Votes 3925 35.5 7116 64.5 1489 12530 275 2.1 12805
Grand Total 14770 37.6 24561 62.4 5571 44902 1349 2.9 46251
PORT STEPHENSRoll : 49514 (Turnout 93.4%)
Washington Baumann
(ALP) (LIB) Informal
89

2011 New South Wales Election
POLLING PLACES Total
Exhst Formal Vote
Votes % Votes % %
1 Barnier Public 820 32.0 1744 68.0 408 2972 124 4.0 3096
2 Bligh Park Public 532 23.3 1752 76.7 357 2641 166 5.9 2807
3 Caddies Crk Public 875 31.4 1912 68.6 265 3052 142 4.4 3194
4 Glenwood High 397 27.4 1051 72.6 118 1566 53 3.3 1619
5 Hambledon Public 720 30.6 1635 69.4 256 2611 85 3.2 2696
6 Ironbark Ridge Public 7 22.6 24 77.4 2 33 2 5.7 35
7 John Palmer 299 21.3 1107 78.7 110 1516 48 3.1 1564
8 Kellyville Ridge Public 683 25.6 1988 74.4 317 2988 93 3.0 3081
9 Marsden Park Public 247 28.0 634 72.0 95 976 50 4.9 1026
10 McGraths Hill Comm. Cntr 169 19.4 702 80.6 112 983 36 3.5 1019
11 Parklea Public 628 29.3 1518 70.7 250 2396 108 4.3 2504
12 Quakers Hill E Public 668 30.7 1505 69.3 228 2401 112 4.5 2513
13 Quakers Hill High 964 39.6 1471 60.4 283 2718 110 3.9 2828
14 Quakers Hill Public 210 41.0 302 59.0 115 627 37 5.6 664
15 Riverstone High 278 24.3 866 75.7 217 1361 46 3.3 1407
16 Sam Ln Complex 377 37.4 630 62.6 117 1124 45 3.8 1169
17 Schofields Public 316 29.7 747 70.3 157 1220 54 4.2 1274
18 Stanhope Gardens Leisure Cntr642 29.6 1528 70.4 288 2458 95 3.7 2553
19 Sydney Town Hall 17 45.9 20 54.1 10 47 2 4.1 49
20 Vineyard Public 99 20.6 381 79.4 49 529 32 5.7 561
21 William Dean Public 588 48.5 624 51.5 184 1396 125 8.2 1521
22 Windsor Function Cntr 223 29.5 534 70.5 127 884 36 3.9 920
23 Windsor Park Public 259 23.9 826 76.1 164 1249 61 4.7 1310
24 Windsor Sth Public 546 34.8 1025 65.2 266 1837 118 6.0 1955
Ordinary Votes 10564 30.1 24526 69.9 4495 39585 1780 4.3 41365
Absent 1684 30.8 3784 69.2 1081 6549 267 3.9 6816
Declared Institution 18 19.1 76 80.9 6 100 1 1.0 101
Enrolment New 18 31.0 40 69.0 10 68 3 4.2 71
Postal/iVote 800 25.8 2297 74.2 389 3486 30 0.9 3516
Pre-poll 413 28.2 1050 71.8 177 1640 43 2.6 1683
Provisional/Silent 58 33.5 115 66.5 26 199 3 1.5 202
Declaration Votes 2991 28.9 7362 71.1 1689 12042 347 2.8 12389
Grand Total 13555 29.8 31888 70.2 6184 51627 2127 4.0 53754
RIVERSTONERoll : 57408 (Turnout 93.6%)
Vassili Conolly
(ALP) (LIB) Informal
90

2011 New South Wales Election
POLLING PLACES Total
Exhst Formal Vote
Votes % Votes % %
1 Arncliffe Public 552 56.7 422 43.3 191 1165 70 5.7 1235
2 Arncliffe W Infants 399 51.8 371 48.2 345 1115 46 4.0 1161
3 Athelstane Public 972 52.6 876 47.4 760 2608 138 5.0 2746
4 Bardwell Park Infants 433 44.4 542 55.6 121 1096 36 3.2 1132
5 Bexley Nth Public 284 48.8 298 51.2 67 649 22 3.3 671
6 Bexley Public 571 54.5 477 45.5 215 1263 51 3.9 1314
7 Brighton-Le-Sands Public 1125 50.8 1091 49.2 258 2474 107 4.1 2581
8 Carlton Sth Public 307 46.9 348 53.1 69 724 30 4.0 754
9 Coronation Hall Arncliffe 442 51.5 417 48.5 289 1148 54 4.5 1202
10 Kogarah Congregational Church329 33.9 641 66.1 70 1040 30 2.8 1070
11 Kogarah High 229 49.1 237 50.9 76 542 30 5.2 572
12 Kyeemagh Infants 490 49.2 505 50.8 65 1060 31 2.8 1091
13 Ramsgate Public 847 41.8 1178 58.2 181 2206 96 4.2 2302
14 Rockdale Public 688 61.0 440 39.0 181 1309 89 6.4 1398
15 Rockdale Uniting 1100 49.3 1133 50.7 290 2523 137 5.2 2660
16 Sans Souci Comm. Pre-Sch. 740 38.2 1197 61.8 243 2180 69 3.1 2249
17 Sans Souci Literary Inst. 860 45.5 1030 54.5 195 2085 74 3.4 2159
18 Sans Souci Public 836 39.9 1260 60.1 168 2264 75 3.2 2339
19 Society of St Pius X 514 50.4 506 49.6 142 1162 59 4.8 1221
20 St George Archers Hall 692 42.5 936 57.5 158 1786 68 3.7 1854
21 St George School 415 49.7 420 50.3 63 898 28 3.0 926
22 St Josephs Rockdale 684 56.2 533 43.8 216 1433 73 4.8 1506
23 St Marks Brighton-Le-Sands 449 44.9 552 55.1 149 1150 40 3.4 1190
24 Sydney Town Hall 42 49.4 43 50.6 6 91 4 4.2 95
Ordinary Votes 14000 47.5 15453 52.5 4518 33971 1457 4.1 35428
Absent 1696 45.5 2030 54.5 633 4359 171 3.8 4530
Declared Institution 61 45.9 72 54.1 7 140 3 2.1 143
Enrolment New 104 54.2 88 45.8 34 226 9 3.8 235
Postal/iVote 1137 37.7 1876 62.3 305 3318 45 1.3 3363
Pre-poll 772 45.3 933 54.7 232 1937 61 3.1 1998
Provisional/Silent 43 34.7 81 65.3 19 143 11 7.1 154
Declaration Votes 3813 42.9 5080 57.1 1230 10123 300 2.9 10423
Grand Total 17805 46.4 20546 53.6 5743 44094 1757 3.8 45851
ROCKDALERoll : 49466 (Turnout 92.7%)
Kamper Flowers
(ALP) (LIB) Informal
91

2011 New South Wales Election
POLLING PLACES Total
Exhst Formal Vote
Votes % Votes % %
1 Brush Farm Academy 95 21.3 352 78.7 48 495 9 1.8 504
2 Denistone E Public 511 23.8 1635 76.2 243 2389 62 2.5 2451
3 Eastwood Baptist 199 24.3 621 75.7 106 926 20 2.1 946
4 Eastwood Hghts Public 312 24.6 955 75.4 163 1430 40 2.7 1470
5 Eastwood Public 546 28.4 1376 71.6 201 2123 74 3.4 2197
6 Epping Boys 61 24.3 190 75.7 37 288 19 6.2 307
7 Kent Rd Public 449 22.7 1529 77.3 205 2183 98 4.3 2281
8 Marsden High 261 23.3 859 76.7 136 1256 28 2.2 1284
9 Meadowbank Public 271 23.7 871 76.3 118 1260 20 1.6 1280
10 Meadowbank TAFE 244 25.6 708 74.4 127 1079 36 3.2 1115
11 Melrose Park Public 217 27.4 575 72.6 89 881 23 2.5 904
12 Morling College 285 26.8 778 73.2 137 1200 40 3.2 1240
13 Nth Ryde Public 511 22.5 1765 77.5 262 2538 82 3.1 2620
14 Putney Public 73 22.5 251 77.5 52 376 12 3.1 388
15 Ryde Baptist 158 21.0 593 79.0 63 814 25 3.0 839
16 Ryde E Public 242 20.5 937 79.5 109 1288 37 2.8 1325
17 Ryde Hospital 146 24.0 462 76.0 59 667 11 1.6 678
18 Ryde Masonic Hall 365 31.1 807 68.9 130 1302 68 5.0 1370
19 Ryde Public 314 26.4 875 73.6 149 1338 48 3.5 1386
20 Ryde TAFE 330 25.4 969 74.6 139 1438 38 2.6 1476
21 Skillseekers Cntr Marsfield 103 18.9 442 81.1 52 597 12 2.0 609
22 Spastic Cntr Ryde 193 22.8 653 77.2 78 924 20 2.1 944
23 St Anthonys Marsfield 258 20.2 1017 79.8 88 1363 47 3.3 1410
24 Sydney Town Hall 30 42.3 41 57.7 11 82 4 4.7 86
25 The Living Way Church Hall 277 23.8 885 76.2 114 1276 49 3.7 1325
26 Truscott St Public 279 21.6 1014 78.4 123 1416 41 2.8 1457
27 W Ryde Public 693 25.8 1989 74.2 336 3018 85 2.7 3103
Ordinary Votes 7423 24.3 23149 75.7 3375 33947 1048 3.0 34995
Absent 912 28.5 2288 71.5 493 3693 99 2.6 3792
Declared Institution 43 22.1 152 77.9 20 215 7 3.2 222
Enrolment New 32 28.8 79 71.2 19 130 3 2.3 133
Postal/iVote 657 21.4 2418 78.6 241 3316 36 1.1 3352
Pre-poll 392 21.7 1414 78.3 172 1978 39 1.9 2017
Provisional/Silent 39 33.3 78 66.7 11 128 4 3.0 132
Declaration Votes 2075 24.4 6429 75.6 956 9460 188 1.9 9648
Grand Total 9498 24.3 29578 75.7 4331 43407 1236 2.8 44643
RYDERoll : 48148 (Turnout 92.7%)
Laxale Dominello
(ALP) (LIB) Informal
92

2011 New South Wales Election
POLLING PLACES Total
Exhst Formal Vote
Votes % Votes % %
1 Albion Park Rail Public 386 57.7 283 42.3 71 740 44 5.6 784
2 Balarang Public 735 58.2 527 41.8 187 1449 60 4.0 1509
3 Barrack Hghts Public 626 66.8 311 33.2 108 1045 45 4.1 1090
4 Dapto Public 334 54.7 277 45.3 71 682 20 2.8 702
5 Dapto Ribbonwood Cntr 1185 57.8 864 42.2 286 2335 141 5.7 2476
6 Flinders Public 861 58.8 603 41.2 161 1625 73 4.3 1698
7 Hayes Park Public 815 56.4 630 43.6 210 1655 104 5.9 1759
8 Horsley Comm. Cntr 1261 52.9 1123 47.1 306 2690 162 5.7 2852
9 Koonawarra Comm. Hall 1296 70.3 547 29.7 266 2109 124 5.6 2233
10 Lake Illawarra High 853 63.6 489 36.4 138 1480 80 5.1 1560
11 Lakelands Public 776 60.0 517 40.0 168 1461 88 5.7 1549
12 Mt Brown Public 942 52.8 842 47.2 190 1974 141 6.7 2115
13 Mt Warrigal Public 921 65.3 489 34.7 167 1577 104 6.2 1681
14 Oak Flats Nhood Cntr 1266 60.1 840 39.9 348 2454 120 4.7 2574
15 Shellharbour City Cntr Anglican876 58.8 614 41.2 156 1646 93 5.3 1739
16 Shellharbour Public 815 50.1 811 49.9 232 1858 80 4.1 1938
17 St Lukes Dapto 454 55.9 358 44.1 107 919 55 5.6 974
18 Sydney Town Hall 8 53.3 7 46.7 2 17 1 5.6 18
19 Warilla High 920 60.6 599 39.4 212 1731 79 4.4 1810
20 Warilla Nth Comm Cntr 822 77.2 243 22.8 114 1179 66 5.3 1245
21 Warilla Public 635 69.9 273 30.1 113 1021 63 5.8 1084
22 Warilla SLSC 794 59.1 550 40.9 196 1540 86 5.3 1626
Ordinary Votes 17581 59.8 11797 40.2 3809 33187 1829 5.2 35016
Absent 2232 55.7 1773 44.3 550 4555 202 4.2 4757
Declared Institution 18 69.2 8 30.8 4 30 0 0.0 30
Enrolment New 100 61.7 62 38.3 20 182 7 3.7 189
Postal/iVote 1112 52.8 993 47.2 248 2353 31 1.3 2384
Pre-poll 1637 54.4 1372 45.6 380 3389 86 2.5 3475
Provisional/Silent 54 55.1 44 44.9 11 109 5 4.4 114
Declaration Votes 5153 54.8 4252 45.2 1213 10618 331 3.0 10949
Grand Total 22737 58.6 16050 41.4 5018 43805 2160 4.7 45965
SHELLHARBOURRoll : 49206 (Turnout 93.4%)
Watson Mallinson
(ALP) (LIB) Informal
93

2011 New South Wales Election
POLLING PLACES Total
Exhst Formal Vote
Votes % Votes % %
1 Abbotsbury Comm. Cntr 689 36.6 1191 63.4 115 1995 104 5.0 2099
2 Beresford Rd Public 991 40.0 1485 60.0 229 2705 163 5.7 2868
3 Bossley Park High 817 50.2 812 49.8 151 1780 124 6.5 1904
4 Bossley Park Public 1253 45.9 1479 54.1 278 3010 167 5.3 3177
5 Edensor Park Public 1149 45.3 1389 54.7 311 2849 198 6.5 3047
6 Governor Philip King Public 996 51.8 928 48.2 229 2153 110 4.9 2263
7 Greystanes Public 977 37.0 1662 63.0 211 2850 150 5.0 3000
8 Holroyd High 78 33.5 155 66.5 26 259 17 6.2 276
9 Horsley Park Public 366 25.6 1066 74.4 88 1520 72 4.5 1592
10 James Erskine Public 1055 38.3 1700 61.7 300 3055 253 7.6 3308
11 Kemps Crk Public 118 22.3 410 77.7 21 549 45 7.6 594
12 Pendle Hill Public 27 44.3 34 55.7 13 74 5 6.3 79
13 Prairievale Public 1121 57.8 819 42.2 242 2182 166 7.1 2348
14 Prairiewood Cntr 88 47.6 97 52.4 18 203 13 6.0 216
15 Ringrose Public 45 36.9 77 63.1 21 143 7 4.7 150
16 Smithfield Public 931 58.1 671 41.9 158 1760 129 6.8 1889
17 Smithfield W Public 1404 48.9 1468 51.1 293 3165 210 6.2 3375
18 St Johns Park High 1052 53.2 925 46.8 236 2213 128 5.5 2341
19 St Johns Park Public 57 53.8 49 46.2 13 119 10 7.8 129
20 Sydney Town Hall 12 32.4 25 67.6 4 41 3 6.8 44
21 Widemere Public 527 38.7 836 61.3 109 1472 66 4.3 1538
22 William Stimson Public 1453 53.6 1260 46.4 255 2968 209 6.6 3177
Ordinary Votes 15206 45.1 18538 54.9 3321 37065 2349 6.0 39414
Absent 2103 47.3 2343 52.7 595 5041 205 3.9 5246
Declared Institution 18 38.3 29 61.7 4 51 1 1.9 52
Enrolment New 72 47.7 79 52.3 16 167 13 7.2 180
Postal/iVote 1175 44.1 1490 55.9 306 2971 49 1.6 3020
Pre-poll 339 41.1 485 58.9 58 882 39 4.2 921
Provisional/Silent 35 43.8 45 56.2 7 87 5 5.4 92
Declaration Votes 3742 45.6 4471 54.4 986 9199 312 3.3 9511
Grand Total 18948 45.2 23009 54.8 4307 46264 2661 5.4 48925
SMITHFIELDRoll : 51761 (Turnout 94.5%)
Khoshaba Rohan
(ALP) (LIB) Informal
94

2011 New South Wales Election
POLLING PLACES Total
Exhst Formal Vote
Votes % Votes % %
1 Burrill Lake Hall 226 34.7 425 65.3 93 744 21 2.7 765
2 Callala Beach Hall 115 32.6 238 67.4 24 377 7 1.8 384
3 Callala Comm. Cntr 282 30.8 634 69.2 94 1010 46 4.4 1056
4 Cudmirrah Hall 127 28.2 324 71.8 30 481 16 3.2 497
5 Culburra Public 396 32.7 814 67.3 91 1301 45 3.3 1346
6 Currarong Hall 65 27.7 170 72.3 27 262 3 1.1 265
7 Erowal Bay Hall 168 43.2 221 56.8 48 437 15 3.3 452
8 Falls Crk Public 131 30.7 296 69.3 33 460 16 3.4 476
9 Greenwell Pt Public 187 29.7 443 70.3 56 686 22 3.1 708
10 Huskisson Comm. Cntr 303 34.6 572 65.4 79 954 33 3.3 987
11 Kioloa-Bawley Pt Comm. Cntr 159 36.7 274 63.3 72 505 9 1.8 514
12 Lake Conjola Comm. Cntr 127 30.9 284 69.1 40 451 15 3.2 466
13 Manyana Hall 120 41.1 172 58.9 41 333 8 2.3 341
14 Milton Anglican 240 27.0 649 73.0 172 1061 22 2.0 1083
15 Milton-Ulladulla Baptist 264 30.3 608 69.7 87 959 18 1.8 977
16 Nowra E Public 382 30.2 884 69.8 102 1368 57 4.0 1425
17 Nowra Hill Public 95 19.2 401 80.8 35 531 26 4.7 557
18 Nowra Public 413 28.6 1032 71.4 132 1577 67 4.1 1644
19 Nowra Wesley Cntr 230 28.8 568 71.2 86 884 35 3.8 919
20 Orient Pt Comm. Cntr 111 31.2 245 68.8 35 391 6 1.5 397
21 Sanctuary Pt Public 944 37.2 1594 62.8 177 2715 110 3.9 2825
22 Shoalhaven High 286 31.0 637 69.0 91 1014 47 4.4 1061
23 Shoalhaven Hospital 27 28.7 67 71.3 7 101 2 1.9 103
24 St Georges Basin Comm. Cntr 337 30.3 777 69.7 77 1191 28 2.3 1219
25 St Georges Basin Public 329 33.6 650 66.4 109 1088 36 3.2 1124
26 Sussex Inlet Comm. Cntr 614 33.4 1226 66.6 93 1933 46 2.3 1979
27 Sydney Town Hall 5 31.2 11 68.8 1 17 1 5.6 18
28 Terara Public 116 17.3 554 82.7 78 748 26 3.4 774
29 Tomerong Public 159 29.9 372 70.1 85 616 21 3.3 637
30 Ulladulla Civic Cntr 600 26.5 1664 73.5 277 2541 79 3.0 2620
31 Vincentia Public 510 32.6 1054 67.4 194 1758 55 3.0 1813
Ordinary Votes 8068 31.1 17860 68.9 2566 28494 938 3.2 29432
Absent 912 30.8 2047 69.2 350 3309 107 3.1 3416
Declared Institution 132 35.5 240 64.5 16 388 5 1.3 393
Enrolment New 43 26.1 122 73.9 24 189 8 4.1 197
Postal/iVote 596 24.5 1835 75.5 148 2579 24 0.9 2603
Pre-poll 2560 26.3 7161 73.7 945 10666 311 2.8 10977
Provisional/Silent 31 27.4 82 72.6 14 127 6 4.5 133
Declaration Votes 4274 27.1 11487 72.9 1497 17258 461 2.6 17719
Grand Total 12342 29.6 29347 70.4 4063 45752 1399 3.0 47151
SOUTH COASTRoll : 50762 (Turnout 92.9%)
Sims Hancock
(ALP) (LIB) Informal
95

2011 New South Wales Election
POLLING PLACES Total
Exhst Formal Vote
Votes % Votes % %
1 Ashfield Boys High 620 57.8 453 42.2 144 1217 37 3.0 1254
2 Ashfield Presbyterian 685 57.6 505 42.4 153 1343 39 2.8 1382
3 Burwood Church of Christ 298 46.7 340 53.3 75 713 24 3.3 737
4 Burwood Girls High 1076 47.4 1194 52.6 220 2490 110 4.2 2600
5 Burwood Pk Comm. Cntr 369 48.1 398 51.9 90 857 23 2.6 880
6 Burwood Public 1089 47.5 1205 52.5 224 2518 84 3.2 2602
7 Chalmers Rd School 558 26.2 1573 73.8 150 2281 39 1.7 2320
8 Croydon Park Public 563 43.2 740 56.8 105 1408 46 3.2 1454
9 Croydon Pre-Sch. 406 50.9 392 49.1 126 924 19 2.0 943
10 Enfield Public 801 47.8 873 52.2 150 1824 72 3.8 1896
11 Enfield Scout Hall 307 47.4 341 52.6 99 747 40 5.1 787
12 Homebush Public 768 46.3 889 53.7 186 1843 49 2.6 1892
13 Homebush W Public 671 57.2 502 42.8 109 1282 26 2.0 1308
14 Malvern Hill Uniting 528 39.0 826 61.0 159 1513 38 2.5 1551
15 St Andrews Summer Hill 355 57.1 267 42.9 119 741 24 3.1 765
16 St James Croydon 407 49.7 412 50.3 103 922 37 3.9 959
17 St Johns Ashfield 934 54.0 797 46.0 247 1978 72 3.5 2050
18 St Johns Strathfield 287 26.8 785 73.2 65 1137 15 1.3 1152
19 St Patricks Cllg Strathfield 187 29.7 443 70.3 31 661 7 1.0 668
20 Strathfield Girls High 569 42.0 785 58.0 137 1491 33 2.2 1524
21 Strathfield Sth Public 683 43.3 895 56.7 154 1732 52 2.9 1784
22 Strathfield Sth Uniting 719 48.5 763 51.5 141 1623 61 3.6 1684
23 Sydney Town Hall 64 59.3 44 40.7 16 124 11 8.1 135
24 The Infants Home 336 51.1 322 48.9 74 732 19 2.5 751
25 Vision Australia Enfield 143 35.8 256 64.2 42 441 15 3.3 456
Ordinary Votes 13423 45.6 16000 54.4 3119 32542 992 3.0 33534
Absent 1494 45.7 1773 54.3 518 3785 98 2.5 3883
Declared Institution 28 44.4 35 55.6 1 64 1 1.5 65
Enrolment New 105 47.5 116 52.5 32 253 3 1.2 256
Postal/iVote 1620 45.7 1921 54.3 351 3892 42 1.1 3934
Pre-poll 1256 44.5 1568 55.5 290 3114 67 2.1 3181
Provisional/Silent 88 54.3 74 45.7 16 178 6 3.3 184
Declaration Votes 4591 45.6 5487 54.4 1208 11286 217 1.9 11503
Grand Total 18014 45.6 21487 54.4 4327 43828 1209 2.7 45037
STRATHFIELDRoll : 49084 (Turnout 91.8%)
Judge Casuscelli
(ALP) (LIB) Informal
96

2011 New South Wales Election
POLLING PLACES Total
Exhst Formal Vote
Votes % Votes % %
1 All Saints Belmont 376 49.2 389 50.8 121 886 29 3.2 915
2 Belmont High 312 43.1 412 56.9 129 853 23 2.6 876
3 Belmont N'hood Cntr 685 57.5 507 42.5 212 1404 51 3.5 1455
4 Belmont Public 812 51.0 781 49.0 320 1913 77 3.9 1990
5 Budgewoi Public 746 53.9 638 46.1 164 1548 64 4.0 1612
6 Buff Pt Scout Hall 731 55.1 596 44.9 202 1529 64 4.0 1593
7 Chain Valley Bay Hall 396 54.2 334 45.8 119 849 46 5.1 895
8 Floraville Public 593 42.8 792 57.2 277 1662 60 3.5 1722
9 Gwandalan Comm. Cntr 696 50.5 682 49.5 230 1608 51 3.1 1659
10 Halekulani Hall 566 52.1 521 47.9 162 1249 64 4.9 1313
11 Jewells Public 694 44.3 873 55.7 334 1901 81 4.1 1982
12 Lake Munmorah Public 1285 49.6 1307 50.4 457 3049 115 3.6 3164
13 Mannering Park Comm. Cntr 625 60.6 407 39.4 178 1210 61 4.8 1271
14 Marks Pt Hall 566 55.8 449 44.2 184 1199 44 3.5 1243
15 Nords Wharf Hall 194 43.1 256 56.9 105 555 17 3.0 572
16 Pelican Flats Hall 433 60.1 287 39.9 142 862 31 3.5 893
17 Redhead Public 717 45.2 871 54.8 327 1915 60 3.0 1975
18 Summerland Pt Hall 483 45.4 581 54.6 177 1241 55 4.2 1296
19 Swansea High 956 46.3 1109 53.7 475 2540 72 2.8 2612
20 Swansea Public 683 57.6 502 42.4 305 1490 50 3.2 1540
21 Swansea-Belmont SLSC 391 57.6 288 42.4 122 801 9 1.1 810
22 Sydney Town Hall 12 50.0 12 50.0 4 28 1 3.4 29
23 The Swansea Cntr 671 54.5 561 45.5 282 1514 38 2.4 1552
24 Valentine Public 933 32.8 1909 67.2 500 3342 98 2.8 3440
Ordinary Votes 14556 49.1 15064 50.9 5528 35148 1261 3.5 36409
Absent 1868 49.2 1931 50.8 752 4551 149 3.2 4700
Declared Institution 12 35.3 22 64.7 9 43 0 0.0 43
Enrolment New 92 58.2 66 41.8 42 200 6 2.9 206
Postal/iVote 1704 50.1 1698 49.9 464 3866 24 0.6 3890
Pre-poll 660 40.5 968 59.5 254 1882 31 1.6 1913
Provisional/Silent 37 42.0 51 58.0 21 109 5 4.4 114
Declaration Votes 4373 48.0 4736 52.0 1542 10651 215 2.0 10866
Grand Total 18928 48.9 19805 51.1 7066 45799 1476 3.1 47275
SWANSEARoll : 50148 (Turnout 94.3%)
Coombs Edwards
(ALP) (LIB) Informal
97

2011 New South Wales Election
POLLING PLACES Total
Exhst Formal Vote
Votes % Votes % %
1 Abraham Mott Hall 603 58.7 425 41.3 175 1203 45 3.6 1248
2 Bondi Beach Public 44 57.9 32 42.1 23 99 2 2.0 101
3 Bourke St Public 210 27.6 550 72.4 177 937 25 2.6 962
4 Crown St Public 509 35.2 937 64.8 261 1707 49 2.8 1756
5 Darlinghurst Public 371 41.9 515 58.1 178 1064 14 1.3 1078
6 Double Bay Public 97 75.2 32 24.8 15 144 0 0.0 144
7 Holdsworth St Comm. Cntr 430 60.1 286 39.9 83 799 19 2.3 818
8 JJ Carroll Pre-School 137 25.2 406 74.8 99 642 13 2.0 655
9 Notre Dame Uni Hall 255 29.6 606 70.4 202 1063 30 2.7 1093
10 Paddington Church of Christ 462 55.3 374 44.7 92 928 17 1.8 945
11 Peter Forsyth Hall 52 32.1 110 67.9 43 205 5 2.4 210
12 Pyrmont Comm. Cntr 1277 52.3 1165 47.7 422 2864 63 2.2 2927
13 Reginald Murphy Hall 1153 49.0 1202 51.0 429 2784 44 1.6 2828
14 Seymour Cntr 31 17.7 144 82.3 45 220 5 2.2 225
15 St Canices 580 51.6 544 48.4 236 1360 21 1.5 1381
16 St Columba Woollahra 178 62.5 107 37.5 28 313 8 2.5 321
17 St Francis of Assisi School 839 47.3 935 52.7 268 2042 51 2.4 2093
18 St Georges Paddington 1083 52.0 999 48.0 254 2336 47 2.0 2383
19 St Johns Comm. Hall 607 36.3 1065 63.7 358 2030 40 1.9 2070
20 St Josephs Edgecliff 207 60.9 133 39.1 31 371 11 2.9 382
21 St Michaels Surry Hills 316 36.9 541 63.1 176 1033 24 2.3 1057
22 St Peters Playhouse 164 38.3 264 61.7 49 477 5 1.0 482
23 St Peters Surry Hills 402 33.0 816 67.0 266 1484 48 3.1 1532
24 St Vincents Hospital Darlinghurst106 39.4 163 60.6 50 319 1 0.3 320
25 Sydney Town Hall 1318 52.0 1215 48.0 597 3130 90 2.8 3220
26 Ultimo Public 410 41.5 579 58.5 318 1307 40 3.0 1347
27 Unitarian Church Hall 198 32.5 412 67.5 101 711 14 1.9 725
28 Woolloomooloo Activity Club 400 46.2 466 53.8 216 1082 32 2.9 1114
Ordinary Votes 12439 45.3 15023 54.7 5192 32654 763 2.3 33417
Absent 2822 51.7 2635 48.3 1493 6950 181 2.5 7131
Declared Institution 65 74.7 22 25.3 67 154 0 0.0 154
Enrolment New 157 50.2 156 49.8 97 410 3 0.7 413
Postal/iVote 1519 50.7 1478 49.3 378 3375 33 1.0 3408
Pre-poll 1121 47.3 1251 52.7 464 2836 57 2.0 2893
Provisional/Silent 97 53.0 86 47.0 58 241 3 1.2 244
Declaration Votes 5781 50.7 5628 49.3 2557 13966 277 1.9 14243
Grand Total 18220 46.9 20651 53.1 7749 46620 1040 2.2 47660
SYDNEYRoll : 56786 (Turnout 83.9%)
Bartels Moore
(LIB) (IND) Informal
98
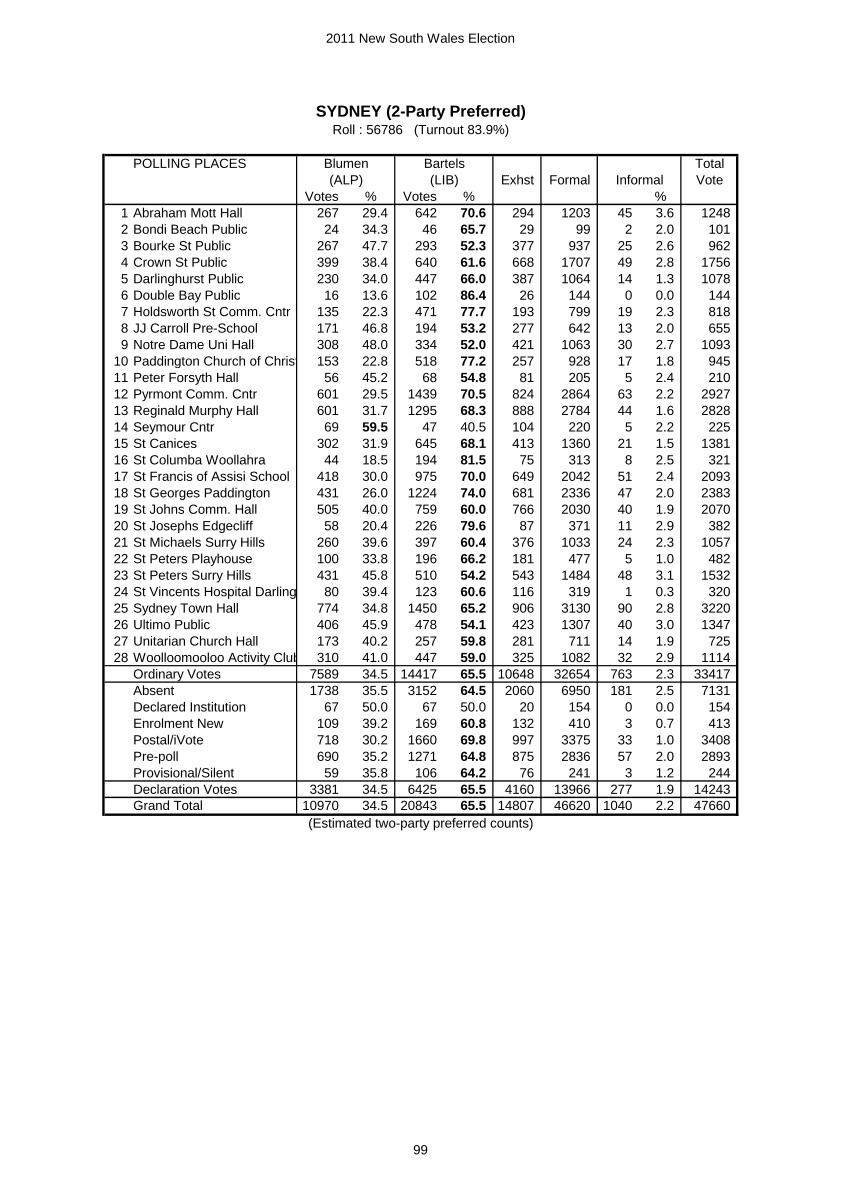
2011 New South Wales Election
POLLING PLACES Total
Exhst Formal Vote
Votes % Votes % %
1 Abraham Mott Hall 267 29.4 642 70.6 294 1203 45 3.6 1248
2 Bondi Beach Public 24 34.3 46 65.7 29 99 2 2.0 101
3 Bourke St Public 267 47.7 293 52.3 377 937 25 2.6 962
4 Crown St Public 399 38.4 640 61.6 668 1707 49 2.8 1756
5 Darlinghurst Public 230 34.0 447 66.0 387 1064 14 1.3 1078
6 Double Bay Public 16 13.6 102 86.4 26 144 0 0.0 144
7 Holdsworth St Comm. Cntr 135 22.3 471 77.7 193 799 19 2.3 818
8 JJ Carroll Pre-School 171 46.8 194 53.2 277 642 13 2.0 655
9 Notre Dame Uni Hall 308 48.0 334 52.0 421 1063 30 2.7 1093
10 Paddington Church of Christ 153 22.8 518 77.2 257 928 17 1.8 945
11 Peter Forsyth Hall 56 45.2 68 54.8 81 205 5 2.4 210
12 Pyrmont Comm. Cntr 601 29.5 1439 70.5 824 2864 63 2.2 2927
13 Reginald Murphy Hall 601 31.7 1295 68.3 888 2784 44 1.6 2828
14 Seymour Cntr 69 59.5 47 40.5 104 220 5 2.2 225
15 St Canices 302 31.9 645 68.1 413 1360 21 1.5 1381
16 St Columba Woollahra 44 18.5 194 81.5 75 313 8 2.5 321
17 St Francis of Assisi School 418 30.0 975 70.0 649 2042 51 2.4 2093
18 St Georges Paddington 431 26.0 1224 74.0 681 2336 47 2.0 2383
19 St Johns Comm. Hall 505 40.0 759 60.0 766 2030 40 1.9 2070
20 St Josephs Edgecliff 58 20.4 226 79.6 87 371 11 2.9 382
21 St Michaels Surry Hills 260 39.6 397 60.4 376 1033 24 2.3 1057
22 St Peters Playhouse 100 33.8 196 66.2 181 477 5 1.0 482
23 St Peters Surry Hills 431 45.8 510 54.2 543 1484 48 3.1 1532
24 St Vincents Hospital Darlinghurst80 39.4 123 60.6 116 319 1 0.3 320
25 Sydney Town Hall 774 34.8 1450 65.2 906 3130 90 2.8 3220
26 Ultimo Public 406 45.9 478 54.1 423 1307 40 3.0 1347
27 Unitarian Church Hall 173 40.2 257 59.8 281 711 14 1.9 725
28 Woolloomooloo Activity Club 310 41.0 447 59.0 325 1082 32 2.9 1114
Ordinary Votes 7589 34.5 14417 65.5 10648 32654 763 2.3 33417
Absent 1738 35.5 3152 64.5 2060 6950 181 2.5 7131
Declared Institution 67 50.0 67 50.0 20 154 0 0.0 154
Enrolment New 109 39.2 169 60.8 132 410 3 0.7 413
Postal/iVote 718 30.2 1660 69.8 997 3375 33 1.0 3408
Pre-poll 690 35.2 1271 64.8 875 2836 57 2.0 2893
Provisional/Silent 59 35.8 106 64.2 76 241 3 1.2 244
Declaration Votes 3381 34.5 6425 65.5 4160 13966 277 1.9 14243
Grand Total 10970 34.5 20843 65.5 14807 46620 1040 2.2 47660
(Estimated two-party preferred counts)
SYDNEY (2-Party Preferred)Roll : 56786 (Turnout 83.9%)
Blumen Bartels
(ALP) (LIB) Informal
99

2011 New South Wales Election
POLLING PLACES Total
Exhst Formal Vote
Votes % Votes % %
1 Attunga Public 245 65.2 131 34.8 9 385 7 1.8 392
2 Barraba Bicentennial Cntr 543 57.2 407 42.8 17 967 9 0.9 976
3 Bendemeer CWA 134 47.7 147 52.3 7 288 7 2.4 295
4 Boggabri Public 369 66.5 186 33.5 22 577 3 0.5 580
5 Breeza Hall 45 50.0 45 50.0 3 93 1 1.1 94
6 Carinya School 717 61.0 459 39.0 24 1200 14 1.2 1214
7 Carroll Public 100 66.7 50 33.3 12 162 6 3.6 168
8 Coledale Comm. Cntr 137 44.3 172 55.7 12 321 7 2.1 328
9 Curlewis Public 168 50.0 168 50.0 9 345 5 1.4 350
10 Currabubula Public 97 48.3 104 51.7 10 211 1 0.5 212
11 Dungowan Hall 129 52.9 115 47.1 6 250 0 0.0 250
12 Duri Hall 197 65.4 104 34.6 3 304 1 0.3 305
13 Gunnedah High 638 65.4 337 34.6 32 1007 11 1.1 1018
14 Gunnedah Sth Public 523 63.7 298 36.3 27 848 12 1.4 860
15 Gunnedah Town Hall 1376 62.9 810 37.1 68 2254 66 2.8 2320
16 Hallsville Uniting 174 59.8 117 40.2 6 297 2 0.7 299
17 Hillvue Public 802 55.6 640 44.4 38 1480 32 2.1 1512
18 Kelvin Hall 61 57.0 46 43.0 1 108 2 1.8 110
19 Kootingal Public 627 53.9 536 46.1 39 1202 19 1.6 1221
20 Manilla Town Hall 776 47.4 862 52.6 49 1687 24 1.4 1711
21 McCarthy Cllg Tamworth 301 56.3 234 43.7 18 553 5 0.9 558
22 Moonbi Public 277 57.9 201 42.1 10 488 7 1.4 495
23 Moore Crk Hall 319 60.8 206 39.2 11 536 2 0.4 538
24 Mullaley Public 57 52.3 52 47.7 3 112 1 0.9 113
25 Nemingha Public 389 53.3 341 46.7 22 752 6 0.8 758
26 Nundle Public 195 54.9 160 45.1 16 371 8 2.1 379
27 Oxley Vale Public 764 58.8 535 41.2 36 1335 27 2.0 1362
28 Peel High 523 52.1 480 47.9 44 1047 28 2.6 1075
29 Somerton Public 119 65.4 63 34.6 2 184 0 0.0 184
30 Sydney Town Hall 10 66.7 5 33.3 1 16 0 0.0 16
31 Tambar Springs Public 44 53.7 38 46.3 3 85 0 0.0 85
32 Tamworth Comm. Cntr 634 59.3 435 40.7 27 1096 16 1.4 1112
33 Tamworth High 1718 55.9 1354 44.1 115 3187 82 2.5 3269
34 Tamworth Public 1574 60.2 1041 39.8 94 2709 29 1.1 2738
35 Tamworth TREC 963 62.2 584 37.8 35 1582 23 1.4 1605
36 Tamworth W Public 721 53.6 624 46.4 31 1376 25 1.8 1401
37 Timbumburi Public 388 66.4 196 33.6 6 590 9 1.5 599
38 Werris Crk Public 247 30.8 554 69.2 28 829 18 2.1 847
39 Westdale Public 632 58.8 443 41.2 27 1102 18 1.6 1120
40 Woolomin Public 88 51.8 82 48.2 2 172 4 2.3 176
Ordinary Votes 17821 57.1 13362 42.9 925 32108 537 1.6 32645
Absent 1436 57.2 1074 42.8 182 2692 44 1.6 2736
Declared Institution 133 57.3 99 42.7 22 254 4 1.6 258
Enrolment New 161 59.0 112 41.0 25 298 6 2.0 304
Postal/iVote 1353 59.0 942 41.0 81 2376 17 0.7 2393
Pre-poll 4696 59.9 3148 40.1 154 7998 86 1.1 8084
Provisional/Silent 80 62.0 49 38.0 16 145 5 3.3 150
Declaration Votes 7859 59.2 5424 40.8 480 13763 162 1.2 13925
Grand Total 25680 57.8 18786 42.2 1405 45871 699 1.5 46570
TAMWORTHRoll : 49246 (Turnout 94.6%)
Anderson Draper
(NAT) (IND) Informal
100

2011 New South Wales Election
POLLING PLACES Total
Exhst Formal Vote
Votes % Votes % %
1 Attunga Public 49 14.9 280 85.1 56 385 7 1.8 392
2 Barraba Bicentennial Cntr 151 18.8 654 81.2 162 967 9 0.9 976
3 Bendemeer CWA 53 23.5 173 76.5 62 288 7 2.4 295
4 Boggabri Public 91 18.0 415 82.0 71 577 3 0.5 580
5 Breeza Hall 17 22.7 58 77.3 18 93 1 1.1 94
6 Carinya School 162 16.1 844 83.9 194 1200 14 1.2 1214
7 Carroll Public 28 20.0 112 80.0 22 162 6 3.6 168
8 Coledale Comm. Cntr 73 28.9 180 71.1 68 321 7 2.1 328
9 Curlewis Public 59 21.4 217 78.6 69 345 5 1.4 350
10 Currabubula Public 43 25.7 124 74.3 44 211 1 0.5 212
11 Dungowan Hall 40 19.8 162 80.2 48 250 0 0.0 250
12 Duri Hall 34 13.0 227 87.0 43 304 1 0.3 305
13 Gunnedah High 144 16.6 723 83.4 140 1007 11 1.1 1018
14 Gunnedah Sth Public 120 16.6 604 83.4 124 848 12 1.4 860
15 Gunnedah Town Hall 356 18.4 1582 81.6 316 2254 66 2.8 2320
16 Hallsville Uniting 42 16.9 207 83.1 48 297 2 0.7 299
17 Hillvue Public 241 19.9 972 80.1 267 1480 32 2.1 1512
18 Kelvin Hall 16 17.8 74 82.2 18 108 2 1.8 110
19 Kootingal Public 204 20.9 773 79.1 225 1202 19 1.6 1221
20 Manilla Town Hall 322 24.2 1011 75.8 354 1687 24 1.4 1711
21 McCarthy Cllg Tamworth 96 21.1 360 78.9 97 553 5 0.9 558
22 Moonbi Public 69 17.2 332 82.8 87 488 7 1.4 495
23 Moore Crk Hall 71 15.8 379 84.2 86 536 2 0.4 538
24 Mullaley Public 20 22.0 71 78.0 21 112 1 0.9 113
25 Nemingha Public 116 19.2 487 80.8 149 752 6 0.8 758
26 Nundle Public 69 22.5 237 77.5 65 371 8 2.1 379
27 Oxley Vale Public 217 19.4 901 80.6 217 1335 27 2.0 1362
28 Peel High 193 22.8 652 77.2 202 1047 28 2.6 1075
29 Somerton Public 22 13.8 137 86.2 25 184 0 0.0 184
30 Sydney Town Hall 2 15.4 11 84.6 3 16 0 0.0 16
31 Tambar Springs Public 14 20.6 54 79.4 17 85 0 0.0 85
32 Tamworth Comm. Cntr 177 19.3 741 80.7 178 1096 16 1.4 1112
33 Tamworth High 549 20.9 2072 79.1 566 3187 82 2.5 3269
34 Tamworth Public 406 18.0 1854 82.0 449 2709 29 1.1 2738
35 Tamworth TREC 222 16.6 1118 83.4 242 1582 23 1.4 1605
36 Tamworth W Public 239 21.4 880 78.6 257 1376 25 1.8 1401
37 Timbumburi Public 62 12.2 445 87.8 83 590 9 1.5 599
38 Werris Crk Public 225 36.5 391 63.5 213 829 18 2.1 847
39 Westdale Public 165 18.0 750 82.0 187 1102 18 1.6 1120
40 Woolomin Public 26 18.8 112 81.2 34 172 4 2.3 176
Ordinary Votes 5205 19.6 21376 80.4 5527 32108 537 1.6 32645
Absent 524 23.6 1697 76.4 471 2692 44 1.6 2736
Declared Institution 53 24.8 161 75.2 40 254 4 1.6 258
Enrolment New 57 23.0 191 77.0 50 298 6 2.0 304
Postal/iVote 363 18.3 1622 81.7 391 2376 17 0.7 2393
Pre-poll 1157 17.3 5547 82.7 1294 7998 86 1.1 8084
Provisional/Silent 28 23.0 94 77.0 23 145 5 3.3 150
Declaration Votes 2182 19.0 9312 81.0 2269 13763 162 1.2 13925
Grand Total 7388 19.4 30688 80.6 7795 45871 699 1.5 46570
(Estimated two-party preferred counts)
TAMWORTH (2-Party Preferred)Roll : 49246 (Turnout 94.6%)
Hobbs Anderson
(ALP) (NAT) Informal
101

2011 New South Wales Election
POLLING PLACES Total
Exhst Formal Vote
Votes % Votes % %
1 Avoca Beach Public 460 26.6 1270 73.4 349 2079 51 2.4 2130
2 Copacabana Public 348 31.2 767 68.8 241 1356 46 3.3 1402
3 Davistown Hall 361 30.5 823 69.5 164 1348 63 4.5 1411
4 Empire Bay Public 655 27.3 1747 72.7 313 2715 79 2.8 2794
5 Erina Hghts Public 227 17.9 1044 82.1 206 1477 28 1.9 1505
6 Erina High 836 28.1 2139 71.9 387 3362 118 3.4 3480
7 Gosford Green Pt Comm. Cntr 326 29.6 777 70.4 99 1202 33 2.7 1235
8 Green Pt Baptist 152 20.2 599 79.8 129 880 24 2.7 904
9 Hardys Bay Church 116 26.1 328 73.9 101 545 22 3.9 567
10 Holgate Public 125 19.7 509 80.3 101 735 22 2.9 757
11 Killcare RFS 110 32.3 231 67.7 77 418 6 1.4 424
12 Kincumber Public 742 29.2 1800 70.8 408 2950 97 3.2 3047
13 Kincumber Youth Cntr 367 32.4 765 67.6 163 1295 39 2.9 1334
14 Saratoga Comm. Hall 410 26.6 1129 73.4 213 1752 72 3.9 1824
15 Sydney Town Hall 8 25.8 23 74.2 4 35 2 5.4 37
16 Terrigal Presbyterian 271 21.9 964 78.1 163 1398 36 2.5 1434
17 Terrigal Primary 571 24.2 1788 75.8 329 2688 85 3.1 2773
18 Terrigal Snr Ctzns Cntr 409 23.8 1307 76.2 207 1923 68 3.4 1991
19 Tuggerah Lakes Cllg -Tumbi Umbi127 26.2 358 73.8 71 556 9 1.6 565
20 Wamberal Hall 405 22.3 1409 77.7 265 2079 57 2.7 2136
21 Wamberal Public 280 27.0 757 73.0 175 1212 22 1.8 1234
Ordinary Votes 7306 26.2 20534 73.8 4165 32005 979 3.0 32984
Absent 1580 28.9 3893 71.1 824 6297 159 2.5 6456
Declared Institution 18 43.9 23 56.1 5 46 3 6.1 49
Enrolment New 11 28.2 28 71.8 13 52 0 0.0 52
Postal/iVote 591 20.0 2371 80.0 278 3240 54 1.6 3294
Pre-poll 391 20.4 1524 79.6 202 2117 28 1.3 2145
Provisional/Silent 16 21.1 60 78.9 22 98 0 0.0 98
Declaration Votes 2607 24.8 7899 75.2 1344 11850 244 2.0 12094
Grand Total 9913 25.9 28433 74.1 5509 43855 1223 2.7 45078
TERRIGALRoll : 48647 (Turnout 92.7%)
Drake Hartcher
(ALP) (LIB) Informal
102

2011 New South Wales Election
POLLING PLACES Total
Exhst Formal Vote
Votes % Votes % %
1 Banksia Cntr 520 36.6 901 63.4 158 1579 69 4.2 1648
2 Bateau Bay Public 562 34.5 1065 65.5 270 1897 77 3.9 1974
3 Berkeley Vale Public 291 32.9 593 67.1 87 971 37 3.7 1008
4 Brooke Ave Public 1109 42.7 1487 57.3 323 2919 125 4.1 3044
5 Chittaway Bay Public 238 38.1 387 61.9 131 756 28 3.6 784
6 Cynthia St Comm. Cntr 181 54.4 152 45.6 45 378 15 3.8 393
7 Glenvale School 431 35.5 783 64.5 167 1381 56 3.9 1437
8 Glenvale School - Nth Entrance194 33.7 382 66.3 79 655 20 3.0 675
9 Killarney Vale Public 448 37.1 761 62.9 179 1388 61 4.2 1449
10 Lisarow Public 655 34.9 1220 65.1 267 2142 77 3.5 2219
11 Long Jetty Snr Ctzns 467 44.6 580 55.4 95 1142 36 3.1 1178
12 Myrtle Brush Park Hall 66 37.3 111 62.7 15 192 6 3.0 198
13 Narara Uniting 400 34.5 759 65.5 151 1310 69 5.0 1379
14 Nareen Gardens 270 38.5 431 61.5 50 751 23 3.0 774
15 Niagara Park Comm. Cntr 720 35.0 1340 65.0 376 2436 110 4.3 2546
16 Ourimbah Public 511 34.6 965 65.4 254 1730 70 3.9 1800
17 Sydney Town Hall 7 30.4 16 69.6 4 27 1 3.6 28
18 The Entrance Public 727 45.5 870 54.5 217 1814 79 4.2 1893
19 Tuggerah Lakes Cllg -The Entrance713 35.9 1271 64.1 277 2261 101 4.3 2362
20 Tuggerah Lakes Cllg -Tumbi Umbi50 23.3 165 76.7 20 235 9 3.7 244
21 Tuggerah Lakes Scout Hall 367 41.9 508 58.1 86 961 39 3.9 1000
22 Tuggerah Public 186 38.2 301 61.8 80 567 18 3.1 585
23 Tumbi Umbi Comm. Hall 284 32.9 578 67.1 64 926 38 3.9 964
24 Valley View Public 450 37.8 742 62.2 214 1406 41 2.8 1447
25 Wyoming Public 816 36.9 1395 63.1 316 2527 112 4.2 2639
Ordinary Votes 10663 37.5 17763 62.5 3925 32351 1317 3.9 33668
Absent 2047 37.8 3362 62.2 867 6276 195 3.0 6471
Declared Institution 58 36.9 99 63.1 12 169 3 1.7 172
Enrolment New 59 40.7 86 59.3 46 191 12 5.9 203
Postal/iVote 1106 36.0 1965 64.0 327 3398 42 1.2 3440
Pre-poll 911 38.9 1429 61.1 156 2496 63 2.5 2559
Provisional/Silent 36 39.1 56 60.9 24 116 1 0.9 117
Declaration Votes 4217 37.6 6997 62.4 1432 12646 316 2.4 12962
Grand Total 14880 37.5 24760 62.5 5357 44997 1633 3.5 46630
THE ENTRANCERoll : 49942 (Turnout 93.4%)
Mehan Spence
(ALP) (LIB) Informal
103

2011 New South Wales Election
POLLING PLACES Total
Exhst Formal Vote
Votes % Votes % %
1 Beresford Rd Public 143 52.6 129 47.4 37 309 18 5.5 327
2 Bert Oldfield Public 577 55.6 461 44.4 153 1191 40 3.2 1231
3 Girraween Public 1193 56.8 907 43.2 194 2294 107 4.5 2401
4 Grantham Hghts Uniting 856 56.3 664 43.7 160 1680 51 2.9 1731
5 Jim Southee Comm. Cntr 630 33.1 1276 66.9 228 2134 64 2.9 2198
6 Kings Langley Public 539 33.9 1052 66.1 190 1781 56 3.0 1837
7 Lalor Park Public 770 53.3 676 46.7 190 1636 118 6.7 1754
8 Lynwood Park Public 546 50.8 528 49.2 151 1225 54 4.2 1279
9 Metella Rd Public 1648 51.7 1541 48.3 319 3508 155 4.2 3663
10 Mitchell High 114 51.1 109 48.9 41 264 7 2.6 271
11 Pendle Hill Baptist 504 54.6 419 45.4 102 1025 35 3.3 1060
12 Pendle Hill Public 932 53.3 815 46.7 187 1934 69 3.4 2003
13 Reg Byrne Comm. Cntr 840 54.4 705 45.6 203 1748 81 4.4 1829
14 Seven Hills High 521 41.8 725 58.2 192 1438 51 3.4 1489
15 Seven Hills Nth Public 496 37.2 836 62.8 152 1484 40 2.6 1524
16 Seven Hills Public 750 56.3 581 43.7 179 1510 54 3.5 1564
17 Seven Hills W Public 734 55.2 596 44.8 161 1491 72 4.6 1563
18 Sydney Town Hall 23 59.0 16 41.0 5 44 2 4.3 46
19 The Hills Sports High 944 59.3 648 40.7 165 1757 86 4.7 1843
20 Toongabbie E Public 158 44.8 195 55.2 44 397 14 3.4 411
21 Toongabbie Public 2016 55.0 1648 45.0 298 3962 121 3.0 4083
22 Toongabbie W Public 705 50.2 700 49.8 141 1546 53 3.3 1599
23 Wentworthville Public 197 49.9 198 50.1 43 438 19 4.2 457
Ordinary Votes 15836 50.7 15425 49.3 3535 34796 1367 3.8 36163
Absent 1913 47.4 2122 52.6 720 4755 203 4.1 4958
Declared Institution 38 61.3 24 38.7 0 62 0 0.0 62
Enrolment New 133 51.0 128 49.0 46 307 26 7.8 333
Postal/iVote 1633 50.0 1630 50.0 365 3628 48 1.3 3676
Pre-poll 388 48.1 418 51.9 77 883 7 0.8 890
Provisional/Silent 40 50.0 40 50.0 13 93 20 17.7 113
Declaration Votes 4145 48.7 4362 51.3 1221 9728 304 3.0 10032
Grand Total 19989 50.3 19784 49.7 4751 44524 1671 3.6 46195
TOONGABBIERoll : 49193 (Turnout 93.9%)
Rees Lloyd
(ALP) (LIB) Informal
104

2011 New South Wales Election
POLLING PLACES Total
Exhst Formal Vote
Votes % Votes % %
1 Banora Pt Public 465 22.7 1584 77.3 209 2258 74 3.2 2332
2 Bilambil Public 311 28.8 770 71.2 194 1275 56 4.2 1331
3 Bogangar Public 434 33.9 848 66.1 282 1564 57 3.5 1621
4 Burringbar Public 167 38.0 273 62.0 107 547 16 2.8 563
5 Centaur Public 780 26.0 2219 74.0 264 3263 167 4.9 3430
6 Condong Public 192 27.6 503 72.4 54 749 20 2.6 769
7 Crabbes Crk Public 68 38.0 111 62.0 35 214 10 4.5 224
8 Cudgen Public 223 31.1 493 68.9 86 802 30 3.6 832
9 Dungay Public 40 34.8 75 65.2 22 137 2 1.4 139
10 Kingscliff TAFE 229 28.6 571 71.4 150 950 18 1.9 968
11 Murwillumbah Civic Cntr 62 29.2 150 70.8 52 264 8 2.9 272
12 Nth Star Holiday Resort 131 28.6 327 71.4 56 514 16 3.0 530
13 Piggabeen Hall 89 22.8 302 77.2 37 428 12 2.7 440
14 Pottsville Beach Public 572 28.4 1442 71.6 277 2291 88 3.7 2379
15 Seagulls Club 430 32.8 882 67.2 133 1445 46 3.1 1491
16 St Anthonys Kingscliff 486 27.7 1270 72.3 229 1985 69 3.4 2054
17 St Josephs Cllg Banora Pt 410 25.2 1214 74.8 99 1723 70 3.9 1793
18 Sydney Town Hall 6 40.0 9 60.0 0 15 1 6.2 16
19 Terranora Public 258 21.9 921 78.1 96 1275 35 2.7 1310
20 Tumbulgum Public 107 32.3 224 67.7 44 375 12 3.1 387
21 Tweed Civic Cntr 396 28.4 997 71.6 137 1530 58 3.7 1588
22 Tweed Heads PCYC 645 32.7 1329 67.3 248 2222 96 4.1 2318
23 Tweed River High 754 34.8 1412 65.2 244 2410 126 5.0 2536
24 Tweed Super Sports 358 32.1 756 67.9 119 1233 56 4.3 1289
Ordinary Votes 7613 29.0 18682 71.0 3174 29469 1143 3.7 30612
Absent 482 30.6 1092 69.4 255 1829 54 2.9 1883
Declared Institution 79 31.0 176 69.0 22 277 2 0.7 279
Enrolment New 46 32.2 97 67.8 24 167 1 0.6 168
Postal/iVote 507 24.3 1583 75.7 129 2219 36 1.6 2255
Pre-poll 1673 26.3 4691 73.7 491 6855 154 2.2 7009
Provisional/Silent 32 32.0 68 68.0 19 119 5 4.0 124
Declaration Votes 2819 26.8 7707 73.2 940 11466 252 2.2 11718
Grand Total 10432 28.3 26389 71.7 4114 40935 1395 3.3 42330
TWEEDRoll : 48888 (Turnout 86.6%)
Byrnes Provest
(ALP) (NAT) Informal
105

2011 New South Wales Election
POLLING PLACES Total
Exhst Formal Vote
Votes % Votes % %
1 Aberdeen Public 232 29.4 558 70.6 163 953 39 3.9 992
2 Bandon Grove Arts Hall 18 15.5 98 84.5 26 142 2 1.4 144
3 Barrington Public 43 16.5 217 83.5 33 293 5 1.7 298
4 Blackville Public 10 15.9 53 84.1 10 73 1 1.4 74
5 Bowman Park Comm. Cntr 186 31.6 403 68.4 82 671 21 3.0 692
6 Broke Public 59 28.4 149 71.6 87 295 5 1.7 300
7 Bunnan Hall 24 30.0 56 70.0 8 88 0 0.0 88
8 Bylong Hall 12 15.4 66 84.6 25 103 4 3.7 107
9 Caroona Hall 29 23.4 95 76.6 42 166 3 1.8 169
10 Cassilis Hall 24 19.7 98 80.3 16 138 5 3.5 143
11 Clarence Town Public 300 38.2 485 61.8 236 1021 52 4.8 1073
12 Denman Hall 207 27.7 541 72.3 142 890 37 4.0 927
13 Dungog Public 323 25.4 948 74.6 260 1531 55 3.5 1586
14 Elderslie Hall 63 36.8 108 63.2 29 200 3 1.5 203
15 Glen William Public 35 21.7 126 78.3 36 197 2 1.0 199
16 Glendon Arts Hall 44 19.3 184 80.7 25 253 9 3.4 262
17 Glendon Brook Hall 16 15.8 85 84.2 30 131 2 1.5 133
18 Gloucester High 57 17.7 265 82.3 60 382 15 3.8 397
19 Gloucester Snr Ctzns Cntr 163 19.6 669 80.4 158 990 26 2.6 1016
20 Gresford Arts Hall 96 21.5 350 78.5 66 512 14 2.7 526
21 Gundy Hall 31 22.0 110 78.0 23 164 3 1.8 167
22 Jerrys Plains Public 42 27.6 110 72.4 48 200 4 2.0 204
23 Martindale Public 23 19.2 97 80.8 18 138 3 2.1 141
24 Martins Crk Public 58 30.4 133 69.6 56 247 7 2.8 254
25 Merriwa Arts Hall 169 23.6 548 76.4 155 872 25 2.8 897
26 Milbrodale Public 52 26.1 147 73.9 57 256 3 1.2 259
27 Moonan Flat Hall 15 11.1 120 88.9 19 154 5 3.1 159
28 Mt Pleasant Public 28 20.1 111 79.9 20 159 2 1.2 161
29 Murrurundi CWA 107 18.3 479 81.7 131 717 25 3.4 742
30 Muswellbrook Indoor Sport Cntr348 30.2 804 69.8 189 1341 56 4.0 1397
31 Muswellbrook PCYC 157 30.5 357 69.5 105 619 24 3.7 643
32 Paterson Public 104 34.8 195 65.2 69 368 11 2.9 379
33 Quirindi High 293 19.2 1231 80.8 275 1799 32 1.7 1831
34 Sandy Hollow Public 55 28.2 140 71.8 54 249 6 2.4 255
35 Scone High 155 20.9 585 79.1 127 867 27 3.0 894
36 Scone Public 243 19.8 985 80.2 247 1475 44 2.9 1519
37 Scone Snr Ctzns Cntr 172 24.1 541 75.9 122 835 23 2.7 858
38 Singleton Anglican 127 27.1 341 72.9 54 522 11 2.1 533
39 Singleton Hghts Public 823 34.9 1533 65.1 459 2815 141 4.8 2956
40 Singleton High 497 32.7 1021 67.3 289 1807 76 4.0 1883
41 Singleton Public 263 27.6 689 72.4 138 1090 26 2.3 1116
42 Spring Ridge Public 13 9.2 128 90.8 44 185 2 1.1 187
43 Stan Theiss Mem. Cntr 277 32.6 573 67.4 144 994 24 2.4 1018
44 Stratford Public 36 21.8 129 78.2 24 189 7 3.6 196
45 Stroud Public 103 26.1 292 73.9 89 484 13 2.6 497
46 Stroud Rd Public 28 22.4 97 77.6 30 155 4 2.5 159
47 Sydney Town Hall 1 11.1 8 88.9 0 9 1 10.0 10
48 Ulan Public 44 33.3 88 66.7 11 143 3 2.1 146
49 Vacy Public 94 27.1 253 72.9 72 419 11 2.6 430
50 Wallabadah Public 40 17.5 188 82.5 30 258 6 2.3 264
51 Wallarobba Hall 23 17.7 107 82.3 21 151 3 1.9 154
52 Wards River Hall 25 30.9 56 69.1 22 103 2 1.9 105
53 Willow Tree Hall 54 18.2 243 81.8 65 362 10 2.7 372
54 Wingen Arts Hall 22 16.5 111 83.5 31 164 5 3.0 169
55 Wollar Public 26 35.6 47 64.4 12 85 4 4.5 89
56 Wollombi Public 60 37.5 100 62.5 67 227 7 3.0 234
Ordinary Votes 6549 26.4 18251 73.6 4851 29651 956 3.1 30607
Absent 1086 30.9 2423 69.1 762 4271 97 2.2 4368
Declared Institution 51 30.0 119 70.0 10 180 4 2.2 184
Enrolment New 102 38.3 164 61.7 62 328 11 3.2 339
Postal/iVote 447 20.8 1698 79.2 263 2408 21 0.9 2429
Pre-poll 1825 26.8 4989 73.2 1133 7947 185 2.3 8132
Provisional/Silent 27 25.5 79 74.5 36 142 2 1.4 144
Declaration Votes 3538 27.2 9472 72.8 2266 15276 320 2.1 15596
Grand Total 10087 26.7 27723 73.3 7117 44927 1276 2.8 46203
UPPER HUNTER (2-Party Preferred)Roll : 49334 (Turnout 93.7%)
Gibbons Souris
(ALP) (NAT) Informal
106

2011 New South Wales Election
POLLING PLACES Total
Exhst Formal Vote
Votes % Votes % %
1 Bondi Beach Public 904 35.9 1612 64.1 592 3108 124 3.8 3232
2 Bondi Presbyterian 193 38.8 305 61.2 104 602 8 1.3 610
3 Bondi Public 414 30.0 964 70.0 302 1680 64 3.7 1744
4 Bondi SLSC 156 34.3 299 65.7 95 550 17 3.0 567
5 Cooper Park Comm. Hall 108 9.9 986 90.1 64 1158 26 2.2 1184
6 Double Bay Public 383 15.4 2112 84.6 237 2732 52 1.9 2784
7 Reddam House 150 24.0 474 76.0 99 723 32 4.2 755
8 Rose Bay Public 377 18.7 1641 81.3 185 2203 72 3.2 2275
9 Rose Bay Secondary Cllg 209 11.2 1651 88.8 100 1960 72 3.5 2032
10 St Andrews Rose Bay 127 10.3 1103 89.7 87 1317 30 2.2 1347
11 St Annes Nth Bondi 402 30.0 937 70.0 185 1524 65 4.1 1589
12 St Columba Woollahra 189 16.8 938 83.2 155 1282 27 2.1 1309
13 St Francis of Assisi School 30 22.1 106 77.9 24 160 5 3.0 165
14 St Josephs Edgecliff 76 16.5 386 83.5 47 509 16 3.0 525
15 St Marks Darling Pt 174 11.5 1340 88.5 152 1666 34 2.0 1700
16 St Michaels Vaucluse 64 7.5 795 92.5 36 895 21 2.3 916
17 St Stephen's Bellevue Hill 373 17.1 1810 82.9 279 2462 61 2.4 2523
18 Sydney Town Hall 30 30.6 68 69.4 21 119 3 2.5 122
19 The Gunyah 117 14.4 697 85.6 106 920 26 2.7 946
20 Vaucluse Bowling Club 220 14.1 1339 85.9 136 1695 42 2.4 1737
21 Waverley College 34 23.4 111 76.6 25 170 3 1.7 173
22 Waverley Comm. Cntr 95 30.5 216 69.5 29 340 10 2.9 350
Ordinary Votes 4825 19.5 19890 80.5 3060 27775 810 2.8 28585
Absent 1224 25.4 3604 74.6 838 5666 130 2.2 5796
Declared Institution 8 20.5 31 79.5 2 41 0 0.0 41
Enrolment New 22 28.9 54 71.1 14 90 4 4.3 94
Postal/iVote 598 14.7 3462 85.3 236 4296 83 1.9 4379
Pre-poll 465 9.8 4258 90.2 277 5000 99 1.9 5099
Provisional/Silent 73 21.6 265 78.4 54 392 8 2.0 400
Declaration Votes 2390 17.0 11674 83.0 1421 15485 324 2.0 15809
Grand Total 7215 18.6 31564 81.4 4481 43260 1134 2.6 44394
VAUCLUSE (2-Party Preferred)Roll : 50561 (Turnout 87.8%)
Neill Upton
(ALP) (LIB) Informal
107

2011 New South Wales Election
POLLING PLACES Total
Exhst Formal Vote
Votes % Votes % %
1 Adelong Comm. Health Cntr 132 22.1 466 77.9 132 730 19 2.5 749
2 Ashmont Public 350 28.3 885 71.7 351 1586 72 4.3 1658
3 Batlow School 215 31.9 460 68.1 122 797 22 2.7 819
4 Blessed Eucharist Church 45 23.2 149 76.8 57 251 4 1.6 255
5 Brungle Hall 27 30.3 62 69.7 12 101 1 1.0 102
6 Collingullie Public 17 9.8 157 90.2 36 210 3 1.4 213
7 Currawarna Comm. Cntr 15 14.2 91 85.8 16 122 1 0.8 123
8 Forest Hill Public 213 24.8 645 75.2 251 1109 41 3.6 1150
9 Galore Hall 2 4.3 45 95.7 1 48 0 0.0 48
10 Glenfield Park Scout Hall 395 20.5 1534 79.5 463 2392 55 2.2 2447
11 Humula Public 7 8.8 73 91.2 3 83 0 0.0 83
12 Joyce Hall 33 15.9 175 84.1 46 254 4 1.6 258
13 Kooringal Public 418 21.9 1493 78.1 498 2409 74 3.0 2483
14 Ladysmith Public 21 9.6 198 90.4 37 256 0 0.0 256
15 Lake Albert Public 342 18.2 1539 81.8 499 2380 57 2.3 2437
16 Lockhart Central 98 17.3 467 82.7 69 634 11 1.7 645
17 Mangoplah Public 15 8.2 167 91.8 23 205 2 1.0 207
18 Mt Austin Public 428 26.8 1170 73.2 443 2041 61 2.9 2102
19 Nth Wagga Public 245 19.6 1002 80.4 318 1565 35 2.2 1600
20 Pleasant Hills Public 5 4.3 111 95.7 7 123 2 1.6 125
21 St Lukes Wagga Wagga 338 24.1 1065 75.9 426 1829 34 1.8 1863
22 Sturt Public 315 22.0 1119 78.0 410 1844 49 2.6 1893
23 Sydney Town Hall 6 37.5 10 62.5 1 17 0 0.0 17
24 Talbingo Public 36 30.3 83 69.7 21 140 1 0.7 141
25 Tarcutta Hall 24 9.1 239 90.9 27 290 8 2.7 298
26 The Rock Hall 109 19.7 444 80.3 100 653 17 2.5 670
27 Tolland Public 243 28.7 603 71.3 146 992 22 2.2 1014
28 Tumut High 394 33.5 781 66.5 156 1331 46 3.3 1377
29 Tumut Public 394 26.5 1095 73.5 230 1719 61 3.4 1780
30 Turvey Park Public 360 25.3 1065 74.7 442 1867 48 2.5 1915
31 Uranquinty Public 65 17.5 306 82.5 85 456 13 2.8 469
32 Wagga Lutheran Primary 150 13.2 983 86.8 356 1489 15 1.0 1504
33 Wagga Wagga Salvo Hall 177 23.3 584 76.7 222 983 28 2.8 1011
34 Wagga Wagga Hospital 49 31.4 107 68.6 87 243 4 1.6 247
35 Wagga Wagga Wesley 314 25.4 920 74.6 383 1617 35 2.1 1652
36 Yerong Crk Public 30 17.2 144 82.8 20 194 3 1.5 197
Ordinary Votes 6027 22.8 20437 77.2 6496 32960 848 2.5 33808
Absent 534 24.2 1676 75.8 352 2562 48 1.8 2610
Declared Institution 69 35.4 126 64.6 39 234 8 3.3 242
Enrolment New 66 28.2 168 71.8 54 288 3 1.0 291
Postal/iVote 288 16.7 1436 83.3 237 1961 10 0.5 1971
Pre-poll 1172 19.9 4724 80.1 1560 7456 110 1.5 7566
Provisional/Silent 16 20.8 61 79.2 21 98 1 1.0 99
Declaration Votes 2145 20.8 8191 79.2 2263 12599 180 1.4 12779
Grand Total 8172 22.2 28628 77.8 8759 45559 1028 2.2 46587
WAGGA WAGGA (2-Party Preferred)Roll : 50492 (Turnout 92.3%)
Elliott-Rudder Maguire
(ALP) (LIB) Informal
108

2011 New South Wales Election
POLLING PLACES Total
Exhst Formal Vote
Votes % Votes % %
1 Allambie Hghts Comm Cntr 524 20.1 2079 79.9 254 2857 90 3.1 2947
2 Beacon Hill Hall 495 18.3 2211 81.7 290 2996 105 3.4 3101
3 Brookvale Public 303 23.7 978 76.3 172 1453 64 4.2 1517
4 Collaroy Masonic Hall 255 18.3 1136 81.7 172 1563 55 3.4 1618
5 Collaroy Plateau Public 375 16.5 1904 83.5 204 2483 49 1.9 2532
6 Cromer High 197 20.9 747 79.1 74 1018 29 2.8 1047
7 Cromer Public 437 18.1 1978 81.9 168 2583 91 3.4 2674
8 Dee Why Public 616 25.5 1803 74.5 319 2738 167 5.7 2905
9 Dee Why SLSC 88 19.5 363 80.5 75 526 14 2.6 540
10 Forestville Public 333 18.0 1521 82.0 181 2035 78 3.7 2113
11 Frenchs Forest Kindy 147 15.1 829 84.9 85 1061 24 2.2 1085
12 Frenchs Forest Public 156 16.8 772 83.2 69 997 22 2.2 1019
13 Killarney Hghts Public 249 16.5 1264 83.5 124 1637 43 2.6 1680
14 Narrabeen Lakes Public 69 22.1 243 77.9 43 355 18 4.8 373
15 Narraweena Public 645 21.7 2322 78.3 295 3262 142 4.2 3404
16 OLGC School 90 15.5 491 84.5 49 630 8 1.3 638
17 St Johns Dee Why 172 22.5 592 77.5 129 893 36 3.9 929
18 St Kevins Dee Why 355 32.7 732 67.3 155 1242 70 5.3 1312
19 Sydney Town Hall 6 18.2 27 81.8 10 43 1 2.3 44
20 The Beach School 148 21.1 554 78.9 60 762 16 2.1 778
21 The Forest High 187 12.9 1258 87.1 147 1592 47 2.9 1639
22 Wakehurst Public 77 17.5 364 82.5 52 493 11 2.2 504
23 Wheeler Hghts Public 347 18.7 1512 81.3 197 2056 75 3.5 2131
Ordinary Votes 6271 19.6 25680 80.4 3324 35275 1255 3.4 36530
Absent 914 21.3 3372 78.7 587 4873 124 2.5 4997
Declared Institution 23 19.7 94 80.3 14 131 3 2.2 134
Enrolment New 63 23.5 205 76.5 47 315 4 1.3 319
Postal/iVote 428 15.9 2256 84.1 180 2864 39 1.3 2903
Pre-poll 296 16.2 1533 83.8 160 1989 40 2.0 2029
Provisional/Silent 26 27.1 70 72.9 9 105 1 0.9 106
Declaration Votes 1750 18.9 7530 81.1 997 10277 211 2.0 10488
Grand Total 8021 19.5 33210 80.5 4321 45552 1466 3.1 47018
WAKEHURST (2-Party Preferred)Roll : 50629 (Turnout 92.9%)
Beattie Hazzard
(ALP) (LIB) Informal
109

2011 New South Wales Election
POLLING PLACES Total
Exhst Formal Vote
Votes % Votes % %
1 All Saints New Lambton 309 44.5 385 55.5 104 798 22 2.7 820
2 Argenton Comm. Hall 439 69.7 191 30.3 157 787 41 5.0 828
3 Callaghan Cllg - Jesmond Snr 557 58.0 403 42.0 234 1194 61 4.9 1255
4 Callaghan Cllg - Wallsend 1133 65.3 601 34.7 357 2091 95 4.3 2186
5 Cardiff Hghts Baptist 345 41.6 485 58.4 158 988 38 3.7 1026
6 Cardiff Nth Public 663 58.2 476 41.8 209 1348 60 4.3 1408
7 Elermore Vale Public 1138 55.6 908 44.4 500 2546 103 3.9 2649
8 Glendale E Public 767 60.8 494 39.2 209 1470 65 4.2 1535
9 Glendore Public 676 57.4 501 42.6 271 1448 50 3.3 1498
10 Jesmond Public 410 62.8 243 37.2 128 781 33 4.1 814
11 Maryland Public 1296 64.5 714 35.5 663 2673 115 4.1 2788
12 New Lambton Hghts Infants 240 40.3 355 59.7 104 699 13 1.8 712
13 New Lambton Public 793 45.5 949 54.5 367 2109 70 3.2 2179
14 New Lambton Sth Public 257 52.3 234 47.7 95 586 28 4.6 614
15 New Lambton Uniting -Grinsell St354 48.4 378 51.6 151 883 16 1.8 899
16 Plattsburg Public 256 70.5 107 29.5 95 458 9 1.9 467
17 Shortland Public 607 61.1 387 38.9 166 1160 60 4.9 1220
18 Shortland Uniting 555 65.4 293 34.6 130 978 37 3.6 1015
19 Silver Ridge Comm. Hall 252 42.2 345 57.8 118 715 18 2.5 733
20 St John the Baptist Lambton 810 52.5 734 47.5 283 1827 91 4.7 1918
21 St Pauls Birmingham Gardens 359 61.6 224 38.4 126 709 32 4.3 741
22 Sydney Town Hall 8 38.1 13 61.9 4 25 0 0.0 25
23 Wallsend Comm. Pre-School 327 66.3 166 33.7 75 568 33 5.5 601
24 Wallsend Sth Public 1047 48.4 1117 51.6 675 2839 87 3.0 2926
25 Wallsend Uniting 1230 65.4 652 34.6 353 2235 86 3.7 2321
26 Waratah Public 208 55.9 164 44.1 94 466 20 4.1 486
27 Waratah W Public 519 61.7 322 38.3 149 990 54 5.2 1044
Ordinary Votes 15555 56.8 11841 43.2 5975 33371 1337 3.9 34708
Absent 1759 51.6 1651 48.4 944 4354 173 3.8 4527
Declared Institution 135 54.9 111 45.1 31 277 7 2.5 284
Enrolment New 101 57.4 75 42.6 61 237 13 5.2 250
Postal/iVote 1698 59.9 1137 40.1 395 3230 29 0.9 3259
Pre-poll 1024 58.1 738 41.9 332 2094 56 2.6 2150
Provisional/Silent 40 55.6 32 44.4 20 92 5 5.2 97
Declaration Votes 4757 56.0 3744 44.0 1783 10284 283 2.7 10567
Grand Total 20314 56.6 15574 43.4 7767 43655 1620 3.6 45275
WALLSENDRoll : 48093 (Turnout 94.1%)
Hornery Dolan
(ALP) (LIB) Informal
110

2011 New South Wales Election
POLLING PLACES Total
Exhst Formal Vote
Votes % Votes % %
1 Artarmon Public 432 23.2 1432 76.8 170 2034 41 2.0 2075
2 Cammeray Public 414 17.3 1974 82.7 243 2631 77 2.8 2708
3 Castle Cove Public 158 12.5 1106 87.5 93 1357 36 2.6 1393
4 Castlecrag Comm. Cntr 165 14.0 1010 86.0 132 1307 24 1.8 1331
5 Chatswood Guide Hall 102 25.1 304 74.9 59 465 13 2.7 478
6 Chatswood Public 626 28.8 1551 71.2 265 2442 91 3.6 2533
7 Chatswood Sth Uniting 218 21.0 822 79.0 166 1206 43 3.4 1249
8 Chatswood-Willoughby Uniting 185 17.7 858 82.3 83 1126 26 2.3 1152
9 Holy Trinity Chatswood W 119 19.0 507 81.0 67 693 13 1.8 706
10 Lane Cove Civic Cntr 188 27.2 502 72.8 97 787 34 4.1 821
11 Middle Harbour Public 75 14.6 440 85.4 53 568 13 2.2 581
12 Mowbray Public 104 23.2 345 76.8 55 504 16 3.1 520
13 Naremburn Comm. Cntr 110 18.3 492 81.7 51 653 25 3.7 678
14 Naremburn School 362 18.5 1596 81.5 166 2124 68 3.1 2192
15 Neutral Bay Public 86 22.4 298 77.6 45 429 7 1.6 436
16 Northbridge Public 226 11.4 1755 88.6 156 2137 34 1.6 2171
17 Northside Bapt. Pre-School 205 17.6 958 82.4 122 1285 26 2.0 1311
18 Our Lady of Dolours Primary 382 24.5 1179 75.5 135 1696 64 3.6 1760
19 RNS Hospital 28 28.0 72 72.0 12 112 3 2.6 115
20 St Barnabas Roseville 177 14.0 1088 86.0 134 1399 32 2.2 1431
21 St Peters Cremorne 334 18.2 1500 81.8 202 2036 38 1.8 2074
22 Sydney Town Hall 20 26.7 55 73.3 10 85 5 5.6 90
23 Willoughby Park Cntr 429 19.1 1819 80.9 182 2430 52 2.1 2482
24 Willoughby Public 575 19.1 2437 80.9 311 3323 112 3.3 3435
Ordinary Votes 5720 19.2 24100 80.8 3009 32829 893 2.6 33722
Absent 970 21.8 3483 78.2 603 5056 133 2.6 5189
Declared Institution 68 24.6 208 75.4 10 286 3 1.0 289
Enrolment New 36 20.5 140 79.5 43 219 8 3.5 227
Postal/iVote 553 16.6 2786 83.4 217 3556 31 0.9 3587
Pre-poll 356 18.4 1581 81.6 136 2073 35 1.7 2108
Provisional/Silent 20 16.8 99 83.2 11 130 5 3.7 135
Declaration Votes 2003 19.4 8297 80.6 1020 11320 215 1.9 11535
Grand Total 7723 19.2 32397 80.8 4029 44149 1108 2.4 45257
WILLOUGHBY (2-Party Preferred)Roll : 49873 (Turnout 90.7%)
Simpson Berejiklian
(ALP) (LIB) Informal
111

2011 New South Wales Election
POLLING PLACES Total
Exhst Formal Vote
Votes % Votes % %
1 Ambarvale Public 451 40.4 664 59.6 243 1358 126 8.5 1484
2 Appin Hall 258 33.1 521 66.9 153 932 52 5.3 984
3 Bargo Hall 659 38.4 1056 61.6 355 2070 99 4.6 2169
4 Bradbury Public 614 40.0 921 60.0 278 1813 105 5.5 1918
5 Buxton Public 313 49.7 317 50.3 144 774 53 6.4 827
6 Camden Country Uniting 110 21.9 393 78.1 67 570 14 2.4 584
7 Camden Sth Public 68 22.4 235 77.6 58 361 22 5.7 383
8 Campbelltown Hospital 120 38.5 192 61.5 60 372 18 4.6 390
9 Cawdor Public 138 19.3 577 80.7 68 783 20 2.5 803
10 Douglas Park Public 179 30.6 406 69.4 115 700 24 3.3 724
11 Durham Green 73 20.1 290 79.9 55 418 7 1.6 425
12 Glen Alpine Hall 717 27.1 1928 72.9 416 3061 150 4.7 3211
13 Mt Hunter Public 138 23.6 447 76.4 109 694 19 2.7 713
14 Oakdale Public 290 36.7 501 63.3 100 891 34 3.7 925
15 Rosemeadow Public 975 41.5 1373 58.5 457 2805 240 7.9 3045
16 Silverdale Childcare Cntr 136 22.8 460 77.2 128 724 29 3.9 753
17 St Helens Park Public 505 41.1 725 58.9 276 1506 81 5.1 1587
18 Sydney Town Hall 8 42.1 11 57.9 6 25 1 3.8 26
19 Tahmoor Public 789 41.0 1135 59.0 379 2303 140 5.7 2443
20 The Oaks Public 479 33.0 971 67.0 159 1609 57 3.4 1666
21 Theresa Park RFS 68 14.3 408 85.7 75 551 16 2.8 567
22 Thirlmere Public 667 37.1 1133 62.9 318 2118 93 4.2 2211
23 Thomas Acres Public 513 42.5 694 57.5 221 1428 84 5.6 1512
24 Thomas Reddall High 203 45.9 239 54.1 80 522 33 5.9 555
25 Tim Blair Comm. Hall 208 31.5 453 68.5 123 784 32 3.9 816
26 Warragamba Public 395 27.9 1019 72.1 374 1788 84 4.5 1872
27 Wollondilly Hall 749 35.0 1393 65.0 297 2439 91 3.6 2530
28 Woodland Rd Public 510 42.4 692 57.6 238 1440 106 6.9 1546
29 Yanderra Public 112 46.5 129 53.5 52 293 10 3.3 303
Ordinary Votes 10445 35.1 19283 64.9 5404 35132 1840 5.0 36972
Absent 1660 35.2 3054 64.8 888 5602 247 4.2 5849
Declared Institution 23 35.9 41 64.1 0 64 1 1.5 65
Enrolment New 90 36.3 158 63.7 50 298 22 6.9 320
Postal/iVote 837 36.2 1475 63.8 381 2693 21 0.8 2714
Pre-poll 468 37.8 770 62.2 208 1446 46 3.1 1492
Provisional/Silent 36 31.0 80 69.0 15 131 6 4.4 137
Declaration Votes 3114 35.8 5578 64.2 1542 10234 343 3.2 10577
Grand Total 13559 35.3 24861 64.7 6946 45366 2183 4.6 47549
WOLLONDILLYRoll : 50340 (Turnout 94.5%)
Costa Rowell
(ALP) (LIB) Informal
112

2011 New South Wales Election
POLLING PLACES Total
Exhst Formal Vote
Votes % Votes % %
1 Berkeley Comm. Centre 308 48.7 325 51.3 80 713 36 4.8 749
2 Berkeley Public 898 60.0 599 40.0 292 1789 86 4.6 1875
3 Berkeley W Public 818 56.4 632 43.6 238 1688 81 4.6 1769
4 Coniston Public 648 57.5 478 42.5 350 1476 80 5.1 1556
5 Cringila Hall 708 74.8 239 25.2 204 1151 72 5.9 1223
6 Fairy Meadow Public 105 55.3 85 44.7 65 255 12 4.5 267
7 Farmborough Rd Public 1043 49.6 1060 50.4 601 2704 115 4.1 2819
8 Figtree High 139 41.2 198 58.8 117 454 20 4.2 474
9 Hayes Park Public 230 36.3 403 63.7 165 798 26 3.2 824
10 Illawarra Snr Cllg 400 51.9 370 48.1 161 931 30 3.1 961
11 Keiraville Public 72 43.9 92 56.1 62 226 11 4.6 237
12 Lake Hghts Public 671 62.5 402 37.5 231 1304 52 3.8 1356
13 Mt Kembla Public 98 24.9 296 75.1 102 496 9 1.8 505
14 Mt St Thomas Public 418 37.1 709 62.9 327 1454 44 2.9 1498
15 Pioneer Hall Wollongong 496 45.8 586 54.2 376 1458 69 4.5 1527
16 Port Kembla Snr Ctzns Cntr 848 70.3 359 29.7 250 1457 74 4.8 1531
17 Primbee Public 419 51.7 392 48.3 193 1004 45 4.3 1049
18 Smiths Hill High 714 38.6 1134 61.4 669 2517 83 3.2 2600
19 St Lukes Dapto 127 36.6 220 63.4 98 445 14 3.1 459
20 St Pius X Unanderra 945 52.2 865 47.8 496 2306 102 4.2 2408
21 St Therese W Wollongong 279 43.0 370 57.0 201 850 33 3.7 883
22 Sydney Town Hall 14 56.0 11 44.0 10 35 3 7.9 38
23 Unanderra Public 541 39.8 818 60.2 437 1796 70 3.8 1866
24 Warrawong Hall 733 71.9 286 28.1 244 1263 70 5.3 1333
25 Warrawong Public 907 76.9 273 23.1 199 1379 102 6.9 1481
26 Windang Snr Ctzns Cntr 540 52.8 483 47.2 274 1297 61 4.5 1358
27 Wollongong Hospital 67 48.6 71 51.4 33 171 7 3.9 178
28 Wollongong Snr Ctzns Cntr 411 43.1 543 56.9 249 1203 38 3.1 1241
29 Wollongong W TAFE 346 52.6 312 47.4 190 848 41 4.6 889
Ordinary Votes 13943 52.5 12611 47.5 6914 33468 1486 4.3 34954
Absent 1485 57.4 1103 42.6 1060 3648 120 3.2 3768
Declared Institution 27 54.0 23 46.0 18 68 0 0.0 68
Enrolment New 60 60.6 39 39.4 50 149 6 3.9 155
Postal/iVote 1204 46.3 1394 53.7 617 3215 26 0.8 3241
Pre-poll 1300 37.4 2172 62.6 886 4358 104 2.3 4462
Provisional/Silent 64 52.0 59 48.0 39 162 10 5.8 172
Declaration Votes 4140 46.4 4790 53.6 2670 11600 266 2.2 11866
Grand Total 18085 50.9 17411 49.1 9572 45068 1752 3.7 46820
WOLLONGONGRoll : 50519 (Turnout 92.7%)
Hay Bradbery
(ALP) (IND) Informal
113

2011 New South Wales Election
POLLING PLACES Total
Exhst Formal Vote
Votes % Votes % %
1 Berkeley Comm. Centre 352 70.7 146 29.3 215 713 36 4.8 749
2 Berkeley Public 965 69.7 420 30.3 404 1789 86 4.6 1875
3 Berkeley W Public 882 70.5 369 29.5 437 1688 81 4.6 1769
4 Coniston Public 680 60.9 436 39.1 360 1476 80 5.1 1556
5 Cringila Hall 729 76.6 223 23.4 199 1151 72 5.9 1223
6 Fairy Meadow Public 104 54.7 86 45.3 65 255 12 4.5 267
7 Farmborough Rd Public 1126 55.9 888 44.1 690 2704 115 4.1 2819
8 Figtree High 156 47.4 173 52.6 125 454 20 4.2 474
9 Hayes Park Public 277 48.7 292 51.3 229 798 26 3.2 824
10 Illawarra Snr Cllg 443 64.3 246 35.7 242 931 30 3.1 961
11 Keiraville Public 84 54.9 69 45.1 73 226 11 4.6 237
12 Lake Hghts Public 702 68.0 331 32.0 271 1304 52 3.8 1356
13 Mt Kembla Public 143 45.3 173 54.7 180 496 9 1.8 505
14 Mt St Thomas Public 506 51.1 484 48.9 464 1454 44 2.9 1498
15 Pioneer Hall Wollongong 546 52.5 494 47.5 418 1458 69 4.5 1527
16 Port Kembla Snr Ctzns Cntr 889 75.7 285 24.3 283 1457 74 4.8 1531
17 Primbee Public 462 61.9 284 38.1 258 1004 45 4.3 1049
18 Smiths Hill High 828 46.6 947 53.4 742 2517 83 3.2 2600
19 St Lukes Dapto 149 47.5 165 52.5 131 445 14 3.1 459
20 St Pius X Unanderra 1011 58.1 728 41.9 567 2306 102 4.2 2408
21 St Therese W Wollongong 308 51.0 296 49.0 246 850 33 3.7 883
22 Sydney Town Hall 12 52.2 11 47.8 12 35 3 7.9 38
23 Unanderra Public 611 47.8 666 52.2 519 1796 70 3.8 1866
24 Warrawong Hall 750 73.2 275 26.8 238 1263 70 5.3 1333
25 Warrawong Public 868 75.2 287 24.8 224 1379 102 6.9 1481
26 Windang Snr Ctzns Cntr 580 59.0 403 41.0 314 1297 61 4.5 1358
27 Wollongong Hospital 73 60.8 47 39.2 51 171 7 3.9 178
28 Wollongong Snr Ctzns Cntr 463 56.1 362 43.9 378 1203 38 3.1 1241
29 Wollongong W TAFE 373 58.1 269 41.9 206 848 41 4.6 889
Ordinary Votes 15072 60.5 9855 39.5 8541 33468 1486 4.3 34954
Absent 1561 56.5 1201 43.5 886 3648 120 3.2 3768
Declared Institution 28 53.8 24 46.2 16 68 0 0.0 68
Enrolment New 64 54.7 53 45.3 32 149 6 3.9 155
Postal/iVote 1329 55.6 1063 44.4 823 3215 26 0.8 3241
Pre-poll 1538 51.1 1473 48.9 1347 4358 104 2.3 4462
Provisional/Silent 64 55.7 51 44.3 47 162 10 5.8 172
Declaration Votes 4584 54.3 3865 45.7 3151 11600 266 2.2 11866
Grand Total 19656 58.9 13717 41.1 11695 45068 1752 3.7 46820
(Estimated two-party preferred count)
WOLLONGONG (2-Party Preferred)Roll : 50519 (Turnout 92.7%)
Hay Blicavs
(ALP) (LIB) Informal
114

2011 New South Wales Election
POLLING PLACES Total
Exhst Formal Vote
Votes % Votes % %
1 Berkeley Vale Public 828 45.4 994 54.6 162 1984 121 5.7 2105
2 Blue Haven Public 1232 50.7 1197 49.3 203 2632 133 4.8 2765
3 Charmhaven Hall 440 49.9 441 50.1 74 955 39 3.9 994
4 Chittaway Bay Public 745 45.0 909 55.0 148 1802 102 5.4 1904
5 Chittaway Pt Hall 171 37.0 291 63.0 32 494 18 3.5 512
6 Gorokan High 788 48.7 830 51.3 187 1805 88 4.6 1893
7 Gorokan Pre-School 299 56.3 232 43.7 48 579 20 3.3 599
8 Gorokan Public 1114 51.3 1059 48.7 153 2326 135 5.5 2461
9 Halekulani Hall 116 50.4 114 49.6 21 251 7 2.7 258
10 Kanwal Public 1048 47.4 1162 52.6 206 2416 154 6.0 2570
11 Myrtle Brush Park Hall 391 46.6 448 53.4 51 890 27 2.9 917
12 Norah Head Hall 302 42.8 404 57.2 69 775 28 3.5 803
13 Northlakes Public 964 59.8 649 40.2 233 1846 98 5.0 1944
14 Sydney Town Hall 11 55.0 9 45.0 0 20 0 0.0 20
15 Tacoma Public 228 51.1 218 48.9 49 495 24 4.6 519
16 Toukley Public 850 49.7 861 50.3 178 1889 97 4.9 1986
17 Toukley Snr Ctzns Cntr 431 49.5 439 50.5 52 922 29 3.0 951
18 Tuggerah Comm. Hall 324 38.5 518 61.5 67 909 26 2.8 935
19 Tuggerah Public 164 38.1 266 61.9 48 478 21 4.2 499
20 Tuggerawong Hall 235 48.7 248 51.3 54 537 12 2.2 549
21 Wadalba School 311 40.2 462 59.8 57 830 30 3.5 860
22 Warnervale Public 792 41.0 1141 59.0 170 2103 83 3.8 2186
23 Woongarrah Public 653 37.9 1072 62.1 93 1818 69 3.7 1887
24 Wyong Anglican 273 42.9 364 57.1 38 675 25 3.6 700
25 Wyong Grove Public 530 47.4 589 52.6 82 1201 45 3.6 1246
26 Wyong Public 651 51.3 617 48.7 136 1404 73 4.9 1477
27 Wyongah Hall 412 48.7 434 51.3 75 921 58 5.9 979
Ordinary Votes 14303 47.2 15968 52.8 2686 32957 1562 4.5 34519
Absent 1508 48.8 1581 51.2 390 3479 124 3.4 3603
Declared Institution 102 55.1 83 44.9 6 191 6 3.0 197
Enrolment New 136 50.7 132 49.3 43 311 12 3.7 323
Postal/iVote 1354 45.3 1637 54.7 183 3174 54 1.7 3228
Pre-poll 2128 48.0 2303 52.0 303 4734 85 1.8 4819
Provisional/Silent 81 49.4 83 50.6 21 185 8 4.1 193
Declaration Votes 5309 47.7 5819 52.3 946 12074 289 2.3 12363
Grand Total 19619 47.4 21771 52.6 3641 45031 1851 3.9 46882
WYONGRoll : 50348 (Turnout 93.1%)
Harris Webber
(ALP) (LIB) Informal
115