business valuation report - smartbusinessreports valuation report experian does not represent or...
TRANSCRIPT
Business Valuation Report
Experian does not represent or endorse the accuracy or reliability of any advice, opinion, statement or any other information displayed or distributed through this report or its website. The estimates and data contained herein are made using the information you provide, publicly available information and data, and rules of thumb for different industries. Experian has not audited or attempted to confirm this information for accuracy or completeness. This report should not be used to obtain credit or for any other commercial purposes. This report is the intellectual property of Experian and the information provided herein is provided for your internal use only and may not be copied or redistributed for any reason. Your use of this report and the information provided herein is also subject to the online terms of use and privacy policy of Experian.
Crocker IndustriesSeptember 21, 2015
Experian does not represent or endorse the accuracy or reliability of any advice, opinion, statement or any other information displayed or distributed through this report or its website. The estimates and data contained herein are made using the information you provide, publicly available information and data, and rules of thumb for different industries. Experian has not audited or attempted to confirm this information for accuracy or completeness. This report should not be used to obtain credit or for any other commercial purposes. This report is the intellectual property of Experian and the information provided herein is provided for your internal use only and may not be copied or redistributed for any reason. Your use of this report and the information provided herein is also subject to the Experian terms of use and privacy policy of Experian.
Powered by BizEquity Page 1
Contents
About Your Valuation Report
About Business Valuation
Our Methodology
Your Valuation
Financial Summary
Key Performance Indicator Overview
KPI Details
Value Map
About Business Valuation
Next Steps
2
3
5
6
7
9
12
25
26
27
9/21/15
Experian does not represent or endorse the accuracy or reliability of any advice, opinion, statement or any other information displayed or distributed through this report or its website. The estimates and data contained herein are made using the information you provide, publicly available information and data, and rules of thumb for different industries. Experian has not audited or attempted to confirm this information for accuracy or completeness. This report should not be used to obtain credit or for any other commercial purposes. This report is the intellectual property of Experian and the information provided herein is provided for your internal use only and may not be copied or redistributed for any reason. Your use of this report and the information provided herein is also subject to the Experian terms of use and privacy policy of Experian.
Powered by BizEquity Page 2
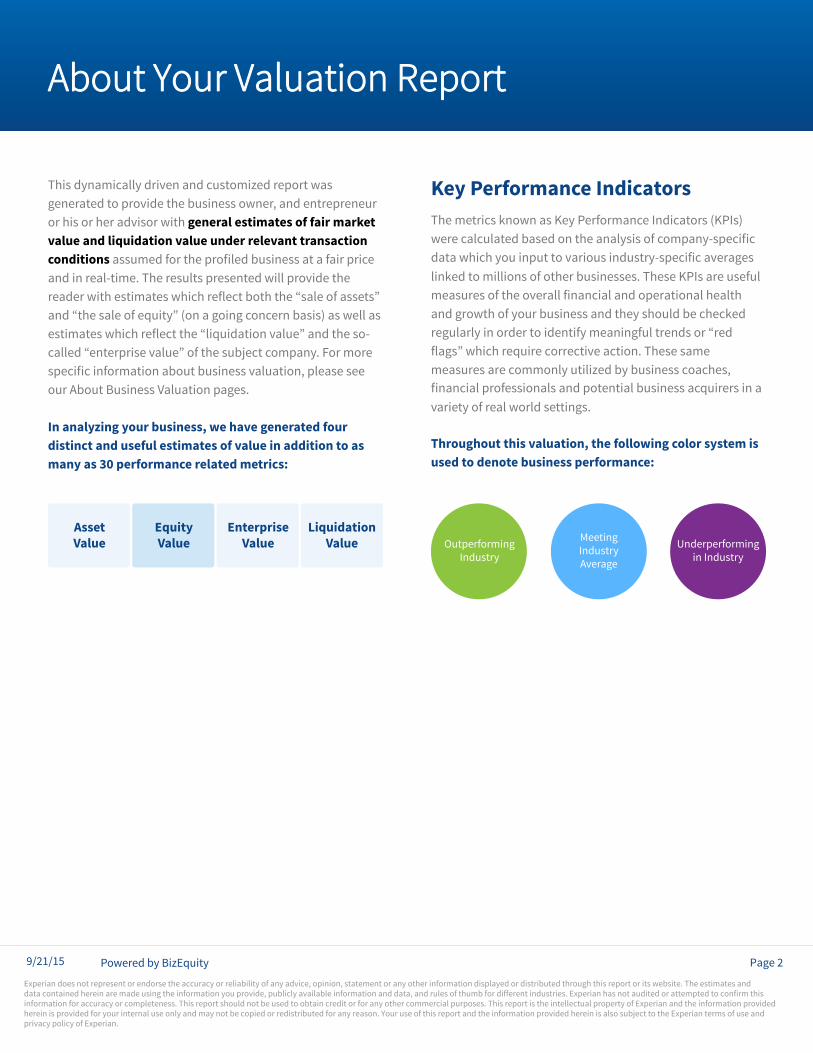
About Your Valuation Report
This dynamically driven and customized report was generated to provide the business owner, and entrepreneur or his or her advisor with general estimates of fair market value and liquidation value under relevant transaction conditions assumed for the profiled business at a fair price and in real-time. The results presented will provide the reader ith estimates hich re ect both the sale of assets and the sale of equity on a going concern basis as ell as estimates hich re ect the liquidation value and the socalled enterprise value of the sub ect company. or more specific information about business valuation, please see our About Business Valuation pages.
In analyzing your business, we have generated four distinct and useful estimates of value in addition to as many as 30 performance related metrics:
Asset Value
Equity Value
Enterprise Value
Liquidation Value Outperforming
Industry
Meeting IndustryAverage
Underperformingin Industry
Key Performance Indicators The metrics no n as ey erformance ndicators s
ere calculated based on the analysis of company specific data hich you input to various industry specific averages linked to millions of other businesses. These s are useful measures of the overall financial and operational health and growth of your business and they should be checked regularly in order to identify meaningful trends or red
ags hich require corrective action. These same measures are commonly utilized by business coaches, financial professionals and potential business acquirers in a variety of real world settings.
Throughout this valuation, the following color system is used to denote business performance:
9/21/15
Experian does not represent or endorse the accuracy or reliability of any advice, opinion, statement or any other information displayed or distributed through this report or its website. The estimates and data contained herein are made using the information you provide, publicly available information and data, and rules of thumb for different industries. Experian has not audited or attempted to confirm this information for accuracy or completeness. This report should not be used to obtain credit or for any other commercial purposes. This report is the intellectual property of Experian and the information provided herein is provided for your internal use only and may not be copied or redistributed for any reason. Your use of this report and the information provided herein is also subject to the Experian terms of use and privacy policy of Experian.
Powered by BizEquity Page 3
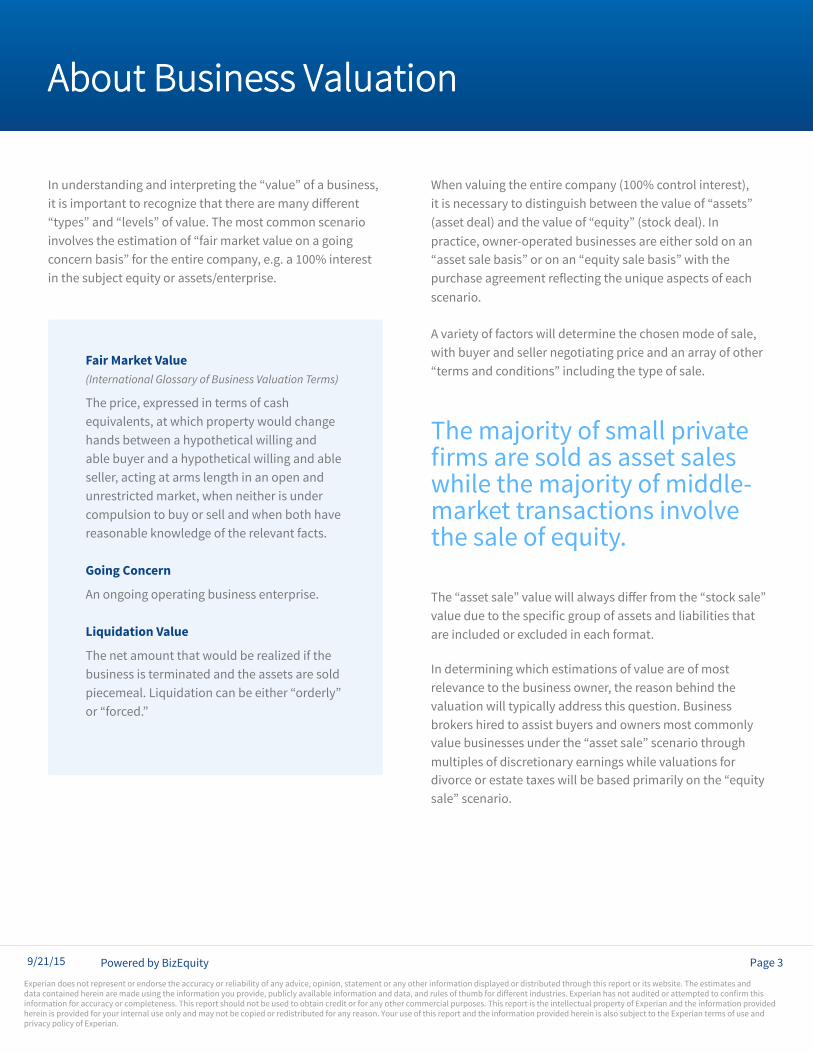
About Business Valuation
hen valuing the entire company control interest , it is necessary to distinguish bet een the value of assets asset deal and the value of equity stoc deal . n
practice, owner-operated businesses are either sold on an asset sale basis or on an equity sale basis ith the
purchase agreement re ecting the unique aspects of each scenario.
A variety of factors will determine the chosen mode of sale, with buyer and seller negotiating price and an array of other
terms and conditions including the type of sale.
The majority of small private firms are sold as asset sales while the majority of middle-market transactions involve the sale of equity.
The asset sale value ill al ays differ from the stoc sale value due to the specific group of assets and liabilities that are included or excluded in each format.
In determining which estimations of value are of most relevance to the business owner, the reason behind the valuation will typically address this question. Business brokers hired to assist buyers and owners most commonly value businesses under the asset sale scenario through multiples of discretionary earnings while valuations for divorce or estate ta es ill be based primarily on the equity sale scenario.
n understanding and interpreting the value of a business,it is important to recognize that there are many different
types and levels of value. The most common scenario involves the estimation of fair mar et value on a going concern basis for the entire company, e.g. a interest in the subject equity or assets/enterprise.
Fair Market Value (International Glossary of Business Valuation Terms)
The price, expressed in terms of cash equivalents, at which property would change hands between a hypothetical willing and able buyer and a hypothetical willing and able seller, acting at arms length in an open and unrestricted market, when neither is under compulsion to buy or sell and when both have reasonable knowledge of the relevant facts.
Going Concern
An ongoing operating business enterprise.
Liquidation Value
The net amount that would be realized if the business is terminated and the assets are sold piecemeal. iquidation can be either orderly or forced.
9/21/15
Experian does not represent or endorse the accuracy or reliability of any advice, opinion, statement or any other information displayed or distributed through this report or its website. The estimates and data contained herein are made using the information you provide, publicly available information and data, and rules of thumb for different industries. Experian has not audited or attempted to confirm this information for accuracy or completeness. This report should not be used to obtain credit or for any other commercial purposes. This report is the intellectual property of Experian and the information provided herein is provided for your internal use only and may not be copied or redistributed for any reason. Your use of this report and the information provided herein is also subject to the Experian terms of use and privacy policy of Experian.
Powered by BizEquity Page 4
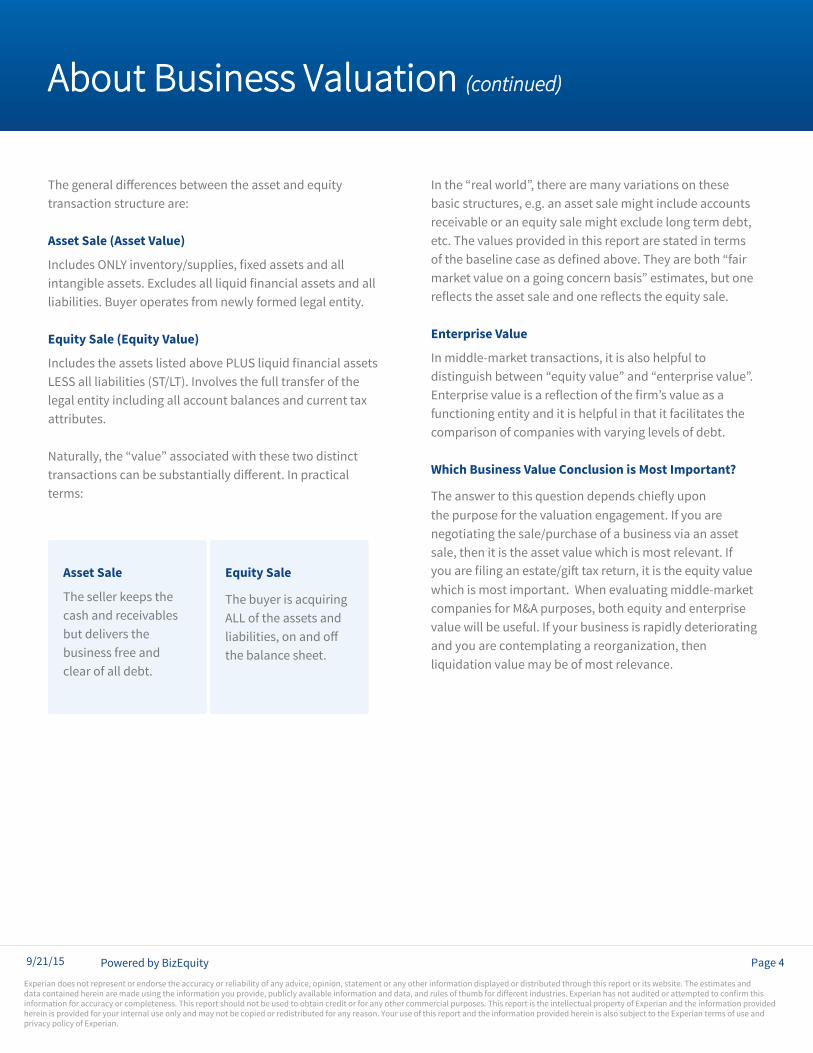
About Business Valuation (continued)
The general differences bet een the asset and equity transaction structure are:
Asset Sale (Asset Value)
ncludes inventory supplies, fi ed assets and all intangible assets. E cludes all liquid financial assets and all liabilities. Buyer operates from newly formed legal entity.
Equity Sale (Equity Value)
ncludes the assets listed above liquid financial assets E all liabilities T T . nvolves the full transfer of the
legal entity including all account balances and current tax attributes.
aturally, the value associated ith these t o distinct transactions can be substantially different. n practical terms:
The seller keeps the cash and receivables but delivers the business free and clear of all debt.
Asset Sale
The buyer is acquiring ALL of the assets and liabilities, on and off the balance sheet.
Equity Sale
n the real orld , there are many variations on these basic structures, e.g. an asset sale might include accounts receivable or an equity sale might exclude long term debt, etc. The values provided in this report are stated in terms of the baseline case as defined above. They are both fair mar et value on a going concern basis estimates, but one re ects the asset sale and one re ects the equity sale.
Enterprise Value
In middle-market transactions, it is also helpful to distinguish bet een equity value and enterprise value . Enterprise value is a re ection of the firm s value as a functioning entity and it is helpful in that it facilitates the comparison of companies with varying levels of debt.
Which Business Value Conclusion is Most Important?
The ans er to this question depends chie y upon the purpose for the valuation engagement. If you are negotiating the sale/purchase of a business via an asset sale, then it is the asset value which is most relevant. If you are filing an estate gi ta return, it is the equity value which is most important. When evaluating middle-market companies for M&A purposes, both equity and enterprise value will be useful. If your business is rapidly deteriorating and you are contemplating a reorganization, then liquidation value may be of most relevance.
9/21/15
Experian does not represent or endorse the accuracy or reliability of any advice, opinion, statement or any other information displayed or distributed through this report or its website. The estimates and data contained herein are made using the information you provide, publicly available information and data, and rules of thumb for different industries. Experian has not audited or attempted to confirm this information for accuracy or completeness. This report should not be used to obtain credit or for any other commercial purposes. This report is the intellectual property of Experian and the information provided herein is provided for your internal use only and may not be copied or redistributed for any reason. Your use of this report and the information provided herein is also subject to the Experian terms of use and privacy policy of Experian.
Powered by BizEquity Page 5
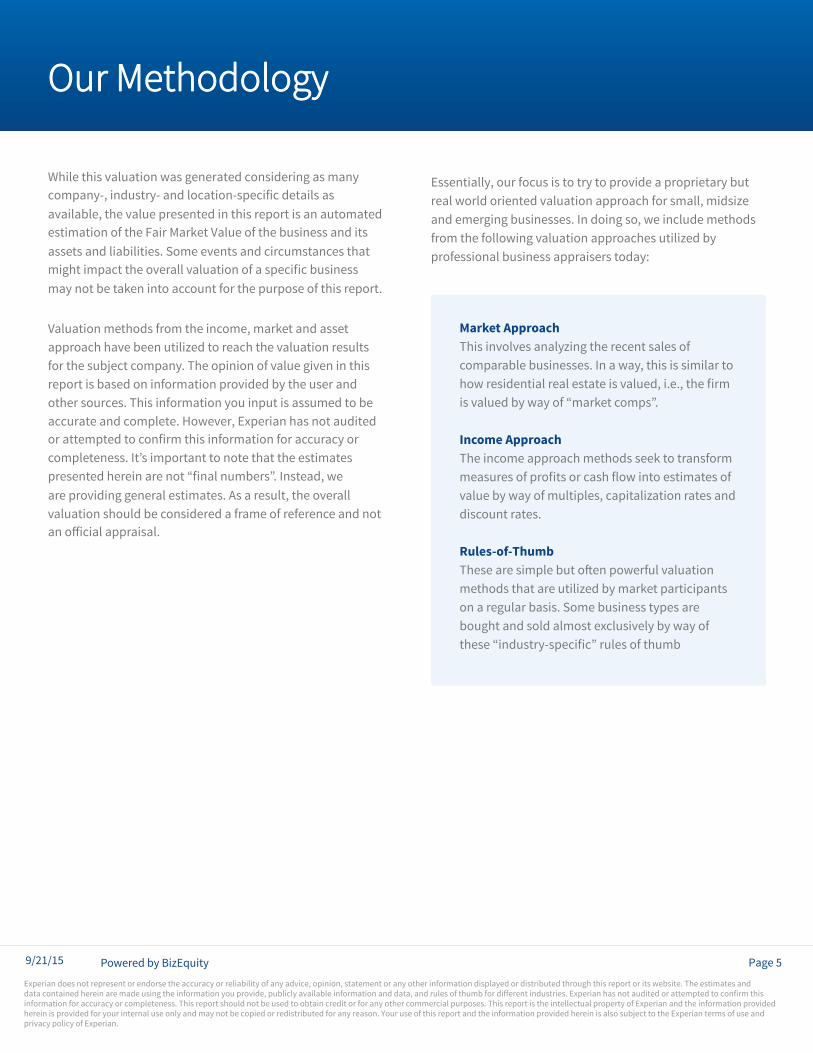
Our Methodology
While this valuation was generated considering as many company , industry and location specific details as available, the value presented in this report is an automated estimation of the air ar et alue of the business and its assets and liabilities. Some events and circumstances that might impact the overall valuation of a specific business may not be taken into account for the purpose of this report.
Valuation methods from the income, market and asset approach have been utilized to reach the valuation results for the subject company. The opinion of value given in this report is based on information provided by the user and other sources. This information you input is assumed to be accurate and complete. However, Experian has not audited or attempted to confirm this information for accuracy or completeness. t s important to note that the estimates presented herein are not final numbers . nstead, e are providing general estimates. As a result, the overall valuation should be considered a frame of reference and not an official appraisal.
Essentially, our focus is to try to provide a proprietary but real world oriented valuation approach for small, midsize and emerging businesses. In doing so, we include methods from the following valuation approaches utilized by professional business appraisers today:
Market ApproachThis involves analyzing the recent sales of comparable businesses. In a way, this is similar to ho residential real estate is valued, i.e., the firm is valued by ay of mar et comps .
Income ApproachThe income approach methods seek to transform measures of profits or cash o into estimates of value by way of multiples, capitalization rates and discount rates.
Rules-of-ThumbThese are simple but o en po erful valuation methods that are utilized by market participants on a regular basis. Some business types are bought and sold almost exclusively by way of these industry specific rules of thumb
9/21/15
Experian does not represent or endorse the accuracy or reliability of any advice, opinion, statement or any other information displayed or distributed through this report or its website. The estimates and data contained herein are made using the information you provide, publicly available information and data, and rules of thumb for different industries. Experian has not audited or attempted to confirm this information for accuracy or completeness. This report should not be used to obtain credit or for any other commercial purposes. This report is the intellectual property of Experian and the information provided herein is provided for your internal use only and may not be copied or redistributed for any reason. Your use of this report and the information provided herein is also subject to the Experian terms of use and privacy policy of Experian.
Powered by BizEquity Page 6
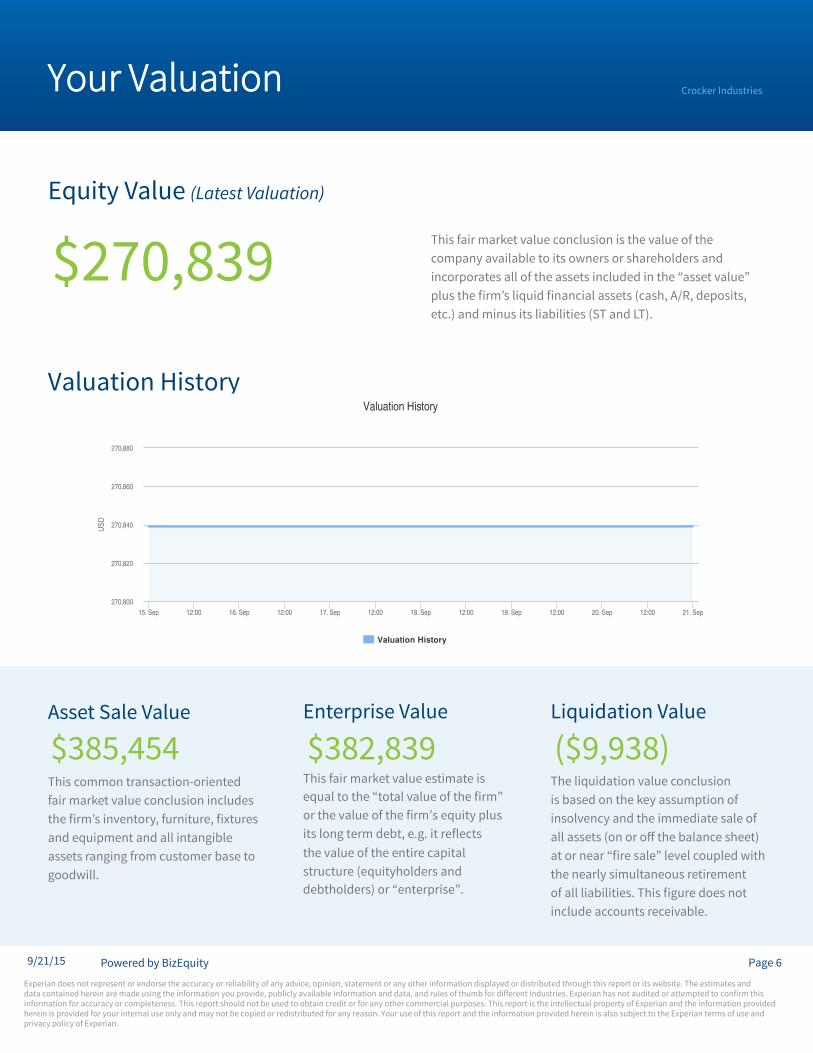
Your Valuation
Equity Value (Latest Valuation)
Valuation History
Asset Sale Value Enterprise Value Liquidation Value
This common transaction-oriented fair market value conclusion includes the firm s inventory, furniture, fi tures and equipment and all intangible assets ranging from customer base to goodwill.
This fair market value estimate is equal to the total value of the firm or the value of the firm s equity plus its long term debt, e.g. it re ects the value of the entire capital structure equityholders and debtholders or enterprise .
The liquidation value conclusion is based on the key assumption of insolvency and the immediate sale of all assets on or off the balance sheet at or near fire sale level coupled ith the nearly simultaneous retirement of all liabilities. This figure does not include accounts receivable.
This fair market value conclusion is the value of the company available to its owners or shareholders and incorporates all of the assets included in the asset value plus the firm s liquid financial assets cash, , deposits, etc. and minus its liabilities T and T .
USD
ValuationHistory
ValuationHistory
15.Sep 12:00 16.Sep 12:00 17.Sep 12:00 18.Sep 12:00 19.Sep 12:00 20.Sep 12:00 21.Sep
270,820
270,840
270,860
270,800
270,880
Crocker Industries
$385,454
9/21/15
$270,839
$382,839 ($9,938)
Experian does not represent or endorse the accuracy or reliability of any advice, opinion, statement or any other information displayed or distributed through this report or its website. The estimates and data contained herein are made using the information you provide, publicly available information and data, and rules of thumb for different industries. Experian has not audited or attempted to confirm this information for accuracy or completeness. This report should not be used to obtain credit or for any other commercial purposes. This report is the intellectual property of Experian and the information provided herein is provided for your internal use only and may not be copied or redistributed for any reason. Your use of this report and the information provided herein is also subject to the Experian terms of use and privacy policy of Experian.
Powered by BizEquity Page 7
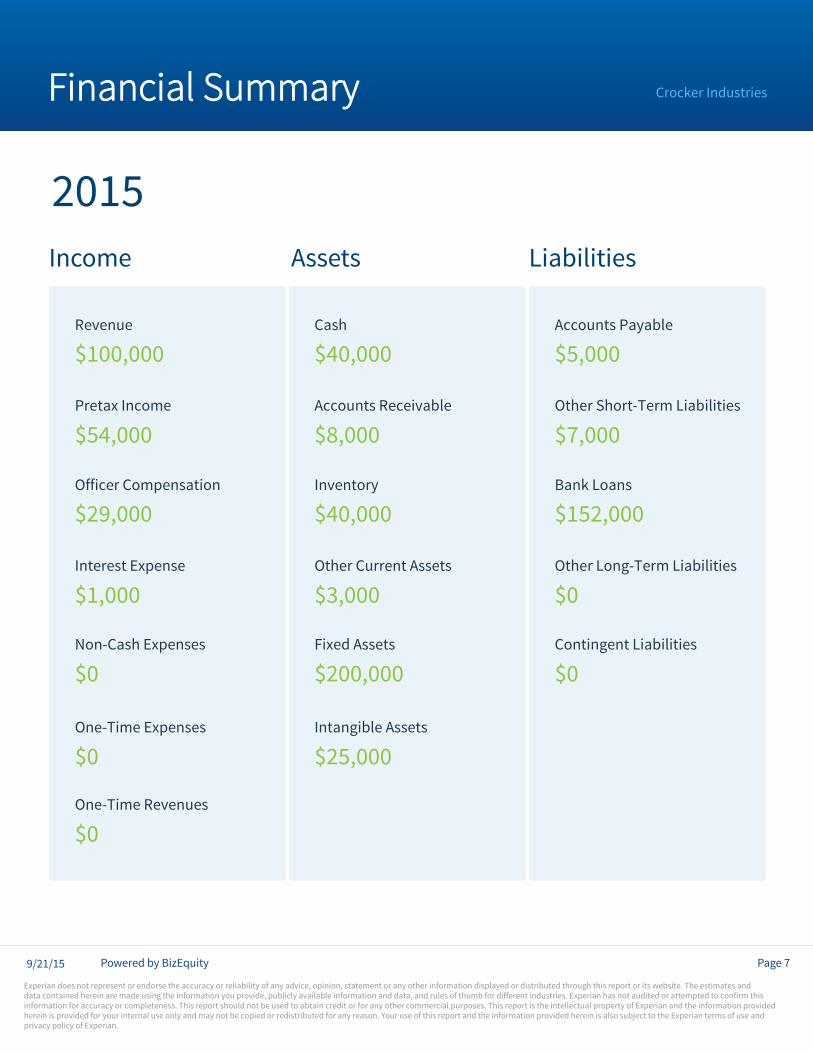
Financial Summary
Income Assets Liabilities
$8,000
One-Time Expenses
Crocker Industries
Bank Loans
Non-Cash Expenses
Other Long-Term Liabilities
Contingent Liabilities
$100,000
$0
$0
9/21/15
Revenue
$5,000
Pretax Income
$1,000
$25,000
$0
Officer Compensation
$40,000
$0
Cash
2015
Interest Expense
$29,000
Intangible Assets
$7,000Accounts Receivable
$54,000Other Short-Term Liabilities
$152,000
Fixed Assets
$200,000
One-Time Revenues
$3,000Other Current Assets
$0
Inventory
Accounts Payable
$40,000
Experian does not represent or endorse the accuracy or reliability of any advice, opinion, statement or any other information displayed or distributed through this report or its website. The estimates and data contained herein are made using the information you provide, publicly available information and data, and rules of thumb for different industries. Experian has not audited or attempted to confirm this information for accuracy or completeness. This report should not be used to obtain credit or for any other commercial purposes. This report is the intellectual property of Experian and the information provided herein is provided for your internal use only and may not be copied or redistributed for any reason. Your use of this report and the information provided herein is also subject to the Experian terms of use and privacy policy of Experian.
Powered by BizEquity Page 8
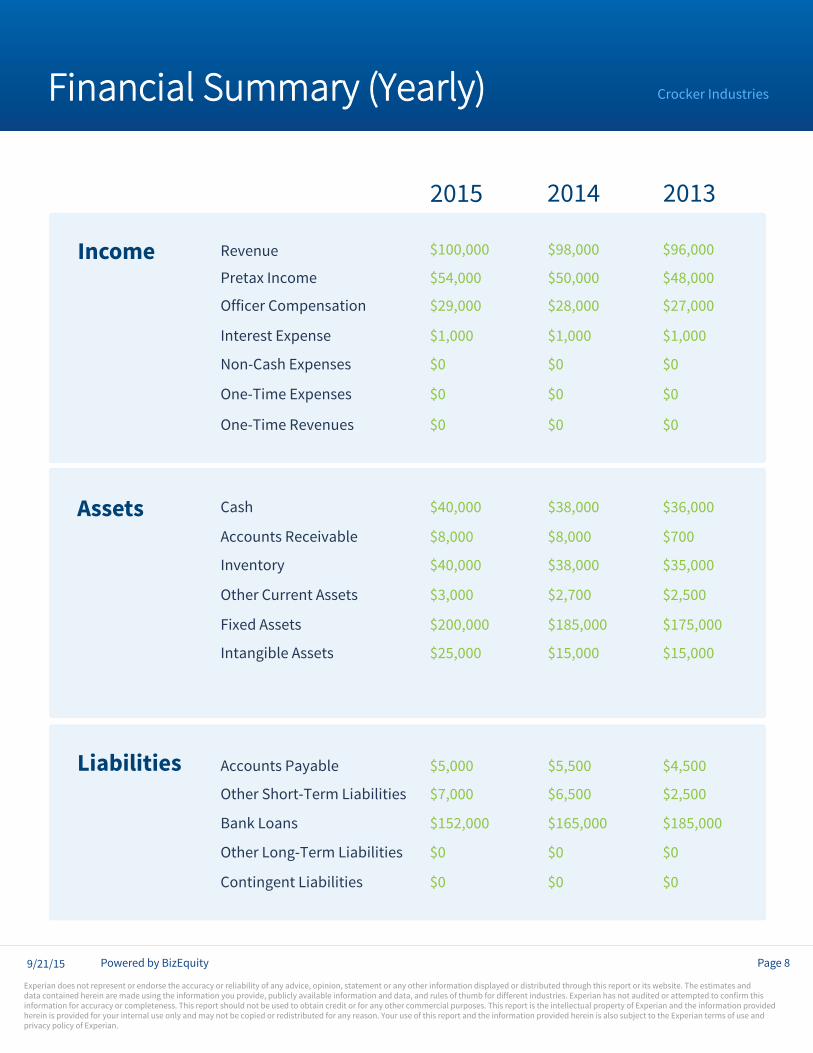
Financial Summary (Yearly)
Income
Assets
Liabilities
$8,000 $700$8,000
One-Time Expenses
Crocker Industries
Bank Loans
Non-Cash Expenses
Other Long-Term Liabilities
Contingent Liabilities
$0 $0
$96,000$100,000
$0
$98,000
$0$0$0
9/21/15
Revenue
$5,500$5,000
$1,000 $1,000
Pretax Income
$1,000
$4,500
$15,000$15,000$25,000
$0 $0 $0
Officer Compensation
$35,000$38,000$40,000
$0$0
Cash
$0
2015 2014 2013
Interest Expense
$27,000$28,000$29,000
Intangible Assets
$7,000 $2,500$6,500
$175,000
Accounts Receivable
$48,000$50,000$54,000
Other Short-Term Liabilities
$185,000$152,000 $165,000
Fixed Assets $185,000$200,000
One-Time Revenues
$3,000 $2,700 $2,500Other Current Assets
$0$0$0
Inventory
Accounts Payable
$36,000$40,000 $38,000
Experian does not represent or endorse the accuracy or reliability of any advice, opinion, statement or any other information displayed or distributed through this report or its website. The estimates and data contained herein are made using the information you provide, publicly available information and data, and rules of thumb for different industries. Experian has not audited or attempted to confirm this information for accuracy or completeness. This report should not be used to obtain credit or for any other commercial purposes. This report is the intellectual property of Experian and the information provided herein is provided for your internal use only and may not be copied or redistributed for any reason. Your use of this report and the information provided herein is also subject to the Experian terms of use and privacy policy of Experian.
Powered by BizEquity Page 9
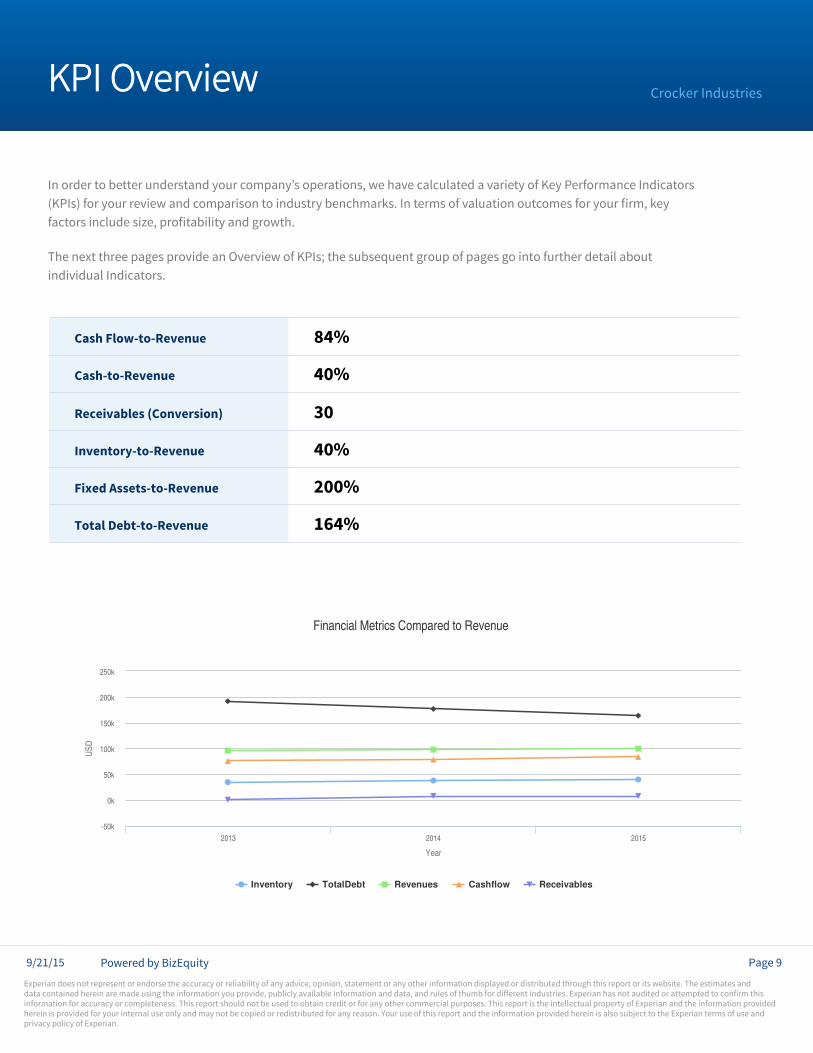
In order to better understand your company’s operations, we have calculated a variety of Key Performance Indicators s for your revie and comparison to industry benchmar s. n terms of valuation outcomes for your firm, ey
factors include size, profitability and gro th.
The next three pages provide an Overview of KPIs; the subsequent group of pages go into further detail about individual Indicators.
KPI Overview
Year
USD
FinancialMetricsComparedtoRevenue
Inventory TotalDebt Revenues Cashflow Receivables
2013 2014 2015-50k
0k
50k
100k
150k
200k
250k
Crocker Industries
Fixed Assets-to-Revenue 200%
9/21/15
Cash Flow-to-Revenue
164%
30
Cash-to-Revenue
40%
Receivables (Conversion)
Inventory-to-Revenue
40%
84%
Total Debt-to-Revenue
Experian does not represent or endorse the accuracy or reliability of any advice, opinion, statement or any other information displayed or distributed through this report or its website. The estimates and data contained herein are made using the information you provide, publicly available information and data, and rules of thumb for different industries. Experian has not audited or attempted to confirm this information for accuracy or completeness. This report should not be used to obtain credit or for any other commercial purposes. This report is the intellectual property of Experian and the information provided herein is provided for your internal use only and may not be copied or redistributed for any reason. Your use of this report and the information provided herein is also subject to the Experian terms of use and privacy policy of Experian.
Powered by BizEquity Page 10
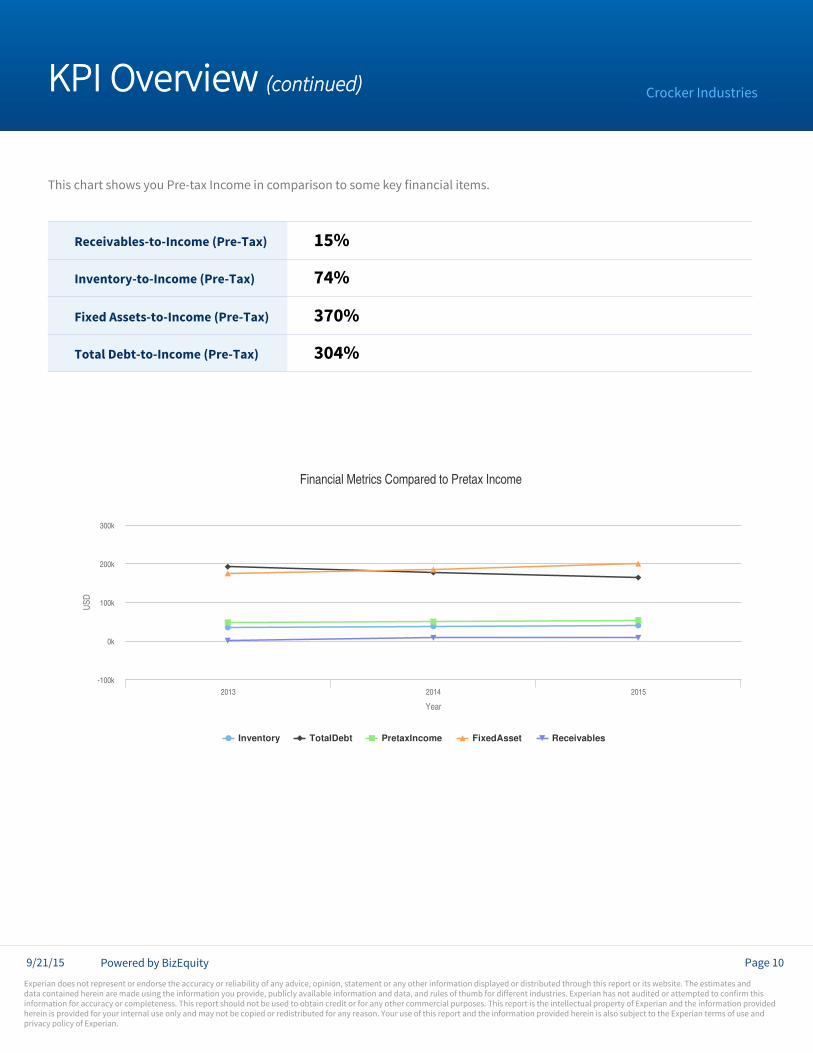
This chart sho s you re ta ncome in comparison to some ey financial items.
KPI Overview (continued)
Year
USD
FinancialMetricsComparedtoPretaxIncome
Inventory TotalDebt PretaxIncome FixedAsset Receivables
2013 2014 2015
0k
100k
200k
-100k
300k
Crocker Industries
15%
9/21/15
Total Debt-to-Income (Pre-Tax)
Inventory-to-Income (Pre-Tax) 74%
Fixed Assets-to-Income (Pre-Tax) 370%
Receivables-to-Income (Pre-Tax)
304%

Experian does not represent or endorse the accuracy or reliability of any advice, opinion, statement or any other information displayed or distributed through this report or its website. The estimates and data contained herein are made using the information you provide, publicly available information and data, and rules of thumb for different industries. Experian has not audited or attempted to confirm this information for accuracy or completeness. This report should not be used to obtain credit or for any other commercial purposes. This report is the intellectual property of Experian and the information provided herein is provided for your internal use only and may not be copied or redistributed for any reason. Your use of this report and the information provided herein is also subject to the Experian terms of use and privacy policy of Experian.
Powered by BizEquity Page 11
With this chart, you can get an indication of the growth trends of the important drivers of the valuation of your business.
Growth Trends of Drivers of Valuation
KPI Overview (continued)
Year
USD
GrowthTrends
Revenue TotalDebt PretaxIncome Receivables
2013 2014 2015-50k
0k
50k
100k
150k
200k
250k
Crocker Industries
9/21/15
Experian does not represent or endorse the accuracy or reliability of any advice, opinion, statement or any other information displayed or distributed through this report or its website. The estimates and data contained herein are made using the information you provide, publicly available information and data, and rules of thumb for different industries. Experian has not audited or attempted to confirm this information for accuracy or completeness. This report should not be used to obtain credit or for any other commercial purposes. This report is the intellectual property of Experian and the information provided herein is provided for your internal use only and may not be copied or redistributed for any reason. Your use of this report and the information provided herein is also subject to the Experian terms of use and privacy policy of Experian.
Powered by BizEquity Page 12
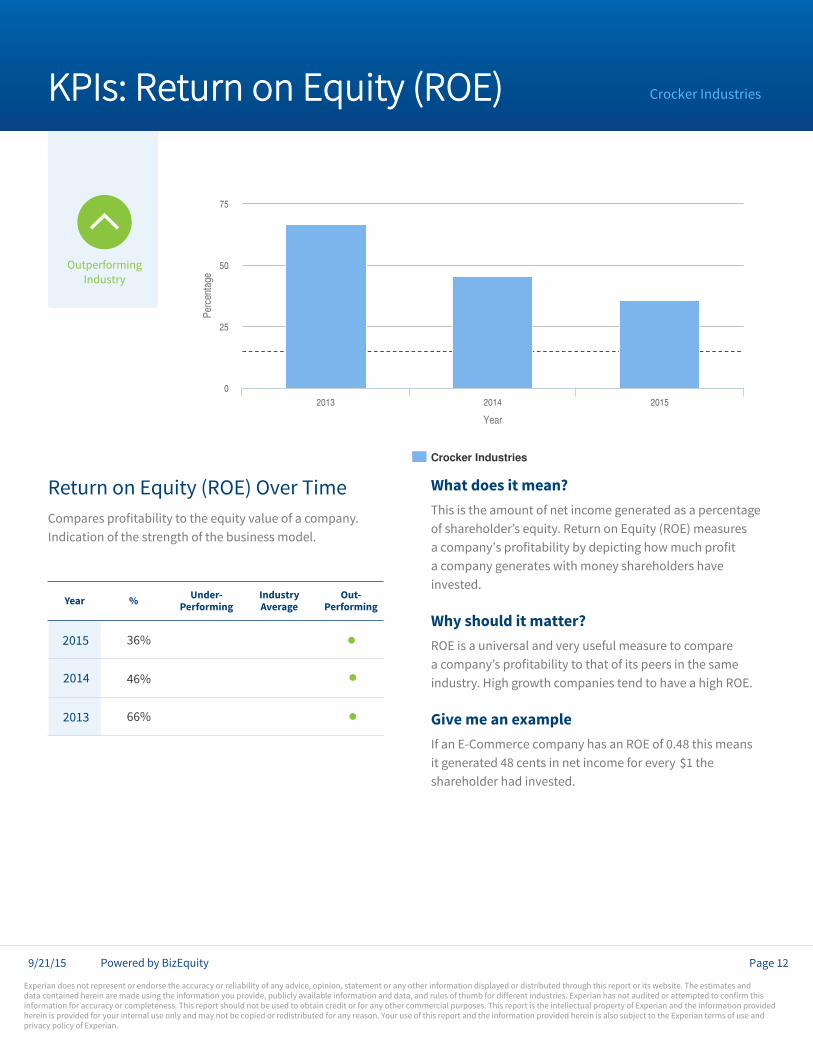
KPIs: Return on Equity (ROE)
Compares profitability to the equity value of a company. Indication of the strength of the business model.
Return on Equity (ROE) Over Time What does it mean? This is the amount of net income generated as a percentage of shareholder’s equity. Return on Equity (ROE) measures a company’s profitability by depicting how much profit a company generates with money shareholders have invested.
Why should it matter?ROE is a universal and very useful measure to compare a company’s profitability to that of its peers in the same industry. High growth companies tend to have a high ROE.
Give me an exampleIf an E-Commerce company has an ROE of 0.48 this means it generated 48 cents in net income for every 1 the shareholder had invested.
Year % Under-Performing
IndustryAverage
Out-Performing
Year
Percentage
CrockerIndustries
2013 2014 20150
25
50
75
●
Crocker Industries
$
9/21/15
●2015
2014
2013
●
66%
46%
36%

Experian does not represent or endorse the accuracy or reliability of any advice, opinion, statement or any other information displayed or distributed through this report or its website. The estimates and data contained herein are made using the information you provide, publicly available information and data, and rules of thumb for different industries. Experian has not audited or attempted to confirm this information for accuracy or completeness. This report should not be used to obtain credit or for any other commercial purposes. This report is the intellectual property of Experian and the information provided herein is provided for your internal use only and may not be copied or redistributed for any reason. Your use of this report and the information provided herein is also subject to the Experian terms of use and privacy policy of Experian.
Powered by BizEquity Page 13
What does it mean? The time period shows the number of days it takes a company to collect its accounts receivables.
Why should it matter?A lower time period indicates that a company relies mainly on cash or is efficient in imparting credit and collecting its debts. On the other hand a higher time period could mean some inefficiency in collecting the account receivables and require a review of the current credit and collections policies of the company. The quicker receivables are collected, the sooner cash is available to meet other business needs (thereby reducing the need to borrow funds).
Give me an exampleIf a lumber wholesaler has a receivables conversion of 24 days, it means it takes 24 days on average to collect its account receivables. f the firm s credit terms are net
days”, this would be considered a positive result.
ncreases over time could signal difficulty in collecting from customers.
Year Days Under-Performing
IndustryAverage
Out-Performing
Year
Ratio
CrockerIndustries
2013 2014 20150
10
20
30
40
KPIs: Receivables (Conversion) Crocker Industries
●
Receivables (Conversion) Over Time
●
9/21/15
30
30
3
2015
2014
2013 ●
Experian does not represent or endorse the accuracy or reliability of any advice, opinion, statement or any other information displayed or distributed through this report or its website. The estimates and data contained herein are made using the information you provide, publicly available information and data, and rules of thumb for different industries. Experian has not audited or attempted to confirm this information for accuracy or completeness. This report should not be used to obtain credit or for any other commercial purposes. This report is the intellectual property of Experian and the information provided herein is provided for your internal use only and may not be copied or redistributed for any reason. Your use of this report and the information provided herein is also subject to the Experian terms of use and privacy policy of Experian.
Powered by BizEquity Page 14
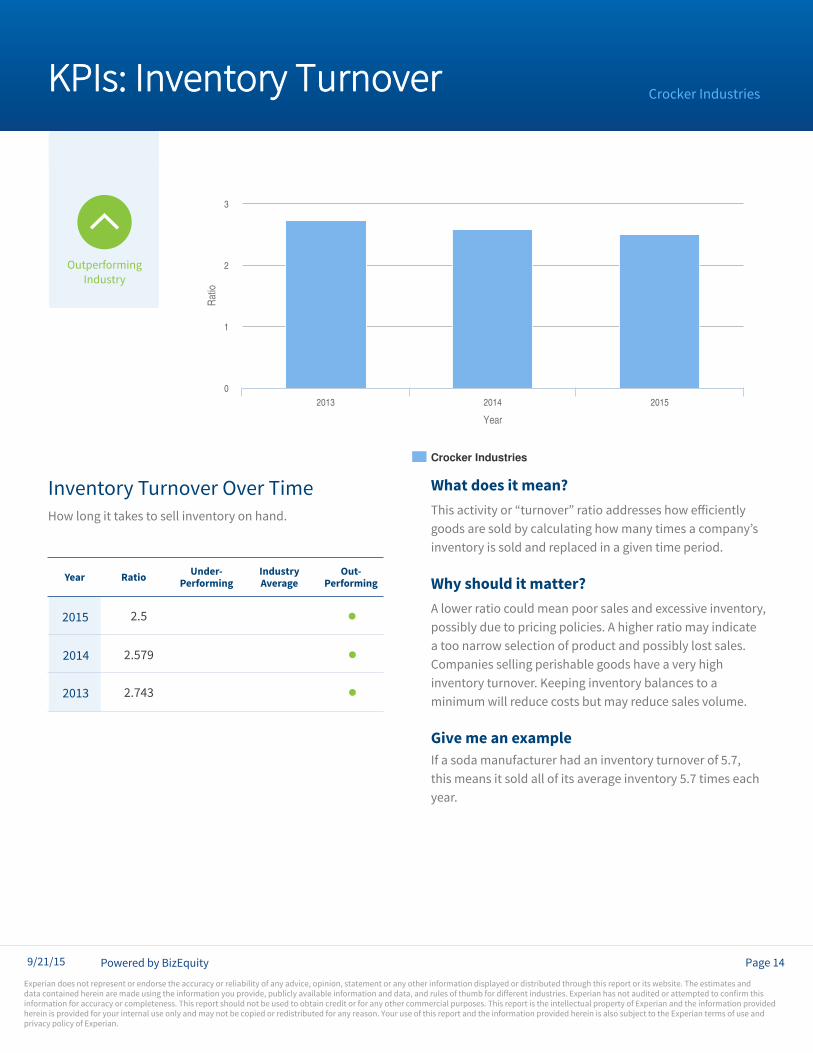
KPIs: Inventory Turnover
What does it mean? This activity or turnover ratio addresses ho efficiently goods are sold by calculating how many times a company’s inventory is sold and replaced in a given time period.
Why should it matter?A lower ratio could mean poor sales and excessive inventory, possibly due to pricing policies. A higher ratio may indicate a too narrow selection of product and possibly lost sales. Companies selling perishable goods have a very high inventory turnover. Keeping inventory balances to a minimum will reduce costs but may reduce sales volume.
Give me an exampleIf a soda manufacturer had an inventory turnover of 5.7, this means it sold all of its average inventory 5.7 times each year.
How long it takes to sell inventory on hand.
Inventory Turnover Over Time
Year Ratio Under-Performing
IndustryAverage
Out-Performing
Year
Ratio
CrockerIndustries
2013 2014 20150
1
2
3
Crocker Industries
●
2.5
2.743
2.579
9/21/15
2015
2014
2013
●
●
Experian does not represent or endorse the accuracy or reliability of any advice, opinion, statement or any other information displayed or distributed through this report or its website. The estimates and data contained herein are made using the information you provide, publicly available information and data, and rules of thumb for different industries. Experian has not audited or attempted to confirm this information for accuracy or completeness. This report should not be used to obtain credit or for any other commercial purposes. This report is the intellectual property of Experian and the information provided herein is provided for your internal use only and may not be copied or redistributed for any reason. Your use of this report and the information provided herein is also subject to the Experian terms of use and privacy policy of Experian.
Powered by BizEquity Page 15
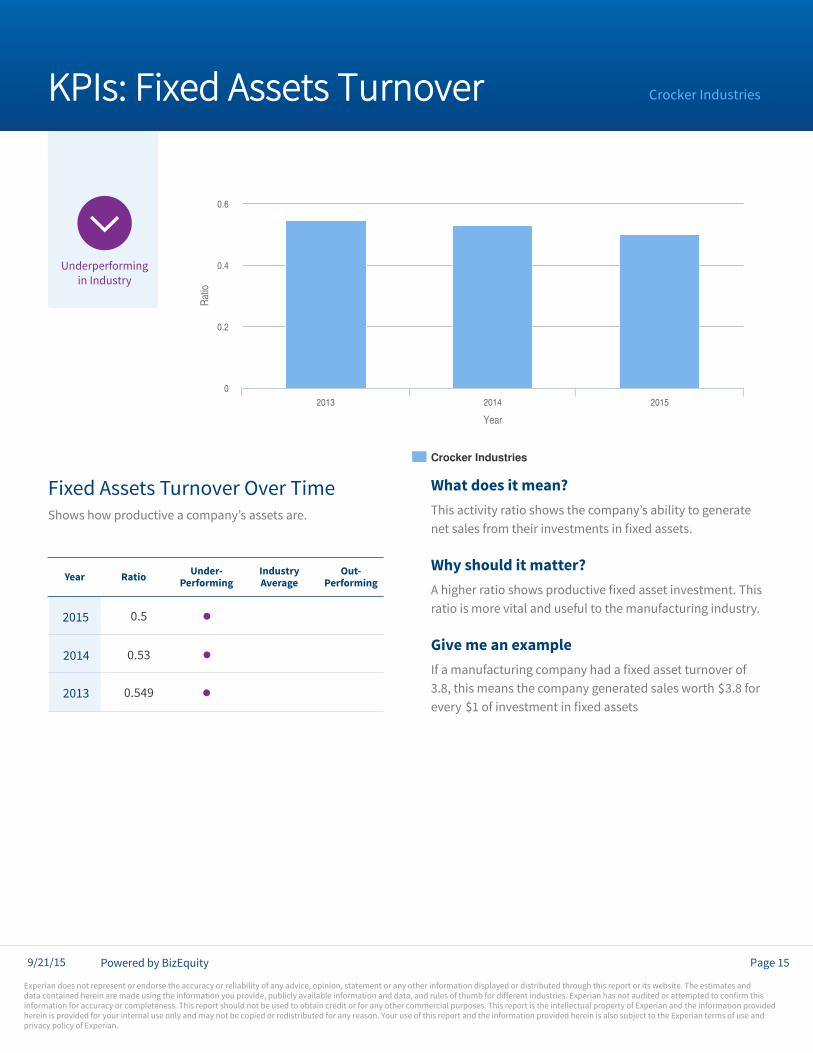
KPIs: Fixed Assets Turnover
What does it mean? This activity ratio shows the company’s ability to generate net sales from their investments in fixed assets.
Why should it matter?A higher ratio shows productive fixed asset investment. This ratio is more vital and useful to the manufacturing industry.
Give me an exampleIf a manufacturing company had a fixed asset turnover of 3.8, this means the company generated sales worth 3.8 for every 1 of investment in fixed assets
Shows how productive a company’s assets are.
Fixed Assets Turnover Over Time
Year Ratio Under-Performing
IndustryAverage
Out-Performing
Year
Ratio
CrockerIndustries
2013 2014 20150
0.2
0.4
0.6
●
Crocker Industries
$$
●
●
9/21/15
0.549
0.5
0.53
2015
2014
2013
Experian does not represent or endorse the accuracy or reliability of any advice, opinion, statement or any other information displayed or distributed through this report or its website. The estimates and data contained herein are made using the information you provide, publicly available information and data, and rules of thumb for different industries. Experian has not audited or attempted to confirm this information for accuracy or completeness. This report should not be used to obtain credit or for any other commercial purposes. This report is the intellectual property of Experian and the information provided herein is provided for your internal use only and may not be copied or redistributed for any reason. Your use of this report and the information provided herein is also subject to the Experian terms of use and privacy policy of Experian.
Powered by BizEquity Page 16
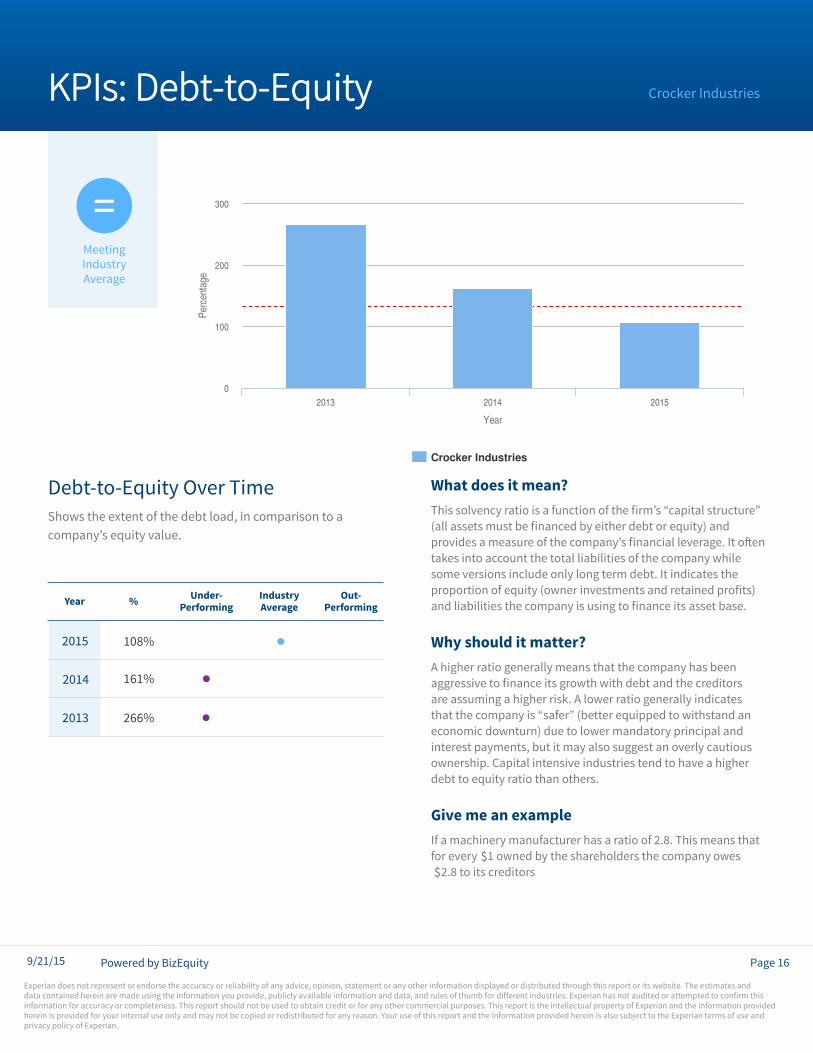
KPIs: Debt-to-Equity
Shows the extent of the debt load, in comparison to a company’s equity value.
Debt-to-Equity Over Time What does it mean? This solvency ratio is a function of the firm’s “capital structure” (all assets must be financed by either debt or equity) and provides a measure of the company’s financial leverage. It often takes into account the total liabilities of the company while some versions include only long term debt. It indicates the proportion of equity (owner investments and retained profits) and liabilities the company is using to finance its asset base.
Why should it matter?A higher ratio generally means that the company has been aggressive to finance its growth with debt and the creditors are assuming a higher risk. A lower ratio generally indicates that the company is “safer” (better equipped to withstand an economic downturn) due to lower mandatory principal and interest payments, but it may also suggest an overly cautious ownership. Capital intensive industries tend to have a higher debt to equity ratio than others.
Give me an exampleIf a machinery manufacturer has a ratio of 2.8. This means that for every 1 owned by the shareholders the company owes 2.8 to its creditors
Year % Under-Performing
IndustryAverage
Out-Performing
Year
Percentage
CrockerIndustries
2013 2014 20150
100
200
300
Crocker Industries
$$
161%
266%
108%
●
9/21/15
●2015
2014 ●
2013
Experian does not represent or endorse the accuracy or reliability of any advice, opinion, statement or any other information displayed or distributed through this report or its website. The estimates and data contained herein are made using the information you provide, publicly available information and data, and rules of thumb for different industries. Experian has not audited or attempted to confirm this information for accuracy or completeness. This report should not be used to obtain credit or for any other commercial purposes. This report is the intellectual property of Experian and the information provided herein is provided for your internal use only and may not be copied or redistributed for any reason. Your use of this report and the information provided herein is also subject to the Experian terms of use and privacy policy of Experian.
Powered by BizEquity Page 17
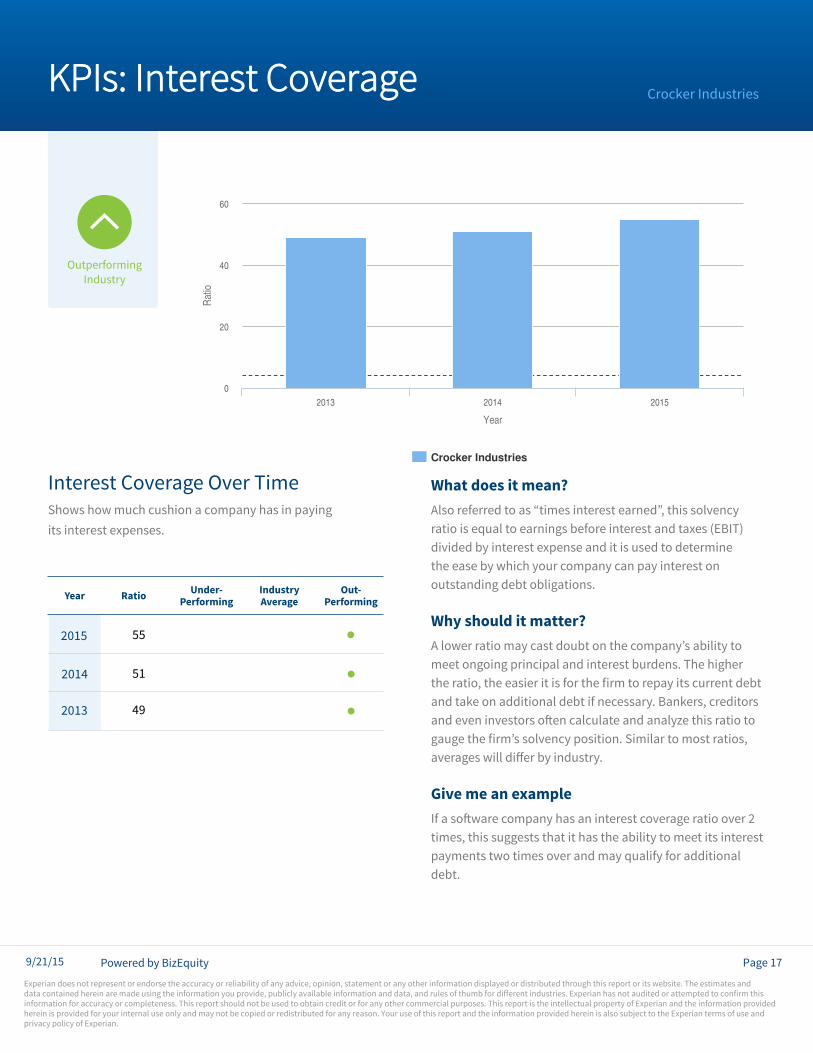
KPIs: Interest Coverage
What does it mean? Also referred to as “times interest earned”, this solvency ratio is equal to earnings before interest and taxes (EBIT) divided by interest expense and it is used to determine the ease by which your company can pay interest on outstanding debt obligations.
Why should it matter?A lower ratio may cast doubt on the company’s ability to meet ongoing principal and interest burdens. The higher the ratio, the easier it is for the firm to repay its current debt and take on additional debt if necessary. Bankers, creditors and even investors o en calculate and analyze this ratio to gauge the firm s solvency position. imilar to most ratios, averages ill differ by industry.
Give me an examplef a so are company has an interest coverage ratio over 2
times, this suggests that it has the ability to meet its interest payments two times over and may qualify for additional debt.
Interest Coverage Over Timeho s ho much cushion a company has in paying
its interest expenses.
Year Ratio Under-Performing
IndustryAverage
Out-Performing
Year
Ratio
CrockerIndustries
2013 2014 20150
20
40
60
Crocker Industries
9/21/15
●
51
55
49
●
2015
2014
2013 ●
Experian does not represent or endorse the accuracy or reliability of any advice, opinion, statement or any other information displayed or distributed through this report or its website. The estimates and data contained herein are made using the information you provide, publicly available information and data, and rules of thumb for different industries. Experian has not audited or attempted to confirm this information for accuracy or completeness. This report should not be used to obtain credit or for any other commercial purposes. This report is the intellectual property of Experian and the information provided herein is provided for your internal use only and may not be copied or redistributed for any reason. Your use of this report and the information provided herein is also subject to the Experian terms of use and privacy policy of Experian.
Powered by BizEquity Page 18
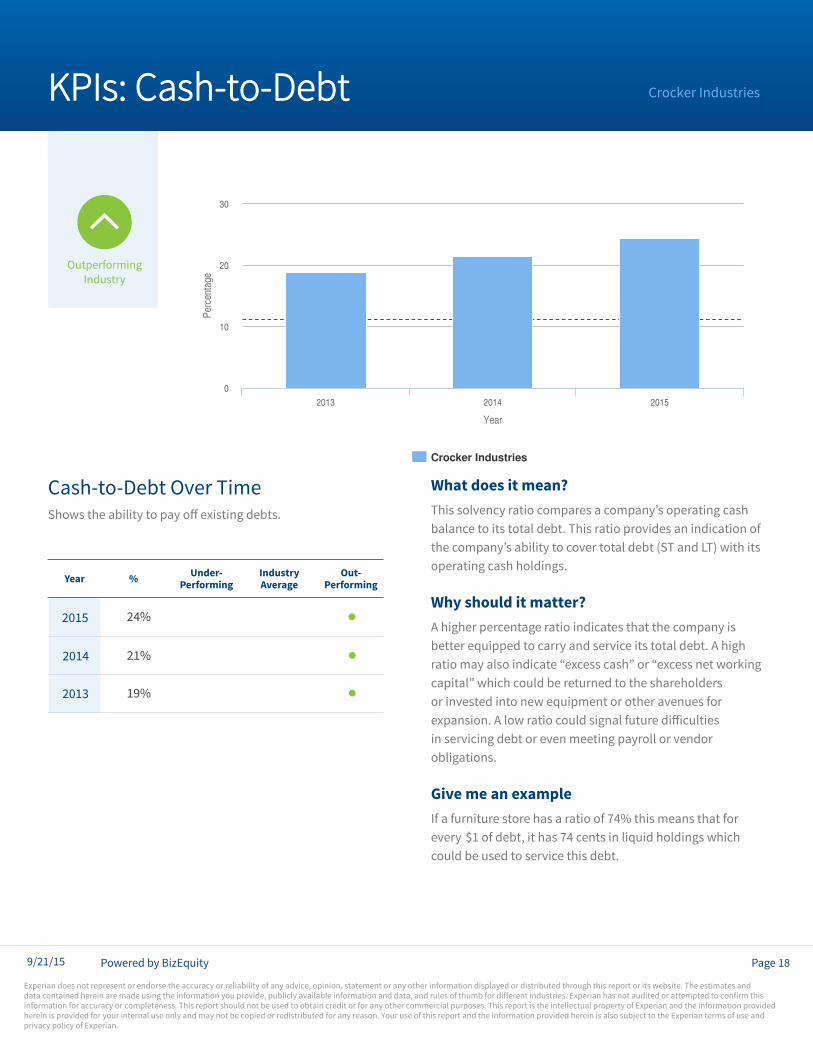
What does it mean? This solvency ratio compares a company’s operating cash balance to its total debt. This ratio provides an indication of the company’s ability to cover total debt (ST and LT) with its operating cash holdings.
Why should it matter?A higher percentage ratio indicates that the company is better equipped to carry and service its total debt. A high ratio may also indicate “excess cash” or “excess net working capital” which could be returned to the shareholders or invested into new equipment or other avenues for expansion. A low ratio could signal future difficulties in servicing debt or even meeting payroll or vendor obligations.
Give me an exampleIf a furniture store has a ratio of 74% this means that for every 1 of debt, it has 74 cents in liquid holdings which could be used to service this debt.
KPIs: Cash-to-Debt
Shows the ability to pay off existing debts.
Cash-to-Debt Over Time
Year % Under-Performing
IndustryAverage
Out-Performing
Year
Percentage
CrockerIndustries
2013 2014 20150
10
20
30
Crocker Industries
$
●
9/21/15
●2015
2014
2013
24%
19%
21%
●
Experian does not represent or endorse the accuracy or reliability of any advice, opinion, statement or any other information displayed or distributed through this report or its website. The estimates and data contained herein are made using the information you provide, publicly available information and data, and rules of thumb for different industries. Experian has not audited or attempted to confirm this information for accuracy or completeness. This report should not be used to obtain credit or for any other commercial purposes. This report is the intellectual property of Experian and the information provided herein is provided for your internal use only and may not be copied or redistributed for any reason. Your use of this report and the information provided herein is also subject to the Experian terms of use and privacy policy of Experian.
Powered by BizEquity Page 19
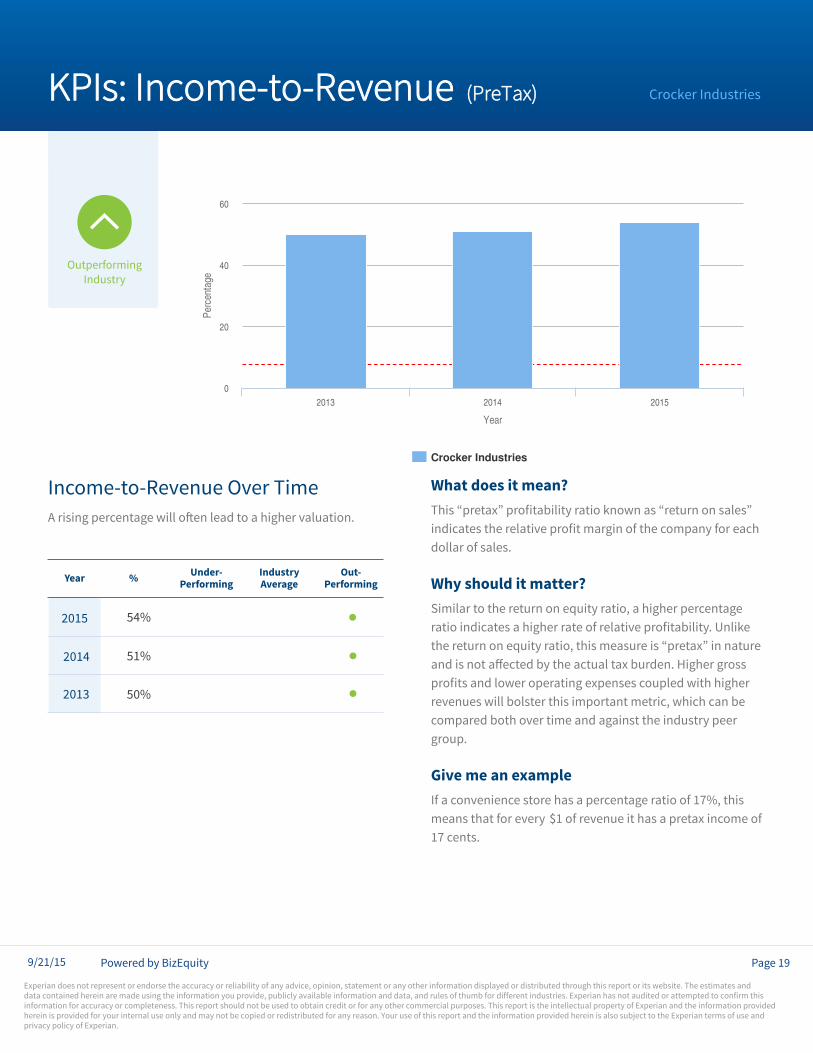
What does it mean? This “pretax” profitability ratio known as “return on sales” indicates the relative profit margin of the company for each dollar of sales.
Why should it matter?Similar to the return on equity ratio, a higher percentage ratio indicates a higher rate of relative profitability. Unlike the return on equity ratio, this measure is “pretax” in nature and is not affected by the actual tax burden. Higher gross profits and lower operating expenses coupled with higher revenues will bolster this important metric, which can be compared both over time and against the industry peer group.
Give me an exampleIf a convenience store has a percentage ratio of 17%, this means that for every 1 of revenue it has a pretax income of 17 cents.
KPIs: Income-to-Revenue (PreTax)
A rising percentage will often lead to a higher valuation.
Income-to-Revenue Over Time
Year % Under-Performing
IndustryAverage
Out-Performing
Year
Percentage
CrockerIndustries
2013 2014 20150
20
40
60
50%
51%
54% ●
Crocker Industries
$
9/21/15
●
2015
2014
2013
●
Experian does not represent or endorse the accuracy or reliability of any advice, opinion, statement or any other information displayed or distributed through this report or its website. The estimates and data contained herein are made using the information you provide, publicly available information and data, and rules of thumb for different industries. Experian has not audited or attempted to confirm this information for accuracy or completeness. This report should not be used to obtain credit or for any other commercial purposes. This report is the intellectual property of Experian and the information provided herein is provided for your internal use only and may not be copied or redistributed for any reason. Your use of this report and the information provided herein is also subject to the Experian terms of use and privacy policy of Experian.
Powered by BizEquity Page 20
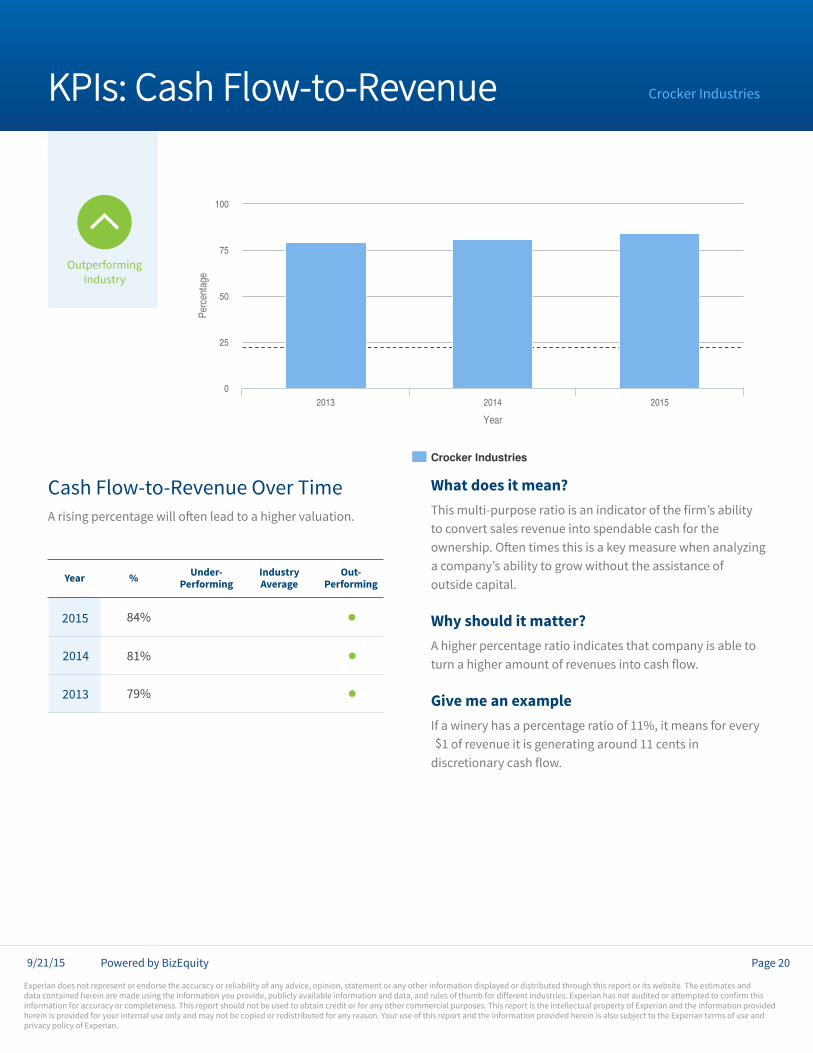
What does it mean? This multi-purpose ratio is an indicator of the firm’s ability to convert sales revenue into spendable cash for the ownership. Often times this is a key measure when analyzing a company’s ability to grow without the assistance of outside capital.
Why should it matter?A higher percentage ratio indicates that company is able to turn a higher amount of revenues into cash flow.
Give me an exampleIf a winery has a percentage ratio of 11%, it means for every 1 of revenue it is generating around 11 cents in discretionary cash flow.
KPIs: Cash Flow-to-Revenue
A rising percentage will often lead to a higher valuation.
Cash Flow-to-Revenue Over Time
Year % Under-Performing
IndustryAverage
Out-Performing
Year
Percentage
CrockerIndustries
2013 2014 20150
100
25
50
75
Crocker Industries
$
9/21/15
●
●
84%
81%
79%
2015
2014
2013
●
Experian does not represent or endorse the accuracy or reliability of any advice, opinion, statement or any other information displayed or distributed through this report or its website. The estimates and data contained herein are made using the information you provide, publicly available information and data, and rules of thumb for different industries. Experian has not audited or attempted to confirm this information for accuracy or completeness. This report should not be used to obtain credit or for any other commercial purposes. This report is the intellectual property of Experian and the information provided herein is provided for your internal use only and may not be copied or redistributed for any reason. Your use of this report and the information provided herein is also subject to the Experian terms of use and privacy policy of Experian.
Powered by BizEquity Page 21
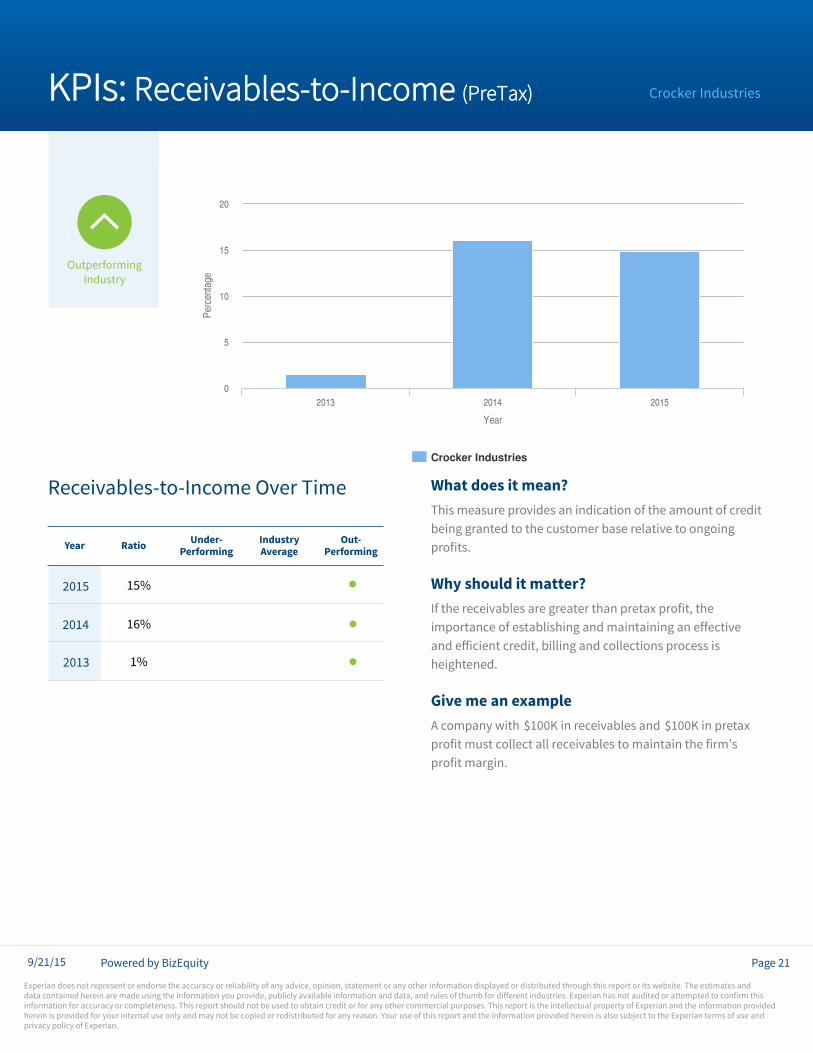
What does it mean? This measure provides an indication of the amount of credit being granted to the customer base relative to ongoing profits.
Why should it matter?If the receivables are greater than pretax profit, the importance of establishing and maintaining an effective and efficient credit, billing and collections process is heightened.
Give me an exampleA company with 100K in receivables and 100K in pretax profit must collect all receivables to maintain the firm’s profit margin.
KPIs: Receivables-to-Income (PreTax)
Receivables-to-Income Over Time
Year Ratio Under-Performing
IndustryAverage
Out-Performing
Year
Percentage
CrockerIndustries
2013 2014 20150
5
10
15
20
Crocker Industries
$ $
●
9/21/15
●
16%
1%
15%2015
2014
2013 ●
Experian does not represent or endorse the accuracy or reliability of any advice, opinion, statement or any other information displayed or distributed through this report or its website. The estimates and data contained herein are made using the information you provide, publicly available information and data, and rules of thumb for different industries. Experian has not audited or attempted to confirm this information for accuracy or completeness. This report should not be used to obtain credit or for any other commercial purposes. This report is the intellectual property of Experian and the information provided herein is provided for your internal use only and may not be copied or redistributed for any reason. Your use of this report and the information provided herein is also subject to the Experian terms of use and privacy policy of Experian.
Powered by BizEquity Page 22
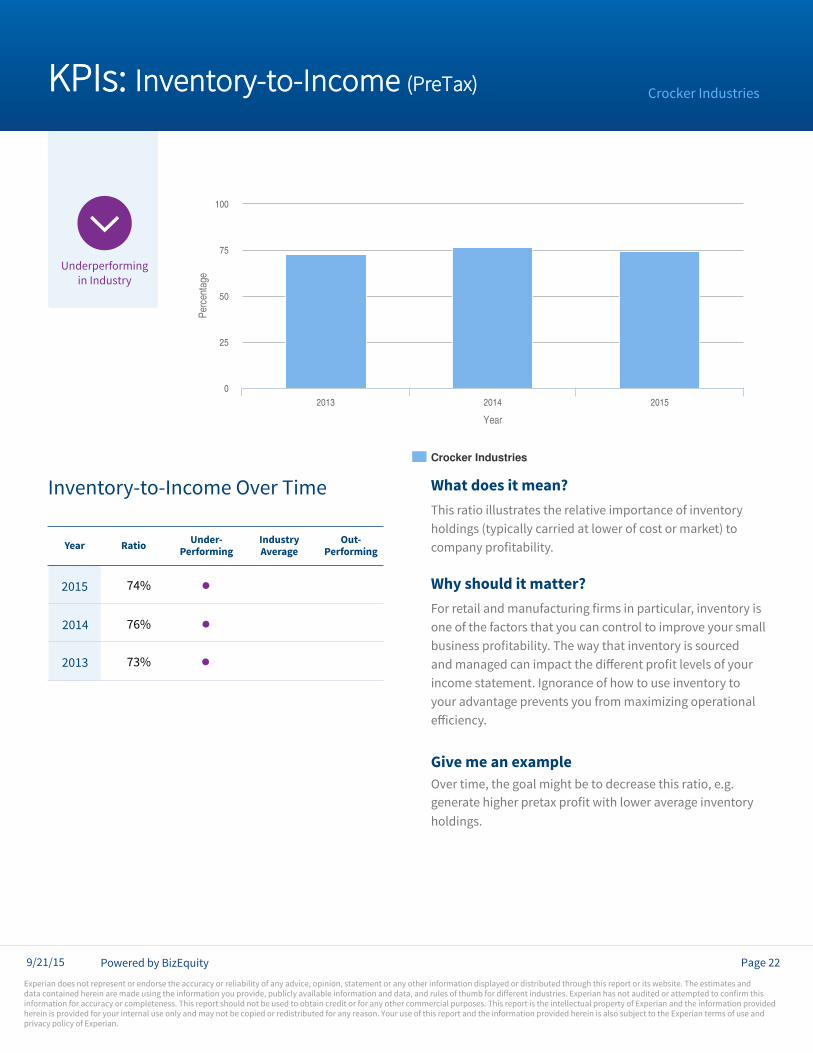
What does it mean? This ratio illustrates the relative importance of inventory holdings (typically carried at lower of cost or market) to company profitability.
Why should it matter?or retail and manufacturing firms in particular, inventory is
one of the factors that you can control to improve your small business profitability. The ay that inventory is sourced and managed can impact the different profit levels of your income statement. Ignorance of how to use inventory to your advantage prevents you from maximizing operational efficiency.
Give me an exampleOver time, the goal might be to decrease this ratio, e.g. generate higher preta profit ith lo er average inventory holdings.
KPIs: Inventory-to-Income (PreTax)
Inventory-to-Income Over Time
Year Ratio Under-Performing
IndustryAverage
Out-Performing
Year
Percentage
CrockerIndustries
2013 2014 20150
25
50
75
100
Crocker Industries
9/21/15
73%
●
74%
76%
2015
2014
2013 ●
●
Experian does not represent or endorse the accuracy or reliability of any advice, opinion, statement or any other information displayed or distributed through this report or its website. The estimates and data contained herein are made using the information you provide, publicly available information and data, and rules of thumb for different industries. Experian has not audited or attempted to confirm this information for accuracy or completeness. This report should not be used to obtain credit or for any other commercial purposes. This report is the intellectual property of Experian and the information provided herein is provided for your internal use only and may not be copied or redistributed for any reason. Your use of this report and the information provided herein is also subject to the Experian terms of use and privacy policy of Experian.
Powered by BizEquity Page 23
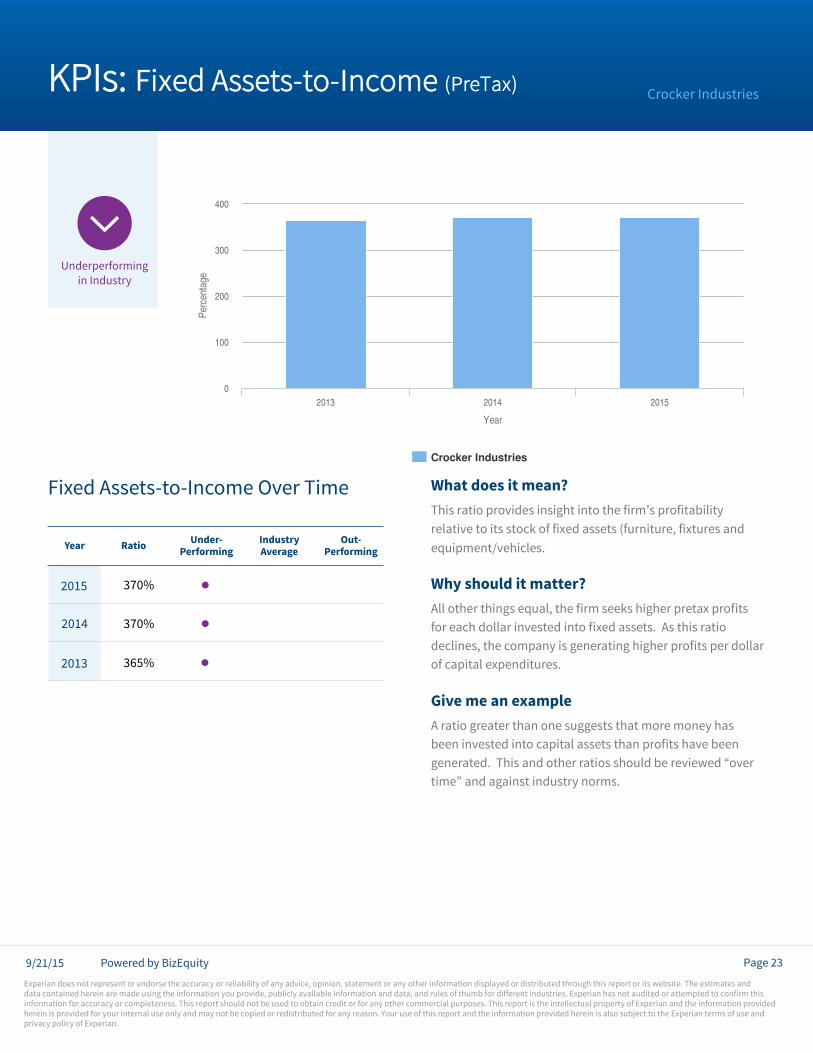
What does it mean? This ratio provides insight into the firm s profitability relative to its stoc of fi ed assets furniture, fi tures and equipment/vehicles.
Why should it matter?ll other things equal, the firm see s higher preta profits
for each dollar invested into fi ed assets. s this ratio declines, the company is generating higher profits per dollar of capital e penditures.
Give me an exampleA ratio greater than one suggests that more money has
been invested into capital assets than profits have been generated. This and other ratios should be reviewed “over
time” and against industry norms.
KPIs: i ed ssets to ncome reTa
i ed ssets to ncome ver Time
Year Ratio Under-Performing
IndustryAverage
Out-Performing
Year
Percentage
CrockerIndustries
2013 2014 20150
100
200
300
400
Crocker Industries
9/21/15
370% ●
365%
370%2015
2014
2013
●
●
Experian does not represent or endorse the accuracy or reliability of any advice, opinion, statement or any other information displayed or distributed through this report or its website. The estimates and data contained herein are made using the information you provide, publicly available information and data, and rules of thumb for different industries. Experian has not audited or attempted to confirm this information for accuracy or completeness. This report should not be used to obtain credit or for any other commercial purposes. This report is the intellectual property of Experian and the information provided herein is provided for your internal use only and may not be copied or redistributed for any reason. Your use of this report and the information provided herein is also subject to the Experian terms of use and privacy policy of Experian.
Powered by BizEquity Page 24
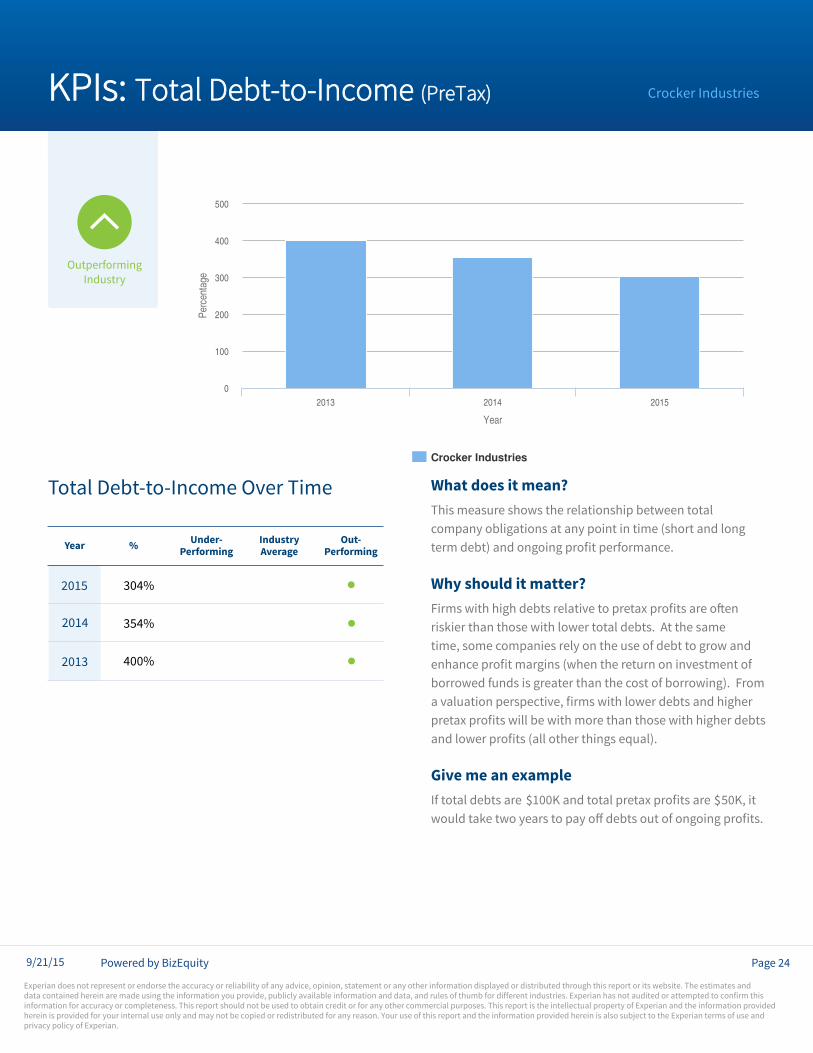
What does it mean? This measure shows the relationship between total company obligations at any point in time (short and long term debt) and ongoing profit performance.
Why should it matter?Firms with high debts relative to pretax profits are often riskier than those with lower total debts. At the same time, some companies rely on the use of debt to grow and enhance profit margins (when the return on investment of borrowed funds is greater than the cost of borrowing). From a valuation perspective, firms with lower debts and higher pretax profits will be with more than those with higher debts and lower profits (all other things equal).
Give me an exampleIf total debts are 100K and total pretax profits are 50K, it would take two years to pay off debts out of ongoing profits.
KPIs: Total Debt-to-Income (PreTax)
Total Debt-to-Income Over Time
Year % Under-Performing
IndustryAverage
Out-Performing
Year
Percentage
CrockerIndustries
2013 2014 20150
100
200
300
400
500
Crocker Industries
$ $
●
9/21/15
2015
2014
2013
●304%
354%
400%
●
Experian does not represent or endorse the accuracy or reliability of any advice, opinion, statement or any other information displayed or distributed through this report or its website. The estimates and data contained herein are made using the information you provide, publicly available information and data, and rules of thumb for different industries. Experian has not audited or attempted to confirm this information for accuracy or completeness. This report should not be used to obtain credit or for any other commercial purposes. This report is the intellectual property of Experian and the information provided herein is provided for your internal use only and may not be copied or redistributed for any reason. Your use of this report and the information provided herein is also subject to the Experian terms of use and privacy policy of Experian.
Powered by BizEquity Page 25
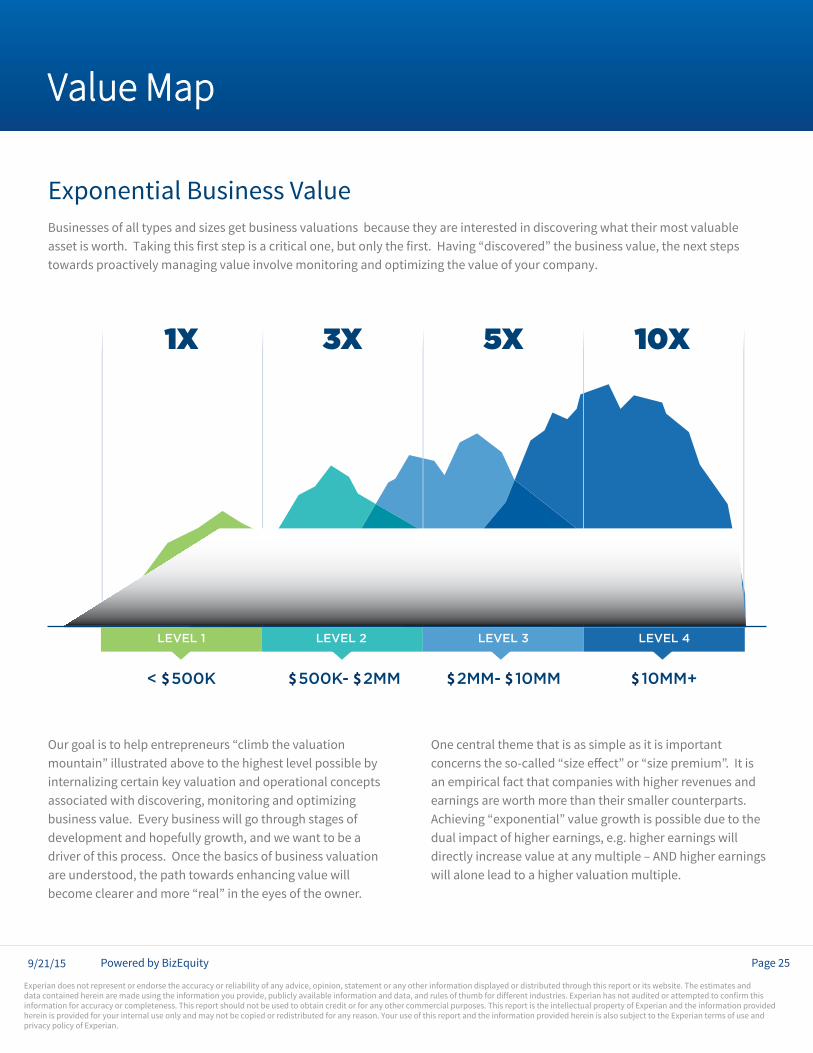
LEVEL 1 LEVEL 2 LEVEL 3 LEVEL 4
Value Map
Our goal is to help entrepreneurs “climb the valuation mountain” illustrated above to the highest level possible by internalizing certain key valuation and operational concepts associated with discovering, monitoring and optimizing business value. Every business will go through stages of development and hopefully growth, and we want to be a driver of this process. Once the basics of business valuation are understood, the path towards enhancing value will become clearer and more “real” in the eyes of the owner.
Businesses of all types and sizes get business valuations because they are interested in discovering what their most valuable asset is worth. Taking this first step is a critical one, but only the first. Having “discovered” the business value, the next steps towards proactively managing value involve monitoring and optimizing the value of your company.
One central theme that is as simple as it is important concerns the so-called “size effect” or “size premium”. It is an empirical fact that companies with higher revenues and earnings are worth more than their smaller counterparts. Achieving “exponential” value growth is possible due to the dual impact of higher earnings, e.g. higher earnings will directly increase value at any multiple – AND higher earnings will alone lead to a higher valuation multiple.
Exponential Business Value
1X
< 500K 500K- 2MM 2MM- 10MM 10MM+
3X 5X 10X
$ $ $ $ $ $
9/21/15
Experian does not represent or endorse the accuracy or reliability of any advice, opinion, statement or any other information displayed or distributed through this report or its website. The estimates and data contained herein are made using the information you provide, publicly available information and data, and rules of thumb for different industries. Experian has not audited or attempted to confirm this information for accuracy or completeness. This report should not be used to obtain credit or for any other commercial purposes. This report is the intellectual property of Experian and the information provided herein is provided for your internal use only and may not be copied or redistributed for any reason. Your use of this report and the information provided herein is also subject to the Experian terms of use and privacy policy of Experian.
Powered by BizEquity Page 26
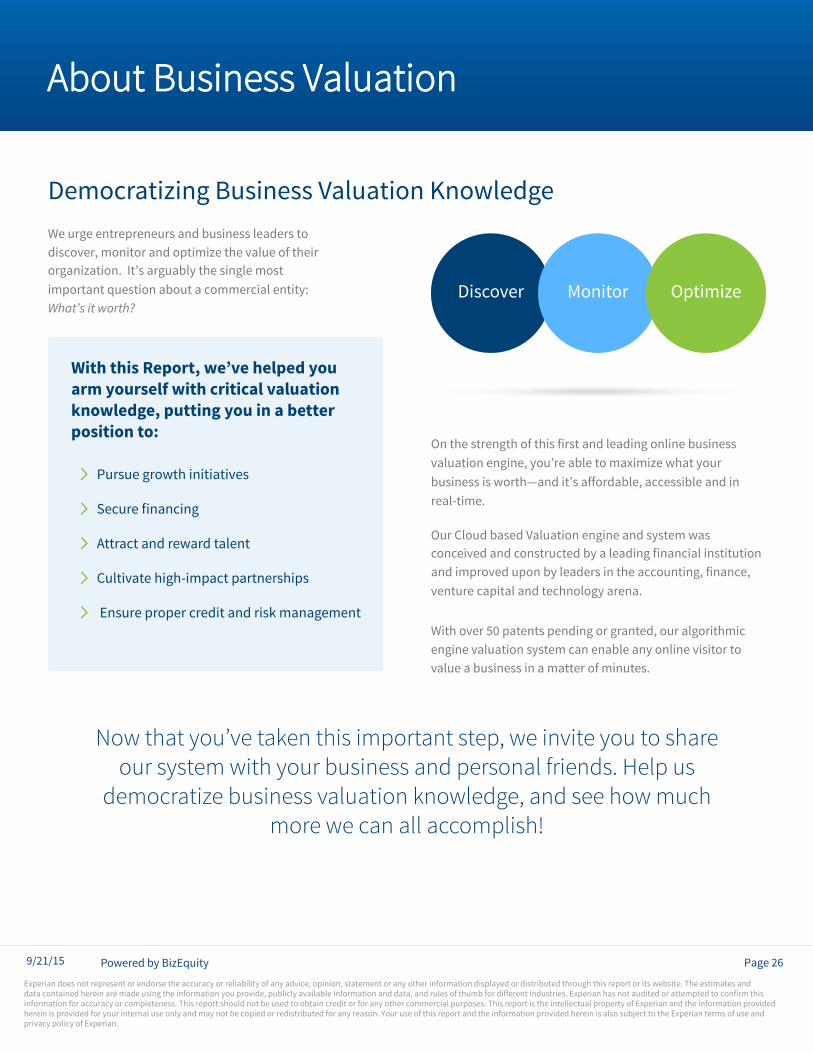
About Business Valuation
We urge entrepreneurs and business leaders to discover, monitor and optimize the value of their organization. t s arguably the single most important question about a commercial entity: What’s it worth?
Democratizing Business Valuation Knowledge
With this Report, we’ve helped you arm yourself with critical valuation knowledge, putting you in a better position to:
Pursue growth initiatives
ecure financing
Attract and reward talent
Cultivate high-impact partnerships
Ensure proper credit and risk management
Discover Monitor Optimize
Now that you’ve taken this important step, we invite you to share our system with your business and personal friends. Help us
democratize business valuation knowledge, and see how much more we can all accomplish!
n the strength of this first and leading online business valuation engine, you re able to ma imize hat your business is orth and it s affordable, accessible and in real-time.
Our Cloud based Valuation engine and system was conceived and constructed by a leading financial institution and improved upon by leaders in the accounting, finance, venture capital and technology arena.
With over 50 patents pending or granted, our algorithmic engine valuation system can enable any online visitor to value a business in a matter of minutes.
9/21/15
Experian does not represent or endorse the accuracy or reliability of any advice, opinion, statement or any other information displayed or distributed through this report or its website. The estimates and data contained herein are made using the information you provide, publicly available information and data, and rules of thumb for different industries. Experian has not audited or attempted to confirm this information for accuracy or completeness. This report should not be used to obtain credit or for any other commercial purposes. This report is the intellectual property of Experian and the information provided herein is provided for your internal use only and may not be copied or redistributed for any reason. Your use of this report and the information provided herein is also subject to the Experian terms of use and privacy policy of Experian.
Powered by BizEquity Page 27
No matter where you may be today, this Report can probably help you get closer to your vision:
f you re in the early stages of your company s life, perhaps you need to expand your capabilities and reach via mar eting, intellectual property advisory, benefits and tax consulting.
If your business is established and nearing a turning point, maybe you seek legal representation, strategic partners and/or growth funding.
If the company is already a substantial success with a critical mass of business, we can help you formulate and/or pursue a smart exit strategy.
Next Steps
We trust that you found your Business Valuation Report to be an informative resource. The aim of this report is to provide guidance for growing companies as they evolve and take steps to elevate their performance results.
9/21/15