bursting in 18 ca2 and ca2+ channels - pnas75 ms) ca2+ inactivation ofca2+ channels (18), they...
TRANSCRIPT
Proc. Nail. Acad. Sci. USAVol. 88, pp. 3897-3901, May 1991Biophysics
Bursting electrical activity in pancreatic 18 cells caused by Ca2 -and voltage-inactivated Ca2+ channelsJOEL KEIZERtt AND PAUL SMOLENt§tInstitute of Theoretical Dynamics and tDepartment of Chemistry, University of California, Davis, CA 95616
Communicated by Terrell L. Hill, January 15, 1991 (received for review September 26, 1990)
ABSTRACT We investigate the hypothesis that two classesof Ca2+ currents, one quickly inactivated by Ca2' and oneslowly inactivated by voltage, contribute to bursting electricalactivity in pancreatic islets. A mathematical model of thesecurrents is fit to the experimental whole-cell current-voltageand inactivation profiles, thereby fixing the Ca2+ conductanceand all activation and inactivation parameters. Incorporatingthese currents into a model that includes delayed rectifier K+channels and ATP-sensitive K+ channels, we show that onlyabnormal bursting is obtained. Modification of activationparameters to increase Ca2+ channel open times, as suggestedby experiment, yields a more robust bursting similar to thatobserved in intact islets. This reinforces the suggestion that inaddition to ATP-sensitive K+ channels, Ca2+ channels mayserve as glucose sensors in the 13 cell.
I. Introduction
Pancreatic ,8 cells, when perifused in islets with physiologicalglucose concentrations that induce insulin secretion, alsoexhibit a rhythmic electrical activity called bursting (1-7).Several K+ and Ca2l ion channels have been implicated inbursting. Voltage-gated K+ and Ca2+ channels are thought tobe responsible for the action potential spikes (8), whileCa2+-activated K+ channels (KCa) (9) and ATP-sensitive K+channels (KATP) (10, 11) have been proposed as "trigger" or"pacemaker" channels. Mathematical models that includethe voltage-gated channels and one or both of the triggerchannels have shown that both mechanisms can supportbursting (12, 13). Recent experimental evidence, however,has called into question the relevance of both KCa channelsand KATP channels. Indeed, Kukuljan et al. (14) have shownthat charybdotoxin, which specifically inhibits KCa channelsin the /8 cell, has no effect on bursting, while Smith et al. (15)conclude that the total KATP conductance changes by <10pS per cell, a value that may be too small to account forrepolarization. Furthermore, isolated ,B cells and small clus-ters can support bursting more regular than can be accountedfor by the small number of active KCa and KATP channelsin single cells.
Recently, Satin and Cook (16, 17) have proposed that slowvoltage inactivation of Ca2+ channels might be involved inrepolarization of the bursts. In addition to the fast (order of75 ms) Ca2+ inactivation of Ca2+ channels (18), they reportevidence for voltage inactivation of calcium current on thetime scale of 1-10 s. Similar results are found in both HITcells (17) and cultured adult mouse cells (18), both of whichexhibit bursting-type electrical activity and insulin secretion.Satin and Cook interpret their Ca2+ currents in terms ofdistinct fast Ca2+-inactivated and slow voltage-inactivatedchannels. In this paper, we develop a mathematical model ofthese currents, which we combine with the delayed rectifier
K+ current (8) and a KATP current (15) to examine whole-cell electrical activity and bursting.
II. HIT Cell Model for Ca21 Currents
The mathematical model developed in this section includestwo Ca2+ currents and two K+ currents. The calcium cur-rents correspond to the fast Ca2'-inactivated and slow volt-age-inactivated Ca2+ channels found by Satin and Cook (17)in HIT cells (19, 20), while the K+ currents are due to the K+delayed rectifier (8) and KATP channels with a constantconductance whose value is set by the ATP/ADP ratio (21).The K+ delayed rectifier has been analyzed by Sherman et al.(22), who assigned it a maximal conductance of 2500 pS percell and the activation parameters in the Appendix. Themagnitude of the KATP conductance in mouse p cells hasbeen estimated to be 360 pS per cell in the presence of 8 mMglucose (23). We use conductance values of this order in ourcalculations and a K+ reversal potential of -75 mV (12, 13,22). Standard values of the capacitance and cell area havebeen adopted (22).According to Satin and Cook (17), the whole-cell Ca2+
current consists of contributions from two classes of chan-nels, which we write in the Goldman-Hodgkin-Katz form
ICa = gCaCaoV/[l- exp(2FV/RT)], [1]
where V is the membrane potential, RT/F is the usual thermalvoltage, Ca. is the external Ca2" concentration (mM), and 9cais the conductance-mM-', written as
gCa = gCa[POf'Xf + ms (V)J(1 - Xf)]. [2]
The first term in Eq. 2 represents the conductance of the fastCa2"-inactivated Ca2+ channels, which carry a fraction Xf ofthe maximal conductance, gca. We use the domain model ofSherman et al. (24) to describe Ca2+ inactivation. [See theAppendix, where POf is the fraction of open channels, 0, inthe scheme (A5) and I is the state inactivated by the voltage-dependent calcium concentration at the mouth of open chan-nels, Cad(V).] The second term in Eq. 2 is the slow voltage-inactivated Ca2+ conductance, for which ms'(V) is the steady-state activation (assumed rapid), and J is the voltage-dependent inactivation, which relaxes to its voltage-dependent steady-state value, J(V), according to
dJ/dt = -[J - Jo(V)]/Tj(V), [3]
with the voltage-dependent time constant, rj.The usual Boltzmann functional form is assumed for the
activation, m'(V). Based on Satin and Cook's observations(17), the half-activation voltage is shifted 10 mV positive fromthat for the steady-state activation, mr(V), for the fastCa2'-inactivated channels. Boltzmann-type formulas arealso assumed for the steady-state inactivation, JN(V), and the
§Present address: Mathematical Research Branch, Building 31,Room 4B-54, National Institutes of Health, Bethesda, MD 20892.
3897
The publication costs of this article were defrayed in part by page chargepayment. This article must therefore be hereby marked "advertisement"in accordance with 18 U.S.C. §1734 solely to indicate this fact.
Dow
nloa
ded
by g
uest
on
Apr
il 22
, 202
0
3898 Biophysics: Keizer and Smolen
inactivation time, rj(V). Details of the functional forms andparameters are given in the Appendix.To describe the time course of the whole-cell voltage and
current we use the differential equation (12, 25, 37)
CdV/dt= -, Is, [4]
where C is the capacitance and the sum is over the appro-priate ion currents. To fix parameter values for the Ca2'channels, the Ca2+ current in Eqs. 1 and 2 is used by itself inthis expression. To analyze bursting activity, the KATP anddelayed rectifier K+ currents in the Appendix are also addedto the right-hand side of Eq. 4.We have used the results of Satin and Cook's experimental
activation and inactivation measurements (17) to fit theparameters of the two Ca2+ currents described above. Wehave simulated three key types of experiments: (i) 40-ms and10-s voltage clamp experiments at various test potentialsstarting from a holding potential of -100 mV (to determinepeak I-V relationships and time course of activation andinactivation); (ii) three-pulse protocols to measure inactiva-tion due to 40-ms and 10-s conditioning at fixed potential; and(iii) 100-ms conditioning pulses at + 10 mV to measure the I-Vrelationship for the slowly inactivating current.To simulate the first type of experiment, we utilized Eq. 4,
supplemented with Eqs. 1-3 and the dynamical equations forfast Ca2+ inactivation of Sherman et al. (24). The resultingpeak I-V curve in 40-ms voltage clamp is shown in Fig. LA.The maximal current of -65 pA and the general shape of thecurve below +50 mV is similar to that shown in figure 2B of
1.0
r.o 0.8,
(.
,-'0.6
co 0.4
0)
0 80 4I -100
-80 -60 -40 -20 0 20 40 60 80
0
-84.'
0
4-)
(8
0.0
-80 -60 -40 -20 0
Voltage,
- l00
mV
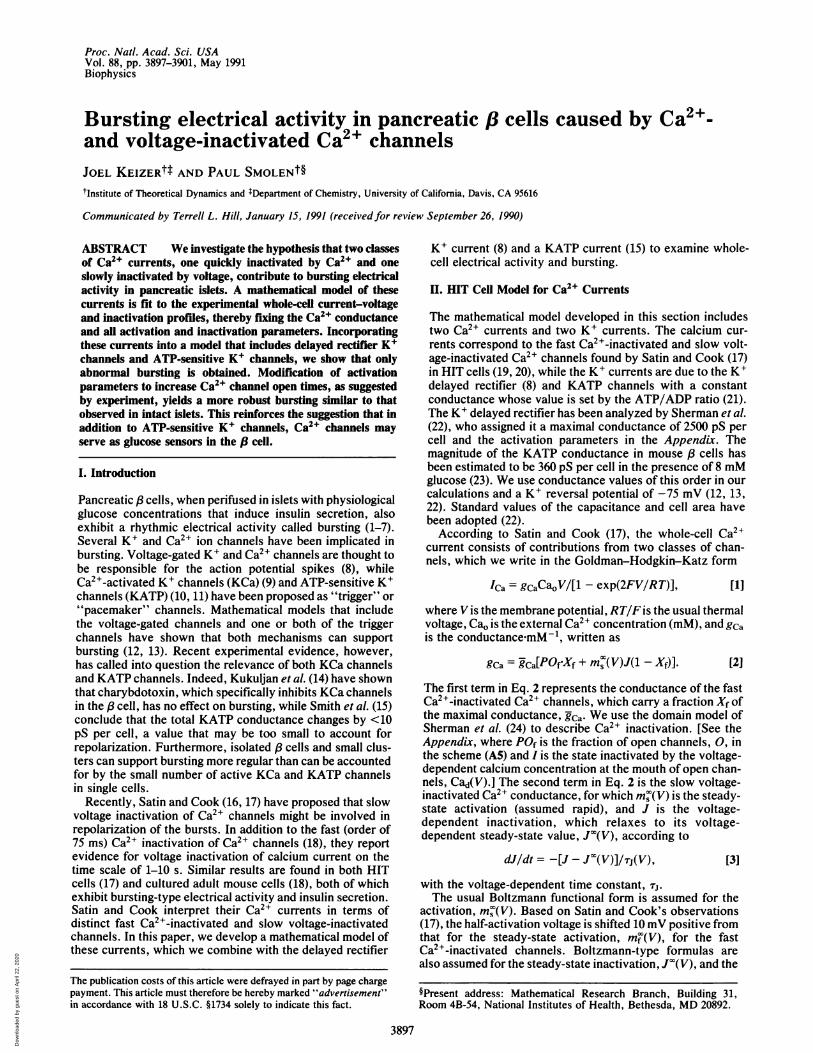
FIG. 1. Simulated peak I-V curves (solid line), and simulatedinactivation curves determined via the three-pulse protocol incor-porating either a 40-ms (triangles) or 10-s (circles) conditioning pulse.(A) Results with the standard parameter set found to best reproduceHIT cell data: Vmf = -3 mV, Smf = 10 mV, Vj = -40 mV, Sj = 7 mV,Vms = 7 mV, S.s = 14 mV, Cao = 3 mM, k- = 0.002 ms-1, k* = 7.56X 10⁻⁴ ms-1.mM-1.mV-1, Xf = 0.45, Rca = 3.92 x 10³ pSmM-1, andTj = 30 s. (B) Results with the modified parameter set that gives goodbursting electrical activity; the differences from A are k* = 4.73 x
10-5 ms-1 mM-1 mV-1, Vmf = -8 mV, Vms = +2 mV.
Satin and Cook (17). With the "standard" parameter valuesgiven in Fig. 1, we obtain somewhat higher currents below-40 mV than were shown experimentally. This may be duein part to the experimental method of leak subtraction sincePlant (18) finds somewhat larger fractional currents in thisrange using 10 mM external Ca2+. The complete current timerecords of these 40-ms simulations (data not shown) aresimilar in time scale and magnitude to the data of Satin andCook (17). It should be noted that the measured inactivationrates in HIT cells are faster than the rates measured in mouse,f cells (18, 26). To account for this, as well as for the fact thatHIT inactivation is not lost after holding for 100 ms at -100mV, the inactivation rate constant, kV, has been increased to4 times the value used by Sherman et al. (24) and thereactivation rate constant, k-, was decreased by nearly anorder of magnitude (see Appendix).Good fits to the 10-s voltage clamp time records (figure 2A
in ref. 19), which show inactivation on the 1- to 7-s time scale,are also obtained with the standard parameters given in Fig.1. In good agreement with their measurements, the relaxationtime Tjis 0.84 s at V = +10 mV and 7.0 s at V = -20 mV.
Theoretical results for the 40-ms and 10-s inactivationcurves based on the standard parameter set are also shown inFig. 1. The protocol used for the simulations mimicked thethree-pulse protocol ofSatin and Cook (17)-namely, holdingat -100 mV followed by a 10-ms pulse at +10 mV; 150 ms at-100 mV; 40 ms (or 10 s) at the conditioning potential; 40 msat -100 mV; and a final 10-ms pulse at +10 mV. The peakcurrents in the first (Ipl) and final (Ip2) pulses to + 10 mV wererecorded, and the fraction of channels not inactivated (h) wasestimated from the formula h = IP2/lpl (18). We show resultsfor the 40-ms simulations only for potentials less than +20mV since at higher potentials our theoretical expression forTj(V) becomes significantly smaller than the limiting value of1 s reported experimentally (17). This leads to significantinactivation of the slow-voltage inactivated current above+20 mV even on the 40-ms time scale and, thus, to spuriousresults. In the physiological region below +20 mV our 40-msinactivation curves reproduce the correct amount ofmaximalinactivation (45%) and the overall shape of the inactivationcurves. Indeed, our simulations even capture the residual,nearly constant, level of inactivation below -50 mV that isseen experimentally. According to our calculations this is notdue to inactivation ofthe slow current, as speculated by Satinand Cook (17), but rather to the kinetics of inactivation of thefast-inactivated channels.Our simulations of the 10-s inactivation protocol show
good agreement with experiments at all values of potential(figure 4B in ref. 17). The increase in inactivation on this timescale between -80 and 0 mV is the sum of the steady-statevoltage inactivation, J"(V), and the steady-state fast Ca2+inactivation, hf(V) (see Appendix). Positive to 0 mV, thesteady-state value ofJ'(V) is essentially 0 and the decline ofinactivation (seen both in Fig. 1A and the experiment) is dueto a lengthening of the transition time from the open state tothe inactivated state as the potential approaches the reversalpotential of Ca2+.As a final check on our Ca2+ currents, we carried out
100-ms conditioning pulses at +10 mV, followed by 40 msholding at -100 mV, and we measured the peak I-V curve ofthe remaining current at various test voltages. The resultingI-V curve (data not shown) is shifted -10 mV to the right anddecreased in magnitude by almost exactly 50% compared tothe unconditioned I-V curve in Fig. LA. This also is in goodagreement with Satin and Cook (17) (cf. their figure 8B). Oursimulation results for the conditioned I-V curve are within10% of the theoretical curve obtained by setting POf = 1.3 x10⁻³ and J = 0.90 in Eqs. 1 and 2, the values achieved afterconditioning. This lends support to the idea that conditioning
Proc. Natl. Acad. Sci. USA 88 (1991)
Dow
nloa
ded
by g
uest
on
Apr
il 22
, 202
0
Proc. Natl. Acad. Sci. USA 88 (1991) 3899
at +10 mV predominantly inactivates the fast Ca2+-inactivated channel.While our standard set of Ca2+ channel parameters leads to
good agreement with Satin and Cook's HIT cell experiments(17), we have not attempted to fit the data to better than5-10%. We have settled on this degree of accuracy becausethe experiments show a great deal of natural variation fromcell to cell. In an effort to reduce the juggling of parameters,we have fixed many of them to agree with previous work (22,24) and focused on obtaining a good set of parameters for theslow channel, the maximal current fraction of the fast chan-nels, and kinetic parameters for Ca2+ inactivation of the fastchannels. We note that previous attempts (27, 28) to explorebursting in the , cell by using slow voltage-inactivating Ca2+channels have employed parameters at serious odds withboth HIT and mouse cell experiments-e.g., a shift of theslow voltage activation 25-28 mV negative rather 10 mVpositive of the fast voltage inactivation (28, 29).
0
S -15
& -30M -45
9 -60
0 5 10 15 20 25
S
D
-t0
III. Analysis of Whole-Cell Electrical Activity
To analyze whole-cell electrical activity we used the fast andslow Ca2+ currents given in Eqs. 1-3 along with the delayedrectifier K+ and ATP-sensitive K+ currents described in theAppendix. Having fixed the parameters of the Ca2+ currents,the primary parameters varied in this section are rT, the rateof activation of the delayed rectifier, and the total conduc-tance of the ATP-sensitive K+ channel, GATP. We justify thisbased on the facts that the rate of activation of the delayedrectifier is known to be temperature dependent (30), whileGATP is a function ofglucose concentration (10, 11). While themaximal value of GATP in the absence of glucose has beenestimated to be 5100 pS in mouse 8 cells, it is reduced bysome 80-90% in the presence of 8 mM glucose (15). In oursimulations, a gradual reduction of GATP through this rangeleads to a slow depolarization of the membrane potential from-75 mV to -68 mV. Reduction of GATP further to 235 pSdepolarizes the cell to -56 mV. Just below this value of GATP,the membrane potential exhibits a kind of rhythmic, burstingelectrical activity.While the time course of bursting depends somewhat on
the magnitude of the activation rate of the delayed rectifier,Tr, bursting consists, essentially, of two "silent" states, onenear -60 mV and another near -35 mV. The transitionbetween the hyperpolarized and depolarized states is accom-panied by vestigial spikes of decreasing amplitude when r, =20 ms. When Tn is increased to 30 ms the spikes becomesomewhat more pronounced, as shown for a GATP value of180 pS in Fig. 2A. This general picture is not modified if themaximal conductance of the delayed rectifier, GK, is de-creased from its "standard" value of 2500 pS to as small avalue as 500 pS or increased to 5000 pS. Thus, we concludethat this generic behavior, including the anomalous bursting,is dominated by the electrical properties of the two calciumcurrents.
This type of bursting is abnormal and has not been reportedfor ,/ cells under physiological conditions (31). Nonetheless,it can be understood easily by using the same type ofmathematical analysis that was used for previous models ofpB-cell electrical activity (38). Analysis of the "fast" dynamicsof the voltage, V, using the "slow" inactivation, 1 - J, as aparameter reveals a z-shaped curve of steady states with thefollowing features: (i) a depolarized (upper) branch of stablesteady states that are approached in an oscillatory fashion;(ii) a hyperpolarized (lower) branch of steady states that areexponentially stable; and (iii) an intermediate branch ofsteady states that are unstable. For the standard parameters(see Fig. 1), there is a Hopf bifurcation leading to stableoscillations on the upper branch at positive values of 1 - Jbelow 0.18. Viewed in this fashion, the abnormal bursts
500
n 400
- 300
cu 200100
0 205 10 15
Time, sec
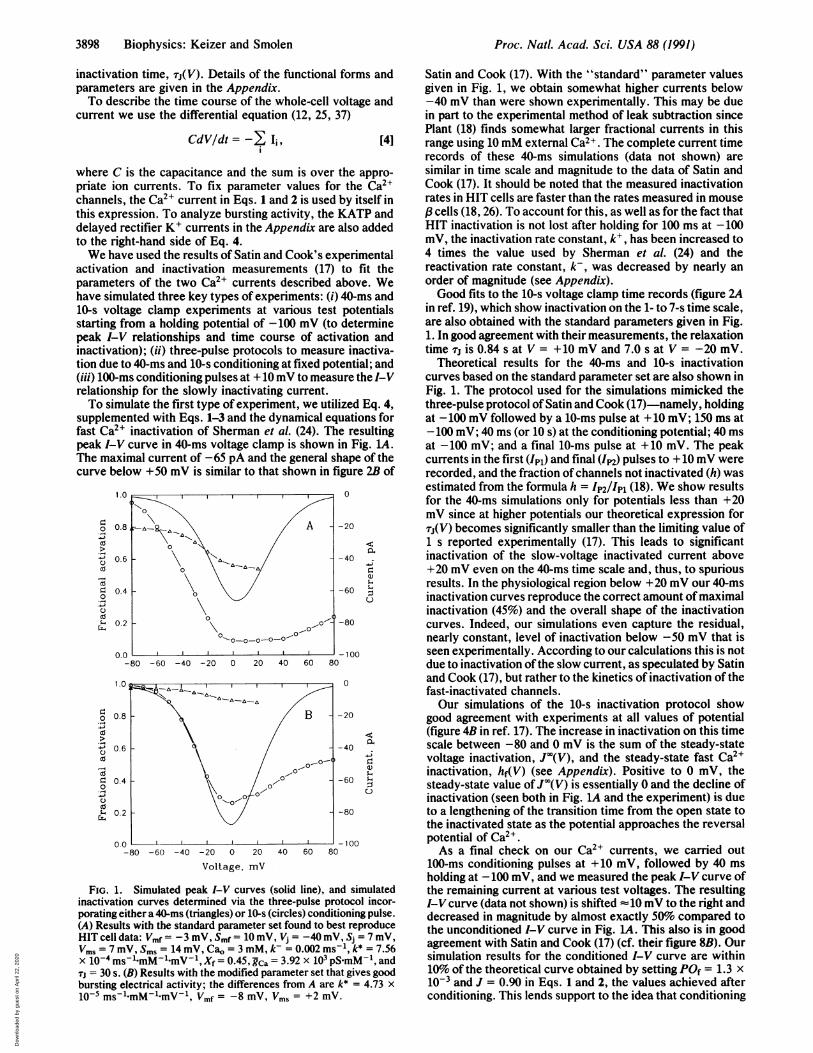
FIG. 2. Simulated time courses for membrane potential, frac-tional activation of slow calcium channels (J), and cytoplasmic freecalcium concentration. (A) Standard parameter set for the Ca2lchannels used in Fig. 1A, GATP = 180 PS, and Tn = 30 ms. (B-D)Modified parameter set (see Fig. 1B) with GATP = 380 PS, Tn = 20 ms,kCA = 0.24 ms-1, andf= 0.015.
consist of three distinct portions. First, a short hyperpolar-ized phase on the lower branch. As 1 - J decreases, thisevolves into several large spikes that depolarize the mem-brane sufficiently to cause the slow inactivation 1 - J to beginincreasing near the upper branch. Since the upper branchsupports only damped oscillations, the cycle is completedwhen 1 - J exceeds the value at the right "knee" of the zcurve and then rapidly repolarizes to the lower branch. Themajor distinctions between this type of bursting behavior andthat seen in other models are the large spikes emanating fromthe lower branch and the damped oscillations on the upperbranch. These differences can be shown to arise from the fastCa2+ inactivation in this model, which relaxes on a time scaleintermediate between that of the voltage and the slow voltageinactivation. The details of this analysis will be given else-where.
IV. Modification of Ca2+ Currents and Normal Bursting
Because the HIT cell Ca2+ currents do not explain theelectrical activity observed in the 8 cells (2, 15, 39), we havesought modifications in both the K+ and Ca2+ currents thatmight lead to normal bursting. Changes in the magnitude ofthe conductances of either the delayed rectifier or the ATP-sensitive channel do not help in this regard, nor does increas-ing (or decreasing) the relaxation time, rn, of the delayedrectifier or changing its activation parameters. Experimentsby Smith et al. (15), however, suggest that 20 mM glucoseincreases the activity of individual Ca2+ channels and length-ens their mean open time. This is reversed by inhibitors ofglucose metabolism, suggesting involvement of a metabolicintermediate. It is also possible that increasing the temper-
Biophysics: Keizer and Smolen
Dow
nloa
ded
by g
uest
on
Apr
il 22
, 202
0
3900 Biophysics: Keizer and Smolen
ature causes changes in Ca2l channel parameters. Indeed,several groups have noted that both electrical activity (32)and intracellular Ca2+ oscillations (34) are abolished at roomtemperature, where Satin and Cook's experiments wereperformed.Thus, we checked whether increasing open times or de-
creasing the time spent in the inactivated state would modifywhole-cell electrical activity. To this end, we modified thestandard activation parameters for the Ca2` currents byshifting the half-maximal voltage to lower potentials andincreasing the slope at half-maximum. Changes in the oppo-site direction were investigated for inactivation parameters.The rate constant, kV, for the fast Ca2" inactivation step (seeAppendix) was also decreased. The vast majority of thesechanges had no significant effect on bursting in the sense thatvalues of GATP and Tn in the physiologically reasonable rangeled only to abnormal bursts like those in Fig. 2A.We found that shifting the half-maximal activation of both
Ca2+ currents by -5 mV and decreasing the rate constant forinactivation, kV, by a factor of 16 led to the apparently normalbursts in Fig. 2B. The bursting period (=6 s) is somewhatshorter than seen experimentally (2), while spiking frequency(-6 s-1 decreasing to 3 s-1) is similar to that normallyobserved. The two parameter changes have the effect ofincreasing the open time for both Ca2" currents, althoughthey affect most strongly the fast Ca2'-inactivated current.This is illustrated in Fig. 1B, in which the current andfractions not inactivated should be compared to Fig. 1A forthe standard parameters. These parameter changes reducethe maximal inactivation in the 40-ms experiment from 45%to 1o and substantially reduce the inactivation in the 10-sexperiments. The maximal current is seen to be increased by-40%o by these changes. We have found that smaller changesthan this do not lead to bursting, but only to an exaggeratedform of the abnormal bursting with more spikes during thetransition to the depolarized state. Although the two changesthat give rise to the modified standard parameter set arerelatively minor, it is clear from comparing Fig. 1B with theresults of Satin and Cook (17) that the resulting modifiedinactivation curves lie well outside experimental error. Weconclude, therefore, that experimentally significant reduc-tions in the Ca2+ inactivation observed for HIT cells wouldbe required to allow slow voltage inactivation to producebursting.Chay (28, 29) has suggested that the half-maximal inacti-
vation potential of a slow current, Vj, could be effective inmodulating the duration of the active (spiking) phase of aburst. We have verified this to be the case for the modifiedparameter set. Indeed, when Vj is reduced from -40 mV to-28.6 mV, the percentage active phase increases continu-ously from about 37% to 90%, while the period increases from5.9 s to a maximum of =10.4 s before continuous spikingabruptly occurs.The period, x, of both the abnormal bursts and the normal
bursts in Fig. 2 are determined predominantly by the size ofrj(V). The period appears to be roughly the size of Tj at -20mV-e.g., -7 s for the modified parameter set. Indeed, wenoted above that as Vj is increased, the period increases-approximately in accord with the relationship T = Tj (-20mV). Thus, significant increases in the bursting period be-yond 10 s would require significant slowing of the slowvoltage inactivation process. Experimentally there is greatvariation in the period of bursting and periods of >120 s havebeen observed in both islets (2) and whole-cell records (15).To explain this fact by slow voltage inactivation alone wouldrequire an order of magnitude increase in the measured timeconstants for slow voltage inactivation.
It is interesting that the modified value of GATP that leadsto normal bursting is 380 pS, close to the value estimated byAshcroft and Smith (23) for the conductance of mouse j3 cells
in 8 mM glucose. In our calculations, increases in GATPdisplace the z curves to the left, leading to a stable hyper-polarized state, as described in the previous section. Smalldecreases in GATP from its modified standard value of 380p5-e.g., to 340 pS-however, lead to abnormal bursting notunlike that shown in Fig. 2A. This change, however, is more"normal" (32) in that normal bursting can be recovered by asmall increase in rin (e.g., from 20 ms to 20.7 ms). This iscaused by a shift in the Hopf bifurcation point on the upperbranch, whose location is sensitive to both GATP and T,Larger values of Tn.-e.g., 22 ms-shift the Hopf bifurcationcurve so far to the left that only the "beating" type spikingis observed.
V. Discussion
The main objective of this work was to determine whether theslow voltage inactivation of HIT cell Ca2' currents couldsuffice to produce bursting. The answer is a qualified "yes,"since without specific reduction in Ca2+ inactivation andincreased Ca2' activation only abnormal bursts are observed.These modifications are in line with the observations ofAshcroft and Smith (15) that glucose increases Ca2"-channelactivity. Despite the fact that 11 mM glucose is present in thebathing solutions of Satin and Cook (17), it is possible that intheir whole-cell configuration a glycolytic intermediate (or aprotein that might, for example, phosphorylate Ca2+ chan-nels) washed out of the cell. Another possibility is that themodifications necessary to achieve normal bursting might becaused by increasing the temperature from 200C to 220C intothe physiological range where bursting occurs (22). It is alsointeresting to note that mouse P cells exhibit somewhat lessinactivation than HIT cells (26). This appears to be dueprimarily to a slower inactivation time course for the fastCa2'-inactivated channels, which in mouse carry only 36% ofthe maximal current (26). These modifications are in the samedirection that we have had to modify the HIT cell data toachieve normal bursting. In this regard, it is also interestingto note that Rojas et al. (35) have presented evidence for aCa2+ channel activated by glucose in human ,3 cells. Ifpresent in mouse and HIT cells, this channel might alsosuffice to provide the additional Ca2+ current needed toachieve bursting.
Increasing the half-maximal inactivation potential, Vj, ofthe slow voltage-inactivated current provides another possi-ble link between Ca2+ currents and glucose. As we havementioned, increasing Vj increases the percentage activephase, ultimately leading to continuous spiking. This mimicsthe effects of increased glucose concentrations in perifusedislets, as does the fact that the bursting period, x, increasesonly slightly (36). The short bursting period (6-10 s) is aproblematic feature of the slow voltage inactivation model.Data from mouse cells (26), which have a comparable voltageinactivation time, are of no help here, nor is an increase intemperature, which should only decrease relaxation times.Thus for slow voltage inactivation alone to serve as thetrigger for bursting would require an increase of at least afactor of 2 or more in relaxation time.A new feature of our slow voltage inactivation mechanism
is that it is independent of intracellular Ca2+. As a conse-quence, intracellular Ca2" concentrations do not necessarilyhave to change slowly in this model. This is important sinceValdeomillos et al. (3) have observed that intracellular Ca2+increases quite rapidly on the upswing of Ca2+ oscillations inislets. We can account for this in the present model by usingthe simple Ca2+ balance equation
f-'dc/dt = -YCa - kcac, [5]
Proc. Natl. Acad. Sci. USA 88 (1991)
Dow
nloa
ded
by g
uest
on
Apr
il 22
, 202
0

Proc. Natl. Acad. Sci. USA 88 (1991) 3901
where c is the concentration (/LM) of free intracellular Ca2",f is the fraction of free Ca2", y = 4.50 x 10⁻⁶ convertsfA totLM ms-', and kCa is a first-order rate constant for extrusionof Ca2" from the cytosol. Eq. 5 is coupled to the voltage viaICa and, when solved numerically by the modified parameterset and kCa = 0.24 ms-1, f = 0.015, yields the intracellularCa2+ oscillations shown in Fig. 2D. The rapid increase in c atthe onset of the active phase is like that seen experimentally(2) and unlike that obtained in previous models (12, 13, 27).Another interesting feature of the present bursting mech-
anism is that it invokes two types of glucose sensors. First,the ATP-sensitive K+ channel is used to depolarize the cellinto the region of the z curve where bursting is possible. Andsecond, reduction of the Ca2+ inactivation and increase in theactivation of both Ca2+ channels is used to initiate normalbursting and modulate the percentage active phase. Whetherthese features, or something similar, turn out to be compat-ible with future experimental work remains to be seen.
Appendix: Functional Forms and Definition of Parameters
Boltzmann-type equations are assumed for all steady-stateactivation (m', m', n') and inactivation (J) functions. Forexample, for the fast Ca2+ activation
m (V) = 1/[1 + exp(Vmf - V)/Smf], [Al]
and for the slow voltage inactivation
JN(V) = 1/[1 + exp(V - Vj)/Sj], [A2J
with comparable notation for m' and n'.The delayed rectifier current is taken from Sherman et al.
(24) as IKV = gKn(V - VK), with n solving
dn/dt = -[n - n'(V)]/rn(V). [A31
The relaxation time for the delayed rectifier is
,r(V) = 'r/{exp[V - Vn)/65] + exp[(- V + Vn)/20]}. [A4]
The ATP-sensitive K+ current is written as GKATP (V - VK)-Kinetic parameters for the domain model of fast Ca2+
inactivation follow the notation of Sherman et al. (24). Thus,in the mechanism
a k+Cad(V)C ;i± U , ' I, [A5J
f k-
a(V) = 0.78 m (V), a + /3 = 0.78 (both in ms), and
k+Cad(V) = k*CaOV/[1 - exp(2FV/RT)], [A6]
with RT/2F = 13.35 mV. The units of k* are ms'1mM-1mV-1 and k- units are ms-1. The theoretical expression forthe fraction not inactivated, hf(V), for the fast Ca2+ inacti-vation in the domain model is (24)
hf(V) = 1/[1 + k+Cad(V)m (V)/k-]. [A7]
The slow voltage inactivation J satisfies Eq. 3, with rj(V)defined by the symmetrical Boltzmann formula
TJ(V) = rj/{exp[(V - Vj)/2Sj] + exp[-(V - Vj)/2Sj]}. [A8]
Other parameters that were generally fixed in this work(22) were VK = -75 mV, gK = 2500 pS, C = 5310 fF, Vceii= 2301 ,um3, Sn, = 5.6 nV, Vn = -13 mV.
This work was supported by National Science Foundation GrantDIR-90-06104 and the Agricultural Experiment Station of the Uni-versity of California, Davis.
1. Dean, P. M. & Matthews, E. K. (1970) J. Physiol. (London)210, 225-264.
2. Atwater, I., Dawson, C. M., Scott, A., Eddlestone, G. &Rojas, E. (1980) Biochemistry and Biophysics ofthe PancreaticP3-Cell (Thieme, New York), pp. 100-107.
3. Valdeomillos, M., Santos, R. M., Contreras, D., Soria, B. &Rosario, L. M. (1989) FEBS Lett. 259, 19-23.
4. Draznin, B. & Dahl, R. (1989) in Molecular and CellularBiology ofDiabetes Mellitus, eds. Draznin, B., Melmed, S. &LeRoith, D. (Liss, New York), Vol. 1, pp. 37-48.
5. Boyd, A. E., lII, Rojan, A. S. & Gaines, K. L. (1989) inMolecular and Cellular Biology of Diabetes Mellitus, eds.Draznin, B., Melmed, S. & LeRoith, D. (Liss, New York), Vol.1, pp. 93-106.
6. Meissner, H. (1976) J. Physiol. (Paris) 72, 757-769.7. Atwater, I., Rojas, E. & Scott, A. (1979) J. Physiol. (London)
291, 57P (abstr.).8. Rorsman, P. & Trube, G. (1986) J. Physiol. (London) 374,
531-547.9. Atwater, 1., Dawson, C., Ribalet, B. & Rojas, E. (1979) J.
Physiol. (London) 288, 575-593.10. Cook, D. & Hales, C. N. (1984) Nature (London) 311, 271-273.11. Ashcroft, F., Harrison, D. & Ashcroft, S. (1984) Nature
(London) 312, 446-448.12. Chay, T. & Keizer, J. (1983) Biophys. J. 42, 181-190.13. Keizer, J. & Magnus, G. (1989) Biophys. J. 56, 229-242.14. Kukuljan, M., Goncalves, A. A. & Atwater, 1. (1991) J.
Membr. Biol. 119, 187-195.15. Smith, P. A., Ashcroft, F. & Rorsman, P. (1990) FEBS Lett.
261, 187-190.16. Satin, L. S. & Cook, D. L. (1988) Pflugers Arch. 411, 401-409.17. Satin, L. S. & Cook, D. L. (1989) Pflugers Arch. 414, 1-10.18. Plant, T. D. (1988) J. Physiol. (London) 404, 731-747.19. Boyd, A. E., III, Hill, R. S., Oberwetter, J. M. & Berg, M.
(1986) J. Clin. Invest. 77, 774-781.20. Keahey, H., Rajan, A. S., Boyd, A. E., III, & Kunze, D. L.
(1989) Diabetes 38, 188-193.21. Misler, S., Falke, L. C., Gillis, K. & McDaniel, M. L. (1986)
Proc. Natl. Acad. Sci. USA 83, 7119-7123.22. Sherman, A., Rinzel, J. & Keizer, J. (1988) Biophys. J. 54,
411-425.23. Ashcroft, F. M. & Smith, D. A. (1989) J. Physiol. (London)
417, 79P (abstr.).24. Sherman, A., Keizer, J. & Rinzel, J. (1990) Biophys. J. 58,
985-995.25. Keizer, J. (1988) Math. Biosci. 90, 127-138.26. Hopkins, W. F., Satin, L. S. & Cook, D. L. (1991) J. Membr.
Biol. 119, 229-239.27. Chay, T. R. & Cook, D. L. (1988) Math. Biosci. 90, 139-153.28. Chay, T. R. (1990) Am. J. Physiol. 258, C955-C965.29. Chay, T. R. (1990) J. Theor. Biol. 142, 305-315.30. Hille, B. (1984) Ionic Channels in Excitable Membranes (Sin-
auer, Sunderland, MA), p. 330.31. Ribalet, B. & Biegelman, P. M. (1981) Am. J. Physiol. 241,
C59-C67.32. Atwater, I., Goncalves, A., Herchuelz, A., Lebrun, P., Mal-
aisse, W. J., Rojas, E. & Scott, E. (1984) J. Physiol. (London)348, 615-627.
33. Falke, L. C., Gillis, K. D., Pressel, D. M. & Misler, S. (1989)FEBS Lett. 251, 167-172.
34. Hellman, B., Gylfe, E., Grapengiesser, E., Panten, U.,Schwanstecher, C. & Heipel, C. (1990) Cell Calcium 11,413-418.
35. Rojas, E., Hidalgo, J., Carroll, P. B., Li, M.-X. & Atwater, 1.(1990) FEBS Lett. 261, 265-270.
36. Meissner, H. P. & Atwater, I. (1976) Horm. Metab. Res. 8,11-16.
37. Plonsey, R. (1969) Bioelectric Phenomena (McGraw Hill, NewYork).
38. Rinzel, J. (1985) in Ordinary and Partial Differential Equations,eds. Sleeman, B. D. & Jarvis, R. J. (Springer, New York), pp.304-316.
39. Atwater, I., Carroll, P. & Li, M.-X. (1989) in Molecular andCellular Biology of Diabetes Mellitus, eds. Draznin, B.,Melmed, S. & LeRoith, D. (Liss, New York), pp. 49-68.
Biophysics: Keizer and Smolen
Dow
nloa
ded
by g
uest
on
Apr
il 22
, 202
0