bursa malaysia berhad - bursa-cn.listedcompany.com · 34th annual general meeting . dato’...
TRANSCRIPT

34th Annual General Meeting
Dato’ Tajuddin Atan, CEO
14 April 2011
BURSA MALAYSIA BERHAD Destination of choice for listings and investments in the region
Presentation to Shareholders

MARKET PERFORMANCE IN 2010
KEY DEVELOPMENT & GLOBAL RECOGNITION IN 2010
FINANCIAL REVIEW
KEY FOCUS & PROSPECT
AGENDA
2

3
Securities Market Progressed Steadily 4 – 5
Securities Market Trading Activity 6
Securities Market Trading Participation 7
Increasing Interest in the Derivatives Market 8
Derivatives Market Demography 9
Peer Comparison In 2010 10
Market Performance in 2010

4
2009 2010 1Q2011
28%
Securities Market Progressed Steadily
1,518.91
3%
Daily Average Trading Value -
OMT + DBT* (RM mil)
Turnover Velocity
Market Capitalisation (RM bil)
FBM KLCI Index 1,272.78 19%
1,221
1,574
29%
FBMKLCI Hits All Time High at 1574.49 on 17 Jan 2011
* OMT - On Market Transaction DBT - Direct Business Transaction
2,234
42%
1,288
1,545.13
1%
27%
42%
34%
999
33%
1,275
2%
31.12.2009 31.12.2010 31.3.2011
28
2009
33
2010 1Q2011
5
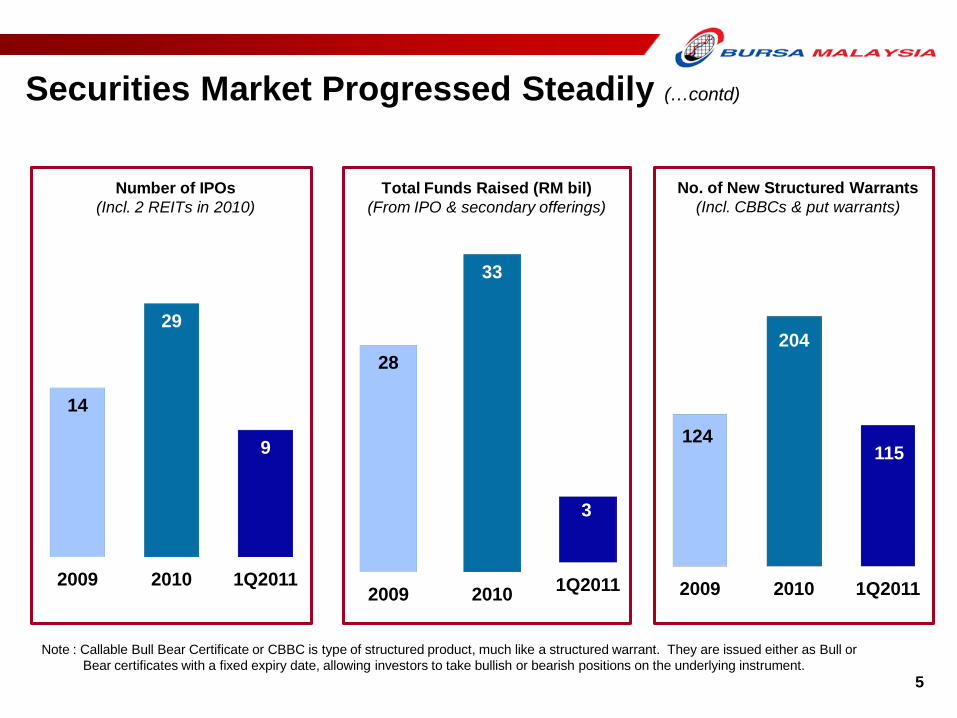
Securities Market Progressed Steadily (…contd)
124
204
115
2009 2010 1Q2011
14
29
9
2009 2010 1Q2011
No. of New Structured Warrants (Incl. CBBCs & put warrants)
Number of IPOs (Incl. 2 REITs in 2010)
Total Funds Raised (RM bil) (From IPO & secondary offerings)
3
Note : Callable Bull Bear Certificate or CBBC is type of structured product, much like a structured warrant. They are issued either as Bull or Bear certificates with a fixed expiry date, allowing investors to take bullish or bearish positions on the underlying instrument.

57%
31% 40% 39%
20% 23%
34% 32% 25%
34%
53%
34% 34% 33% 42%
1,924
497 805 911
350 472 748
874 718
1,019
2,179
1,181 1,129 1,454
2,161
-
400
800
1,200
1,600
2,000
2,400
1997 1998 1999 2000 2001 2002 2003 2004 2005 2006 2007 2008 2009 2010 1Q2011
RM mil
Annual DATV & Velocity
68%
54% 50%
41% 46%
31% 25%
32% 23%
48%
36% 28%
35% 28% 31%
37% 42%
6
2,610 2,303
2,069 1,751 1,907
1,187 823 854
615
1,490 1,266 1,099 1,435 1,209 1,387
1,793 2,161
- 400 800
1,200 1,600 2,000 2,400 2,800
1Q07 2Q07 3Q07 4Q07 1Q08 2Q08 3Q08 4Q08 1Q09 2Q09 3Q09 4Q09 1Q10 2Q10 3Q10 4Q10 1Q11
RM mil
Securities Market Trading Activity Quarterly DATV & Velocity
Daily Average Trading Value (RM mil) Turnover Velocity
Daily Average Trading Value (RM mil) Turnover Velocity

346
806
283 373 378
583
34 37 24
33 26 27
66 63 76 67 74 73
2006 2007 2008 2009 2010 1Q2011
7
Securities Market Trading Participation
From 2006 to 2009, the statistics were based on Brokers’ submission. From 2010 onwards statistics were based on Bursa’s internal system.
65 63 58
73 73 76
35 37 42 27 27 24
2006 2007 2008 2009 2010 1Q2011
Retail (%)
Institutions (%)
Local (%)
Foreign (%)
Retail DATV (RM mil)
Foreign DATV (RM mil)
357
806
496
305 393
519
Retail vs Institutions Foreign vs Local

2010
24,818
2010 1Q2011
24,749
2009
Increasing Interest in the Derivatives Market
8
FCPO & Total Volume Reach All Time Monthly Highs of 619,326 & 856,791 contracts in March 2011
FCPO
Daily Average Contracts
(Units)
Open Positions
0.3%
123,141 132,151 36,785
136,202
48%
1Q2011 2010 2009
FKLI
1Q2011 2009
25,606
16,389 16,165 8,056 8,044
10,274
9
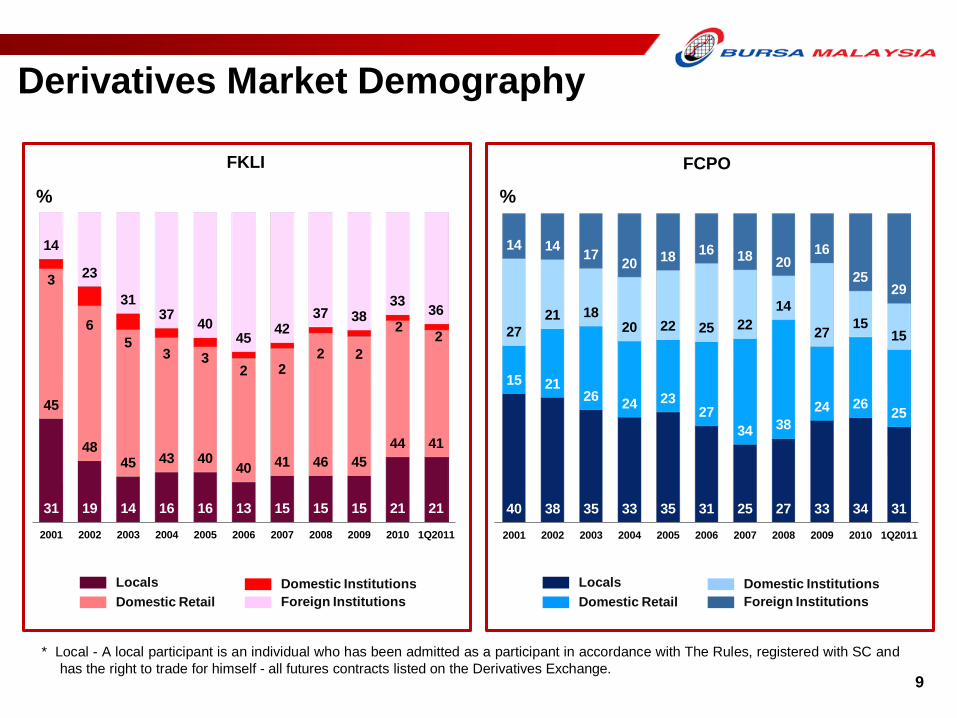
Derivatives Market Demography
* Local - A local participant is an individual who has been admitted as a participant in accordance with The Rules, registered with SC and has the right to trade for himself - all futures contracts listed on the Derivatives Exchange.
31 19 14 16 16 13 15 15 15 21 21
45
48 45 43 40
40 41 46 45 44 41
3
6 5
3 3 2 2
2 2
2 2
14
23
31 37 40
45 42 37 38
33 36
2001 2002 2003 2004 2005 2006 2007 2008 2009 2010 1Q2011
%
FKLI
Locals Domestic Retail
Domestic Institutions Foreign Institutions
40 38 35 33 35 31 25 27 33 34 31
15 21 26 24 23
27 34 38
24 26 25
27 21 18
20 22 25 22 14
27 15 15
14 14 17 20 18 16 18 20 16
25 29
2001 2002 2003 2004 2005 2006 2007 2008 2009 2010 1Q2011
%
FCPO
Locals Domestic Retail
Domestic Institutions Foreign Institutions

-20% 0%
20% 40% 60% 80%
100% 120%
Col
ombo
Phili
ppin
es
Osa
ka
Indo
nesi
a
Shen
zhen
Thai
land
Kore
a
Nat
iona
l SE
Indi
a
Sing
apor
e
Bom
bay
Hon
g Ko
ng
Taiw
an
Aust
ralia
Toky
o
Shan
ghai
-40.00%
-20.00%
0.00%
20.00%
40.00%
60.00%
80.00%
100.00%
Col
ombo
Thai
land
Indo
nesi
a
Kore
a
Nat
iona
l SE
Indi
a
Bom
bay
SE
Sing
apor
e
Taiw
an
Hon
g Ko
ng
Osa
ka
Shen
zhen
SE
Aust
ralia
Toky
o SE
Shan
ghai
SE
Mal
aysi
a
10
0
200
400
600
800
1,000
1,200
Hon
g Ko
ng
Shan
ghai
Shen
zhen
Aust
ralia
n
Toky
o
Nat
iona
l SE
Indi
a
Kore
a
Indo
nesi
a
Sing
apor
e
Taiw
an
Thai
land
Phili
ppin
es
Col
ombo
Osa
ka
USD
bil
Funds Raised
Peer Comparison in 2010 Asian Benchmark Index Growth % Asian Market Capitalisation Growth %
Mal
aysi
a
100
80
60
40
20
0
-20
-40
120 100 80 60 40 20 0
-20
Source: World Federation Exchanges (WFE)
19% 28%
USD10.8 bil
Mal
aysi
a

11
Key Development in 2010 12
Global Recognition 13
Awards and Accolades in 2010 14
Key Development & Global Recognition in 2010
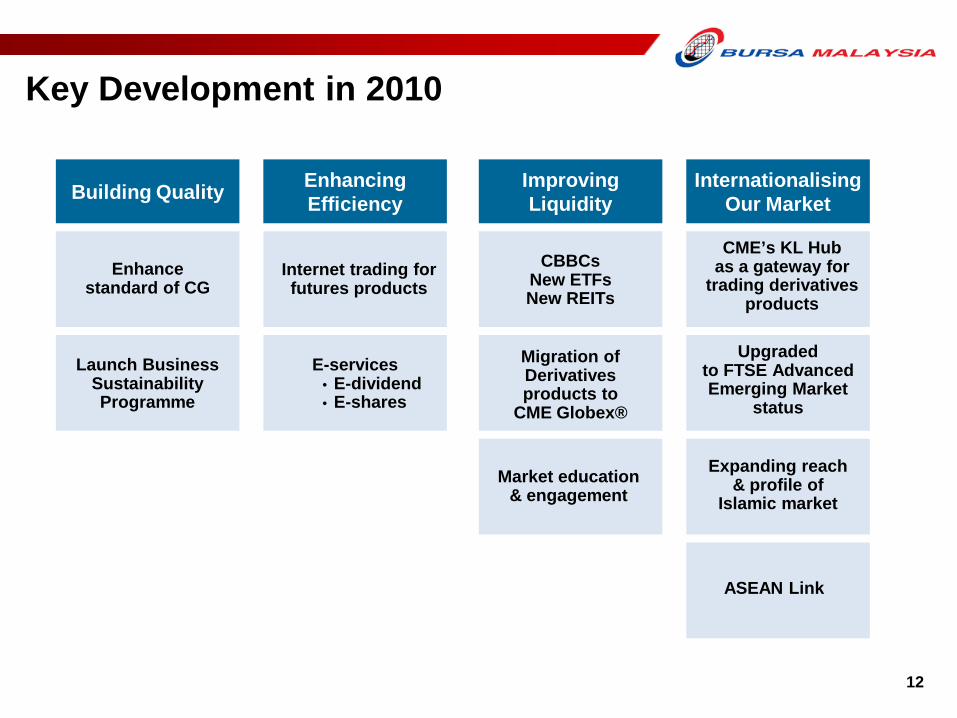
12
Enhance standard of CG
Market education & engagement
CME’s KL Hub as a gateway for
trading derivatives products
Expanding reach & profile of
Islamic market
Upgraded to FTSE Advanced Emerging Market
status
Key Development in 2010
CBBCs New ETFs New REITs
E-services • E-dividend • E-shares
ASEAN Link
Migration of Derivatives products to
CME Globex®
Internet trading for futures products
Internationalising Our Market
Improving Liquidity Building Quality Enhancing
Efficiency
Launch Business Sustainability Programme

Global Recognition
Approval from US Commodity Futures Trading Commission (CFTC) to enable Malaysian Futures brokers to deal with US customers
Migration of Malaysian derivatives products to CME Globex®
QDII – Malaysia Investment destination for China investors
13
CBRC Recognition
FTSE Upgrade
CFTC Approval
U.S. SEC Approval
“Designated Offshore Securities Market” recognition to ease trading in Malaysian listed securities & shelf listed bonds by U.S. investors
CME Partnership
Malaysia promoted to Advanced Emerging Market status in FTSE Global Equity Index Series

Bursa Suq Al-Sila’s Innovation Awards
14
Awards and Accolades in 2010
Malaysian CG Index Awards by MSWG
• Top 3 (overall) Award for excellent in CG • Distinction Award • Special Transparency Award
• Market innovation award for The Asset Triple Awards for Islamic Finance
• Islamic innovation award by Ministry of Science, Technology and Innovation (MOSTI)
Investor Relations Awards by Investor Relations Global Ranking
• Best Corporate Governance practices • Best Online Annual Report in Asia Pacific

15
Financial Review
Improved Financial Performance 16
Increased Revenue 17
Higher Operating Expenses 18
Sustainable Performance Ratios 19
Strong Reserves 20
High Dividend Payout 21
2009 2010
16
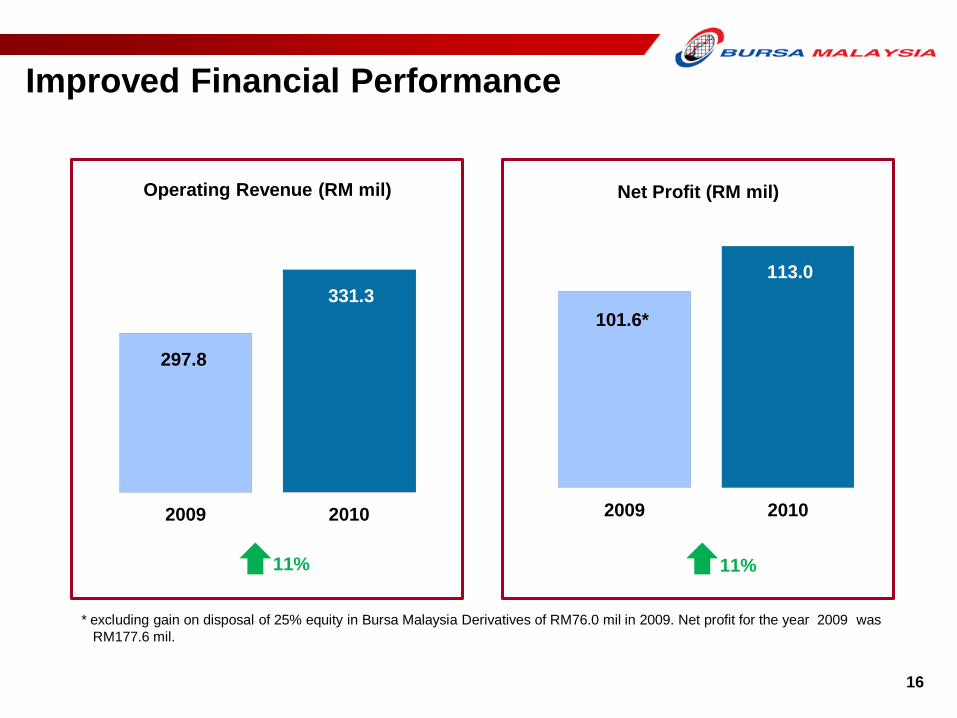
Improved Financial Performance
2009 2010
Operating Revenue (RM mil)
297.8
331.3
Net Profit (RM mil)
11%
* excluding gain on disposal of 25% equity in Bursa Malaysia Derivatives of RM76.0 mil in 2009. Net profit for the year 2009 was RM177.6 mil.
11%
101.6*
113.0
17
139.1
38.5
103.6
16.7
167.9
37.6
107.8
17.9
Securities Trading Revenue
Derivatives Trading Revenue
Stable Revenue Other Operating Revenue
32.0 32.9
17.4
10.9 7.4
3.0
36.1 33.1
17.0
11.3 7.3
3.0
Listing Fees Depository Services
Information Services
Broker Services
Access Fee Participants' Fees
Operating Revenue
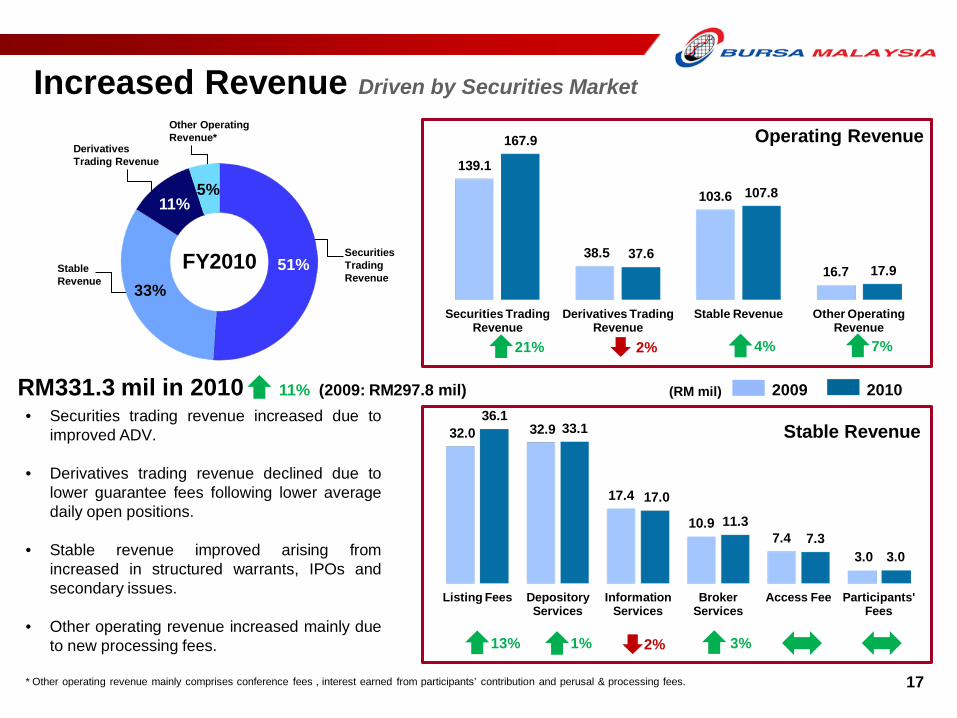
Increased Revenue Driven by Securities Market
17 * Other operating revenue mainly comprises conference fees , interest earned from participants’ contribution and perusal & processing fees.
FY2010
21% 4% 7% 2%
RM331.3 mil in 2010 11% (2009: RM297.8 mil) • Securities trading revenue increased due to
improved ADV.
• Derivatives trading revenue declined due to lower guarantee fees following lower average daily open positions.
• Stable revenue improved arising from increased in structured warrants, IPOs and secondary issues.
• Other operating revenue increased mainly due to new processing fees.
Stable Revenue
(RM mil) 2009 2010
13% 3% 2% 1%
Other Operating Revenue*
Securities Trading Revenue
Stable Revenue
Derivatives Trading Revenue
51% 33%
11% 5%

47%
22%
6%
9% 5%
2% 9%
18 18
83.3
38.9
15.4 14.2 10.1 3.2
17.5
92.4
43.2
12.3 17.7
10.2 2.7
18.2
• Other OPEX comprises administrative expenses, CDS consumables & other miscellaneous expenses..
FY2010
Staff Cost Depreciation & Amortisation (D & A) Market Development Technology Charges Building Management Costs Professional Fees Other OPEX
Higher Operating Expenses Talent Investment for Future Growth
` (RM mil) 2009 2010
• Higher staff cost due to talent attraction and retention efforts.
• Higher D&A due to accelerated depreciation following the migration from Bursa Trade
Derivatives to Globex.
• Market development cost was higher in 2009 as compared to 2010 mainly due to advisory fees incurred for the Globex implementation project.
• Higher technology charges due to Globex license fee.
RM196.7 mil in 2010 8% (2009: RM182.6 mil)
Staff Cost D&A Market Development
Technology Charges
Building Management
Costs
Professional Fees
Other OPEX
11% 11% 20% 16% 4% 25%

31.2*
51.7
12.1
12.9*
32.0
53.7
13.4
13.4
Net Profit Margin (%) Operating EBITDA Margin (%)
Return on Equity (%) EPS (sen)
19 19
Sustainable Performance Ratios
4%
2009 2010 ̀
* excluding gain on disposal of 25% equity in Bursa Malaysia Derivatives of RM76.0 mil in 2009.
4% 11%

840 852
2009 2010
(RM mil)
453
512
2009 2010
20 20
Strong Reserves
Shareholders’ Fund
Financial Resources Available for Use
(RM mil)
1%
13%
`
The Company has sufficient financial resources to cover its Clearing Guarantee Fund commitment, CAPEX and working capital requirements.
`
21 21
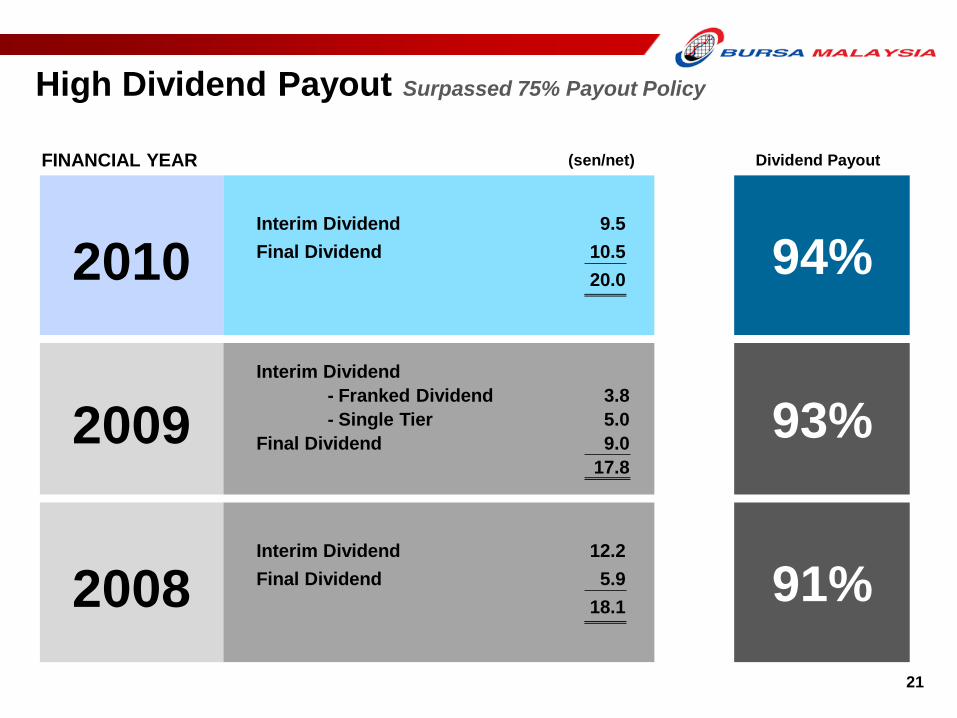
High Dividend Payout Surpassed 75% Payout Policy
(sen/net) Dividend Payout
2010
94%
FINANCIAL YEAR
2009
Interim Dividend 9.5 Final Dividend 10.5
20.0
Interim Dividend - Franked Dividend 3.8 - Single Tier 5.0
Final Dividend 9.0 17.8
2008
91% Interim Dividend 12.2 Final Dividend 5.9
18.1
93%

22 22
Key Focus & Prospect
Key Focus for 2011 23
Positive Prospect & Outlook 24

23 23
Strengthen Equity Market
Expand Derivatives
Market Widen &
Internationalise Islamic Market
TO REMAIN COMPETITIVE IN THE REGION
Key Focus for 2011

24 24
Positive Prospect & Outlook
Barring any adverse developments, we expect an improved performance in our markets and results in 2011.
Potential Market Catalysts
Acceleration in the implementation of various economic transformation programmes.
Greater M&A activities & government transformation programmes. Prospects for further divestments by government-linked companies.
Bursa remains committed in ensuring markets continues to be sustainable and vibrant despite increasing volatility from external factors.
Malaysia’s strong economic fundamentals. Liberalisation efforts by the government. Sustained domestic corporate earnings growth attracting portfolio inflows.
Strong and Solid System
Progressive Developmental
Efforts
We continue to invest in the development of the capital market and the
regulatory environment. And at the same time, putting a close watch on our expenditure.

Thank you
KOAY LEAN LEE [email protected]
603-2034 7306
Disclaimer :
Bursa Malaysia and its Group of Companies (the Company) reserve all proprietary rights to the contents of this Presentation.
Whilst the Company endeavours to ensure that the contents in the presentation booklet are accurate, complete or have been obtained from sources believed by the Company to be accurate and reliable, neither the Company nor the Presenter make any warranty, express or implied, nor assume any legal liability or responsibility for the accuracy, completeness or currency of the contents of this Presentation.
In no event shall the Company be liable for any claim, howsoever arising, out of or in relation to this presentation booklet to the recipient of this presentation booklet and/or to any other third party.
© Bursa Malaysia 2011
INTAN DIYANA TAJUDIN [email protected]
603-2034 7049
INVESTOR RELATIONS CONTACT INFORMATION
E-mail : [email protected] Fax : 603-2026 3684
MUHAMMAD ALI [email protected]
603-2034 7673

26 26
Additional Information
Board of Directors & Shareholdings Structure 27
Securities Market Foreign Ownership 28
Derivatives Market Activity 29
27 27
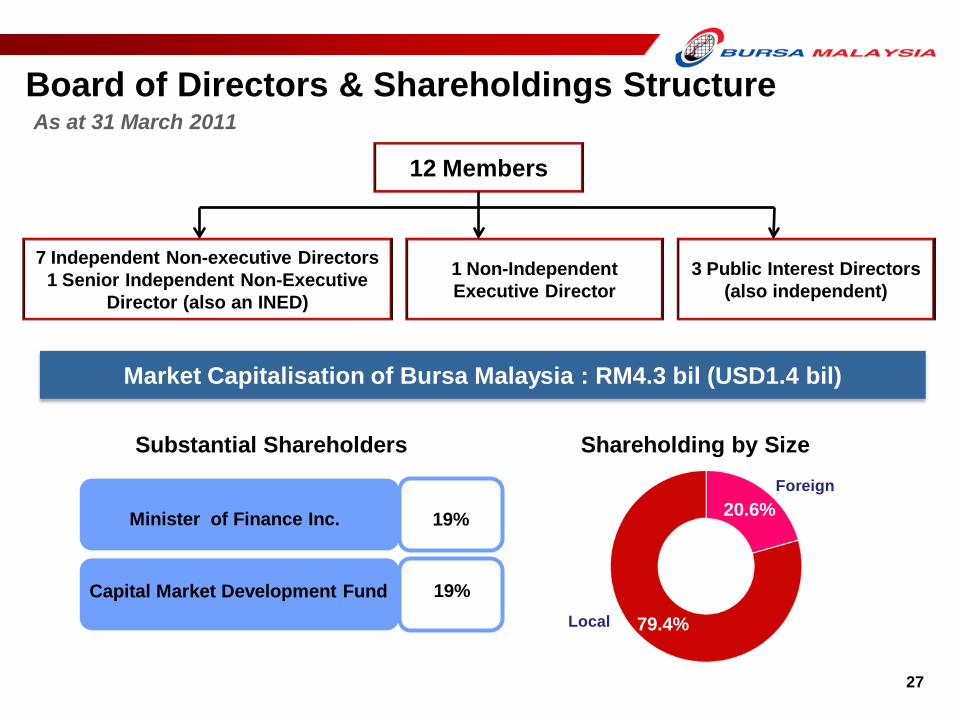
Board of Directors & Shareholdings Structure As at 31 March 2011
12 Members
7 Independent Non-executive Directors 1 Senior Independent Non-Executive
Director (also an INED)
1 Non-Independent Executive Director
3 Public Interest Directors (also independent)
20.6%
79.4%
Foreign
Local
Substantial Shareholders Shareholding by Size
Minister of Finance Inc.
Capital Market Development Fund
19%
19%
Market Capitalisation of Bursa Malaysia : RM4.3 bil (USD1.4 bil)

28 28
7.8%
1.9%
0.9%
0.4%
0.1%
13.2%
Singapore
Hong Kong
UK
USA
Mid-East
Others
25.8%
74.2%
Foreign Ownership by Nationality
Foreign Nominees
Based on Market Capitalisation (as at month end)
26.5
25.7
24.1
21.7
20.9
20.7
20.7
20.9
20.4
20.4
20.6
20.8
21.8
21.9
22.0
21.4
Mar 2011
%
Securities Market Foreign Ownership
1.6% China / Taiwan

2003 2004 2005 2006 2007 2008 2009 2010
49K
66K
85K
159K
125K
156K
123K
29 29
1Q09 2Q09 3Q09 4Q09 1Q10 2Q10 3Q10 4Q10
Derivatives Market Activity
2.0
2.6
2.5 4.
2
6.2
6.1
6.1
Annually (Total, million units)
KLCI Futures
Crude Palm Oil Futures Open Position
Others
29%
24K
29K
24K
70%
Quarterly (Daily Average Contracts 000’)
KLCI Futures
Crude Palm Oil Futures Open Position
Others
22K
132K
6.2
24K
32%
6
6%
25K
23K
28K
139K
122K
136K
156K 148K
117K 142K
124K