bureau of mineral resources, geology geophysics }~1~1:~~;:(l~' … · 2015-12-02 · 11.30...
TRANSCRIPT
}~391~
C(JF:~ ~~
j
- '.
, s
Bureau of Mineral Resources, _
Geology & Geophysics }~1~1:~~;:(l"~'
Record 1989/6
SEISMICITY AND EARTHQUAKE STUDIES
IN THE
AUSTRALIAN PLATE
AND
ITS MARGINS
compiled by
Marion Michael-Leiba
19'8
\
. 11,,,,.. ': .... \ .9~9 C-v. ~ "/
('.(', . A ,,:,) .. ' f.,,'.g '-t~ ... ~

Record 1989/6
SEISMICITY AND EARTHQUAKE STUDIES
IN THE
AUSTRALIAN PLATE
AND
ITS MARGINS
compiled by
Marion Michael-Leiba
III I 1 11 10 Ill 101 11

PREFACE
This record is a compilation of the abstracts of oral and poster papers presented at a symposium held at the Bureau of Mineral Resources, Canberra from 13-16 February 1989. The symposium was entitled "Seismicity and Earthquake Studies in the Australian Plate and its Margins", and was co-sponsored by the Specialist Group on Solid Earth Geophysics of the Geological Society of Australia and the Bureau of Mineral Resources. The abstracts in the Record are in the same order as in the symposium program at the beginning of the Record.

SYMPOSIUM 13-16 FEBRUARY 1989
SEISMICITY AND EARTHQUAKE STUDIES IN THE AUSTRALIAN PLATE AND ITS MARGINS
MONDAY 13 FEBRUARY
09.00 Late registrations
10.00 Morning tea
10.20 D. Denham: Welcome and introductory remarks
Session: Nuclear monitoring (Chair: D. Denham)
10.30 S. Ingate: Nuclear explosion monitoring in the Australian Seismological Centre.
Session: Strain measurements and earthquake prediction. (Chair: D. Denham)
10.55 M.T. Gladwin: Borehole tensor strain measurements from the North Palm Springs 1986 earthquake.
11.20 Quantum video on Dalton-Gunning
11.30 M. Michael-Leiba, V. Klein, J. Weekes and Krayshek: Earthquake swarms as short-term precursors in the Dalton-GunningOolong region, New South Wales.
Session: Experimental Studies (Chair: D. Denham)
11.50 S.J.D. Cox: Experimental Studies of friction of
12.15 Lunch
rocks: implications for earthquake sources.
Session: Stress and focal mechanisms (Chair: M. Gladwin)
13.30 L. Kanter: Seismicity and tectonics of stable continental crust of Australia.
13.55 L.G. Alexander: A plate-tectonic model to predict the state of stress in the lithosphere in an idealised continental intraplate region.
14.20 R. Cuthbertson: Focal mechanisms of earthquakes in south east Queensland.
14.45 T.D. Jones & K.F. McCue: Seismicity and tectonics of the Macquarie Ridge.

-2-
15.10 P. Chopra: Tectonic stress measurements in granites - eastern NSW.
15.25 Afternoon tea
Session: Seismograph networks (Chair: T. Jones)
15.50 D. Denham: The Australian seismographic network 1900-1990.
16.05 L. Drake: Earthquake studies with digital broadband seismographs.
16.30 V.H. Jensen: The Tasmania State Seismic Net.
16.55 D. Love: The South Australian seismic network.
17.20 H. Letz: The Papua New Guinea digital seismic network.
17.45 Drinks & nibbles
TUESDAY 14 FEBRUARY
Session: Strong motion and earthquake risk (Chair: K.McCue)
08.30 B.A. Gau11: Results of strong ground motion attenuation in southwest Western Australia.
08.55 I.A. Mumme & I.D. Hughes: Derivation of response spectra for strong motion accelerograms as well as realistic velocity and displacement information.
09.20 J.M.W Rynn, A. Paynter, W.H. Boyce, J.M. Fenwick & D.J. Williams Uncertainties in seismic risk estimates
for the engineering community - further developments.
09.45 Morning tea
Session: Seismicity and aftershock studies (Chair: M. Michael-Leiba)
10.15 R. Cuthbertson: Geological implications of eastern Queensland seismicity.
10.40 V. Dent: The geographic distribution of Cadoux aftershocks.
11.05 K.F. McCue: Aftershocks of large earthquakes in Australia.

-3-
11.30 J.M.W. Rynn: Earthquake activity in northeastern Australia (Queensland and NE NSW) 1985 through 1988.
Session: Crustal structure and earthquake location (Chair: M. Michael-Leiba)
11.55 B.L.N. Kennett & M.S. Sambridge: Crustal structure, inversion and location of earthquakes in southeastern Australia.
12.20 Lunch
Session: Tennant Creek earthquakes (Chair: J. Rynn)
14.00 T.D. Jones, K.F. McCue, D. Denham, P.J. Gregson, J.R. Bowman & G. Gibson: Three large intraplate
earthquakes near Tennant Creek, 22 January 1988.
14.25 J. R. Bowman, G. Gibson & T.D. Jones: Fault process of the Tennant Creek earthquakes.
14.50 G. Gibson, A. Corke & Z. Demirer: : Triggered digital recording of the Tennant Creek earthquake aftershocks.
15.15 Afternoon tea
15.45 G. Choy & J.R. Bowman: Fault process of the Tennant Creek earthquakes from broadband waveform modelling.
Session: Instrumentation (Chair: G. Gibson)
16.10 V. Wesson, G. Gibson & P. Georgiadis: digital seismograph.
The Kelunji
16.35 V.H. Jensen: Time signal services and how to receive them.
17.00 M. Michael-Leiba: The resuscitation of VNG.
19.30 Symposium dinner - The Athenian Restaurant, 10 Botany Street, Phillip.
WEDNESDAY 15 FEBRUARY
Excursion to Dalton-Gunning region
09.00 Bus leaves BMR building and travels to Dalton-Gunning via Lake George. Inspect Lake George scarp which is no more seismically active than the surrounding region.

-4-
10.30 Inspect the Dalton Gunning zone which has the highest seismic risk of any land area in eastern Australia. Contrast the topography with that of the Lake George scarp. Examine seismic instrumentation and cracked buildings.
12.30
14.00
17.00
17.30
Lunch at Telegraph Hotel, Gunning
Leave Gunning to visit Helms winery (Nanima Creek Vineyard, Murrumbateman.
Arrive back at BMR building
Poster session and light refreshments.
S. Cox: Experimental studies of friction of rocks: implications for earthquake sources.
R. Cuthbertson: Geological implications of eastern Queensland seismicity.
T. Jones: Tennant Creek earthquakes.
L. Kanter: Seismicity and tectonics of stable continent crust of Australia.
S. Spi1iopou1os: An automatic detector and onset time picker for the Warramunga array.
THURSDAY 16 FEBRUARY
Session: Earthquake quantification (Chair: L. Drake)
09.00 D. Denham: A review
09.25 A. Johnston: Magnitude quantification of stable continental earthquakes.
09.50 M. Michael-Leiba: Log linear estimation of earthquake magnitude from isoseisma1s.
10.15 Morning tea
10.45 M. Michael-Leiba & K. Malafant: Attenuation and the ML scale in southeastern Australia.
11.10 B.A. Gau11, P.J. Gregson & K. Ma1afant: Earthquake magnitude scales in Western Australia.
11.35 General discussion.
NUCLEAR EXPLOSION MONITORING IN
THE AUSTRALIAN SEISMOLOGICAL CENTRE
Shane F. Ingate
BMR, Canberra, ACT, Australia
ABSTRACT
The principal tools for monitoring compliance with a CTBT are seismic networks and
surveillance satellites. On-site inspections might also be required to resolve unidentified events.
Satellites are actually of limited use, since it is possible to carry out low-yield explosions in buried
cavities without any visible ground-surface motion resulting, and tests can be associated with mining or
other large-scale industrial undertakings. Seismology provides the principal means of detecting,
locating and identifying underground explosions and of determining their yield. The critical element of
the monitoring system is thus the global network of seismic stations, and the network of in-country
seismic stations.
The underlying theory of this verification mechanism is that underground nuclear explosions
generate characteristic seismic signals, and that a systematic worldwide effort to gather and exchange
detailed seismic data will diminish the likelihood that such signals will go undetected.
In 1976 the Conference of the Committee on Disarmament established an Ad Hoc Group of
Scientific Experts (GSE) to consider and report on International co-operative measures to detect and
identify seismic events to facilitate the monitoring of a Comprehensive Test Ban Treaty (CTBT). The
GSE is now in the process of designing a modem international seismic monitoring system. This system
will include the transfer of both parameter and waveform data from 50 or more seismic stations over
international telecommunications links to international data centres for analysis, in order to locate and
report on seismic events. Large scale testing of the system is scheduled in 1989/90. Australia, a large
"quiet" continent in the largely oceanic southern hemisphere, is in a position to make a significant
contribution to such a monitoring system.

At the Australian Seismological Centre (ASC) in Canberra, facilities are being established to
operate an independent national capacity to identify nuclear explosions; and to operate an international
data centre to assist in the co-operative monitoring of seismic events.
Currently the digital outputs of all of the Alice Springs (ASAR) and Tennant Creek (WRA)
seismic arrays, and the seismic stations at Charters Towers (CTAO), Toolangi (TOO), Woomera (WRG)
and Mawson (MAW) are transmitted to the ASC over either dedicated landlines or satellite. Using only
the above seismological stations, the current capabilities for nuclear event detection for the main test
sites are: Mururoa and E. Kazakhstan, a few kilotonnes; Nevada Test Site, 10 kilotonnes.
The digital format of the telemetered data allows real-time on-line storage, processing, analysis
and archival on the ASC computers which consist of a Pyramid 9810 supermini, two Sun 3's and 3 Sun
2 workstations. The computer and workstations are linked by Ethernet. The current throughput of data
that is automatically analysed by the computers for detections and event locations is around 350
Mbytes/day. In the near future, an additional three stations, Stephens Creek, Kalgoorlie and Christmas
Creek will be telemetered into the ASC for the purpose of nuclear monitoring. It is anticipated that the
number of stations that will be digitally telemetered into the ASC may exceed 20. These data, and
associated detection/location files, will be available to users throughout Australia and the world.

BOREHOLE TENSOR STRAIN MEASUREMENTS from the
NORTH PALM SPRINGS EARTHQUAKE of July 8, 1986.
M. T. Gladwin, R. G. Hart and R. L. Gwyther Department of Physics, University of Queensland,
S1. Lucia, 4067; (07 3772473)
Borehole tensor strain measurements at Pinon Flat observatory in southern California appear to demonstrate that the North Palm Springs earthquake (July 8, 1986, ML = 5.9, /).= 45km) was accompanied by a static principal strain offset at Pinon Flat of P1 = -32ne , P 2 = +76ne, and azimuth (P 1) = N 79° E, with the usual convention of negative compression. These figures were compared with the predicted offsets of of a series of models using seismic and other data which indicate expected strains of P 1 = -26n e , P 2 = 132n e, and azimuth N 62° E. The predicted strains are highly sensitive to geometry of the fault plane and the data allow additional constraints on the fault parameters to be derived. The observed strains are incompatible with a dislocation surface located symmetrically around the epicentre, and the reported moment is larger than is necessary to explain the data.
Modelling of the event indicated that the estimated moment should be reduced to approximately 1.1 x 10¹⁸ Nm, that the strike plane should be rotated to N 700 W, that the centroid of the dislocatiop surface should be moved about 5 km along strike to the south east, an'l that about 200 rake (reverse dip slip) is necessary to produce the observec data set.
Calibration of the strain meter at this site has been performed by comparison of tidal observations with the laser strain meter for several tidai components.
The event was also accompanied by a significant change in the long term strain rate for the area. The long term data set covers the interval October 1983 to the present. Prior to the North Palm Springs Earthquake, strain at the site indicated a well defined accumulation of maximum shear strain rate of O.5Jle per annum. At the time of the event this changed to less than O.lJ..Le per annum and remained at this figure until mid 1987, when a further change in shear occurred.
The tidal response of the strain meter compared before and after the event indicates that no significant change of coupling conditions have occurred at the site. Correct observation of co-seismic strain offset, and unchanged tidal response indicate that the regional strain field has been adequately monitored over this interval of time.
The data suggest that regional strain fields are not constant with time, and that arrays of continuous strain instrumentation could be expected to provide valuable secular strain rate data and also constraints for source process modelling.

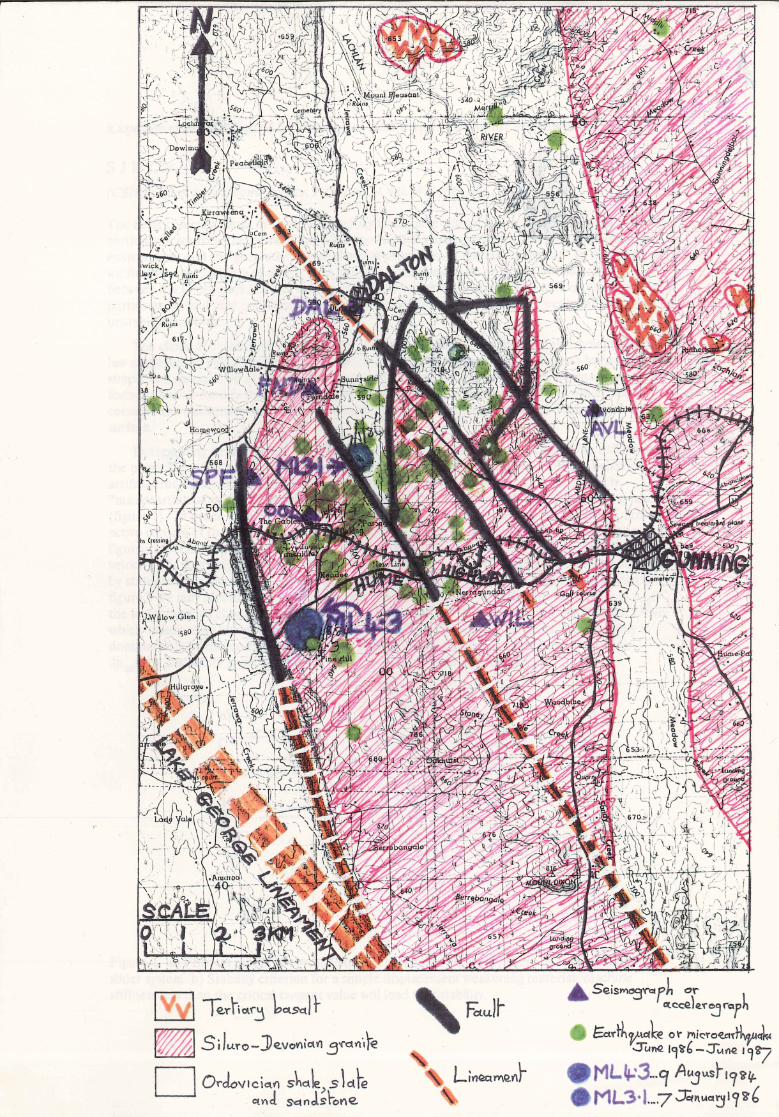
EARTHQUAKE SWARMS AS SHORT-TERM PRECURSORS IN DALTON-GUNNING-OOLONG AREA, NEW SOUTH WALES
Marion Michael-Leibal , Vicki Klein2 , Janet w3ekes3 and Clementine Krayshek
The Dalton-Gunning seismic zone, New South Wales, has the highest earthquake risk of any land area in eastern Australia. While earthquakes occur throughout the zone, the highest concentration of seismicity is in the Dalton-Gunning-Oolong region. The geological sketch map shows that the events occur near the faulted northern margin of the Gunning Batholith. The area has not been mapped geologically in detail, and this map was compiled from Simpson (1974), from the 1:250 000 NSW Geological Survey map sheet of the area, and by examination of a Landsat photo and the 1:100 000 Gunning topographic map sheet.
From 1 January 1960 - 30 June 1987, 29 swarms and swarm groups were identified in the Dalton-Gunning-Oolong region, 34.70-34.86°S, l49.ll-l49.26
oE. Sixteen of these were followed by larger events
related to them. We define a swarm to be a series of events with the difference in Richter magnitude between the largest and third largest being no more than 0.9 and with the three largest events occurring in the same 24 hour period. If11 is the mean Richter magnitude of the three largest events of a swarg and M is the magnitude of the subsequent main shock, then the 16 caWes fit the regression
Mm = (0.93 ± 0.18) 11p + (0.92 ± 0.36)
Fourteen of the 16 swarms were followed by a main shock within 60 days, so there is a probability of about 48% that any swarm will be followed by a related main shock within this time period. This is more useful than earthquake risk statistics for forecasting events with 2.6~ ~3.6, as the largest event related to a precursory swarm had magni~ude ML3.6.
However, many events, including the only two potentially damaging earthquakes in the region since the commencement of detailed seismological recording, would not have been forecast by swarms.
Reference:
Simpson, G.B. 1974: Measurement of earth movements in the Gunning/Dalton area, NSW - Report of feasibility investigation, 1971. Bureau of Mineral Resources Record 1974/95 (unpubl.).
1 Australian Seismological Centre, Bureau of Mineral Resources, GPO Box 378, Canberra, ACT, Australia, 2601
2 Upsan Downs, Dalton, NSW, Australia, 2581
3 Research School of Earth Sciences, Australian National University, PO Box 4, Canberra, ACT, 2601
Experimental studies of friction of rocks: implications for earthquake sources
S J D Cox
(CSIRO Division ojGeomechanics, P.O. Box 54, Mt. Waverley, Vic. 3149)
The most common cause of shallow seismicity is unstable slip on faults. Physical models of earthquake sources, therefore, comprise a mechanical system including the remote loading environment and the geometry and mechanical properties of the fault segment. In this framework we find that the stability of sliding on a fault is constrained quite generally by the coupling between the loading system and the constitutive description of shear resistance on the fault. In particular we find that only forms involving either displacement or velocity weakening can lead to unstable behaviour.
The classical description conforming to this requirement is the simple static-dynamic friction law suggested to explain observations of stick-slip friction. More recently this has been seen simply as a special case of a general state-dependent frictional behaviour. In the more general formulation we modify the first order Amontons' law with second order effects which also consider the instantaneous sliding velocity as part of the complete history of deformation on the surface.
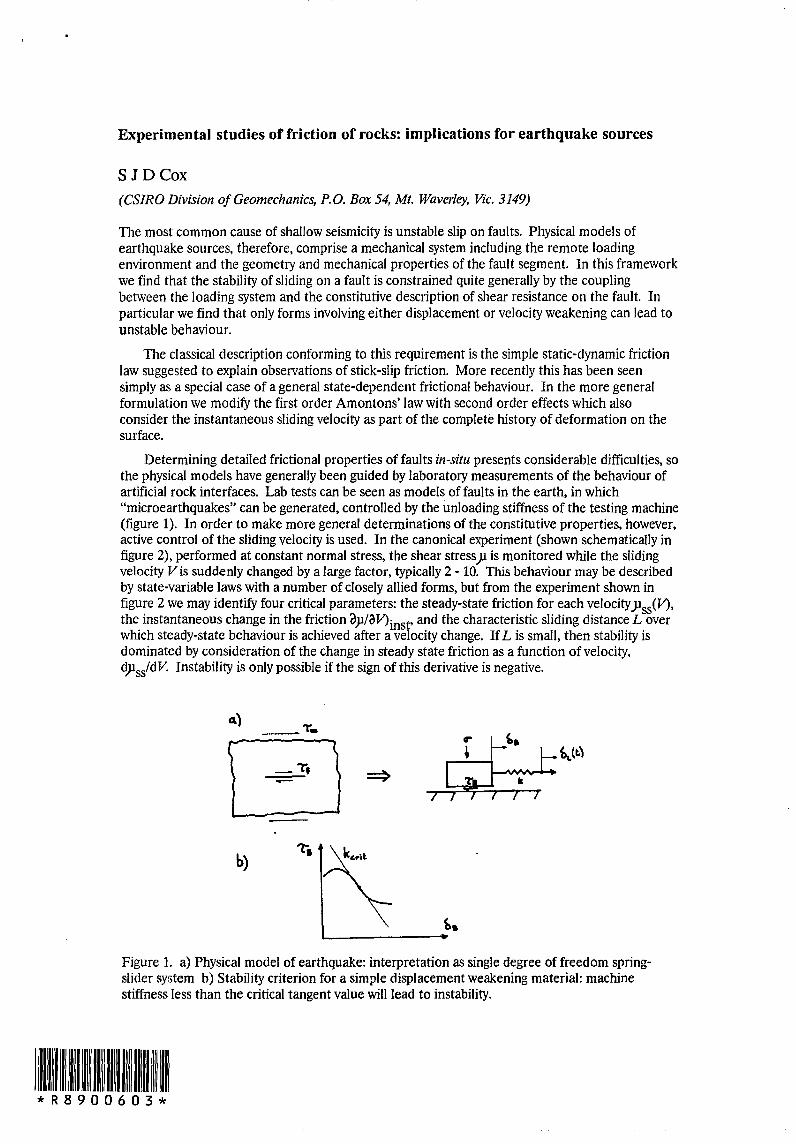
Determining detailed frictional properties of faults in-situ presents considerable difficulties, so the physical models have generally been guided by laboratory measurements of the behaviour of artificial rock interfaces. Lab tests can be seen as models of faults in the earth, in which "microearthquakes" can be generated, controlled by the unloading stiffness of the testing machine (figure 1). In order to make more general determinations of the constitutive properties, however, active control of the sliding velocity is used. In the canonical experiment (shown schematically in figure 2), performed at constant normal stress, the shear stress)l is monitored while the sliding velocity Vis suddenly changed by a large factor, typically 2 - to. This behaviour may be described by state-variable laws with a number of closely allied forms, but from the experiment shown in figure 2 we may identify four critical parameters: the steady-state friction for each velocity )lss(V)' the instantaneous change in the friction ~)l/aV)inst. and the characteristic sliding distance Lover which steady-state behaviour is achieved after a velocity change. If L is small, then stability is dominated by consideration of the change in steady state friction as a function of velocity. dps/dV. Instability is only possible if the sign of this derivative is negative.
_T_
=>
b)
Figure 1. a) Physical model of earthquake: interpretation as single degree of freedom springslider system b) Stability criterion for a simple displacement weakening material: machine stiffness less than the critical tangent value will lead to instability.
1111 HIIIII *R8900603*

Experiments have been performed by different workers in a variety of configurations, which has led to some difficulty in comparing results. However, most observations can be summarized as follows: (i) L is (at least initially) larger for rougher starting surfaces; (ii) dJlss/dVis negative for bare surfaces or thin and immature gouge layers, and positive for thick gouge layers. Within this broad framework, unresolved areas include the systematic effects of (i) normal stress (ii) absolute sliding velocity (iii) total accumulated displacements.
fT b)
L ,
"':-V
"",. 17_ v. ... I
i
~) . (v.:v,) ;,v . It ...
Figure 2. a) Idealized sliding experiment b) Change in shear stress during a sudden velocity change.
We have been using a servo-controlled biaxial loading frame to perform direct shear experiments on a large (250 x 400 mm) artificially prepared rock interface over very large total displacements (m's) under low normal stresses «10 MPa) during velocity stepping experiments over the range l}lffi/s - 300Opmls. Data taken on a mature surface containing a thin layer of very fine debris worn from the surfaces confirms the general form of the stress changes described above, with steady state velocity weakening behaviour seen over the whole range of sliding velocities, though the effect is at the lower end of the range observed by other workers.
We also have made direct observations of the relative separation of the surfaces during sliding. So far we have been unable to measure any dilatancy effects associated with the velocity and stress changes, down to a detection threshold of -l)1m. However, since the steady-state shear stress changes are only of the order of 0.3%, and the gouge layer is <50Opm thick, we might expect the effect to be smaller than this.
Overall, these data indicate that velocity weakening friction may persist to very large displacements on simple faults under low stresses. However, taking the small magnitude of the effect together with the data reported for thick gouge, the potential for instability due to the frictional properties appears to diminish as a fault system matures.
SEISMICITY AND TECTONICS OF STABLE CONTINENTAL CRUST OF AUSTRALIA
Lisa R. Kanter, Center for Earthquake Research and Information, Memphis State University, Memphis, TN 38152, U.S.A.
As part of a worldwide study of stable continental seismicity, we have defined stable continental crust in a more restrictive way than the usual'definition of an intraplate region. We exclude not only active plate boundary zones, but certain formerly active zones as well. Orogenic belts with activity continuing into latest Cretaceous or Paleogene are excluded, as are extensional or strike-slip zones with Neogene activity. Rifted continental margins in the active rift phase are excluded while those that are in the drift phase are generally considered stable continental crust.
Nine stable continental regions were defined. Stable Australia includes all of Australia as well as part of New Guinea and the intervening shelf. It is surrounded on three sides by passive margins, and the edge of stable crust is considered to be at the continental-oceanic crust boundary. To the north stable crust is limited by the active convergence zones of New Guinea and Timor. Through New Guinea the boundary runs slightly south of the southern limit of thrust faults, then bends south of the Aru basin and along the edge of the Timor Trough.
Basement ages, ancient rifts and sutures, and extended crust of passive margins create a tectonic basemap for analysis of Australian stable continental seismicity. For seismogenic purposes, we define age of basement as the age of the youngest penetrative deformation. Historical and instrumental events were compiled and assigned a moment magnitude, M, according to a uniform magnitude scale developed for this study. In attempting to make the data base as complete as possible down to M=5, all events with any magnitude 2: 5 or M]v! I 2: VII were considered. The completeness of the resulting list is temporally and spatially variable and depends on several factors. Reported Australian seismicity should be complete to M=5. Events with M2: 4.5 are plotted on the tectonic basemap.
Earthquakes that are located at the edge of stable continental crust are classified as transitional and are plotted in gray. Zones along boundaries with unstable crust are probably influenced by stresses in those unstable regions and not representative of stable continental crust. We consider continental-oceanic boundary events, however, to be representative of stable crust, although of uncertain crustal type.
In stable Australia, as in other stable continental regions, low magnitude (4.5-5.5) seismicity occurs in almost any tectonic setting. Certain ancient rifts (Adelaide, Amadeus, Fitzroy) and extended crust of the passive margins have concentrations of intermediate magnitude activity. Australia has an unusually high amount of intermediate to large magnitude seismicity in apparently long-quiescient basement blocks. The very largest events occur in highly extended crust. The 1906 Exmouth Plateau event (M=7.2) and the 1951 South Tasman Rise event (M=7.0) are both located on Mesozoic margins very close to the continental-oceanic boundary. Worldwide, nearly all of the largest earthquakes occur in either passive margins or ancient rifts, perhaps implying that extended crust is particularly susceptible to later reactivation under appropriately-oriented stress regimes.

A PLATE-TECTONIC MODEL TO PREDICT THE STATE OF STRESS IN THE LITHOSPHERE IN AN IDEALISED CONTINENTAL INTRAPLATE REGION
* by L.G. Alexander
In order to explain the predominantly high horizontal compressive stress reported from in-situ measurements in different countries, and its variation with depth below the ground surface, a model to represent the mechanism of stress development in an idealised lithospheric plate was investigated.
The plate is under horizontal compression from the hydrostatic pressure of the relatively low-viscosity support medium. The total compressive force is distributed in the plate according to the stress-deformation characteristics of its two layers.
The lower and thicker layer is viscous and suffers a sustained rate of strain excepting when in viscostatic equilibrium with horizontal stresses equal to vertical gravity stress at all depths. The upper layer is brittle, and can suffer earthquakes on faults suitably inclined to the stress field, when stresses attain the Coulomb-Mohr criterion. The criterion is supplemented by a hypothesis on rates of strain, relative to greatest, intermediate, and least components of the stress field.
The requirement of isostatic equilibrium of the plate on the support medium constrains the densities of the plate layers such that the pressure in the support medium exceeds the gravity stress in the plate at all depths, excepting at the plate base. There is an excess horizontal compression over that required for viscostatic equilibrium of the lower layer, The excess compressive force is shed to the upper layer, which commences to fail. If the failure criterion is exceeded at all depths of the upper layer, both layers contract at a sustained rate.
The force differences that cause plate drift are modelled so that plate compression is lower if it is associated with a higher drift rate and major horizontal plate stress is in the direction of lower drift rate.
The results are compared with the overall trend of in-situ measurements in different continents.
* Post Retirement research fellow, Division of Geomechanics, CSIRO. Present address: Australian Seismological Centre, BMR
Canberra City ACT 2601.
FOCAL MECHANISMS OF EARTHQUAKES IN SOUTHEAST QUEENSLAND
by Russell J. Cuthbertson Queensland Department of Mines
Focal mechanism studies of 68 well located earthquakes in southeast Queensland indicate the crust is being compressed in a northeast-southwest direction.
Focal mechanisms have been used since the early 1920's in an attempt to discover more about the earthquake source, in particular the fault orientation and the causative stress field. To obtain a satisfactory earthquake focal mechanism requires knowledge of the earthquake location and the local crustal structure. The two orthogonal planes dividing compressional and dilatational first motions are the fault plane (x 1 = 0) upon which motion occurs, and the auxilary plane (x t = 0) which is perpendicular to the motion in the fault plane. The choice of whIch of the two planes is the fault plane and which is the auxllary cannot be made from first motion data alone.
If the earthquake occurs in an homogenous material then the principal stress (51) must lie on the third orthogonal plane (x3 = 0), in the dilatational quadrant and at an angle to the fault plane of 45° or less (Anderson, 1951). The internal coefficient of friction of the material accounts for deviations from 45°.
The low stress-drops observed in shallow earthquakes, being too small by an order of magnitude to produce fracture in homogenous material, indicate that earthquakes occur on pre-existing faults (Chinnery, 1964; Brune & Allen, 1967; Wyss & Brune, 1968). In a uniaxial stress field (52 = 53) the principal stress will still lie on the x3 = 0 plane (Mackenzie, 1969). The angle between the fault plane and the principal stress is now dependent upon the relative orientation of the two, with only favourably orientated faults being re-activated.
For the case of a triaxial stress field (52/:. 53) it has been shown that 51 can be anywhere in the dilatational quadrant (Mackenzie, 1968). This is clearly not much use in estimating the orientation of 5 l' Various statistical techniques can be used to obtain stress fields from a family of focal mechanism solutions (Gephart & Forsyth, 1984; Angelier et al., 1982) but the simplest method is to find the area which is common to all dilatational quadrants; the principal stress 51' must lie in this range (Carey-Gailhardis & Mercier, 1987).
Application of focal mechanism theory to Queensland involved selecting a set of well located earthquakes. The Wivenhoe Dam network which has been operating in southeast Queensland since 1977 provided 68 well located earthquakes. From these 68 events 226 first motions were measured.
Inadequate station distributions meant that focal mechanisms for individual events could not be obtained and so a composite focal mechanism solution was attem pted. This method requires a uniform stress field over the area and earthquakes either on a single fault plane or on faults with identical orientations. Earthquakes were grouped into zones based on geographical locations and a composite focal mechanism attempted for each zone.
The better constrained solutions of some zones were used as a guide in selecting solutions for the other zones. In this manner a set of focal mechanisms were obtained such that not only did the dilatational quadrants have a 100% intersection but the axes (x.3 = 0) of each solution roughly intersected at a point. The simplest explanatiOn is that the stress field in southeast Queensland is essentially uniaxial with a principal stress acting horizontally in a northeastsouthwest direction.
ANDERSON, E.M., 1951: The Dynamics of Faulting. Edinburgh, Oliver and Boyd.
ANGELlER, J., TARANTOLA, A., VALETTE, B., & MANOUSSIS, S., 1982: Inversion of field data in fault tectonics to obtain regional stress. I. Single phase fault populations: A new method of computing the stress tensor. Geophysical Journal of the Royal Astronomical Society, 69, 607-621.
BRUNE, J.N., & ALLEN, C.R., 1967: A low-stress-drop low-magnitude earthquake with surface faulting: The Imperial, California earthquake of March 4, 1966. Bulletin of the Seismological Society of America, 57, 501-514.
CAREY-GAILHARDIS, E., & MERCIER, J.L., 1987: A numerical method for determining the state of stress using focal mechanisms of earthquake populations: Application to Tibetan teleseisms and microseismicity of Southern Peru. Earth and Planetary Science Letters, 82, 165-179.
CHINNER Y, M.A., 1964: The strength of the Earth's crust under horizontal shear stress. Journal of Geophysical Research, 69, 2085-2089.
GEPHART, J.W., & FORSYTH, D.W., 1984: An improved method for determining the regional stress tensor using earthquake focal mechanism data: Application to the San Fernando Earthquake sequence. Journal of Geophysical Research, 89, 9305-9320.
McKENZIE, D.P., 1969: The relation between fault plane solutions for earthquakes and the direction of the principal stress. Bulletin of the Seismological Society of America, 59, No.2, 591-601.
WYSS, M., & BRUNE, J.N., 1968: Seismic moment, stress and source dimensions for earthquakes in the California-Nevada region. Journal of Geophysical Research, 73, 4681-4694.

SEISMICITY AND TECTONICS OF THE MACQUARIE RIDGE
T.D. Jones & K.F. McCue
Australian Seismological Centre, Bureau of Mineral Resources, Geology & Geophysics
The Macquarie Ridge is an arcuate ridge-trench complex which extends over 1200 km from southern New Zealand to a triple junction of the Pacific, Australia and Antarctic plates near 61.5°S, 161.00E. It was formed by oblique compression of the Australian and Pacific plates near to their common boundary. Trench crossings through the ridge at about 51 oS and 56°S divide it into northern, central, and. southern ridge segments.
Large earthquakes Clccur frequently on the ridge, with an average return period of one year for an event of magnitude 6.2 or more and 10 years for one of magnitude 7.2 or more. Post-1962 earthquakes form a single narrow band some tens of kilometres wide and all earthquakes are shallow, unlike some in the adjacent Fiordland of southern New Zealand where there is active subduction. Expeditioners at Macquarie Island in the central ridge segment are exposed to a greater earthquake hazard than most other Australians.
Analysis of 24 focal mechanism solutions indicates that the direction of the principal stress is consistently horizontal, and along the northern and central ridge segments it strikes approximately east-west. In the southern ridge segment, the mean azimuth of the P-axes from focal mechanisms is N32°E. Along the entire length of the ridge, mechanisms indicate either reverse dip-slip faulting normal to the ridge axis or right-lateral strike-slip parallel to the ridge axis. However, north of 51 oS the characteristic fault displacement is by thrusting, whilst south of 51°S, fault motion is predominantly by right-lateral strike-slip. Fault displacements are consistent with an anti-clockwise rotation of the Pacific plate around a pole of rotation east of the southern ridge segment, as suggested by other authors. Gravimetric and topographic evidence suggest that the ridge is in a state of incipient sub:1uction.

Tectonic stress Measurements in Granites, Eastern NSW
P.N. Chopra Bureau of Mineral Resources, Geology and Geophysics Canberra ACT 2601
Measurements of the tectonic stress field have been made in boreholes drilled in granitic rocks at three locations in eastern New South Wales. The sites are at Berrigan in the Riverina, Oolong in the DaltonGunning seismic zone and Eugowra south-east of Forbes. The stress data have been obtained using the hydraulic fracturing technique at depths between 4 and 168 metre below ground level.
Significant tectonic stress magnitudes have been recorded at all three sites and, in each case, the state of stress has been found to be strongly non-hydrostatic. The orientation of this non-hydrostatic stress field has been found, for the most part, to be oriented in a consistent fashion at all three sites. In each case, the maximum principal stress direction has been found to be north of east.
In the Berrigan and Eugowra boreholes, where measurements have been made at a number of depths, pronounced trends of increasing tectonic stress with depth have been observed (see Figures 1 and 2). These trends are modified to a degree in places by open fractures which act as mechanical discontinuities effectively isolating parts of the rock column from each other.
At Berrigan, high tectonic stresses in the very near surface are indicated by the presence of a "pop-up" in the granite outcrop. These high stresses are also reflected in the results of the measurements at 4 metre depth. The high stresses measured at Berrigan are also in accord with the area's record of previous seismicity, with a magnitude 5.5 earthquake recorded in the vicinity in 1938.
At Eugowra, unlike Berrigan, the non-hydrostatic stresses appear to increase at a rate faster than that of the lithostatic component of the stress field down to depths of at least 150 metre.
The results obtained at Eugowra define two distinct stress regimes separated by a series of open fractures at 106 metre depth. These fractures effectively decouple the overlying rock from the long-range stress field with the result that the stress measurements above this depth are much smaller in magnitude and differently oriented to those obtained at greater depths. As a consequence of this decoupling, the underlying column of rock between 106 m and another fracture at 114 m is currently being subjected to relatively higher stress levels than it might otherwise have been.
The intensification of local stresses in this way by mechanical discontinuities may have important implications for earthquake mechanisms in the upper crust.

111.0*1
11
111111
11
I
1
I^11^11^1I1
//
IMO
• *T•1^11^11^1
11^
I1
11^1
.^.... .
1^11^11^11^1
1
1^1 .......... . I
C)-2 \
0-v
100
110
120
130
140
150
4^
6^8^10^12^14
Stress in MPa 0^5^10^15^20
Stress in MPa
Figure 1 ^
Figure 2 Berrigan, NSW^
Eugowra, NSW
Plots of in-situ stress data versus depth in granites attwo sites in eastern NSW. Also shown are the locations ofzones of natural fracturing (dotted lines) as revealed bycore recovered from the boreholes and/or from geophysicalwell-logging data. The fracture zones can be seen inplaces to magnify the long range tectonic stress field tolocally high values (see text).
o
50 -(I) ~ ..-(I)
E -.c. 100 ..-C. (I)
Q
150
200
' .. ::.: .. :: .. :;:.:.;: .. _: .. :;:.;:.:.:.::.:.:.:.:.:.:.:':':':':';:':'::':':':':':':':':"::':';:":;:~'.'.:.:.'.:: .. :.;:.:.;:,::.:.:.:,:;: .. :: .
.·.::·.?t:·.::·.:::::::·.::·.::·.:·.::·.::·.:~K.·.:·.·.: .... : .. :::: .. :: .. :: .. : .... : .. : ... : .... : .... : .. : .. :: .. ::.' \ \ \ h p or
......... ~\ .............................. \ ....................................... . \ \
.......... ~ ................................. ~ .... ~ ............................. . \ \ \ \ \ \
---I • • \ \ \ \ \ \
_\ ~ \ \
:::::::::::::=::::\:::::::::.~ .. : ... : .. :.:.:~\:::\6:.:::::::.:::.' , \ \ \
4
\ \.. \ +-+ \ \ \ \ \ \ \ G2 \ \ \
\CYv \ \
6 8 10 12
Stress in MPa
Figure 1 Berrigan, NSW
14
100
110
120
130
140
150
\ \ \ \ \ \ \ \ ~ I , / \ \ /
::::::.:\.::.:.::::~::::::::::::::::::::::::.::::::::::::'::::::::::"::::::.:::::::: \ ". ----.. \ , '-\ .................... -..------.. I •• .-=---. \ ········T············································· ................................. .
I .. +-j+ \ \ \ I \ \ I \ \ I \ \ I \ \ I \ \
\ \ \\ .:.:.:.::.:.:.:.:.:.:.:.\:.:.:.:.:.:.:.:.:.:.:.:.::.:.:':'::':':':':':'~':':':":'.:.:.:.:.: .. ":':':':':':':.:.::.:.:::.:.:.:.:.:.:.:.:.:,.:.:.:.:.:.:.:.:.:.:.:.:.:.:-:
\ \ \ I \ \ I \ \ I \ \
::::::::::::::::::::::::\::::::::::::::::::::::::::::::::::::::::::::::::::\::::::::::::::::::::::\::::::::::::::::::::::::::::::::::::::::::::::::::::::::::::::
\ \ :·:·:·:·:·:·:·:·:·:·:·:·:·:·t·:·:·:·:·:·:·:·:·:·:·:·:·:':':':':-::'::'::':':':y':':':':':':':':':':-:':\':':':.:.:.:.:.:.:.:.:.:.:.::.::.:.:.:.:.:.:.:.:.:.:.:.:.:.
I \ \
o
\ 02\ \ 01 \ ~ ~ 10-
V
5 10 15
Stress in MPa
Figure 2 Eugowra, NSW
20
Plots of in-situ stress data versus depth in granites at two sites in eastern NSW. Also shown are the locations of zones of natural fracturing (dotted lines) as revealed by core recovered from the boreholes and/or from geophysical well-logging data. The fracture zones can be seen in places to magnify the long range tectonic stress field to locally high values (see text) .
AUSTRALIAN NETWORK
David Denham (Australian Seismological Centre, Bureau of Mineral Resources, P.O.Box 378, Canberra, ACT, 2601).
The permanent Australian national seismographic network is designed for three main purposes:
(1) to locate all earthquakes in the Australian region with magnitudes of three and greater,
(2) to have a national capacity to detect and identify underground nuclear explosions in a timely manner, and
(3) to provide information for global seismological studies, as Australia's contribution to international seismology.
At present there are just over 100 permanent seismographs operating on the Australian continent. These were set up for a variety of reasons, such as the monitoring of regional seismicity, nuclear explosions, and reservoir induced earthquakes. The current network has the capacity of locating earthquakes of M >3 over approximately 70 percent of the continent. To complete the network, so that the coverage is complete down to MI =3, seven more stations are required. These are needed in the central, western and northern parts of the continent.
The most powerful seismic detectors are the arrays near Alice Springs and Tennant Creek (WRA) in the Northern Territory. With appropriate beamforming techniques, these arrays have equivalent magnifications of over half a million and, on average, can detect ~<4 events and to about 55
0. These sensors are the main detectors used to monitor
nuclear explosions.
There are a number of world standard and broadband stations operating in Australia. The table below gives the present deployment:
WWSS: DWWSS: SRO: Guralp: Iris: Geoscope: IDA:
Adelaide, Mundaring, Riverview Hobart Alice Springs, Narrogin Charters Towers, Mawson (Antarctica) Charters Towers Canberra Adelaide.
Plans are in train to install six more broadband Guralps throughout the continent during the next three years and to transmit the data from these stations to Canberra in real time either via satellite or telephone links.

EARTHOUAKE STUDIES WITH DIGITAL BROADBAND SEISMOGRAPHS
Lawrence A. Drake School of Earth Sciences
Macquarie University NSW 2109
A short period digital network is operating in Japan and a broadband digital network of nine stations has been operating in the people's Republic of China since 1985. In Central California the Berkeley Digital Seismic Network (BDSN) has three-component broadband instruments operating at Berkeley (BKS), Columbia College (CMB), San Andreas Geophysical Observatory (SAGO) and Mount Hamilton (MHC). For the whole of US a National Seismic Network (USNSN) of approximately 150 three-component broadband digital stations is being developed; 13 of these stations are to be in California.
The BDSN has a bandwidth of 0.01 Hz to 5 Hz. At present the 96 dB dynamic range (4.6 orders of magnitude) of the system is determined by the 16-bit resolution of the AID converter. The Streckeisen seismometers have a dynamic range of approximately 140 dB over the period range 0.2 s to 130 s and a present priority is to install 24-bit digitizers with 144 dB range.
The planners of the USNSN are writing about a bandwidth of 0.01 Hz to 30 Hz and a dynamic range of up to 10 orders of magnitude. Data from the stations are to be transmitted via satellite telemetry (Ku band, 14-16 GHz) to a central recording site in Golden, Colorado. The required dynamic range, linearity and bandwidth of the seismometers necessitates the use of force balance sensors. Two sets of seismometers (a high and low gain sensor for each component) will be required. Data streams will be triggered and recorded only during the arrival of significant phases.
THE TASMANIA STATE SEISMIC NETWORK
V.H. JENSEN Geology Department, University of Tasmania
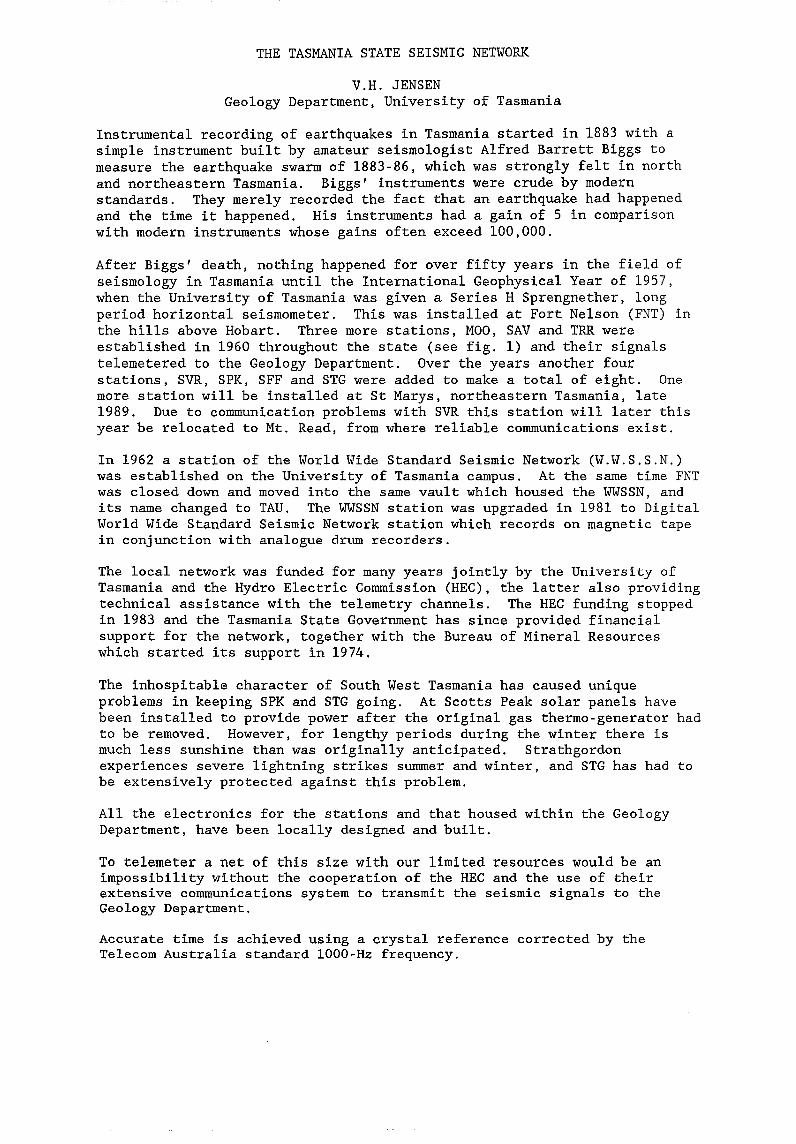
Instrumental recording of earthquakes in Tasmania started in 1883 with a simple instrument built by amateur seismologist Alfred Barrett Biggs to measure the earthquake swarm of 1883-86, which was strongly felt in north and northeastern Tasmania. Biggs' instruments were crude by modern standards. They merely recorded the fact that an earthquake had happened and the time it happened. His instruments had a gain of 5 in comparison with modern instruments whose gains often exceed 100,000.
After Biggs' death, nothing happened for over fifty years in the field of seismology in Tasmania until the International Geophysical Year of 1957, when the University of Tasmania was given a Series H Sprengnether, long period horizontal seismometer. This was installed at Fort Nelson (FNT) in the hills above Hobart. Three more stations, MOO, SAV and TRR were established in 1960 throughout the state (see fig. 1) and their signals telemetered to the Geology Department. Over the years another four stations, SVR, SPK, SFF and STG were added to make a total of eight. One more station will be installed at St Marys, northeastern Tasmania, late 1989. Due to communication problems with SVR this station will later this year be relocated to Mt. Read, from where reliable communications exist.
In 1962 a station of the World Wide Standard Seismic Network (W.W.S.S.N.) was established on the University of Tasmania campus. At the same time FNT was closed down and moved into the same vault which housed the WWSSN, and its name changed to TAU. The WWSSN station was upgraded in 1981 to Digital World Wide Standard Seismic Network station which records on magnetic tape in conjunction with analogue drum recorders.
The local network was funded for many years jointly by the University of Tasmania and the Hydro Electric Commission (HEC) , the latter also providing technical assistance with the telemetry channels. The HEC funding stopped in 1983 and the Tasmania State Government has since provided financial support for the network, together with the Bureau of Mineral Resources which started its support in 1974.
The inhospitable character of South West Tasmania has caused unique problems in keeping SPK and STG going. At Scotts Peak solar panels have been installed to provide power after the original gas thermo-generator had to be removed. However, for lengthy periods during the winter there is much less sunshine than was originally anticipated. Strathgordon experiences severe lightning strikes summer and winter, and STG has had to be extensively protected against this problem.
All the electronics for the stations and that housed within the Geology Department, have been locally designed and built.
To telemeter a net of this size with our limited resources would be an impossibility without the cooperation of the HEC and the use of their extensive communications system to transmit the seismic signals to the Geology Department.
Accurate time is achieved using a crystal reference corrected by the Telecom Australia standard lOOO-Hz frequency.
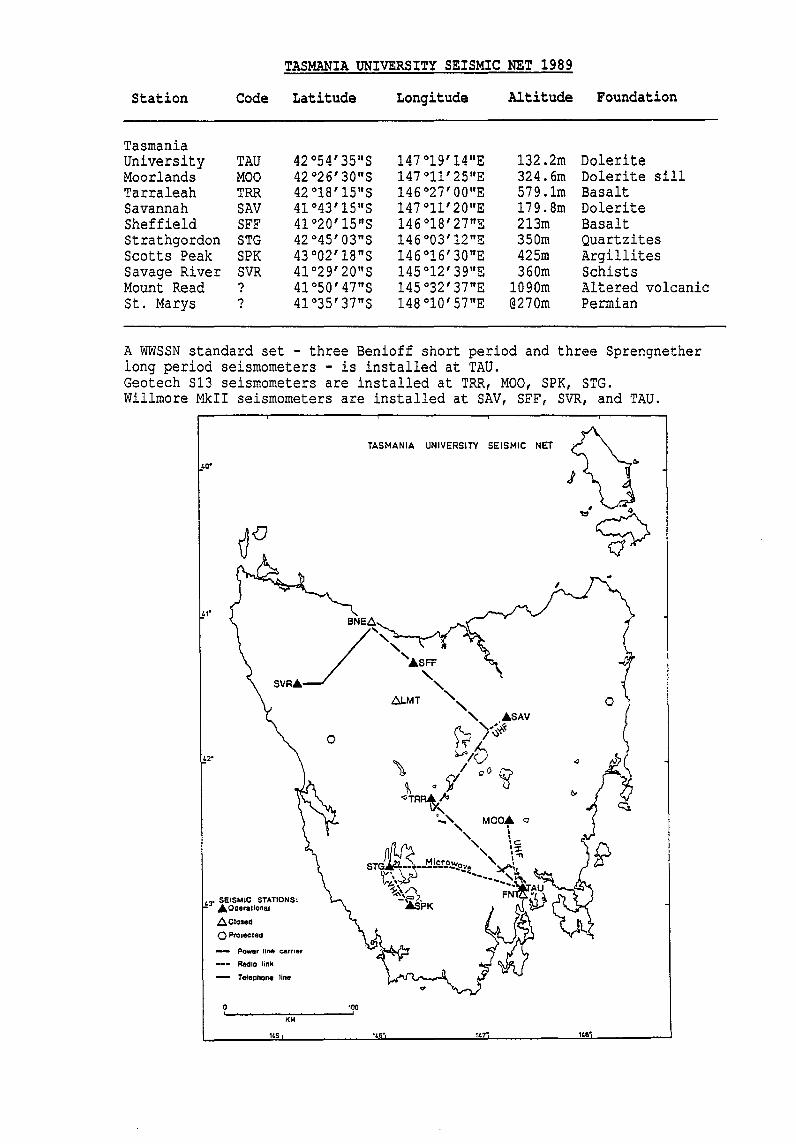
TASMANIA UNIVERSITY SEISMIC NET 1989
Station Code Latitude Longitude Altitude Foundation
Tasmania University TAU 42 °54' 35"S 147 °19' 14"E 132.2m Dolerite Moorlands MOO 42 °26' 30"S 147°11'25"E 324.6m Dolerite sill Tarraleah TRR 42 °18' 15"S 146 °27' OO"E 579.1m Basalt Savannah SAV 41 °43' 15"S 147°11'20"E 179.8m Dolerite Sheffield SFF 41 °20' 15"S 146°18'27"E 213m Basalt Strathgordon STG 42 °45' 03"S 146°03'12 tfE 350m Quartzites Scotts Peak SPK 43 °02' 18"S 146°16'30"E 425m Argillites Savage River SVR 41 °29' 20"S 145 °12' 39"E 360m Schists Mount Read '? 41°50'47"S 145°32'37"E 1090m Altered volcanic St. Marys '? 41 °35' 37"S 148°10'57"E @270m Permian
A WWSSN standard set - three Benioff short period and three Sprengnether long period seismometers - is installed at TAU. Geotech S13 seismometers are installed at TRR, MOO, SPK, STG. Willmore MkII seismometers are installed at SAV, SFF, SVR, and TAU.
TASMANIA UNIVERSITY SEISMIC NET
40'
42'
43' SEISMIC STATIONS: AOperational
ACloSOd
o Pto,ected
- Power line carrier
--- RadIO lintl
- TelePhone line
o 100 , , KM
145 147'

THE SOUTH AUSTRALIAN SEISMIC NETWORK
D.N.Love*
The South Australian seismic network has undergone considerable change since 1986 when the last published account was written. There have been changes in staff, premises, computer hardware and software, seismograph equipment and timing apparatus. The network is being supervised by the Department of Mines and Energy until a non-profit research institute (the Sutton Institute of Earthquake Physics) is set up. A new multi-user computing system has been supplied by the Seismology Research Centre at Phillip Institute of Technology, thus giving the network closer ties with other States and the Commonwealth. There have been a few changes in the regional network, however major changes are likely in the near future with the possible closure of some long running stations, and the injection of funds for the study of tremors in the offshore Otway Basin in the South East of the State. The study came about following the fortuitous occurrence of a large bitumen stranding following a tremor of magnitude MN 2.2. Funding is being provide through the auspices of the State Energy Research Advisory Committee, with half of the finance being supplied by an oil exploration company. It is expected that six dial-up triggered digital recorders will be installed this year, making a big break from analogue recording. The Department of Mines and Energy has considerable expertise in logging and legal oversight of most drilling in the State. This is likely to lead into a strong emphasis on borehole sites in the future. A recently abandoned oil exploration hole near Robe, with a plug at 345 m, will be tested soon.
* SOUTH AUSTRALIAN DEPARTMENT OF MINES AND ENERGY, P.O. BOX 151, EASTWOOD, S.A. 5063

PAPUA NEW GUINEA DIGITAL SEISMIC NETWORK
Horst Letz*
The concept of replacing the current analogue seismic network consisting of 12 remote stations was introduced some time ago. The main reasons for changing the system were:
poor quality of the transmitted FM analogue signal
loss of data because of frequent PTC line-faults
high costs for rented telephone lines (on permanent basis)
and no possibility to expand the network and to include stations still operated by part-time observers at reasonable cost.
The proposed Papua New Guinea Digital Seismic Network has been designed as a real time processing network manufactured by Sprengnether Instruments Inc., consisting of 21 microprocessor controlled field stations (ARIES System) to operate remotely throughout Papua New Guinea, 11 DR 210 Strong Motion Recorders and the DAC 300 Central Seismic Workstation Computer.
The ARIES is an in-field seismic monitoring and data reduction system. The ARIES includes an adjustable preamplifier to connect the Mark L 4 A seismometer, anti-alias filter, ADG, TGXO, OMEGA timing interface, CPU, 2 MB RAM, terminal interface and autodial modem. ARIES monitors seismic signals, automatically picks P and S phases, determines amplitudes, identifies P polarity, determines coda length of the earthquake and does spectral analysis of the waveform. These parameters are stored in reduced format and retrieved remotely via communication link. As the reception of the OMEGA signal (Australia) is sufficiently good anywhere in PNG, every single station is equipped with an OMEGA receiver, interfaced to the internal clock.
The DAC 300 Central Seismic Workstation routinely polls each remote station for reduced parameter data or event triggers, or it retrieves such data at the initiative of the remote stations. As it is possible to use the coda length of the event as a trigger, every individual station can activate the DAG 300 to start polling the network and the earthquake alarm when a larger earthquake has been detected.
The DAG 300 Seismic Workstation facilitates the editing and analysis of the digital seismic data. It associates event triggers, computes hypocentre locations, fault plane solutions and creates master event files of valid events.
* Geophysical Observatory, PO Box 323, Port Moresby, Papua New Guinea

-2-
Manual picks can be done, using the interactive graphic waveform display. Waveforms and database information are saved on 9-track tape, 5 1/4" floppy disk or laser disk. The data will be formatted to USGS standard. Downloading seismic data into the USGS computer will be done by packet switch network, now available to Papua New Guinea.
The analysis program is menu driven and provides b-value and Wadati plots, spectral analysis of waveforms, epicentre plots, hard copy plots of selected data, query reports and analysis of strong motion data (DR 210 and SMA-I). To ensure correct timing, the DAC 300 is connected to a Kinemetrics GPS-DC Synchronized Clock driving a rubidium oscillator. The field stations can be tested (auto test facility) remotely by computer and parameters can be changed the same way.
In addition to the ARIES network, a total of 11 digital accelerographs (DR 210 Strong Motion Recorders) will be deployed throughout Papua New Guinea. At the moment, it has not been decided yet, whether the accelerographs will be connected to the telephone for remote operation or not.
Once the Papua New Guinea Digital Seismic Network is up and running the benefits are expected to be:
monitor and process seismic data in almost real time (earthquake hypocentres and magnitudes)
improve hypocenter location and the definition of seismic zones
provide an upgraded computer database on PNG earthquakes for seismic risk and prediction investigations
establish programs for numerical modelling, seismic ray-tracing and synthetic seismograms to determine the crust/mantle structure in PNG
low operational costs
improved efficiency and reliability
comprehensive seismic analysis can be carried out at the Geophysical Observatory independent of other organisations and services.

STRONG GROUND MOTION ATTENUATION IN SOUTHWEST WESTERN AUSTRALIA (SWWA)
by B.A. GAULL BMR Mundaring Geophysical Observatory, Mundaring. WA.
It was not until the ML4.5 earthquake of 7/3/87, centred near Cadoux, that this topic could be seriously addressed, as for the first time in this state, strong motion recordings were obtained in both the near and far-fields. The by-eye fit to the resultant peak horizontal acceleration (PHA, in ms-2) as a function of the hypocentral distance (R, in km) is given by: logPHA = 1.64 - 1.53logR - O.0033R. This expression compares favourably with that of McCue (1986) for the southeast of Australia. However, because the PHA occurred at a ground period, (T), of about 0.045s, which is not generally of engineering significance, these recordings were bandpass filtered with 3dB points of 0.1-0.5s and a roll-off of 18dB per octave. Other significant accelerograms from the SWWA data base were digitised and also filtered and a relationship between near-field PHA (at 0.1<T<O.5) and ML was plotted and used to establish the general attenuation function for this region:
logPHA = (0.25logR+0.15)ML - 2.271ogR - O.0045R + 0.3
The set of accelerograms was then filtered further using 3dB points of 0.15-0.5 and 0.2-1.0s with the same roll-off and it was found that only at these higher T-windows did the site factor become apparent. Sites with significant overburden had an amplification factor of up to 10 over hard rock sites. Furthermore, it is shown that the PHA associated with this longer T, is attenuated less. The digitised accelerograms were then integrated and the peak horizontal velocity (PHV,in mms-1) determined and plotted against ML which gave rise to the relation :
log PHV = 0.60ML - 1.14logR - 0.0050R - 0.33. Assuming the residuals about the fitted logPHA and logPHV curves were normally distributed, the standard deviation of them was about 0.1.
The ground period associated with PHA for earthquakes of different magnitude was also investigated and it was found that although scattered, a trend did exist. This trend is sensitive to the site geology and is described by the by-eye fits of : logT =0.10ML - 1.70, logT = 0.18ML - 1.65 and logT = 0.14ML - 1.68 for hard-rock, alluvial and in-between sites respectively. Also the duration of strong ground motion was plotted against earthquake magnitude resulting in the preliminary relation: ML = 2.17logt + 0.033t + 1, where t is the time in seconds the ground shakes at or above human perceptibility, assumed to be 0.05ms-2.
REFERENCE: McCue, K.F., 1986 - Strong motion attenuation in eastern Australia. Earthquake Engineering Symposium, Sydney, 2-3 December, 1986, The Institution of Engineers, Australia, National Conference Publication 86/15.

DERIVATION OF RESPONSE SPECTRA AS WELL AS REALISTIC VELOCITY
AND DISPLACEMENT INFORMATION FROM STRONG-MOTTON ACCELEROGRAMS
BY
LA. MUMME
CSIRO, (Lucas Heights)
and
LD. HUGHES
ANSTO (Lucas Heights)
Since the digitized records from strong motion accelerograms are in terms of
acceleration time-histories, the corresponding velocity and displacement traces
integrated from such accelerograms have to be realistic in the time domain.
While integration of ragged functions such as strong motion accelerograms by
regular quadrature formulas (e.g. the trapezoidal formula, and Simpson's rule) can
lead to errors, one important cause results from the processing of such records where
the initial conditions. and the zero acceleration base-line are not accurately known.
Thus, adjustment of the acceleration-time history is advisable to not only obtain
peak acceleration, velocity, and displacement information but corrected response
spectra as well.
Various techniques used to derive such information will be explained through
the use of examples.
UNCERTAINTIES IN SEISMIC R!SK ESTIMATES FOR THE ENGINEERING COMMUNITY -FURTHER DEVELOPMENTS
(1) (2) (3) John M.flf) Rynn ,Andrew Payn~2) ,William H. Boyce ; Fenwick and David J. Williams
John M.
Working Group on Earthquake Engineering; Department of Geology and Mineralogy. University of Queensland. St. Lucia, Qld. 4067.
(1) Seismology Group, Department of Geology and ~1neralogy;. University of Queensland. St. Lucia, Qld. 4067.
(2) Department of Civil Engineering, University of Queens land, St. Lucia, Qld. 4067.
(3) Cameron McNamara Pty. Ltd., Consulting Engineers, 299 Coronation Drive, Milton, Qld. 4064.
(4) Bridge Branch, Main Roads Department, corner Boundary and Fortescue Streets, Spring Hill, Qld. 4000
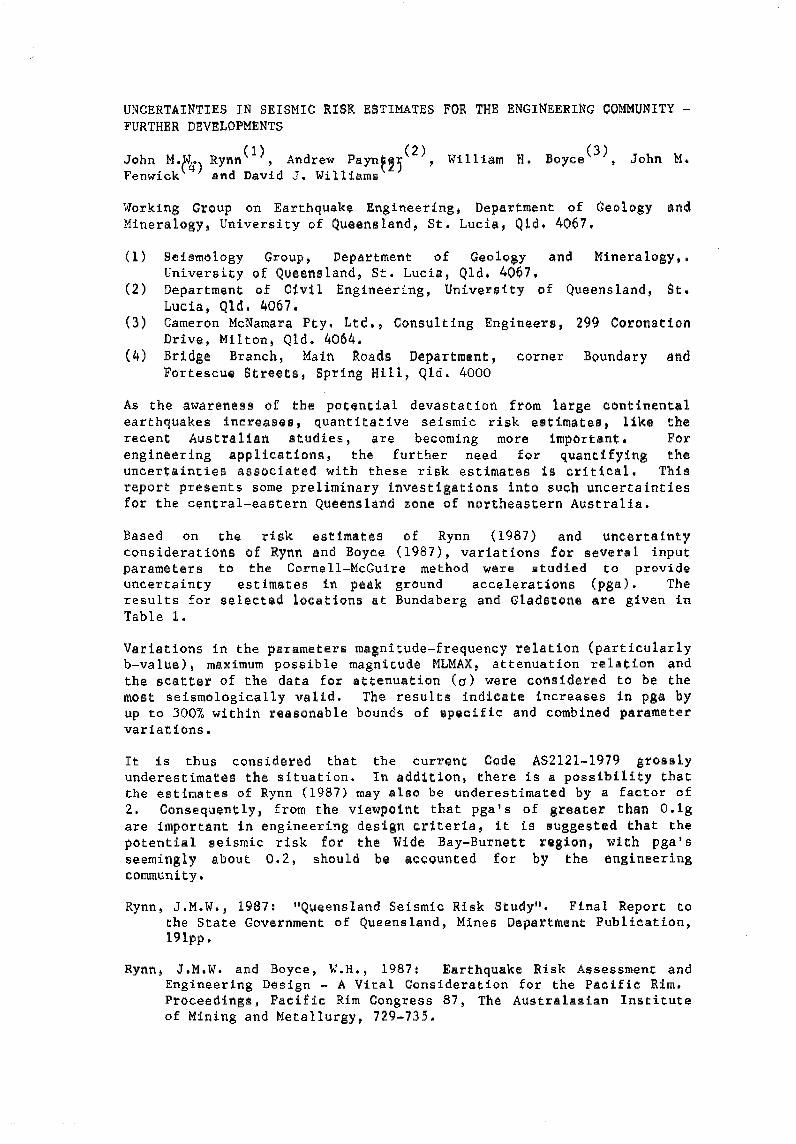
As the awareness of the potential devastation from large continental earthquakes increases, quantitative seismic risk estimates, like the re.cent Australian studies, are becoming more important. For engineering applications, the further need for quantifying the uncertainties associated with these risk estimates is critical. This report presents some preliminary investigations into such uncertainties for the central-eastern Queensland zOne of northeastern Australia.
Based on the dsk estimates of Rynn (1987) and uncertainty considerations of Rynn and Boyce (1987), variations for several input parameters to the Cornell-McGuire method were studied to provide uncertainty est imstes in peak ground accelerations (pga). The results for selected locations at Bundaberg and Gladstone are given in Table 1.
Variations in the parameters magnitude-frequency relation (particularly b-value) I maximum possible magnitude MLMAX, attenuation relation and the scatter of the data for attenuation (0) were considered to he the most seismo1ogica11y valid. The results indicate increases in psa by up to 300% within reasonable bounds of specific and combined parameter variations.
It is thus consldered that the current Code AS2121-1979 grossly underestimates the situation. In addition, there is a possibility that the estimates of Rynn (1987) may also be underestimated by a factor of 2. Consequently, from the viewpoint that pga's of greater than O.lS are important in engineering design criteria, it is suggested that the potential seismic risk for the Wide Bay-Burnett region t with pga 's seemingly about 0.2, should be accounted for by the engineering community.
Rynn, J .M.W., 1987: "Queens land SeismiC Risk Study". Final Report to the State Government of Queensland, Mines Department Publication, 191pp.
Rynn~ J.M.W. and Boyce, \-;I.H., 1987: Earthquake Risk Assessment and Engineering Design - A Vital Consideration for the Pacific Rim. Proceedings, Pacific Rim Cong~ess 87, The Australasian Institute of Mining and Metallurgy~ 729-735.

TABLE 1
UUCHRTAINTIES IN SEISMIC RISK ESTIMATES
The effects of variations in input paramet~r5 on ~eism1c risk estimates fnr the earthquake source zone Ql based on GME values -" of Rynn (19.87)
Inpllt Parameter
Source Zone Area
ML MIN
ML HAX h
Magnitude-Frequency Relation
a
b
Attenuation Relation
el
, C2 ' C3
*Seisroologicall}' significant
Variation
(not yet available)
(no~ yet available)
Increase 6.8 to 8.0 (not yet available)
Increase by 20% Decrease by 20% Increase by 20% Decrease by 10%
Increase 0.28 to 0.50 Increase 0.28 to 1.00
Estera and Villeverde (1974) With 0 = 0.64, ML(MAX) 6.8
0 = 0.64, ML(MAX) = 8.0
Effect on Seismic Risk Estimates of Rynn (19a7) Source ZOne Ql Bundaberg Gayndah
Increase up to 50%
Increase by <1~~ Slight decrease Decrease up to 50% Increase up to 50'.
Increase up to 20% Increase up to 200%
Increase up to 150% Inc.rease up to 300%
Current Standards AS2121-1979 RYNN (1987)
O.12g
0.08g 0.08g O.(}4g O.12g
a.lOg 0.20g
0.20g 0.2:6g
0.05g O.lOg
O.09g*
0.018* O.06g 0.04g O.l1g*
O.OBg* 0.16g*
0. 198* O.23g*
0.05g 0.08g

GEOLOGICAL IMPLICATIONS OF EASTERN QUEENSLAND SEISMICITY
by Russell J. Cuthbertson Queensland Department of Mines
Earthquakes that have been accurately located using instruments in the reservoir-monitoring networks operated by the Queensland Department of Mines have been used to delineate seismic regions in eastern Queensland. Correlation of these zones with regional structure has provided an insight into the tectonic structure of the area.
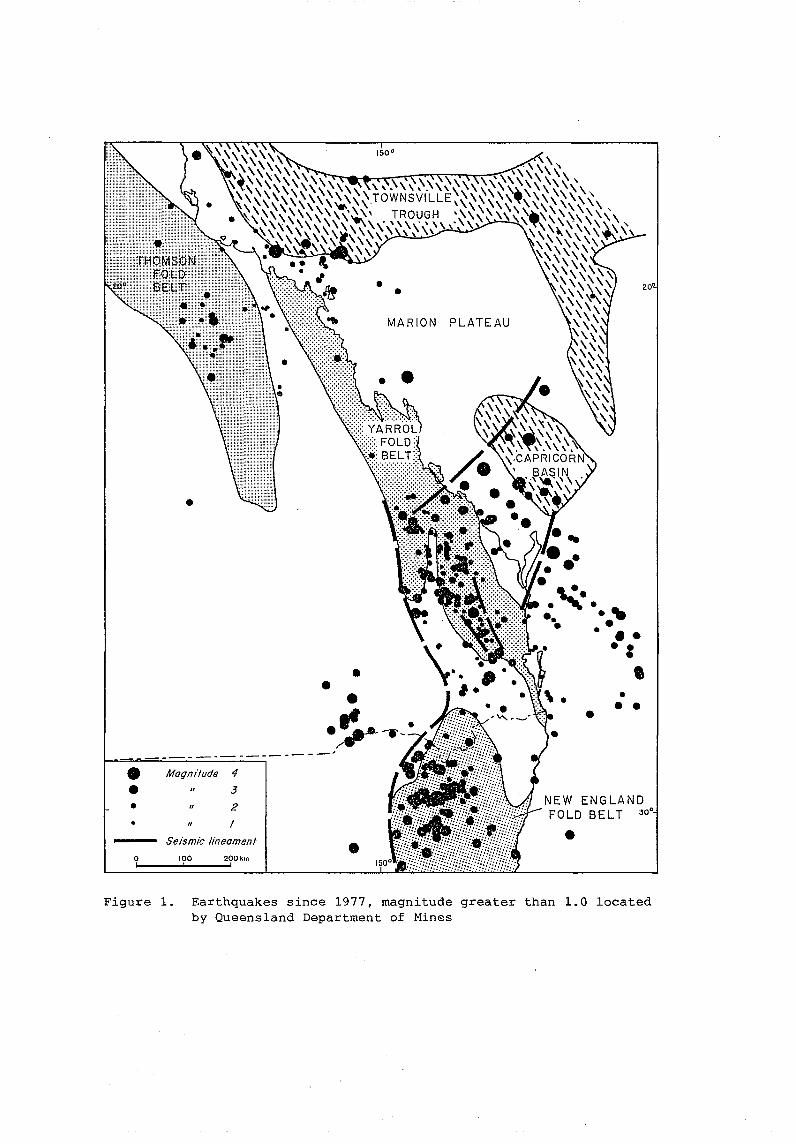
Earthquake activity in northern New South Wales and eastern Queensland (Figure 1) is confined mainly to the New England Fold Belt and the Yarrol Fold Belt. Seismicity in the intervening Clarence-Moreton Basin is restricted to the west by a NNW-trending line. This line coincides with a large-scale fault postulated by Murray et ale (1987) to account for the structure of the New England and Yarrol Fold Belts.
In the southern portion of the Yarrol Fold Belt two NNW-trending lines confine the majority of the activity to a zone which includes the South D'Aguilar Block, the Esk Trough and the northern portion of the Yarraman Block. The North D'Aguilar and Gympie Blocks and the Nambour and Maryborough Basins are significantly less active.
The lack of activity in the Maryborough Basin is in conflict with the two earthquakes of 1947 and 1952 that were located in the area (Jones, 1958) It is suggested that these two events should actually be located further east in the region of activity off Fraser Island. This zone of activity extends over the continental shelf to the tasmantides of the North Tasman Basin (David, 1933).
An area of activity in the vicinity of St George shows no correspondence with mapped geology or tectonics.
Activity in the central portion of the Yarrol Fold Belt is seemingly confined to the south by a line extending offshore from Gladstone. The decrease in activity to the north of this line may be due to the poorer detection level of the distant monitoring networks.
The offshore basins surrounding the Marion Plateau are seismically active but whether they are under a tensional stress regime as would be expected from the geological structure or a compressional stress regime as has been found in southeast Queensland remains to be seen.
Scattered activity around the Burdekin Dam area is restricted to the northern portions of the Drum mond and Bowen Basins.
DAVID, T.W.E., 1933: Explanatory notes to accompany a new geological map of the Commonwealth of Australia. Commonwealth Council for Scientific and Industrial Research.
JONES, O.A., 1958: Queensland earthquakes and their relation to structural features. Journal and Proceedings, Royal Society of New South Wales, 92, Part IV, 176-181.
MURRAY, C.G., FERGUSON, C.L., FLOOD, P.G., WHITAKER, W.G., & KORSCH, R.J., 1987: Plate Tectonic Model for the Carboniferous Evolution of the New England Fold Belt. Australian Journal of Earth Sciences, 34, 213-236.
• • • •
o !
-
•
-------------'
Magnitude 4
3
" 2
" I
Seismic lineament
100 !
200km I
• MARION PLATEAU
•
•
-• • .,-... - . -. .
•
••• -: • • • •
NEW ENGLAND FOLD BELT
•
Figure 1. Earthquakes since 1977, magnitude greater than 1.0 located by Queensland Department of Mines
DISTRIBUTION OF EARTHQUAKES NEAR CADOUX
* V.F. DENT
ABSTRACT: Seismic coverage has not been particularly good in the South West Seismic Zone of Western Australia. Plots of aftershocks of the 1979 ML 6.2 event at Cadoux show a fairly scattered distribution. During a three month period in 1983, a temporary seismograph network was established around Cadoux, enabling good locations to be made in this area. Locations from this network established for the first time that Cadoux events had depths of less than 5 km. It also established a fairly clear pattern of seismicity on the west side of the Robb Fault, and that earthquake locations by traditional methods were out by 5 to 10 km. When corrections are applied to older Cadoux locations, the relationship with the Robb Fault is enhanced.
*Mundaring Geophysical Observatory, Bureau of Mineral Resources, Hodgson Street, Mundaring, Western Australia 6073

AFTERSHOCKS OF LARGE EARTHQUAKES IN AUSTRALIA
by Kevin McCue*
During the last two decades, four large earthquakes have occurred in Australia and close enough to regional seismographic networks that all associated foreshock and aftershock activity down to at least magnitude ML 3 were recorded, if not accurately located; the 1968 Meckering WA earthquake, the 1979 Cadoux WA earthquake, the 1986 Marryat Creek SA earthquake and last years Tennant Creek NT earthquake. Faulting accompanied all four earthquakes and the faults were all shallow angle thrusts.
Four distinct phases are recognisable in the rupture process accompanying these large earthquakes in the Australian Precambrian shield;
i the fore shock or pre mainshock period ii the mainshock phase iii the short-term aftershock sequence with exponential decay of
energy release iv the final aftershock phase of slowly decaying energy release
but the individual patterns show distinct differences. All four phases are clearly discernable in the Meckering and Cadoux
earthquake sequences; a few small fore shocks in the week prior to a single mainshock followed by a long aftershock sequence in two parts. The Tennant Creek sequence is outstanding; firstly in the duration of the foreshocks, 12 months, and then in the mainshock phase where not one but three large earthquakes of increasing magnitude occurred within a twelve hour period. The aftershocks are still continuing at Tennant Creek a year after the mainshock.
The exceptional sequence is the 1986 Marryat Creek earthquake in South Australia; there were no foreshocks and just a single mainshock followed by very few aftershocks, a second earthquake half a magnitude smaller than the mainshock occurred at Marryat Creek six months later with a similar sequence of events. Only 4 earthquakes exceeded ML 3 in the intervening period.
All four earthquakes occurred at shallow depth in Precambrian basement and there appear to be no grounds for appealing to different geological settings to explain the differences. The macro hydrogeological settings of the Meckering, Cadoux and Marryat Creek earthquakes are local low productivity aquifers whilst that at Tennant Creek is an extensive porous, highly productive aquifer. At least for the earlier three earthquakes, pore pressures at focal depths in the range of 3 to 5 km can be expected to be similar.
The mechanisms of only two aftershocks have so far been examined using the conventional P-wave polarity method. The 3 March 1987 Cadoux earthquake on the Robb section of the 1979 fault had a very simple pure thrust mechanism with both nodal planes paralleling the ground fracture, one dipping at 40 degrees east, the other at 50 degrees to the west. The Robb fault dips to the west in the vicinity of the epicentre so the westerly dipping nodal plane is likely to be the fault plane. This focal mechanism is very similar to that of the mainshock.
The fault plane solution of the large aftershock at Marryat Creek is interesting in that while the nodal planes are almost identical in dip and orientation, the P and T axes are interchanged by comparison with the mainshock. So while the Cadoux aftershock seems to have continued the progressive failure, that at Marryat Creek seems to have been a stress relaxation event.
* Australian Seismological Centre, BMR, Canberra, ACT

The four scarps have been surveyed exposing another difference; while the Meckering, Cadoux and Tennant Creek scarps are extremely complex systems of small fault segments, the Marryat Creek scarp has been mapped as virtually a single curvilinear thrust.
The differing aftershock patterns and variations in mapped surface faulting are attributed to the roughness or density of asperities along the failure surface. The Marryat Creek scarp must have been exceptionally smooth so that, in failure, the upthrown block actually overshot during the mainshock releasing all the stress at once so there were few aftershocks. The extra potential energy was released six months later when the block slipped back along the original failure surface. The other three earthquakes failed progressively, the stress not being released immediately but in fits and starts as successive barriers were fractured in turn, but basically completed by the end of the exponential aftershock decay curve. Finally strain energy redistributed into the fault zone from the surrounding area accounts for the near constant tail of the aftershock decay curve.
No two large earthquakes sequences have yet occurred in the same place in Australia, so the style of the aftershock sequence is unpredictable.

EARTHQUAKE ACTIVrTY IN NORTHEASTERN AUSTRALIA (QUEENSLAND AND NORTHEASTERN NEW SOUTH WALES)
1985 THROUGH 1988
John M.W. Rynn
Seismology Group~ Depa~t~ant of Geology and Mineralogy, University of Queensland~ St. Lucia, Qld. 4067.
This paper presents a resume of earthquake activity in northeastern Australia for the period 1985 through 1988. Although still in preliminary form, this data complimQnts the Queensland Earthquake Data File 1866 through 1984. Data sources include the Seismology Group, Queensland Min~6 Department and the Australian Seismological Centre.
More than 200 earthquakes in the range 0.0 <: ML < 4.5 havQ been located in northeastern Australia in the last four years. Of these, 19 had magnitudos 3.0 < ML<4.0 and 5 were of ML> 4.0. The vast majorit.y occurred in the Wide Bay-Burnett! Southeast Queensland and southern part (Townsville to Mackay) of the Northeast Queensland provinces. Other act.ivity was noted in th~ St. George and Goondiwind1 areas (Queensland-NSW Border region) and in northeastern New South Wales.
Significant Earthquakes (Table 1): Felt effects from eight earthquakes were experienced in several parts of the region. Public concern was particularly relevant for the 1987 Townsville and 1988 Gatton earthquakes. Questions were raisad as to the. possible relationships of the Gatton earthquake to the W1venhoe Dam. No evidence waS found to support this conjecture. Damage to private houses (MM > 5) was reported tor five of the earthquakes with insura.nce claims submitted for the 1985 Frazer Is. (at Hervey Bay), 1.986 Somerset. Dam (near Kilcoy - $5000 paid out), 1987 Townsville and 1988 Gatton earthquakes.
Inv~rell (NE NSW) Swarm Activity: Swarm activity for the Inverell region has again occurred during this pet'iod, similar to that previously studied for March 1982. Activity was widely felt in fhe Inverall-Elsmore-Tingha-Stannifer region, (approximately 1200 km) from May through August 1986 and several earthquakes with nlagnitudes 2.5 < ML < 3.5 were located. Reports of minor damage (MM 5) were received. Other earthquakes with ML about 3.0 occurred during 1985 and 1987 with no swarm activity reported to be associated with them.
Seismograph Stations: To improve the ~onitoring capability of the regions earthquakes~ the Univers tty of Queensland in cooperat ion with other institut ions has embarkod on a program to upgrade and expand the State network. In September 1987. a USGS global digital seismic station (Strekhe1sen system) was installed at Charters Towers (CTAO). Continued operation of the BMR's nuclear monitoring station at CTAO has also bean maintained. As a consequence, the WWSSN (six~component.) instruments therein were transferred to Mt. Nebo (BRS) where operations, via a telemetry link t.o St. Lucia Campus, began in January 1988. Short.

period vertical telemetered stations at Mt. Morgan and Warwick will begin operating this year. Plans are in place fot' stations near Rockhampton and ToW'nsvi lle and in the Wide Bay-Burnett region. The highlight of this pariod was the operation of the BRS station at World Expo 88 (telemetry link and recorder traosferred frOM St. Lucia).
Continuing Studies: The expanded monitoring will further compliment the on-going seismic risk studies. Research through microearthquake surveys, selsmotectonic studies and geological aspects associated with seismicity is ongoing. Continued macroseismic surveys of felt earthquakos arc still regarded as high priority studies to improve our knowledge of seismic attenuation (through intensity). Planning is in progress to establish acccl(lrograph recording sites in central- and south-east Queensland regions, the highest risk zone in the State.
TABLE 1
SIGNIFICANT EARTHQUAKES NE AU$T 1985-1988
EVENT ORIGIN TIME UT EPICENTRE h ML MM FELT AREA
DATE HM Os LAT °E LONG KM M~X KM2
1985 FRASER IS FEB 08 0823 25.02 154.28 16 4.5 4(5 ) 16000 PROSi:RP!NE AUG 02 1216 19.50 148.86 8 4.5 4 3000 COALSTOUN LAKES DEC 02 06t9 25.39 151.71 10 3.3 4 1500
1986 SOMERSET DAM JAN 08 0955 27.06 152.53 8 4.0 6 4700 Ml NEBO MAY 19 0046 27.28 152.82 10 2.6 4(5) 1000 INVERELL SWARM t.lAV-JUL (see Text) 4-5 1200
1987 TOWNSVILLE SEP 27 1601 19.00 147.85 10 4.5 5 40000 INVERELL SEI=' 28 1938 29.39 150.54 0 3.3 5 3000 JUNOAH DEC 16 0455 24.82 1402.86 15 4.0 NOT FELT
1988 BATTON AUG 14 2323 27.56 152.33 10 4.0 6 8000
3·· D STRUCTURE OF SOUTHEASTERN AUSTRALIA -A NON-LINEAR INVERSION OF REGIONAL TRAVEL TIMES
M.S. Sambridge, & B.L.N. Kennett
Research School of Earth Sciences, Australian National University, GPO Box 4, Canberra, ACT 2601, Australia
The three-dimensional seismic velocity structure in southeastern Australia has been determined by the inversion of travel times from regional earthquakes, quarry blasts, and controlled sources from seismic refraction surveys. Over 350 well recorded earthquakes, with good spatial location across the region, were selected from the data base of the regional seismic network which has 16 stations throughout the highland region around Canberra. The permanent station recordings of the major quarries in the area were supplemented by in-line and fan refraction profile data.
This large-scale non-linear inverse problem requires simultaneous determination of earthquake hypocentres and seismic velocity structure. The velocity structure is parameterised using a large scale 3D lattice, to which a variable smoothing technique has been applied. As the inversion progresses the 'rigidity' of the model is decreased, allowing the longer wavelengths to be resolved first and the more detailed structure later.
P-wave and S-wave crustal and upper mantle structure has been inverted for, together with parameters representing the depth of the Moho. This multi-parameter type large-scale inverse problem requires careful handling of the different parameter types to avoid the introduction of bias. A new algorithm based on the minimization of a measure of the misfit between observed and computed travel times has been used, which offers considerable computational advantages over methods which require the inversion of large scale matrices. At each iteration a projection is made onto a 'subspace' derived from a few well chosen vectors in model parameter space, related to the properties of the misfit function, and the next model estimate is constructed in this subspace. Here we have determined the subspace vectors by partitioning the gradient of the data misfit into parts associated with each parameter class. In this way we are able to remove 'down-weighting' effects that may occur in single-gradient methods owing to a poor a priori choice of model covariances. In the new method each parameter type is adjusted, at each iteration, in response to its effect on the data misfit without unwarranted influence from other parameter types.
The nonlinear inversion requires fully three-dimensional raypaths to be determined. This has been achieved with the use of an efficient two-point ray tracing program, which allows travel times to be determined to a high degree of accuracy. We are therefore able to treat the problem more realistically and avoid the errors introduced from the use of approximate raypaths. The resulting maps of crustal and upper mantle velocity distribution, and depths to the Mohorovicic discontinuity, show interesting relations to surface geological structure.

THREE LARGE INTRAPLATE EARTHQUAKES
NEAR TENNANT CREEK NT, 22 JANUARY 1988.
T.D. Jones, K.F. McCue, D. Denham and P.J. Gregson
Australian Seismological Centre, Bureau of Mineral Resources, Geology & Geophysics
J.R. Bowman
Research School of Earth Sciences, Australian National University
G. Gibson
Seismology Research Centre, Phillip Institute of Technology
Extensive surface faulting accompanied an extraordinary sequence of earthquakes in the Proterozoic Tennant Creek Block of central Australia on 22 January 1988 in an area with no record of significant seismic activity prior to 1987. The sequence included three earthquakes of magnitudes Ms 6.3, 6.4 and 6.7. Hundreds of aftershocks were recorded in the epicentral area in the first few days after the main shocks and the sequence continued throughout 1988. The three largest earthquakes were felt over more than one quarter of the land surface of Australia and in high rise buildings up to 2000 km from the epicentre. Minor damage was caused to buildings in the town of Tennant Creek 30 km from the surface rupture, and a buried gas pipeline was shortened by 1 m where the faulting crossed it. Focal mechanism solutions indicate thrust mechanisms for the first and third large earthquakes and a combination of thrust and strike-slip for the second. Ground deformation and offsets along roads, fences and the pipeline ;;1so indicate predominantly thrust faulting. The largest aftershock occurred 8 hours after the third large earthquake and had a strike-slip mechanism with the left-lateral nodal plane parallel to the surface faulting. The mean azimuth of the P-axes for the first three focal mechanisms is N3l o E, in close agreement with the maximum principal stress direction determined from in situ stress measurements made in 1975 in the nearby Warrego gold mine. Hypocentres of the three largest earthquakes are grouped centrally and faulting probably occurred sequentially northwest, southwest, and finally southeast.
The Faulting Process of the 1988 Tennant Creek, Australia Earthquake from Local Seismograph Arrays
1. Roger Bowman (Research School of Earth Sciences, Australian National University,
GPO Box 4, Canberra, ACf 2601)
On 22 January 1988 three earthquakes of Ms 6.3, 6.4 and 6.7 occurred in a twelve
hour period near Tennant Creek, Northern Territory and produced 32 km of surface
rupture. Low-angle (20°- 3(0) thrust faulting is seen on two main scarps separated by a 7
km gap. The Lake Surprise scarp fonns a north pointing chevron of about 24 km length
with the west ann trending west-southwest and the east ann¥, east-southeast. The 8 km
long Kunayungku scarp lies on a northwest extension of the eastern Lake Surprise scarp.
However, there is no surface breakage connecting these two scarps. On the Kunayungku
and eastern Lake Surprise scarps, the surface on the south side of the scarp was thrust
over the north side, whereas on the western Lake Surprise scarp, the north block was
thrust over the south.
Data from the Warramunga (WRA) seismic array situated 30 km east of the scarp
are used to relocate the mainshocks and a series of M 3-5 earthquakes in 1986 and 1987.
The 1986, 1987 and 22 January 1988 earthquakes all nucleated within a zone about 5 km
across, from north to south but elongated radially away from WRA by up to 30 km. The
1986 and largest 1987 events were restricted to the western part of the fault zone. The
three mainshock hypocentres moved progressively from west to east suggesting that the
Kunayungku scarp was produced by the first mainshock, and the west and east ends of
the Lake Surprise scarp were produced by the second and third mainshocks, respectively.
Data from up to eleven portable seismographs operated by the AND in the fault
zone for four weeks beginning in late February and for two weeks in late June and early
July are used to locate 150 aftershocks. The aftershock zone is about 40 km by 10 km in
plan and is elongated parallel to the trend of the surface ruptures. Focal depths range
from near surface to about 8 km. In the western and eastern portions of the fault zone,
aftershocks occur only south of the Kunayungku and Lake Surprise scarps, respectively.
In the central section, in contrast, aftershocks lie primarily to the north of the western
Lake Surprise scarp. In all sections the shallowest earthquakes lie closest to the scarps,
whereas deeper events lie most distant. The aftershocks fonn inclined zones delineating
the primary fault surfaces ruptured by the mainshock. In the east and west, the fault
planes dip to the south, consistent with the sense of surface rupture. In the central
segment, on the other hand, a group of aftershocks with well constrained focal depths
clearly define a north-dipping plane, also consistent with the sense of surface rupture for
this scarp segment. The aftershock data would allow a second, south-dipping plane in the
central section that may be continuous with the fault plane on the eastern Lake Surprise

2
fault, but that does not break the surface. This suggests that conjugate fault planes
ruptured during the second mainshock, consistent with broadband waveform modeling
results.

Triggered Digital Recording of the Tennant Creek Earthquake Aftershocks
* Gary Gibson, Anthony Corke and Zuha1 Demirer
The Tennant Creek earthquakes have provided an excellent testing ground for the use of triggered digital recorders. A range of recorder types have been installed, including seismographs and accelerographs, recording on magnetic tape and in solid state memory.
Problems encountered included high temperatures (one tape cassette become so soft it was permanently deformed), rain (two recorders were flooded by heavy rain) and dust (this caused considerable problems with keyboards and disc drives on portable computers). Animals ate any cables that were not buried, but did not otherwise damage solar panels or instruments.
The level of activity was such that triggering was quite simple. To give a reasonable number of events the trigger thresholds were all set very high, and very few false triggers were recorded. Careful choice of values for trigger ratios on the fast and slow short term average/long term average (STA/LTA) triggers led to a reasonable mix of triggers from small nearby events compared with those from larger more distant events.
The most significant problems encountered involved the use of car batteries for the power supply. These were charged using solar panels. The high temperatures led to considerable evaporation of battery water, even during periods as short as a few weeks. This problem was reduced by burying the batteries so that their tops were just above the surface, and by ensuring that the systems received as much shade as possible. In addition, the solar power regulators were modified so that there was considerably more hysteresis in the charging cycle, switching the charge current off at 12.9 volts and waiting until the battery dropped to 12.3 volts before switching on.
The use of both seismometers and accelerometers clearly showed the advantages of each. Seismometers are more sensitive and recorded the more distant events more reliably, they used less power, but went full scale on large nearby events. Accelerometers recorded nearby events within 10 kilometres as reliably as seismometers and could record motion to full scale of 19, but the wide dynamic range feed-back accelerometers used more power than the rest of the recording system.
Several thousand seismograms and acce1erograms have been produced from the Tennant Creek network.
* Seismology Research Centre, Phillip Institute of Technology, Plenty Road, Bundoora, Victoria 3083.
The Rupture Process of the 1988 Tennant Creek, Australia
Earthquake from Broadband Teleseismic Analysis
George Choy (U.S. Geological Survey, Box 25046, MS 967, Denver, CO 80225)
J. Roger Bowman (Research School of Earth Sciences, Australian National University, GPO Box 4, Canberra, ACT 2601)
Broadband displacement and velocity records of P waves recorded at teleseismic
distances are analyzed to determine the rupture characteristics of three Ms 6.3-6.7 earthquakes and a mb 5.8 aftershock near Tennant Creek, Northern Territory on 22
January 1988. The analyis provides estimates of focal depths, moment, focal
mechanism, radiated energy and associated stresses for the mainshocks., The three
mainshocks ruptured the west, central and east segments of the fault zone at 0036, 0357
and 1204 UCT, respectively. With broadband data we are able to resolve a complex
rupture history for each mainshock. The first earthquake is comprised of two subevents
with the same focal mechanism (strike 100° , dip 35°, slip 90°) but distinct depths of
6.5 km and 4.5 km. This rupture propagated updip and to the northwest. Although the
second mainshock consists of three subevents at depths of 3.0-3.5 km, its waveforms
exhibit no resolvable directivity. The focal mechanism of the first two subevents (strike
290°, dip 70°, slip 120°) is well constrained by nodal P arrivals at stations TATO and
MAJO. The focal mechanism of the third subevent of the second mainshock (strike
250°, dip 50°, slip 115°) is less well constrained by the broadband data, but the north
dipping nodal plane of this mechanism is consistent with surface deformation and
aftershock distribution. The third mainshock was also a complex ruture, consisting of
three subevents with the same mechanism (strike 290°, slip 45°, dip 100°) and depth of
4.5 km. Rupture propagation was to the southeast. The south-dipping nodal planes for
the first and third mainshocks are identified as fault planes by the sense of thrusting seen
at the surface and by the distribution of aftershock hypocentres. For the second
mainshock, the first two subevents may have ruptured along the south-dipping plane that
did not break the surface, whereas the third subevent ruptured the north-dipping plane.
The third subevent had low energy release and may have broken along a preexisting fault
plane expressed at the surface as a quartz ridge.
The Kelunji Digital Seismograph
* Vaughan Wesson, Gary Gibson and Peter Georgiadis
The Seismology Research Centre at the Phillip Institute of Technology has been involved in the design of portable, battery powered digital seismographs for more than ten years. This paper discusses the design and applications of the third generation recorder.
The application areas which the recorder was designed to cover are local, regional and teleseismic distance triggered or continuous earthquake recording, monitoring of structures either singly or in groups, deep seismic sounding and monitoring of blasts.
The hardware and software architecture of the Kelunji has been designed to allow considerable flexibility in the design and application of the recorder. Specifications such as power consumption, resolution, dynamic range, sample rate and the amount of data storage may all be varied in the future.
The current version of the recorder is a small, low power digital seismograph using the 32 bit National Semiconductor 32C016 CMOS microprocessor. It includes at least one megabyte of solid state data storage, a high precision temperature compensated crystal oscillator driving a real time clock and three channel gain ranged amplifiers. The current analogue section is designed for sample rates up to 1000 per second (synchronous on all three channels) and has a dynamic range of over 120 db with 12 bit resolution. Each recorder has two serial ports used for communication with a portable computer, connection to a modem, connection to an external storage module, connection to another Kelunji or to receive the radio signal commands. The total power consumption of the recorder is under 1.5w, from a single l2v battery.
The recorder may operate as either or both a triggered recorder or continuously telemeter data to a laboratory computer and/or an analogue recorder. Data may be stored either internally where it is extracted remotely by modem or locally by portable computer or it may be stored externally with the storage module being swapped and returned to the analysis centre for processing.
For detailed monitoring of structures or a small seismic array, a number of recorders may be connected together in a star network with completely synchronous recording, mutual triggering and central data retrieval Should any link in the network fail, all recorders will still continue to operate.
Early production recorders were tested under severe field conditions recording aftershocks of the January 1988 Tennant Creek earthquake. Since then many other recorders have been installed to record local seismicity and monitor various structures.
* Seismology Research Centre, Phillip Institute of Technology, Plenty Road, Bundoora, Victoria 3083.

TIME SIGNAL SERVICES - HOW TO RECEIVE THEM
V.H. JENSEN Geology Department, University of Tasmania
The old saying "you don't know what you have got till it is gone" came true 10.00 a.m. October 1st, 1987 when the VNG HF time signal service transmitted from Lyndhurst, Victoria was shut down. Various alternatives were considered by former VNG users. These included:
WWVH, WWV, JJY & BPM HF time signal transmissions. RAN SSB HF time signal transmissions. OMEGA VLF navigational broadcasts. GPS and AUSSAT satellite transmissions. Telephone time pips. TELECOM two tone frequency comparison system.
We shall consider some of these services, their relative usefulness to seismologists and how to receive them.
There are basically three different kinds of signals that we can extract time information from: 1. A signal specifically designed for that purpose i.e. WWVH, WWV, JJY,
BPM, VNG and telephone time pips. 2. Signals that have time information buried in them. Examples are
OMEGA and LORAN-C navigation systems. In these pulses emitted are related in a very precise way to atomic clocks. Although not getting a pulse exactly on the second, minute or hour, the emission times on these signals are related precisely to the second, minute and hour.
3. Accurate frequency transmissions such as the Telecom 1000 Hz standard frequency (see Fig. 1) available in all capital cities of Australia.
As the latter two do not have precise time incorporated into their transmissions it is necessary to have access to accurate time from some other source at least when initially setting up a clock driven by or locked to these signals.
One factor often overlooked regarding HF transmissions is the time it takes for a signal to travel from the transmitter to the reception point. This can be considerable. For example, from WWVH in Kauai, Hawaii to Hobart this delay amounts to an average of SOm secs. As we are trying to record time to better than 10m secs. This delay must be taken into account and corrected for.
Since 1981, the Geology Department, University of Tasmania, has been actively involved in the development of short wave receivers specifically designed for reception of HF time signals. The latest of these, the Ke1unji Mk 3 radio is a frequency synthesized, dual conversion, superhet receiver (see Fig. 2). The basic model will tune across the range 5-20 MHz in 1KHz steps. It incorporates two active filters centred at 1KHz and 1.2KHz which can be individually selected via the data bus that controls the entire receiver. There are some unique features incorporated into the radio. The front RF stage is self-tuning, giving good sensitivity and rejection of unwanted signals. The outputs of the two audio filters are combined when the radio is used in the Frequency Shift Keying (FSK) mode to receive data at a 50 baud rate. This facility is used when one wants to reprogramme a remote field station via a HF radio transmission link.
Aerials are an item often given little consideration in HF time signal reception. By using simple aerials tuned to the wanted frequency and erected properly, a signal otherwise buried in noise, can become audible and useful.

1700 2700
Hz I
Two Tone Frequency Comparison System
ATOMIC CAESIUM
STANDARD
1 MHz SYNTHESISE
-----:-1 SEND RECEIVE I FILTER FILTER
BANDPASS BANDPASS Hz
I 300-3400 ~ 300-3400 ~ Hz H~ :J L -- -- - - - -- -
COMPARISON SYSTEM
r- --- - -- - - - I INPUT
I DETECTOR FILTER
I 1 kHz FILTER
1701 Hz f-- f-- BANDPASS SINE 2701 Hz
BANDPASS & 850-'150 1.6-2.8 AGC
WAVE
I Hz I kHz
I (Fnl I 1 kHz
f I SQUARE
I WAVE
1000: 1 _f PHASE I (FLl 1 kKz
I
DIVIDER -ICOMPARATORI--& SYNCH 1.1 CHART
I (:cl t T I' -I RECORDER
I BALANCED COUNTER I
I GATE
'-- -- --- - -- - ~ t1 kHz
1 MHz
REMOTE Fig. 1 QUART2
STANDARD
KELUNJI RADIO 5-20MHz
RAGC Line
> _____ ------lDet. & AGC
"MHz = "".S45MHZT
Absolute volue rectifier
Fig. 2
ANAGC
AtlEXT
ANFSK
ANRAD o
ANT EST

THE RESUSCITATION OF VNG
Marion Michael-Leiba
For 23 years, from 21 September 1964 to 1 October 1987, Australia's standard frequency and time signal service, VNG, was broadcast from Lyndhurst, Victoria. Funded by Telecom Australia, VNG was switched off because Telecom no longer needed it and because the Government proposed to sell the Radio Lyndhurst site in March 1988.
On 1 December 1987 a meeting of nearly 100 interested parties and former VNG users resolved that the NSC Precise Time Working Group should investigate ways of reviving VNG. Within two and a half months, that Group identified a prospective site for VNG at Llandilo, and Telecom donated the VNG equipment to the National Standards Commission.
In mid February 1988, the Group considered that it would soon be necessary to remove the VNG equipment from Lyndhurst but Telecom quoted $4500 for dismantling and packing. As there was insufficient time to arrange Government funding for this, it was necessary to ask users for contributions. It was not considered appropriate for a Government body to write asking people and organisations to dip into their own pockets, so the VNG Users Consortium was formed on 25 February 1988 to re-establish and maintain a national HF standard frequency and time signal service. It mailed letters to all known VNG users requesting contributions towards equipment acquisition costs. To date, the Consortium has collected over $10000 from 55 users and sympathisers, enabling it to pay for the dismantling, packing and transport of the equipment from Lyndhurst to Llandilo.
AUSLIG (the Australian Surveying and Land Information Group of the Department of Administrative Services) then obtained funds to set up VNG at Llandilo. The balance of Consortium equipment acquisition funds will be used to give AUSLIG partial cost recovery for setting up costs.
The new site for VNG is the Civil Aviation Authority's International Transmitting Station at Llandilo, northeast of Penrith, NSW. The bulk of the VNG equipment was moved from Lyndhurst to Llandilo by commercial carrier on 16-17 June 1988. The timing equipment and four transmitters occupied an entire semi trailer and the transmitters were so big that the doorway of the transmitter hall had to be enlarged to admit them! The remainder, 14 large capacitors containing PCBs, was transported to the new site by a relay of two pairs of VNG users in a private vehicle on 1-2 July 1988.
Very hard work by the people at Llandilo got one transmitter operational on 4.5 MHz and, on 17 August, staff from Telecom Research Laboratories and National Measurement Laboratory installed and set a rubidium standard and put VNG on time. The voice announcing cartridges were inserted for the first time 10 months. The voice was that of Radio Australia's Barry Seeber and the announcement was recorded free of charge by Radio Australia.
However, the success was short-lived. With the appearance of the voice announcement, complaints started coming in from operators in the Sydney area, who had been allocated frequencies close to 4.5 MHz, that VNG was drowning them out. On 18 August, the Radio Frequency Licensing Branch of the Department of Transport and Communications ordered that VNG be switched off until the problem was sorted out.
At a meeting between Radio Frequency Licensing, the Precise Time Working Group and Llandilo on 21 September, it was pointed out that VNG's old

frequencies, 4.5, 7.5 and 12.0 MHz, are outside the bands in the Australian Radio Frequency Spectrum allocated to standard frequency and time signal services. The Department of Transport and Communications people wanted to allocate 5.0, 10.0 and 15.0 MHz to VNG, to put it into the correct part of the spectrum. To have the old frequencies reallocated would require alteration of the Spectrum Management Plan. This would take about 12 months. This option will probably be pursued but, to get VNG back on the air quickly, it was decided to accept 5.0, 10.0 and 15.0 MHz as an interim measure. There was a very negative reaction to the new frequencies from users with overseas interests because of the number of similar services on the same frequencies. For this reason there was a delay in applying for the licenses.
VNG was granted a temporary license to transmit for a few hours on 4.5 MHz on the nights of 21-22 August and 21-22 October so that astronomers could time grazing occultations. Aside from that it remained dormant and seemed to be in an impasse.
Finally, the VNG Users Consortium met in October and decided that the licenses on the new frequencies should be paid, but that VNG should go on the air initially only on 5.0 MHz to cause minimum disruption on those crowded channels. Radio Frequency Licensing then found that the International Radio Regulations require international approval of a frequency change, so the decision to go to air continuously on 5.0 MHz from 1 November was stymied.
DOTC granted a temporary license for 5.0 MHz from 7-18 November so that VNG could be used as a backup to Omega during annual station maintenance. The new voice announcement was done by amateur radio operator, Graham Conolly, a Sydney ABC news reader prior to his retirement. He recorded it free of charge in the Brisbane studios of the ABC while on holiday at Expo.
The heart of VNG is three small racks of electronics: precision quartz oscillators (controlled by a two-tone signal generated from a caesium beam primary standard at Telecom Australia Research Laboratories), time signal generators, fixed frequency synthesisers, announcing machines, supervisory equipment, DUTI code generators, civil time receivers, and power supplies. A rubidium standard is being used instead of the oscillators until Telecom instals the connection to the two-tone. The slow time code also awaits the installation of a private line. The VNG transmitters are STC HF broadcast transmitters, designed to deliver an output of 10 kW carrier power over the frequency range 3.2 - 28.0 MHz. When the full VNG service is running, one transmitter will be left tuned to each of the three frequencies; the fourth transmitter will be used as a standby. At present, one transmitter is tuned to 4.5 MHz, another to 5.0 MHz, a third is operational, and the fourth needs a lot of work. The transmitters are quick and easy to retune.
At the time of writing (9 February 1989), VNG is transmitting on 5.0 MHz, through a Wells quadrant aerial, on a three months temporary license which commenced on 8 December 1988.
Permanent continuous transmissions will start as soon as approval is received from the International Frequency Registration Board. AUSLIG will fund the running costs of VNG for a number of years, but a certain percentage of cost recovery will be required from users.
REFERENCES Harris, R.W. 1987: VNG, standard frequency and time signal service,
Lyndhurst, Victoria. National Standards Commission Seminar on Precise Time Comparisons, 1 December 1987.
STC HF Broadcast Transmitter Handbook.

An automatic detector and onset time picker for the Warramunga array.
Spiro Spiliopoulos*
The Warramunga array is an L-shaped array of seimometers, of aperture 20 kms., situated
near Tennant Creek in Austtalia. The array forms part of the Austtalian network of insttuments
used for the detection of nuclear explosions and earthquakes. As an array of this size is expected
to detect hundreds of events per day it is necessary to automate as much of the detection and
analysis procedure as possible. A poster is presented detailing an algorithm for the automatic
detection of seismic events.
Briefly the algorithm takes one hours data from each of the twenty channels of the array,
filters it and forms 400 beams. Each beam is formed by phasing the array to a unique azimuth and
velocity and thus looks at a particular region of the globe. The detection is done using a threshold
method. The power in the beam is calculated over a three second window and a twenty second
window, the ratio of these values is then compared to a threshold value which, when exceeded,
causes the detector to flag an event The detections are then logged. At this stage the beams
formed have apparent velocities between 8 kmlsec and 900 kmlsec and are equally distributed
azimuthally. The major problems encountered in this procedure are getting the software to run as
quickly as possible and the triggering of the detector by false alarms. These problems are
discussed and results are presented.
To further automate the analysis procedure an automatic onset picker (AOP) is required. The
aim of the AOP is to pick as accurately the onset time of a seismic event. This time will then be
used to determine the frequency and amplitude of the signal. An AOP is being developed and
although still in an early stage some results of the AOP are presented. Once a detection is declared
the beamed up signal is passed onto the AOP which filters it and a Hilbert ttansform is applied.
The ttansformed signal is then passed through a low pass filter, the result then forms the
"characteristic function" which is used to pick the onset time.
* Austtalian Seismological Centre Bureau of Mineral Resources Jamieson House Canberra 2601 ACT

MAGNITUDE QUANTIFICATION OF STABLE CONTINENTAL EARTHQUAKES, WITH EMPHASIS ON AUSTRALIA
ARCH C. JOHNSTON, Center for Earthquake Research and Information (CERI) Memphis State University, Memphis, Tennessee 38142, U.S.A.
A data set consisting of over 1,000 earthquakes, both instrumental and historical, from the stable continental cores of the world has been quantified in terms of seismic moment magnitude (M) as defined by Hanb and Kanamori (1979). The quality of the assigned magnitude grades from highest for instrumentally determined Mo to lowest for only a 10 value with no ancillary data. A major effort was made to correlate MMI (I, II, III), IV, V, VI areas to log (Mo) for each stable continent region. In this regard the Australian data were exceptionally good and uniform in comparison with other continents. Continent-scale attenuation variations contribute to the scatter of the data on which these relationships are based, but this is minimized by the a priori exclusion of active tectonic zones. From the direct correlation of instrumental MOl the important global formulas in descending order of preference are:
10g(Mo) = 22.47 - 0.40(Ms) + 0.14(M,,)2 log(Mo) = 23.33 - 1.28(mb) + 0.26(mb)2 10g(Mo) = 25.76 - 2.72(inLg) + 0.43(mLg)2 log(Mo) = 20.94 +0.3610g(A vI ) + 0.141og2 (AVI) log(Mo) = 26.90 - 3.10log(Av) + 0.5210g2 (Av) log(Mo)= 30.62 -4.671og(A1V ) + 0.6510g2 (Av) log(Mo) = 47.34 - 10.81l0g(A f ) + 1.171og2 (Af)
These results have been found to yield generally internally consistent M - estimates among each other.
The largest stable continental earthquakes all occurred in rifted or extended crust. The list is headed by the New Madrid, North America sequence of 1811-12 (M 8.0-8.4), the 1819 Kutch India event (M 7.8) with a fault scarp 90-140 km in length, 1933 Baffin Bay, North America (M 7.7), and two M 7.6 earthquakes, 1886 Charleston, South Carolina and 1604 southeast China coast.
The largest Australian earthquake-the 1906 Exmouth Plateau event-has associated uncertainties in both size and location. We judge it occurred in subsided continental crust and assign the magnitude of M7.2 based on the M" 7.2 of Abe and Noguchi 1983) rather than the MR 7.8 of Gutenberg and Richter (1954). A "top ten" ranking of Australian earthquakes using the global formula with primary data type and reference is as follows:
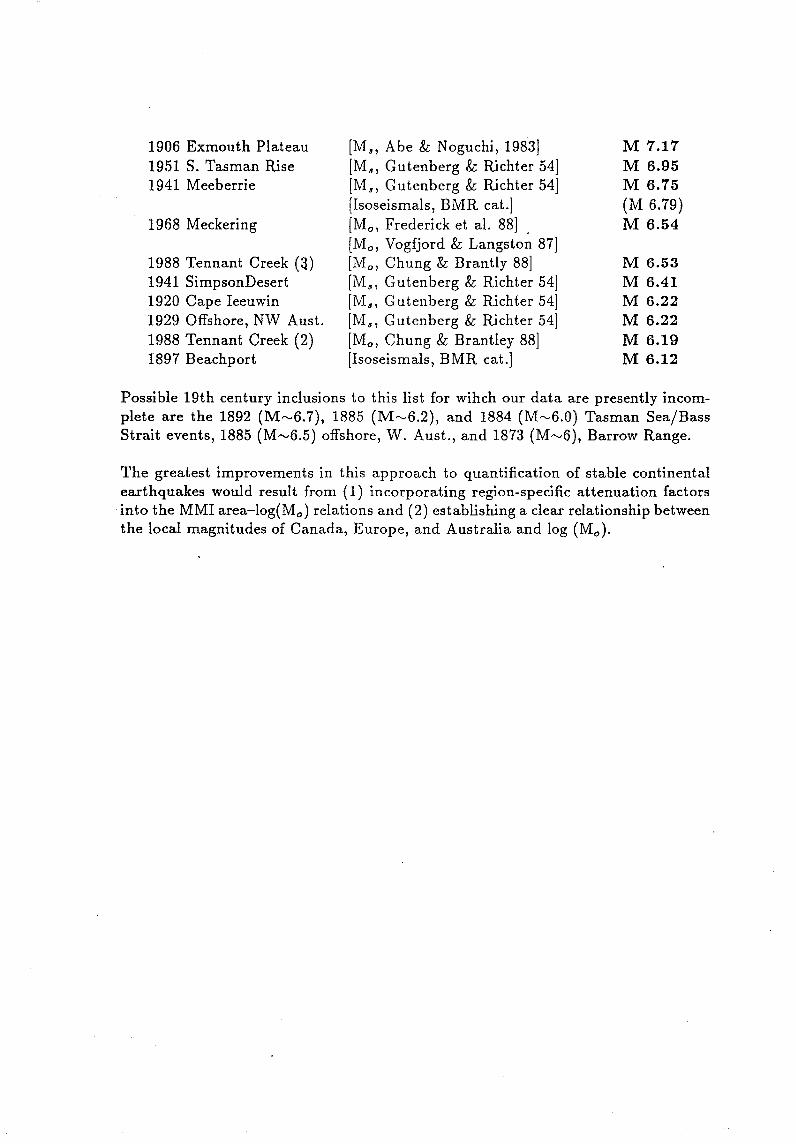
1906 Exmouth Plateau [M!, Abe & Noguchi, 1983J M 7.11 1951 S. Tasman Rise [M6' Gutenberg & Richter 54J M 6.95 1941 Meeberrie [M!, Gutenberg & Richter 54J M 6.75
[Isoseismals, BMR cat.J (M 6.79) 1968 Meckering [Mo, Frederick et al. 88J M 6.54
[Mo, Vogfjord & Langston 87J 1988 Tennant Creek (~) [Mo, Chung & Brantly 88] M 6.53 1941 SimpsonDesert [M!l Gutenberg & Richter 54J M 6.41 1920 Cape Ieeuwin [M6l Gutenberg & Richter 54] M 6.22 1929 Offshore, NW Aust. [M!l Gutenberg & Richter 54J M 6.22 1988 Tennant Creek (2) [MOl Chung & Brantley 88J M 6.19 1897 Beachport [Isoseismals, BMR cat.] M 6.12
Possible 19th century inclusions to this list for wihch our data are presently incomplete are the 1892 (M",6.7), 1885 (M",6.2), and 1884 (M"-'6.0) Tasman Sea/Bass Strait events, 1885 (M"'6.5) offshore, W. Aust., and 1873 (M",6), Barrow Range.
The greatest improvements in this approach to quantification of stable continental earthquakes would result from (1) incorporating region-specific attenuation factors
. into the MMI area-Iog(Mo ) relations and (2) establishing a clear relationship between the local magnitudes of Canada, Europe, and Australia and log (Mo ).

LOG LINEAR ESTIMATION OF EARTHQUAKE MAGNITUDE
FROM ISOSEISMALS
Marion Michael-Leiba*
Two methods of log linear estimation of earthquake magnitude from isoseismals approximate ML usually to half a magnitude unit or better.
In the first, applicable for southeastern Australian events, the Richter magnitude, ML, for historical earthquakes can be obtained from the Modified Mercalli intensity, I, and hypocentral distance, R (km) using the formula:
ML = 1.13 lnR + 0.667 I - 2.60
A magnitude is calculated from each intensity contour with a mean radius greater than 35km, and the arithmetic mean of these magnitudes is designed MI. For Tasmanian and Victorian events for which the MMIII contour is not included in the magnitude determination, a correction of -0.2 should be applied to MI. For New South Wales earthquakes, the correction is -0.1.
In the second, the formula:
ML = 1.06 In R(IV) + 0.16
provide a quick and simple means of estimating the Richter magnitude, ML, of an earthquake from the mean MMIV isoseismal radius, R(IV) km. It provides a satisfactory method for estimating the magnitude of larger (M~3.8) earthquakes for which a radius of perceptibility cannot be determined accurately.
*Australian Seismological Centre, Bureau of Mineral Resources, GPO Box 378, Canberra, ACT,2601.

ATTENUATION AND THE ML SCALE IN SOUTHEASTE~ AUSTRALIA 2
Marion Michael-Leiba and Kim Ma1afant
In southeastern Australia, measurements of maximum trace amplitudes were made from 181 short period vertical seismograms recorded at hypocentra1 distances of 3-1484 km from 36 earthquakes. They were converted to Wood-Anderson maximum trace amplitudes, A mm, making no correction for the measurements having been made on the vertical component, and assuming a maximum Wood-Anderson magnification of 2800. It was assumed that a magnitude ML3.0 earthquake has a maximum trace amplitude of 1 mm on a Wood Anderson seismograph at a distance of 100 km, and that the correction to ML because of vertical component measurement is +0.13. Then ML = log A + n log(.lL) + k(R-100) + 3.0 + 0.13 + S
100 where n is the geometric spreading factor, k the attenuation coefficient, R km the hypocentra1 distance and S the station correction.
The model fitted to the data was -3.13 - log A = n log (.lL) + k(R-100) - Mi + SJ.
100 where M. is the individual earthquake magnitude, and the station
1 correctlons, S., add up to zero. J
The model was fitted using the GLIM package (Baker and Ne1der, 1978) as a linear regression with normal error distribution. The solution gives values for the 36 earthquake magnitudes as well as for n, k and the station corrections.
The model fits 2xtremely well, accounting for 94% of the variation in the data - an R value of 0.94. All variables give a highly significant reduction in deviance, with the attenuation parameter n being highly significant. The estimates of nand k are 1.337 ± 0.0931 and O.oooSSO ± 0.000122 respectively. Analysis of variance indicates significant (P<O.OOl) earthquake and station adjustments as well as attenuation effects.
The new ML scale for southeastern Australia is: ML = log A + 1.337 log(-R-) + 0.000SSO(R-100) + 3.13 + S.
100 J Comparisons of magnitudes of 34 events calculated using this scale with those determined empirically using the normal BMR method (Richter attenuation with Drake correction and vertical component correction) suggest that events with ML 2.2 or less are estimated reasonably correctly using the BMR method, whereas those with ML = 2.7 - 4.3 are overestimated by up to 0.4 of a magnitude unit. This is because the southeastern Australian attenuation is very similar to the Richter attenuation for distances ~200 km, but is markedly less than the Richter attenuation for distance >200 km.
The station corrections are 0.0 for CMS, TOO, BFD and DAL, -0.1 for COO and RMQ, -0.2 for STK, + 0.1 for CNB and + 0.3 for RIV. These values should be subtracted from the individual station magnitude to give an estimate of the mean magnitude.
REFERENCE Baker, R.J. and Ne1der, J.A. 1978: The GLIM System,
Release 3, NAG, Oxford.
1. Australian Seismological Centre, BMR, Canberra 2. NRIC, Dept. of Primary Industries and Energy, Canberra
NEW LOCAL MAGNITUDE SCALES IN WESTERN AUSTRALIA 112
by B.A. Gaull , P.J. Gregson and K. Malafant 1 BMR Mundaring Geophysical Observatory, Mundaring, WA. 2 BMR Australian Seismological Centre, Canberra, ACT.
Earthquakes which were located approximately 100km from the Mundaring Wood-Anderson seismograph (WAS) were assigned a Richter magnitude (ML), using the definition of Richter (1958): " ... an earthquake recording with trace amplitude of Imm measured on a standard seismogram at 100km, is assigned ML3". Peak trace amplitudes for the Sand L phases at each recording station for each of these events were converted to equivalent WAS amplitudes. The greater of the two amplitudes for each reading was multiplied by 1.34 to compensate for use of vertical instead of horizontal sensors as used by the WAS. Also, so that amplitudes derived from one earthquake could be compared with those from another, they were all normalised to ML3. The near-field amplitudes were obtained from accelerograms using the assumption of simple harmonic motion. Once the amplitude function using the above criteria was established, ML control could be and was obtained for earthquakes located anywhere in the state.
It was assumed that seismic attenuation could be described by the relation: -log A = Co log R + CIR + C2, where A is the maximum trace amplitude in mm on a standard WAS, located R km from the hypo centre of an earthquake. A standard linear regression was carried out on the data base of over 700 (R,A) points to determine the 3 constants. An adjustment to the baseline constant, C2, was necessary so that the fitted curve passed through the point of definition (100,1.0). This was attributed to the fact that, unlike the WAS, the longer-period waves on the regional network were being swamped by the short period response.
The resultant local magnitude scale is given by: ML(WA) = 10gA + 1.13610g R + 0.0006453R + 0.668 + Si
where Si is the station correction. Magnitudes from this scale can be directly compared with those of Greenhalgh and Singh (1986) for South Australia and Hutton and Boore (1987) in California, as all three are almost collinear in the O<R<100 km range where the different definitions have been suggested. However the attenuation is considerably less in Western Australia. It is also noted that from a sample of 30 earthquakes, that previously determined magnitudes were on average being underestimated by 0.1, overestimated by 0.2 and 0.5 for short, mid and long range events respectively. In addition to this it is reported that significantly less scatter was achieved using the new scale.
Magnitudes of about 100 events were then derived using the above definition, and the duration of the codas (t, in s) recorded on the WA-based seismographs for each event noted. The ML-t data were then plotted at varying R-ranges and a preliminary t-based magnitude scale determined and is given by:
ML = 1.010gi + 0.0020t + O.OOlR.

REFERENCES: Greenhalgh, S.A., and Singh, R. 1986 - A revised magnitude scale for South Australian earthquakes. Bulletin of the Seismological Society of America, 76, 3, 757-769.
Hutton, L.K., and Boore, D.M., 1987 - The ML scale in southern California. Bulletin of the Seismological Society of America, 77, 6, 2074-2094.
Richter, C.F., 1958 - Elementary seismology. W.H. Freeman and Company, San Francisco, 1958.