buoy and generator interaction with ocean waves: studies of a
TRANSCRIPT


To Magdalena

Front cover: The buoy of the wave energy converter L3. In the background, Klam-merskär and the observation tower. June 2009. Back cover: The rubber dinghy Bullen,which has made many trips to and from Klammerskär, with and without the author. Inthe background, the southern marker buoy for the Lysekil research site can be seen.July 2011.

List of Papers
This thesis is based on the following papers, which are referred to in the textby their Roman numerals.
I Leijon, M., Boström, C., Danielsson, O., Gustafsson, S., Haikonen, K.,Langhamer, O., Strömstedt, E., Stålberg, M., Sundberg, J., Svensson,O., Tyrberg, S., and Waters, R. “Wave Energy from the North Sea:Experiences from the Lysekil Research Site”. Surveys in Geophysics,Vol. 29, Issue 3, pp. 221–240, May 2008.
II Tyrberg, S., Stålberg, M., Boström, C., Waters, R., Svensson, O.,Strömstedt, E., Savin, A., Engström, J., Langhamer, O., Gravråkmo,H., Haikonen, K., Tedelid, J., Sundberg, J., and Leijon, M. “TheLysekil Wave Power Project: Status Update”. Proceedings of the10th World Renewable Energy Congress, WREC, Glasgow, UK,pp. 1061–1066, July 2008.
III Leijon, M., Waters, R., Stålberg, M., Svensson, O., Boström, C., Ström-stedt, E., Engström, J., Tyrberg, S., Savin, A., Gravråkmo, H., Bern-hoff, H., Sundberg, J., Isberg, J., Ågren, O., Danielsson, O., Eriksson,M., Lejerskog, E., Bolund, B., Gustafsson, S., and Thorburn, K. “Catchthe Wave to Electricity: The Conversion of Wave Motions to Electric-ity Using a Grid-Oriented Approach”. IEEE Power & Energy MagazineVol. 7, Issue 1, pp. 50–54, January/February 2009.
IV Tyrberg, S., Gravråkmo, H., Leijon, M. “Tracking a Wave Power BuoyUsing a Network Camera — System Analysis and First Results”. Pro-ceedings of the 28th International Conference on Offshore Mechanicsand Arctic Engineering (peer-reviewed), OMAE, Honolulu, USA, June2009.
V Tyrberg, S., Waters, R., and Leijon, M. “Wave Power Absorption as aFunction of Water Level and Wave Height: Theory and Experiment”.IEEE Journal of Oceanic Engineering, Vol. 35, Issue 3, pp. 558–564,July 2010.
VI Boström, C., Lejerskog, E., Tyrberg, S., Svensson, O., Waters, R.,Savin, A., Bolund, B., Eriksson, M., and Leijon, M. “ExperimentalResults From an Offshore Wave Energy Converter”. Journal ofOffshore Mechanics and Arctic Engineering, Vol. 132, Issue 4,pp. 041103-1–041103-5, November 2010.

VII Tyrberg, S., Svensson, O., Kurupath, V., Engström, J., Strömstedt, E.,and Leijon, M. “Wave Buoy and Translator Motions — On-site Mea-surements and Simulations”. IEEE Journal of Oceanic Engineering,Vol. 36, Issue 3, pp. 377–385, July 2011.
VIII Lejerskog, E., Gravråkmo, A., Savin, A., Strömstedt, E., Tyrberg, S.,Haikonen, K., Krishna, R., Boström, C., Rahm, M., Ekström, R., Svens-son, O., Engström, J., Ekergård, B., Baudoin, A., Kurupath, V., Hai,L., Li, W., Sundberg, J., Waters, R., and Leijon, M. “Lysekil ResearchSite, Sweden: A Status Update”. Proceedings of the 9th European Waveand Tidal Energy Conference (peer-reviewed), EWTEC11, Southamp-ton, UK, September 2011.
IX Lindroth, S. and Leijon, M., “Offshore Wave Power Measurements - aReview”, Renewable & Sustainable Energy Reviews, in press, availableonline, DOI:10.1016/j.rser.2011.07.123, September 2011.
X Lindroth, S. and Leijon, M., “Spectral Parameters and Wave EnergyConverter Performance”, Manuscript, October 2011.
Reprints were made with permission from the publishers. The author has alsocontributed to the following papers, not included in the thesis. Paper A is aconference version of Paper VI. For Paper B the contribution of the authorwas minor, and the scope differs somewhat from the rest of the papers.
A Boström, C., Lejerskog, E., Tyrberg, S., Svensson, O., Waters, R.,Savin, A., Bolund, B., Eriksson, M., and Leijon, M. “Experimentalresults from an offshore wave energy converter”. Proceedings of the27th International Conference on Offshore Mechanics and ArcticEngineering (peer-reviewed), OMAE, Estoril, Portugal, June 2008.
B Gravråkmo, H., Leijon, M., Strömstedt, E., Engström, J., Tyrberg, S.,Savin, A., Svensson, O., Waters, R., “Description of a Torus ShapedBuoy for Wave Energy Point Absorber”. Proceedings of RenewableEnergy 2010, Yokohama, Japan, June/July 2010. Received Best PaperAward.

Contents
1 Introduction . . . . . . . . . . . . . . . . . . . . . . . . . . . . . . . . . . . . . . . . . . 111.1 Wave energy and ways to capture it . . . . . . . . . . . . . . . . . . . . . 111.2 Working in engineering science . . . . . . . . . . . . . . . . . . . . . . . . 121.3 Aims of the thesis . . . . . . . . . . . . . . . . . . . . . . . . . . . . . . . . . . 13
2 Background . . . . . . . . . . . . . . . . . . . . . . . . . . . . . . . . . . . . . . . . . . 152.1 The Lysekil Project . . . . . . . . . . . . . . . . . . . . . . . . . . . . . . . . . 152.2 Timeline . . . . . . . . . . . . . . . . . . . . . . . . . . . . . . . . . . . . . . . . . 152.3 Theory . . . . . . . . . . . . . . . . . . . . . . . . . . . . . . . . . . . . . . . . . . 18
2.3.1 Describing waves . . . . . . . . . . . . . . . . . . . . . . . . . . . . . . . 182.3.2 Linear generators . . . . . . . . . . . . . . . . . . . . . . . . . . . . . . . 21
3 Ocean Measurements . . . . . . . . . . . . . . . . . . . . . . . . . . . . . . . . . . . 233.1 History and development of wave power measurements . . . . . . 233.2 The fundamental difficulties . . . . . . . . . . . . . . . . . . . . . . . . . . . 243.3 The work at Klammerskär . . . . . . . . . . . . . . . . . . . . . . . . . . . . 25
3.3.1 Successes and failures . . . . . . . . . . . . . . . . . . . . . . . . . . . 263.4 Interpreting measurements . . . . . . . . . . . . . . . . . . . . . . . . . . . . 27
3.4.1 Comparing measurements with incoming waves . . . . . . . . 294 WEC Performance . . . . . . . . . . . . . . . . . . . . . . . . . . . . . . . . . . . . . 31
4.1 Defining performance . . . . . . . . . . . . . . . . . . . . . . . . . . . . . . . 314.2 Controlling the variables . . . . . . . . . . . . . . . . . . . . . . . . . . . . . 32
4.2.1 AC/DC load and sea state . . . . . . . . . . . . . . . . . . . . . . . . . 334.2.2 Water level and wave height . . . . . . . . . . . . . . . . . . . . . . . 344.2.3 Spectral shape . . . . . . . . . . . . . . . . . . . . . . . . . . . . . . . . . 34
5 Summary of Papers . . . . . . . . . . . . . . . . . . . . . . . . . . . . . . . . . . . . 376 Conclusions . . . . . . . . . . . . . . . . . . . . . . . . . . . . . . . . . . . . . . . . . . 43
6.1 Measurements and buoy/generator motion . . . . . . . . . . . . . . . . 436.2 WEC Performance . . . . . . . . . . . . . . . . . . . . . . . . . . . . . . . . . . 44
7 Acknowledgements . . . . . . . . . . . . . . . . . . . . . . . . . . . . . . . . . . . . 458 Svensk sammanfattning . . . . . . . . . . . . . . . . . . . . . . . . . . . . . . . . . 47References . . . . . . . . . . . . . . . . . . . . . . . . . . . . . . . . . . . . . . . . . . . . . . 49


Abbreviations and nomenclature
Abbreviation Meaning
AC Alternating CurrentDC Direct CurrentGPS Global Positioning SystemL1–9 Wave energy converter 1–9LRS The Lysekil Research SiteWEC Wave Energy Converter
Symbol Unit Entity
Φ Wb Magnetic fluxρ kg/m3 DensityE V Electromotive forceH m Wave heightHm0 m Significant wave heightJ W/m Energy transportN - Number of coil turnsS( f ) m2/Hz Variance spectral densityT s PeriodT−10 s Energy periodTp s Peak periodf Hz Frequencyf0 Hz Fundamental frequencyf−10 Hz Energy frequencyfp Hz Peak frequencyg m/s2 Gravitational constantmk m2Hzk Spectral moment number kt s Timew m Water level
9


1. Introduction
1.1 Wave energy and ways to capture itThe ever increasing need for energy in the world and the dangers of furtheruse of fossil fuels have put a focus on renewable energy technologies. Thatthere is a vast amount of energy in ocean waves has been known for a longtime (see e.g. [1,2]), and this also becomes very evident to anyone who spendstime out at sea. The exact amount of power available from waves is impossibleto determine, since it depends on the performance of the technology chosen,but an estimation that about 1 TW continuously descends on the coastlines ofthe world was made in [3]. Regardless of the precision in that statement, it isclear that our oceans carry enough energy for wave power to be interesting tostudy further.
Numerous projects have tried to harvest the energy in waves. There arequite a few projects still active around the world, the most famous of whichis possibly the Pelamis [4, 5]. Some other concepts that are, or have been,active in recent years are the Wave Dragon [6], the Archimedes Wave Swing[7], Oceanlinx [8], the Ocean Energy Buoy [9], the Oregon State Universityproject [10] and the Backward Bent Duct Buoy [11]. Further projects, pastand present, can be found in a recent review by Falcão [12]. Historically, mostattempts have failed in creating a technology that can survive the harsh oceanwave climates, or in designing a technology that is economically viable.
There are some considerable advantages in using wave energy in compar-ison to other intermittent energy sources, such as wind and solar energy. Butthere are also some fundamental difficulties. On the positive side, wave en-ergy is a concentrated form of energy, since waves absorb the energy fromwinds blowing over large areas. This also means that waves, in comparisonwith winds, are more predictable and more evenly distributed in time. Even ifthe wind abates, waves will keep rolling in for some time.
The major difficulty of tapping into the huge energy resource of oceanwaves is the large variations of the powers and forces involved. For a sys-tem to be sustainable, it needs to produce electricity at average wave climates,but still survive harsh weathers and storms. There is therefore a risk of endingup with systems that are either too bulky to be economically viable, or con-versely, too fragile to survive in the long run. The Lysekil project, run by theDivision of Electricity at Uppsala University, is an attempt to design a waveenergy system which is sturdy enough, without becoming too expensive.
11
(a)
(b)
(c)f
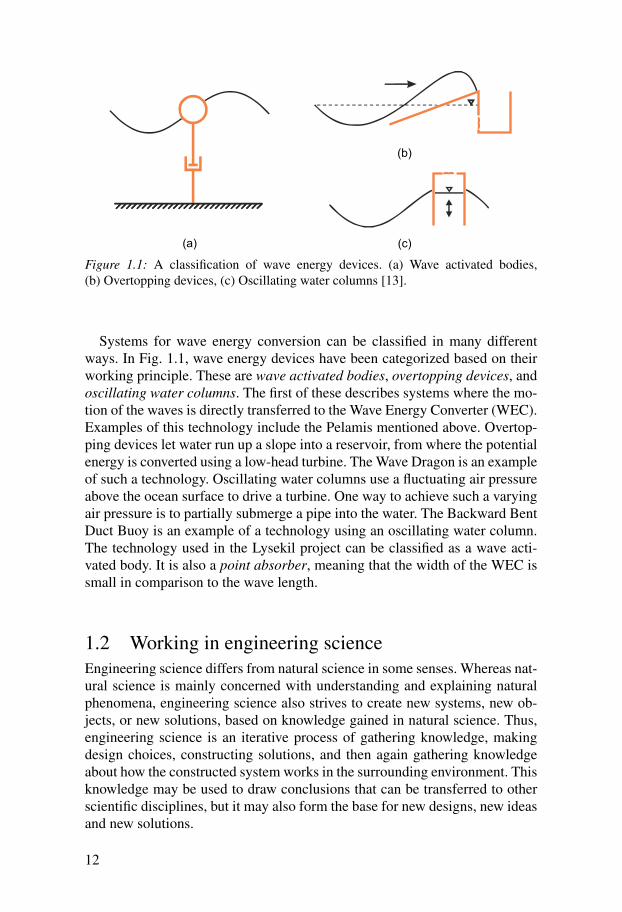
Figure 1.1: A classification of wave energy devices. (a) Wave activated bodies,(b) Overtopping devices, (c) Oscillating water columns [13].
Systems for wave energy conversion can be classified in many differentways. In Fig. 1.1, wave energy devices have been categorized based on theirworking principle. These are wave activated bodies, overtopping devices, andoscillating water columns. The first of these describes systems where the mo-tion of the waves is directly transferred to the Wave Energy Converter (WEC).Examples of this technology include the Pelamis mentioned above. Overtop-ping devices let water run up a slope into a reservoir, from where the potentialenergy is converted using a low-head turbine. The Wave Dragon is an exampleof such a technology. Oscillating water columns use a fluctuating air pressureabove the ocean surface to drive a turbine. One way to achieve such a varyingair pressure is to partially submerge a pipe into the water. The Backward BentDuct Buoy is an example of a technology using an oscillating water column.The technology used in the Lysekil project can be classified as a wave acti-vated body. It is also a point absorber, meaning that the width of the WEC issmall in comparison to the wave length.
1.2 Working in engineering scienceEngineering science differs from natural science in some senses. Whereas nat-ural science is mainly concerned with understanding and explaining naturalphenomena, engineering science also strives to create new systems, new ob-jects, or new solutions, based on knowledge gained in natural science. Thus,engineering science is an iterative process of gathering knowledge, makingdesign choices, constructing solutions, and then again gathering knowledgeabout how the constructed system works in the surrounding environment. Thisknowledge may be used to draw conclusions that can be transferred to otherscientific disciplines, but it may also form the base for new designs, new ideasand new solutions.
12

The work with the wave energy system at the Division of Electricity is anexample of the engineering process described above. Theories of wave dy-namics, electromagnetism and mechanics have been used together with ex-isting solutions within power electronics and mechanical engineering to de-velop a system that has then been deployed in the ocean. The workings of thishuman-made system, and its interaction with the sea, have then been the focusof our studies. As we have learned more and more, we have been able to takesteps towards more efficient wave energy converters, and we have also beenable to draw several conclusions on the workings of our system in relation todifferent natural and engineering parameters. The extent to which these con-clusions can be applied to general cases may vary, but regardless of this, thework gives us the foundation needed to take further steps, and to find the nextquestions to ask.
1.3 Aims of the thesisDescribing work within engineering science, this thesis does not follow onesingle straight line, as such a line does not exist, now or in the future. Rather,it is composed of a number of papers describing work within the same gen-eral area, but with slightly different focuses. The general aim of the papers isto increase the understanding of wave–buoy–generator interaction in a wavepower plant, so that the performance can be increased. This broad aim can betranslated to a number of more specific questions to be answered:
• How can we measure buoy and generator motion?• How does the buoy behave in the waves?• How do the motions of the waves, the buoy and the generator relate?• What electrical and oceanic parameters impact the performance of a wave
energy converter? How can this impact be described?• To what extent can we simulate and predict the performance of a wave
energy converter?
Due to the nature of engineering science, the answers to the questions abovemay give very different results. Some answers will stimulate new theories,others will be used to confirm simulations, and others still could provide inputfor mechanical solutions. Certain answers, finally, will not lead anywhere.However, it is in the process of working with the questions that we find agood path, and it is often afterwards that the big picture can be distinguished,rather than before.
13


2. Background
2.1 The Lysekil ProjectThe Lysekil wave energy project was initiated with simplicity as a guidingprinciple, since the harsh conditions at sea mean that complex systems have ahigh risk of failure, and are associated with high maintenance costs. The ideaof simplicity meant that direct drive (i.e. without gearboxes or energy stor-age) was favoured, and led to the wave energy converter concept illustrated inFig. 2.1. The buoy follows the motion of the waves and the line transmits thismotion to the translator in the linear generator, where electricity is produced.The chosen system means that the most complex part (the generator) is placedon the seabed, away from the extreme forces of the waves. The direct drivemeans that the system becomes more robust, but also that it is impossible totransmit the converted electricity directly to the grid, since voltages will varyboth in amplitude and frequency. There is a need for an intermediate step,where the voltages from several WECs are rectified, added together and theninverted again to the grid frequency.
The experimental work within the project has taken place both at theÅngström Laboratory in Uppsala and out at sea near Lysekil on the WestCoast, at the Lysekil Research Site (LRS). A sea chart of the area, fromPaper IV, can be found in Fig. 2.2. The site is also described in moredetail in Paper I and II. Eight licentiate theses [14–21] and seven doctoraltheses [13, 22–27] have been published regarding the Lysekil project.The research covers many different topics, such as power electronics,generator technology, hydrodynamics, wave resource descriptions, structuralmechanics, measurement systems and environmental impact.
2.2 TimelinePaper II and VIII give an overview of the Lysekil project history, on severaldifferent areas. In addition to this, Paper I and III describe the main ideasbehind the project, and go into some more detail. For a better understandingof the timing of different steps, a brief time line is also presented here:
2002–2004• The project is started during the spring of 2002.
15

Stator
Translator
Retractingsprings
Buoy
Line
Sealing
9 m
Foundation
End stop spring
End stop spring
Figure 2.1: The wave energy converter L3 (left), and a schematic description of theconcept (right). Adapted from Paper VII.
• Investigations are made of the bottom conditions at LRS during the summerof 2003.• A laboratory version of the linear generator is finished in December 2003.• A wave measuring buoy is deployed at LRS in April 2004.• The National Maritime Administration deploys buoys to mark LRS to the
public in October 2004.
2005• An experimental setup to measure forces on a cylindrical buoy is deployed
at LRS in March.• The four first “biology buoys” are deployed at LRS during the fall. The
purpose of these is to study the environmental impact of installing buoysand foundations in an otherwise empty ocean area.• The construction of the first wave energy converter, L1, is started.
2006• A measurement station is built on Härmanö, close to LRS, during the first
months of the year.
16

Figure 2.2: The Lysekil Research Site and its surroundings. The dash-dotted line rep-resents the power cable from the wave park to shore. The dots surrounded by thedashed line represent wave energy converters and biology buoys. From Paper IV.
• L1 is deployed at LRS on the 13th of March, and the first set of experimentaldata from the generator is gathered.
2007• Additional biology buoys are deployed.• In July, a tower is erected on the islet of Klammerskär, near the research
site, to form the base for a future observation system. A picture of theresearch site, taken from the tower, can be seen in Fig. 2.3.
Figure 2.3: The Lysekil research site, as seen from the observation tower. From Pa-per VI.
17
2008• A toroidal buoy is attached to L1 in May, to investigate if the design can
help decrease the peak forces on the generator.• In July, a network camera is installed in the tower on Klammerskär, en-
abling real time observation of the park from Uppsala.• During the fall and winter, WECs number two and three (L2 and L3) are
finished and transported to Lysekil.
2009• L2 and L3 are deployed at LRS in February.• In March, the substation is deployed at LRS.• In October, WEC number four (L9)1 is deployed.• In connection to the deployment of L9, L2 and L3 are also taken out of the
water for maintenance.
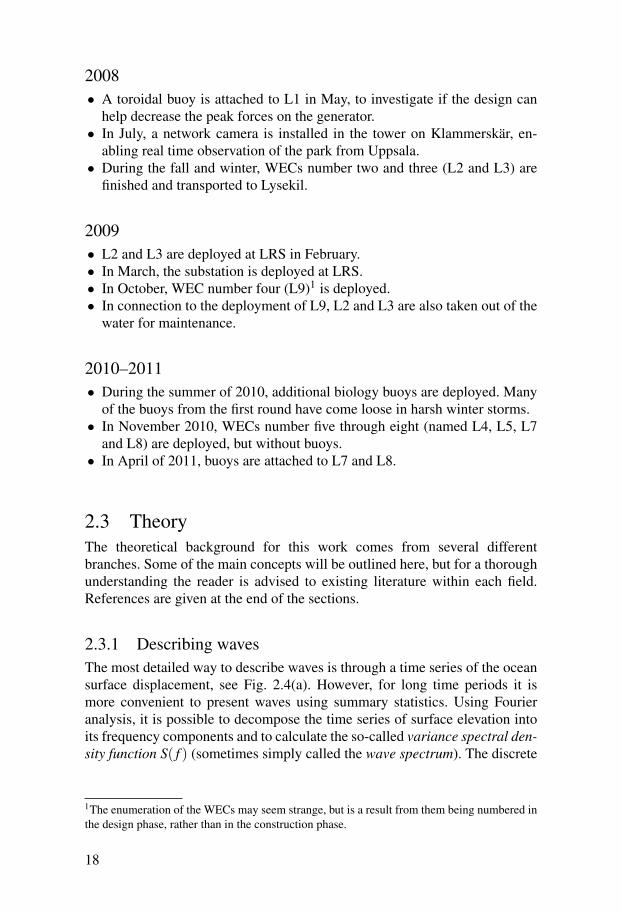
2010–2011• During the summer of 2010, additional biology buoys are deployed. Many
of the buoys from the first round have come loose in harsh winter storms.• In November 2010, WECs number five through eight (named L4, L5, L7
and L8) are deployed, but without buoys.• In April of 2011, buoys are attached to L7 and L8.
2.3 TheoryThe theoretical background for this work comes from several differentbranches. Some of the main concepts will be outlined here, but for a thoroughunderstanding the reader is advised to existing literature within each field.References are given at the end of the sections.
2.3.1 Describing wavesThe most detailed way to describe waves is through a time series of the oceansurface displacement, see Fig. 2.4(a). However, for long time periods it ismore convenient to present waves using summary statistics. Using Fourieranalysis, it is possible to decompose the time series of surface elevation intoits frequency components and to calculate the so-called variance spectral den-sity function S( f ) (sometimes simply called the wave spectrum). The discrete
1The enumeration of the WECs may seem strange, but is a result from them being numbered inthe design phase, rather than in the construction phase.
18
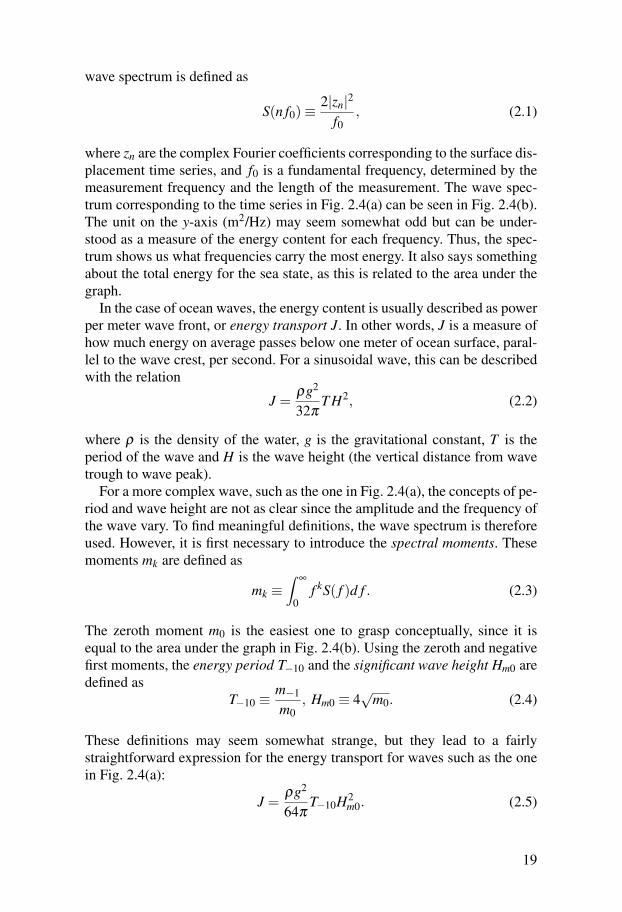
wave spectrum is defined as
S(n f0)≡2|zn|2
f0, (2.1)
where zn are the complex Fourier coefficients corresponding to the surface dis-placement time series, and f0 is a fundamental frequency, determined by themeasurement frequency and the length of the measurement. The wave spec-trum corresponding to the time series in Fig. 2.4(a) can be seen in Fig. 2.4(b).The unit on the y-axis (m2/Hz) may seem somewhat odd but can be under-stood as a measure of the energy content for each frequency. Thus, the spec-trum shows us what frequencies carry the most energy. It also says somethingabout the total energy for the sea state, as this is related to the area under thegraph.
In the case of ocean waves, the energy content is usually described as powerper meter wave front, or energy transport J. In other words, J is a measure ofhow much energy on average passes below one meter of ocean surface, paral-lel to the wave crest, per second. For a sinusoidal wave, this can be describedwith the relation
J =ρg2
32πT H2, (2.2)
where ρ is the density of the water, g is the gravitational constant, T is theperiod of the wave and H is the wave height (the vertical distance from wavetrough to wave peak).
For a more complex wave, such as the one in Fig. 2.4(a), the concepts of pe-riod and wave height are not as clear since the amplitude and the frequency ofthe wave vary. To find meaningful definitions, the wave spectrum is thereforeused. However, it is first necessary to introduce the spectral moments. Thesemoments mk are defined as
mk ≡∫
∞
0f kS( f )d f . (2.3)
The zeroth moment m0 is the easiest one to grasp conceptually, since it isequal to the area under the graph in Fig. 2.4(b). Using the zeroth and negativefirst moments, the energy period T−10 and the significant wave height Hm0 aredefined as
T−10 ≡m−1
m0, Hm0 ≡ 4
√m0. (2.4)
These definitions may seem somewhat strange, but they lead to a fairlystraightforward expression for the energy transport for waves such as the onein Fig. 2.4(a):
J =ρg2
64πT−10H2
m0. (2.5)
19

0 20 40 60 80 100 120
−0.1
−0.05
0
0.05
0.1
Time (s)
Sur
face
ele
vatio
n (m
)
(a) Time series representation.
0 0.1 0.2 0.3 0.4 0.5 0.6 0.7 0.8 0.9 10
0.002
0.004
0.006
0.008
0.01
Frequency (Hz)
Spe
ctra
l den
sity
(m
2 /Hz)
(b) Spectral density representation, S( f ).
Time (s)
Fre
quen
cy (
Hz)
20 40 60 80 100 1200
0.2
0.4
0.6
0.8
1
(c) Wavelet scalogram representation.
Figure 2.4: Different ways to present wave data. Adapted from Paper X.
This equation assumes that the deep water approximation is valid, which usu-ally means that the water depth must be larger than half the wavelength of thewaves.
Fig. 2.4(c) shows a wavelet scalogram. This is an alternative way to rep-resent waves and gives information both on the frequency content and thetime distribution of the energy. The colour in the scalogram corresponds toenergy, and the x-axis and y-axis display time and frequency respectively. Thescalogram is produced using dilations and translations of a so-called motherwavelet on the original signal. The mother wavelet is a fast decaying waveform whose shape can be varied depending on the application. In the case ofocean engineering the Morlet wavelet is often used [28], see Fig. 2.5.
20

−4 −3 −2 −1 0 1 2 3 4−1
−0.5
0
0.5
1
Figure 2.5: The Morlet wavelet, at arbitrary scale.
A more thorough introduction to wave theory and spectra can be found in[29] and [30]. Several papers have also been published on the use of waveletsin ocean engineering; see for example [31–34].
2.3.2 Linear generatorsThe purpose of a generator is to convert mechanical energy into electric en-ergy. Most conventional generators are of the rotating kind, but the systemstudied in this thesis uses a linear generator. However, the principles of elec-tric energy conversion do not differ, and a linear generator consists of the samekey components as its rotating sibling. Fig. 2.6 shows a schematic illustrationof a rotating and a linear generator. Both generators have a moving part (therotor/translator) and a static part (the stator). Magnets with alternating mag-netic direction are mounted on the moving part. All generators are based onFaraday’s law, which states that a changing magnetic field in a coil will inducean electromotive force E in that coil:
E =−NdΦ
dt. (2.6)
N is the number of coil turns and Φ is the magnetic flux. The changing mag-netic field can come from a motion of the coil, a motion of the magnet or achange of magnetic flux density. In Fig. 2.6 the magnets are of the permanentkind, but electromagnets can also be used, which allows for control of themagnetic field.
In a rotating generator, N in Eq. 2.6 remains constant. In a linear generatorhowever, there is a possibility for the translator to move out of the stator,resulting in a decrease of the active area, i.e. the area where the stator andthe translator overlap, see Fig. 2.6. This means that the voltage will drop, andthat the dynamics of the generator will change. The impact will among otherthings depend on the stator and translator lengths, the stroke length of thetranslator, the equilibrium position of the translator, and the load connected tothe generator. Paper V is an investigation of this effect.
21

Rotor
Stator
Translator
Stator
Conductor
Permanent magnet
Air gap
Figure 2.6: A rotating and a linear generator [13].
For a more thorough description of generators and electromagnetic theory,see e.g. [35–37]. Linear generators have been investigated thoroughly by e.g.[22].
22
3. Ocean Measurements
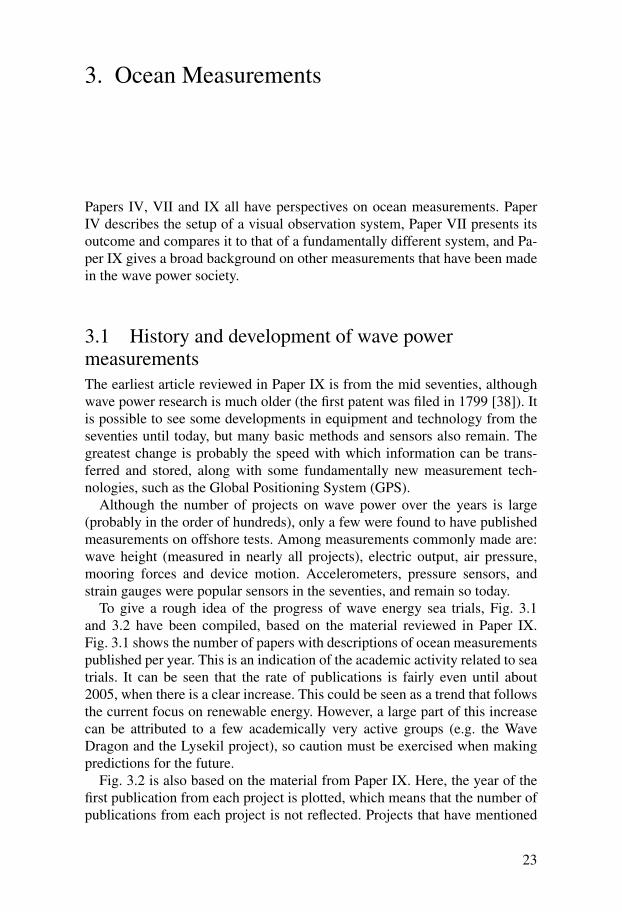
Papers IV, VII and IX all have perspectives on ocean measurements. PaperIV describes the setup of a visual observation system, Paper VII presents itsoutcome and compares it to that of a fundamentally different system, and Pa-per IX gives a broad background on other measurements that have been madein the wave power society.
3.1 History and development of wave powermeasurementsThe earliest article reviewed in Paper IX is from the mid seventies, althoughwave power research is much older (the first patent was filed in 1799 [38]). Itis possible to see some developments in equipment and technology from theseventies until today, but many basic methods and sensors also remain. Thegreatest change is probably the speed with which information can be trans-ferred and stored, along with some fundamentally new measurement tech-nologies, such as the Global Positioning System (GPS).
Although the number of projects on wave power over the years is large(probably in the order of hundreds), only a few were found to have publishedmeasurements on offshore tests. Among measurements commonly made are:wave height (measured in nearly all projects), electric output, air pressure,mooring forces and device motion. Accelerometers, pressure sensors, andstrain gauges were popular sensors in the seventies, and remain so today.
To give a rough idea of the progress of wave energy sea trials, Fig. 3.1and 3.2 have been compiled, based on the material reviewed in Paper IX.Fig. 3.1 shows the number of papers with descriptions of ocean measurementspublished per year. This is an indication of the academic activity related to seatrials. It can be seen that the rate of publications is fairly even until about2005, when there is a clear increase. This could be seen as a trend that followsthe current focus on renewable energy. However, a large part of this increasecan be attributed to a few academically very active groups (e.g. the WaveDragon and the Lysekil project), so caution must be exercised when makingpredictions for the future.
Fig. 3.2 is also based on the material from Paper IX. Here, the year of thefirst publication from each project is plotted, which means that the number ofpublications from each project is not reflected. Projects that have mentioned
23

1975 1980 1985 1990 1995 2000 2005 20100
5
10
15
Figure 3.1: Number of yearly publications that are describing ocean measurements,and are referenced in Paper IX.
1975 1980 1985 1990 1995 2000 2005 20100
1
2
3
4
5
6
Figure 3.2: Number of first publications per year from all projects referenced in Pa-per IX.
sea trials but not described any measurements are also included. The figuregives an indication to the progress of sea trials in general, regardless of aca-demic priorities. In is interesting to note that the increase at year 2005 thatwas seen in Fig. 3.1 can be seen here too.
The most recent European Wave and Tidal Energy Conference, which isthe major conference within wave energy, took place in the early fall of 2011.This was too late for the publications from the conference to be includedin Paper IX. A few papers presented details on measurements from offshoreocean tests however and could be mentioned here: [39] regarding the BOLTpoint absorber, [40] regarding the CETO unit, [41] regarding a version of theOcean Energy Buoy, [42] regarding the Oyster, and [43] regarding the Lysekilproject.
3.2 The fundamental difficultiesIn order to understand why relatively few projects have presented measure-ments on ocean trials, it might be valuable to reflect on the difficulties inmaking offshore measurements. As the aim of any wave energy project is
24

to capture incoming energy, the sites are almost always energetic and at timesimpossible to access. This means that (i) the window of opportunity for instal-lation and maintenance is short, (ii) the conditions in which the measurementsystem is to operate are harsh, (iii) nearby stationary points are rare, (iv) thechances of regularly checking if the system works are small, (v) the possibilityof using wired communications with the device is low, and (vi) the opportunityof long-time controlled testing on site is virtually non-existent. Finally thereis a need for the system to be self-sufficient on energy if regular exchanges ofbatteries are to be avoided.
Keeping the above difficulties in mind, it is perhaps not surprising that thenumber of reported offshore wave power measurements remains fairly low.Most projects have run across unexpected difficulties, such as malfunction-ing sensors, mooring failures, biofouling, leakages, destroyed equipment, andeven theft of sensors (see for example [44]).
It must also be remembered that not all projects have an interest in present-ing their results. Much research is performed within companies, which limitsthe need or drive for publishing results. Other projects may have performedmeasurements that are in principle open, but lack funding or sufficient resultsfor publishing.
3.3 The work at KlammerskärThe observation station on Klammerskär is an example of an offshore/near-shore measurement station. The setup of the station is thoroughly described inPaper IV. Some additional comments will be given here, to complete the pic-ture. As was stated above, most often a wave energy developer will not havethe possibility to perform measurements on her/his device from a stationarypoint, as most tests are made offshore. In the case of the Lysekil project, how-ever, there were two small islets south of the research site; Western and East-ern Klammerskär, on which an observation tower could be placed. The pur-pose of such a tower was primarily to enable observation of the site in harshweathers. There was also a secondary objective: to see if the motion of thebuoy could be tracked optically during operation. Thus, planning for a towerbegan in 2006. Several permits were needed: the consent of the land owner,a building permit, an exception from the coastal protection rule, and a permitfor camera surveillance. By the summer of 2007, all permits had been granted,and the tower was erected on Western Klammerskär in July 2007. During thefall and coming spring, the tower was equipped with an energy system, a 3Gmodem for communication, and finally the camera. Some images from theinstallation of the tower can be seen in Fig. 3.3.
In the rightmost image, the camera can be seen at the top of the tower. Inthe middle of the tower, there are four solar cell panels installed. The control
25

Figure 3.3: Setup of the observation system. Left: casting the foundation. Middle: theempty tower. Right: equipment installed.
equipment, the batteries, and the communication system are also installed inthe middle of the tower.
3.3.1 Successes and failuresKlammerskär is little more than some rocks sticking out of the water, and athigh waves the site is very hostile. Two images taken by the camera pointingstraight down can be seen if Fig. 3.4. The first one is taken on a calm day, andthe second one on a day when moderate waves are coming in. On such a dayit is impossible to access the tower.
As the conditions on Klammerskär are harsh, the strain on the tower and theequipment has been heavy. Twice, installed wind turbines have been wreckedand had to be dismounted. The first time it was due to the waves destroyingthe dump load, leading to the turbine spinning out of control. The second time
Figure 3.4: Two images taken by the camera at Klammerskär, on a calm day and on aday with moderate waves.
26

L9
Biology buoys
Northern marker buoy
Southern marker buoy
Figure 3.5: The Lysekil research site, iced in. February 11th, 2010.
it was possibly a lightning strike that destroyed the turbine, or the controlequipment that kept it from spinning too fast. At that time, melted pieces ofmetal could be found inside the turbine housing after taking it apart. Otherthings that have broken are: the ladder in the tower, the first electric cabinet,the heavy duty metal bars that held the cabinet, and the grounding cable.
Naturally, the strain on the installed WECs has been equally heavy. Fig. 3.5shows a panoramic picture of LRS on February 11th 2010, where almost theentire site was frozen in.
In spite of the weather challenges L9 survived the winter of 2010. More-over, the camera, as well as the communication equipment and the rest of theelectric system, has worked since installation in 2008, virtually without anymaintenance. Managing to make something not break may seem like a pettysuccess, but in this business it is far from a small step.
3.4 Interpreting measurementsPaper VII compares measurements of buoy motion from the observation towerwith measurements made inside the buoy, for the wave energy converter L3.Having independent measurements of the same thing is a luxury for anyoneworking in an uncontrolled environment. Even so, interpreting the measure-ments can be very difficult. There is no “ground truth”, against which data canbe compared. Instead, it is necessary to try to use sound judgement, and to
27

0 10 20 30 40 50−1.5
−1
−0.5
0
0.5
1
1.5
Time (s)
Pos
ition
(m
)
Surface elevationCumulative mean
Figure 3.6: Sample wave and its cumulative mean.
be observant of what assumptions are the most critical for the results. As anexample, in the case of Paper VII, the filtering of the accelerometer signals isof great importance, as is the assumption that the buoy is primarily movingperpendicular to the line of sight of the camera.
The accelerometer signals have to be integrated to obtain position. This in-tegration introduces a drifting error, which needs to be removed. In Paper VIIthis was done using a sliding mean filter and then subtracting the calculatedmean from the signal. The width of the sliding mean window was set to 21 s.Essentially, this means that any oscillation with a period longer than 21 s isremoved. Choosing a narrower window would have meant filtering away moreof the motion, and conversely; choosing a wider window would have filteredaway less. The choice of the size of the window is not obvious, and differentvalues give different ranges of resulting buoy motion. Fig. 3.6 gives an illus-tration to the motive for choosing a value of 21 s. The red graph shows thesurface elevation for 50 s of the measurement period. The blue dashed graphshows the cumulative mean of the surface elevation, which tends to zero asthe window for the mean increases. This figure is just an example, but is fairlytypical for the sea state at the time. When the window reaches approximately20 s, the main oscillations of the mean have died out, and only small varia-tions remain. The energy period at the time was approximately 7 s, and a valueroughly corresponding to three periods, or 21 s, was decided upon.
The assumption that the buoy is primarily moving perpendicular to the lineof sight of the camera is clearly a simplification of the reality. However, itis reasonable that the motion to/from the camera is small. This is due to thecamera being roughly south of the buoy, with waves coming in mainly fromthe west. It is also reasonable to assume that the motion to/from the camera isof fairly small importance for the resulting calculated vertical motion of thebuoy. This is due to the fact that the camera is only 14 m above the oceansurface, while being approximately 250 meters away from the buoy. This isa challenge when it comes to getting good photos of the buoy in high waves.But at the same time, it is a strength when estimating vertical motion, sincethis motion is almost perpendicular to the line of sight for the camera.
28

3.4.1 Comparing measurements with incoming wavesThere is another difficulty when it comes to interpreting data obtained fromocean trials, which comes into play when motion data is compared to the in-coming waves: it is in principle impossible to measure the wave that actuallyreaches the WEC, for two reasons. First, it is impossible to measure the wavesat exactly the same location as the WEC. However small the distance betweenmeasurement unit and the WEC is, the waves measured may differ somewhatfrom the waves reaching the WEC. Therefore, it is necessary to make an es-timation of whether it is reasonable that the waves within a given area arerelatively stationary in space. At the Lysekil research site, the bottom is fairlyflat, and the distances between the wave measurement buoy and the WECs arerelatively small in comparison to the size of the site. Furthermore, the mainpart of the waves are coming from one direction (west). Therefore, the condi-tions for stationarity were deemed to be fulfilled.
The second reason that it is impossible to measure the wave that actuallyreaches the WEC is that the WEC is absorbing energy and radiates waves.Thus, what is measured is essentially the incoming wave plus the wave gener-ated by the WEC. In a laboratory environment, it would be possible to measurethe (stationary) wave before inserting the WEC, and then measure the motionof the WEC separately. This cannot be done in an ocean environment. How-ever, since the power absorbed by the WEC is very small in relation to thepower passing within a few buoy lengths, this effect was deemed negligible.
29

4. WEC Performance
For a developer of a wave energy device, deployment of the first unit in theocean is a clear and major milestone. Such a deployment gives invaluableexperiences of the practicalities and challenges associated with working atsea. It also gives the developer a chance to evaluate how the device works inreal waves, rather than in a controlled laboratory environment. The aim of theevaluation will be to answer questions on how the performance of the devicevaries with certain parameters. Papers V, VI, and X all include investigationson how the WECs at LRS perform depending on electrical and oceanic param-eters. Before going into the results of these papers, however, it is important toclarify what is meant by performance when it comes to wave energy.
4.1 Defining performanceDescribing the performance of a WEC is far from trivial. This is partly due toan immaturity of the subject, where different developers have chosen differ-ent ways of describing their devices, but also due to the complexity of oceanwaves. For assessments with the purpose of comparing different projects, pro-tocols have been suggested [45,46], and may be accepted by the wave energycommunity in the future. These protocols aim at giving proper estimates ofthe produced electricity over a year, based on a specific site, and on (scaled)measurements for different combinations of wave parameters.
If the aim is to describe how the performance of a single device changeswith one or several parameters, it may be more straightforward to presentfigures on (i) absorbed power, (ii) the ratio of absorbed power to incomingpower, or (iii) capture width. However, all of these descriptions have theirlimitations and caution must be exercised when using them.
Absorbed power is perhaps the easiest parameter to understand. However,it is important to specify where in the energy conversion chain this poweris located. A hydrodynamic absorption of e.g. 10 kW is very different fromhaving 10 kW in a hydraulic system, or in an electric load. In this thesis,absorbed power refers to power dissipated in the windings of the generator,in the sea cable, and in the load onshore. It is therefore somewhat less thanwhat is removed from the waves, since mechanical losses and iron losses inthe generator are not accounted for.
31
The ratio of captured power to incoming power is sometimes referred toas absorption, or relative absorption. It may be given without a unit, or inper cent. It is important to stress that relative absorption is not the same asefficiency, since efficiency relates to losses. The energy in a wave which is notabsorbed by a WEC is not lost, as it can be absorbed at another point. Thisis different from e.g. resistive losses in a generator, which cannot be utilized.It is also worth pointing out that the width of the WEC defines the amount ofincoming power. Changes in WEC width will therefore also result in changesin relative absorption, unless the absorbed power changes in the same way.
Capture width is defined as the absorbed power by the device, divided by theincoming power per meter wave front. This measure is given in meters and hasbeen recommended by some as it provides a robust and normalized measureof WEC performance [45], if combined with information on WEC size. Incomparison with the relative absorption, it is less likely that the capture widthwill be confused with efficiency, since the unit is not per cent. The downsideis that it is slightly less straightforward.
All of the parameters above can be suitable when describing how the per-formance of a WEC changes with a certain variable. However, it is importantto keep in mind that neither of the parameters say anything about how “goodor bad” the WEC is in absolute terms, unless they are combined with knowl-edge of WEC size, need for maintenance, rated power, generator efficiency,ability to handle overloads, etc.
4.2 Controlling the variablesTesting at sea has its advantages and its disadvantages. One of the disadvan-tages is that the incoming waves cannot be controlled. In a wave tank it is pos-sible to subject your model WEC to specific combinations of significant waveheight and energy period, as well as sea states with defined spectral shapes.In the ocean you have to wait and see what Mother Nature serves you. How-ever, if sufficiently long series of measurements can be acquired, the naturalvariations in sea state will give a relatively complete set of conditions.
Much unlike the sea state, the electric setup is something that can be con-trolled completely. Varying the electric parameters essentially means varyingthe damping of the device, i.e. how the generator will resist the motion of thebuoy. In this thesis, the variations of electrical parameters are limited to usingdifferent loads, and switching between AC and DC systems for longer peri-ods. In principle, however, it is possible to make electrical changes on timescales in the millisecond region.
There are many other parameters that have also been varied in the Ly-sekil project, but that are not covered in this thesis. For instance, cylindri-cal, toroidal and discus shaped buoys have been tested. Different types of DC
32
9.29.2 trend line
13.813.8 trend line27.527.5 trend line
ΩΩΩΩΩΩ
Significant wave height (m)
Re
lative
ab
so
rptio
n (
%)
Significant wave height (m)
Absorb
ed
pow
er
(kW
)
(a) (b)
9.29.2 trend line
13.813.8 trend line27.527.5 trend line
ΩΩΩΩΩΩ
0
1
2
3
4
0.5 1 1.5 2 2.50.5 1 1.5 2 2.50
5
10
15
20
25
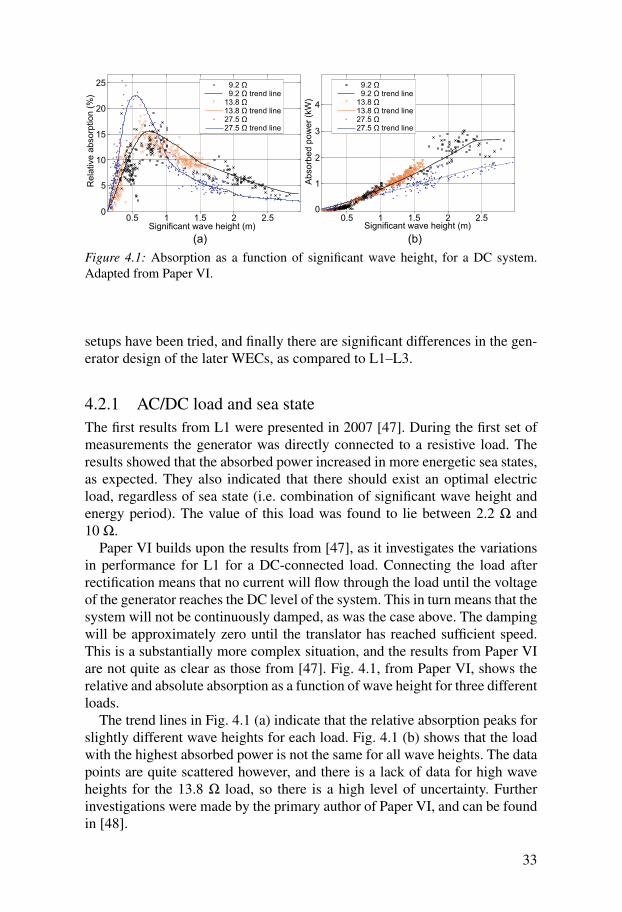
Figure 4.1: Absorption as a function of significant wave height, for a DC system.Adapted from Paper VI.
setups have been tried, and finally there are significant differences in the gen-erator design of the later WECs, as compared to L1–L3.
4.2.1 AC/DC load and sea stateThe first results from L1 were presented in 2007 [47]. During the first set ofmeasurements the generator was directly connected to a resistive load. Theresults showed that the absorbed power increased in more energetic sea states,as expected. They also indicated that there should exist an optimal electricload, regardless of sea state (i.e. combination of significant wave height andenergy period). The value of this load was found to lie between 2.2 Ω and10 Ω.
Paper VI builds upon the results from [47], as it investigates the variationsin performance for L1 for a DC-connected load. Connecting the load afterrectification means that no current will flow through the load until the voltageof the generator reaches the DC level of the system. This in turn means that thesystem will not be continuously damped, as was the case above. The dampingwill be approximately zero until the translator has reached sufficient speed.This is a substantially more complex situation, and the results from Paper VIare not quite as clear as those from [47]. Fig. 4.1, from Paper VI, shows therelative and absolute absorption as a function of wave height for three differentloads.
The trend lines in Fig. 4.1 (a) indicate that the relative absorption peaks forslightly different wave heights for each load. Fig. 4.1 (b) shows that the loadwith the highest absorbed power is not the same for all wave heights. The datapoints are quite scattered however, and there is a lack of data for high waveheights for the 13.8 Ω load, so there is a high level of uncertainty. Furtherinvestigations were made by the primary author of Paper VI, and can be foundin [48].
33

f
(a) (b) (c)f
Figure 4.2: Different translator-stator geometries. (a) Long translator, (b) Long stator,(c) Geometry of L1.
4.2.2 Water level and wave heightOne of the design choices for the generator is the length of the translator rela-tive to the stator. This choice is a balance between performance and economy.In the extreme case, a very long translator (longer than any incoming waveheight) would mean that the active length (the length for which translator andstator overlap) would never decrease, see Fig. 4.2, case (a). However, thiswould make for a very large and not very economical generator since the mag-nets are an expensive component. Making the stator very long instead (case(b)) would also result in a constant active area, but at the prize of a highercost, as well as increased impedance in the stator windings. In L1, a middleway was chosen, and the respective lengths of stator and translator were set to1.26 m and 1.87 m. This has been illustrated in case (c) in Fig. 4.2.
For a set generator geometry, whether or not the translator will move out ofthe stator is dependent on the magnitude of the oscillating motion, but also onthe equilibrium position of the translator inside the stator. These two entitiesare dependent on the incoming wave height and the water level. In an at-tempt to quantify the impact a theoretical expression was derived in Paper V,and was compared to experimental data. Fig. 4.3 from said paper shows theresults. The relative absorption has been plotted as a function of significantwave height Hm0 and still water level w. The theoretically expected perfor-mance is plotted as a surface. It was found that the theoretic values follow theexperimental data qualitatively in the Hm0-direction, but that the correlation inthe w-direction is less clear.
4.2.3 Spectral shapeTypically, WEC performance is presented in scatter diagrams for combina-tions of T−10 and Hm0. However, when studying data from L1 for sea stateswhere T−10 and Hm0 were kept roughly constant, large variations in perfor-
34

-0.8-0.4
00.4
0.8 0 0.5 1 1.5 2 2.5
0.05
0.1
0.15
0.2
0.25
Significant wave height Hm0
(m)Still water level w (m)
Rela
tive a
bsorp
tion
Figure 4.3: Absorption as function of significant wave height and still water level.Adapted from Paper V.
mance were found. Such variations have been suggested to be caused by vari-ations in spectral width [49]. Therefore in Paper X a number of parametersdescribing spectral width were tested against the performance data to inves-tigate any correlations. The two best indicators were found to be κ and ε1,defined as
κ =1
m0
∣∣∣∣∫ ∞
0S( f )ei2π f
√m0/m2d f
∣∣∣∣ , (4.1)
ε1 =
√m1m−1
m20−1. (4.2)
Variations of these parameters accounted for roughly 40% of the variations inWEC performance for a load of 4.9 Ω, using a linear fit.
Another parameter that relates to the shape of the spectrum, and that couldbe used to explain the performance variations for constant T−10 and Hm0, isthe peak period Tp. The peak period corresponds to the peak frequency fp, i.e.the frequency for which S( f ) has its maximum. If this period differs substan-tially from the energy period (Fig. 4.4), it is an indication that the spectrummight be double peaked or skewed. This could mean that a large portion of theavailable energy in the waves is carried by frequencies that are not capturedby the WEC. Fig. 4.5 from Paper X shows a scatter diagram of performanceand energy period for 42 measurements on L1 where the energy period wasbetween 3.5 s and 4.0 s. It can be seen that the six lowest absorption valueshave a peak period which is greater than 6.0 s or lower than 3.5 s. It therefore
35

0 0.2 0.4 0.6 0.8 1 1.2 1.40
0.01
0.02
0.03
0.04
0.05
Frequency (Hz)
Spe
ctra
l den
sity
(m
2 /Hz)
Figure 4.4: A double peaked spectrum, where T−10 = 3.99 s (corresponding to f−10 =0.25 Hz) and Tp = 6.10 s (corresponding to fp = 0.16 Hz).
2.5 3 3.5 4 4.5 5 5.5 6 6.5 70
5
10
15
20
25
Peak period (s)
Abs
orpt
ion
(%)
Figure 4.5: Scatter diagram of absorption and peak period Tp. Adapted from Paper X.
seems as if the poorest performances in the data set can be explained usingTp. However, there is still quite some variation in the remaining values, andthere are also data points with high absorption for which Tp is close to, or evenbelow, 3.5 s.
36

5. Summary of Papers
This thesis is based on ten papers, presented in their full length at the end. Ashort summary is given here.
PAPER IWave Energy from the North Sea: Experiences from the LysekilResearch SiteA very thorough description of the first years of the Lysekil project can befound in this paper, both on the technology used and the process of installingthe first WEC. The paper covers all parts of the project: from a brief intro-duction of wave energy projects around the world to describing the propertiesof LRS and the results on wave characteristics, electrical systems, absorptionand environmental impact.
The author coordinated the texts from the other authors, and contributedwith the description of the observation tower, as well as the actual installationof the tower.
This paper is published in Surveys in Geophysics Vol. 29, Issue 3, May2008.
PAPER IIThe Lysekil Wave Power Project: Status UpdateThis paper presents a more brief, but slightly more updated, description of thestatus of the Lysekil project as it was in 2008, as compared to Paper I. A lotof the material in this paper is covered in Paper I as well, but the focus hereis more on the work performed by the author, i.e. the effect of varying waterlevels and the installation of the observation system.
The author performed most of the writing of this paper, based on the in-formation provided by the people who had carried out the experiments withineach field. The work of installing the observation tower mentioned in section4.6 was also carried out by the author.
37
This conference paper is published in the Proceedings of the 10th World Re-newable Energy Conference and was orally presented by the author in Glas-gow, UK, in July 2008.
PAPER IIICatch the Wave to Electricity: The Conversion of Wave Motionsto Electricity Using a Grid-Oriented ApproachIn this paper, the main ideas behind the Lysekil project are introduced, to-gether with a short summary of the process of carrying out the project. Com-pared to Paper I and II, the focus here is on what philosophies led to the chosensystem, rather than detailed descriptions of the technology.
The author contributed to a major revision of this paper and took part in thesubmission process.
This paper is published in IEEE Power & Energy Magazine, Vol. 7, Issue 1,January/February 2009.
PAPER IVTracking a Wave Power Buoy Using a Network Camera - SystemAnalysis and First ResultsIn the summer of 2008, a camera system was installed at Klammerskär, southof LRS. In this paper, the work with this system is described, and an analysisis made of the first series of pictures from the camera. The wave power buoyhas been photographed during operation, and using image analysis on thesepictures, buoy motions have been extracted. The values (±0.5 m maximumvertical motion) correspond fairly well to what would be expected based onthe sea state during the image sequence (Hm0 = 0.82 m). The strengths andweaknesses of the system are analyzed in the paper, concluding that somework remains on quantifying the accuracy and synchronizing the images tothe measurements of voltages in the linear generator. In general the systemhas worked well.
The author performed most of the work in this paper.This conference paper is published in the peer-reviewed Proceedings of the
28th International Conference on Offshore Mechanics and Arctic Engineeringand was orally presented by the author in Honolulu, USA, in June 2009.
38

PAPER VWave Power Absorption as a Function of Water Level and WaveHeight: Theory and ExperimentSince the translator will move partly out of the stator at high amplitudes ofmotion, resulting in a decreased active area, it is reasonable to assume that theWEC performance is dependent on the equilibrium position of the translatoras well as stroke magnitude. The former is affected by the water level at thesite, and the latter is affected by the size of the incoming waves.
In this article, a theoretical model was presented to describe the perfor-mance of the wave energy converter L1 as a function of significant wave heightand water level. The model was matched against experimental data from LRS.Experimental and theoretical values exhibit similar characteristics, especiallywith changing significant wave heights. It is therefore likely that the decliningvalues of relative absorption at high significant wave heights are due to thedecrease of the active area. For changing water levels, it is more difficult todraw any conclusions.
The author performed most of the work in this paper.This paper is published in IEEE Journal of Oceanic Engineering, Vol. 35,
Issue 3, July 2010.
PAPER VIExperimental Results From an Offshore Wave Energy ConverterThis paper describes an experiment with rectification of the voltage of thewave energy converter L1 at LRS. Absorbed power and relative absorptionas a function of wave height and electric DC load was plotted. The relativeabsorption was found to have peaks at different wave heights for differentloads. This indicates that there is not a single optimal load for all significantwave heights.
The author contributed with section 2, as well as Fig. 3b and 3d, and helpedout in the review of the paper.
This paper is published in Journal of Offshore Mechanics and Arctic Engi-neering, Vol. 132, Issue 4, November 2010.
PAPER VIIWave Buoy and Translator Motions — On-Site Measurements andSimulationsIn the process of improving the concept in the Lysekil project, it is importantto be able to quantify and predict several different entities in the wave energy
39
converters. This paper has an engineering focus, and is aimed at comparingdifferent ways of measuring buoy motion, as well as relating these measure-ments to simulations made in Simulink. Buoy motion was measured using aland based optical system, and a buoy based accelerometer system. The mea-surements were found to correlate well in the vertical direction. However, inthe horizontal direction the difference was substantial. The main reason forthis was that the buoy rotation about its axis of symmetry was not measured.In a first comparison, the simulations and the measurements showed goodagreement.
The author organized the work in this paper, wrote most of the text, andproduced all figures except for Fig. 11. The author also performed the mea-surements of buoy motion through optical measurements, and the subsequentanalysis.
This paper is published in IEEE Journal of Oceanic Engineering, Vol. 36,Issue 3, July 2011.
PAPER VIIILysekil Research Site, Sweden, A Status UpdateThis paper presents an up-to-date description of the Lysekil project. Togetherwith Paper II, it gives a brief overview of the project from start to present.
The author made a minor contribution to the writing of the paper.This conference paper is published in the peer-reviewed Proceedings of the
9th European Wave and Tidal Energy Conference and was presented by ErikLejerskog in Southampton, UK, in September 2011.
PAPER IXOffshore Wave Power Measurements - a ReviewIn the process of developing a wave power concept, it is important to learnfrom previous successes and failures, not least when moving into the oceanfor testing. In this paper, a thorough review of measurements made in off-shore wave power trials has been made. The purpose of the review is to findout what has commonly been measured, and how these entities have been mea-sured. Such information can help present and future wave energy projects intheir design of measurement systems, and could also be used when preparingprotocols and standards for testing.
Twenty projects were reviewed, where the earliest one took place in the1970s. Wave height was an almost universal measurement among the projects,although the technologies used differed somewhat. Other common measure-ments included voltages, device motion and mooring forces. It is clear that it is
40

far from trivial to measure any entity at sea, and many of the projects reportedon sensor failures and other unforeseen events.
The author performed most of the work in this paper.This paper is in press for publication in Renewable & Sustainable Energy
Reviews and is available online. DOI: 10.1016/j.rser.2011.07.123.
PAPER XSpectral Parameters and Wave Energy Converter PerformanceStudying performance data from L1 it can be seen that for measurements withsimilar summary statistics T−10 and Hm0 there are values for relative absorp-tion that vary from 5% to 25%. It therefore seems probable that the propertiesof the sea state that are not captured using T−10 and Hm0 have an effect on howa WEC performs. It has been proposed in the literature that the width of thewave spectrum is one such property. In this paper, six parameters that describespectral width have been tested against performance data to look for correla-tions. In addition to this, the performance data was tested against peak periodand standard deviation of peak frequency, as found through wavelet analysis.
It was found that out of the parameters tested, κ and ε1 displayed thestrongest correlation. Even this correlation was not very strong however, anddid only exhibit an r2-value of 0.39 in a linear fit for L1 connected to a 4.9 Ω
load. It was also found that the lowest absorption values were connected tothe lowest and highest Tp-values.
The author performed most of the work in this paper, which is an unsub-mitted manuscript.
41


6. Conclusions
The main conclusions in this thesis can be divided into two broad categories:conclusions regarding measurements and buoy/generator motion, and conclu-sions regarding WEC performance.
6.1 Measurements and buoy/generator motion• Although many ocean experiments have been made within the field of wave
power, published descriptions of measurements are fairly rare. However, anincrease can be seen in recent years.• Almost everyone who has published descriptions of ocean measurements
have also reported on problems encountered in the marine environment.• Wave height, electric power and air pressure are the most common mea-
surements in sea trials of wave energy devices. Pressure transducers are themost common specific sensors.• The buoy motion of L3 is not symmetrical, due to the constraint of the buoy
being attached to the generator. The observed motion is skewed, whereas afree motion would be expected to be circular or elliptical.• The installed camera system on Klammerskär works for motion measure-
ment, even though the conditions are far from ideal in terms of distancescamera–buoy, tough weather, and wave sheltering.• The gathered accelerometer data for buoy motion matches the image data
from the camera, but the results are dependent on proper filtering.• Buoy rotation about the vertical axis cannot be neglected in accelerometer
measurements.• Horizontal motion of the buoy does not contribute in any significant way
to the motion of the translator.• Dual measurements of buoy motions are recommended if possible. Opti-
cal measurements make the interpretation of results easier, although thepresent system needed a lot of manual work. This has been remedied byadding markers to later versions of the buoy.• In a first evaluation, the simulations of buoy and translator motion match
the measured results.• The range of motion in the translator is slightly less than for the buoy. This
is expected, since the translator is bound by its end stops.
43

6.2 WEC Performance• The theoretical model for the expected performance variation with the vari-
ation of water levels and wave height seems to qualitatively predict the de-cline of performance for increasing wave heights. Variations in water levelwere not captured as clearly by the model.• Out of the ten parameters related to spectral width or shape studied in Pa-
per X, κ and ε1 were found to be the best indicators for performance vari-ation for set values of significant wave height and energy period. However,they only explained about 40% of the variations for performance of L1connected to a 4.9 Ω load, which indicates that there may be other factorsaffecting performance as well.
• The lowest performance values in the studied set were connected to thehighest and the lowest values of the peak period.
44

7. Acknowledgements
First, I would like to thank my supervisor Mats Leijon for letting me be a partof this project. It has been stimulating, challenging, varying and fun all theway, and I am impressed by your belief in us PhD students. Looking back atall the things I have gotten the chance to do in this job, it seems almost unreal.Thank you to my assistant supervisor Jan Isberg for always being around andgiving answers regarding theoretical issues. To all of our financiers: thank youfor your support – it gives us a chance to pursue this research. Thank you alsoto Uppsala University for financing my PhD studies.
To all the great people in the Wave Group: thanks for all the fun times inUppsala, Lysekil, and at conferences around the world. It has been a privilegeto work with you all, and I wish you the greatest of luck in the future.
To my room mates, past and present: Olle Svensson, Remya Krishna, Mag-nus Rahm and Rafael Waters, thank you for talks, laughs, scientific exchange,and general support. Olle, thank you for your help in everything concerningmeasurement technology and electronics - including, but not limited to, theworkings of guitar pickups and microphones. Remya, thank you for giving meinsight into the details of Indian weddings and cooking. Magnus and Rafael,thank you for good food and good wine, for all the great non-work times, forguiding me into the Division, and for the great little band Electric Acoustics.Rafael, thank you also for all the other music we have shared, and for manyhours of conversation on the way to or from Lysekil.
Jörgen Nilsson, thank you for the help with making Klammerskär a workingmeasuring station. Without your practical talents it would never have becomeoperational, and without your swimming capabilities we would still have beenstuck on that rock. Thank you also to Jens Engström, Kalle Haikonen, FredrikBülow, Jenny Tedelid, Nils Englund and Erik Back who on different occasionshave help me out on Klammerskär.
Mårten Grabbe, Staffan Lundin, Cecilia Boström, Magnus Rahm, JohanBladh, Olle Svensson, Katarina Yuen, Rafael Waters, Jens Engström and Jo-han Lundin, thank you for proofreading my thesis and the last paper. I ap-preciate very much your feedback. Thanks are also given to the people whocontributed in my beer-for-errors program, among which Marcus Berg andAnders Goude are the most notorious. Staffan Lundin, thank you for being aliving LATEX dictionary, to whom no coding problem is too small to investigate.Katarina Yuen, thank you for great talks, and for helping me to take some steps
45

in figuring out just what engineering science is about. Johan Bladh, thank youfor good lunch times and for sharing my bike interest.
Thank you Gunnel Ivarsson, Thomas Götschl, Ingrid Ringård, ChristinaWolf, Elin Tögenmark and Maria Nordengren for all the support in adminis-trative issues. Without you I would have been lost on numerous occasions.Ulf Ring, thanks for the invaluable help with construction issues, and the non-invaluable help with coming up with bad jokes. Thank you Tommy Carlsson,at Klubban in Fiskebäckskil, for practical help in the field.
To all the fantastic people at the Division of Electricity: thank you for greatdiscussions on scientific and worldly issues, laughs, lunch talks, fika, Fridaybeer, Basic Cooking, Blodomloppet, Raid Uppsala, Christmas parties, ski tripsto Orsa, and the numerous events with the Division choir. Thanks to you all,coming to work has been something to look forward to every single day.
To my family: thank you for all the support and love. Finally, to my fabulouswife Magdalena: thank you for being there and letting me be there with you.Thank you for your patience, your wisdom, and your great sense of humor.You make my days and my future bright.
46

8. Svensk sammanfattning
Bakgrunden till den här avhandlingen är arbetet med Lysekilsprojektet, vilketdrivits vid avdelningen för elektricitetslära sedan 2002. Inom projektet harett antal vågkraftverk installerats i havet sydväst om Lysekil. Principen förvågkraftverken är att en boj vid ytan rör sig med vågorna, och förmedlarrörelsen till en bottenplacerad linjärgenerator via en lina. Den genereradespänningen från flera sådana vågkraftverk likriktas, sammanläggs i ett ställ-verk på botten, växelriktas igen och transformeras innan den förs iland via ensjökabel.
Installationen av det första vågkraftverket, som döpts till L1, följde på ettstort teoretiskt och experimentellt arbete där systemet simulerats, försöksplat-sen undersökts och en försöksuppställning installerats för att mäta krafter påbojen. Sedan installationen genomförts har L1 och senare vågkraftverk variti bruk i sammanlagt över två år. En mängd vetenskapliga undersökningar hargenomförts i olika delar av projektet, och har resulterat i ett stort antal pub-licerade artiklar.
En företeelse som varit viktig att förstå har varit hur vågkraftverkenpresterar i olika vågklimat, och för olika elektriska parametrar. I den häravhandlingen har L1:s prestanda undersökts för varierande våghöjder ochvattenstånd, samt för varierande vågspektra, det vill säga vågklimat medolika sammansättning av periodiska vågor. Avhandlingen innehåller ocksåresultat över hur prestandan varierar med olika elektriska laster i ett likriktatsystem. Att ändra den elektriska lasten innebär att generatorns benägenhet attbromsa in bojens rörelse förändras.
Det visar sig att den absorberade effekten i relation till den inkommande ef-fekten minskar för ökande våghöjder. Detta är i överensstämmelse med teorin,eftersom stora rörelser hos bojen ger stora utslag i generatorn, vilket i sin turinnebär att generatorns aktiva area minskar tillfälligt. Skiftande vattennivåer,och därmed skiftande jämviktslägen i generatorn, förutspåddes ha samma ef-fekt, men en sådan variation var svårare att se i praktiken.
Man kan se att prestandan för L1 (mätt över en halvtimme) varierar kraftigt,även för vågklimat med samma statistiska parametrar (våghöjd och period).Därför undersöktes kopplingen mellan prestanda och ett antal parametrar sombeskriver spektral bredd, det vill säga i vilken utsträckning energin i vågornaär utspridd på olika frekvenser. Viss koppling hittades, men även de parame-trar som var starkast kopplade till prestandan förklarade bara ungefär 40 % avvariationen. Kopplingen mellan topperioden, motsvarande den frekvens som
47

bär mest av energin i vågklimatet, och prestandan undersöktes också. Resul-tatet var att för tillfällen då topperioden (som beror på var vågspektrumetsmaxvärde uppträder) avvek från energiperioden (som påverkas av vågspek-trumets form) var också prestandan lägre.
För ett likriktat system verkar det som att generatorns optimala dämpningvarierar med våghöjden. Dock saknades mätpunkter för vissa laster i högavågor, varför det är svårt att dra några definitiva slutsatser.
Som bakgrund till resultaten ovan beskriver avhandlingen mätningar av boj-rörelser till havs för olika mätsystem, och ger en historik över havsbaseradevågkraftsmätningar i andra projekt. Datainsamling till havs är svår att genom-föra, vilket också visat sig genom att tämligen få projekt genom åren valtatt, eller kunnat, redovisa mätningar. Inom Lysekilprojektet har bojens rörelsemätts med två olika system: ett landbaserat optiskt system och ett accelero-metersystem i bojen. Resultaten från systemen överensstämmer i huvudsak,och deras styrkor och svagheter kompletterar varandra. Generatorns rörelsemättes också under samma tidsperiod, och fanns vara något mindre än bojensrörelse. Detta är ett förväntat resultat, eftersom generatorns rörelse är begrän-sad av ändstopp i övre och nedre läget. Slutligen jämfördes bojens och gen-eratorns rörelser med simuleringar. Vid en första utvärdering visade sig dessage tillfredsställande resultat.
48

References
[1] S. H. Salter, “Wave power,” Nature, vol. 249, pp. 720–724, 1974.
[2] D. Mollison, O. P. Buneman, and S. H. Salter, “Wave power availability in theNE atlantic,” Nature, vol. 263, pp. 223–226, 1976.
[3] J. Falnes and J. Løvseth, “Ocean wave energy,” Energy Policy, October 1991.
[4] C. Retzler, “Measurements of the slow drift dynamics of a model Pelamis waveenergy converter,” Renewable Energy, vol. 31, pp. 257–269, 2006.
[5] R. Henderson, “Design, simulation, and testing of a novel hydraulic power take-off system for the Pelamis wave energy converter,” Renewable Energy, vol. 31,pp. 271–283, 2006.
[6] J. Tedd and J. Kofoed, “Measurements of overtopping flow time series on theWave Dragon, wave energy converter,” Renewable Energy, vol. 34, pp. 711–717, 2009.
[7] M. Prado, F. Neumann, M. Damen, and F. Gardner, “AWS results of pilot planttesting 2004,” in Proceedings of the 6th European Wave and Tidal Energy Con-ference, EWTEC05, Glasgow, UK, pp. 401–407, 2005.
[8] R. Alcorn, S. Hunter, C. Signorelli, R. Obeyesekera, T. Finnigan, and T. Denniss,“Results of the Testing of the Energetech Wave Energy Plant at Port Kembla onOctober 26, 2005,” tech. rep., Energetech Australia Pty Limited, 2005.
[9] D. O’Sullivan, J. Griffiths, M. G. Egan, and A. W. Lewis, “Development ofan electrical power take off system for a sea-test scaled offshore wave energydevice,” Renewable Energy, vol. 36, no. 4, pp. 1236–1244, 2011.
[10] D. Elwood, A. Schacher, K. Rhinefrank, J. Prudell, S. Yim, E. Amon,T. Brekken, and A. von Jouanne, “Numerical modeling and ocean testing ofa direct-drive wave energy device utilizing a permanent magnet linear gener-ator for power take-off,” in Proceedings of the 28th International Conferenceon Offshore Mechanics and Arctic Engineering, OMAE 2009, Honolulu, USA,pp. 817–824, 2009.
[11] K. Toyota, S. Nagata, Y. Imai, and T. Setoguchi, “Research for evaluating perfor-mance of OWC-type Wave Energy Converter “Backward Bent Duct Buoy”,” inProceedings of the 8th European Wave and Tidal Energy Conference, EWTEC09,Uppsala, Sweden, pp. 901–913, 2009.
49

[12] A. F. de O. Falcão, “Wave energy utilization: A review of the technologies,”Renewable and Sustainable Energy Reviews, vol. 14, no. 3, pp. 899 – 918, 2010.
[13] R. Waters, Energy from Ocean Waves. Full Scale Experimental Verification of aWave Energy Converter. PhD thesis, Uppsala University, Division of Electricity,2008.
[14] I. Ivanova, Simulation of Linear Permanent Magnet Octagonal Generator forSea Wave Energy Conversion. Licentiate thesis, Uppsala University, Division ofElectricity, 2004.
[15] M. Eriksson, Electromechanical Dynamics of a Direct Drive Wave Energy Con-verter. Licentiate thesis, Uppsala University, Division of Electricity, 2004.
[16] K. Thorburn, Modelling new generators for wave energy conversion and hy-dropower upgrading. Licentiate thesis, Uppsala University, Division of Elec-tricity, 2004.
[17] C. Boström, Electrical System of a Wave Power Plant. Licentiate thesis, UppsalaUniversity, Division of Electricity, 2008.
[18] J. Engström, Hydrodynamic Modeling of the Energy Conversion from OceanWaves to Electricity. Licentiate thesis, Uppsala University, Division of Electric-ity, 2009.
[19] S. Tyrberg, Studying Buoy Motion for Wave Power. Licentiate thesis, UppsalaUniversity, Division of Electricity, 2009.
[20] H. Gravråkmo, Buoy for linear wave energy converter. Licentiate thesis, Upp-sala University, Division of Electricity, 2011.
[21] R. Krishna, Multilevel Inverter for Wave Power Conversion. Licentiate thesis,Uppsala University, Division of Electricity, 2011.
[22] O. Danielsson, Wave Energy Conversion, Linear Synchronous Permanent Mag-net Generator. PhD thesis, Uppsala University, Division of Electricity, 2006.
[23] K. Thorburn, Electric Energy Conversion Systems: Wave Energy and Hy-dropower. PhD thesis, Uppsala University, Division of Electricity, 2006.
[24] M. Eriksson, Modelling and Experimental Verification of Direct Drive WaveEnergy Conversion. Buoy-Generator Dynamics. PhD thesis, Uppsala University,Division of Electricity, 2007.
[25] O. Langhamer, Wave energy conversion and the marine environment: Coloniza-tion patterns and habitat dynamics. PhD thesis, Uppsala University, Division ofElectricity, 2009.
[26] M. Rahm, Ocean Wave Energy: Underwater Substation System for Wave EnergyConverters. PhD thesis, Uppsala University, Division of Electricity, 2010.
50

[27] C. Boström, Electrical systems for wave energy conversion. PhD thesis, UppsalaUniversity, Division of Electricity, 2011.
[28] G. Nolan, J. V. Ringwood, and B. Holmes, “Short term variability off the westcoast of Ireland,” in Proceedings of the 7th European Wave and Tidal EnergyConference, EWTEC07, Porto, Portugal, 2007.
[29] J. Falnes, Ocean Waves and Oscillating Systems. Cambridge University Press,2002.
[30] L. H. Holthuijsen, Waves in Oceanic and Coastal Waters. Cambridge UniversityPress, 2007.
[31] P. C. Liu, “Is the wind wave frequency spectrum outdated,” Ocean Engineering,vol. 27, pp. 577–588, 2000.
[32] S. R. Massel, “Wavelet analysis for processing of ocean surface wave records,”Ocean Engineering, vol. 28, no. 8, pp. 957–987, 2001.
[33] M. C. Huang, “Wave parameters and functions in wavelet analysis,” Ocean En-gineering, vol. 31, no. 1, pp. 111 – 125, 2004.
[34] M. Elsayed, “An overview of wavelet analysis and its application to ocean windwaves,” Journal of Coastal Research, vol. 26, no. 3, pp. 535–540, 2010.
[35] I. Boldea, Synchronous Generators. Taylor & Francis Group, 2006.
[36] R. K. Wangsness, Electromagnetic Fields. New York City, New York, USA:John Wiley & sons, 2 ed., 1986.
[37] K. E. Hallenius, Elektriska maskiner (Electrical Machines). Liber Läromedel,1980.
[38] D. Ross, Power from the waves. Oxford University Press, 1995.
[39] I. K. Bjerke, J. Sjolte, E. Hjetland, and G. Tjensvoll, “Experiences from fieldtesting with the BOLT wave energy converter,” in Proceedings of the 9th Euro-pean Wave and Tidal Energy Conference, EWTEC11, Southampton, UK, 2011.
[40] R. Caljouw, D. Harrowfield, L. Mann, and J. Fievez, “Testing and model evalu-ation of a scale CETO unit,” in Proceedings of the 9th European Wave and TidalEnergy Conference, EWTEC11, Southampton, UK, 2011.
[41] F. Thiebaut, D. O’Sullivan, P. Kracht, S. Ceballos, J. López, C. Boake, J. Bard,N. Brinquete, J. Varandas, L. M. C. Gato, R. Alcorn, and A. W. Lewis, “Testingof a floating OWC device with movable guide vane impulse turbine power take-off,” in Proceedings of the 9th European Wave and Tidal Energy Conference,EWTEC11, Southampton, UK, 2011.
[42] J. Skelton, G. Bryans, and K. Doherty, “The learning and development processof the Oyster wave energy converter,” in Proceedings of the 9th European Waveand Tidal Energy Conference, EWTEC11, Southampton, UK, 2011.
51

[43] O. Svensson, E. Strömstedt, A. Savin, and M. Leijon, “Sensors and measure-ments inside the second and third wave energy converter at the Lysekil researchsite,” in Proceedings of the 9th European Wave and Tidal Energy Conference,EWTEC11, Southampton, UK, 2011.
[44] Y. Masuda, T. Kuboki, and X. Liang, “Wave power use for island power sup-ply by a Backward Bent Duct Buoy,” in Proceedings of the Annual OffshoreTechnology Conference, Houston, Texas, USA, vol. 1, pp. 527–536, 1997.
[45] E. D. Tietje, III, M. Folley, S. Beatty, M. Raftery, and P. Ricci, “Standardizedperformance assessment of wave energy converters,” in Proceedings of the 9th
European Wave and Tidal Energy Conference, EWTEC11, Southampton, UK,2011.
[46] C. Johnstone, T. McCombes, A. S. Bahaj, L. Myers, B. Holmes, J. P. Kofoed,and C. Bittencourt, “Equimar: Development of best practices for the engineeringperformance appraisal of wave and tidal energy convertors,” in Proceedings ofthe 9th European Wave and Tidal Energy Conference, EWTEC11, Southampton,UK, 2011.
[47] R. Waters, M. Stålberg, O. Danielsson, O. Svensson, S. Gustafsson, E. Strömst-edt, M. Eriksson, J. Sundberg, and M. Leijon, “Experimental results from seatrials of an offshore wave energy system,” Applied Physics Letters, vol. 90,p. 034105 (3 pages), 2007.
[48] C. Boström, R. Waters, E. Lejerskog, O. Svensson, M. Stålberg, E. Strömstedt,and M. Leijon, “Study of a wave energy converter connected to a nonlinearload,” IEEE Journal of Oceanic Engineering, vol. 34, no. 2, pp. 123–127, 2009.
[49] J.-B. Saulnier, A. Clément, A. F. D. O. Falcão, T. Pontes, M. Prevosto, andP. Ricci, “Wave groupiness and spectral bandwidth as relevant parameters forthe performance assessment of wave energy converters,” Ocean Engineering,vol. 38, no. 1, pp. 130–147, 2011.
52

