building the backbone of energy efficiency · the “building the backbone of energy efficiency”...
TRANSCRIPT
Perlmutter Institute forGlobal Business Leadership
Building the BackBone of energy efficiency
executive summary
New England’s Competitiveness, Innovation, and Sustainability in the 21st Century
June 2, 2015Federal Reserve Bank of Boston
© 2015 Brandeis International Business School. Created by BullsEye Resources, www.bullseyeresources.com. 2
New England Economic Partnership: Building the Backbone of Energy Efficiency
AGENDA
� 11:45 a.m. Registration
� 12:15 p.m. New England Energy Challenges and Trends Kevin Lindemer, Managing Director, IHS Global Insight/Cambridge Energy Research Associates
� 1:15 p.m. Luncheon
� 2:00 p.m. NEEP Forecast Managers: Growth, Energy Costs, Infrastructure Needs — Ed Deak, NEEP Connecticut Forecast Manager — Ryan Wallace, Maine Presenter; Charlie Colgan, NEEP Maine Forecast Manager — Alan Clayton-Matthews, NEEP Massachusetts Forecast Manager — Dennis Delay, NEEP New Hampshire Forecast Manager — Jeff Carr, NEEP Vermont Forecast Manager
� 2:45 p.m. Infrastructure Needs and Our Electrical Grid for the 21st Century Bill Zarakas, Principal, The Brattle Group — James, Daly, Vice President, Eversource — Jane Michalek, Vice President, Global Partners — Greg Crisp, Business Development, Spectra Energy Inc. — Jim Burpee, President/CEO, Canadian Electricity Association — Curtis Cole, Director of Business Development, Kinder Morgan Energy Partners
� 4:15 p.m. Technology, Innovation and Sustainability: Developing and Funding Our Energy Future Matthew Bunn, Professor of Practice, Co-Principal Investigator, Project on Managing the Atom, Harvard’s JFK School of Government — Dr. David Rapaport, Head of Technology Innovation Management US for Siemens Corporation, Corporate Technology — Kevin Ramsdell, Advanced Facilities Specialist, General Dynamics Mission Systems — Lucas Missong, Senior Vice President, Boston Energy Investors Fund
� 5:15 p.m. State and Regional Energy Policy: New England Energy Policy in the 21st Century Dean Bruce Magid, Martin and Ahuva Gross Chair in Financial Markets and Institutions Director, Perlmutter Institute for Global Business Leadership, Brandeis IBS Henry Lee, Jasmin M. Jaidah Family Director of the Environment and Natural Resources Program, Harvard’s JFK School of Government — Jonathan Raab, Convener and Moderator, New England Restructuring Roundtable — Mark Kalpin, New England Council Energy and Environment, Partner, WilmerHale — Eric Wilkinson, Senior External Affairs Representative, ISO New England — Secretary Matthew A. Beaton, Executive Office of Energy and Environmental Affairs
� 6:15 p.m. Reception
� 7:00 p.m. The Perlmutter Award For Global Business Leadership Dinner Honoring Eric Spiegel, President and CEO Siemens USA
www.brandeis.edu/global www.maroundtable.com http://neepecon.org
© 2015 Brandeis International Business School. Created by BullsEye Resources, www.bullseyeresources.com. 3
New England Economic Partnership: Building the Backbone of Energy Efficiency
TAblE of CoNTENTs
�Conference Overview 4
�Conference Themes 5
�New England Energy Challenges and Trends 6
� Infrastructure Needs and Our Electrical Grid for the 21st Century 12
�Technology, Innovation and Sustainability: Developing and Funding Our Energy Future 19
�State and Regional Energy Policy: New England Energy Policy in the 21st Century 24
Building the BackBone of energy efficiencyNew England’s Competitiveness, Innovation, and Sustainability in the 21st Century
© 2015 Brandeis International Business School. Created by BullsEye Resources, www.bullseyeresources.com. 4
CoNfErENCE ovErviEwOver 100 people gathered on June 2, 2015 to discuss the challenges of building a sustain-able economy around an efficient energy system for the 21st Century. The six New Eng-land states face some of the highest electricity costs in the country with an infrastructure that is unable to deliver low-cost and flexible energy sources to its customers. Regional energy policy is not well coordinated, particularly when we look at the longer term goal of reducing carbon emissions by 80% while containing electricity costs. To build a com-petitive and flexible energy system for the 21st century, New England needs collaborative partnerships and a substantial commitment of resources by all the players involved.
The “Building the Backbone of Energy Efficiency” conference looked at the volatility of global energy markets, as well as the need to address gas pipeline bottle necks in New England while building a more flexible electrical grid. The energy challenges of building a vital and sustainable economy over the next thirty years are considerable.
� New England faces a “new normal” in world markets with the low price of oil & gas arising from an oversupply from US shale producers and OPEC/Saudi players. The region faces significantly higher electricity rates compared to the rest of country because of logistics/infrastructure issues.
� There is significant variance across the New England states in terms of energy sources, infrastructure, and grid capacity; nonetheless the region (i.e., RGGI) is committed to reducing its carbon footprint and consumption of traditional fossil fuels over the next 20 years.
� The pipeline infrastructure, bottlenecks, and lack of flexibility in our electricity grid has resulted in higher costs. The states need to invest and develop a more cost efficient, co-ordinated distributed energy system that connects to lower cost energy sources outside of New England.
� Longer term the country needs to make significant investments through collaborative partnerships in new technologies that will meet the energy demands of New England and the rest of the country while addressing the forecasted impact of climate change.
� The policy challenges of formulating a competitive sustainable energy policy are huge, particularly over the longer term time horizon. The private and public sectors need to find better ways to collaborate, fund infrastructure, support technology innovations, and manage costs, while providing flexible energy sources over next thirty years.
The conference highlighted the need to develop a forward looking energy policy and reconfigured infrastructure that is flexible, lower cost, and able to meet the changing de-mands of the New England economy. This will only come through informed dialogue and leadership that is responsive to the short and longer term needs of the region. New En-gland will not thrive or grow without a competitive 21st energy plan that is implemented in a deliberate and decisive manner over the coming years. For state executive summaries, go to the NEEP website at http://neepecon.org/conference-presentations/.
© 2015 Brandeis International Business School. Created by BullsEye Resources, www.bullseyeresources.com. 5
New England Economic Partnership: Building the Backbone of Energy Efficiency
CoNfErENCE ThEmEs � Trends: With economic growth, consumers are demanding more energy across global markets, as new technologies (fracking) and OPEC production policies increase supply. This has resulted in a dramatic decrease in the price of oil, lower oil and gas production costs, and a decline in the carbon intensity of the global economy. This low-price envi-ronment may be the “new normal” for some time. In fact, the United States may begin to export energy for the first time in 40 years. However, New England is at the end of the energy supply chain where the logistics of pipelines and delivery contribute to higher electricity and gas prices than the rest of the country.
� The New England states face a variety of costs and infrastructure issues that are not well coordinated across the region (see NEEP state write-ups with link here).
� Infrastructure: Electricity prices are on the rise across New England. Despite an effort to lower costs to consumers through deregulation and increased competition in the 1990s, New England has higher cost of power generation along with an inadequate infrastruc-ture that cannot deliver lower cost energy efficiently. Energy experts are looking at a vari-ety of options: from pipeline expansion that could provide adequate gas supply to meet peak demand, more diversification of supply (e.g., wind and hydro), and energy demand efficiency, so that utilities can improve the grid and decrease electricity prices.
� Technology: The energy sector faces daunting challenges of providing the world with affordable, reliable, and convenient energy through investments in new technologies, while mitigating the impact of climate change. Addressing these challenges requires new technologies, significant funding, and policies that spur innovation. The energy sector needs government engagement, support, and funding—which requires a fun-damental rethinking of how governments partner with the private sector in technology investments.
� Policy: New England’s energy sector faces significant challenges. New England is at the end of the pipeline. The region has high energy prices, price volatility, an aging infra-structure, a lack of capacity, and a slow rate of bringing new capacity online. Historical-ly, Massachusetts and New England have been innovators in developing policies and collaborations to address the challenges ahead. State policies have improved demand management, energy efficiency, and innovation. New policies are needed to address the challenges of today’s volatile prices, constrained capacity, and climate change. Strate-gies and plans need to be developed and implemented effectively to address the real challenges of the region.
The conference also recognized the innovative leadership of Eric Speigel, the CEO of Siemens USA. Siemens is a leader in developing innovative sustainable energy technol-ogies through partnerships with universities, energy incubators, and entrepreneurs to remain on the forefront of innovative technologies. Eric Speigel, and Seimens USA under his leadership, are applauded for their socially responsible, visionary, and successful im-plementation of new technologies with active participation of the Siemens management team and Eric Speigel.
© 2015 Brandeis International Business School. Created by BullsEye Resources, www.bullseyeresources.com. 6
ovErviEwConsumers are demanding more energy globally, as new technologies (especially hydrau-lic fracking) and OPEC production policies (e.g., Saudi Arabia’s decision to defend market share by holding production at current levels) are increasing the supply. This has resulted in a dramatic decrease in the price of oil, lower oil and gas production costs and a decline in the carbon intensity of the global economy. This low-price environment may be the “new normal” for some time. In fact, the United States may begin to export energy for the first time in 40 years. However, New England is at the end of the energy supply chain where the logistics of pipelines and delivery contribute to higher oil and gas prices than the rest of the country.
CoNTExTJohn Ballantine introduced the conference and set the stage for the day. He explained that we face the same issue today that has existed for some time: formulating a competi-tive and efficient energy policy in a complex and dynamic world. The challenges are even greater today based on the realities of climate change. For New England, the challenge is to have energy supplied at a competitive price to keep the region vital. Competitive ener-gy prices are a function of infrastructure, innovation, and policy at the state and regional level. The focus of this conference was on state-level infrastructure needs, energy innova-tion, and regional policy.
Kevin Lindemer kicked off the conference, by looking at New England within the context of global, national, and regional trends of technologies, demands, supply logistics, and energy policies.
KEy TAKEAwAysThere have been major changes in world energy markets and policies over the past few years. Over the last decade, U.S. and world energy markets have undergone more major changes than any period in history, many of which were abrupt and unanticipated. The discussion today is on the oil and gas sector that has experienced drastic changes in prices, supply and demand shifts, technology advances, demographics changes, and new policy priorities.
Aging demographics are shifting consumption patterns in developed countries that ac-count for 40% of the global population; the percent of people at working age is declining. As people age, they consume less energy, especially oil, and this leads to a mature energy market and a per capita drop in energy consumption in many countries.
New technologies—specifically hydraulic fracking and horizontal drilling—have enabled the United States to become the new swing producer for oil and gas. Producers still need to deliver the oil and gas to the end market, which is creating many logistical challenges, as there are many bottlenecks and not a well-designed, efficient pipeline network in the U.S. In addition, the United States and individual states have enacted numerous policies—fracking, carbon emissions, railroad safety—over the last few years that impact almost every aspect of energy.
NEw ENGlAND ENErGy ChAllENGEs AND TrENDsIntroduction: John ballantine, President, New England Economic Partnership (NEEP), Brandeis International Business SchoolSpeaker: Kevin lindemer, Managing Director, IHS Global Insight/Cambridge Energy Research Associates
© 2015 Brandeis International Business School. Created by BullsEye Resources, www.bullseyeresources.com. 7
New England Economic Partnership: Building the Backbone of Energy Efficiency
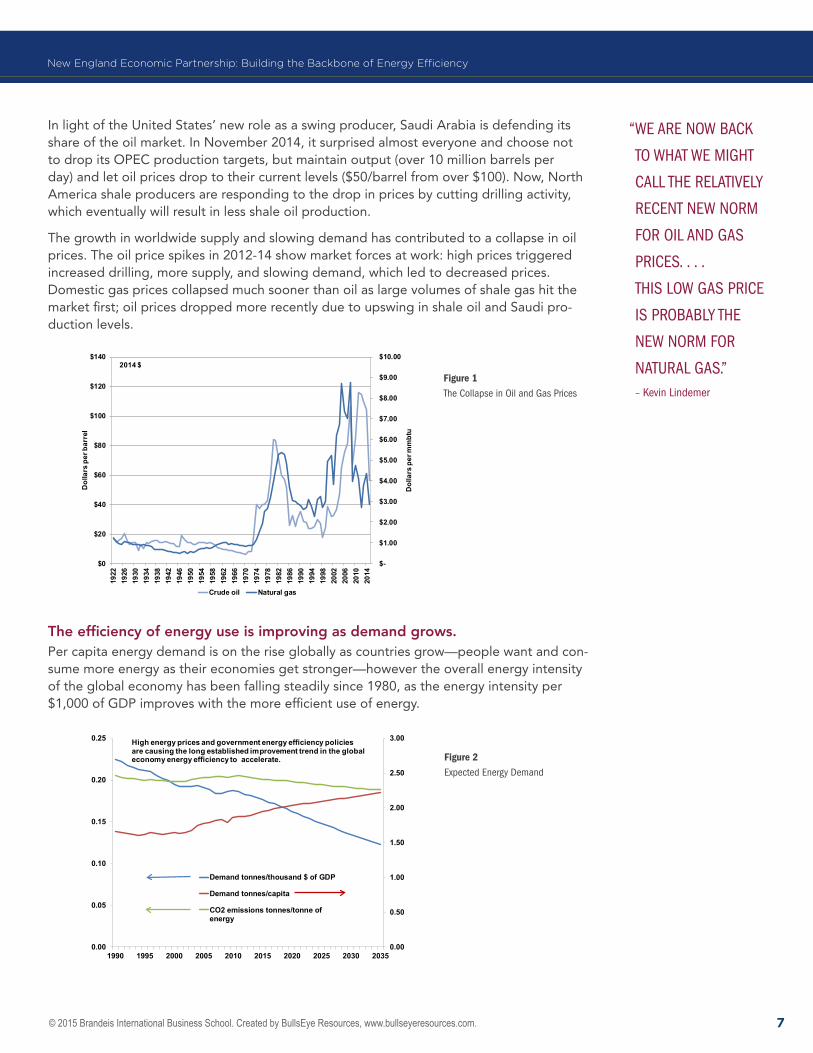
In light of the United States’ new role as a swing producer, Saudi Arabia is defending its share of the oil market. In November 2014, it surprised almost everyone and choose not to drop its OPEC production targets, but maintain output (over 10 million barrels per day) and let oil prices drop to their current levels ($50/barrel from over $100). Now, North America shale producers are responding to the drop in prices by cutting drilling activity, which eventually will result in less shale oil production.
The growth in worldwide supply and slowing demand has contributed to a collapse in oil prices. The oil price spikes in 2012-14 show market forces at work: high prices triggered increased drilling, more supply, and slowing demand, which led to decreased prices. Domestic gas prices collapsed much sooner than oil as large volumes of shale gas hit the market first; oil prices dropped more recently due to upswing in shale oil and Saudi pro-duction levels.
Figure 1The Collapse in Oil and Gas Prices
The efficiency of energy use is improving as demand grows.Per capita energy demand is on the rise globally as countries grow—people want and con-sume more energy as their economies get stronger—however the overall energy intensity of the global economy has been falling steadily since 1980, as the energy intensity per $1,000 of GDP improves with the more efficient use of energy.
Figure 2Expected Energy Demand
“WE arE nOW baCk
TO WhaT WE miGhT
Call ThE rElaTivEly
rECEnT nEW nOrm
fOr Oil anD Gas
PriCEs. . . .
This lOW Gas PriCE
is PrObably ThE
nEW nOrm fOr
naTural Gas.”– kevin lindemer
Oil and Gas Prices: both have collapsed from supply pressures…again
$-
$1.00
$2.00
$3.00
$4.00
$5.00
$6.00
$7.00
$8.00
$9.00
$10.00
$0
$20
$40
$60
$80
$100
$120
$140
1922
1926
1930
1934
1938
1942
1946
1950
1954
1958
1962
1966
1970
1974
1978
1982
1986
1990
1994
1998
2002
2006
2010
2014
Dol
lars
per
mm
btu
Dol
lars
per
bar
rel
Crude oil Natural gas
2014 $
Energy Demand: People Will Need More, but the Economy Will Need Less for Growth With Less CO2
0.00
0.50
1.00
1.50
2.00
2.50
3.00
0.00
0.05
0.10
0.15
0.20
0.25
1990 1995 2000 2005 2010 2015 2020 2025 2030 2035
Demand tonnes/thousand $ of GDP
Demand tonnes/capita
CO2 emissions tonnes/tonne ofenergy
High energy prices and government energy efficiency policiesare causing the long established improvement trend in the globaleconomy energy efficiency to accelerate.
© 2015 Brandeis International Business School. Created by BullsEye Resources, www.bullseyeresources.com. 8
New England Economic Partnership: Building the Backbone of Energy Efficiency
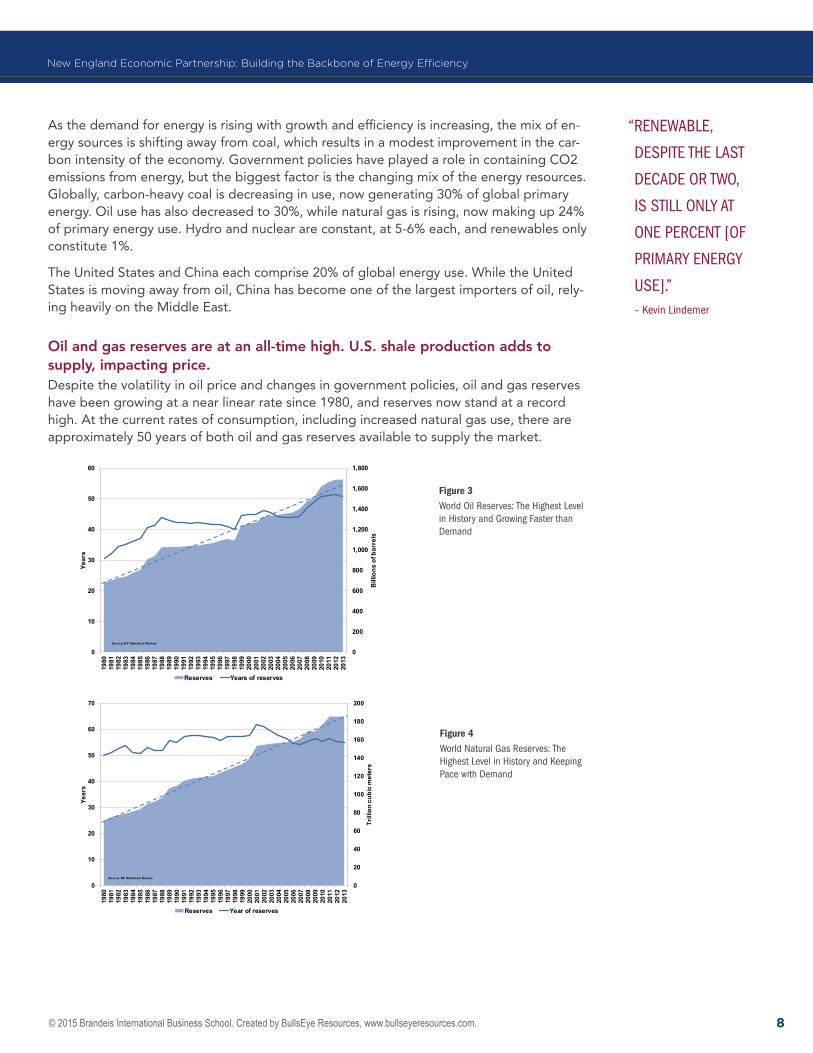
As the demand for energy is rising with growth and efficiency is increasing, the mix of en-ergy sources is shifting away from coal, which results in a modest improvement in the car-bon intensity of the economy. Government policies have played a role in containing CO2 emissions from energy, but the biggest factor is the changing mix of the energy resources. Globally, carbon-heavy coal is decreasing in use, now generating 30% of global primary energy. Oil use has also decreased to 30%, while natural gas is rising, now making up 24% of primary energy use. Hydro and nuclear are constant, at 5-6% each, and renewables only constitute 1%.
The United States and China each comprise 20% of global energy use. While the United States is moving away from oil, China has become one of the largest importers of oil, rely-ing heavily on the Middle East.
Oil and gas reserves are at an all-time high. U.S. shale production adds to supply, impacting price.Despite the volatility in oil price and changes in government policies, oil and gas reserves have been growing at a near linear rate since 1980, and reserves now stand at a record high. At the current rates of consumption, including increased natural gas use, there are approximately 50 years of both oil and gas reserves available to supply the market.
Figure 3World Oil reserves: The highest level in history and Growing faster than Demand
Figure 4World natural Gas reserves: The highest level in history and keeping Pace with Demand
“rEnEWablE,
DEsPiTE ThE lasT
DECaDE Or TWO,
is sTill Only aT
OnE PErCEnT [Of
Primary EnErGy
usE].”– kevin lindemer
World Oil Reserves: the highest level in history and growing faster than demand
0
200
400
600
800
1,000
1,200
1,400
1,600
1,800
0
10
20
30
40
50
60
1980
1981
1982
1983
1984
1985
1986
1987
1988
1989
1990
1991
1992
1993
1994
1995
1996
1997
1998
1999
2000
2001
2002
2003
2004
2005
2006
2007
2008
2009
2010
2011
2012
2013
Bill
ions
of b
arre
ls
Year
s
Reserves Years of reserves
Source: BP Statistical Review
0
20
40
60
80
100
120
140
160
180
200
0
10
20
30
40
50
60
70
1980
1981
1982
1983
1984
1985
1986
1987
1988
1989
1990
1991
1992
1993
1994
1995
1996
1997
1998
1999
2000
2001
2002
2003
2004
2005
2006
2007
2008
2009
2010
2011
2012
2013
Trill
ion
cubi
c m
eter
s
Year
s
Reserves Year of reserves
Source: BP Statistical Review
© 2015 Brandeis International Business School. Created by BullsEye Resources, www.bullseyeresources.com. 9
New England Economic Partnership: Building the Backbone of Energy Efficiency
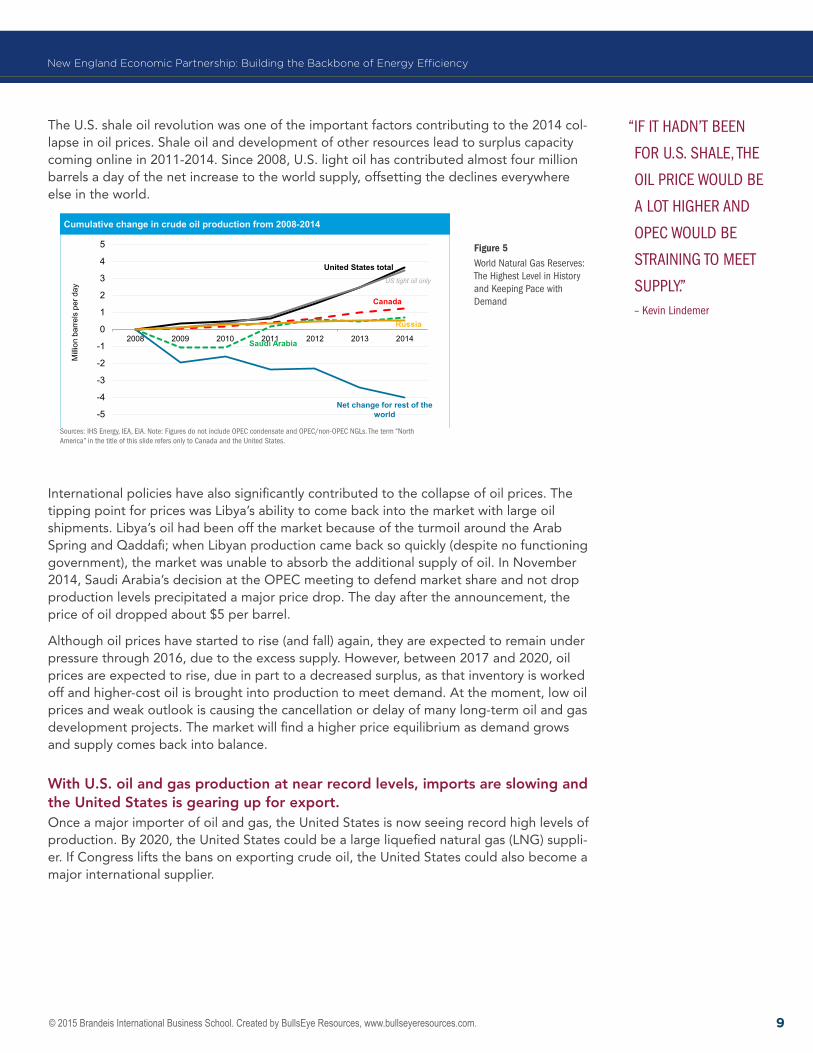
The U.S. shale oil revolution was one of the important factors contributing to the 2014 col-lapse in oil prices. Shale oil and development of other resources lead to surplus capacity coming online in 2011-2014. Since 2008, U.S. light oil has contributed almost four million barrels a day of the net increase to the world supply, offsetting the declines everywhere else in the world.
Figure 5World natural Gas reserves: The highest level in history and keeping Pace with Demand
International policies have also significantly contributed to the collapse of oil prices. The tipping point for prices was Libya’s ability to come back into the market with large oil shipments. Libya’s oil had been off the market because of the turmoil around the Arab Spring and Qaddafi; when Libyan production came back so quickly (despite no functioning government), the market was unable to absorb the additional supply of oil. In November 2014, Saudi Arabia’s decision at the OPEC meeting to defend market share and not drop production levels precipitated a major price drop. The day after the announcement, the price of oil dropped about $5 per barrel.
Although oil prices have started to rise (and fall) again, they are expected to remain under pressure through 2016, due to the excess supply. However, between 2017 and 2020, oil prices are expected to rise, due in part to a decreased surplus, as that inventory is worked off and higher-cost oil is brought into production to meet demand. At the moment, low oil prices and weak outlook is causing the cancellation or delay of many long-term oil and gas development projects. The market will find a higher price equilibrium as demand grows and supply comes back into balance.
With U.S. oil and gas production at near record levels, imports are slowing and the United States is gearing up for export.Once a major importer of oil and gas, the United States is now seeing record high levels of production. By 2020, the United States could be a large liquefied natural gas (LNG) suppli-er. If Congress lifts the bans on exporting crude oil, the United States could also become a major international supplier.
Tight oil
United States total
Saudi Arabia
-5
-4
-3
-2
-1
0
1
2
3
4
5
2008 2009 2010 2011 2012 2013 2014
Cumulative change in crude oil production from 2008-2014
© 2014 IHS
Milli
on b
arre
ls p
er d
ay
Net change for rest of the world
Russia
Canada
US tight oil only
sources: ihs Energy, iEa, Eia. note: figures do not include OPEC condensate and OPEC/non-OPEC nGls. The term “north america” in the title of this slide refers only to Canada and the united states.
“if iT haDn’T bEEn
fOr u.s. shalE, ThE
Oil PriCE WOulD bE
a lOT hiGhEr anD
OPEC WOulD bE
sTraininG TO mEET
suPPly.”– kevin lindemer
© 2015 Brandeis International Business School. Created by BullsEye Resources, www.bullseyeresources.com. 10
New England Economic Partnership: Building the Backbone of Energy Efficiency
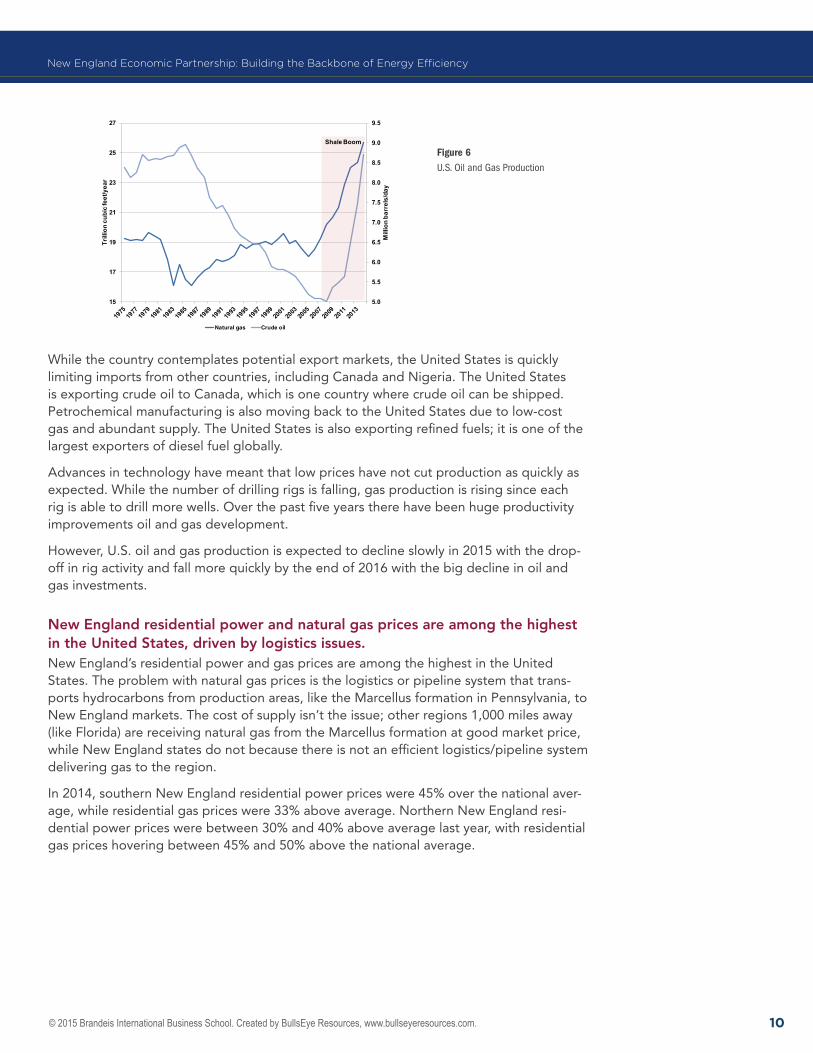
Figure 6u.s. Oil and Gas Production
While the country contemplates potential export markets, the United States is quickly limiting imports from other countries, including Canada and Nigeria. The United States is exporting crude oil to Canada, which is one country where crude oil can be shipped. Petrochemical manufacturing is also moving back to the United States due to low-cost gas and abundant supply. The United States is also exporting refined fuels; it is one of the largest exporters of diesel fuel globally.
Advances in technology have meant that low prices have not cut production as quickly as expected. While the number of drilling rigs is falling, gas production is rising since each rig is able to drill more wells. Over the past five years there have been huge productivity improvements oil and gas development.
However, U.S. oil and gas production is expected to decline slowly in 2015 with the drop-off in rig activity and fall more quickly by the end of 2016 with the big decline in oil and gas investments.
New England residential power and natural gas prices are among the highest in the United States, driven by logistics issues.New England’s residential power and gas prices are among the highest in the United States. The problem with natural gas prices is the logistics or pipeline system that trans-ports hydrocarbons from production areas, like the Marcellus formation in Pennsylvania, to New England markets. The cost of supply isn’t the issue; other regions 1,000 miles away (like Florida) are receiving natural gas from the Marcellus formation at good market price, while New England states do not because there is not an efficient logistics/pipeline system delivering gas to the region.
In 2014, southern New England residential power prices were 45% over the national aver-age, while residential gas prices were 33% above average. Northern New England resi-dential power prices were between 30% and 40% above average last year, with residential gas prices hovering between 45% and 50% above the national average.
US Oil and Gas Production: shale has driven to record high levels
5.0
5.5
6.0
6.5
7.0
7.5
8.0
8.5
9.0
9.5
15
17
19
21
23
25
27
Mill
ion
barr
els/
day
Trill
ion
cubi
c fe
et/y
ear
Natural gas Crude oil
Shale Boom
© 2015 Brandeis International Business School. Created by BullsEye Resources, www.bullseyeresources.com. 11
New England Economic Partnership: Building the Backbone of Energy Efficiency
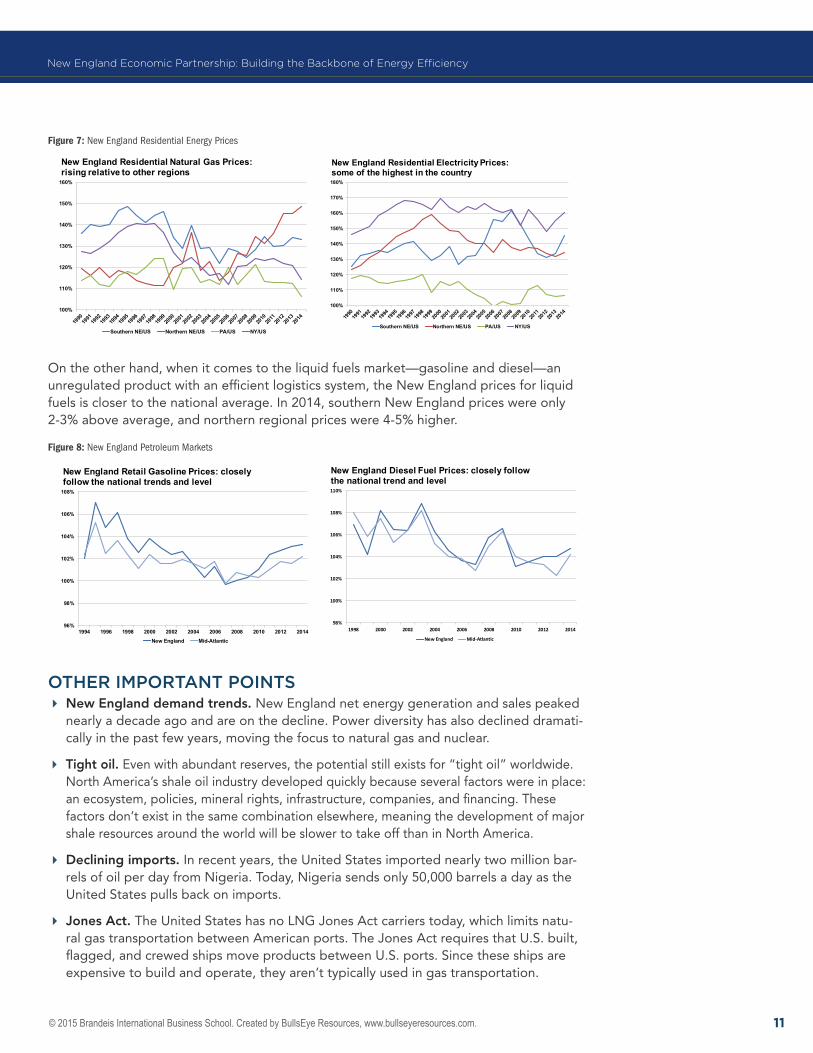
Figure 7: new England residential Energy Prices
On the other hand, when it comes to the liquid fuels market—gasoline and diesel—an unregulated product with an efficient logistics system, the New England prices for liquid fuels is closer to the national average. In 2014, southern New England prices were only 2-3% above average, and northern regional prices were 4-5% higher.
Figure 8: new England Petroleum markets
oThEr imporTANT poiNTs � New England demand trends. New England net energy generation and sales peaked nearly a decade ago and are on the decline. Power diversity has also declined dramati-cally in the past few years, moving the focus to natural gas and nuclear.
� Tight oil. Even with abundant reserves, the potential still exists for “tight oil” worldwide. North America’s shale oil industry developed quickly because several factors were in place: an ecosystem, policies, mineral rights, infrastructure, companies, and financing. These factors don’t exist in the same combination elsewhere, meaning the development of major shale resources around the world will be slower to take off than in North America.
� Declining imports. In recent years, the United States imported nearly two million bar-rels of oil per day from Nigeria. Today, Nigeria sends only 50,000 barrels a day as the United States pulls back on imports.
� Jones Act. The United States has no LNG Jones Act carriers today, which limits natu-ral gas transportation between American ports. The Jones Act requires that U.S. built, flagged, and crewed ships move products between U.S. ports. Since these ships are expensive to build and operate, they aren’t typically used in gas transportation.
100%
110%
120%
130%
140%
150%
160%
New England Residential Natural Gas Prices: rising relative to other regions
Southern NE/US Northern NE/US PA/US NY/US
100%
110%
120%
130%
140%
150%
160%
170%
180%
New England Residential Electricity Prices: some of the highest in the country
Southern NE/US Northern NE/US PA/US NY/US
96%
98%
100%
102%
104%
106%
108%
1994 1996 1998 2000 2002 2004 2006 2008 2010 2012 2014
New England Retail Gasoline Prices: closely follow the national trends and level
New England Mid-Atlantic
98%
100%
102%
104%
106%
108%
110%
1998 2000 2002 2004 2006 2008 2010 2012 2014
New England Diesel Fuel Prices: closely follow the national trend and level
New England Mid-Atlantic
© 2015 Brandeis International Business School. Created by BullsEye Resources, www.bullseyeresources.com. 12
“CEnTralizED
rEsOurCEs arEn’T
GOinG aWay. in
ThE nOrThEasT,
ElECTriCiTy is nOT
GOinG TO shifT
TO DisTribuTivE
rEsOurCEs.”– bill zarakas
OverviewElectricity prices are on the rise across New England. Despite an effort to lower costs to consumers by spurring competition through deregulation at the start of the 21st century, New England has higher cost of power generation along with an inadequate infrastructure that is unable able to deliver lower cost energy efficiently.
From pipeline expansion that could provide adequate gas supply to meet peak demand, to energy supply diversification and energy efficiency, utilities and energy experts are look-ing at a variety of options to improve the electric grid and decrease end-user electricity prices.
CoNTExTPanelists with a wide variety of perspectives provided insight on the issues facing the elec-trical utilities/grid and potential solutions that could increase supply and decrease costs.
KEy TAKEAwAysAs trends impact the electricity industry infrastructure, centralized resources remain key. Bill Zarakas focused on trends that create opportunities for the electricity industry and the supporting infrastructure.
� Lines are blurring within utilities; where power supply planning, transmission, and distri-bution were once distinct silos within a utility, now managers need to contract for lower cost sources and distribute it to customers across the grid in a timely and reliable man-ner. We no longer have a fixed distribution system for electricity, with energy resources being located in the distribution system.
� Demand-side resources, including energy efficiency, are seen as a possible way to defer an estimated $600 billion in growth-related investments and upgrades to the electric distribution system, which currently has a market value at $300 billion.
� Distributed energy resource (DER) costs are declining, but centralized resources are less expensive on a wholesale basis, due to scale economies and distribution networks of traditional power generation (coal and hydro).
Quantifying demand met by DER—including distributed generation, energy efficiency, demand response, and storage—is quite difficult at the moment, according to ISO-New England, although there are substantial step to make it more observable. However, the difficult in quantifying DER isn’t preventing other states from controlling traditional re-sources; New York ISO is implementing Reforming the Energy Vision (REV), with a goal of making DER resources more available.
iNfrAsTruCTurE NEEDs AND our ElECTriCAl GriD for ThE 21sT CENTuryModerator: bill Zarakas, Principal, The Brattle Group Panelists: Jim burpee, President/CEO (retired), Canadian Electricity Association; Curtis Cole, Director of Business Development, Kinder Morgan Energy Partners; Greg Crisp, Business Development, Spectra Energy Inc., James Daly, Vice President, Eversource, and Jane michalek, Vice President, Global Partners
© 2015 Brandeis International Business School. Created by BullsEye Resources, www.bullseyeresources.com. 13
New England Economic Partnership: Building the Backbone of Energy Efficiency
Even with REV in place, centralized power will remain the dominant resources for the next decade. NYISO has forecasted that DER, which provides just 1% of energy today, will be just 8% of the overall demand by 2025, although other scenario estimates put DER as high as 18%. In these alternative forecasts, most of the DER comes from traditional demand-side management, especially energy efficiency. In almost all situations centralized resources will account for approximately 90% of electricity over the next 10 years.
Increased infrastructure spending across North America impacts energy rates.Jim Burpee, the retired CEO and president of the Canadian Electricity Association, ex-plained that the anticipated 20-year cost of building out Canada’s electricity infrastructure is $350 billion. Over the last few years, Canada has spent in excess of $20 billion per year, which is 100% above earlier annual expenditures (of $8-11 billion). Burpee predicted that the United States will experience similar increases, In other words, infrastructure expendi-tures will impact energy prices across North America as rates increase to recover capital expenditures.
Across Canada, whether Manitoba, where consumers are paying $0.06/kWh, or Halifax, where people are paying $0.15/kWh, electricity prices stir strong emotional responses from residential customers. However, we need to put these rates in perspective where German residents spend an average of 2% to 3% of total household spending on elec-tricity. In Germany, the average price is $0.45/kWh, for an average of 3,500 kWh per year, whereas in the United States and Canada, we pay far less per kWh but consume approx-imately 10,000-12,000 kWh per year. Germans consume considerable less electricity per capita partly because they don’t have air conditioning.
Burpee sees a growing role for distributed electricity generation (“microgrids”) that will supplement, but not replace, centralized grid production. Examples where microgrids could have value include for charging electric vehicles in remote locations or emergency response situations when the grid becomes unavailable. Generally, residents will not go “off the grid” with microgrids because the economics and reliability are not comparable to the value of centralized energy sources.
The U.S. electricity infrastructure relies on Canadian production, and it will probably ex-pand over the coming years. Currently, the United States consumes about 10% of Canadi-an power production via 35 international power lines between the two countries, with six more in development.
The proposed NED pipeline aims to alleviate supply bottlenecks, providing low-cost natural gas to New England.Curtis Cole described Kinder Morgan’s current activities with the Tennessee Gas Pipeline (TGP) and the company’s efforts to improve/expand the Northeast Energy Direct (NED) project.
On any given day, Kinder Morgan manages the flow of natural gas coming into its TGP. Cole said that while demand and available product exist, the market demand exceeds the amount that the pipeline can transport. Over the past three winters, supply restrictions averaged between 0.7 billions of cubic feet (BCF) per day to 1.4 BCF per day; during the cold winter of 2015 Kinder Morgan saw restrictions up to 2.6 BCF per day. Even during summer months, Kinder Morgan is restricting flow as parts of the system come down for maintenance.
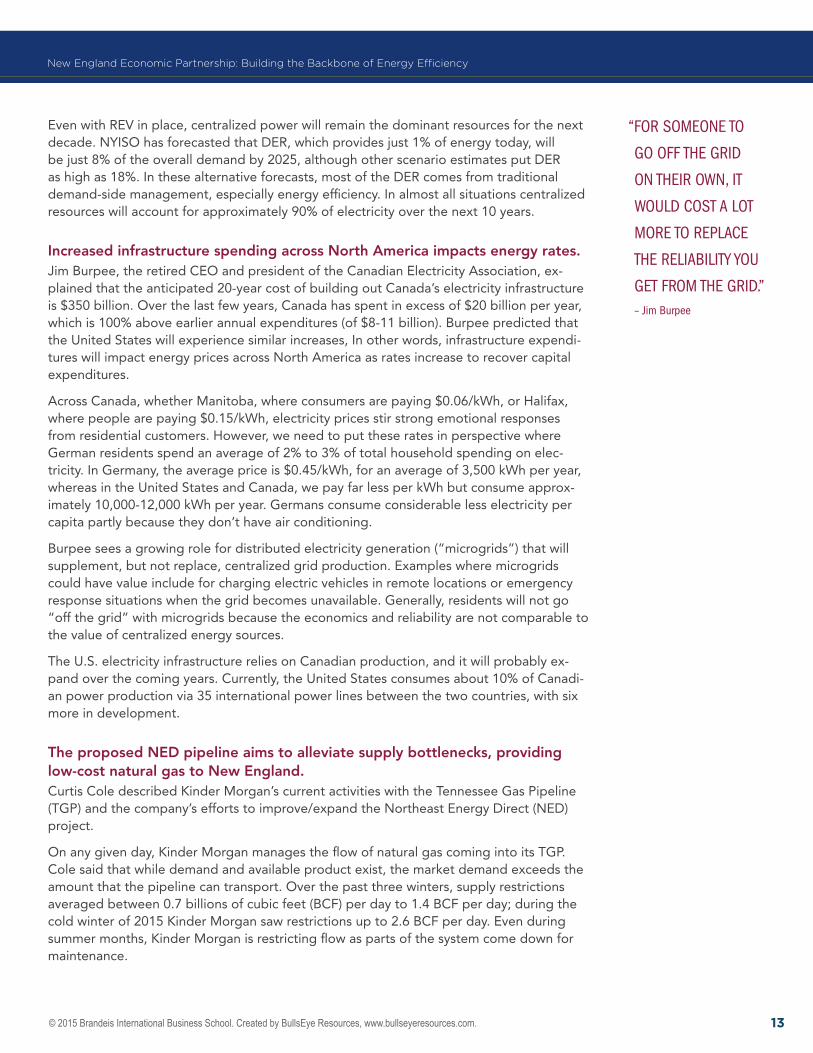
“fOr sOmEOnE TO
GO Off ThE GriD
On ThEir OWn, iT
WOulD COsT a lOT
mOrE TO rEPlaCE
ThE rEliabiliTy yOu
GET frOm ThE GriD.”– Jim burpee
© 2015 Brandeis International Business School. Created by BullsEye Resources, www.bullseyeresources.com. 14
New England Economic Partnership: Building the Backbone of Energy Efficiency
Kinder Morgan feels it needs to add to pipeline capacity to its NED project. It is proposing a bidirectional pipeline that will fundamentally change natural gas flows into the region. This will make incremental gas supplies available to local electricity exchange carriers (LEC), gas-powered generators, and industrial end users. The pipeline expansion project is expected to enhance the reliability of the New England grid by creating a new high-capac-ity, high-pressure transmission gas supply route that would be able to handle an unexpect-ed outage of one of the LEC transmission systems.
The NED is in the pre-filing stage; however, Kinder Morgan has already contracted 500,000 dekatherms (Dth) per day from the Marcellus and Wright shale fields. The pipeline also provides electric distribution companies (EDCs) with the opportunity to lower ener-gy costs. The pipeline would also be a flexible, integrated response to renewable energy sources used by the EDCs. Natural gas operates as a reliable backup to wind and solar farms.
Spectra Energy’s pipeline projects connect supply to markets to alleviate reliability concerns.Greg Crisp of Spectra Energy, another pipeline company serving New England, presented an alternative series of gas supply options. He described three possible pipeline projects that could expand electricity capacity in New England. These projects would provide greater electricity reliability on peak days, and would impact pricing as well.
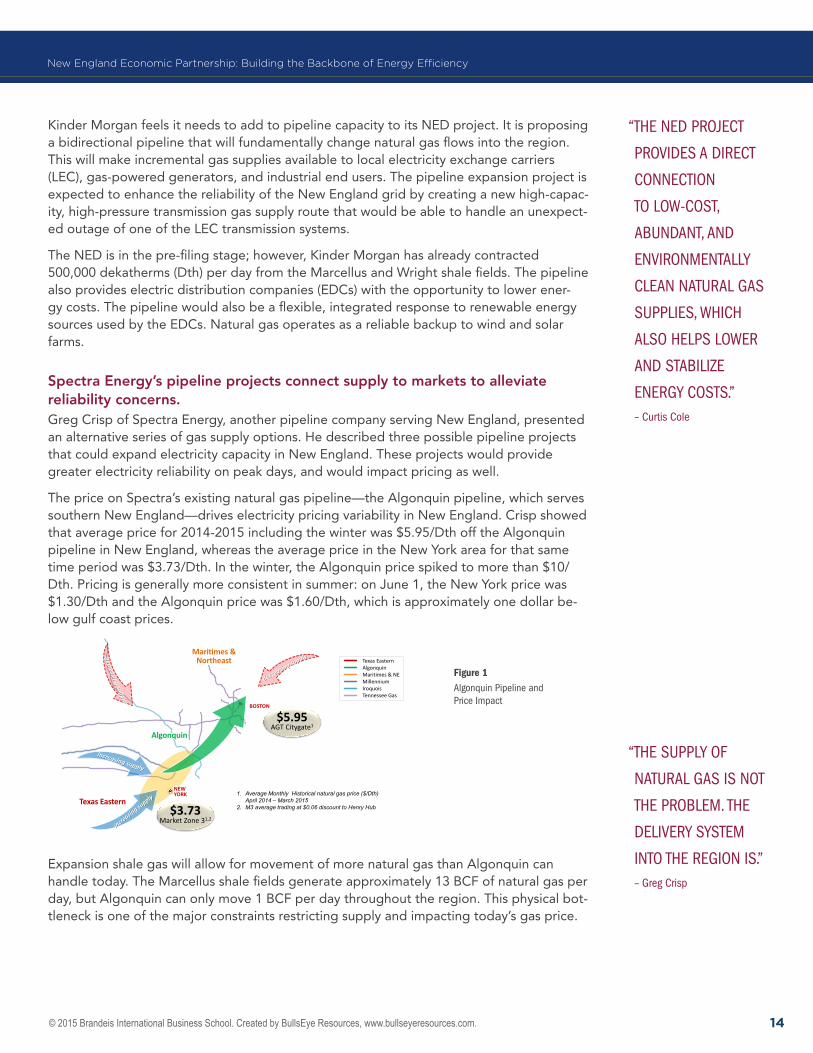
The price on Spectra’s existing natural gas pipeline—the Algonquin pipeline, which serves southern New England—drives electricity pricing variability in New England. Crisp showed that average price for 2014-2015 including the winter was $5.95/Dth off the Algonquin pipeline in New England, whereas the average price in the New York area for that same time period was $3.73/Dth. In the winter, the Algonquin price spiked to more than $10/Dth. Pricing is generally more consistent in summer: on June 1, the New York price was $1.30/Dth and the Algonquin price was $1.60/Dth, which is approximately one dollar be-low gulf coast prices.
Figure 1 algonquin Pipeline and
Price impact
Expansion shale gas will allow for movement of more natural gas than Algonquin can handle today. The Marcellus shale fields generate approximately 13 BCF of natural gas per day, but Algonquin can only move 1 BCF per day throughout the region. This physical bot-tleneck is one of the major constraints restricting supply and impacting today’s gas price.
“ThE nED PrOJECT
PrOviDEs a DirECT
COnnECTiOn
TO lOW-COsT,
abunDanT, anD
EnvirOnmEnTally
ClEan naTural Gas
suPPliEs, WhiCh
alsO hElPs lOWEr
anD sTabilizE
EnErGy COsTs.”– Curtis Cole
Meeting New England and Atlantic Canada Natural Gas Infrastructure Needs
Texas EasternAlgonquinMaritimes & NEMillenniumIroquoisTennessee Gas
BOSTON
Algonquin
Maritimes &Northeast
Texas Eastern
$5.95AGT Citygate1
$3.73Market Zone 31,2
NEW YORK 1. Average Monthly Historical natural gas price ($/Dth)
April 2014 – March 2015 2. M3 average trading at $0.06 discount to Henry Hub
“ThE suPPly Of
naTural Gas is nOT
ThE PrOblEm. ThE
DElivEry sysTEm
inTO ThE rEGiOn is.”– Greg Crisp
© 2015 Brandeis International Business School. Created by BullsEye Resources, www.bullseyeresources.com. 15
New England Economic Partnership: Building the Backbone of Energy Efficiency
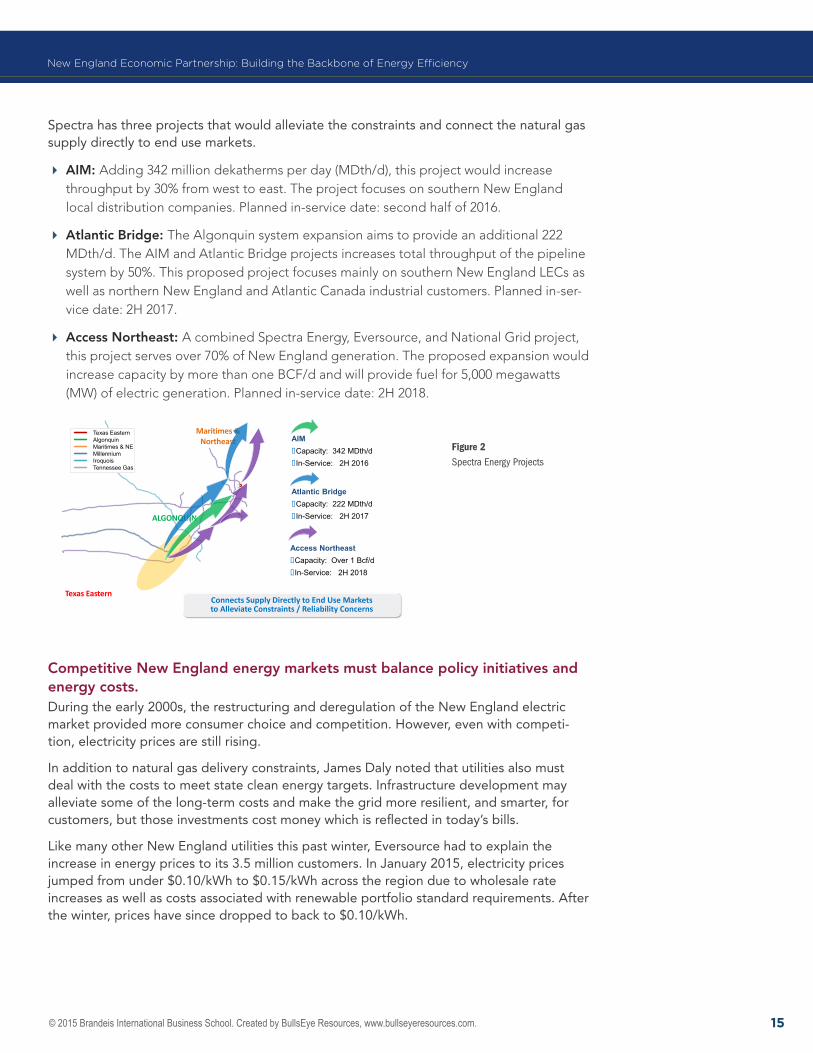
Spectra has three projects that would alleviate the constraints and connect the natural gas supply directly to end use markets.
� AIM: Adding 342 million dekatherms per day (MDth/d), this project would increase throughput by 30% from west to east. The project focuses on southern New England local distribution companies. Planned in-service date: second half of 2016.
� Atlantic Bridge: The Algonquin system expansion aims to provide an additional 222 MDth/d. The AIM and Atlantic Bridge projects increases total throughput of the pipeline system by 50%. This proposed project focuses mainly on southern New England LECs as well as northern New England and Atlantic Canada industrial customers. Planned in-ser-vice date: 2H 2017.
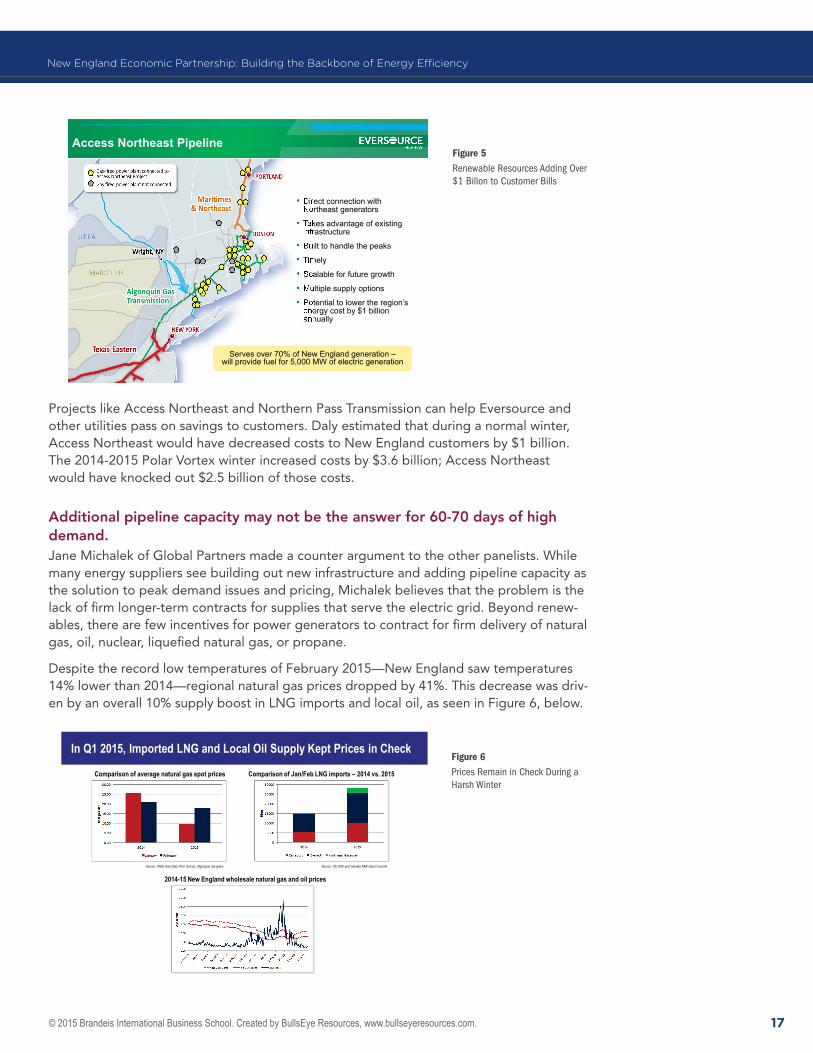
� Access Northeast: A combined Spectra Energy, Eversource, and National Grid project, this project serves over 70% of New England generation. The proposed expansion would increase capacity by more than one BCF/d and will provide fuel for 5,000 megawatts (MW) of electric generation. Planned in-service date: 2H 2018.
Figure 2spectra Energy Projects
Competitive New England energy markets must balance policy initiatives and energy costs.During the early 2000s, the restructuring and deregulation of the New England electric market provided more consumer choice and competition. However, even with competi-tion, electricity prices are still rising.
In addition to natural gas delivery constraints, James Daly noted that utilities also must deal with the costs to meet state clean energy targets. Infrastructure development may alleviate some of the long-term costs and make the grid more resilient, and smarter, for customers, but those investments cost money which is reflected in today’s bills.
Like many other New England utilities this past winter, Eversource had to explain the increase in energy prices to its 3.5 million customers. In January 2015, electricity prices jumped from under $0.10/kWh to $0.15/kWh across the region due to wholesale rate increases as well as costs associated with renewable portfolio standard requirements. After the winter, prices have since dropped to back to $0.10/kWh.
Meeting New England’s Natural Gas Needs:Leveraging Existing Infrastructure
Texas EasternAlgonquinMaritimes & NEMillenniumIroquoisTennessee Gas
ALGONQUIN
Maritimes &Northeast
Texas Eastern
AIM�Capacity: 342 MDth/d �In-Service: 2H 2016
Atlantic Bridge�Capacity: 222 MDth/d �In-Service: 2H 2017
Access Northeast�Capacity: Over 1 Bcf/d�In-Service: 2H 2018
Connects Supply Directly to End Use Markets to Alleviate Constraints / Reliability Concerns
© 2015 Brandeis International Business School. Created by BullsEye Resources, www.bullseyeresources.com. 16
New England Economic Partnership: Building the Backbone of Energy Efficiency
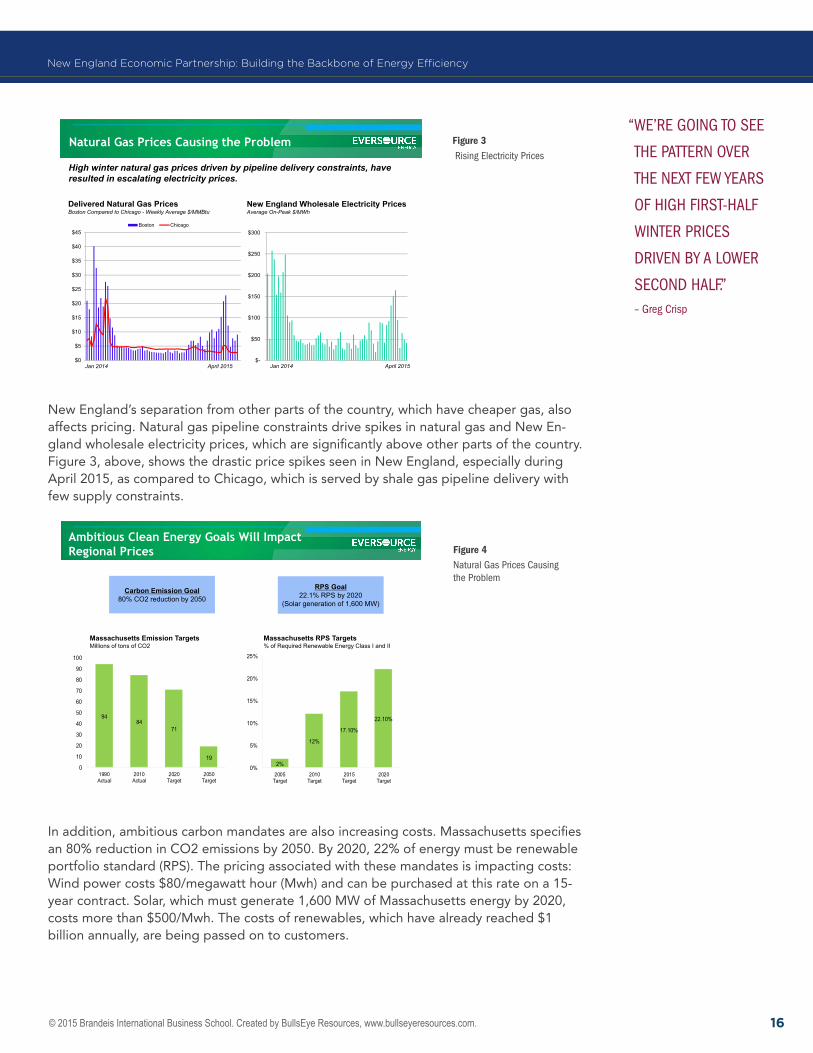
Figure 3 rising Electricity Prices
New England’s separation from other parts of the country, which have cheaper gas, also affects pricing. Natural gas pipeline constraints drive spikes in natural gas and New En-gland wholesale electricity prices, which are significantly above other parts of the country. Figure 3, above, shows the drastic price spikes seen in New England, especially during April 2015, as compared to Chicago, which is served by shale gas pipeline delivery with few supply constraints.
Figure 4natural Gas Prices Causing the Problem
In addition, ambitious carbon mandates are also increasing costs. Massachusetts specifies an 80% reduction in CO2 emissions by 2050. By 2020, 22% of energy must be renewable portfolio standard (RPS). The pricing associated with these mandates is impacting costs: Wind power costs $80/megawatt hour (Mwh) and can be purchased at this rate on a 15-year contract. Solar, which must generate 1,600 MW of Massachusetts energy by 2020, costs more than $500/Mwh. The costs of renewables, which have already reached $1 billion annually, are being passed on to customers.
“WE’rE GOinG TO sEE
ThE PaTTErn OvEr
ThE nExT fEW yEars
Of hiGh firsT-half
WinTEr PriCEs
DrivEn by a lOWEr
sECOnD half.”– Greg Crisp
Natural Gas Prices Causing the Problem
4
High winter natural gas prices driven by pipeline delivery constraints, have resulted in escalating electricity prices.
Delivered Natural Gas PricesBoston Compared to Chicago - Weekly Average $/MMBtu
New England Wholesale Electricity PricesAverage On-Peak $/MWh
$-
$50
$100
$150
$200
$250
$300
Jan 2014 April 2015Jan 2014 April 2015$0
$5
$10
$15
$20
$25
$30
$35
$40
$45Boston Chicago
Ambitious Clean Energy Goals Will Impact Regional Prices
5
Carbon Emission Goal80% CO2 reduction by 2050
RPS Goal22.1% RPS by 2020
(Solar generation of 1,600 MW)
Massachusetts Emission TargetsMillions of tons of CO2
9484
71
190
10
20
30
40
50
60
70
80
90
100
1990Actual
2010Actual
2020Target
2050Target
Massachusetts RPS Targets% of Required Renewable Energy Class I and II
2%
12%
17.10%
22.10%
0%
5%
10%
15%
20%
25%
2005Target
2010Target
2015Target
2020Target
© 2015 Brandeis International Business School. Created by BullsEye Resources, www.bullseyeresources.com. 17
New England Economic Partnership: Building the Backbone of Energy Efficiency
Figure 5renewable resources adding Over $1 billon to Customer bills
Projects like Access Northeast and Northern Pass Transmission can help Eversource and other utilities pass on savings to customers. Daly estimated that during a normal winter, Access Northeast would have decreased costs to New England customers by $1 billion. The 2014-2015 Polar Vortex winter increased costs by $3.6 billion; Access Northeast would have knocked out $2.5 billion of those costs.
Additional pipeline capacity may not be the answer for 60-70 days of high demand.Jane Michalek of Global Partners made a counter argument to the other panelists. While many energy suppliers see building out new infrastructure and adding pipeline capacity as the solution to peak demand issues and pricing, Michalek believes that the problem is the lack of firm longer-term contracts for supplies that serve the electric grid. Beyond renew-ables, there are few incentives for power generators to contract for firm delivery of natural gas, oil, nuclear, liquefied natural gas, or propane.
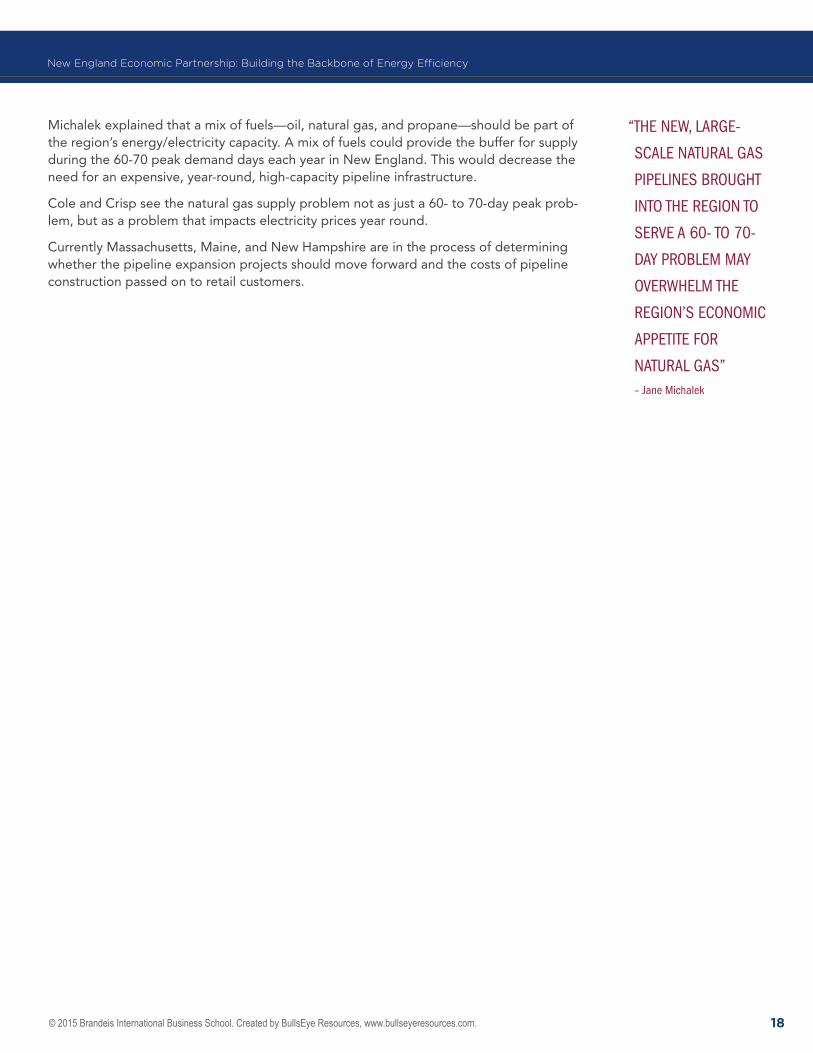
Despite the record low temperatures of February 2015—New England saw temperatures 14% lower than 2014—regional natural gas prices dropped by 41%. This decrease was driv-en by an overall 10% supply boost in LNG imports and local oil, as seen in Figure 6, below.
Figure 6Prices remain in Check During a harsh Winter
8
• Direct connection with Northeast generators
• Takes advantage of existing infrastructure
• Built to handle the peaks
• Timely
• Scalable for future growth
• Multiple supply options
• Potential to lower the region’s energy cost by $1 billion annually
Serves over 70% of New England generation –will provide fuel for 5,000 MW of electric generation
Serves over 70% of New England generation –will provide fuel for 5,000 MW of electric generation
Access Northeast Pipeline
4 │ New England Economic Partnership │ June 2, 2015
Comparison of average natural gas spot prices Comparison of Jan/Feb LNG imports – 2014 vs. 2015
2014-15 New England wholesale natural gas and oil prices
Source: Platts Gas Daily Price Survey- Algonquin city-gates Source: US DOE and Canada NEB import records
Source: Platts
In Q1 2015, Imported LNG and Local Oil Supply Kept Prices in Check
© 2015 Brandeis International Business School. Created by BullsEye Resources, www.bullseyeresources.com. 18
New England Economic Partnership: Building the Backbone of Energy Efficiency
Michalek explained that a mix of fuels—oil, natural gas, and propane—should be part of the region’s energy/electricity capacity. A mix of fuels could provide the buffer for supply during the 60-70 peak demand days each year in New England. This would decrease the need for an expensive, year-round, high-capacity pipeline infrastructure.
Cole and Crisp see the natural gas supply problem not as just a 60- to 70-day peak prob-lem, but as a problem that impacts electricity prices year round.
Currently Massachusetts, Maine, and New Hampshire are in the process of determining whether the pipeline expansion projects should move forward and the costs of pipeline construction passed on to retail customers.
“ThE nEW, larGE-
sCalE naTural Gas
PiPElinEs brOuGhT
inTO ThE rEGiOn TO
sErvE a 60- TO 70-
Day PrOblEm may
OvErWhElm ThE
rEGiOn’s ECOnOmiC
aPPETiTE fOr
naTural Gas”– Jane michalek
© 2015 Brandeis International Business School. Created by BullsEye Resources, www.bullseyeresources.com. 19
“EnErGy is ThE
lifE blOOD Of
mODErn sOCiETy
anD mODErn
ECOnOmiEs.”– matthew bunn
OverviewThe energy sector faces daunting challenges of providing the world with affordable, reli-able, and convenient energy while not aggravating the impact of climate change. Innova-tion is the key.
Dealing with these challenges requires new technologies, significant funding, and policies that spur innovation. The energy sector needs government engagement, support, and funding—which requires a fundamental rethinking of the partnering role of government in energy—working with private sector in joint technology investments.
CoNTExTEach panelist provided his perspective on how to increase innovation in the energy sector, and how to improve energy technology.
KEy TAKEAwAysThe U.S. government needs an effective energy technology policy to motivate innovation. The world faces significant energy challenges. These include climate change, energy security challenges, and poverty, as over one billion people on the planet lack access to modern energy.
Matthew Bunn and his colleagues considered the role of the U.S. government in support-ing energy innovation that is covered in a Harvard Kennedy School book that he co-edited, Transforming U.S. Energy Innovation.
Some of the conclusions in the book included: the United States needs to double ener-gy research, development, and support demonstration (R&D) investments to encourage significantly faster technological progress. R&D investment can lead to huge returns; if we pursued recommended R&D funding over the next twenty years, it has the potential to generate $80 to $350 billion in benefits by 2050.
The United States also needs to transform the way that energy institutions are run. Labs need sustained/consistent budgets that hold managers accountable for meeting objec-tives; and lab managers need the flexibility to shift budgeted funds to the best opportuni-ties. The government should also be involved when there is too much risk for the private sector (like carbon sequestration). We may need a new institution for managing large-scale technology demonstration projects. The energy R&D approach should understand the risks and acknowledge that occasionally there will be failures. R&D is about pushing
TEChNoloGy, iNNovATioN AND susTAiNAbiliTyDeveloping and Funding Our Energy FutureModerator: matthew bunn, Professors of Practice, Co-Principal Investigator, Project on Managing the Atom, Harvard’s John F. Kennedy School of GovernmentPanelists: Dr. David rapaport, Head of Technology Innovation Management US for Siemens Corporation, Corporate Technology, Kevin ramsdell, Advanced Facilities Specialist, General Dynamics Mission Systems, and lucas missong, Senior Vice President, Boston Energy Investors Fund (ARES)
“WE arGuE ThaT
ThErE arE huGE
rETurns TO
an inCrEasED
invEsTmEnT in
rD&D.”– matthew bunn
© 2015 Brandeis International Business School. Created by BullsEye Resources, www.bullseyeresources.com. 20
New England Economic Partnership: Building the Backbone of Energy Efficiency
boundaries, and stumbles, without becoming mired in government investigations every time a problem occurs. Unfortunately, Congress is making significant federal funding re-ductions and moving in the wrong direction.
Bunn felt that we need a new approach of cooperating with and working with the private sector. There should be more learning by doing, where organizations collect and analyze data on what worked and what didn’t work. For example, setting a substantial carbon price will also motivate private sector innovation, driving businesses and individuals to find solutions that include the cost of carbon on our environment and economy.
Since energy is a worldwide challenge, international cooperation is also key to transform-ing U.S. energy innovation. The U.S. government needs to figure out how to interact with the energy R&D initiatives in other countries. The worldwide market for energy supply and efficiency technology is likely to be in the tens of trillions of dollars over the next decade. The United States needs to make sure it is a substantial player in these R&D initiatives.
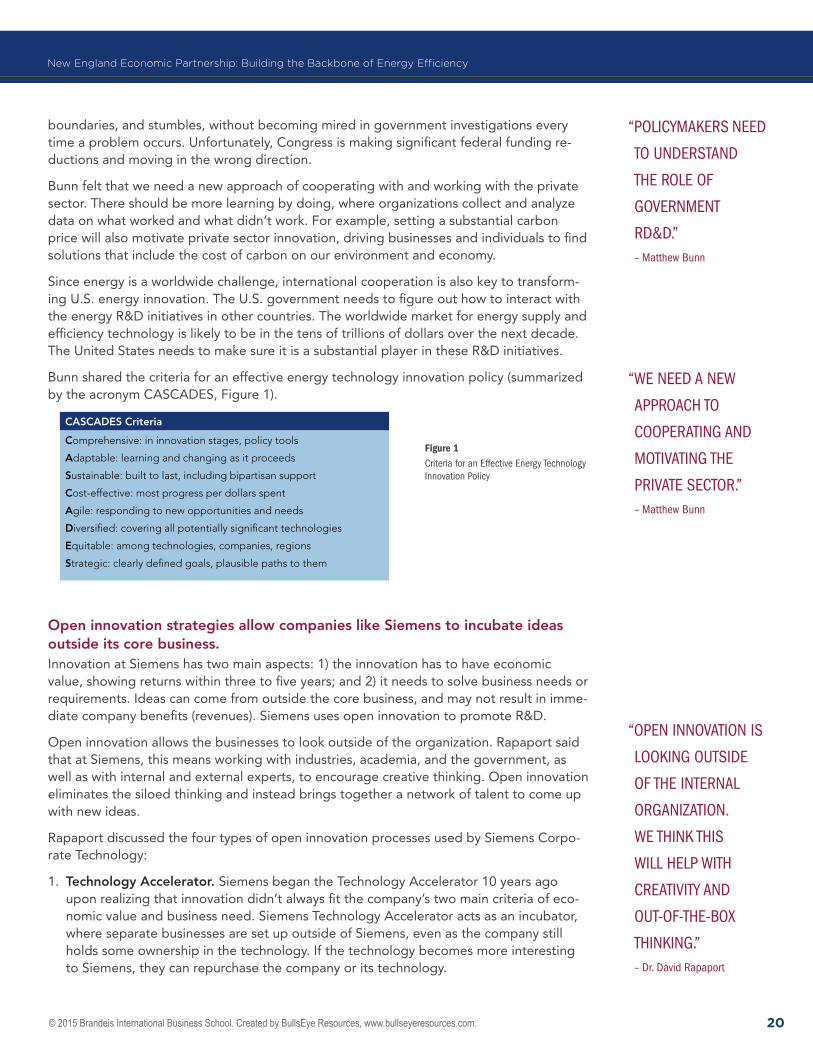
Bunn shared the criteria for an effective energy technology innovation policy (summarized by the acronym CASCADES, Figure 1).
Figure 1Criteria for an Effective Energy Technology innovation Policy
Open innovation strategies allow companies like Siemens to incubate ideas outside its core business. Innovation at Siemens has two main aspects: 1) the innovation has to have economic value, showing returns within three to five years; and 2) it needs to solve business needs or requirements. Ideas can come from outside the core business, and may not result in imme-diate company benefits (revenues). Siemens uses open innovation to promote R&D.
Open innovation allows the businesses to look outside of the organization. Rapaport said that at Siemens, this means working with industries, academia, and the government, as well as with internal and external experts, to encourage creative thinking. Open innovation eliminates the siloed thinking and instead brings together a network of talent to come up with new ideas.
Rapaport discussed the four types of open innovation processes used by Siemens Corpo-rate Technology:
1. Technology Accelerator. Siemens began the Technology Accelerator 10 years ago upon realizing that innovation didn’t always fit the company’s two main criteria of eco-nomic value and business need. Siemens Technology Accelerator acts as an incubator, where separate businesses are set up outside of Siemens, even as the company still holds some ownership in the technology. If the technology becomes more interesting to Siemens, they can repurchase the company or its technology.
“POliCymakErs nEED
TO unDErsTanD
ThE rOlE Of
GOvErnmEnT
rD&D.”– matthew bunn
“WE nEED a nEW
aPPrOaCh TO
COOPEraTinG anD
mOTivaTinG ThE
PrivaTE sECTOr.”– matthew bunn
CASCADES Criteria
Comprehensive: in innovation stages, policy tools
Adaptable: learning and changing as it proceeds
Sustainable: built to last, including bipartisan support
Cost-effective: most progress per dollars spent
Agile: responding to new opportunities and needs
Diversified: covering all potentially significant technologies
Equitable: among technologies, companies, regions
Strategic: clearly defined goals, plausible paths to them
“OPEn innOvaTiOn is
lOOkinG OuTsiDE
Of ThE inTErnal
OrGanizaTiOn.
WE Think This
Will hElP WiTh
CrEaTiviTy anD
OuT-Of-ThE-bOx
ThinkinG.”– Dr. David rapaport
© 2015 Brandeis International Business School. Created by BullsEye Resources, www.bullseyeresources.com. 21
New England Economic Partnership: Building the Backbone of Energy Efficiency
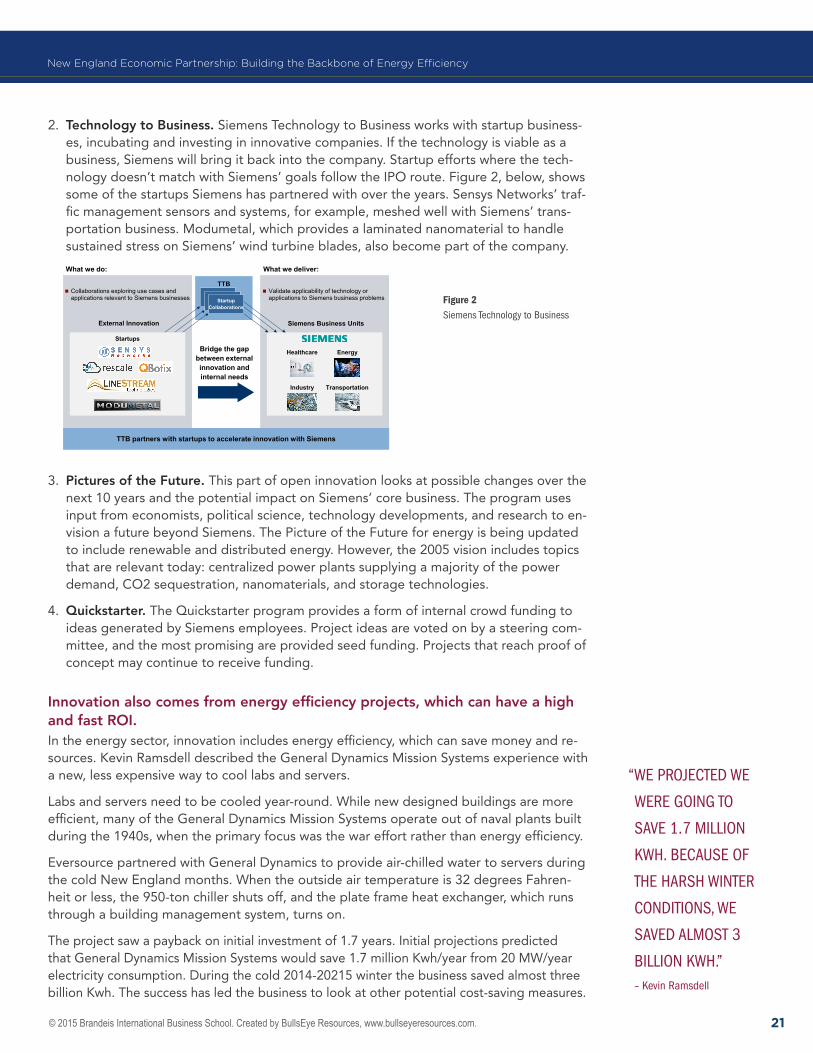
2. Technology to Business. Siemens Technology to Business works with startup business-es, incubating and investing in innovative companies. If the technology is viable as a business, Siemens will bring it back into the company. Startup efforts where the tech-nology doesn’t match with Siemens’ goals follow the IPO route. Figure 2, below, shows some of the startups Siemens has partnered with over the years. Sensys Networks’ traf-fic management sensors and systems, for example, meshed well with Siemens’ trans-portation business. Modumetal, which provides a laminated nanomaterial to handle sustained stress on Siemens’ wind turbine blades, also become part of the company.
Figure 2siemens Technology to business
3. Pictures of the Future. This part of open innovation looks at possible changes over the next 10 years and the potential impact on Siemens’ core business. The program uses input from economists, political science, technology developments, and research to en-vision a future beyond Siemens. The Picture of the Future for energy is being updated to include renewable and distributed energy. However, the 2005 vision includes topics that are relevant today: centralized power plants supplying a majority of the power demand, CO2 sequestration, nanomaterials, and storage technologies.
4. Quickstarter. The Quickstarter program provides a form of internal crowd funding to ideas generated by Siemens employees. Project ideas are voted on by a steering com-mittee, and the most promising are provided seed funding. Projects that reach proof of concept may continue to receive funding.
Innovation also comes from energy efficiency projects, which can have a high and fast ROI.In the energy sector, innovation includes energy efficiency, which can save money and re-sources. Kevin Ramsdell described the General Dynamics Mission Systems experience with a new, less expensive way to cool labs and servers.
Labs and servers need to be cooled year-round. While new designed buildings are more efficient, many of the General Dynamics Mission Systems operate out of naval plants built during the 1940s, when the primary focus was the war effort rather than energy efficiency.
Eversource partnered with General Dynamics to provide air-chilled water to servers during the cold New England months. When the outside air temperature is 32 degrees Fahren-heit or less, the 950-ton chiller shuts off, and the plate frame heat exchanger, which runs through a building management system, turns on.
The project saw a payback on initial investment of 1.7 years. Initial projections predicted that General Dynamics Mission Systems would save 1.7 million Kwh/year from 20 MW/year electricity consumption. During the cold 2014-20215 winter the business saved almost three billion Kwh. The success has led the business to look at other potential cost-saving measures.
n Collaborations exploring use cases and applications relevant to Siemens businesses
External Innovation Siemens Business Units
TTB
Healthcare Energy
TransportationIndustry
Bridge the gap between external innovation and internal needs
TTB partners with startups to accelerate innovation with Siemens
Startups
n Validate applicability of technology or applications to Siemens business problemsProjectsProjectsStartup
Collaborations
What we do: What we deliver:
“WE PrOJECTED WE
WErE GOinG TO
savE 1.7 milliOn
kWh. bECausE Of
ThE harsh WinTEr
COnDiTiOns, WE
savED almOsT 3
billiOn kWh.”– kevin ramsdell
© 2015 Brandeis International Business School. Created by BullsEye Resources, www.bullseyeresources.com. 22
New England Economic Partnership: Building the Backbone of Energy Efficiency
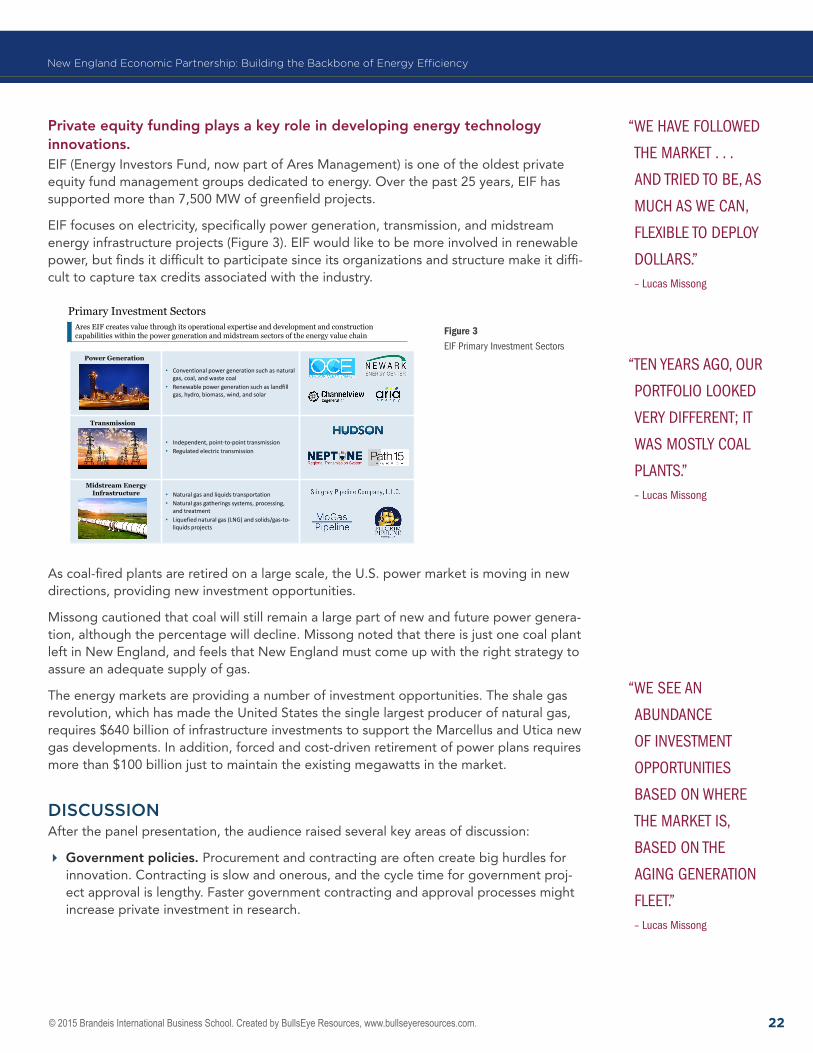
Private equity funding plays a key role in developing energy technology innovations.EIF (Energy Investors Fund, now part of Ares Management) is one of the oldest private equity fund management groups dedicated to energy. Over the past 25 years, EIF has supported more than 7,500 MW of greenfield projects.
EIF focuses on electricity, specifically power generation, transmission, and midstream energy infrastructure projects (Figure 3). EIF would like to be more involved in renewable power, but finds it difficult to participate since its organizations and structure make it diffi-cult to capture tax credits associated with the industry.
Figure 3 Eif Primary investment sectors
As coal-fired plants are retired on a large scale, the U.S. power market is moving in new directions, providing new investment opportunities.
Missong cautioned that coal will still remain a large part of new and future power genera-tion, although the percentage will decline. Missong noted that there is just one coal plant left in New England, and feels that New England must come up with the right strategy to assure an adequate supply of gas.
The energy markets are providing a number of investment opportunities. The shale gas revolution, which has made the United States the single largest producer of natural gas, requires $640 billion of infrastructure investments to support the Marcellus and Utica new gas developments. In addition, forced and cost-driven retirement of power plans requires more than $100 billion just to maintain the existing megawatts in the market.
DisCussioNAfter the panel presentation, the audience raised several key areas of discussion:
� Government policies. Procurement and contracting are often create big hurdles for innovation. Contracting is slow and onerous, and the cycle time for government proj-ect approval is lengthy. Faster government contracting and approval processes might increase private investment in research.
“WE havE fOllOWED
ThE markET . . .
anD TriED TO bE, as
muCh as WE Can,
flExiblE TO DEPlOy
DOllars.”– lucas missong
• Conventional power generation such as natural gas, coal, and waste coal
• Renewable power generation such as landfill gas, hydro, biomass, wind, and solar
• Independent, point-to-point transmission• Regulated electric transmission
• Natural gas and liquids transportation• Natural gas gatherings systems, processing,
and treatment• Liquefied natural gas (LNG) and solids/gas-to-
liquids projects
Power Generation
Transmission
Midstream Energy Infrastructure
Primary Investment SectorsAres EIF creates value through its operational expertise and development and construction capabilities within the power generation and midstream sectors of the energy value chain
“TEn yEars aGO, Our
POrTfOliO lOOkED
vEry DiffErEnT; iT
Was mOsTly COal
PlanTs.”– lucas missong
“WE sEE an
abunDanCE
Of invEsTmEnT
OPPOrTuniTiEs
basED On WhErE
ThE markET is,
basED On ThE
aGinG GEnEraTiOn
flEET.”– lucas missong
© 2015 Brandeis International Business School. Created by BullsEye Resources, www.bullseyeresources.com. 23
New England Economic Partnership: Building the Backbone of Energy Efficiency
� Coal’s global presence. Coal still remains a major source of energy in China, Europe, and India. Although China is the fastest growing global market for energy technolo-gies—they are building nuclear, solar, and wind generation plants faster than anyone else in the world—the country has access to a significant amount of coal. If these coun-tries choose to burn coal without carbon sequestration, it will significantly impact the climate. Professor Bunn was skeptical, believing it will be hard to avoid huge climate change and that the planet could be in trouble.
� Financing energy innovation. The shale gas revolution was funded, in part, by a charge on gas pipelines; not through appropriations by Congress. A larger scale energy innovation fund could finance additional U.S. energy innovations. This level of funding is required to compete with countries like China, which are willing to fund and make big bets on innovative energy technologies.
� Nuclear technology. Professor Bunn sees nuclear energy as a necessary solution to avoid a climate catastrophe. China continues to consider nuclear energy generation and is looking at new technologies, such as a pebble bed/molten salt reactor that many feel in not susceptible to a meltdown. These types of new nuclear technologies could come the in the latter half of the century, however until 2050, nuclear power generation is likely to come from current designs and existing reactors.
� Energy efficiency. Innovations that yield greater energy efficiency will play a big role in the energy markets. Businesses will see the benefits of behavioral changes, such as turning off lights or air conditioners. Software-based decision support systems will educate individuals on the cost of energy, which also changes behavior. Energy compa-nies can work with businesses—as Eversource did with General Dynamics—to provide innovative energy efficiency solutions that result in significant savings.
© 2015 Brandeis International Business School. Created by BullsEye Resources, www.bullseyeresources.com. 24
“OnE Of ThE mOsT
imPaCTful ThinGs
ThaT WE Can DO
is aDDrEss ThE
hiGh COsT Of
ElECTriCiTy anD
GET Gas CaPaCiTy
inTO ThE rEGiOn.
This Will hElP
us sTabilizE anD
PrOviDE EnOuGh
Gas TO ThE arEa,
EsPECially DurinG
PEak DEmanD.”– matthew beaton
OverviewNew England’s energy sector faces significant challenges. New England’s location is a challenge, as the region is at the end of the pipeline. The region has high energy prices, price volatility, an aging infrastructure, a lack of capacity, and a slow rate of bringing new capacity online.
But historically, Massachusetts and New England have been innovators in developing pol-icies and collaborations to address the challenges faced. Policies have improved demand management, energy efficiency, and innovation. New policies are needed to address challenges of today’s high and volatile prices, constrained capacity, and climate change. Strategies and plans need to be developed and implemented effectively to address the real challenges of the region.
CoNTExTThe panelists summarized major challenges facing New England’s energy industry and offered some policy recommendations.
KEy TAKEAwAysNew England faces multiple energy-related challenges. Moderator Henry Lee summarized many of the challenges the energy sector faces in the region. Major challenges include the region’s location, carbon dependency which can have a catastrophic impact on climate change, the cost of decreasing this dependency, and the need to change institutions and modernize the infrastructure.
Massachusetts’ state government is focusing on reducing and stabilizing energy costs, clean energy, and grid modernization.Massachusetts is a leader in energy efficiency and the clean energy technology sector. Still, Secretary of Energy and Environmental Affairs Matthew Beaton said the state faces a number of challenges, including reducing and stabilizing the rising cost of energy for consumers, continuing the commitment to clean energy, and developing a safe, reliable, and resilient energy infrastructure.
Natural gas pipelines play a key role in keeping down the rising cost of energy for con-sumers. The current gas infrastructure doesn’t meet regional demand during winter peak consumption times, which impacts natural gas and electric prices. Recognizing the eco-nomic benefits from expansion of natural gas is a key energy initiative for Massachusetts under Governor Charlie Baker’s administration.
sTATE AND rEGioNAl ENErGy poliCyNew England Energy Policy in the 21st CenturyModerator: henry lee, Jasmin M. Jaidah Family Director of the Environment and Natural Resources Program, Harvard’s John F. Kennedy School of GovernmentPanelists: matthew A. beaton, Secretary, Executive Office of Energy and Environmental Affairs; mark Kalpin, New England Council Energy and Environment, Partner, Wilmer Hale; Jonathan raab, Convener and Moderator, New England Restructuring Roundtable; and Eric wilkinson, Senior External Affairs Representative, ISO New England
© 2015 Brandeis International Business School. Created by BullsEye Resources, www.bullseyeresources.com. 25
New England Economic Partnership: Building the Backbone of Energy Efficiency
The state also remains committed to a clean energy future that continues its excellence in energy efficiency efforts and encourages the development of the renewable market. Massachusetts wants a diversified renewable energy portfolio that allows competitive pric-es while meeting the goals of the Global Warming Solutions Act. Incentives have helped expand the solar market in Massachusetts; Secretary Beaton would like these incentives adjusted so that solar power becomes less expensive. He would also like the state to consider adding Canadian hydroelectric power to Massachusetts’ renewable portfolio, although this means overcoming current transmission challenges.
In addition, grid modernization, that supports a more resilient electric grid, is a top priority.
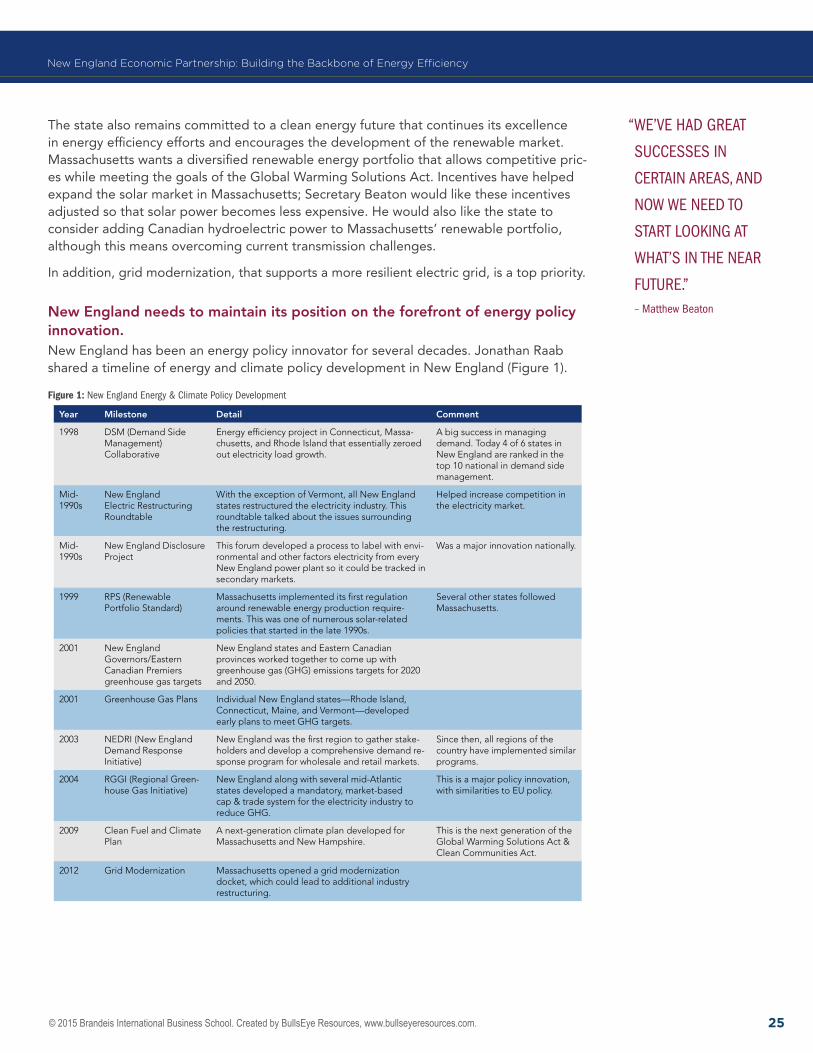
New England needs to maintain its position on the forefront of energy policy innovation.New England has been an energy policy innovator for several decades. Jonathan Raab shared a timeline of energy and climate policy development in New England (Figure 1).
Figure 1: new England Energy & Climate Policy Development
“WE’vE haD GrEaT
suCCEssEs in
CErTain arEas, anD
nOW WE nEED TO
sTarT lOOkinG aT
WhaT’s in ThE nEar
fuTurE.”– matthew beaton
Year Milestone Detail Comment
1998 DSM (Demand Side Management) Collaborative
Energy efficiency project in Connecticut, Massa-chusetts, and Rhode Island that essentially zeroed out electricity load growth.
A big success in managing demand. Today 4 of 6 states in New England are ranked in the top 10 national in demand side management.
Mid-1990s
New England Electric Restructuring Roundtable
With the exception of Vermont, all New England states restructured the electricity industry. This roundtable talked about the issues surrounding the restructuring.
Helped increase competition in the electricity market.
Mid-1990s
New England Disclosure Project
This forum developed a process to label with envi-ronmental and other factors electricity from every New England power plant so it could be tracked in secondary markets.
Was a major innovation nationally.
1999 RPS (Renewable Portfolio Standard)
Massachusetts implemented its first regulation around renewable energy production require-ments. This was one of numerous solar-related policies that started in the late 1990s.
Several other states followed Massachusetts.
2001 New England Governors/Eastern Canadian Premiers greenhouse gas targets
New England states and Eastern Canadian provinces worked together to come up with greenhouse gas (GHG) emissions targets for 2020 and 2050.
2001 Greenhouse Gas Plans Individual New England states—Rhode Island, Connecticut, Maine, and Vermont—developed early plans to meet GHG targets.
2003 NEDRI (New England Demand Response Initiative)
New England was the first region to gather stake-holders and develop a comprehensive demand re-sponse program for wholesale and retail markets.
Since then, all regions of the country have implemented similar programs.
2004 RGGI (Regional Green-house Gas Initiative)
New England along with several mid-Atlantic states developed a mandatory, market-based cap & trade system for the electricity industry to reduce GHG.
This is a major policy innovation, with similarities to EU policy.
2009 Clean Fuel and Climate Plan
A next-generation climate plan developed for Massachusetts and New Hampshire.
This is the next generation of the Global Warming Solutions Act & Clean Communities Act.
2012 Grid Modernization Massachusetts opened a grid modernization docket, which could lead to additional industry restructuring.
© 2015 Brandeis International Business School. Created by BullsEye Resources, www.bullseyeresources.com. 26
New England Economic Partnership: Building the Backbone of Energy Efficiency
Despite innovation over the past several decades, there remain many energy policy chal-lenges facing New England. Although GHG emissions have been a target policy area since 2001, New England and the rest of the country need to figure out how to reduce green-house gas emissions not just by the 20% to 25% reduction goal set for 2020, but by the 2050 target of 75% to 80%. States have been focused on 2020 goals but haven’t begun to consider the 2050 goals.
Raab agreed with Secretary Beaton that the region needs figure out how the gas transmis-sion infrastructure will meet peak winter demands and how we will pay for this develop-ment. The mix of liquefied natural gas (LNG) and pipeline gas also needs to be considered when looking at meeting demand needs.
Raab also believes that smart rate design, including bi-directional time varying rates, can be used as an incentive for retail customers to use distributed energy resources. This will provide the right price signals to customers and encourage use of solar power, electric vehicles, and storage.
Price volatility and aging infrastructure are among the key energy challenges facing the region.The New England Council’s Energy and Environment Committee has been a consistent advocate for a clean, reliable, secure, and economic supply of energy to the region. The council—an alliance of business, academic, and health institutions in the six New England states—promotes economic growth and a high quality of life for the region, representing New England’s interest in Washington D.C.
High prices are a problem in New England, but Mark Kalpin also sees price volatility for natural gas and electricity as a main challenge to the region. Fluctuating natural gas and electricity prices make it difficult to come up with an economic plan as there is no way to accurately predict energy costs.
The energy infrastructure is old and inadequate. Refurbishing it is complicated by the dif-ficulty of siting new projects around New England, whether they are wind, solar, LNG, or other energy sources. Kalpin recommends a more streamlined siting process.
The government can be both a help and a hindrance when it comes to progress. The government has been a key driving force for clean energy technologies, energy efficiency, and addressing climate change targets. But, there have been occasions where government involvement has led to unintended consequences. Government involvement should be considered carefully to ensure it sends the right signals to the competitive marketplace.
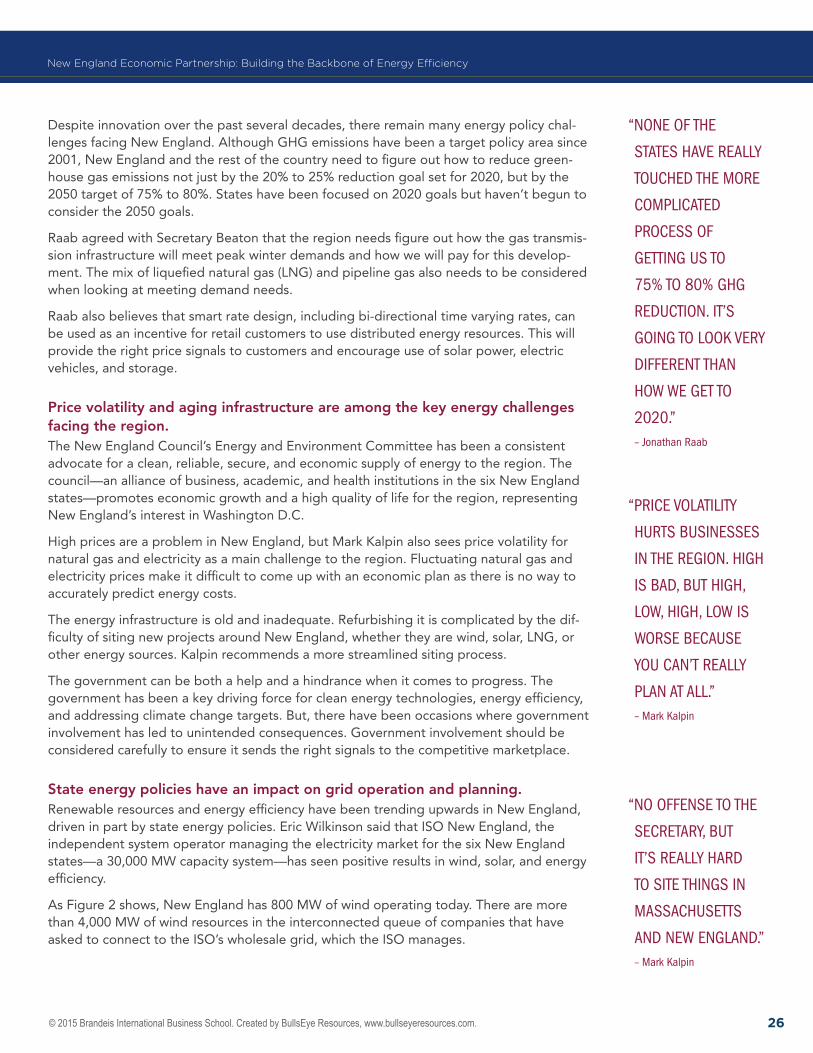
State energy policies have an impact on grid operation and planning.Renewable resources and energy efficiency have been trending upwards in New England, driven in part by state energy policies. Eric Wilkinson said that ISO New England, the independent system operator managing the electricity market for the six New England states—a 30,000 MW capacity system—has seen positive results in wind, solar, and energy efficiency.
As Figure 2 shows, New England has 800 MW of wind operating today. There are more than 4,000 MW of wind resources in the interconnected queue of companies that have asked to connect to the ISO’s wholesale grid, which the ISO manages.
“nOnE Of ThE
sTaTEs havE rEally
TOuChED ThE mOrE
COmPliCaTED
PrOCEss Of
GETTinG us TO
75% TO 80% GhG
rEDuCTiOn. iT’s
GOinG TO lOOk vEry
DiffErEnT Than
hOW WE GET TO
2020.”– Jonathan raab
“PriCE vOlaTiliTy
hurTs businEssEs
in ThE rEGiOn. hiGh
is baD, buT hiGh,
lOW, hiGh, lOW is
WOrsE bECausE
yOu Can’T rEally
Plan aT all.”– mark kalpin
“nO OffEnsE TO ThE
sECrETary, buT
iT’s rEally harD
TO siTE ThinGs in
massaChusETTs
anD nEW EnGlanD.”– mark kalpin
© 2015 Brandeis International Business School. Created by BullsEye Resources, www.bullseyeresources.com. 27
New England Economic Partnership: Building the Backbone of Energy Efficiency
Figure 2renewable and Energy Efficiency resources are Trending up
Solar is also trending upwards. At the end of 2014 there were 900 MW of solar PV (photo-voltaics) on the New England system. The first quarter 2015 survey has shown growth to 1,000 MW of solar PV. Wilkinson expects even more solar to come online—forecasted to reach 2,400 MW by 2024— which in part is driven by Massachusetts’ goal of 1,600 MW of solar power by 2020.
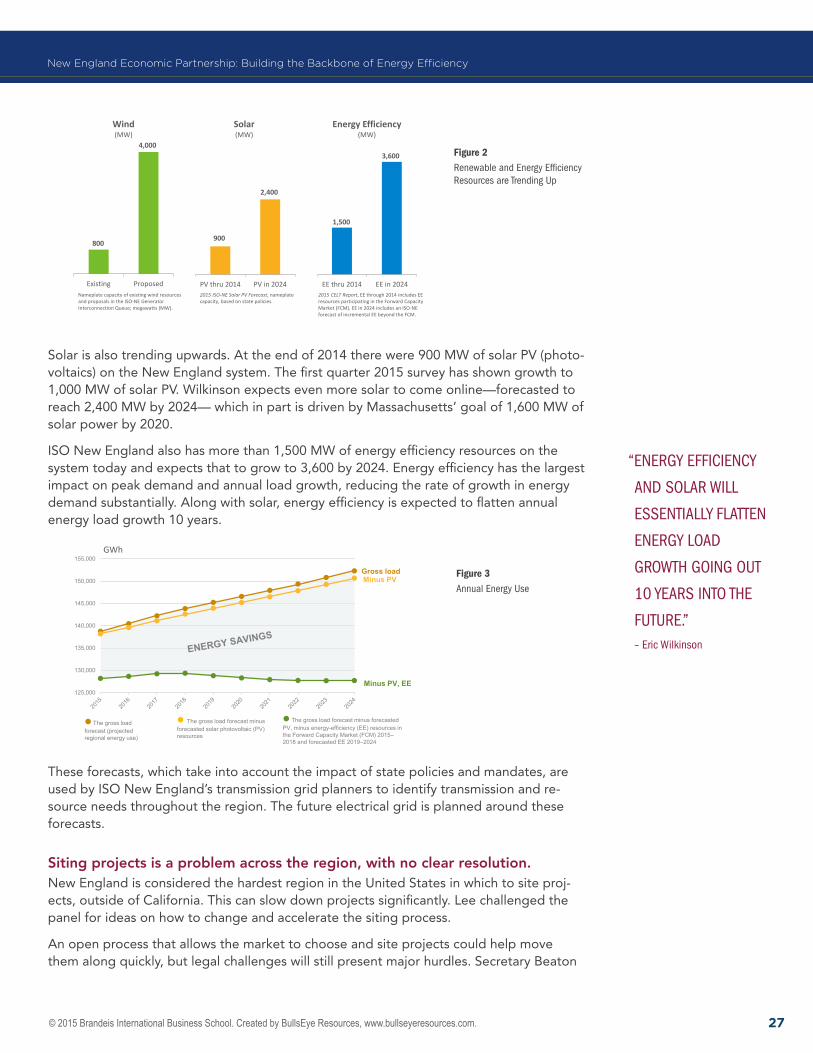
ISO New England also has more than 1,500 MW of energy efficiency resources on the system today and expects that to grow to 3,600 by 2024. Energy efficiency has the largest impact on peak demand and annual load growth, reducing the rate of growth in energy demand substantially. Along with solar, energy efficiency is expected to flatten annual energy load growth 10 years.
Figure 3annual Energy use
These forecasts, which take into account the impact of state policies and mandates, are used by ISO New England’s transmission grid planners to identify transmission and re-source needs throughout the region. The future electrical grid is planned around these forecasts.
Siting projects is a problem across the region, with no clear resolution.New England is considered the hardest region in the United States in which to site proj-ects, outside of California. This can slow down projects significantly. Lee challenged the panel for ideas on how to change and accelerate the siting process.
An open process that allows the market to choose and site projects could help move them along quickly, but legal challenges will still present major hurdles. Secretary Beaton
Renewable and EE Resources are Trending Up
800
4,000
Existing Proposed
Wind (MW)
Nameplate capacity of existing wind resources and proposals in the ISO-NE Generator Interconnection Queue; megawatts (MW).
900
2,400
PV thru 2014 PV in 2024
Solar (MW)
2015 ISO-NE Solar PV Forecast, nameplate capacity, based on state policies.
1,500
3,600
EE thru 2014 EE in 2024
Energy Efficiency (MW)
2015 CELT Report, EE through 2014 includes EE resources participating in the Forward Capacity Market (FCM). EE in 2024 includes an ISO-NE forecast of incremental EE beyond the FCM.
Annual Energy UseWith and Without Energy Efficiency and Solar Photovoltaics (PV)
125,000
130,000
135,000
140,000
145,000
150,000
155,000
l The gross load forecast minus forecasted PV, minus energy-efficiency (EE) resources in the Forward Capacity Market (FCM) 2015–2018 and forecasted EE 2019–2024
Gross load
Minus PV, EE
Minus PV
l The gross load forecast (projected regional energy use)
l The gross load forecast minus forecasted solar photovoltaic (PV) resources
GWh
“EnErGy EffiCiEnCy
anD sOlar Will
EssEnTially flaTTEn
EnErGy lOaD
GrOWTh GOinG OuT
10 yEars inTO ThE
fuTurE.”– Eric Wilkinson
© 2015 Brandeis International Business School. Created by BullsEye Resources, www.bullseyeresources.com. 28
New England Economic Partnership: Building the Backbone of Energy Efficiency
suggested that an open and transparent process that allows maximum public input could reduce the time spent in courts during the siting process.
Kalpin agreed that litigation often gets in the way, but he believes that a process similar to the Federal Energy Regulatory Commission (FERC) could speed up siting. FERC provides a list of all the components that developers must have in place before filing, ensuring they have thought through the details of the project before they submit a plan.
Raab’s team recently helped New Hampshire review and change the state’s siting process following several controversial projects. He suggested that a clear regulatory process, involving stakeholders, and a well-balanced and clear procedure can improve the siting processes. A suggested strategy for Massachusetts and other states is to put all permit-ting into one agency.
Reducing carbon emissions by 80% by 2050 requires more than just an energy industry focus.The states in the region agreed on a target of 80% reduction in carbon emissions by 2050. That goal sounds great, but how it will be achieved is far from clear. California, which has perhaps the most aggressive low carbon program in the country, has only reduced carbon emissions by 1.4%.
In order for states to reduce emissions by 80% by 2050, the focus needs to fall beyond the energy industry, and encompass the transportation and home heating industry. Raab cited analyses which determined that a 75% to 80% carbon emissions reduction could be ac-complished by electrifying both the vehicle fleet and home heating, along with renewables and fast-start gas-fired generation. This approach could be costly, however, although Raab was hopeful prices would come down by 2050.
ISO New England is already seeing significant decreases in electric generation sector emissions. Between 2001 and 2013, Wilkinson said nitrogen emissions decreased 74%, sul-fur dioxide emissions decreased 93%, and carbon dioxide emissions dropped 28%, mainly due to a fuel switch from coal to oil and gas.
Secretary Beaton advocated for a diversified approach, called for deploying existing tech-nologies that will help reduce emissions, developing new technologies, and focusing on the transportation sector.
DisCussioNOther topics discussed included:
� Renewables will remain. Secretary Beaton does not believe that natural gas will push out renewables. The industry should focus on energy efficiency and reducing demand. The Secretary wants government to continue to provide incentives for renewable ener-gy use, such as wind and solar, and readjust incentives as markets become established and new technologies become available at lower cost.
� Government’s role. One attendee argued that the government needs to play a role in establishing goals, standards, and rules to ensure greater predictability in the market. The market should pick winners and losers.
� Hydro. There is a large amount of hydroelectric power in Canada that is available for export to the United States. Raab said the region needs to look at this source closely, as it can help New England states meet climate goals and stabilize prices, even though it doesn’t meet the renewable portfolio standards.

contact us
brANDEis iNTErNATioNAlbusiNEss sChool
415 South StreetWaltham, MA 02454-9110781-736-8351 Centers and Initiatives/External Relations
brandeis.edu/global
Perlmutter Institute forGlobal Business Leadership