building relationships early: banks in venture capital
TRANSCRIPT
1
Building Relationships Early: Banks in Venture Capital
Thomas Hellmann
Sauder School of Business, University of British Columbia
Laura Lindsey
W.P. Carey School of Business, Arizona State University
Manju Puri†
Fuqua School of Business, Duke University and NBER
⎯⎯⎯⎯⎯⎯⎯⎯⎯⎯⎯⎯⎯⎯⎯⎯⎯⎯⎯⎯⎯⎯⎯⎯⎯⎯⎯⎯⎯⎯⎯⎯ † Corresponding author. Fuqua School of Business, Duke University, One Towerview Drive, Durham, NC 27708-0120. Email: [email protected]. Tel: (919) 660-7657. Fax: (919) 660-8038. We thank Bob McDonald (the editor), Serdar Dinc, Colin Mayer, Bill Megginson, and seminar participants in AFA meetings, San Diego, Chicago (Federal Reserve Conference), Duke, Frankfurt, Georgia Tech, Half Moon Bay (Stanford GSB and NYSE Conference on Entrepreneurial Finance and Initial Public Offerings), Kansas City (Wagnon Conference), LBS, Michigan, New York (Federal Reserve Bank), Notre Dame, Oslo, Oxford, Philadelphia (Federal Reserve Bank), Pittsburgh, Porto, Sydney, Toronto, University of Arizona, University of British Columbia, University of North Carolina, University of Texas Austin, University of Wollongong, and Yale (First EVI Conference). We also thank Steven Drucker, Jun Ishii and Shu Wu for excellent research assistance and the Center for Entrepreneurial Studies at the Stanford Graduate School of Business and the National Science Foundation for financial support. Puri thanks the Sloan Foundation for partial funding support. All errors are ours.

2
Building Relationships Early: Banks in Venture Capital
Abstract
This paper examines bank behavior in venture capital. It considers the relationship between a
bank’s venture capital investments and its subsequent lending, which can be thought of as
intertemporal cross-selling. Theory suggests that unlike independent venture capital firms, banks
may be strategic investors who seek complementarities between venture capital and lending
activities. We find evidence that banks use venture capital investments to build lending
relationships. Having a prior relationship with a company in the venture capital market increases
a bank’s chance of subsequently making a loan to that company. Companies can benefit from
these relationships through more favorable loan pricing.

3
The scope of banking activities has always been an important issue to financial
economists and policy makers alike. The recent banking literature examines the benefits and
costs of expanding the scope of bank activities into different areas such as underwriting activities
[see e.g., Carow and Kane (2002), Kroszner and Rajan (1994), and Puri (1996)]. A growing
literature suggests that cross selling across banks’ activities might be important [see e.g.,
Bharath, et al. (2006) and Drucker and Puri (2005)]. One area that has received little attention is
the bank’s foray into venture capital. As a consequence of legislative changes in 1999 (and
before that, from exploiting regulatory loopholes), banks regularly make private equity
investments in start-ups. The question arises as to how banks as venture capitalists differ from
independent venture capitalists and to what extent banks’ venture capital investments are related
to their core lending activities.
In this paper we examine the relationship between a bank’s venture capital investments
and its subsequent lending to these companies. While much of the universal banking literature
focuses on cross–selling of different products at a given point in time, this paper investigates a
dynamic type of cross–selling relating to the intertemporal expansion of banks’ activities. The
main hypothesis is that building a relationship at the early venture capital stage increases a
bank’s likelihood of providing a loan to the company at a later stage. Our central empirical
finding is that having made a venture capital investment significantly increases a bank’s chances
of financing that company in the loan market. We also find that companies may benefit from this
relationship through lower loan pricing. Additionally, we contrast banks’ venture capital
investments with those of independent venture capitalists and find that banks invest in later stage
deals and in companies with potentially greater debt capacity.
Theory suggests that banks may differ from independent venture capitalists because they
may act as strategic investors and their venture investments may interact with their other banking
activities. Strategic investors target companies where there are complementarities between the
venture capital investments and their other core business [see Hellmann (2002)]. They
differentiate themselves by virtue of their complementary assets and they reap benefits from
exploiting synergies between the venture investments and their core business. For banks, the
main complementary asset is their lending expertise which may be of future interest to the
portfolio company. Industry observers seem to believe that banks try to take advantage of such
complementarities. Wilson (1985), for example, argues that “by getting in on the ground floor of

4
new companies and industries, they expected to build future customers for the lending side of the
bank.” To examine the hypothesis that banks are strategic venture capital investors, we provide
empirical evidence for such complementarities. Specifically, we show that forging a relationship
with a company at the venture capital stage increases the probability that a bank subsequently
gets to make a loan to that company.
For the empirical analysis we use and augment data from Venture Economics about the
investments made by banks and independent venture capitalists over the period 1980-2000. We
also gather additional data from Compustat, Loan Pricing Corporation, and Moody’s Manuals.
We first establish a set of facts that suggests that banks invest differently in the venture capital
market than independent venture capitalists. For example, they invest less in earlier rounds,
participate in larger syndicates, and invest in larger deals. Interestingly, banks are also more
likely to make investments in high-debt industries (both in terms of the absolute level of debt and
the debt-to-asset ratio). And they are more likely to invest in companies that subsequently obtain
loans. This evidence is generally consistent with a notion that banks are investors who pursue
strategic goals in their venture capital investments.
To test the main hypothesis of strategic complementarities, we ask whether making
venture capital investment in a specific company increases a bank’s chance of subsequently
making a loan to that company. For this, we need to go beyond the venture capital market and
test whether relationships from venture capital actually affect loan market outcomes. For this
purpose, in an approach that is relatively new to the finance literature, we construct all possible
potential and realized company-bank pairs and measure whether a specific bank makes a loan to
a specific company. Our empirical model examines whether the likelihood of making a loan
depends on whether the pair has a prior relationship from the venture capital market. We find
that a prior relationship significantly increases a bank’s chance of becoming a company’s lender.
This supports the hypothesis that building relationships in the venture capital market
complements the banks’ lending business. We also submit our results to a large number of
robustness checks, including instrumental variables, fixed effect regressions and alternative
clustering approaches. Indeed, we believe that an additional contribution of this paper is to
introduce the analysis of potential and realized pairs for a two-sided market, which is not yet
common in the finance literature, and to discuss some of econometric issues associated with this
approach.

5
Another interesting question is whether companies also benefit from using relationships
developed in the venture capital market in the lending market. On the one hand there are
potential benefits in that companies can use their relationship to signal their quality and lower
their pricing terms by raising loans from their relationship bank. Alternatively, banks may
engage in rent extraction, so that there are no benefits to companies. We test for this by
comparing yields of relationship and non-relationship loans through the use of matching
regressions based on propensity scores [Heckman, Ichimura and Todd (1997, 1998)]. We find
that relationship loans have lower yields than non-relationship loans. This difference suggests
that relationships have an economic impact, and using these relationships can benefit companies.
The paper builds on the large literature on relationship banking. James (1987), Lummer
and McConnell (1989), Best and Zhang (1993), Billett, Flannery and Garfinkel (1995), among
others, find that new loans, loan renewals, and lender identity carry (positive) private
information to the outside equity market about a borrowing company’s financial condition [see
also the survey in Drucker and Puri (2006)]. Petersen and Rajan (1994) and Berger and Udell
(1995) examine bank relationships with small private companies. Our examination of the
strategic investor hypothesis is related to the literature on corporate venture capital [Block and
MacMillan (1993), Gompers and Lerner (2000), Dushnitsky and Shaver (2006)]. One advantage
of examining banks is that the strategic complementarities are more readily identifiable than in
the corporate context. The importance of prior relationships has also been examined in the
literature on equity offerings [e.g., Gompers and Lerner (1999), Drucker and Puri (2005), Li and
Masulis (2005), Ljungqvist, Marston, and Wilhelm (2005), Yasuda (2005)]. Hamao, Packer, and
Ritter (2000) also examine bank-affiliated venture capital in the context of equity underwriting
in Japan.
Our analysis suggests a cautionary policy note. Banks are the dominant financial
institution in most countries [see Allen and Gale (2000)]. Policy makers in many countries want
to develop their venture capital market, and their natural instinct is often to rely on their
incumbent banks for this task [Becker and Hellmann (2003)]. Our examination of the US
evidence suggests that banks may be driven by strategic objectives, making them followers,
rather than leaders in the venture capital market. Naturally, the lessons from the US may not
necessarily translate directly to other countries, but the evidence highlights banks’ strategic
incentives when investing in venture capital [see also Mayer, Schoors and Yafeh (2005)].
6
The remainder of the paper is organized as follows. Section 1 describes the data and
discusses the regulatory environment. Section 2 provides some preliminary evidence on the role
of bank in venture capital. Section 3 empirically examines the main hypothesis about the role of
prior venture relationships in the loan market. Section 4 examines the impact of relationships on
loan pricing. Section 5 concludes with some further discussion.
1. The data
1.1 Data Sources
The data are compiled from several commercially available data sources, including
Venture Economics, Loan Pricing Corporation, Compustat, FDIC, and augmented by hand-
collected data from Moody’s Manuals. Venture Economics (VE henceforth), a division of
Thomson Financial, provides information on venture firms (i.e., the investors),1 the companies in
which they invest, and the details of individual financing rounds.2 We collect all data on U.S.
investments for the period 1980-2000.3
The VE database contains information on individual financing rounds, such as the
company receiving the financing, the different investors providing the financing, the date and
round number of individual financing rounds, and the total dollar amount raised by the company.
VE collects data from voluntary disclosures of venture capital firms. Since we are interested in
venture capital financing of start-ups or private companies, we exclude all leveraged buyout
deals. For each investor the VE database tracks its organizational form and affiliations. With this
data we can identify whether a venture capital firm is bank-owned, independent or other. In
order to have a clean comparison of organizational types, we exclude the deals by all investors
that are neither banks nor independent venture capitalists.
While VE identifies bank venture capitalists, its classification is not reliable. Apart from
omissions and coding errors, their bank category includes entities other than commercial banks,
such as finance companies and foreign banks without a U.S. banking charter affiliate. We
therefore verified every venture capital firm manually, using Moody’s Bank and Finance
Manuals. We classified an investor as a bank venture capitalist if it was a commercial bank, a
bank holding company, or a subsidiary of a bank. Moreover, the bank had to be chartered in the
7
U.S. For every venture capital firm we considered the most recent issue of Moody’s Bank and
Finance Manual. If a firm was not listed, we also consulted Moody’s index, which lists all past
entries for (at least) the last ten years. If necessary, we also went back to the appropriate
Moody’s issue ten years prior, to further look for past entries. Classifying venture capitalists
with this approach, and also taking into account bank mergers (see discussion below), we
identified 50 bank venture capitalists for the entire dataset. For independent venture capitalists,
we use all funds that are listed as “Independent Private Partnership” and where the venture
capitalist is listed as “Private Firm Investing Own Capital.”
We obtain lending information for bank-financed portfolio companies from the Loan
Pricing Corporation’s DealScan Database (LPC henceforth).4 The data extend from January
1987 to June 2001, though full coverage in the LPC data did not begin until 1989. To identify
prior relationships between companies and bank venture capitalists, we also need to account for
acquisitions and mergers among banks. We track these changes manually using the Moody’s
Bank and Finance Manuals. We classify banks according to their end of sample merger status.
For a company that received venture financing from a bank that was later acquired, we further
check that the loan by the acquiring bank was not made prior to the bank merger.
Because there is no common identifying code between the LPC database and the VE
database, we match on company name. We wrote a Perl script that strips organizational form
suffixes, spaces, capital letters, and punctuation from the name field in each database in order to
match on the “core” of the company name.5 We also perform this matching on former company
names listed in VE.6 Furthermore, the results of the program were carefully checked by hand.
VE maintains an industry classification (called VE codes) that is more suited to the
venture industry than the standard SIC codes. Most venture deals fall into a small number of four
digit SIC codes, and at the one digit level, SIC codes have inappropriately broad aggregations,
such as grouping computer equipment and electronics in the same category as the manufacturing
of textiles and furniture. The VE codes group industries into somewhat more meaningful and
detailed categories. At the one digit level, for example, the VE codes are Communications,
Computer Related, Other Electronics (including semiconductors), Biotechnology,
Medical/Health Related, Energy Related, Consumer Related, Industrial Products, and Other
Services and Manufacturing. Whenever possible, we use the VE codes.

8
1.2. Background on regulation
Venture investments involve private equity participation. The Gramm-Leach-Bliley Act,
passed in November 1999, allows banks to engage in various activities though the financial
holding company. However, during our sample period, banks were yet to take advantage of this
provision. Prior to Gramm-Leach-Bliley, the Glass-Steagall Act of 1933 prohibited banks from
buying stock in any corporation and from buying “predominately speculative” securities.
Nonetheless, there are two loopholes through which banks could make private equity
investments which are relevant for our sample period.
First, there is a government program administered by the Small Business Administration
(SBA), which allows for the creation of “Small Business Investment Corporations” (SBICs).
These SBICs can make equity investments and they may receive financial leverage from the
SBA. The Small Business Act of 1958 authorized bank and bank holding companies to own and
operate SBICs. A bank may place up to 20% of its capital in an SBIC subsidiary (10% at the
holding company level). These investments are governed by the rules of the SBA and subject to
regulatory review by that organization. An SBIC is also reviewed by the bank’s regulators as a
wholly owned subsidiary. SBA provisions include a limitation on the amount of the SBIC’s
funds that can be placed in a single company (less than 20%). Further, SBIC investments are
subject to certain size restrictions. At the end of the sample period, the SBA considered a
business eligible for the SBIC program if its net worth was $18 million or less and average
annual net after-tax income for preceding 2 years was not more than 6 million. [See also Brewer
and Genay (1994), Kinn and Zaff (1994) or SBIC (2003).]
Second, bank holding companies can make equity investments subject to some
limitations. Under Section 4(c)(6) of the Bank Holding Company Act of 1956, bank holding
companies may invest in the equity of companies as long as the position does not exceed more
than 5% of the outstanding voting equity of the portfolio company. Some banks also invest in
limited partnerships directly at the bank holding company level. Unlike SBICs, which are
regulated by both the SBA and relevant bank regulators, bank holding companies are regulated
only by the bank regulators. [See also Fein (2002) or FDIC (2003).]

9
2. Comparing bank and independent venture capital investments
In this section we provide some background analysis on the activities of banks in the
venture capital market. We contrast the venture capital investment of banks with independent
venture capitalists. This analysis provides a foundation for the main hypothesis, which is
examined in the next section, section 3.
In this section, our unit of analysis is a “venture deal,” defined as the unique match of a
venture capital investor with a company. This can also be referred to as a realized company-
investor pair. It implies that if in a particular round there exists more than one investor, we count
each investor as a separate observation. If, for example, one bank and two independent venture
capitalists co-invest in the same round, this approach allows us to recognize the presence of each
of these three distinct investors. Our unit of analysis, however, does not count repeated
interactions between a particular investor and company as a separate observation. If there are
two investors, and one of them prefers to commit the money in several stages, whereas the other
prefers to commit all the money at once, we count each of them as one deal.7 Our data contain
10578 companies that generate 24659 deals.
Our main variables are as follows.
• BANK is a dummy variable that takes the value 1 if the investor in the deal is a bank, 0
otherwise. Being a bank means that the deals were done by the bank itself or by a venture
fund that is affiliated to the bank or bank holding company.
• EARLY-STAGE is a dummy variable that takes the value of 1 if the company received
seed or first stage financing in the company’s first round, 0 otherwise.
• ROUND-EARLY-STAGE is a dummy variable that takes the value of 1 if the company
received seed or first stage financing at the time of the matched investor’s first
investment, 0 otherwise.
• ROUND 1,2,3,4 is a set of dummy variables that take the value 1 if the first time that the
matched investor participated was the company’s first, second, third or fourth round, 0
otherwise.
• VCCLUSTER is a dummy variable that takes the value 1 if the company is in California
or Massachusetts, 0 otherwise.

10
• AMOUNT is the natural logarithm of the total amount invested in the company by all
venture capital investors across all rounds
• ROUND-AMOUNT is the natural logarithm of the total amount invested by all investors
in the first round that the matched investor participated.
• NUMBER-OF-VCS is the total number of venture capital firms that invested in the
company.
• ROUND-NUMBER-OF-VCS is the total number of venture capital firms that invested in
the first round that the matched investor participated.
• INDUSTRY controls are the VE industry categories.
• DEBT is the natural logarithm of the average industry debt level for each portfolio
company. In Compustat this corresponds to Data Item 9 + Data Item 34. Total debt is
calculated for all companies in Compustat using the first 3 years of data. The industry
average is the mean for each two-digit SIC code.
• DEBT/ASSET ratio is the average industry debt to asset ratio for each portfolio
company. In Compustat this corresponds to (Data Item 9 + Data Item 34) / Data Item 6.
The debt to asset ratio is calculated for all companies in Compustat using the first 3 years
of data. The industry average is the mean for each two-digit SIC code.
• IPO is a dummy variable that takes the value 1 if the company went public, 0 otherwise
• LOAN is a dummy variable that takes the value 1 if a company obtained a loan in LPC, 0
otherwise. This variable is obtained from LPC.
Note that the difference between EARLY-STAGE and ROUND-EARLY-STAGE is that the
former is a company-specific variable, whereas the second is specific to an investor-company
pair at the time of the investor’s first investment round with the company. For all of the above
variables, we use the ROUND prefix to distinguish those that pertain to an investor-company
pair.
Table 1 provides descriptive statistics for venture capital deals by banks versus
independent venture capital firms. It includes a test for the statistical significance of the
differences in means or, in the case of indicator variables, differences in proportions. It shows
that banks are different in a number of dimensions. Consider first differences in company
11
characteristics at the time of making a deal. We note that banks invest less in first rounds and
other early rounds.8 Banks are relatively more active outside the cluster states of California and
Massachusetts.9 This is intuitive since banks have large branching networks that may allow them
to have relatively better access to deals outside the main venture capital clusters.10 Banks invest
in larger deals. Relative to independent venture firms, banks probably have easier access to a
large amount of funds. Banks are also more likely to invest in companies that have more
investors.11 In unreported results, we confirm that these results hold in a multiple regression
setting.
Given that banks’ core business is lending, we examine whether banks focus on high debt
industries. We examine the debt level of young public companies, defined as the first three years
of data in Compustat. Since Compustat contains SIC codes, we determined for each VE code the
two-digit SIC code that is most frequently associated using observations where both VE and SIC
codes are reported. We then used this mapping to assign SIC codes (and thus industry debt
measures) to those companies that have only their VE codes reported. We consider both an
absolute measure (the natural logarithm of the amount of debt) and a relative measure (the debt-
to-asset ratio). The absolute measure is relevant in this context, since banks presumably care
about the total demand for loans. Table 1 shows that banks invest in industries with more debt,
both in absolute and relative terms. This is consistent with the notion that banks strategically
invest in those segments of the venture market that is populated by clients with a high debt
capacity.
In addition to examining company differences at the time of the deal, we can also
examine differences in subsequent outcomes. From Table 1 we note that the percentage of deals
that go public is very similar for bank versus independent venture capital firms. To the extent
that IPO rates are a proxy for success, it appears that banks are neither better nor worse at
picking successful companies. However, Table 1 also shows that the proportion of companies
that subsequently obtain a large loan (as recorded in LPC) is significantly higher for bank
venture capitalists, compared to independent venture capitalists. In an earlier working paper
version we show that these results continue to hold in a multiple regression framework. It is
worth briefly mentioning the economic significance of these numbers. 15.7% of bank venture
capital deals obtain a loan, as compared to 12.3% of independent venture capital deals. This
suggests that in relative terms, bank venture capital deals are 27.6% more likely to obtain a loan.
12
Overall, this section shows how banks are somewhat distinct investors from independent
venture capital firms. The patterns of Table 1 suggest the notion that banks may have some
strategic motivations when investing in the venture capital market. Of particular interest is the
finding that banks focus their investment on the type of companies that are likely to have a
higher debt capacity. This motivates the main question of this paper, whether investing in a
company at the venture capital stage has strategic implications. We are now in a position to
address our main hypothesis.
3. The effect of prior venture capital relationships on loan
market activity
3.1. Definition of sample
The analysis of the previous section already suggests that banks invest disproportionately
in venture companies that subsequently obtain some funding in the loan market. The central
question is whether a bank that invests in a company at the venture capital stage increases its
own chance of providing a loan to that company at a later stage. We now provide a formal
analysis of the main hypothesis that relationships forged at the venture capital stage increase the
likelihood of subsequently becoming a lender.
To evaluate the effect of prior relationships, we need to consider both realized matches in
the loan market (where a specific bank does make a loan to a specific company), and unrealized
matches (where a specific bank does not make a loan to a specific company). This implies that
our unit of analysis is the potential pairing of a company and a bank. That is, we need to consider
not only the realized pairs of companies and banks, but also those cases where there is potential
to pair even if the pairing does not actually occur.
For “relationship lending” to occur, clearly there needs to be a “relationship,” and there
needs to be some “lending.” This means that all companies that experience some relationship
lending necessarily satisfy two criteria: they all received some bank venture capital, and they all
received some loan. Our sample contains 279 companies that satisfy these two criteria, 259 with

13
complete information. For each of those companies, we consider all possible matches with the 50
banks that invest in venture capital, generating a total of 12950 possible matches. We will use
this as our base sample.
Table 2 provides descriptive statistics for the potential deals sample. Our main variables
are:
• LENDER is a dummy variable that takes a value of 1 if the bank participated in a loan to
the company, 0 otherwise.
• PRIOR-VC is a dummy variable that takes a value of 1 if the bank made a prior venture
investment in the company, 0 otherwise.
• LOAN-MARKET-SHARE is a bank-specific variable that consists of a ratio. The
numerator counts the number of companies in the sample that received a loan from the
specific bank. The denominator counts the total number of companies in our LPC
sample.12
• LARGE-BANK is a bank-specific dummy variable that takes the value 1 if at the end of
the sample period, the bank had assets in excess of $100 billion dollars, 0 otherwise.
Asset information is taken from SDI Data available from the FDIC.
• VENTURE-YEAR is a set of dummy variables, one for each calendar year, that takes the
value 1 if the company obtained its first venture capital round in that year, 0 otherwise.
• LOAN-YEAR is a set of dummy variables, one for each calendar year, that takes the
value 1 if the company obtained its first LPC loan in that year, 0 otherwise.
In addition, we use some company characteristics, as described in section 2. Note that the
LOAN-MARKET-SHARE and LARGE-BANK variables both capture different aspects of bank
size. The first measures a bank’s presence in this specific loan market, whereas the second
captures information about the overall bank size.
3.2. The main model

14
To test our main hypothesis, we use a Probit regression model. The dependent variable is
LENDER, which measures whether or not a specific company obtains a loan from a specific
bank. The main independent variable of interest is PRIOR-VC, which measures whether or not a
specific company previously obtained a venture capital investment from a specific bank. This
specification allows us to test the hypothesis that when a bank gives venture capital to a firm, it
increases its chances to subsequently also give a loan to the same firm.
The regression controls for bank characteristics, namely the bank’s market share in the
loan market, and the dummy for large banks. The regression also controls for company
characteristics, namely the year the company entered the venture capital and loan market, the
industry and geographic location of the company, whether the company was an early stage
venture company, the total amount raised in the venture capital market, and whether the
company went public or not.
Table 3 reports the results from our Probit regressions.13 The coefficient for PRIOR-VC
is positive and statistically significant at the 1% level. This suggests that having established a
relationship at the venture capital stage increases a bank’s chance of making a loan to a
particular company. In addition to being statistically significant, the effect is economically non-
negligible. The base probability of a relationship loan is 2.7% (evaluated at the mean of the
independent variables), whereas the estimated coefficient on PRIOR-VC translates into a 3.7%
increase in the probability of a loan. Subject to the usual caveat of evaluating marginal effects at
the mean, this suggests that having a relationship more than doubles the probability of making a
loan. Overall, this result confirms our main hypothesis about the importance of building
relationships early.
Table 3 also reports intuitive findings for the main control variables. Banks with higher
loan market shares have higher probabilities of making a loan. Beyond that, being a large bank
does not seem to matter. Early-stage companies are less likely to obtain a loan, whereas
companies that have gone public are more likely to do so. Companies in the main technology
clusters of California and Massachusetts are less likely to obtain loans.
Throughout the analysis we cluster our standard errors by company (Rogers, 1993). This
approach is also known as a pooled Probit regression. In section 3.5 we further discuss this, and
also discuss the last column of Table 3.

15
3.3. Instrumental variables
The result from Table 3 establishes a correlation between having a prior relationship and
making a loan. Next we estimate a simultaneous equations model, where we augment the main
Probit equation with an additional equation to explain what factors influence PRIOR-VC.14
Since both LENDER and PRIOR-VC are binary variables, we use a bivariate Probit model. For
better identification, we require instrumental variables that predict selection in the venture
capital market, but not loan market outcomes.
We propose to use instruments that measure the availability of different financial
intermediaries [see also Berger et al. (2005)]. The main idea is that availability affects the
likelihood that a company is matched with a certain investor, but should not affect how the
specific company and the specific investor interact, once the match is made. We use two
measures of availability: the first is based on an individual banks’ venture capital presence in a
company’s local geographic market; the second is based on the individual banks’ level of
venture capital investing during the period that a company was active in the venture capital
market.
Our first instrument concerns local geographic market availability, namely a bank’s
venture capital market share in the company’s local geographic market, and is computed as
follows. For each company-bank pair, we calculate the market share of venture capital deals
made by the individual bank, in the company’s metropolitan statistical area (MSA). We call this
variable GEOGRAPHIC-MARKET-SHARE. Our second instrument measures the temporal
dimension of a bank’s market share in the venture capital market. We first define for each
company the time window during which it was active in the venture capital market, defined as
the time period between its first and last venture capital round. For each company-bank pair, we
then calculate the bank’s market share over that company’s time window. We call this variable
TEMPORAL-MARKET-SHARE.
The choice of these instrumental variables can be justified as follows. In general, the
validity of instrumental variables depends on two conditions: first, that they explain selection,
and second, that they are unrelated to outcomes. In our context this means, first, that the

16
instrumental variables should be related to the self-selection process in the venture capital
market (as captured in the equation for PRIOR-VC). The likelihood that a company receives an
investment from an investor should naturally depend on the investor’s local availability, i.e., his
activity level in the company’s local market. Our two instruments measure both the geographic
and temporal dimensions of these local markets. Second, the instruments should be conceptually
unrelated to the outcome variable (as captured in the equation for LENDER). The key insight
here is that our instruments pertain to the venture capital market, whereas our outcomes pertain
to the loan market. These are clearly separate markets. Moreover, through the LOAN-MARKET-
SHARE variable, our outcome regression already controls for a bank’s activity level in the loan
market. More formally, our identification assumption is that, after controlling for a bank’s
market share in the loan market, its probability of making a loan to a company is unrelated to its
past activity level in the company’s local venture capital market.
Table 4 reports the results for the bivariate Probit model, again clustering our standard
errors by company. The regression for PRIOR-VC includes all the observable company
characteristics.15 It includes our two instruments, GEOGRAPHIC-MARKET-SHARE and
TEMPORAL-MARKET-SHARE.16 In addition, we included LOAN-MARKET-SHARE and
LARGE-BANK, to account for the possibility that companies might be choosing their bank
venture capitalist with an eye on future lending activity. The first column reports these results.
We note that both the geographic and the temporal market share variables are statistically highly
significant and have considerable explanatory power. 17
The second column of Table 4 reports the main regression for LENDER, now estimated
as part of the bivariate Probit. The main finding is that the effect of PRIOR-VC remains positive
and statistically significant at the 1% level. The coefficient estimate is in fact slightly higher than
in Table 3, but the estimate for rho, which measures the strength of selection effects, is
statistically insignificant. It therefore appears that selection effects do not have a significant
effect on the estimated relationship between lending and prior venture capital relationships.
Overall, these findings suggest that self-selection in the venture capital market does not
seem to affect our main result that prior venture relationships increase the likelihood of making a
loan.

17
3.4. Company fixed effects
So far our analysis takes the standard approach of controlling for a number of company
characteristics. One of the strengths of working with a sample of company-bank pairs is that we
can use a particularly strong set of controls. Specifically, it is possible to also account for
company fixed effects. This provides a richer set of controls, essentially removing unobserved
average company effects. It may also help to control for some of the possible correlation of
errors within companies. To see this, note that because we have a binary dependent variable, we
can use the conditional logit model [Chamberlain (1980)]. This effectively controls for company
fixed effects semi-parametrically, estimating the likelihood relative to each company. An
attractive property of the conditional logit model is that it recognizes the interdependence of
choices, estimating the likelihood of a company’s choice of a specific bank, conditional on the
total number of bank relationships observed for that company.
To implement this model we note that, for a given company, all variables that do not vary
across observations (company-bank pairs) are collinear with the fixed effects, and thus fall out of
the estimation. This means that we can dispense of all company-specific variables used in Table
3. The only dependent variables left are LOAN MARKET SHARE and LARGE BANK, which
are bank-specific, as well as PRIORVC, which is company-bank pair specific. Moreover, only
companies with variation in the dependent variable contribute to the likelihood, which reduces
the number of observations that affect the estimation. The first column of Table 5 reports the
base estimates of the conditional logit model. As before, we find that the effect of PRIOR-VC
remains positive and significant at the 1% level.
Again we may ask how instrumentation might affect our results. One approach would be
to estimate the equation with the dependent variable (PRIOR-VC in our case) as a function of the
instruments and all of the exogenous variables, obtain its fitted value, and use it in the main
outcome regression. Wooldridge (2001) notes that if the outcome regression is linear, then the
fitted value approach generates consistent coefficients and valid standard errors. Even though it
includes the approximation of linearizing the probability function, the linear probability model
thus has the advantage of always producing consistent estimates. Hence we follow this approach.
We therefore re-estimate the outcome regression for LENDER as a linear probability
model, with company fixed effects. To increase our confidence in this model, we first run the
18
outcome regression without instruments. The second column of Table 5 reports the results. It
reassuringly shows that the linear model generates comparable significance levels to the non-
linear conditional logit model. We then re-run the model using a fitted value from a first stage
equation including instruments, and report the results in the third column of Table 5. Again, we
find that instrumentation does not have a major impact on the results. While the estimated
coefficient is slightly lower than before, it remains significant at the 3% level. The overall
message from Table 5 is that the main result about the effect of PRIORVC on LENDER remains
valid even after controlling for company fixed effects.
3.5. Robustness
The evidence from Tables 3, 4 and 5 provides support for our main hypothesis that
having a prior venture capital relationship increases a bank’s likelihood of making a loan to a
company. We ran a large number of additional robustness checks on this result. In this
subsection we discuss the most important ones.
Our main analysis examines relationship lending within the sample of company-bank
pairs that is limited to those companies that can have a relationship loan, in the sense that they all
had a venture capital investment from some bank, and they all received a loan from some bank.
The purpose of defining such a tight control group is to limit the amount of unobserved
heterogeneity. As a robustness check, we examined whether our results are sensitive to this
particular sample choice. We relaxed the restrictions on the set of companies admitted to the
sample, first relaxing the restriction that companies need to obtain bank venture capital, then also
the condition that they need to obtain a loan. We reran our regressions with these alternative
sample definitions, and consistently obtained very similar results.18 Furthermore, we considered
tightening the conditions of our sample. In the main analysis, for every company, we consider all
possible matches with the 50 banks that invest in venture capital. However, only 30 of these
banks ever make a loan in LPC to a company financed by venture capital. For the main analysis,
we deliberately retained the additional 20 banks, since retaining them presumably makes it
harder to find evidence of relationship lending. However, we also reran all of our regressions
excluding these additional 20 banks from the analysis. We find that excluding them does not

19
affect any results. Overall, our results appear to be remarkably robust across different sample
specifications.
One of the challenges of working with a sample of bank-company pair matches is that
there might be correlation in the error term within companies or banks. Before we discuss
possible econometric remedies, let us briefly explore the economic meaning of such correlation.
Correlation among observations for the same company could arise if a company considers the
decisions to borrow from different banks as interdependent decisions. Economically, this appears
an important concern because a typical company obtains relatively few loans, and from a handful
of banks at most. By contrast, correlation among observations for the same bank would arise if
the bank does not make independent lending decisions. Banks are in the business of making
many loans to many companies. As a first-order approximation, the assumption of independent
choices thus seems much more reasonable for banks than for companies.
The most important econometric challenge is thus to control for possible correlation
among observations for the same company. That is why all of our regressions cluster standard
errors by company. This approach relaxes the independence assumption of the traditional Probit
model. It allows observations of the same company to have correlated errors by assuming not
only an idiosyncratic but also a group-specific (companies in our case) error component for each
observation. In addition, note that the model with company fixed effects provides an alternative
way of controlling for correlation within companies. Indeed, one of the properties of the
conditional logit model is to explicitly take into account interdependencies among observations
within the same group. As an additional robustness check, we also examined the possibility that
errors may be correlated among observations for the same bank. Again we use two approaches,
clustering and fixed effects. We reran all of our results clustering by banks instead of companies,
but found that this did not affect any of our results. The last column of Table 3 reports the results
for the base model. In addition, we reran all of our specifications adding bank fixed effects (and
clustering by companies). Again we found that all of our results remained intact. Finally, a recent
paper by Thompson (2006) derives a method for two-dimensional clustering. We use this
approach and find again that this does not affect the significance of our results. This suggests
that concerns about correlation within bank observations are unlikely to affect the main results.
Our measure of geographical and temporal market shares uses the number of venture
deals made by a specific bank in a specific market. Whenever a company receives a venture

20
investment from a bank, its own deal is included in this market share measure. One could argue
that a company’s own deal should be excluded to use market shares as instrumental variables.
The idea is that if the market share variable is meant to capture the availability of a specific
investor, then we may want to measure availability outside of the company’s own realized deal.
To address this concern, we ran two additional specifications. First we excluded a company’s
own deal from the numerator, which essentially amounts to pretending that the specific deal
never happened. Second, we excluded a company’s own deal from both the numerator and
denominator, which essentially amounts to pretending that the company never existed. We reran
our instrumental variable models using these alternative specifications of the market share
variables, and found that this did not affect any of our results.
Our analysis focuses on the question of whether a bank makes a loan to a specific
company. One may also go one step further and ask what role that bank played in the loan. Of
particular interest is whether a bank is a lead lender. Following Drucker (2005), we identify
banks as serving a lead role if (1) it is the only bank listed for the loan or (2) it is listed as in LPC
as “Lead Arranger.”19 We reran our regressions, replacing our dependent variable (LENDER)
with a lead lender variable that is based on this definition. Again, we find the same pattern of
results, suggesting that prior relationships have an effect not only on the likelihood of making the
loan, but also on the likelihood of becoming a lead lender.
Section 1.2 mentioned that banks can invest in private equity through two regulatory
loopholes, either through SBIC registered funds, or through the Bank Holding Act exemption.
While VE does not maintain records of which investments are financed under which loophole, it
is possible to track which banks have an SBIC subsidiary. It is thus possible to subdivide banks
into two categories, those with and those without SBIC subsidiaries. We reran our base model,
dividing the PRIOR-VC coefficient into two, one for SBIC banks and one for non-SBIC banks.
We found that both coefficients were statistically significant, and that the t-test for the difference
of coefficients was not significant. These results seem to suggest that the choice of regulatory
loophole does not matter for our main findings.
4. The impact of relationships on loan pricing

21
To provide further evidence for our main hypothesis, we ask whether there is economic
impact from these relationships. Companies can potentially benefit from such relationships if
they can use these relationships to signal better quality and get better loan pricing. Alternatively,
banks may use the private information at their disposal to extract rents from the companies so
that there is no benefit to companies.
In this section we test whether companies get better terms on relationship-loans than non-
relationship-loans. For this, we naturally confine ourselves to the companies of the restricted
sample, namely the 279 companies that receive venture funding from commercial banks and
subsequently obtain at least one loan in LPC. We identify 193 relationship loans, which are
lending facilities in which the company’s venture capitalist is a lender. For non-relationship
loans, we consider all non-relationship loans made by banks in LPC. We identify 809 non-
relationship loans. For the analysis we lose all loans that have no reported yield spread and/or
term length. This reduces the sample to 146 relationship loans and 634 non-relationship loans.
Loan pricing is commonly measured by the yield spread, which is the difference between
the interest rate on the loan and the safe rate of return, as measured by LIBOR. Formally, the
variable YIELD SPREAD is the yield of the loan, quoted in basis points over LIBOR. We use
the data item “all-in spread drawn” in LPC, which also incorporates all fees paid by the
borrowers. These loans are typically syndicated, are typically to public companies, and are
reported on SEC filings. Hence it is unlikely that there are other unreported compensation or
costs related to the loan. The pricing data can be considered quite reliable including both interest
rates and fees.
To compare relationship loans and non-relationship loans we need to control for
differences in the types of loans, such as their size, term length or credit rating. To estimate the
difference in yield spreads between relationship and non-relationship loans, we use econometric
matching methods developed by Rosenbaum and Rubin (1983), Heckman and Robb (1986), and
Heckman, Ichimura and Todd (1997, 1998). In essence, matching methods use the loan
characteristics to construct an optimal control sample. For those readers not familiar with this
methodology, the appendix provides a brief explanation of this estimation method.
For each of the relationship and non-relationship loans, we compute a propensity score
via a Probit model, where the dependent variable is PRIOR-VC, and the independent variables
are as follows:

22
• RATING provides the Standard & Poor’s credit rating of a company at the date of the
loan, which we convert as follows: AAA = 1, AA = 2, A = 3, BBB = 4, BB = 5, B = 6,
CCC = 7, CC = 8, C = 9, NR=10;
• NOTRATED is a dummy variable, which is 1 if the loan is not rated, 0 otherwise;
• FACSIZE is the notional value of the loan facility between the lender and the borrower,
expressed in millions of dollars;
• LENGTH is the difference between the term facility active date and the term facility
expiration date, measured in months;
• TYPE is a set of dummy variables concerning loan type (LPC classifies loans into term
loans, revolving lines of credit, 364 day facilities and other type);
• YEARL is a set of dummy variables based on the year of the lending facility;
• VE is a set of dummy variables based on two-digit primary VE industry codes.
• VCCLUSTER is a dummy variable that takes the value 1 if the company is in California
or Massachusetts, 0 otherwise.
Our choice of independent variables includes all those characteristics that are economically
meaningful, and that are observable both for relationship loans and the control group of non-
relationship loans.
There are several standard approaches for calculating propensity scores, and the appendix
provides a technical overview of their differences. Table 6 reports the results from the various
matching methods. We see that relationship loans consistently have lower yields than similar
non-relationship loans. The estimates range from 18 to 27 basis points. Statistical significance
varies across the different methods as well, with P-values ranging from 4.8% to 10.8%.
Altogether these results suggest that there is an economically non-negligible pricing difference
between relationship and non-relationship loans.
This evidence suggests that the relationships forged at the venture capital stage can have
an economic impact, in terms of allowing companies to obtain better loan pricing. Naturally,
these calculations are not meant to estimate the net benefit of choosing a bank as a venture
capitalist. This would be much more difficult to do, both because it is hard to measure all the
benefits, and because of self-selection at the venture capital stage. However, the existence of
23
loan pricing differential does suggest that there is a meaning to the relationships forged between
companies and banks, and that these relationships can be economically beneficial not only for
banks in terms of better access to loan deals, but also for companies in terms of better loan
pricing.
5. Conclusion
This paper examines the role of banks in venture capital. The evidence suggests that
banks build relationships in the venture capital market that can be mutually advantageous in the
loan market. This highlights the strategic nature of banks’ investments in the venture capital
market. Naturally, there may be other factors that also influence the venture capital investment of
banks. For instance, banks’ activities may be influenced by regulation or greater risk-aversion.
This is consistent with our finding that banks avoid early stage investments. However, banking
regulation and risk-aversion alone cannot explain the evidence on relationship building. Another
way of seeing our analysis is thus that within the constraints of banking regulation and risk-
aversion, we find evidence that banks tilt their venture capital investments towards strategic
goals of relationship building.
Prior research established the importance of value-adding support in venture capital [see
e.g., Hellmann and Puri (2000, 2002) and Kaplan and Strömberg (2004)]. Some observers argue
that banks typically fail to provide such value-adding support, and Bottazzi, Da Rin and
Hellmann (2006) provide some supporting evidence from European venture capital deals. One
possible interpretation is that banks are less skillful investors, and that banks provide insufficient
monetary incentives for their venture managers. Again this is consistent with the finding that
banks may focus on later-stage investments, where value-adding support is relatively less
critical. However, it is worth noting that this alone cannot explain the evidence on the building
of relationships. Fundamentally, our finding on relationship building actually suggests an
explanation for banks’ perceived lack of value-adding support. Given that banks have a strategic
focus, they endogenously have fewer incentives to expend costly resources on building value
added support capabilities. If banks use venture capital to build lending relationships, as our
findings suggest, building the infrastructure for providing value-adding support may not be their
main priority.

24
Understanding the role of banks in venture capital is also important for the development
of venture capital markets outside the US. Policy makers in numerous countries have tried to
facilitate the development of their own venture capital industry. Some policies focus on the
supply of start-ups. Gompers, Lerner and Scharfstein (2005) argue that incumbent corporations
may play an important role, especially for spawning off technologies and entrepreneurs. Other
policies focus on the supply of venture capital. Black and Gilson (1997) argue that in bank-
dominated economies the lack of active stock markets is an obstacle for venture capital. Our
paper adds a new perspective to this debate. Our evidence suggests that banks have different
incentives than independent venture capitalists. They may focus their venture activities towards
building relationships for their lending activities, rather than developing the early stage venture
capital market itself. Put differently, banks may play a very useful role in the venture capital
industry, in terms of building relationships that are mutually advantageous for companies and
banks. But this is a different role than developing the venture capital market by making
pioneering investments in early stage ventures.

25
Appendix: Matching methods
The formal econometric methods of matching were developed in Rosenbaum and Rubin
(1983), Heckman and Robb (1986), and Heckman, Ichimura and Todd (1997, 1998). We provide
an outline of how we apply these methods to our data. Let D=1 if the loan is a relationship loan,
and let D=0 if the loan is a non-relationship loan. In principle, the ith of the N loans under study
has both a yield spread Y1i that would result with a relationship loan, and another yield spread Y0i
that would result with a non-relationship loan. The effect of interest is a mean effect of the
difference between Y1 and Y0. However, since we only observe Y1 for our sample of relationship
loans, we have a missing data problem that cannot be solved at the level of the individual bank,
so we reformulate the problem at the population level. We focus on the mean effect of the
difference between relationship loans and non-relationship loans with characteristics X:
E(Y1 – Y0 | D=1, X) (1)
While the mean E(Y1 | D=1, X) can be identified from data on relationship loans, some
assumptions must be made to identify the unobservable counterfactual mean, E(Y0 | D=1, X).
The observable outcome of self-selected non-relationship loans E(Y0 | D=0, X) can be used to
approximate E(Y0 | D=1, X). The selection bias that arises from this approximation is E(Y0 |
D=1, X) - E(Y0 | D=0, X).
We use a method of matching that solves the evaluation problem.20 Following Heckman
and Robb (1986), we assume that the relevant differences between relationship loans and non-
relationship loans are captured by their observable characteristics X. Let
D | X) , Y(Y ⊥10 (2)
denote the statistical independence of (Y0, Y1) and D conditional on X. Rosenbaum and Rubin
(1983) establish that when (2) and
0 < P(D=1 | X) < 1 (3)
(which are referred to as the strong ignorability conditions) are satisfied, then
.|110 X) D | P(D) , Y(Y =⊥ While it is often difficult to match on high dimension X, this result
allows us to match based on the one-dimensional P(D=1 | X) alone. P(D=1 | X), known as the
propensity score, can be estimated using Probit or logit models. Heckman, Ichimura and Todd

26
(1998) extend this result by showing that the strong ignorability conditions are overly restrictive
for the estimation of (1). All that is required is the weaker mean independence condition
E(Y0 | D=1, P(D=1 | X)) = E(Y0 | D=0, P(D=1 | X)) (4)
By using the propensity score, we can effectively take into account the fact that the
characteristics of relationship loans may differ significantly from non-relationship loans and
ensure that such observed characteristics are not driving the results.
There may be loans that have propensity scores that are outside of the common support of
relationship loan and non-relationship loan propensity scores. Using loans that fall outside of the
common support can substantially bias the results [see e.g., Heckman, Ichimura and Todd
(1997)]. As a result, we remove all loans that are outside of the common propensity score
support.
We use two classes of propensity score matching methods: (i) nearest neighbor matching,
and (ii) kernel based matching. Both propensity score matching methods are discussed in greater
detail in Heckman, Ichimura and Todd (1997, 1998). Let Y1i be the yield spread of a relationship
loan, Y0j be the yield spread of a non-relationship loan, and let ziY 0 represent the (weighted)
average of yield spreads of the non-relationship loans using estimator z, that is matched with Y1i.
To match the yield spreads of non-relationship loans to the yield spreads of relationship loans we
compute for every i the estimated yield difference .01zii YY −
For each relationship loan, the nearest neighbor matching estimator chooses the n non-
relationship loans with closest propensity scores to the relationship loan propensity score. The
estimator computes the arithmetic average of the yield spreads of these n non-relationship loans.
For each Y1i, we match ∑∈
=)(
001
iNjj
NNi Y
nY where N(i) is the set of non-relationship loans that are
nearest neighbors to Y1i. We set n = 10, 20, 50 and 100.
The kernel estimators construct matches for each relationship loan by using weighted averages
of yield spreads of multiple non-relationship loans. If weights from a typical symmetric, non
negative, unimodal kernel K are used, then the kernel places higher weight on loans close in
terms of P(PRIOR-VC=1|X) and lower or zero weight on more distant observations.
Let ⎟⎟⎠
⎞⎜⎜⎝
⎛ −=
hXPXP
KK jiij
)()( 01 where h is a fixed bandwidth and P(X)=P(PRIOR-VC=1|X). For

27
each Y1i, we match a corresponding KiY 0 where
∑∑
=
jij
jj
ijKi
K
YKY
0
0 . We use two different kernels to
compute KiY 0 . The Gaussian kernel uses all non-relationship loans while the Epanechnikov kernel
only uses non-relationship loans with a propensity score P(X0j) that falls within the fixed
bandwidth h of P(X1i). We set h = 0.01. As a robustness check we also set h to different values
and obtained similar results.

28
References
Allen, F., and D. Gale, 2000, Comparing Financial Systems MIT Press, Cambridge,
Massachusetts.
Becker, R., and T. Hellmann, 2005, “The Genesis of Venture Capital: Lessons from the German
Experience,” in C. Keuschnigg and V. Kanniainen (eds.), Venture Capital,
Entrepreneurship, and Public Policy, Chapter 2, 33-67, MIT Press, Cambridge,
Massachusetts.
Berger, A., N. Miller, M. Petersen, R. Rajan, and J. Stein, 2005, “Does Function Follow
Organizational Form? Evidence from the Lending Practices of Large and Small Banks,”
Journal of Financial Economics, 76(2), 237-269.
Berger, A., and G. Udell, 1995, “Relationship Lending and Lines of Credit in Small Firm
Finance,” Journal of Business, 68(3), 351-381.
Best, R., and H. Zhang, 1993, “Alternative Information Sources and the Information Content of
Bank Loans,” Journal of Finance, 48(4), 1507-1522.
Bharath, S., S. Dahiya, A. Saunders, and A. Srinivasan, 2006, “So What Do I Get? The Bank's
View of Lending Relationships,” forthcoming in Journal of Financial Economics.
Billet, M.T., M.J. Flannery, and J.A. Garfinkel, 1995, “The Effect of Lender Identity on a
Borrowing Firm's Equity Return,” Journal of Finance, 50(2), 699-718.
Black, B. S., and R. J. Gilson, 1997, “Venture Capital and the Structure of Capital Markets:
Banks versus Stock Markets,” Journal of Financial Economics, 47(3), 243-277.
Block Z., and I. MacMillan, 1993, Corporate Venturing, Harvard Business School Press, Boston,
Massachusetts.
Bound, J., D. A. Jaeger, and R. M. Baker, 1995, “Problems with Instrumental Variables
Estimation When the Correlation Between the Instruments and the Endogenous
Explanatory Variable is Weak,” Journal of the American Statistical Association, 90(430),
443-450.
Brander, J., R. Amit, and W. Antweiler, 2002, “Venture Capital Syndication: Improved Venture
Selection vs. The Value-Added Hypothesis,” Journal of Economics, Management and
Strategy, 11(3), 423-452.
29
Brewer, E., and H. Genay, 1994, “Funding Small Business through the SBIC Program,”
Economic Perspectives, Federal Reserve Bank of Chicago, May, 22-34.
Bottazzi, L., M. Da Rin, and T. Hellmann, 2006, “Who are the Active Investors? Evidence from
Venture Capital,” Mimeo, University of British Columbia.
Carow, K.A., and E. Kane, 2002, “Event-study Evidence of the Value of Relaxing Longstanding
Regulatory Restraints of Banks, 1970-2000,” Quarterly Review of Economics and
Finance, 42(3), 439-463.
Cary, M., M. Post, and S. A. Sharpe, 1998, “Does Corporate Lending by Banks and Finance
Companies Differ? Evidence on Specialization in Private Debt Contracting,” Journal of
Finance, 53(3), 845-878.
Chamberlain, G., 1980, “Analysis of Covariance with Qualitative Data,” Review of Economic
Studies, 47(1), 225-238.
Drucker, S., 2005 “Information Asymmetries and the Effects of Banking Mergers on Firm-Bank
Relationships,” Mimeo, Columbia University.
Drucker, S., and M. Puri, 2005, “On the Benefits of Concurrent Lending and Underwriting,”
Journal of Finance, 60(6), 2763–2799.
Drucker, S., and M. Puri, 2006, “Banks in Capital Markets,” forthcoming in E. Eckbo (ed.),
Empirical Corporate Finance, Handbooks in Finance, North-Holland Publishers,
Amsterdam.
Dushnitsky, G., and J.M. Shaver, 2006, “Limitations to Inter-Organizational Knowledge
Acquisition: The Paradox of Corporate Venture Capital,” Mimeo, Wharton School,
University of Pennsylvania.
FDIC, 2003, “Permissible National Bank Activities and Equity Investments,”
http://www.fdic.gov/regulations/resources/permissible/index.html.
Fein, M., 2002, Securities Activities of Banks (3rd ed.), Aspen Publisher, Inc., New York City,
New York.
Gande, A., M. Puri, A. Saunders, and I. Walter, 1997, “Bank Underwriting of Debt Securities:
Modern Evidence,” Review of Financial Studies, 10(4), 1175-1202.
30
Gompers, P., 1995, “Optimal Investment, Monitoring, and the Staging of Venture Capital,”
Journal of Finance, 50(5), 1461-1489.
Gompers, P., and J. Lerner, 1999, “Conflict of Interest in the Issuance of Public Securities:
Evidence from Venture Capital,” Journal of Law and Economics, 42(1), 53-80.
Gompers, P., and J. Lerner, 2000, “The Determinants of Corporate Venture Capital Success:
Organizational Structure, Incentives, and Complementarities,” in Randall Morck (ed.),
Concentrated Ownership, 17-50, University of Chicago Press, Chicago, Illinois.
Gompers, P., A. Kovner, J. Lerner, and D. Scharfstein, 2007, “Venture Capital Investment
Cycles: The Impact of Public Markets,” forthcoming in Journal of Financial Economics.
Gompers, P., J. Lerner, and D. Scharfstein, 2005, “Entrepreneurial Spawning: Public
Corporations and the Genesis of New Ventures, 1986-1999,” Journal of Finance, 60(2),
577-614.
Greenbaum, S. I., and A. V. Thakor, 1995, Contemporary Financial Intermediation, The Dryden
Press, Orlando, Florida.
Greene, W., 2000, Econometric Analysis, Prentice Hall, Upper Saddle River, New Jersey.
Hamao, Y., F. Packer, and J. Ritter, 2000, “Institutional Affiliation and the Role of Venture
Capital: Evidence from Initial Public Offerings in Japan,” Pacific-Basin Finance Journal,
8(5), 529-558.
Heckman, J., H. Ichimura, and P. Todd, 1997, “Matching as an Econometric Evaluation
Estimator: Evidence from Evaluating a Job Training Programme,” Review of Economic
Studies, 64(4), 605-654.
Heckman, J., H. Ichimura, and P. Todd, 1998, “Matching as an Econometric Evaluation
Estimator,” Review of Economic Studies, 65(2), 261-294.
Heckman, J., and R. Robb, 1986, “Alternative Methods for Evaluating Solving the Problem of
Selection Bias Evaluating the Impact of Treatments on Outcomes,” in H. Wainer (ed.),
Drawing Inference from Self-Selected Samples, Springer Verlag, Berlin.
Hellmann, T., 2002 “A Theory of Strategic Venture Investing” Journal of Financial Economics,
64(2), 285-314.

31
Hellmann, T., and M. Puri, 2000, “The Interaction between Product Market and Financing
Strategy: The Role of Venture Capital,” Review of Financial Studies, 13(4), 959-984.
Hellmann, T., and M. Puri, 2002, “Venture Capital and the Professionalization of Start-Up
Firms: Empirical Evidence,” Journal of Finance, 57(1), 169-197.
James, C., 1987, “Some Evidence on the Uniqueness of Bank Loans,” Journal of Financial
Economics, 19 (2), 217-235.
Kaplan, S., and A. Schoar, 2005, “Private Equity Performance: Returns, Persistence and Capital
Flows,” Journal of Finance, 60(4), 1791-1823.
Kaplan, S., B. Sensoy, and P. Strömberg, 2004, “How Well do Venture Capital Databases
Reflect Actual Investments,” Mimeo, University of Chicago.
Kaplan, S., and P. Strömberg, 2001, “Venture Capitalists As Principals: Contracting, Screening,
and Monitoring,” American Economic Review, Papers and Proceedings, 91(2), 426-430.
Kaplan, S., and P. Strömberg, 2003, “Financial Contracting meets the Real World: An Empirical
Study of Venture Capital Contracts,” Review of Economic Studies, 70(2), 281-315.
Kaplan, S., and P. Strömberg, 2004, “Contracts, Characteristics, and Actions: Evidence from
Venture Capital Analyses,” Journal of Finance, 59(5), 2177-2210.
Kinn, B., and A. Zaff, 1994, “The New SBIC Program: Finally Here,” Venture Capital Journal,
June, 36-40.
Kroszner, R., and R. Rajan, 1994, “Is the Glass-Steagall Act Justified? A Study of the U. S.
Experience with Universal Banking before 1933,” American Economic Review, 84(4),
810-32.
Lerner J., 1994, “The Syndication of Venture Capital Investments,” Financial Management,
23(3), 16-27.
Lerner, J., 1995, “Venture Capitalists and the Oversight of Private Firms,” Journal of Finance,
50(1), 301-18.
Li, X., and R. Masulis, 2005, “Venture Capital Investments by IPO Underwriters: Certification,
Alignment of Interest or Moral Hazard?” Mimeo, Vanderbilt University.

32
Ljungqvist, A., F. Marston, and W. Wilhelm, 2006, “Competing for Securities Underwriting
Mandates: Banking Relationships and Analyst Recommendations,” Journal of Finance,
61(1), 301-340.
Lummer, S., and J. McConnell, 1989, “Further Evidence on Bank Lending Process and Capital
Market Response to Bank Loan Agreements,” Journal of Financial Economics, 25(1),
52-63.
Mayer, C., K. Schoors, and Y. Yafeh, 2005, “Sources of Funds and Investment Strategies of
Venture Capital Funds: Evidence from Germany, Israel, Japan and the UK,” Journal of
Corporate Finance, 11(3), 586-608.
Petersen, M., and R. Rajan, 1994, “The Benefits of Lending Relationships: Evidence from Small
Business Data,” Journal of Finance, 49(1), 3-37.
Petersen, M., and R. Rajan, 2002, “Does Distance Still Matter: the Informational Revolution in
Small Business Lending,” Journal of Finance, 57(6), 2533-2570.
Puri, M., 1996, “Commercial Banks in Investment Banking: Conflict of Interest or Certification
Effect?” Journal of Financial Economics, 40(3), 373-401.
Rogers, W.H., 1993, “Regression Standard Errors in Clustered Samples,” Stata Technical
Bulletin 13, 19-23.
Rosenbaum, P., and D. Rubin, 1983, “The Central Role of the Propensity Score in Observational
Studies for Causal Effects,” Biometrika, 70(1), 41-55.
Sahlman, W., 1990, “The Structure and Governance of Venture Capital Organizations,” Journal
of Financial Economics, 27(2), 473-521.
Staiger, D., and J.H. Stock, 1997, “Instrumental Variables Regression with Weak Instruments,”
Econometrica, 65(3), 557-586.
SBIC, 2003, “SBIC Regulations” http://www.sba.gov/INV/regulations.html.
Smith, R. J., and R.W. Blundell, 1986, “An Exogeneity Test for a Simultaneous Equation Tobit
Model with an Application to Labor Supply,” Econometrica, 54(4), 679-686.
Thompson S., 2006, “Simple Formulas for Standard Errors that Cluster by Both Firm and Time,”
Mimeo, Harvard University.

33
Wilson, J., 1985, The New Ventures: Inside the High-Stakes World of Venture Capital, Addison-
Wesley Publishing Company, Reading, Massachusetts.
Wooldridge, J., 2001, Econometric Analysis of Cross Section and Panel Data, MIT Press,
Cambridge, Massachusetts.
Yasuda, A., 2005, “Do Bank Relationships Affect the Firm’s Underwriter Choice in the
Corporate Bond Underwriting Market?” Journal of Finance, 60(3), 1259-1292.

34
1 Throughout the paper we reserve the word “firm” to the investor, and the word “company” to
the investee. 2 VE is a standard database for venture capital research. It has been used in many recent venture
capital studies, including Gompers (1995), Lerner (1995), Kaplan and Schoar (2005), and
Gompers, Kovner, Lerner and Scharfstein (2007). For a detailed discussion of the properties and
accuracy of this database, see Lerner (1995), and Kaplan, Sensoy and Strömberg (2004). While
this database has many strengths, these authors note that the main deficiencies of the VE
database are that it does not have complete coverage of financing rounds, that it over-samples
larger rounds and California companies, and that it over-counts the number of rounds (where a
single round is reported as two separate rounds). Any over-counting of rounds does not affect
our analysis, since our unit of analysis does not rely on the counting of rounds. Our analysis also
controls for the size of the round and California companies. 3 VE began tracking venture deals in 1970. Their coverage in the early years is believed to have
been sparse. Moreover, the reinterpretation of the ERISA ‘prudent man’ standard in 1979 is
widely believed to mark the beginning of the modern venture market. We therefore take 1980 as
the beginning of our sample period. 4 LPC collects its loan data from SEC filings, and it also receives data from large loan
syndicators, from news coverage and through LPC’s relationship with major banks. As such the
LPC database covers large loans for companies which have either public equity or public debt,
supplemented with voluntary information on other loans. LPC has been used in previous studies
for many purposes, including examining the effect of lending on bond yield spreads [see, for
example, Gande et al. (1997)] and for differences in lending by banks and finance companies
[Carey, Post and Sharpe (1998)]. 5 The Perl program works by matching on the core of each company name after stripping out
non-identifying information such as “Corp.”, “Incorporated”, or “Inc.” Matching without
cleaning the name field in such a manner would result in missing matches between “XYZ Co.”
and “XYZ Corp”, for example, strictly because of different naming conventions in the different
databases. In addition to organizational form suffixes, we also strip the name field of spaces,
capital letters, and punctuation.
35
6 If a company changes name because of an acquisition, we consider this an exit and do not track
lending activity after the acquisition. 7 This definition of the deal is appropriate to study the portfolio structure of the different types of
ventures. It allows us to identify all interactions between investors and companies without
introducing any double counting that might arise from an investor’s preference to stage the
commitment of financing [see Gompers (1995), Kaplan and Strömberg (2001, 2003, 2004) or
Sahlman (1990)]. Our definition also eliminates a potential data problem in VE, namely that
even within a single round there may be staging of disbursements, which could be mistaken as
separate rounds [see Lerner (1995)]. 8 While this finding might be intuitive for those familiar with the institutional details of venture
capital, it contrasts with the usual argument in the banking literature [see e.g., Greenbaum and
Thakor (1995)] that banks have a comparative advantage at originating deals (and less so
funding hence the growth of loans sales and securitization). Our results show that in the venture
capital market, rather than originating themselves, banks let others do more of the origination
work. 9 The venture capital industry is highly concentrated, with California and Massachusetts
accounting for 54.87% of all the deals in our sample. 10 The importance of bank location is also examined by Berger et. al. (2005) and Petersen and
Rajan (2002). 11 Lerner (1994) and Brander, Amit and Antweiler (2002) examine the role of syndication in
venture capital. 12 Since several lenders may lend to the same company, the sum of our market shares exceeds 1.
An equivalent comment also applies to our measures of geographic and temporal venture capital
market shares. 13 We also reran this model using a pooled Logit model and, unsurprisingly, obtain very similar
results. 14 In general it is impossible to say who selects whom in the venture capital market. It could be
that certain companies look for certain bank venture capitalists, and/or that certain banks seek
out certain types of companies. What matters for the econometric analysis is to account for the
resulting self-selection between venture capitalists and companies.
36
15 In our base specification, we omit IPO as a dependent variable, since the resolution of this
variable is not known at the time of the venture investment. Greene (2000) explains why such an
omission is econometrically valid for the bivariate Probit. However, as a robustness check, we
also reran all of our models, using all exogenous variables, even those pertaining to events that
happen after the event (namely the IPO variable, as well as loan year dummies for the base
sample). The results are qualitatively similar. 16 The number of observations in Table 4 is slightly fewer than in Table 3 because of missing
geographic data. We reran Table 3 with the slightly smaller sample and found that this did not
affect any of the results. We also did the same for Table 5. 17 Staiger and Stock (1997) propose a test for the strength of instruments that is based on an F-
test for the joint significance of the instruments. Our instruments are jointly highly significant,
clearly passing the threshold level for this F-test. Bound et al. (1995) suggest that high partial R-
square, defined as the difference in R-square between the first stage regression with and without
the instruments, ensures instruments are sufficiently strong. We find that the inclusion of the
instruments in a first stage Probit with all exogenous variables increases the pseudo R-square
from 0.1963 to 0.3176. This highlights the importance of availability of different financial
intermediaries, which is at the base of our instrumentation strategy. We also consider the
validity of the exclusion restriction for our instruments. We follow the approach of Smith and
Blundell (1986), who propose a test for exogeneity in models with limited dependent variables.
The test is based on including in the outcome regression residuals from a linear probability
model of the selection equation. We find that these residuals are highly insignificant, suggesting
that we cannot reject the hypothesis that the instruments are exogenous. We also calculated a
standard Hansen-J statistic for the linear probability version of our two equations. Again we
were unable to reject the hypothesis that the instruments are exogenous. 18 We also expanded the sample even further by including companies in VE that obtained
venture capital from venture capital investors that were neither independent, nor bank-owned.
The largest single investor type for this group is corporate venture capitalists. We exclude them
from our main analysis, since these other types of venture capitalists typically have more
complex strategic objectives that may lead to a distinct investment pattern. However, adding
them back into the analysis, we found that our results continue to hold.

37
19 If the Lead Arranger field is blank, we use data from the “Arranger” field. If the Arranger field
is blank, we use the “Lead Role” descriptor from the “Lender” field. This procedure is designed
to more accurately identify true lead banks. See also Drucker (2005). 20 To determine if econometric matching is a viable method of evaluation, Heckman, Ichimura
and Todd identify four features of the data and matching techniques that can substantially reduce
bias: (i) Participants and controls have the same distributions of unobserved attributes; (ii) They
have the same distributions of observed attributes; (iii) Outcomes and characteristics are
measured in the same way for both groups; and (iv) Participants and controls are from the same
economic environment. Items (iii) and (iv) are met very well for this study because the loan yield
spreads and other loan characteristics are measured in the same way for both relationship and
non-relationship loans, and the non-relationship loans are from the same time period as the
relationship loans. To satisfy condition (ii), we use loan characteristics to match relationship
loans to non-relationship loans. Feature (i) cannot be achieved in a non-experimental evaluation.
However, Heckman, Ichimura and Todd (1997) note that feature (i) is only a small part of bias in
their experimental study. Thus, the method of matching non-relationship loans to relationship
loans can produce a viable estimate of the difference between relationship and non-relationship
loan yield spreads.
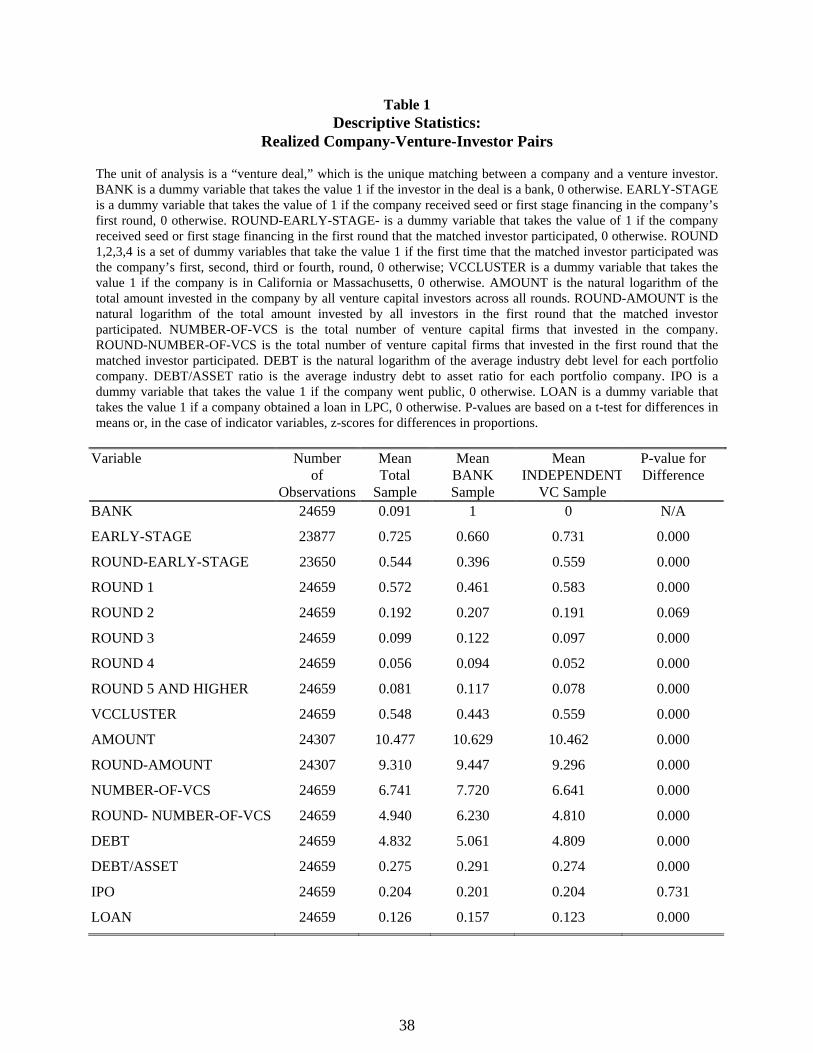
38
Table 1 Descriptive Statistics:
Realized Company-Venture-Investor Pairs
The unit of analysis is a “venture deal,” which is the unique matching between a company and a venture investor. BANK is a dummy variable that takes the value 1 if the investor in the deal is a bank, 0 otherwise. EARLY-STAGE is a dummy variable that takes the value of 1 if the company received seed or first stage financing in the company’s first round, 0 otherwise. ROUND-EARLY-STAGE- is a dummy variable that takes the value of 1 if the company received seed or first stage financing in the first round that the matched investor participated, 0 otherwise. ROUND 1,2,3,4 is a set of dummy variables that take the value 1 if the first time that the matched investor participated was the company’s first, second, third or fourth, round, 0 otherwise; VCCLUSTER is a dummy variable that takes the value 1 if the company is in California or Massachusetts, 0 otherwise. AMOUNT is the natural logarithm of the total amount invested in the company by all venture capital investors across all rounds. ROUND-AMOUNT is the natural logarithm of the total amount invested by all investors in the first round that the matched investor participated. NUMBER-OF-VCS is the total number of venture capital firms that invested in the company. ROUND-NUMBER-OF-VCS is the total number of venture capital firms that invested in the first round that the matched investor participated. DEBT is the natural logarithm of the average industry debt level for each portfolio company. DEBT/ASSET ratio is the average industry debt to asset ratio for each portfolio company. IPO is a dummy variable that takes the value 1 if the company went public, 0 otherwise. LOAN is a dummy variable that takes the value 1 if a company obtained a loan in LPC, 0 otherwise. P-values are based on a t-test for differences in means or, in the case of indicator variables, z-scores for differences in proportions.
Variable Number
of Observations
Mean Total
Sample
Mean BANK Sample
Mean INDEPENDENT
VC Sample
P-value for Difference
BANK 24659 0.091 1 0 N/A
EARLY-STAGE 23877 0.725 0.660 0.731 0.000
ROUND-EARLY-STAGE 23650 0.544 0.396 0.559 0.000
ROUND 1 24659 0.572 0.461 0.583 0.000
ROUND 2 24659 0.192 0.207 0.191 0.069
ROUND 3 24659 0.099 0.122 0.097 0.000
ROUND 4 24659 0.056 0.094 0.052 0.000
ROUND 5 AND HIGHER 24659 0.081 0.117 0.078 0.000
VCCLUSTER 24659 0.548 0.443 0.559 0.000
AMOUNT 24307 10.477 10.629 10.462 0.000
ROUND-AMOUNT 24307 9.310 9.447 9.296 0.000
NUMBER-OF-VCS 24659 6.741 7.720 6.641 0.000
ROUND- NUMBER-OF-VCS 24659 4.940 6.230 4.810 0.000
DEBT 24659 4.832 5.061 4.809 0.000
DEBT/ASSET 24659 0.275 0.291 0.274 0.000
IPO 24659 0.204 0.201 0.204 0.731
LOAN 24659 0.126 0.157 0.123 0.000
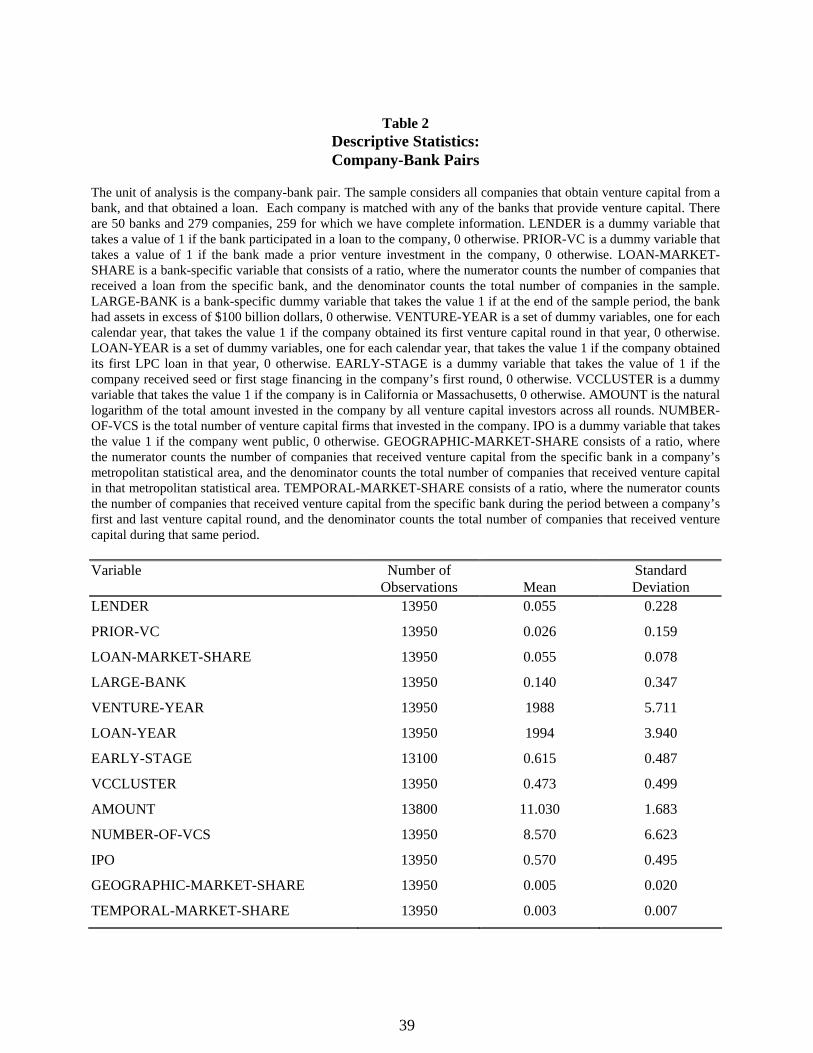
39
Table 2
Descriptive Statistics: Company-Bank Pairs
The unit of analysis is the company-bank pair. The sample considers all companies that obtain venture capital from a bank, and that obtained a loan. Each company is matched with any of the banks that provide venture capital. There are 50 banks and 279 companies, 259 for which we have complete information. LENDER is a dummy variable that takes a value of 1 if the bank participated in a loan to the company, 0 otherwise. PRIOR-VC is a dummy variable that takes a value of 1 if the bank made a prior venture investment in the company, 0 otherwise. LOAN-MARKET-SHARE is a bank-specific variable that consists of a ratio, where the numerator counts the number of companies that received a loan from the specific bank, and the denominator counts the total number of companies in the sample. LARGE-BANK is a bank-specific dummy variable that takes the value 1 if at the end of the sample period, the bank had assets in excess of $100 billion dollars, 0 otherwise. VENTURE-YEAR is a set of dummy variables, one for each calendar year, that takes the value 1 if the company obtained its first venture capital round in that year, 0 otherwise. LOAN-YEAR is a set of dummy variables, one for each calendar year, that takes the value 1 if the company obtained its first LPC loan in that year, 0 otherwise. EARLY-STAGE is a dummy variable that takes the value of 1 if the company received seed or first stage financing in the company’s first round, 0 otherwise. VCCLUSTER is a dummy variable that takes the value 1 if the company is in California or Massachusetts, 0 otherwise. AMOUNT is the natural logarithm of the total amount invested in the company by all venture capital investors across all rounds. NUMBER-OF-VCS is the total number of venture capital firms that invested in the company. IPO is a dummy variable that takes the value 1 if the company went public, 0 otherwise. GEOGRAPHIC-MARKET-SHARE consists of a ratio, where the numerator counts the number of companies that received venture capital from the specific bank in a company’s metropolitan statistical area, and the denominator counts the total number of companies that received venture capital in that metropolitan statistical area. TEMPORAL-MARKET-SHARE consists of a ratio, where the numerator counts the number of companies that received venture capital from the specific bank during the period between a company’s first and last venture capital round, and the denominator counts the total number of companies that received venture capital during that same period.
Variable Number of
Observations
Mean Standard Deviation
LENDER 13950 0.055 0.228
PRIOR-VC 13950 0.026 0.159
LOAN-MARKET-SHARE 13950 0.055 0.078
LARGE-BANK 13950 0.140 0.347
VENTURE-YEAR 13950 1988 5.711
LOAN-YEAR 13950 1994 3.940
EARLY-STAGE 13100 0.615 0.487
VCCLUSTER 13950 0.473 0.499
AMOUNT 13800 11.030 1.683
NUMBER-OF-VCS 13950 8.570 6.623
IPO 13950 0.570 0.495
GEOGRAPHIC-MARKET-SHARE 13950 0.005 0.020
TEMPORAL-MARKET-SHARE 13950 0.003 0.007
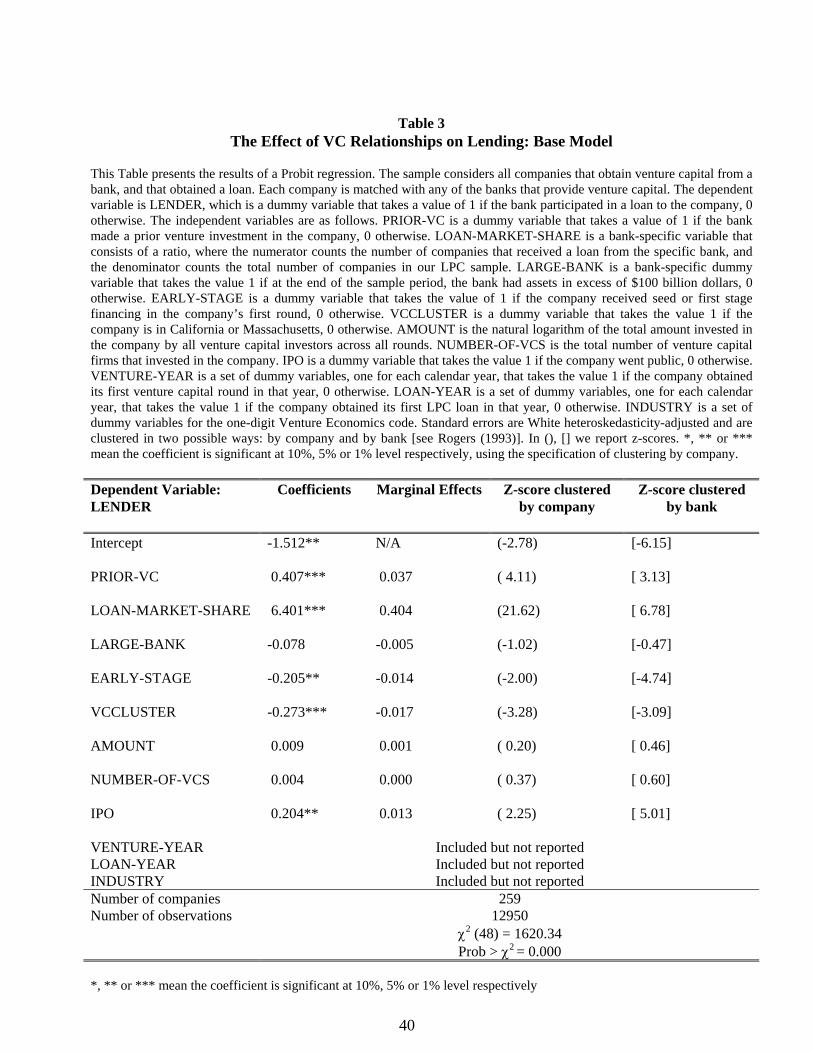
40
Table 3
The Effect of VC Relationships on Lending: Base Model This Table presents the results of a Probit regression. The sample considers all companies that obtain venture capital from a bank, and that obtained a loan. Each company is matched with any of the banks that provide venture capital. The dependent variable is LENDER, which is a dummy variable that takes a value of 1 if the bank participated in a loan to the company, 0 otherwise. The independent variables are as follows. PRIOR-VC is a dummy variable that takes a value of 1 if the bank made a prior venture investment in the company, 0 otherwise. LOAN-MARKET-SHARE is a bank-specific variable that consists of a ratio, where the numerator counts the number of companies that received a loan from the specific bank, and the denominator counts the total number of companies in our LPC sample. LARGE-BANK is a bank-specific dummy variable that takes the value 1 if at the end of the sample period, the bank had assets in excess of $100 billion dollars, 0 otherwise. EARLY-STAGE is a dummy variable that takes the value of 1 if the company received seed or first stage financing in the company’s first round, 0 otherwise. VCCLUSTER is a dummy variable that takes the value 1 if the company is in California or Massachusetts, 0 otherwise. AMOUNT is the natural logarithm of the total amount invested in the company by all venture capital investors across all rounds. NUMBER-OF-VCS is the total number of venture capital firms that invested in the company. IPO is a dummy variable that takes the value 1 if the company went public, 0 otherwise. VENTURE-YEAR is a set of dummy variables, one for each calendar year, that takes the value 1 if the company obtained its first venture capital round in that year, 0 otherwise. LOAN-YEAR is a set of dummy variables, one for each calendar year, that takes the value 1 if the company obtained its first LPC loan in that year, 0 otherwise. INDUSTRY is a set of dummy variables for the one-digit Venture Economics code. Standard errors are White heteroskedasticity-adjusted and are clustered in two possible ways: by company and by bank [see Rogers (1993)]. In (), [] we report z-scores. *, ** or *** mean the coefficient is significant at 10%, 5% or 1% level respectively, using the specification of clustering by company. Dependent Variable: LENDER
Coefficients
Marginal Effects
Z-score clustered by company
Z-score clustered by bank
Intercept -1.512**
N/A
(-2.78) [-6.15]
PRIOR-VC 0.407***
0.037
( 4.11) [ 3.13]
LOAN-MARKET-SHARE 6.401***
0.404
(21.62) [ 6.78]
LARGE-BANK -0.078
-0.005
(-1.02) [-0.47]
EARLY-STAGE -0.205**
-0.014
(-2.00) [-4.74]
VCCLUSTER -0.273***
-0.017
(-3.28) [-3.09]
AMOUNT 0.009
0.001
( 0.20) [ 0.46]
NUMBER-OF-VCS 0.004
0.000
( 0.37) [ 0.60]
IPO 0.204**
0.013
( 2.25) [ 5.01]
VENTURE-YEAR Included but not reported LOAN-YEAR Included but not reported INDUSTRY Included but not reported Number of companies 259 Number of observations 12950 χ2 (48) = 1620.34
Prob > χ2 = 0.000 *, ** or *** mean the coefficient is significant at 10%, 5% or 1% level respectively
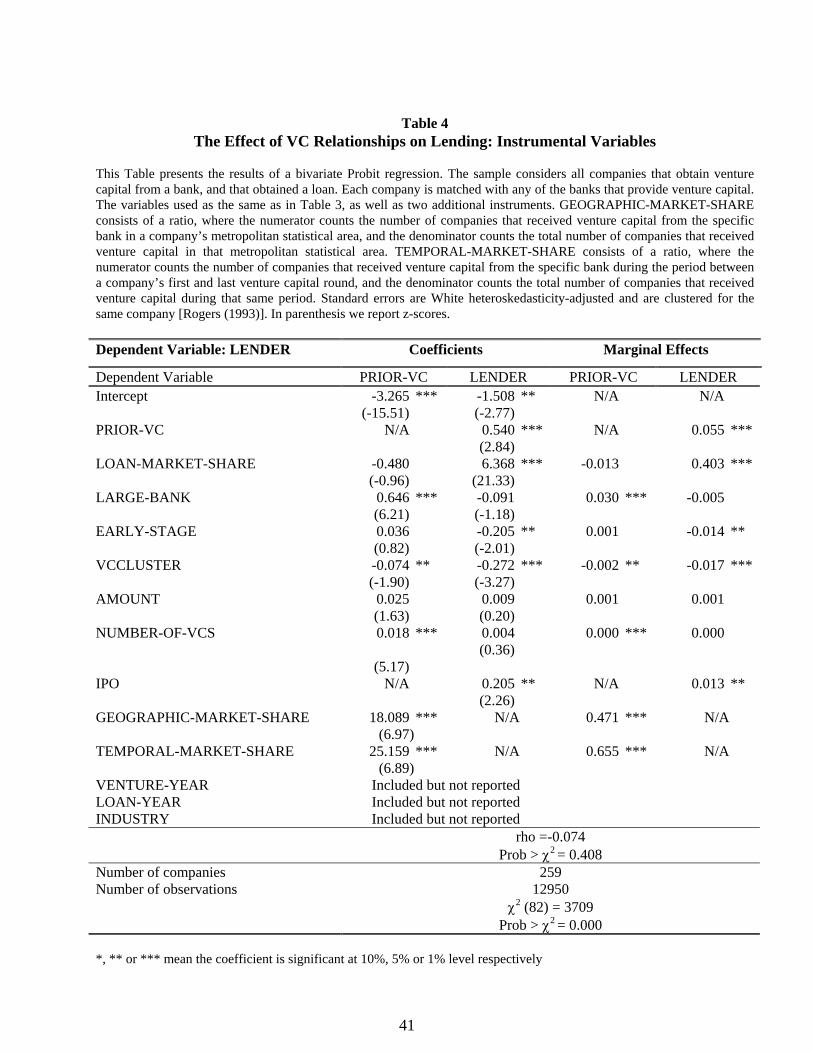
41
Table 4
The Effect of VC Relationships on Lending: Instrumental Variables This Table presents the results of a bivariate Probit regression. The sample considers all companies that obtain venture capital from a bank, and that obtained a loan. Each company is matched with any of the banks that provide venture capital. The variables used as the same as in Table 3, as well as two additional instruments. GEOGRAPHIC-MARKET-SHARE consists of a ratio, where the numerator counts the number of companies that received venture capital from the specific bank in a company’s metropolitan statistical area, and the denominator counts the total number of companies that received venture capital in that metropolitan statistical area. TEMPORAL-MARKET-SHARE consists of a ratio, where the numerator counts the number of companies that received venture capital from the specific bank during the period between a company’s first and last venture capital round, and the denominator counts the total number of companies that received venture capital during that same period. Standard errors are White heteroskedasticity-adjusted and are clustered for the same company [Rogers (1993)]. In parenthesis we report z-scores.
Dependent Variable: LENDER Coefficients Marginal Effects
Dependent Variable PRIOR-VC LENDER PRIOR-VC LENDER Intercept -3.265 ***
(-15.51) -1.508 ** (-2.77)
N/A N/A
PRIOR-VC N/A 0.540 *** (2.84)
N/A 0.055 ***
LOAN-MARKET-SHARE -0.480 (-0.96)
6.368 *** (21.33)
-0.013
0.403 ***
LARGE-BANK 0.646 *** (6.21)
-0.091 (-1.18)
0.030 ***
-0.005
EARLY-STAGE 0.036 (0.82)
-0.205 ** (-2.01)
0.001
-0.014 **
VCCLUSTER -0.074 ** (-1.90)
-0.272 *** (-3.27)
-0.002 **
-0.017 ***
AMOUNT 0.025 (1.63)
0.009 (0.20)
0.001
0.001
NUMBER-OF-VCS 0.018 *** (5.17)
0.004 (0.36)
0.000 ***
0.000
IPO N/A 0.205 ** (2.26)
N/A 0.013 **
GEOGRAPHIC-MARKET-SHARE 18.089 *** (6.97)
N/A 0.471 ***
N/A
TEMPORAL-MARKET-SHARE 25.159 *** (6.89)
N/A 0.655 ***
N/A
VENTURE-YEAR Included but not reported LOAN-YEAR Included but not reported INDUSTRY Included but not reported rho =-0.074
Prob > χ2 = 0.408 Number of companies 259 Number of observations 12950 χ2 (82) = 3709
Prob > χ2 = 0.000 *, ** or *** mean the coefficient is significant at 10%, 5% or 1% level respectively
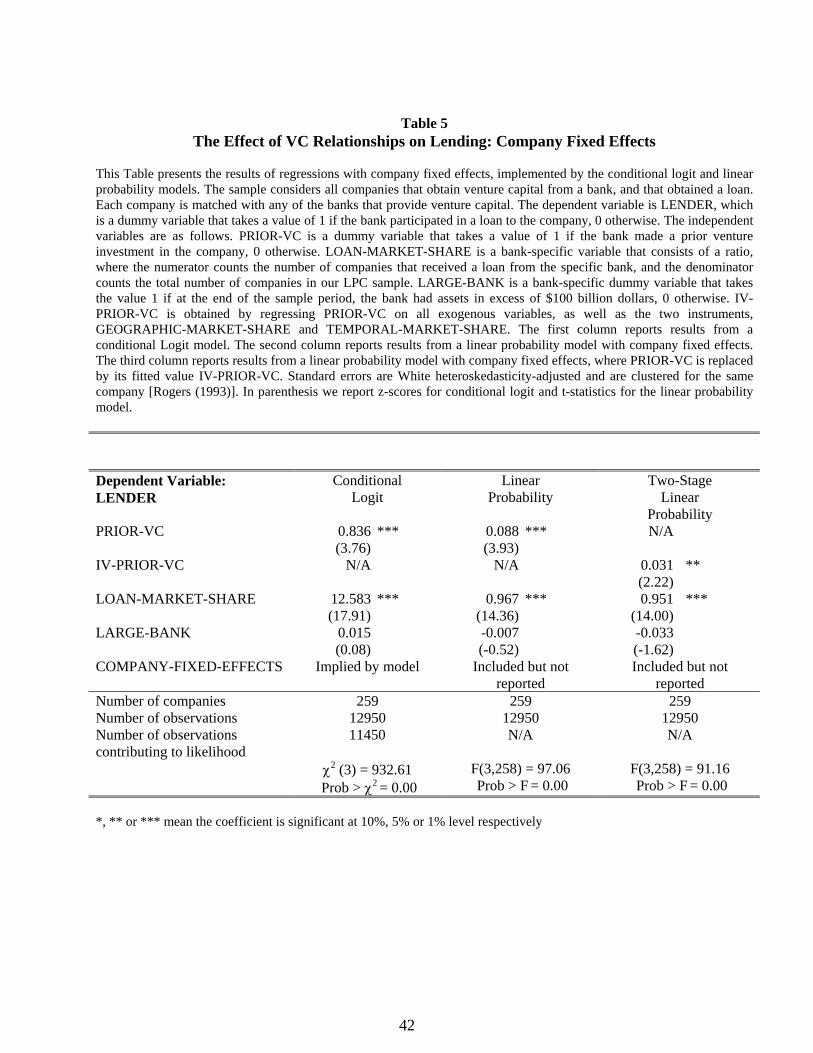
42
Table 5
The Effect of VC Relationships on Lending: Company Fixed Effects This Table presents the results of regressions with company fixed effects, implemented by the conditional logit and linear probability models. The sample considers all companies that obtain venture capital from a bank, and that obtained a loan. Each company is matched with any of the banks that provide venture capital. The dependent variable is LENDER, which is a dummy variable that takes a value of 1 if the bank participated in a loan to the company, 0 otherwise. The independent variables are as follows. PRIOR-VC is a dummy variable that takes a value of 1 if the bank made a prior venture investment in the company, 0 otherwise. LOAN-MARKET-SHARE is a bank-specific variable that consists of a ratio, where the numerator counts the number of companies that received a loan from the specific bank, and the denominator counts the total number of companies in our LPC sample. LARGE-BANK is a bank-specific dummy variable that takes the value 1 if at the end of the sample period, the bank had assets in excess of $100 billion dollars, 0 otherwise. IV-PRIOR-VC is obtained by regressing PRIOR-VC on all exogenous variables, as well as the two instruments, GEOGRAPHIC-MARKET-SHARE and TEMPORAL-MARKET-SHARE. The first column reports results from a conditional Logit model. The second column reports results from a linear probability model with company fixed effects. The third column reports results from a linear probability model with company fixed effects, where PRIOR-VC is replaced by its fitted value IV-PRIOR-VC. Standard errors are White heteroskedasticity-adjusted and are clustered for the same company [Rogers (1993)]. In parenthesis we report z-scores for conditional logit and t-statistics for the linear probability model.
Dependent Variable: LENDER
Conditional Logit
Linear Probability
Two-Stage Linear
Probability PRIOR-VC 0.836 ***
(3.76) 0.088 *** (3.93)
N/A
IV-PRIOR-VC
N/A N/A 0.031 ** (2.22)
LOAN-MARKET-SHARE 12.583 *** (17.91)
0.967 *** (14.36)
0.951 *** (14.00)
LARGE-BANK 0.015 (0.08)
-0.007 (-0.52)
-0.033 (-1.62)
COMPANY-FIXED-EFFECTS Implied by model Included but not reported
Included but not reported
Number of companies 259 259 259 Number of observations 12950 12950 12950 Number of observations contributing to likelihood
11450 N/A N/A
χ2 (3) = 932.61 Prob > χ2 = 0.00
F(3,258) = 97.06 Prob > F = 0.00
F(3,258) = 91.16 Prob > F = 0.00
*, ** or *** mean the coefficient is significant at 10%, 5% or 1% level respectively
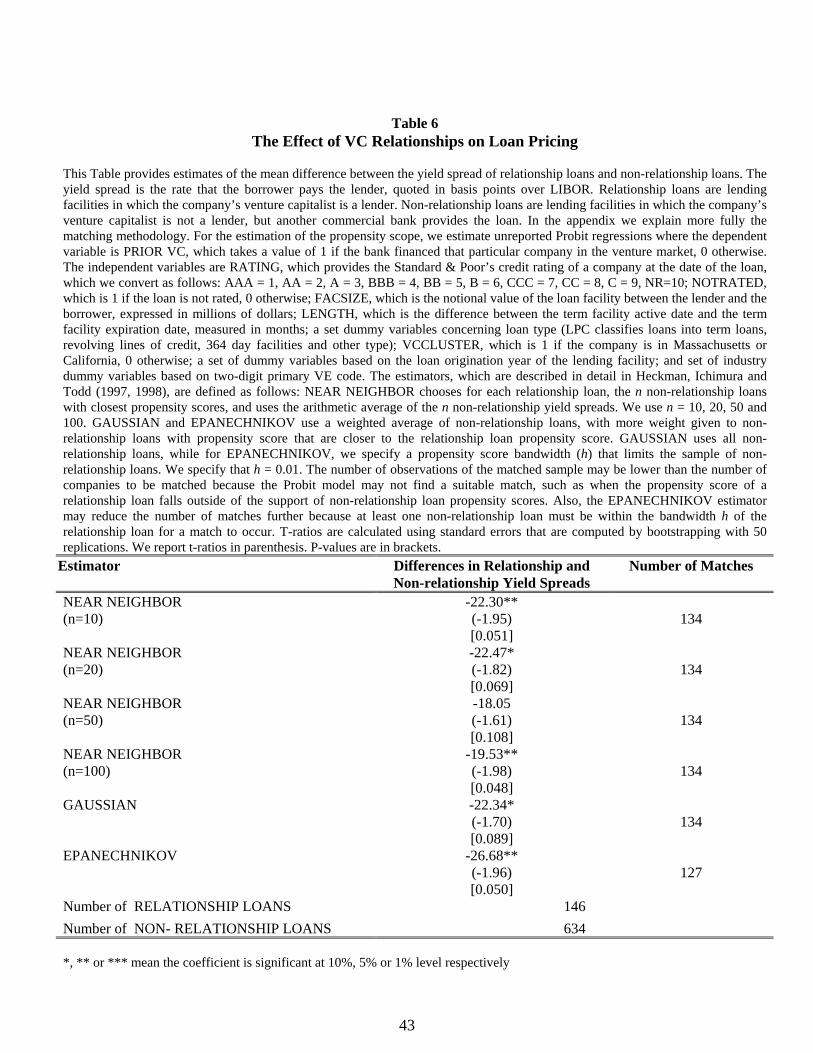
43
Table 6
The Effect of VC Relationships on Loan Pricing
This Table provides estimates of the mean difference between the yield spread of relationship loans and non-relationship loans. The yield spread is the rate that the borrower pays the lender, quoted in basis points over LIBOR. Relationship loans are lending facilities in which the company’s venture capitalist is a lender. Non-relationship loans are lending facilities in which the company’s venture capitalist is not a lender, but another commercial bank provides the loan. In the appendix we explain more fully the matching methodology. For the estimation of the propensity scope, we estimate unreported Probit regressions where the dependent variable is PRIOR VC, which takes a value of 1 if the bank financed that particular company in the venture market, 0 otherwise. The independent variables are RATING, which provides the Standard & Poor’s credit rating of a company at the date of the loan, which we convert as follows: AAA = 1, AA = 2, A = 3, BBB = 4, BB = 5, B = 6, CCC = 7, CC = 8, C = 9, NR=10; NOTRATED, which is 1 if the loan is not rated, 0 otherwise; FACSIZE, which is the notional value of the loan facility between the lender and the borrower, expressed in millions of dollars; LENGTH, which is the difference between the term facility active date and the term facility expiration date, measured in months; a set dummy variables concerning loan type (LPC classifies loans into term loans, revolving lines of credit, 364 day facilities and other type); VCCLUSTER, which is 1 if the company is in Massachusetts or California, 0 otherwise; a set of dummy variables based on the loan origination year of the lending facility; and set of industry dummy variables based on two-digit primary VE code. The estimators, which are described in detail in Heckman, Ichimura and Todd (1997, 1998), are defined as follows: NEAR NEIGHBOR chooses for each relationship loan, the n non-relationship loans with closest propensity scores, and uses the arithmetic average of the n non-relationship yield spreads. We use n = 10, 20, 50 and 100. GAUSSIAN and EPANECHNIKOV use a weighted average of non-relationship loans, with more weight given to non-relationship loans with propensity score that are closer to the relationship loan propensity score. GAUSSIAN uses all non-relationship loans, while for EPANECHNIKOV, we specify a propensity score bandwidth (h) that limits the sample of non-relationship loans. We specify that h = 0.01. The number of observations of the matched sample may be lower than the number of companies to be matched because the Probit model may not find a suitable match, such as when the propensity score of a relationship loan falls outside of the support of non-relationship loan propensity scores. Also, the EPANECHNIKOV estimator may reduce the number of matches further because at least one non-relationship loan must be within the bandwidth h of the relationship loan for a match to occur. T-ratios are calculated using standard errors that are computed by bootstrapping with 50 replications. We report t-ratios in parenthesis. P-values are in brackets.
Estimator
Differences in Relationship and Non-relationship Yield Spreads
Number of Matches
NEAR NEIGHBOR (n=10)
-22.30** (-1.95) [0.051]
134
NEAR NEIGHBOR (n=20)
-22.47* (-1.82) [0.069]
134
NEAR NEIGHBOR (n=50)
-18.05 (-1.61) [0.108]
134
NEAR NEIGHBOR (n=100)
-19.53** (-1.98) [0.048]
134
GAUSSIAN
-22.34* (-1.70) [0.089]
134
EPANECHNIKOV
-26.68** (-1.96) [0.050]
127
Number of RELATIONSHIP LOANS 146 Number of NON- RELATIONSHIP LOANS 634 *, ** or *** mean the coefficient is significant at 10%, 5% or 1% level respectively