building leadership teams - niusileadscape.org · module 1: building leadership teams ‐ academy...
TRANSCRIPT

Building Leadership Teams
Academy 3: Aligning School Goals and School Work Participant Handouts
© 2004 National Institute for Urban School Improvement™ Arizona State University P.O.Box 872011 Tempe
Arizona 85287 - 2011 Phone 480.965.0391 • Fax 480.727.7012
www.urbanschools.org
MODULE
1

© 2004 NIUSI www.urbanschools.org
2
Academy 3: Aligning School Goals and School Work
sing district and individual school goals and outcomes, this academy provides a process to accomplish action plans by targeting change efforts by month. Participants will discover various ways of collecting data, analyzing change based on that data, and
developing a continuous improvement plan.
Module Outcomes As a result of the activities and information shared in this Leadership Academy, module participants will
• Develop a continuous improvement cycle for tracking their change process
• Synthesize anecdotal, observational and frequency evidence for making adjustments to support positive climate for change in their building
Agenda We constructed this Leadership Academy to occur within a 3‐hour timeframe with 15 minutes or so for breaks and other time adjustments. The times listed below are approximate but reflect the time these activities and lecturettes have previously taken. Facilitators should be flexible, read their audience, and work to achieve the overall purpose and outcomes.
TIME EVENT 15 min Introductions and Greetings 30 min Activity 1: Evaluating Change 20 min Lecturette 1: Evidence of Change 25 min Activity 2: Making Progress 10 min Break 20 min Lecturette 2: Continuous Improvement 20 min Activity 3: Develop a Continuous Improvement Plan 30 min Leave‐taking and Feedback
U

© 2004 NIUSI www.urbanschools.org
Module 1: Building Leadership Teams ‐ Academy 3: Aligning School Goals and School Work
Change Checklist
Possible ways to know change is happening

Issues A-Z Issues by category View Issue chart Send us feedback
Register now to enjoy FREE access to our exclusive premium content!
Already registered? Login here.
Updated: March 12, 2004
All Categories
A student's decision to drop out of school has long-term consequences that can contribute to juvenile delinquency, welfare dependency, or, in the worst cases, prison.
According to the National Center for Education Statistics, the population segment of U.S. 16- through 24-year-olds who were not enrolled in school, or who did not have a high school diploma or a General Educational Development credential was about 11 percent in 2001. The economic value attached to completion of ever-greater levels of education has been well documented (e.g., U.S. Census Bureau, 2002).
In 2000, adults ages 25 to 34 who had dropped out of school or had not acquired a GED, earned up to 30 percent less than their peers who had completed high school or had GEDs. The gap widened when comparing the incomes of high school dropouts with those people with bachelor's degrees. In 2000, male and female college graduates earned $42,292 and $32,238 respectively, while male and female high school dropouts earned $19,225 and $11, 583 respectively. (Wirt, 2002). But the value of a high school education cannot be measured in dollars alone. Rates of high-risk behaviors such as teen pregnancy, delinquency, substance abuse, and crime are significantly higher among dropouts (Woods, 1995).
Although the dropout rate overall has
"Review of Transcripts Says College Concerns May Be Unwarranted," Feb. 18, 2004.
"Paige Seeks to Address Thorny Graduation Data," Jan. 7, 2004.
"Arizona Finds Good News in Latest Dropout Data," News in Brief, Jan. 7, 2004.
"Dropout Data," Report Roundup, Nov. 19, 2003.
"Texas, Foundation Aim To Curb Dropout Rate," News in Brief, Nov. 19, 2003.
"Graduation-Rate Plans Called All Over the Map," Oct. 1,
Page 1 of 6Education Week: Dropouts - dropouts, graduation rates, GED, at-risk students, accountabi...
3/19/2004http://www.edweek.org/context/topics/issuespage.cfm?id=113

changed little over the past decade, there are great variances among racial and ethnic groups and geographical regions. American-born Hispanics, for example, have the largest dropout rate of any ethnic or racial group, hence, dropout rates in the South and the West tend to be higher than those in the Midwest and Northeast (NCES, 2000). Those findings are reflected in 2001 graduation rates as well. Hispanics had the lowest graduation rate, 52 percent. The graduation rate was 51 percent for African-Americans and 72 percent for whites (Greene & Forster, 2003).
The strongest predictors that a student is likely to drop out are family characteristics such as: socioeconomic status, family structure, family stress (e.g., death, divorce, family moves), and the mother's age. Students who come from low-income families, are the children of single, young, unemployed mothers, or who have experienced high degrees of family stress are more likely than other students to drop out of school. Of those characteristics, low socioeconomic status has been shown to bear the strongest relationship to students' tendency to drop out. In one study, for example, students of lower socioeconomic status had a dropout rate four times higher than that of students of a higher socioeconomic status (Alexander, Entwisle and Kabbani, 2001).
The tendency for students to drop out is also associated with their school experiences. According to the U.S. Department of Education, students drop out of school for the following reasons:
Dislike of school;
Low academic achievement;
Retention at grade level;
A sense that teachers and administrators do not care about students; and
Inability to feel comfortable in a large, depersonalized school setting (1999).
2003.
"Houston Case Offers Lesson on Dropouts," Sept. 24, 2003.
"Houston Escapes Lowered Rating Over Dropout Errors," Sept. 3, 2003.
"Out of School and Unemployed," Commentary, Sept. 3, 2003.
"Houston Faces Questions on Dropout Data," July 9, 2003.
"Reports Spotlight Latino Dropout Rates, College Attendance," June 18, 2003.
"Study: Formulas Yield Widely Varied Graduation Rates," May 21, 2003.
"Accountability Helps Students at Risk," Commentary, April 30, 2003.
"Mariachi Motivation," Feb. 26, 2003.
"Researchers Debate Impact of Tests," Feb. 5, 2003.
Page 2 of 6Education Week: Dropouts - dropouts, graduation rates, GED, at-risk students, accountabi...
3/19/2004http://www.edweek.org/context/topics/issuespage.cfm?id=113
Research indicates that the lower the achievement level, the greater the likelihood that a student will drop out of school. For example, a study of students in Baltimore schools found that low test scoresand report card grades as early as the 1st grade were a reliable predictor of whether or not the students would later drop out (Alexander, Entwisle & Kabbani, 2000).
Grade retention—being "held back" or flunked—has also been found to be highly correlated with dropping out. For example, students who repeat a grade, even as early as kindergarten, significantly increase their chances of dropping out (Kaufman & Bradby, 1992).
According to a 2002 report by the U.S. General Accounting Office, Congress' investigative arm, schools generally approach the dropout problem in three different ways. Schools tend to: provide supplemental services for needy students, offer different learning environments as an alternative to the regular classroom, or institute schoolwide restructuring efforts.
Those supplemental services include tutoring, social services, and counseling. Tutoring programs such as the Coca-Cola Valued Youth Program place older students in tutoring positions with elementary school children. The aim of the program is to increase the self-esteem of youths deemed at risk by placing them in positions of responsibility. A review of the program found that 12 percent of the students in a comparison group dropped out of school, while just 1 percent of the program participants dropped out (Cardenas et al., 1992).
Alternative learning environments come in several forms, each designed to provide struggling students a different path they can take instead of dropping out. Districts may offer alternative classrooms within a traditional school, offering varied programs in a different environment; a school-within-a-school, with specialized education programs; or a magnet
Calculating High School Graduation Rates
The different methods of calculating and reporting dropout rates sometimes generate controversy. For example, a state may report one set of numbers suggesting a low dropout rate; then, a private organization might analyze the statistics using a different measure and accuse the state or school system of underestimating the problem. Here are different ways of calculating dropout rates: Event Rate: This method measures the percentage of young adults ages 15 through 24 who dropped out during the school year preceding the data collection. This annual measure provides important information about how effective educators are in keeping students enrolled in school. The event rate is generally lower than the status rate (see below). Status Rate: This method measures the percentage of young adults ages 16 through 24 who are not enrolled in school and who have not completed a high school diploma or obtained a General Educational Development credential or GED. Status rates reveal the extent of the dropout problem in the population, and are therefore used to estimate the need for further education and training designed to help dropouts participate fully in the economy and broader life of the nation. Cohort Rate: This approach measures what happens to a group of students over a period of time. The rate is based on repeated measures of a cohort of students with shared experiences and reveals how
Page 3 of 6Education Week: Dropouts - dropouts, graduation rates, GED, at-risk students, accountabi...
3/19/2004http://www.edweek.org/context/topics/issuespage.cfm?id=113
Alexander, K., Entwisle, D., and Kabbani, N., "The Dropout Process in Life Course Perspective: Part I, Profiling Risk Factors at Home and School," Baltimore, MD: Johns Hopkins University, 2000.
school, offering a focused curriculum in one or more subject areas (National Dropout Prevention Center).
Partnership at Las Vegas (PAL) is an example of an alternative learning environment. The PAL program embodies the school-within-a-school concept that focuses on academic and career skills. At-risk 11th and 12th graders attend class four days a week and work at nonpaid internships one day a week. In addition to covering the basics, the curriculum focuses the connection between school and work. PAL participants are far less likely than nonparticipants to drop out of school. Two percent of the students who have gone through the PAL program dropped out, while 13.5 percent of thestudents in a comparison group became dropouts (GAO, 2002).
Some districts have restructured entire schools to combat the dropout phenomenon. Schoolwide restructuring usually occurs in schools with a majority of students at risk of dropping out. Under the Talent Development Model, one template for this approach, officials may reorganize the school into smaller learning academies, create standards-based instructional programs, and put more emphasis on professional development. A three-year evaluation of five Talent Development high schools in Philadelphia found that in addition to achievement gains, schools that had implemented the model for two or more years saw their 9th grade attendance rates rise by 15 percent (Philadelphia Education Fund, 2002).
"Career academies," another dropout-prevention strategy, offer career-focused curricula, team teaching, and involvement from the business community. An ongoing, 10-year evaluation of career academies found that, among other results, they significantly cut dropout rates of students at high risk of school failure (Kemple & Snipes, 2000).
Additionally, at the federal level, the School Dropout Prevention Program was authorized by the No Child Left Behind Act of 2001. Its purpose is to provide three-year grants to states and school districts to assist in dropout prevention and school re-entry activities. Grantees must demonstrate the effectiveness of their proposed prevention and re-entry activities, based on scientific research.
—Lisa N. Staresina
many students starting in a specific grade drop out over time. High School Completion Rate: This rate represents the proportion of 18- through 24-year-olds who have left high school and earned a high school diploma or the equivalent, such as a GED credential. Source: U.S. Department of Education, "Dropout Rates in the United States: 2000."
Page 4 of 6Education Week: Dropouts - dropouts, graduation rates, GED, at-risk students, accountabi...
3/19/2004http://www.edweek.org/context/topics/issuespage.cfm?id=113
Alexander, K., Entwisle, D., and Kabbani, N., "The Dropout Process in Life Course Perspective: Early Risk Factors at Home and School," Teachers College Record, 103 (5), 2001.
Cardenas, et al., "The Coca-Cola Valued Youth Program: Dropout Prevention Strategies for At-Risk Students," Texas Researcher, vol. 3, 1992.
Cotton, K., "School Size, School Climate, and Student Performance," Northwest Regional Educational Laboratory, School Improvement Research Series, Close up #20, 1996.
Greene, J.P., and Forster, G., "Public High School Graduation and College Readiness Rates in the United States," Manhattan Institute for Policy Research, September 2003.
Kaufman, P., and Bradby, D., "Characteristics of At-Risk Students in NELS:88," U.S. Department of Education, National Center for Education Statistics (NCES 92-042), 1992.
Kemple, J.J., & Snipes, J.C., "Career Academies: Impact on Students' Engagement and Performance in High School," Manpower Demonstration Research Corp., 2000.
National Dropout Prevention Center/Network, "Alternative Schooling Overview," no date.
Philadelphia Education Fund, "Year Three of the Talent Development High School Initiative in Philadelphia: Results From Five Schools," 2002. (Requires Adobe's Acrobat Reader.)
South Carolina Kids Count, "Young Adults in South Carolina: A Comprehensive Report on the Lives of South Carolinians Ages 18 to 29," 2000.
U.S. Census Bureau, "The Big Payoff: Educational Attainment and Synthetic Estimates of Work Life Earnings," 2002. (Requires Adobe's Acrobat Reader.)
U.S. Department of Education, National Center for Education Statistics "Dropout Rates in the United States: 2000," no date.
U.S. Department of Education, "Taking Responsibility for Ending Social Promotion: A Guide for Educators and State and Local Leaders," 1999.
U.S. General Accounting Office, "School Dropouts: Education Could Play a Stronger Role in Identifying and Disseminating Promising Prevention Strategies" (#GAO-02-240), 2002.
Wirt, J., et al., "The Condition of Education 2003," U.S. Department of Education, National Center for Education Statistics (NCES 2003-067), 2003. (Requires Adobe's Acrobat Reader.)
Woods, E.G., "Reducing the Dropout Rate," Northwest Regional Educational Laboratory, School Improvement Research Series, Close-up #17, 1995.
“Dropouts in America,” is a collection of papers presented at a conference sponsored by The Civil Rights Project and Achieve Inc. in 2001.
"Hispanic Youth Dropping Out of U.S. Schools, Measuring the Challenge," June 2003, from the Pew Hispanic Center, finds that while the Hispanic dropout rate is high in comparison to other ethnic groups, commonly cited dropout rates have been inflated over the years. According to the study, foreign-born Hispanics who have never had contact with the U.S. educational system are included in the calculation
Page 5 of 6Education Week: Dropouts - dropouts, graduation rates, GED, at-risk students, accountabi...
3/19/2004http://www.edweek.org/context/topics/issuespage.cfm?id=113

of Hispanic dropout rates. The report states that the retention of Hispanics in U.S. schools is actually a “manageable challenge.”
The National Dropout Prevention Center/Network serves as a clearinghouse on dropout-related, providing research and resources to policymakers, practitioners, and researchers. The center posts strategies for dropout-reduction. See also The Journal of At-Risk Issues.
The U.S. Department of Education's, School Dropout Prevention Program provides grants for programs aimed at preventing students from dropping out and helping dropouts return to school. See examples of funded programs.
The Coca-Cola Valued Youth Program is a tutoring program that aims to increase the self-esteem of at-risk youths by giving them the opportunity to tutor younger school children.
The Talent Development Model is a school restructuring model aimed at reducing and preventing the occurrence of dropping out. Read a three-year study of Talent Development High Schools in Philadelphia. (Requires Adobe's Acrobat Reader.)
The Houston-based Project GRAD (Graduation Really Achieves Dreams) the philosophy that dropout prevention begins in preschool. View a February 2003 white paper on its approach. (Requires Adobe's Acrobat Reader.)
© 2004 Editorial Projects in Education
advertising | about this site | order special reports | jobs | archives k-12 buyers' guide | privacy policy | feedback | letter to the editor
Page 6 of 6Education Week: Dropouts - dropouts, graduation rates, GED, at-risk students, accountabi...
3/19/2004http://www.edweek.org/context/topics/issuespage.cfm?id=113
Lecturette 1: Evidence of Change
Copyright 2004 NIUSI www.urbanschools.org 1
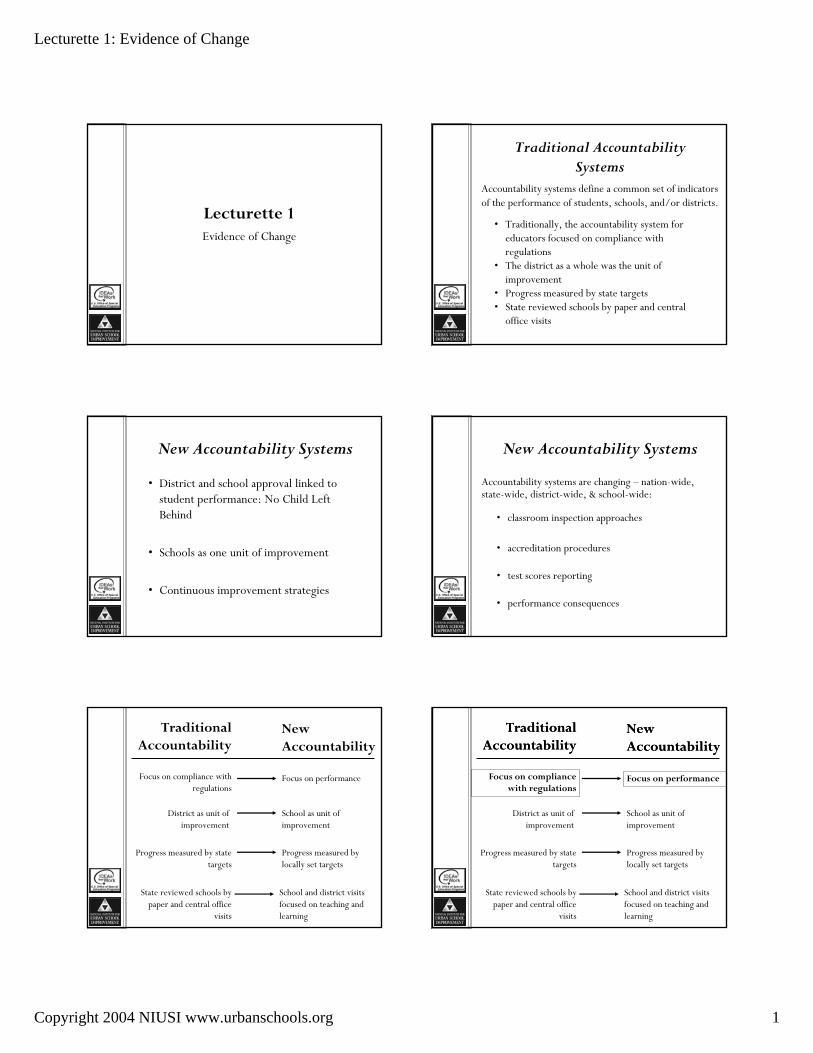
Lecturette 1Evidence of Change
Traditional Accountability Systems
• Traditionally, the accountability system for educators focused on compliance with regulations
• The district as a whole was the unit of improvement
• Progress measured by state targets• State reviewed schools by paper and central
office visits
Accountability systems define a common set of indicators of the performance of students, schools, and/or districts.
New Accountability Systems
• District and school approval linked to student performance: No Child Left Behind
• Schools as one unit of improvement
• Continuous improvement strategies
Accountability systems are changing – nation-wide, state-wide, district-wide, & school-wide:
• classroom inspection approaches
• accreditation procedures
• test scores reporting
• performance consequences
New Accountability Systems
Traditional Accountability
New Accountability
Focus on compliance with regulations
District as unit of improvement
Progress measured by state targets
State reviewed schools by paper and central office
visits
Focus on performance
School as unit of improvement
Progress measured by locally set targets
School and district visits focused on teaching and learning
Traditional Accountability
New Accountability

Lecturette 1: Evidence of Change
Copyright 2004 NIUSI www.urbanschools.org 2
Traditional Accountability
New Accountability
Focus on compliance with regulations
District as unit of improvement
Progress measured by state targets
State reviewed schools by paper and central office
visits
Focus on performance
School as unit of improvement
Progress measured by locally set targets
School and district visits focused on teaching and learning
Traditional Accountability
New Accountability
Traditional Accountability
New Accountability
Focus on compliance with regulations
District as unit of improvement
Progress measured by state targets
State reviewed schools by paper and central
office visits
Focus on performance
School as unit of improvement
Progress measured by locally set targets
School and district visits focused on teaching and learning
Traditional Accountability
New Accountability What are Data?
Data aren’t just test scores. Look around – data are everywhere!
• Data are work that students and teachers do every day.
• Data are tasks that are done at different times during the school year.
• Data are collected to serve specific purposes.
• Data are collected to serve potential uses.
• Data are collected to answer different questions.
Data vs. Evidence
• Facts
• Proof
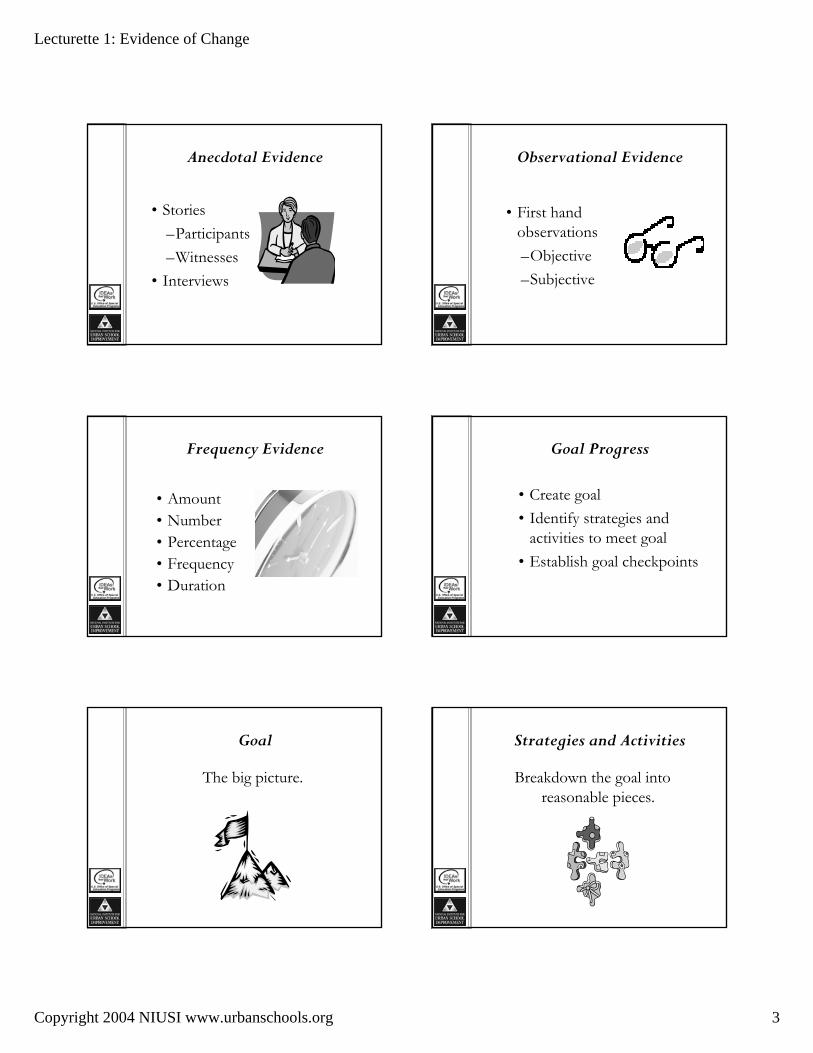
Evidence of change
• Anecdotal evidence
• Observational evidence
• Frequency evidence
Lecturette 1: Evidence of Change
Copyright 2004 NIUSI www.urbanschools.org 3
Anecdotal Evidence
• Stories–Participants–Witnesses
• Interviews
Observational Evidence
• First hand observations–Objective–Subjective
Frequency Evidence
• Amount• Number• Percentage• Frequency• Duration
Goal Progress
• Create goal• Identify strategies and
activities to meet goal• Establish goal checkpoints
Goal
The big picture.
Strategies and Activities
Breakdown the goal into reasonable pieces.

Lecturette 1: Evidence of Change
Copyright 2004 NIUSI www.urbanschools.org 4
Checkpoints
Revisit goal and modify as needed. Questions
© 2004 NIUSI www.urbanschools.org
Module 1: Building Leadership Teams ‐ Academy 3: Aligning School Goals and School Work
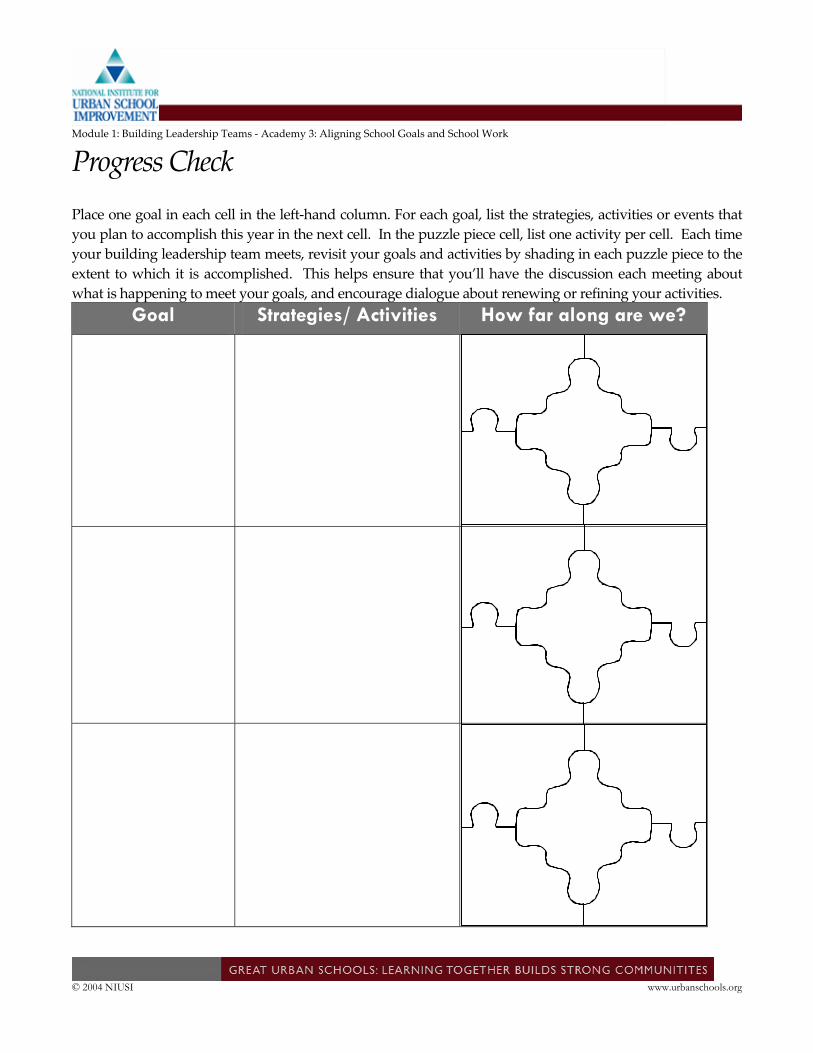
Progress Check Place one goal in each cell in the left‐hand column. For each goal, list the strategies, activities or events that you plan to accomplish this year in the next cell. In the puzzle piece cell, list one activity per cell. Each time your building leadership team meets, revisit your goals and activities by shading in each puzzle piece to the extent to which it is accomplished. This helps ensure that you’ll have the discussion each meeting about what is happening to meet your goals, and encourage dialogue about renewing or refining your activities.
Goal Strategies/ Activities How far along are we?
© 2004 NIUSI www.urbanschools.org
Module 1: Building Leadership Teams ‐ Academy 3: Aligning School Goals and School Work
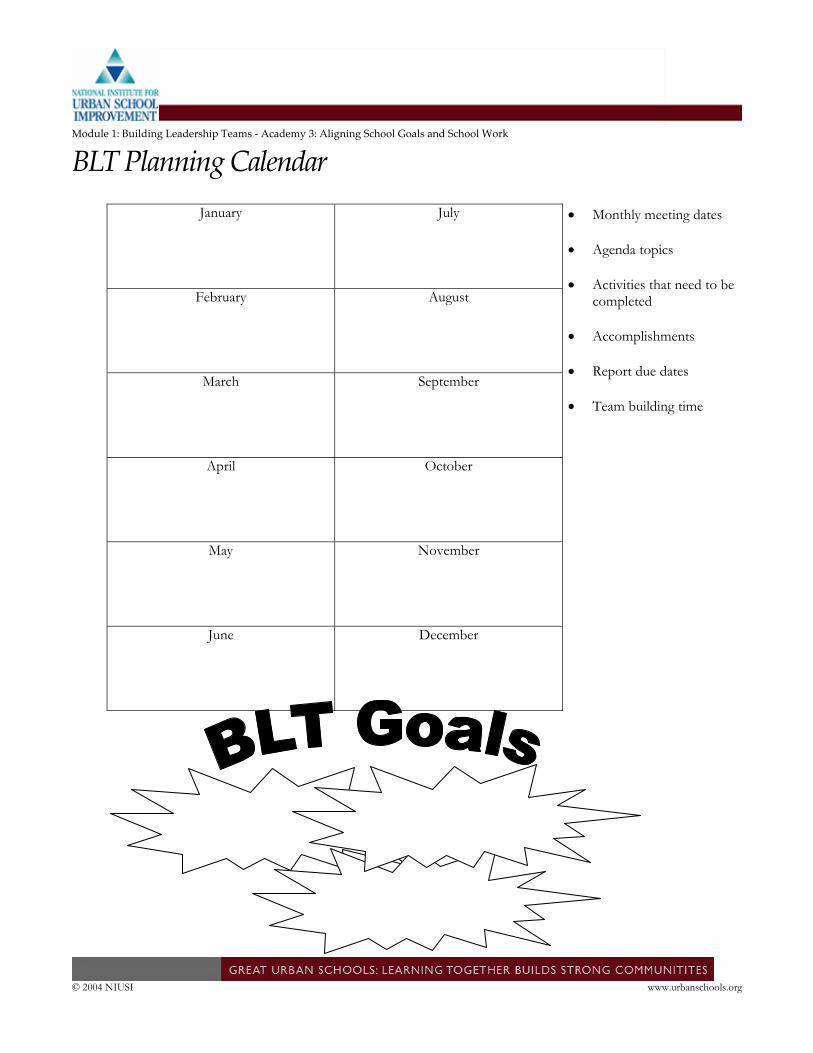
BLT Planning Calendar January July
February August
March September
April October
May November
June December
• Monthly meeting dates
• Agenda topics
• Activities that need to be completed
• Accomplishments
• Report due dates
• Team building time
Lecturette 2: Continuous Improvement
Copyright 2004 NIUSI www.urbanschools.org 1
Lecturette 2Continuous Improvement
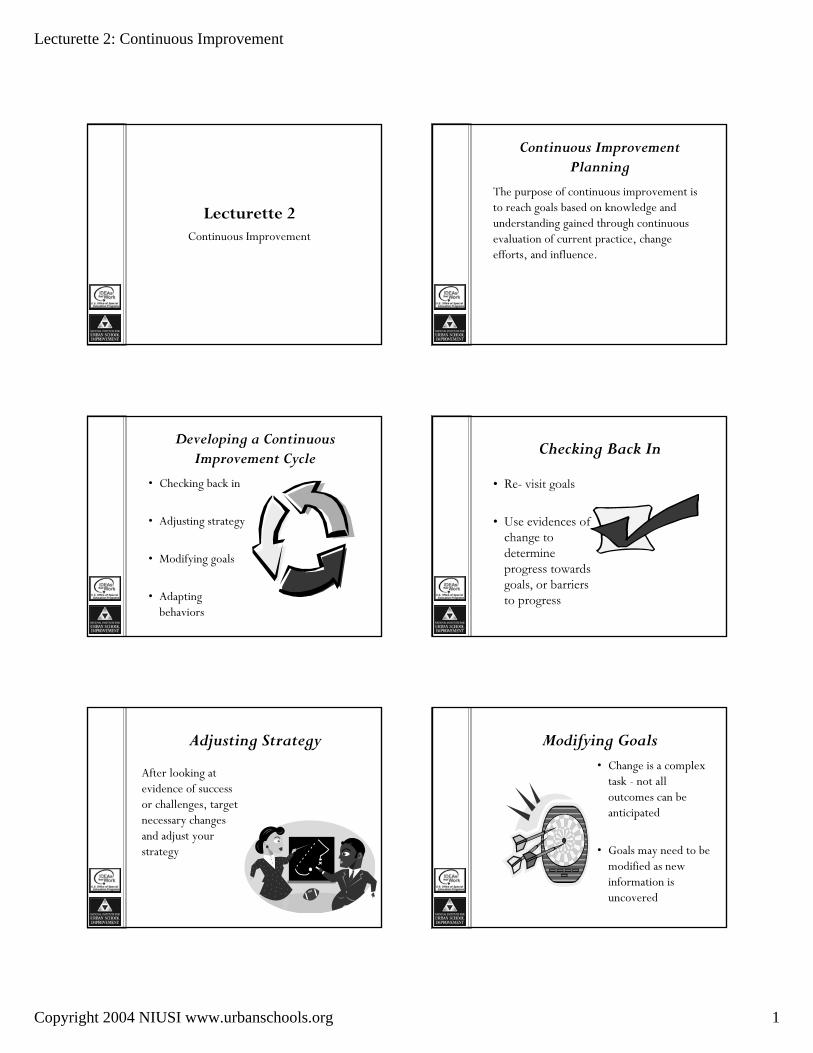
Continuous Improvement Planning
The purpose of continuous improvement is to reach goals based on knowledge and understanding gained through continuous evaluation of current practice, change efforts, and influence.
Developing a Continuous Improvement Cycle
• Checking back in
• Adjusting strategy
• Modifying goals
• Adapting behaviors
Checking Back In
• Re- visit goals
• Use evidences of change to determine progress towards goals, or barriers to progress
After looking at evidence of success or challenges, target necessary changes and adjust your strategy
Adjusting Strategy• Change is a complex
task - not all outcomes can be anticipated
• Goals may need to be modified as new information is uncovered
Modifying Goals
Lecturette 2: Continuous Improvement
Copyright 2004 NIUSI www.urbanschools.org 2
Adapting Behaviors
• Identify what activities have been successful
• Identify those activities that have met with resistance
• Revise action steps to build on successes
Questions

© 2004 NIUSI www.urbanschools.org
Goal Outcomes to Date Roadblocks Next Steps
Module 1: Building Leadership Teams ‐ Academy 3: Aligning School Goals and School Work
Continuous Improvement Planning
© 2004 NIUSI www.urbanschools.org
Module 1: Building Leadership Teams ‐ Academy 3: Aligning School Goals and School Work
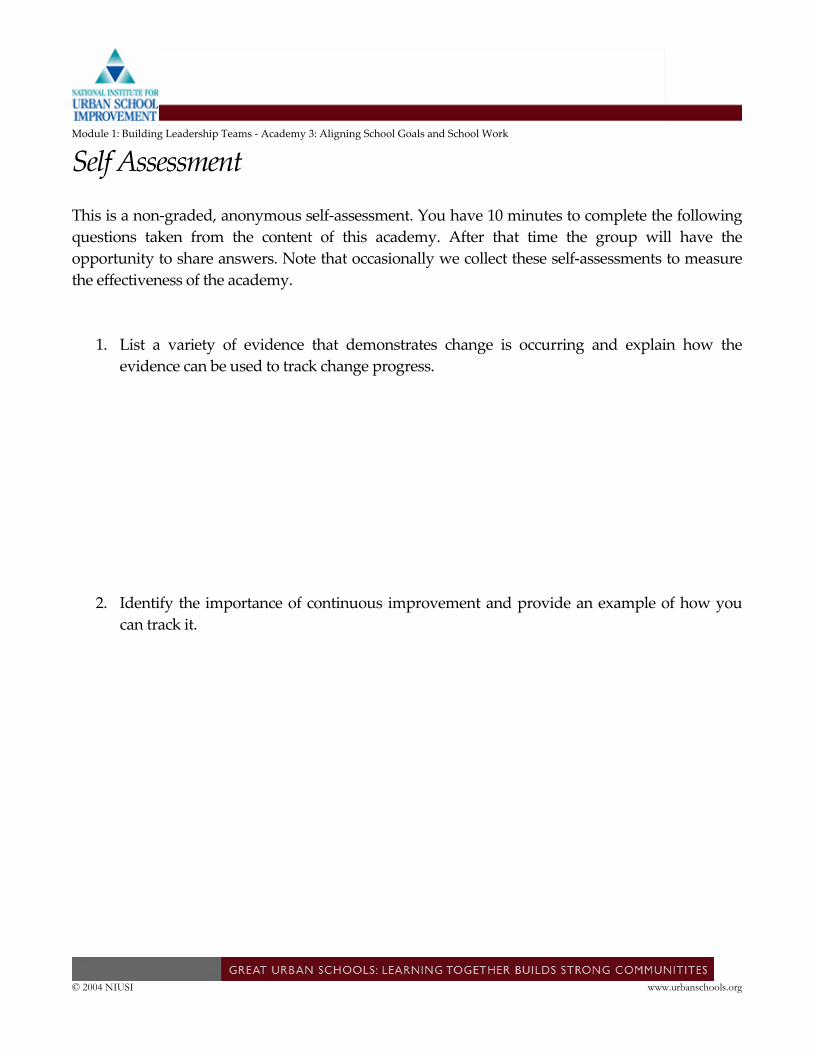
Self Assessment
This is a non‐graded, anonymous self‐assessment. You have 10 minutes to complete the following questions taken from the content of this academy. After that time the group will have the opportunity to share answers. Note that occasionally we collect these self‐assessments to measure the effectiveness of the academy.
1. List a variety of evidence that demonstrates change is occurring and explain how the evidence can be used to track change progress.
2. Identify the importance of continuous improvement and provide an example of how you can track it.
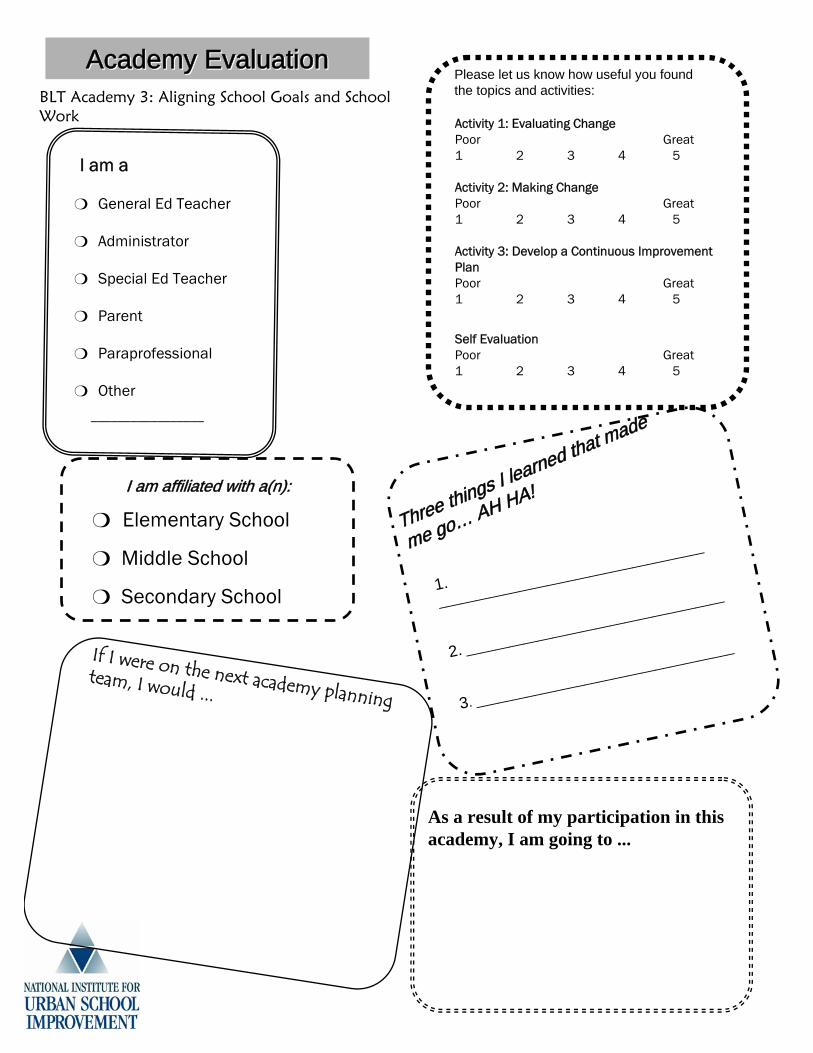
As a result of my participation in this academy, I am going to ...
Academy EvaluationAcademy Evaluation
If I were on the next academy planning team, I would ...
BLT Academy 3: Aligning School Goals and School Work
I am a
General Ed Teacher
Administrator
Special Ed Teacher
Parent
Paraprofessional
Other
_________________
Please let us know how useful you found the topics and activities:
Activity 1: Evaluating ChangePoor Great1 2 3 4 5
Activity 2: Making ChangePoor Great1 2 3 4 5
Activity 3: Develop a Continuous Improvement PlanPoor Great1 2 3 4 5
Self EvaluationPoor Great1 2 3 4 5
I am affiliated with a(n):
Elementary School
Middle School
Secondary School
Three things I learned that made
me go… AH HA!
1._____________________________________
2. ____________________________________
3. ____________________________________

© 2004 NIUSI www.urbanschools.org
3
Resources
Anderson, B. T., Brown, C., & Lopez‐Ferrao, J. (2003). Systemic reform: Good educational practice with positive impacts and unresolved problems and issues. Review of Policy Research, 20(4), 617‐628.
This article describes the National Science Foundationʹs systemic reform programming, including major accomplishments and barriers to systemic reform. The challenges of systemic reform and new directions for education reform are discussed. The focus is on the results and challenges of policies implemented by the systemic initiatives, namely the mandate for the alignment of standards, curriculum, instruction, and assessment with the implementation of a standards‐based K‐12 mathematics and science education program; increased science and mathematics requirements for high school graduation; the delivery of intensive, high‐quality professional development; and improvement in student achievement after three years of funding. A broader view of education reform in the future will require policymakers and educators to pay more attention to formulating mutually supportive policies across education, health, and social services; establishing fiscal policies that provide sufficient funding to ensure equitable outcomes; and revising accountability policies to facilitate rather than impede the reform efforts. Bernhardt, V. L, (1998). Data analysis for comprehensive schoolwide improvement. Larchmont, NY: Eye
on Education. With clear and concrete examples from elementary and high schools, this book helps you effectively gather, analyze, and use data to improve student learning. It demonstrates how to make better decisions, identify root causes of problems, and communicate and report results. Bernhardt, V. L, (2000). Designing and using databases for school improvement. Larchmont, NY:
Eye on Education. Written in a conversational style, Designing and Using Databases provides an easy‐to‐follow guide to help school personnel work through the processes of using data to improve student learning. This book shows you how to design a database that fits your school or district. The advice in this book applies to a wide range of approaches ‐‐ from the simple and inexpensive to the high‐end. Bernhardt, V. L, (1999). The school portfolio. Larchmont, NY: Eye on Education. A school portfolio is the most effective way to ensure your schoolʹs success at systemic reform. Extensively tested, it is a non‐threatening self‐assessment tool which exhibits a schoolʹs goals, achievements, and vision for improvement. This book will show you how to develop a school portfolio tailored to your particular school and vision. Fullan, M. (2001). Leading in a culture of change. San Francisco: Jossey‐Bass.
© 2004 NIUSI www.urbanschools.org
4
Business, nonprofit, and public sector leaders are facing new and daunting challenges‐‐rapid‐paced developments in technology, sudden shifts in the marketplace, and crisis and contention in the public arena. If they are to survive in this chaotic environment, leaders must develop the skills they need to lead effectively no matter how fast the world around them is changing. Leading in a Culture of Change offers new and seasoned leadersʹ insights into the dynamics of change and presents a unique and imaginative approach for navigating the intricacies of the change process. Fullan, M. (2003). Change forces with a vengeance. New York: RoutledgeFalmer. Educators have already taken on board the idea that educational change and school reform are not as easy to accomplish as first expected. In this book, Michael Fullan, arguably one of the worldʹs leading authors on the issue of educational change, explores why this continues to be the case, and builds on the lessons that he set out so clearly in the first two volumes of his trilogy on the subject. This book is concise, accessible and the message contained is clearly written with a broad audience mind both for academics in education and general reader. McLagan, P. A. (2002). Success with change. T + D, 56(12), 44‐53. Summarizes research on how organizations implement change successfully. Focuses on five lessons for implementing and sustaining change: (1) be sure it will add value; (2) match the change process to the challenge; (3) provide management support; (4) prepare the system for change; and (5) help people align. Senge, P. (2000). Schools that learn: A fifth discipline fieldbook for educators, parents, and everyone who
cares about education. New York: Doubleday. One of the great strengths of Schools That Learn is its description of practices that are meeting success across the country and around the world, as schools attempt to learn, grow, and reinvent themselves using the principles of organizational learning. Featuring articles, case studies, and anecdotes from prominent educators such as Howard Gardner, Jay Forrester, and 1999 U.S. Superintendent of the Year Gerry House, as well as from impassioned teachers, administrators, parents, and students, the book offers a wealth of practical tools, anecdotes, and advice that people can use to help schools (and the classrooms in them and communities around them) learn to learn. Squire, K. D. & Reigeluth, C. M. (2000). The many faces of systemic change. Educational Horizons,
78(3), 143‐152. The writers discuss the systems approach to educational reform. They examine the various meanings of the term ʺsystemsʺ and outline the resulting approaches for the improvement of education. Suggestions for avoiding the confusion that surrounds much of the current debate on the topic of systemic change in education are provided. Tosti, D. T. (2000). Systemic change. Performance Improvement, 39(3), 53‐59.

© 2004 NIUSI www.urbanschools.org
5
Examines three factors contributing to organizational success: use of a systemic model to design and guide the change effort; analysis of interdependencies within the system and of the change potential; and use of communication methods to help ensure that the change will be supported. Presents characteristics of successful change efforts with related questions that are typically asked about a change.