building geospatial mashups to visualize information for ... · building geospatial mashups to...
TRANSCRIPT
Building Geospatial Mashups to Visualize Information for Crisis Management
Shubham Gupta and Craig A. Knoblock
University of Southern California
1
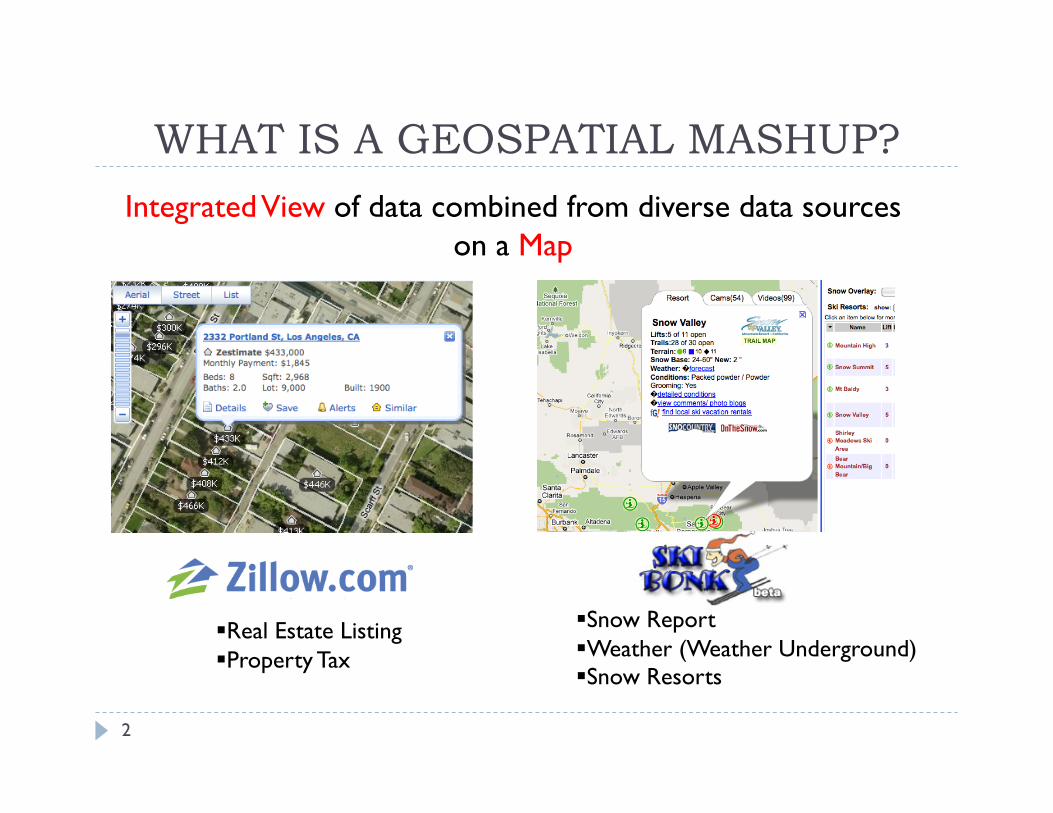
WHAT IS A GEOSPATIAL MASHUP?
Integrated View of data combined from diverse data sources on a Map
Real Estate Listing Property Tax
Snow Report Weather (Weather Underground) Snow Resorts
2
MOTIVATION: CRISIS MANAGEMENT Characteristics of decision-making in such scenarios:
Employs multiple data sources with heterogeneous data access and data representation types
Takes place in time-sensitive environment: Every decision has to be taken promptly
Various data visualization techniques are used such as graphs, timeline charts, etc. to understand the data better
3
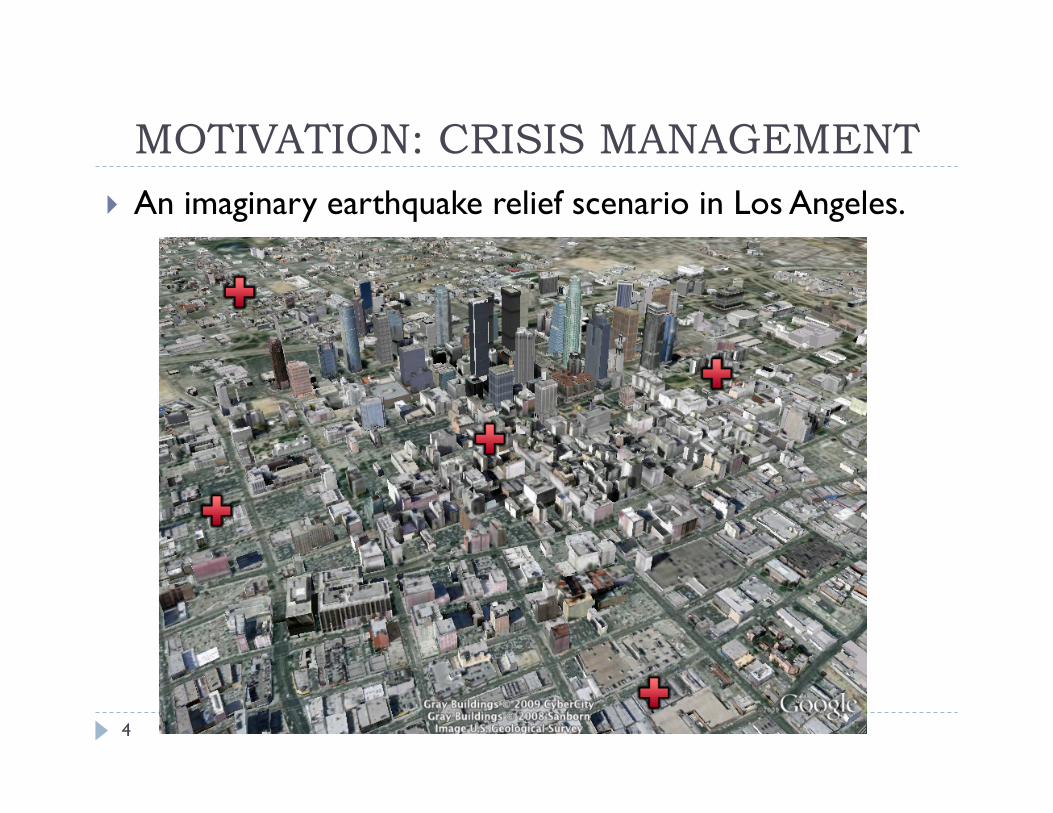
MOTIVATION: CRISIS MANAGEMENT An imaginary earthquake relief scenario in Los Angeles.
4
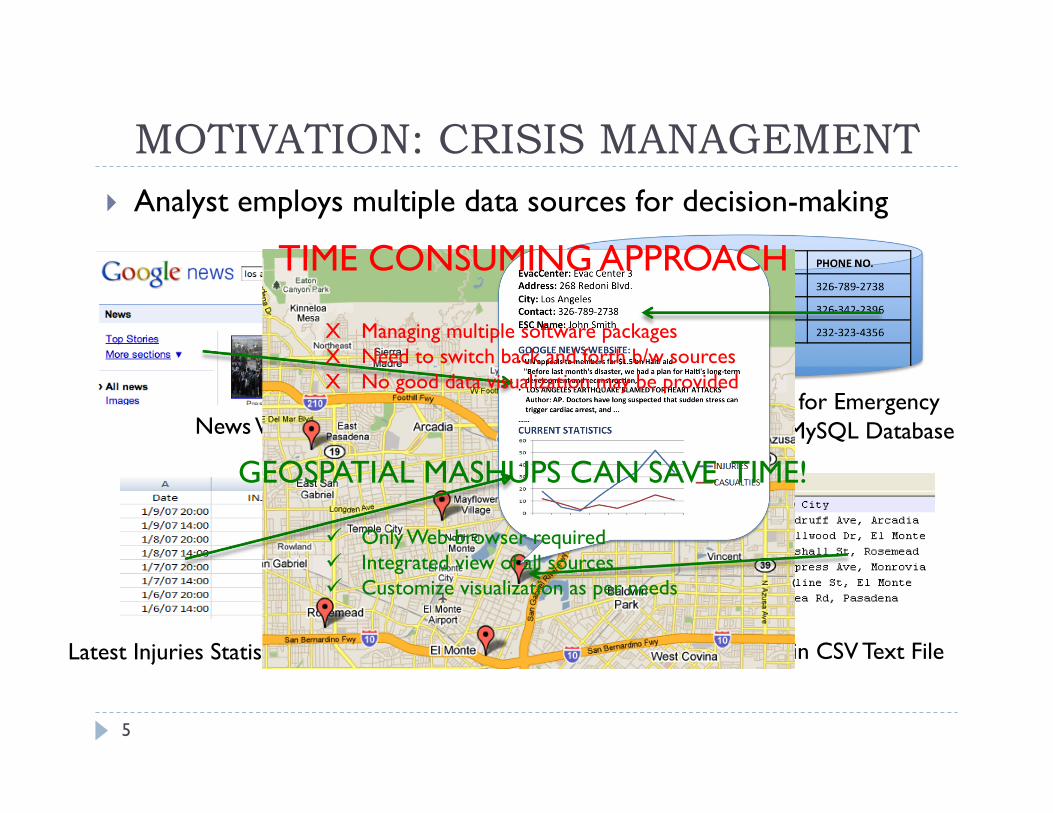
MOTIVATION: CRISIS MANAGEMENT Analyst employs multiple data sources for decision-making
Evacuation Centers List in CSV Text File Latest Injuries Statistics in Excel Spreadsheet
News Website Contact Information for Emergency
Coordinators from a MySQL Database
GEOSPATIAL MASHUPS CAN SAVE TIME!
TIME CONSUMING APPROACH
X Managing multiple software packages X Need to switch back and forth b/w sources X No good data visualization may be provided
Only Web-browser required Integrated view of all sources Customize visualization as per needs
5
MAP
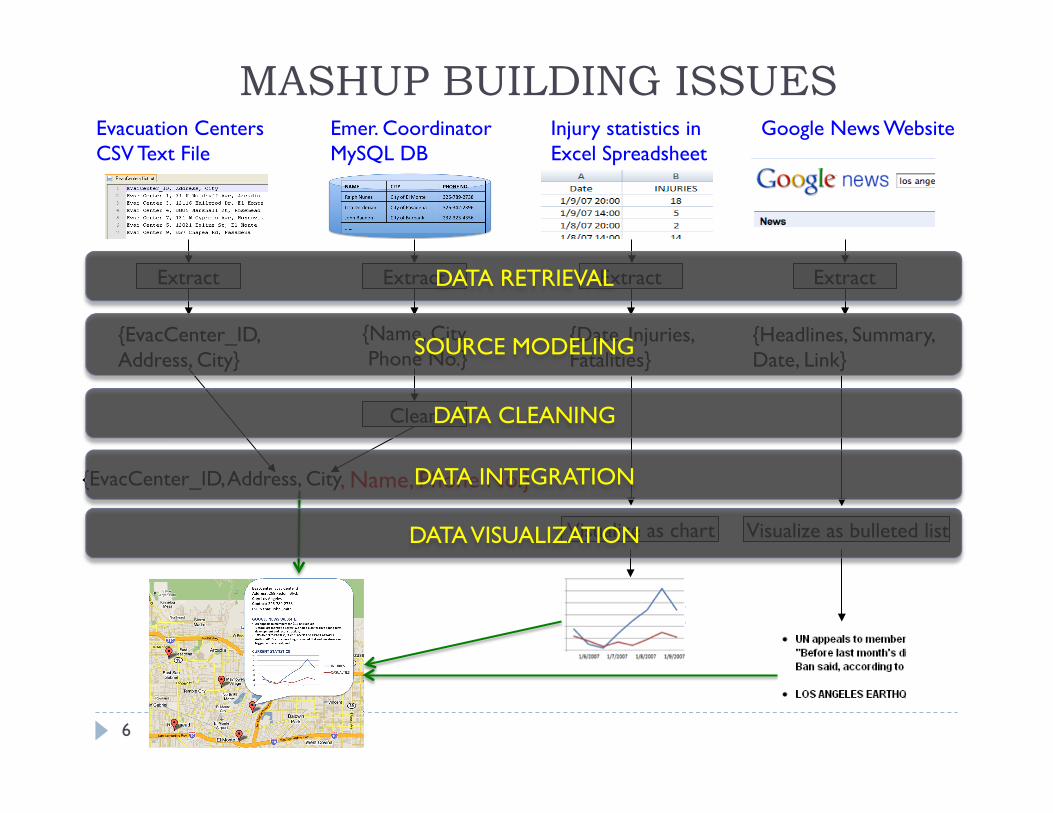
Extract
{Name, City, Phone No.}
Clean
Emer. Coordinator MySQL DB
, Name, Phone No.}
{Date, Injuries, Fatalities}
Injury statistics in Excel Spreadsheet
Extract
Visualize as chart
{EvacCenter_ID, Address, City
{EvacCenter_ID, Address, City}
Extract
Evacuation Centers CSV Text File
{Headlines, Summary, Date, Link}
Google News Website
Visualize as bulleted list
Extract DATA RETRIEVAL
SOURCE MODELING
DATA CLEANING
DATA INTEGRATION
DATA VISUALIZATION
MASHUP BUILDING ISSUES
6
EXISTING APPROACHES
7
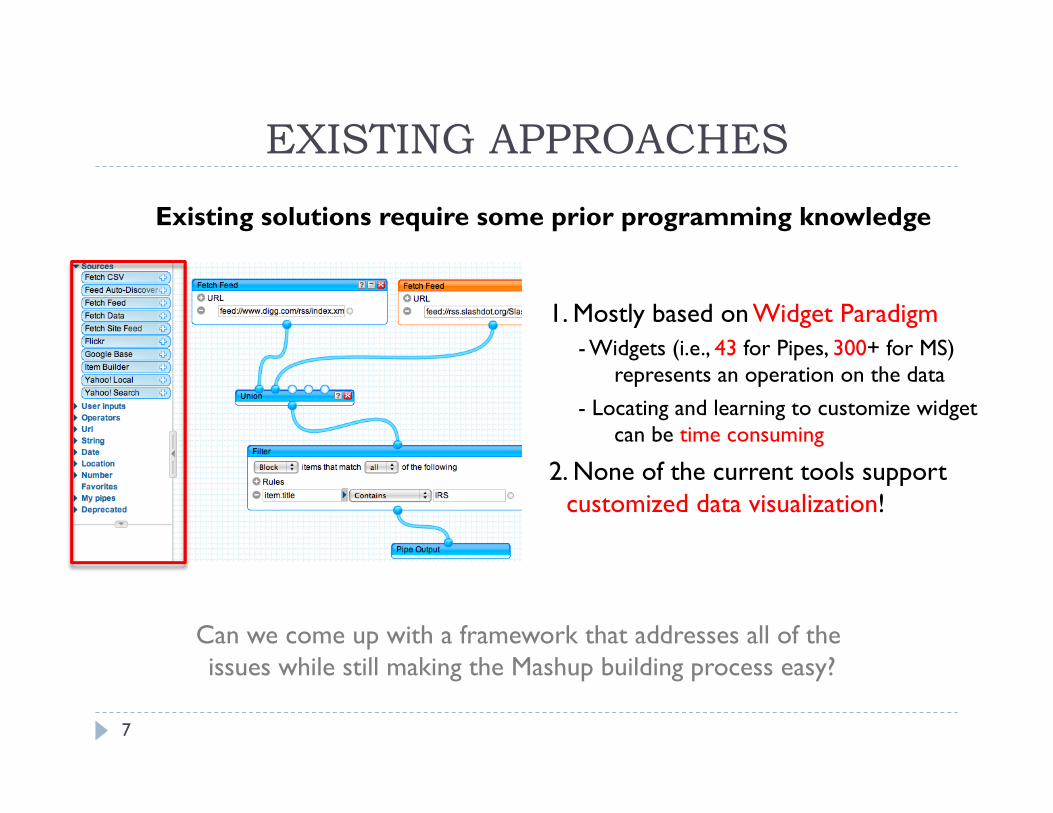
Existing solutions require some prior programming knowledge
1. Mostly based on Widget Paradigm - Widgets (i.e., 43 for Pipes, 300+ for MS)
represents an operation on the data - Locating and learning to customize widget
can be time consuming
2. None of the current tools support customized data visualization!
Can we come up with a framework that addresses all of the issues while still making the Mashup building process easy?
OUR APPROACH
8
In our earlier work, we introduced Programming-by-Demonstration approach to Mashup building. Does not require any programming or widget knowledge. Enables user to create a mashup by simply demonstrating the
system on one or more concrete example.
We present a Programming by Demonstration approach to support customized Data Visualization.
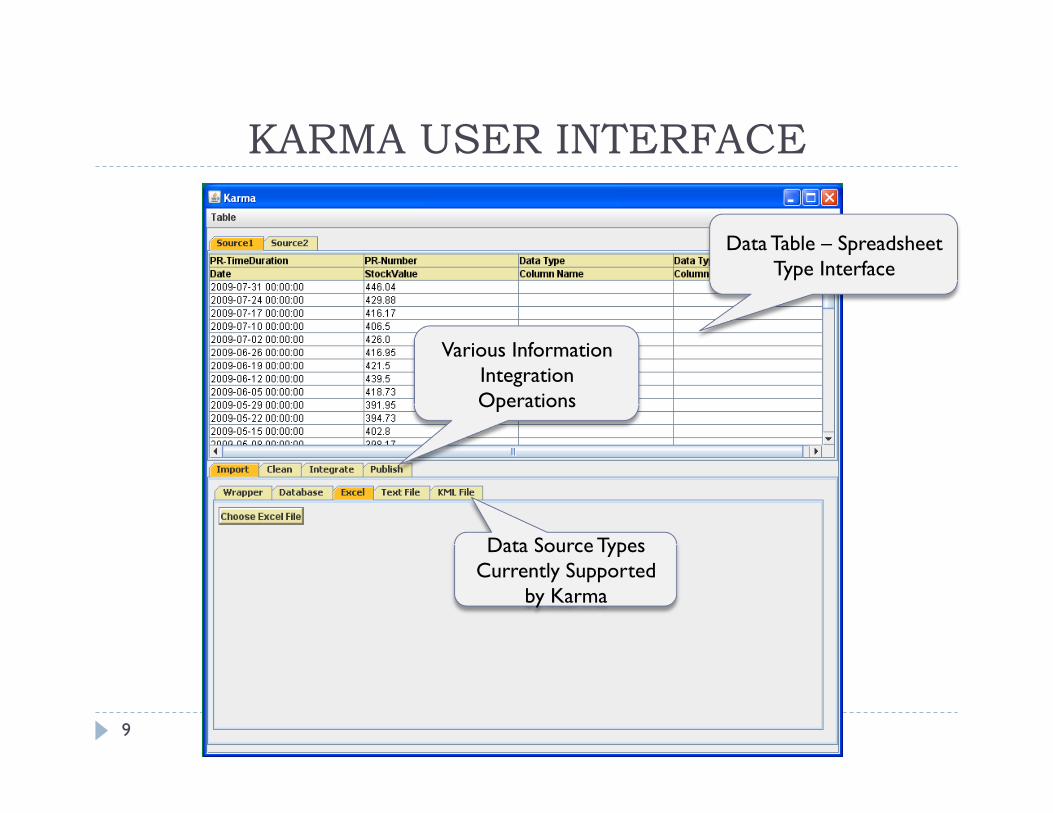
KARMA USER INTERFACE
9
Data Source Types Currently Supported
by Karma
Various Information Integration Operations
Data Table – Spreadsheet Type Interface
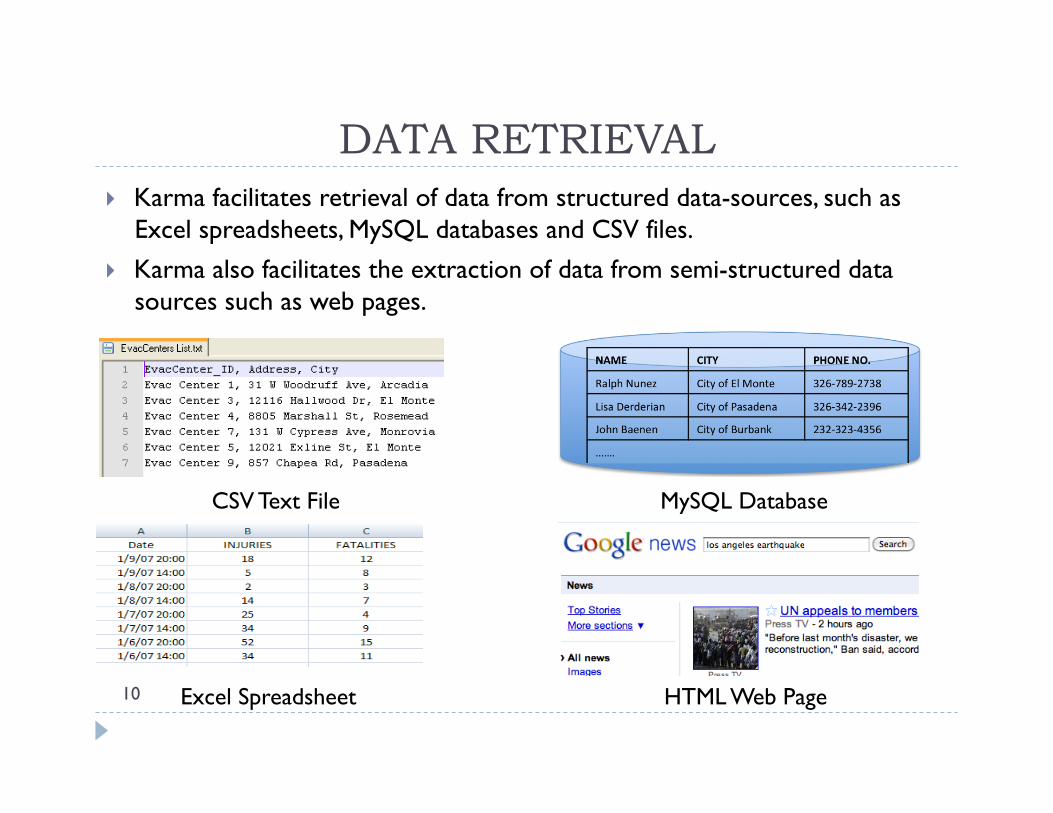
DATA RETRIEVAL Karma facilitates retrieval of data from structured data-sources, such as
Excel spreadsheets, MySQL databases and CSV files. Karma also facilitates the extraction of data from semi-structured data
sources such as web pages.
CSV Text File MySQL Database
Excel Spreadsheet HTML Web Page 10
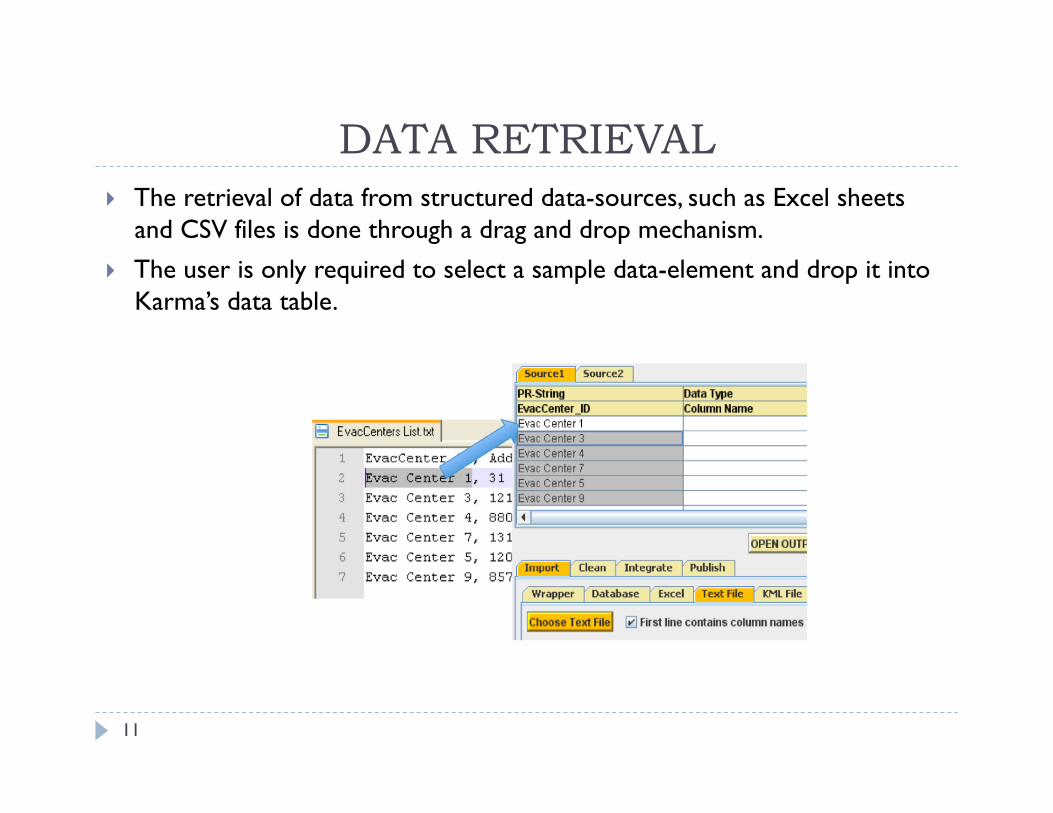
DATA RETRIEVAL The retrieval of data from structured data-sources, such as Excel sheets
and CSV files is done through a drag and drop mechanism. The user is only required to select a sample data-element and drop it into
Karma’s data table.
11
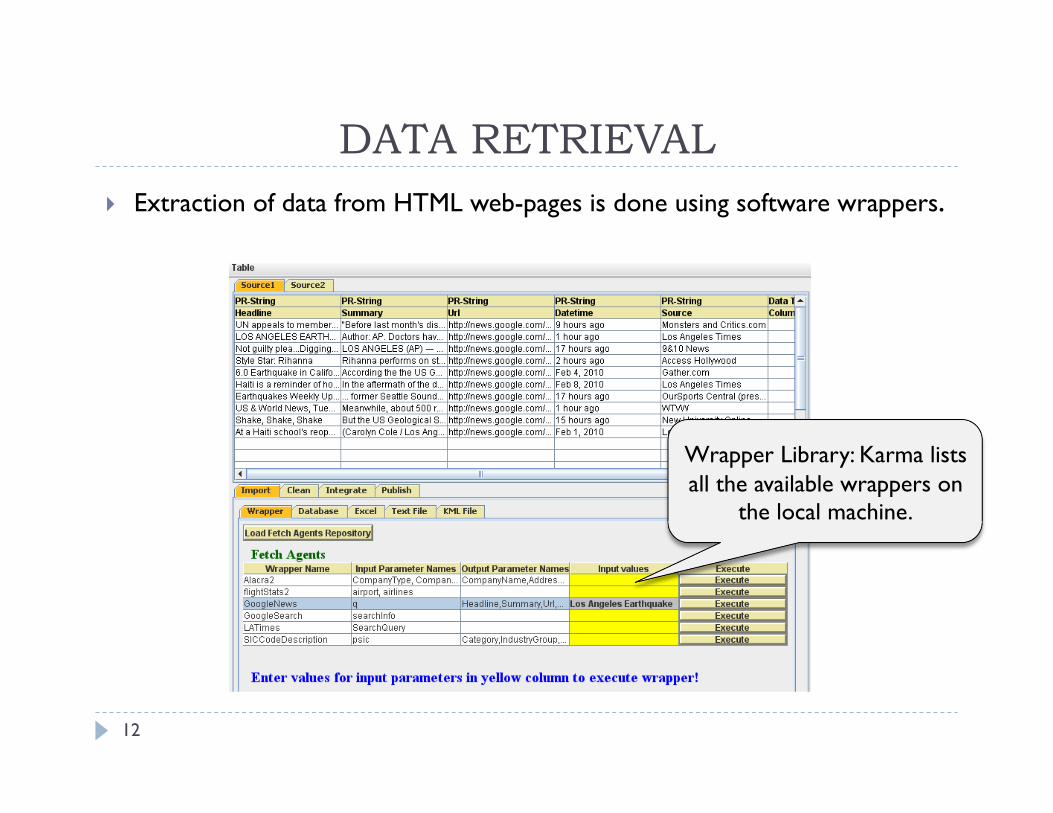
DATA RETRIEVAL Extraction of data from HTML web-pages is done using software wrappers.
Wrapper Library: Karma lists all the available wrappers on
the local machine.
12
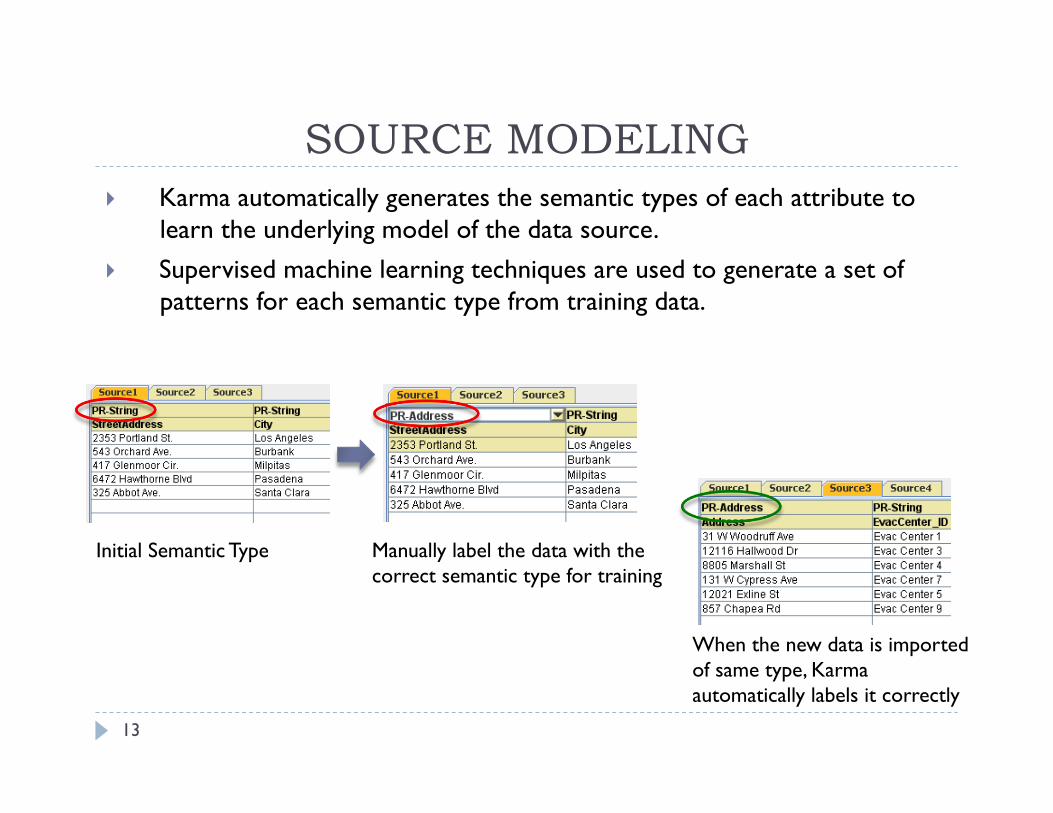
SOURCE MODELING Karma automatically generates the semantic types of each attribute to
learn the underlying model of the data source. Supervised machine learning techniques are used to generate a set of
patterns for each semantic type from training data.
Initial Semantic Type Manually label the data with the correct semantic type for training
When the new data is imported of same type, Karma automatically labels it correctly
13
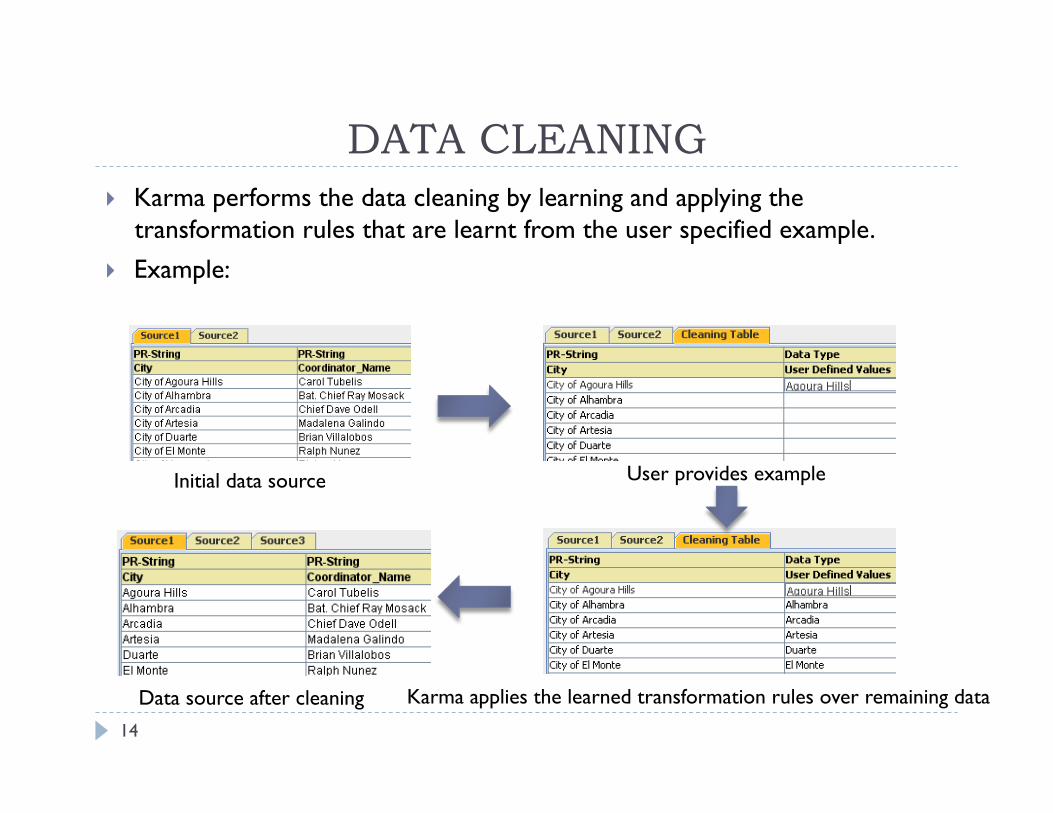
DATA CLEANING Karma performs the data cleaning by learning and applying the
transformation rules that are learnt from the user specified example. Example:
Initial data source User provides example
Karma applies the learned transformation rules over remaining data Data source after cleaning
14
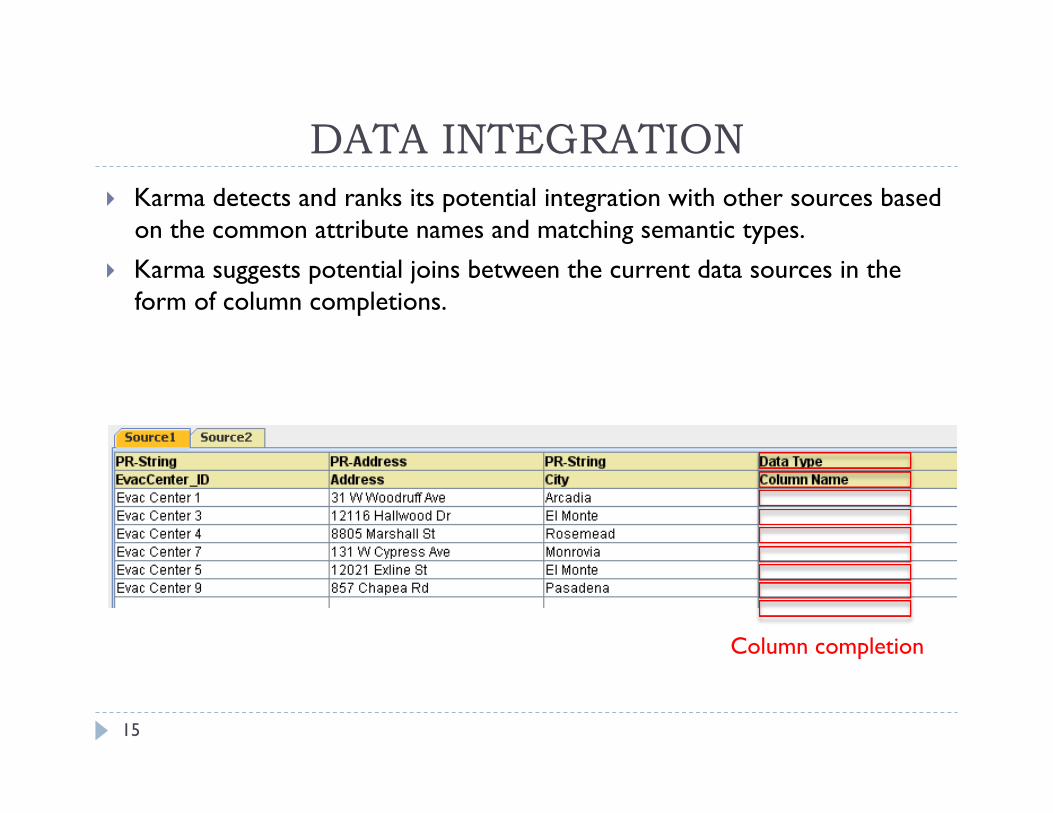
DATA INTEGRATION Karma detects and ranks its potential integration with other sources based
on the common attribute names and matching semantic types. Karma suggests potential joins between the current data sources in the
form of column completions.
15
Column completion
DATA INTEGRATION
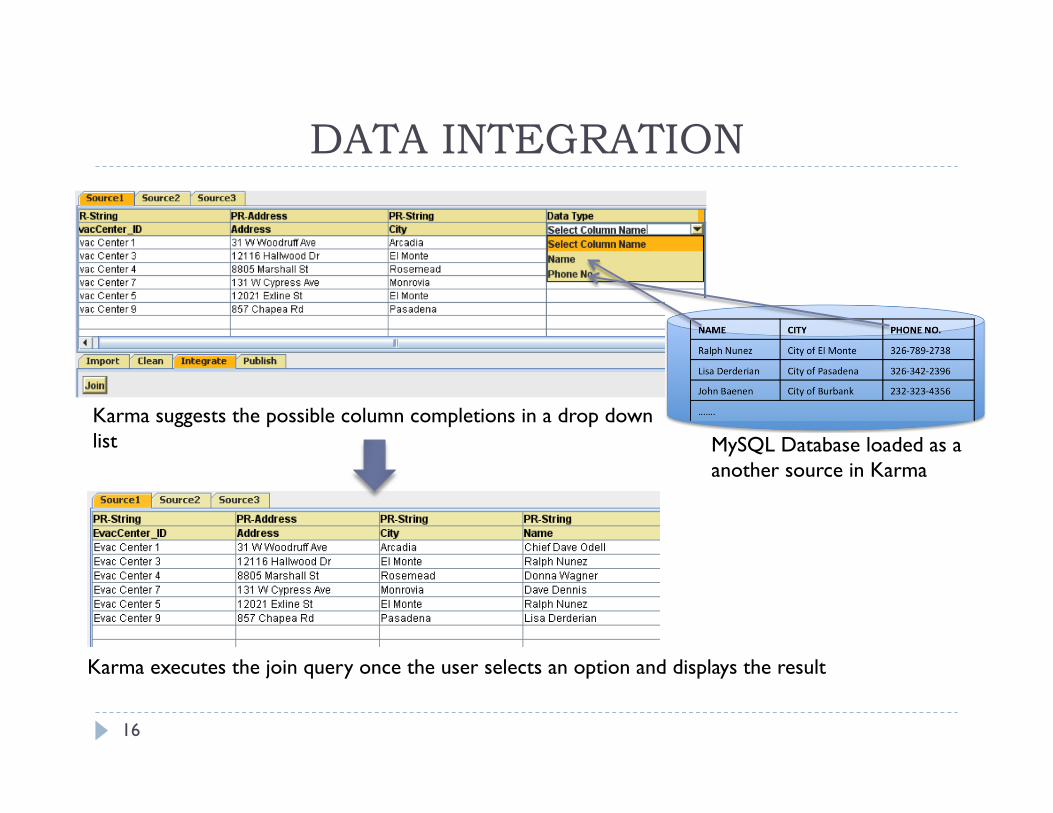
MySQL Database loaded as a another source in Karma
Karma suggests the possible column completions in a drop down list
Karma executes the join query once the user selects an option and displays the result
16
DATA VISUALIZATION
17
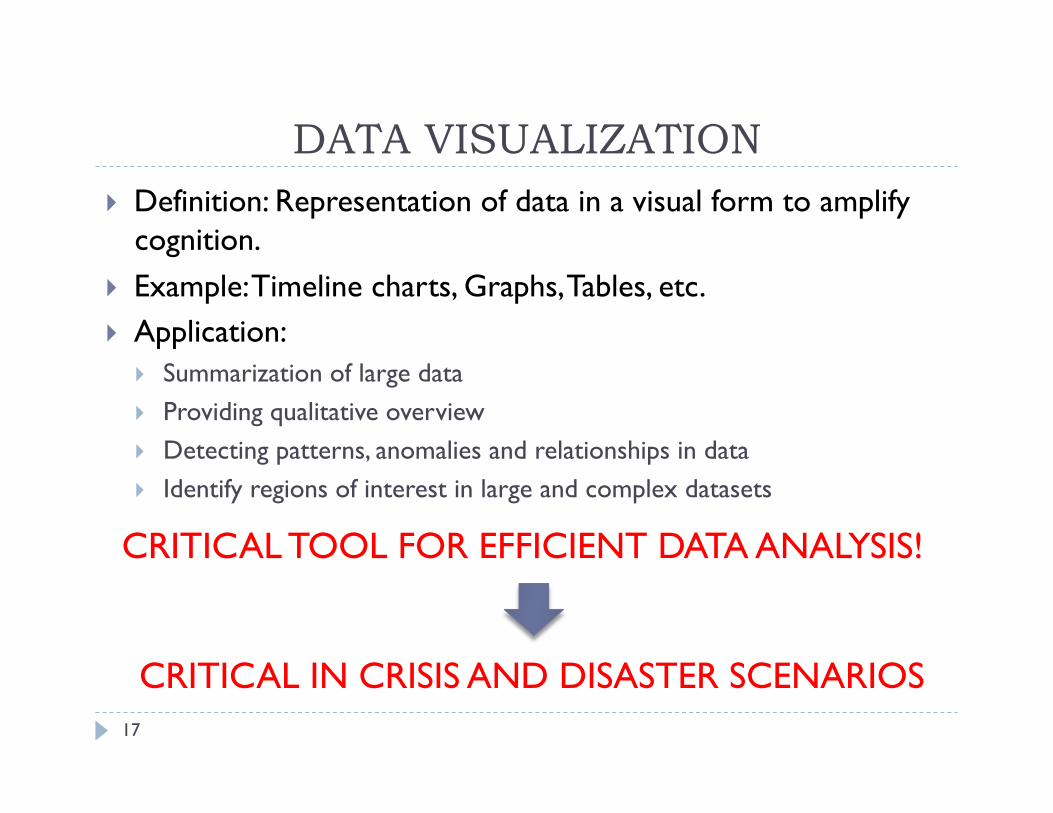
Definition: Representation of data in a visual form to amplify cognition.
Example: Timeline charts, Graphs, Tables, etc. Application:
Summarization of large data Providing qualitative overview Detecting patterns, anomalies and relationships in data Identify regions of interest in large and complex datasets
CRITICAL TOOL FOR EFFICIENT DATA ANALYSIS!
CRITICAL IN CRISIS AND DISASTER SCENARIOS
DATA VISUALIZATION
18
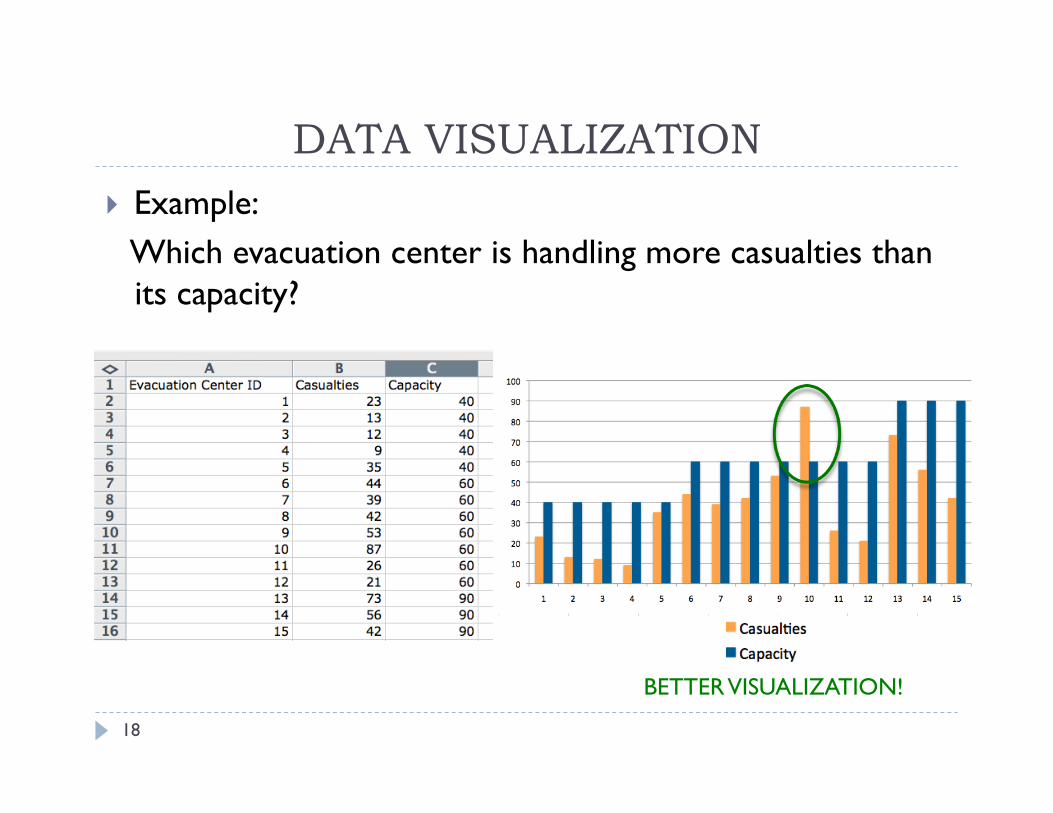
Example: Which evacuation center is handling more casualties than its capacity?
BETTER VISUALIZATION!
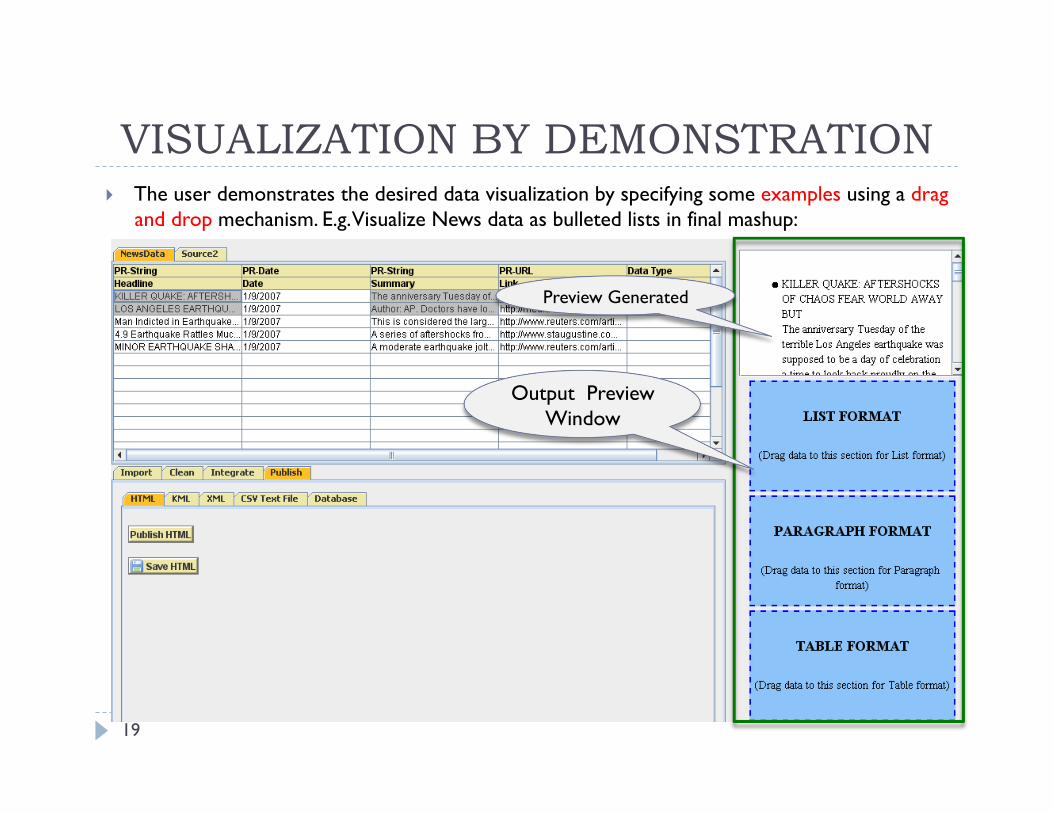
VISUALIZATION BY DEMONSTRATION The user demonstrates the desired data visualization by specifying some examples using a drag
and drop mechanism. E.g. Visualize News data as bulleted lists in final mashup:
19
Output Preview Window
Preview Generated
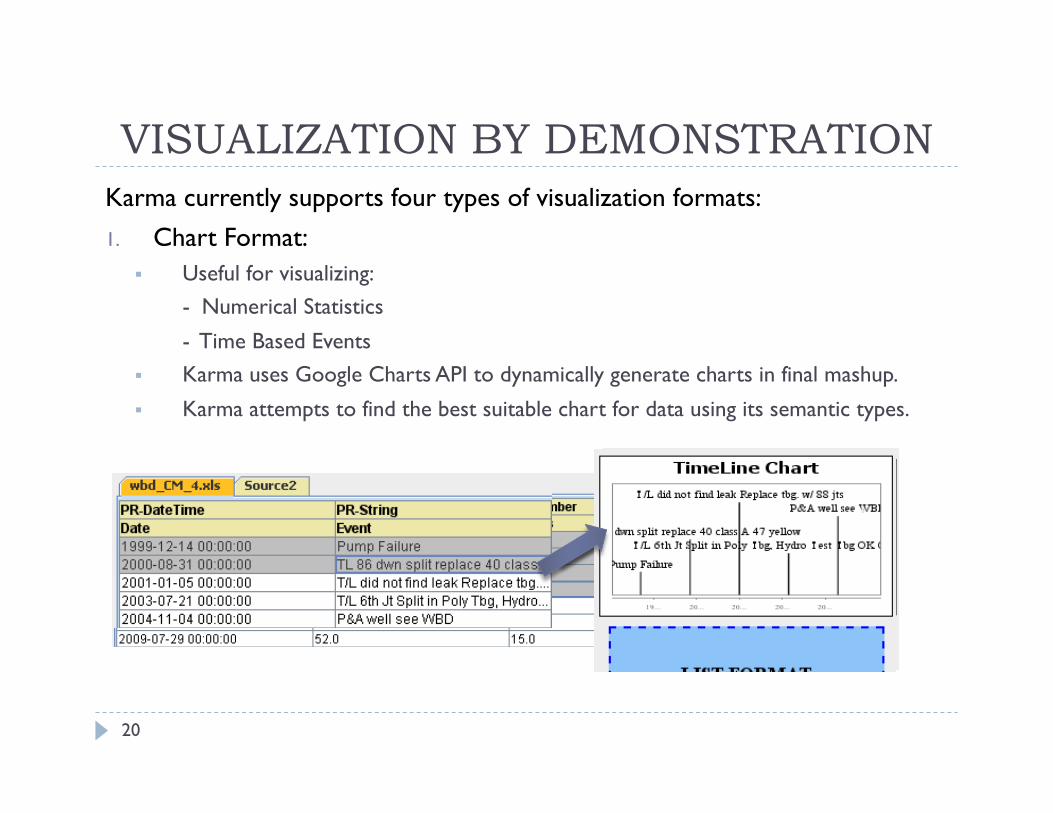
VISUALIZATION BY DEMONSTRATION Karma currently supports four types of visualization formats: 1. Chart Format:
Useful for visualizing: - Numerical Statistics
- Time Based Events Karma uses Google Charts API to dynamically generate charts in final mashup.
Karma attempts to find the best suitable chart for data using its semantic types.
20
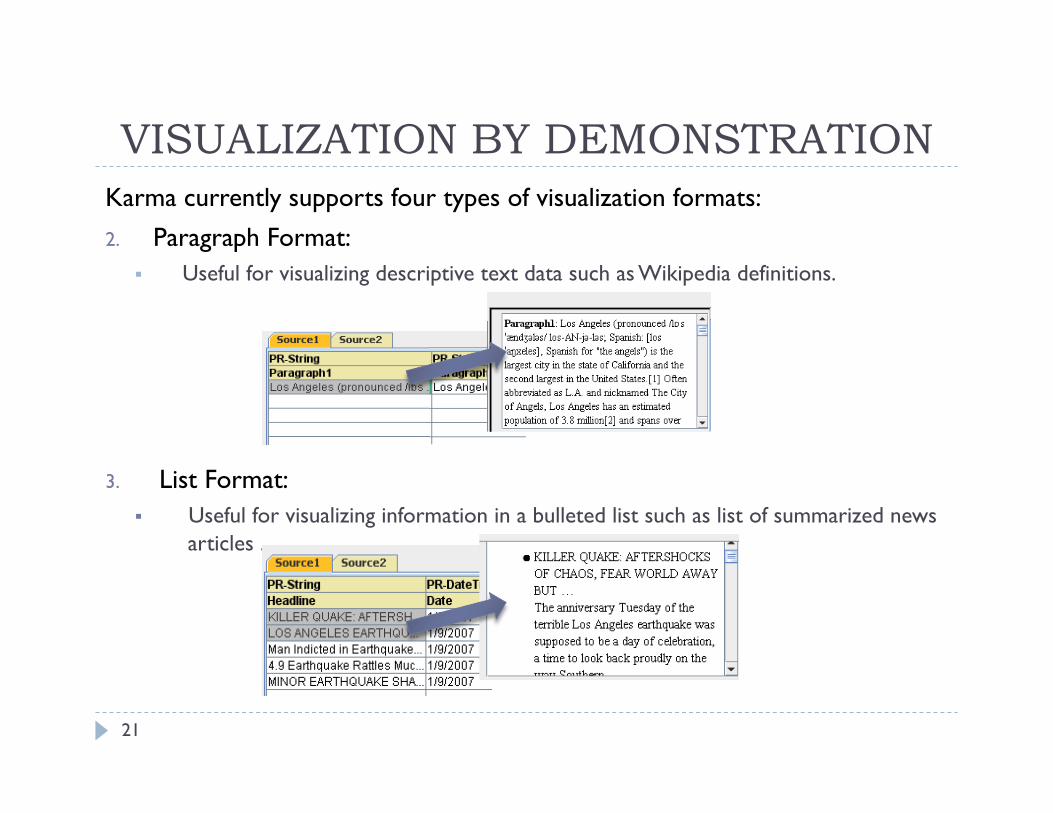
VISUALIZATION BY DEMONSTRATION Karma currently supports four types of visualization formats: 2. Paragraph Format:
Useful for visualizing descriptive text data such as Wikipedia definitions.
3. List Format: Useful for visualizing information in a bulleted list such as list of summarized news
articles .
21
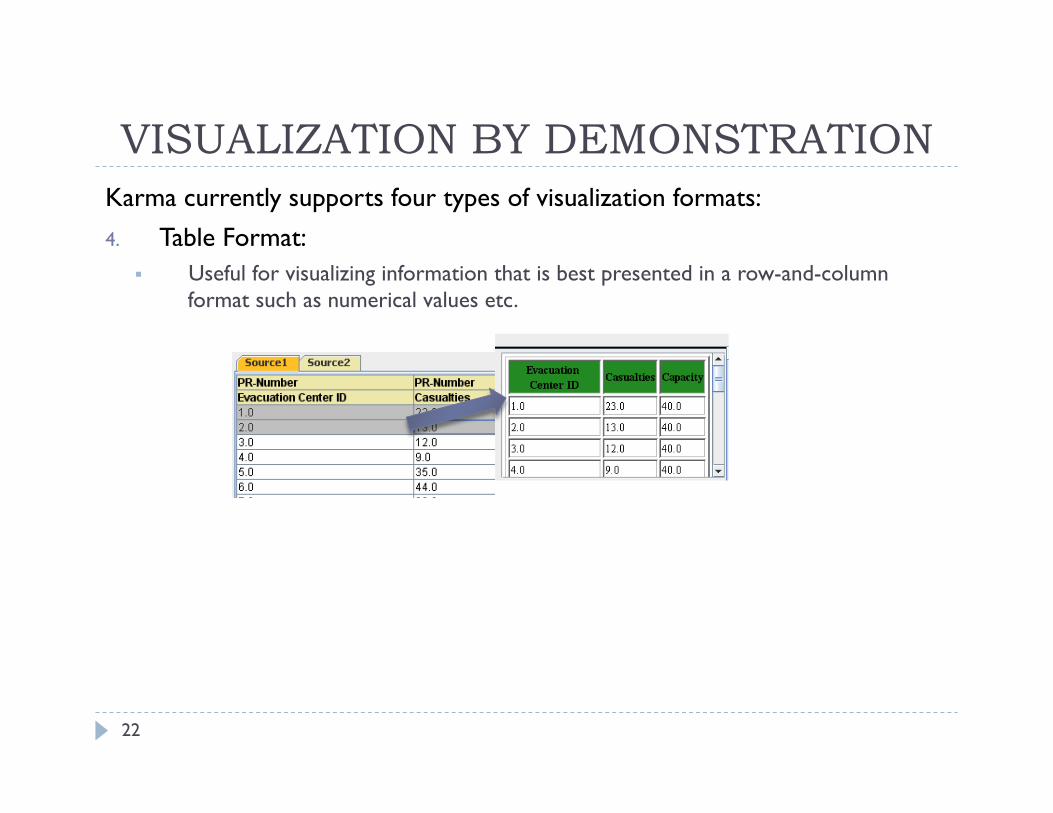
VISUALIZATION BY DEMONSTRATION Karma currently supports four types of visualization formats: 4. Table Format:
Useful for visualizing information that is best presented in a row-and-column format such as numerical values etc.
22
RESULTS CAN BE PUBLISHED IN MULTIPLE FORMATS
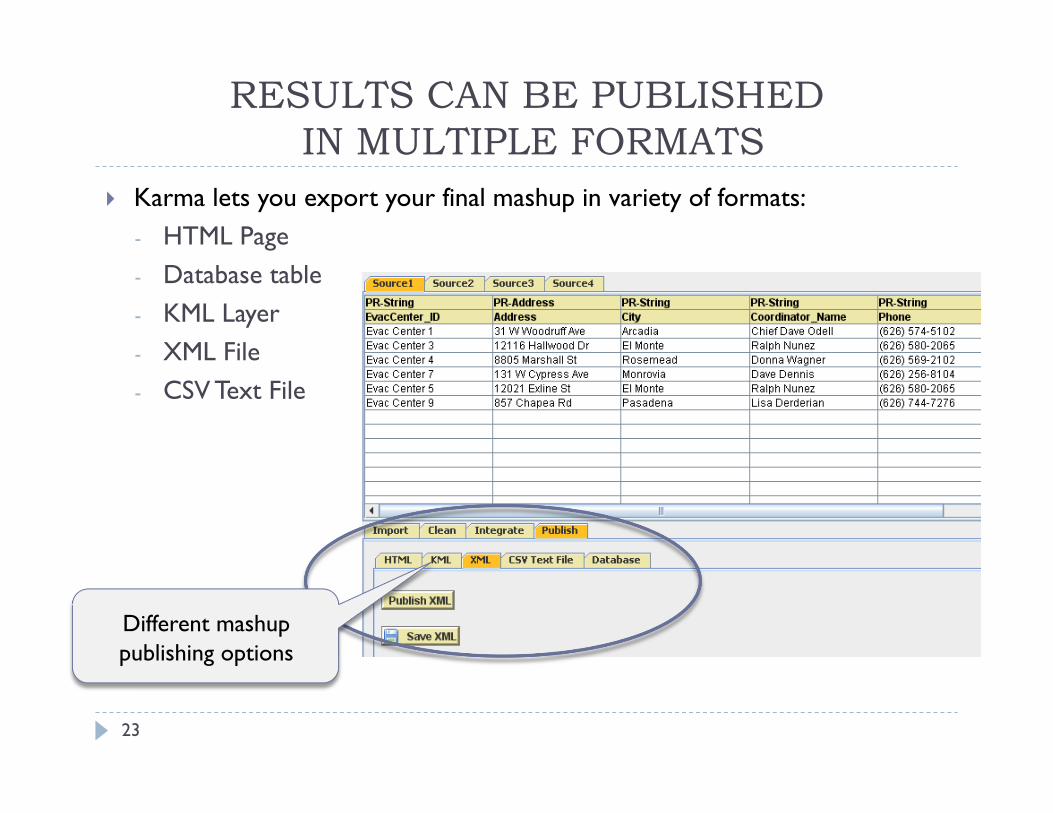
Karma lets you export your final mashup in variety of formats: - HTML Page - Database table - KML Layer - XML File - CSV Text File
Different mashup publishing options
23
AUTOMATICALLY FINDS GEOSPATIAL REFERENCES
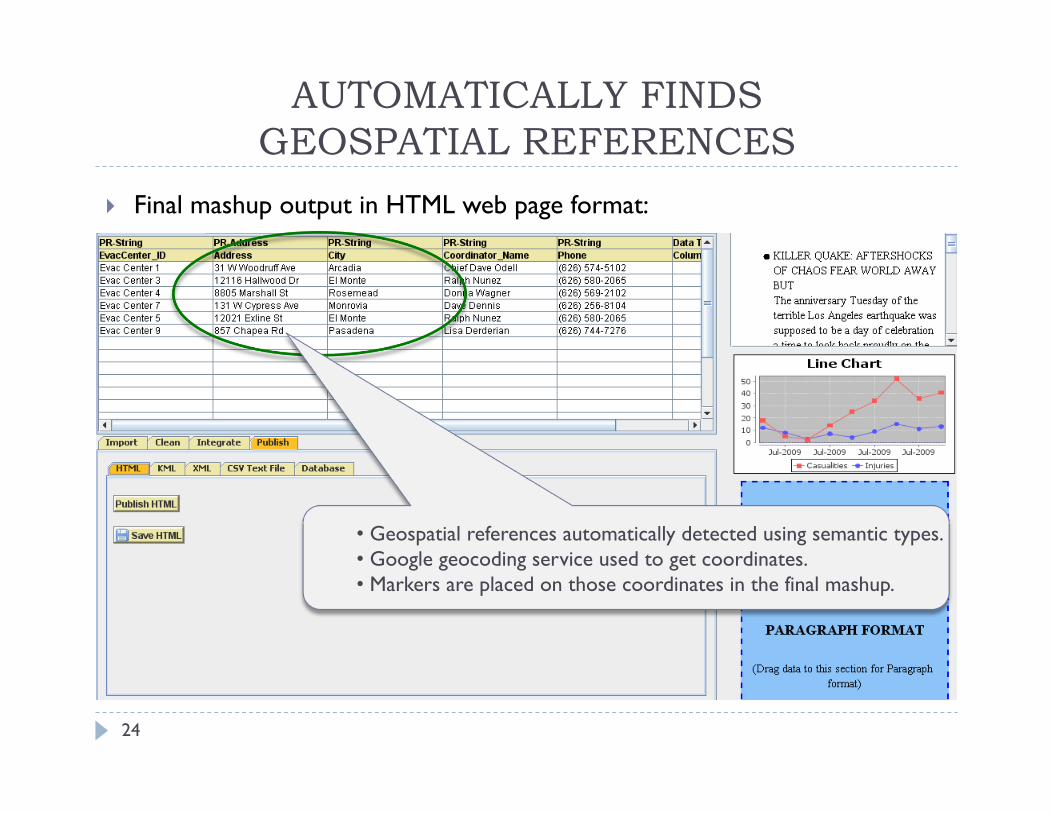
Final mashup output in HTML web page format:
• Geospatial references automatically detected using semantic types. • Google geocoding service used to get coordinates. • Markers are placed on those coordinates in the final mashup.
24
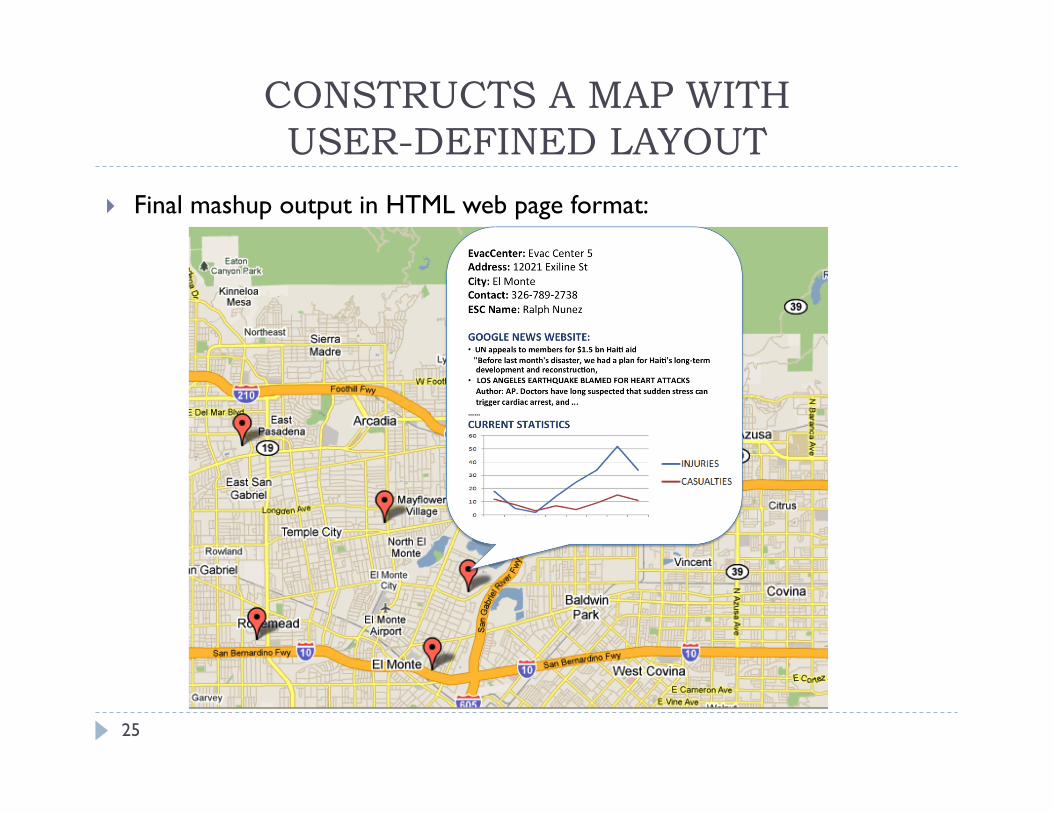
CONSTRUCTS A MAP WITH USER-DEFINED LAYOUT
Final mashup output in HTML web page format:
25
RELATED WORK
26
Existing and Past mashup building tools:
Lot of research has been done on data visualization, esp. within data mining and knowledge discovery communities. Improved Sammon algorithm for visualizing sparse data [Martin et al. 2004]. Interactive High dimensional data visualization [Buja et al. 1996]
None of the current (or past) mashup building tools support customized data visualization in the final mashup output.
CONCLUSION
27
Geospatial Mashups can be instrumental for efficient and judicious decision-making in crisis management.
Visualization By Demonstration approach lets the user customize the mashup output without any programming.
Users can now construct a mashup in one seamless integrated process including data visualization.
FUTURE WORK
28
Integrate more visualization formats such as scatter plots, 2D/3D isosurfaces, etc.
Provide the ability to save the plans for extracting and integrating the data so that they can be applied to the new data.
Provide the ability to support dynamic view of data (to reflect the changes made to data in the mashup).
Support the integration of geospatial data in mashups (i.e., vector layers, raster layers).
THANK YOU!
29
Any Questions? Comments?