budget retreat agenda - addison, texasaddisontexas.net/ckeditorfiles/files/forms/budgets/2018...
TRANSCRIPT
Budget Retreat Agenda
• General Fund Presentation
• Special Revenue Funds Presentation
• Internal Service Funds Presentation
• Enterprise Funds Presentation
• Capital Improvement Program Budget Presentation
• Infrastructure Investment Fund Presentation
• Long Range Financial Plan
• Other FY 2018 Budget Related Discussion
1
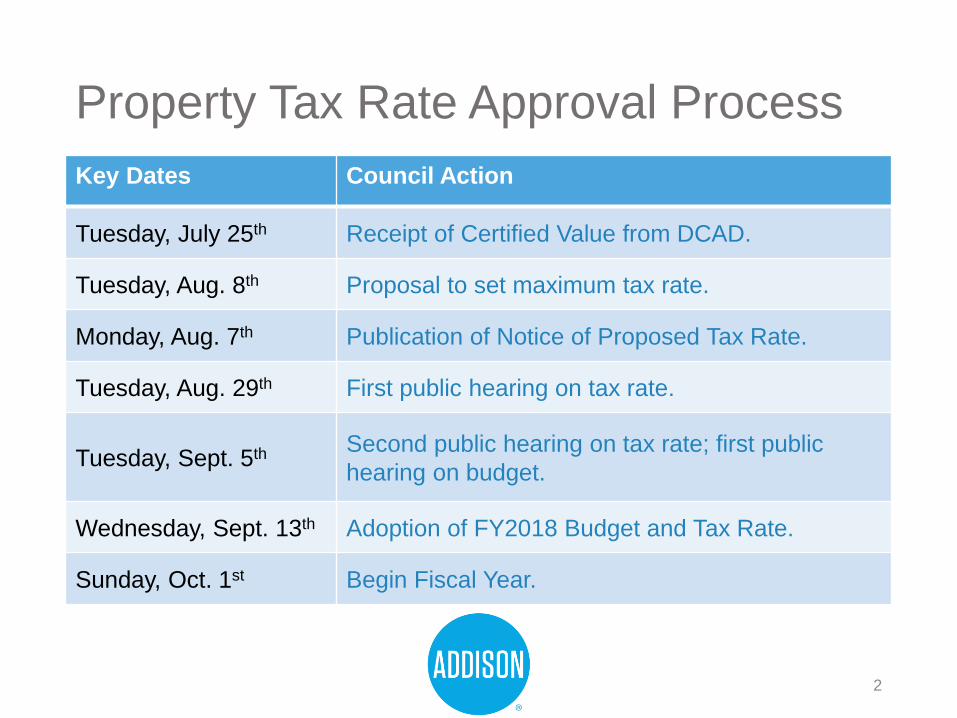
Property Tax Rate Approval Process
Key Dates Council Action
Tuesday, July 25th Receipt of Certified Value from DCAD.
Tuesday, Aug. 8th Proposal to set maximum tax rate.
Monday, Aug. 7th Publication of Notice of Proposed Tax Rate.
Tuesday, Aug. 29th First public hearing on tax rate.
Tuesday, Sept. 5th Second public hearing on tax rate; first public
hearing on budget.
Wednesday, Sept. 13th Adoption of FY2018 Budget and Tax Rate.
Sunday, Oct. 1st Begin Fiscal Year.
2

Proposed BudgetFY2018
3

Goals
Building And Maintaining Trust By:
• Doing the right thing
• Helping people
• Being easy to do business with
Constantly Pursue Continuous Improvement
4

Vision
The Town of Addison will be the benchmark of all Texas
cities. When a local government wants to emulate best practices, Addison is the
first place they look.
5
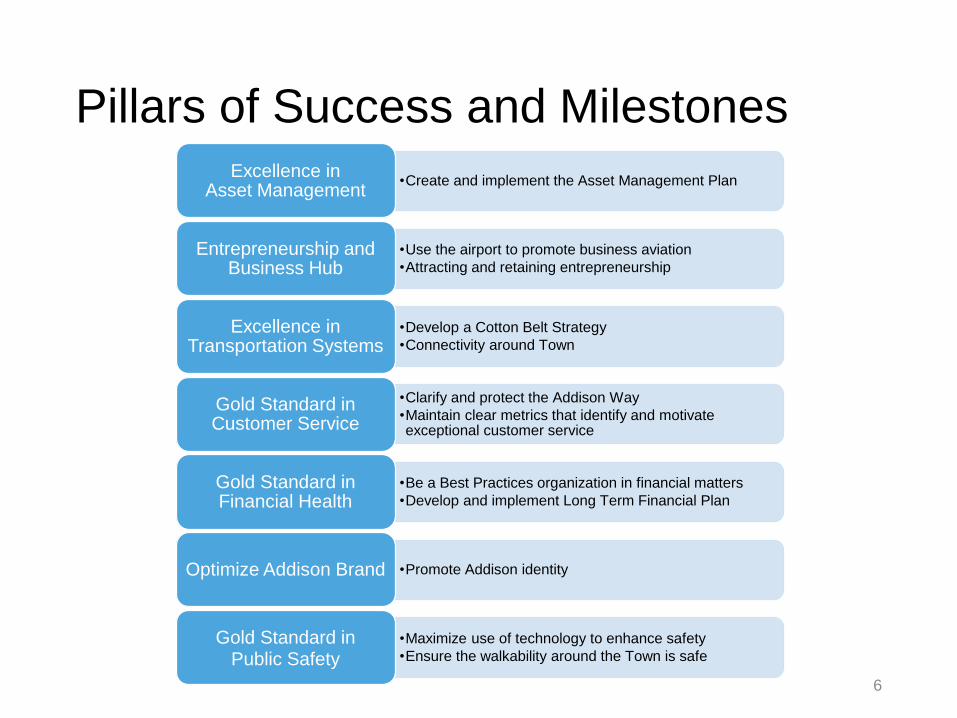
Pillars of Success and Milestones
•Create and implement the Asset Management Plan Excellence in
Asset Management
•Use the airport to promote business aviation
•Attracting and retaining entrepreneurship
Entrepreneurship and Business Hub
•Develop a Cotton Belt Strategy
•Connectivity around Town
Excellence in Transportation Systems
•Clarify and protect the Addison Way
•Maintain clear metrics that identify and motivate exceptional customer service
Gold Standard in Customer Service
•Be a Best Practices organization in financial matters
•Develop and implement Long Term Financial Plan
Gold Standard in Financial Health
•Promote Addison identityOptimize Addison Brand
•Maximize use of technology to enhance safety
•Ensure the walkability around the Town is safe
Gold Standard in Public Safety
6

7

Guiding Fiscal Principals
Persist In Fiscal Control By:
• Putting first things first
• Living within our means
Execute On Our Core Mission
Treat All Employees Fairly
Maintain Long-Term Sustainability
Achieve Continuous Improvement
8

FY2018 Consolidated Budget $74.9M(excluding transfers)
9

Property Tax Values and Tax Rate
Certified Assessed Value FY2018 ~$4.45B
Current Certified Assessed Value FY2017 ~$4.30B
Current Property Tax Rate FY2017 $.560472/100
Proposed Property Tax Rate FY2018 $.550000/100
10
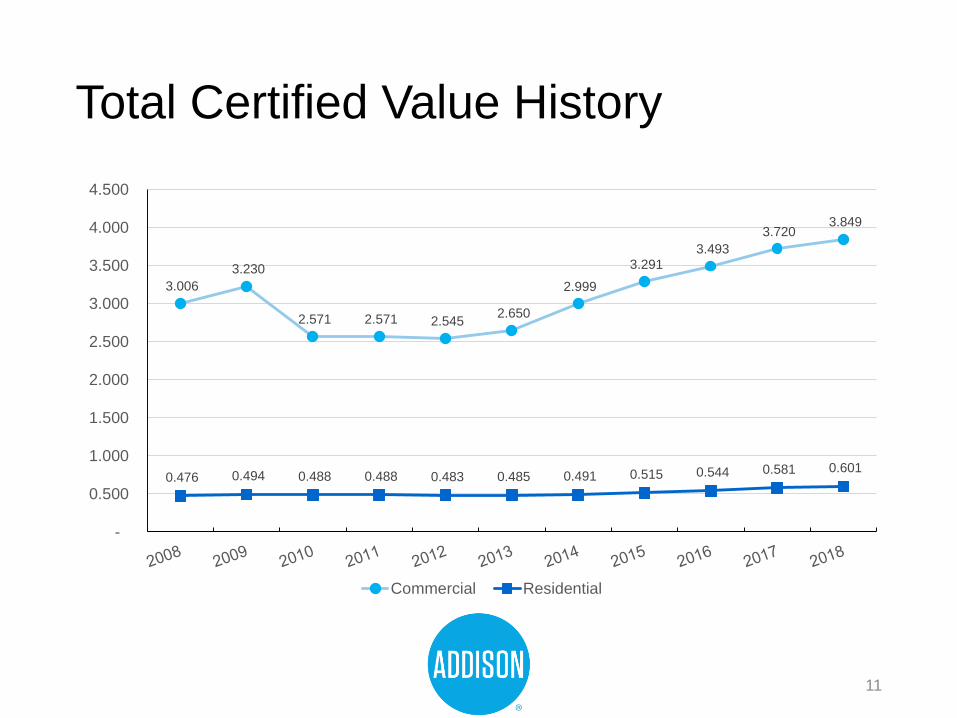
Total Certified Value History
3.006
3.230
2.571 2.571 2.545 2.650
2.999
3.291 3.493
3.720 3.849
0.476 0.494 0.488 0.488 0.483 0.485 0.491 0.515 0.544 0.581 0.601
-
0.500
1.000
1.500
2.000
2.500
3.000
3.500
4.000
4.500
Commercial Residential
11

Total Certified Value History
68% 66%
64% 64% 65% 66%68%
69%69%
69% 70%
19%20%
20% 20% 19%18%
18%
18%18%
17%16%
14%
13%
16% 16% 16%15%
14%
14%
13%
14%14%
-
0.5
1.0
1.5
2.0
2.5
3.0
3.5
4.0
4.5
5.0
2008 2009 2010 2011 2012 2013 2014 2015 2016 2017 2018
Bill
ion
s
Commercial BPP Residential
12

FY2017 Tax Rates – Dallas County
1.12
0.94
0.87 0.850.80 0.79 0.78
0.76 0.76 0.74 0.740.70 0.70 0.70 0.69 0.69 0.68 0.67
0.630.60 0.60 0.59 0.58 0.56
0.50
0.440.41
0.330.29
0.250.22
0.00
0.20
0.40
0.60
0.80
1.00
1.20
FY2017 Tax Rate - Dallas County
Median: 0.644473
Mean: 0.687000
13

FY2017 Tax Rates - Comparison Cities
0.630.60 0.60 0.59 0.58 0.57 0.56
0.520.48
0.45 0.44 0.44
0.290.25
0.00
0.10
0.20
0.30
0.40
0.50
0.60
0.70
Median: 0.54023
Mean: 0.499994
14

Combined FY2017 Property Tax Rates
Combined Tax Rate
$2.497258
Addison, 0.560472,22.4%
Parkland Hospital, 0.279400, 11.2%
DCCC, 0.122930,4.9%
Dallas ISD, 1.282085, 51.3%
Dallas County, 0.252371, 10.1%
15

Property Tax Rates
FY2016 FY2017 FY2018
Effective $0.534304/100 $0.545760/100 $0.542963/100
Rollback $0.555524/100 $0.562533/100 $0.551854/100
Adopted/Proposed $0.579150/100 $0.560472/100 $0.550000/100
16
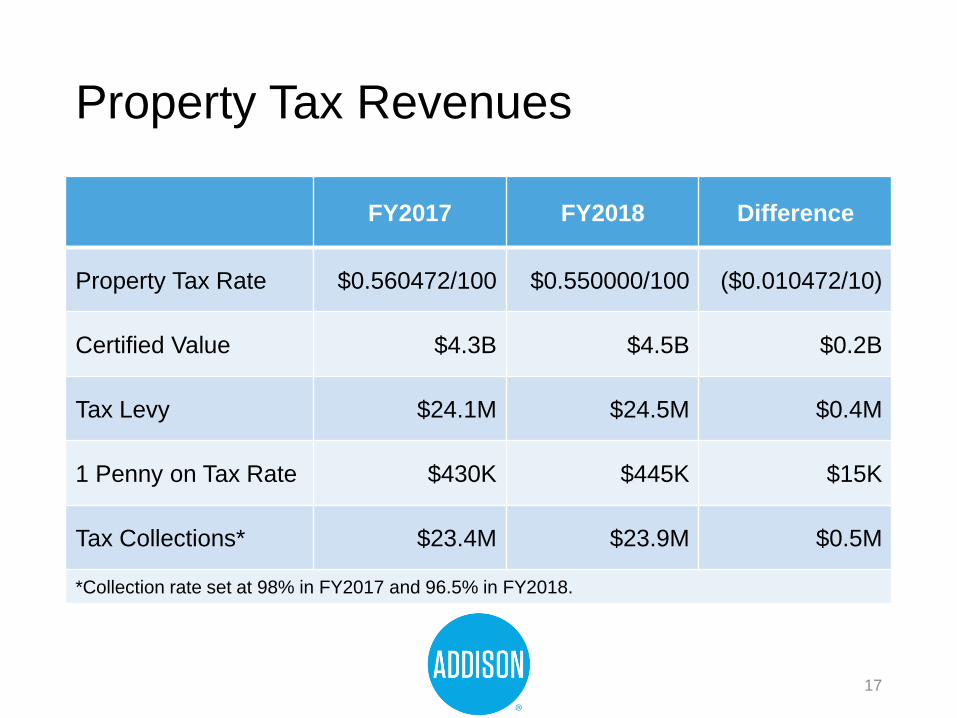
Property Tax Revenues
FY2017 FY2018 Difference
Property Tax Rate $0.560472/100 $0.550000/100 ($0.010472/10)
Certified Value $4.3B $4.5B $0.2B
Tax Levy $24.1M $24.5M $0.4M
1 Penny on Tax Rate $430K $445K $15K
Tax Collections* $23.4M $23.9M $0.5M
*Collection rate set at 98% in FY2017 and 96.5% in FY2018.
17
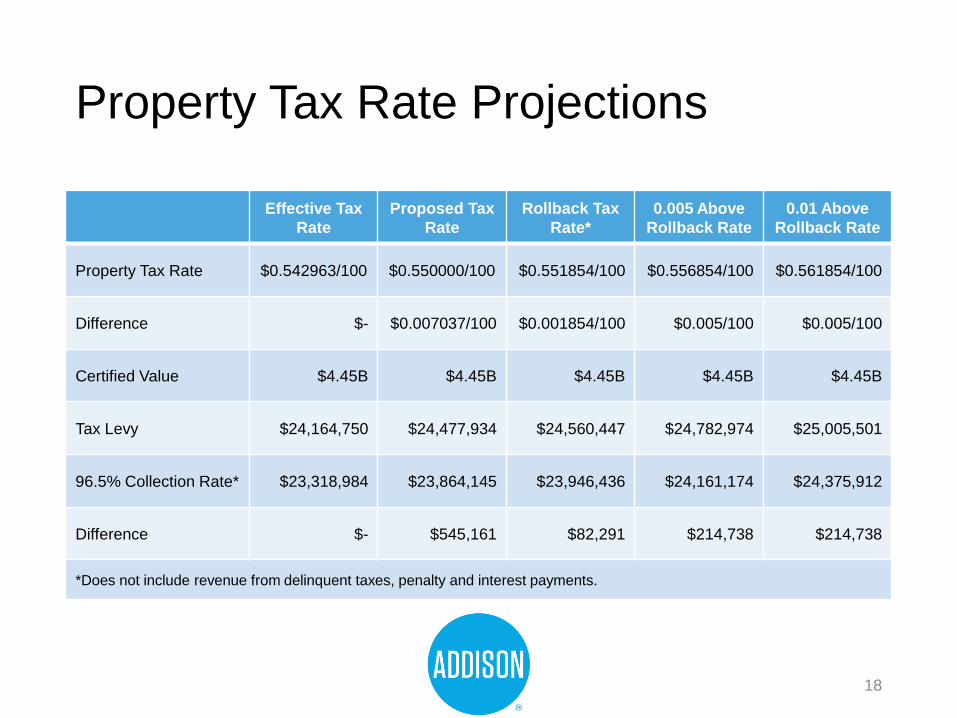
Property Tax Rate Projections
Effective Tax
Rate
Proposed Tax
Rate
Rollback Tax
Rate*
0.005 Above
Rollback Rate
0.01 Above
Rollback Rate
Property Tax Rate $0.542963/100 $0.550000/100 $0.551854/100 $0.556854/100 $0.561854/100
Difference $- $0.007037/100 $0.001854/100 $0.005/100 $0.005/100
Certified Value $4.45B $4.45B $4.45B $4.45B $4.45B
Tax Levy $24,164,750 $24,477,934 $24,560,447 $24,782,974 $25,005,501
96.5% Collection Rate* $23,318,984 $23,864,145 $23,946,436 $24,161,174 $24,375,912
Difference $- $545,161 $82,291 $214,738 $214,738
*Does not include revenue from delinquent taxes, penalty and interest payments.
18
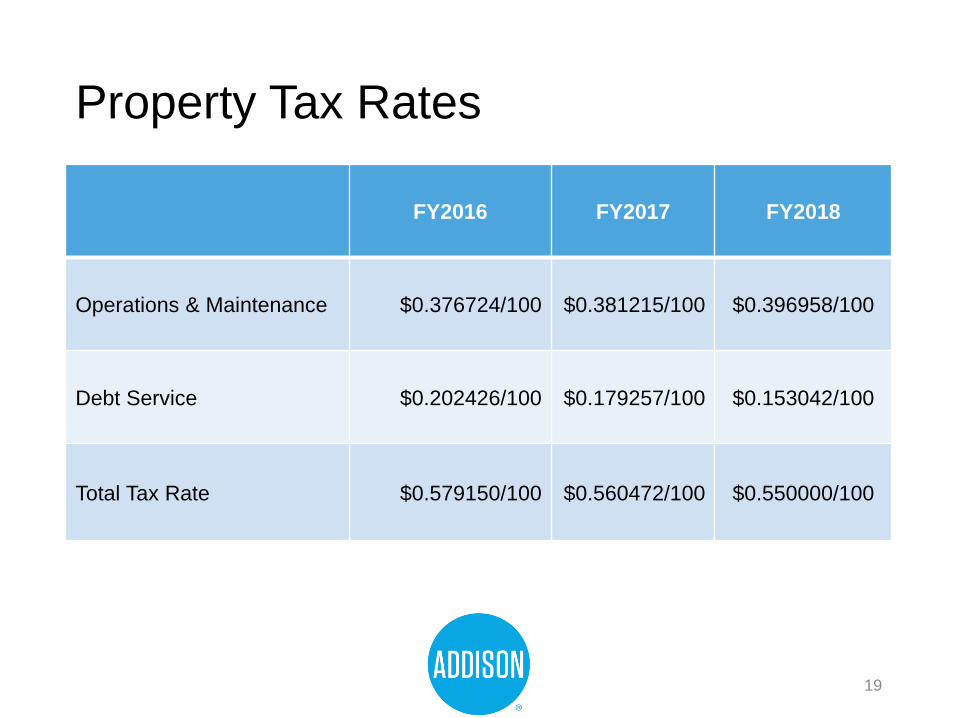
Property Tax Rates
FY2016 FY2017 FY2018
Operations & Maintenance $0.376724/100 $0.381215/100 $0.396958/100
Debt Service $0.202426/100 $0.179257/100 $0.153042/100
Total Tax Rate $0.579150/100 $0.560472/100 $0.550000/100
19
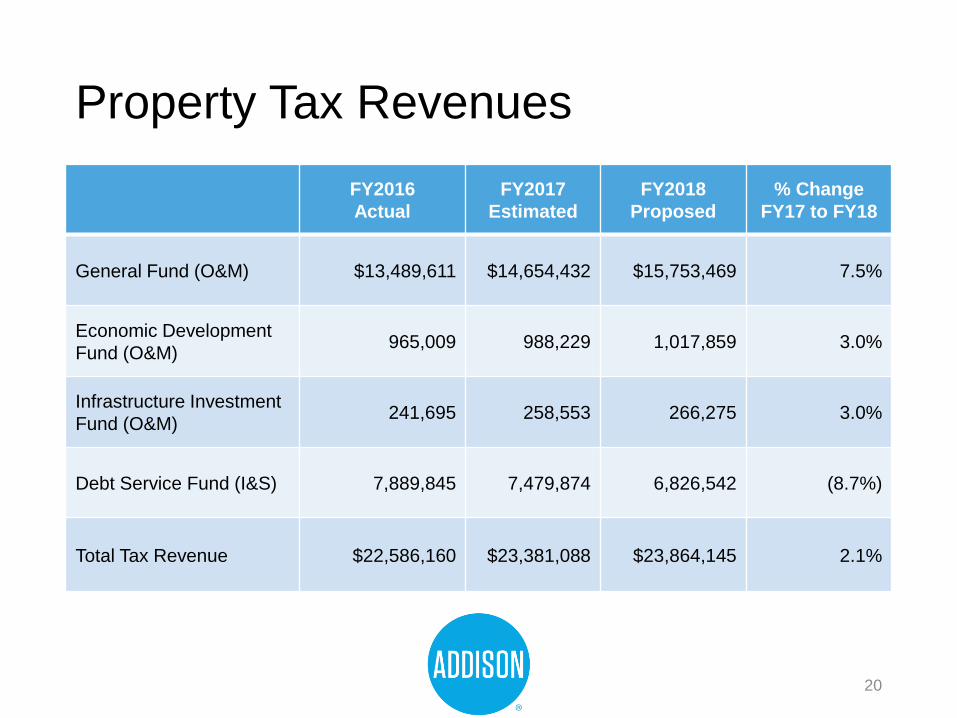
Property Tax Revenues
FY2016
Actual
FY2017
Estimated
FY2018
Proposed
% Change
FY17 to FY18
General Fund (O&M) $13,489,611 $14,654,432 $15,753,469 7.5%
Economic Development
Fund (O&M)965,009 988,229 1,017,859 3.0%
Infrastructure Investment
Fund (O&M)241,695 258,553 266,275 3.0%
Debt Service Fund (I&S) 7,889,845 7,479,874 6,826,542 (8.7%)
Total Tax Revenue $22,586,160 $23,381,088 $23,864,145 2.1%
20
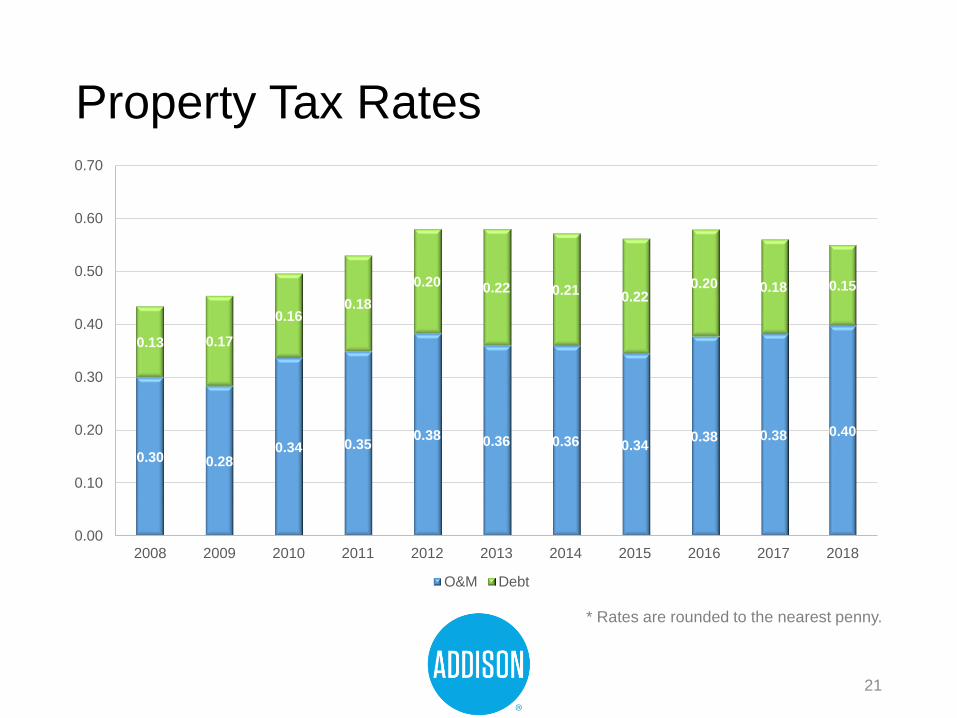
Property Tax Rates
0.30 0.280.34 0.35
0.38 0.36 0.36 0.340.38 0.38 0.40
0.13 0.17
0.160.18
0.20 0.22 0.210.22
0.20 0.18 0.15
0.00
0.10
0.20
0.30
0.40
0.50
0.60
0.70
2008 2009 2010 2011 2012 2013 2014 2015 2016 2017 2018
O&M Debt
* Rates are rounded to the nearest penny.
21
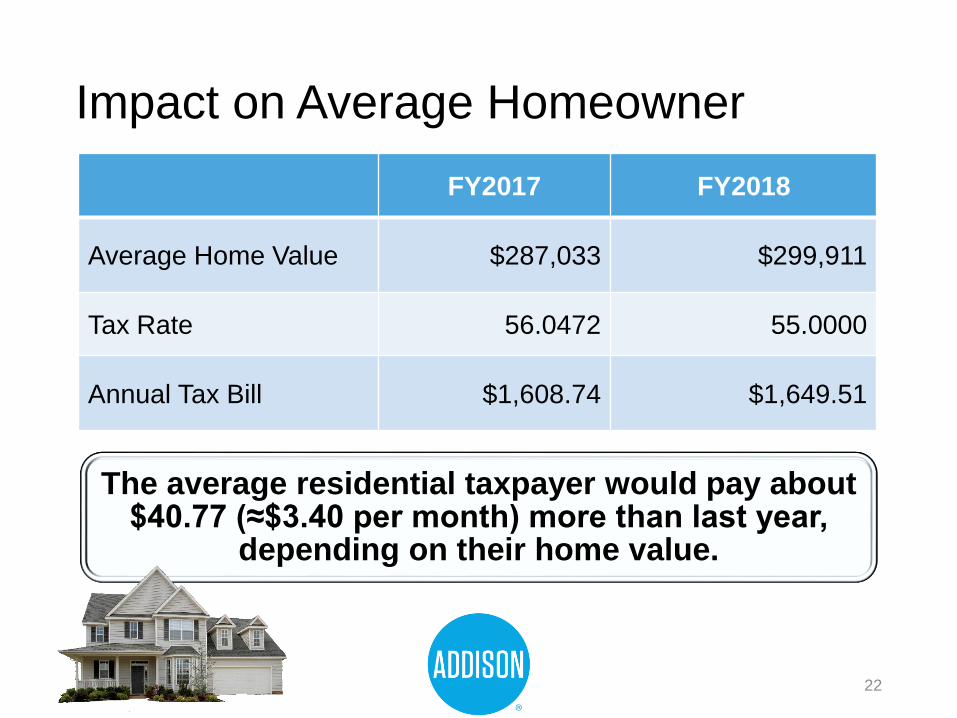
Impact on Average Homeowner
FY2017 FY2018
Average Home Value $287,033 $299,911
Tax Rate 56.0472 55.0000
Annual Tax Bill $1,608.74 $1,649.51
The average residential taxpayer would pay about $40.77 (≈$3.40 per month) more than last year,
depending on their home value.
22

15
Price Comparison(cost per month)
City Services:24-hr Police Protection
24-hr Fire Protection
24-hrAmbulance
Street Maintenance
Lighting Maintenance
Library Access
Parks, Athletic Center
Animal Control
Environmental Health
Building Inspections
Property Standards
Cable
&
Internet
23

Average Monthly Total Bill Increase for Residents
FY2017 FY2018 Increase
Property Tax $134.06 $137.46 $3.40
Water (5,000 gallons) $20.04 $20.71 $0.67
Sewer (5,000 gallons) $26.78 $28.28 $1.50
Total Average Monthly Increase $5.57
24

FY2018 Decision Packages RequestedGENERAL FUND Recurring One-Time Total
City Secretary
1 Records Scanning / Retention $- $50,000 $50,000
Combined Services
1 Resident Survey $- $20,000 $20,000
Development
1 Unified Development Code $- $175,000 $175,000
2 Special Study Public Engagement $30,000 $- $30,000
3 Landscape Inspector (1.0 FTE) $76,231 $41,500 $117,731
Fire
1 Emergency Management Specialist (1.0 FTE) $74,615 $2,800 $77,415
2 Management Assistant (1.0 FTE) $81,478 $2,500 $83,978
3 Captain of EMS (1.0 FTE) $118,482 $2,500 $120,982
4 Stryker Power Load System $3,000 $63,437 $66,437
5 eDraulic Extrication / Rescue Tools $- $71,000 $71,000
6 Direct Capture Vehicle Exhaust Ventilation System $- $80,000 $80,000
7 Job Specific Physical Fitness Equipment $- $40,000 $40,000
26

FY2018 Decision Packages Requested
GENERAL FUND (CONTINUED) Recurring One-Time Total
General Services
1 Facilities Technician (1.0 FTE) $32,915 $31,800 $64,715
2 Fuel Dispenser & Monitor Replacement $- $70,000 $70,000
3 Training Increase $5,250 $4,800 $10,050
4 Funding Mechanism for Facility Assessment $432,232 $- $432,232
5 Facilities Maintenance Items $- $175,000 $175,000
Human Resources
1 Human Resources Manager (1.0 FTE) $104,887 $- $104,887
2 Tuition Reimbursement $- $6,448 $6,448
3 Employee Handbook $- $15,000 $15,000
Information Technology
1 Backup Communication Lines $30,000 $2,000 $32,000
2 Website Redesign $2,500 $50,000 $52,500
3 Microwave Technology $- $550,000 $550,000
27

FY2018 Decision Packages Requested
GENERAL FUND (CONTINUED) Recurring One-Time Total
Parks
1 Parks Master Plan Update $- $125,000 $125,000
2 Addison Circle Fountain $- $375,000 $375,000
3 Backflow Repair $43,000 $20,000 $63,000
4 Park Trailers $- $31,500 $31,500
5 Les Lacs Floating Fountain $3,500 $35,000 $38,500
6 Property Damage Contingency $20,000 $- $20,000
Police
1 Department Restructure (10.0 FTEs) $875,428 $- $875,428
Recreation
1 Outdoor Pool Filters $- $128,000 $128,000
2 Assistant Director of Recreation $5,000 $- $5,000
Streets
2 Signal Timing Project $- $190,000 $190,000
TOTAL GENERAL FUND (TOTAL FTEs 16.0) $1,938,518 $2,358,285 $4,296,803
28
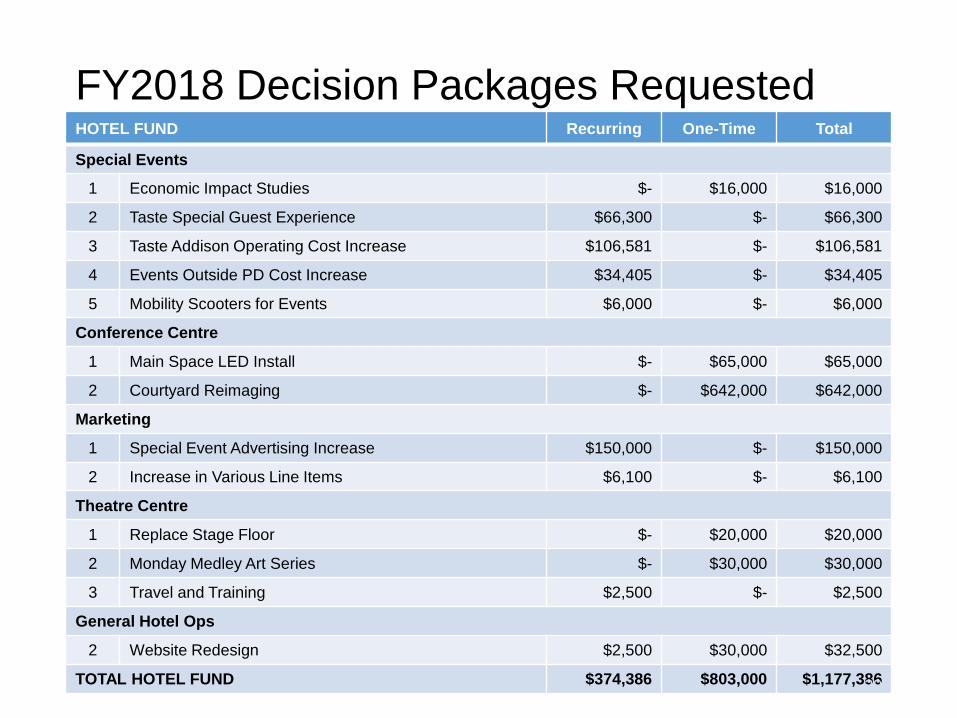
FY2018 Decision Packages RequestedHOTEL FUND Recurring One-Time Total
Special Events
1 Economic Impact Studies $- $16,000 $16,000
2 Taste Special Guest Experience $66,300 $- $66,300
3 Taste Addison Operating Cost Increase $106,581 $- $106,581
4 Events Outside PD Cost Increase $34,405 $- $34,405
5 Mobility Scooters for Events $6,000 $- $6,000
Conference Centre
1 Main Space LED Install $- $65,000 $65,000
2 Courtyard Reimaging $- $642,000 $642,000
Marketing
1 Special Event Advertising Increase $150,000 $- $150,000
2 Increase in Various Line Items $6,100 $- $6,100
Theatre Centre
1 Replace Stage Floor $- $20,000 $20,000
2 Monday Medley Art Series $- $30,000 $30,000
3 Travel and Training $2,500 $- $2,500
General Hotel Ops
2 Website Redesign $2,500 $30,000 $32,500
TOTAL HOTEL FUND $374,386 $803,000 $1,177,386 29
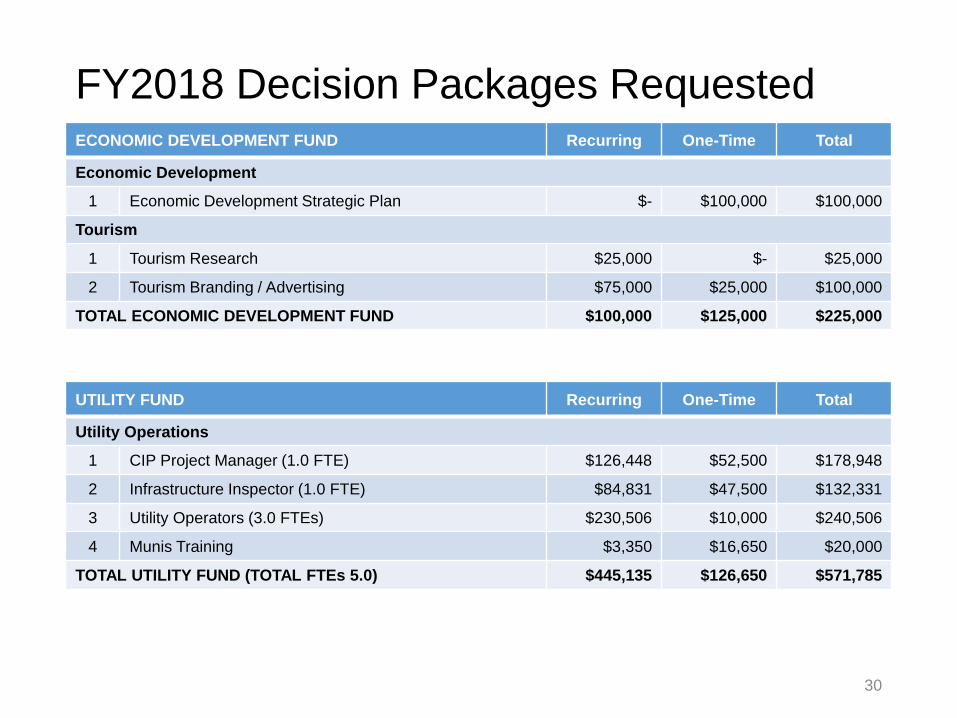
FY2018 Decision Packages Requested
UTILITY FUND Recurring One-Time Total
Utility Operations
1 CIP Project Manager (1.0 FTE) $126,448 $52,500 $178,948
2 Infrastructure Inspector (1.0 FTE) $84,831 $47,500 $132,331
3 Utility Operators (3.0 FTEs) $230,506 $10,000 $240,506
4 Munis Training $3,350 $16,650 $20,000
TOTAL UTILITY FUND (TOTAL FTEs 5.0) $445,135 $126,650 $571,785
ECONOMIC DEVELOPMENT FUND Recurring One-Time Total
Economic Development
1 Economic Development Strategic Plan $- $100,000 $100,000
Tourism
1 Tourism Research $25,000 $- $25,000
2 Tourism Branding / Advertising $75,000 $25,000 $100,000
TOTAL ECONOMIC DEVELOPMENT FUND $100,000 $125,000 $225,000
30
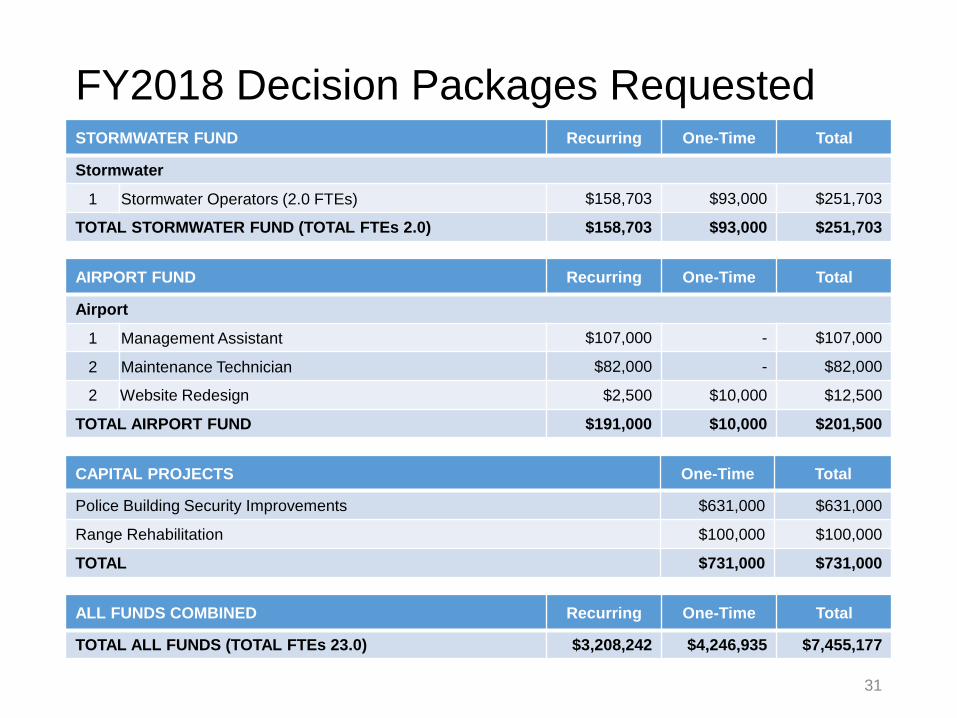
FY2018 Decision Packages Requested
CAPITAL PROJECTS One-Time Total
Police Building Security Improvements $631,000 $631,000
Range Rehabilitation $100,000 $100,000
TOTAL $731,000 $731,000
ALL FUNDS COMBINED Recurring One-Time Total
TOTAL ALL FUNDS (TOTAL FTEs 23.0) $3,208,242 $4,246,935 $7,455,177
AIRPORT FUND Recurring One-Time Total
Airport
1 Management Assistant $107,000 - $107,000
2 Maintenance Technician $82,000 - $82,000
2 Website Redesign $2,500 $10,000 $12,500
TOTAL AIRPORT FUND $191,000 $10,000 $201,500
STORMWATER FUND Recurring One-Time Total
Stormwater
1 Stormwater Operators (2.0 FTEs) $158,703 $93,000 $251,703
TOTAL STORMWATER FUND (TOTAL FTEs 2.0) $158,703 $93,000 $251,703
31

FY2018 Decision Packages ProposedGENERAL FUND Recurring One-Time Total FTEs
City Secretary
1 Records Scanning / Retention $- $50,000 $50,000
Development
1 Unified Development Code $- $175,000 $175,000
Fire
2 Management Assistant (1.0 FTE) $81,478 $2,500 $83,978 1.0
Human Resources
3 Employee Handbook $- $15,000 $15,000
Information Technology
1 Backup Communication Lines $30,000 $2,000 $32,000
2 Website Redesign $5,000 $60,000 $65,000
Parks
1 Parks Master Plan Update $- $125,000 $125,000
3 Backflow Repair $43,000 $20,000 $63,000
Recreation
1 Outdoor Pool Filters $- $128,000 $128,000
Streets
2 Signal Timing Project $- $190,000 $190,000
TOTAL GENERAL FUND (TOTAL FTEs 1.0) $159,478 $767,500 $926,978 1.032

FY2018 Decision Packages ProposedHOTEL FUND Recurring One-Time Total FTEs
Special Events
3 Taste Addison Operating Cost Increase $95,400 $- $95,400
4 Events Outside PD Cost Increase $34,405 $- $34,405
Theatre Centre
1 Replace Stage Floor $- $20,000 $20,000
3 Travel and Training $2,500 $- $2,500
General Hotel Ops
2 Website Redesign $2,500 $30,000 $32,500
TOTAL HOTEL FUND $134,805 $50,000 $184,805 0.0
ECONOMIC DEVELOPMENT FUND Recurring One-Time Total FTEs
Economic Development
1 Economic Development Strategic Plan $- $100,000 $100,000
Tourism
1 Tourism Research $- $25,000 $25,000
2 Tourism Branding / Advertising $50,000 $- $50,000
TOTAL ECONOMIC DEVELOPMENT FUND $50,000 $125,000 $175,000 0.0
33

FY2018 Decision Packages Proposed
CAPITAL PROJECTS One-Time Total FTEs
Police Building Security Improvements $631,000 $631,000
Range Rehabilitation $100,000 $100,000
TOTAL $731,000 $731,000 0.0
ALL FUNDS COMBINED Recurring One-Time Total FTEs
TOTAL ALL FUNDS $346,783 $1,683,500 $2,030,283 1.0
34
AIRPORT FUND Recurring One-Time Total FTEs
Airport
2 Website Redesign $2,500 $10,000 $12,500
TOTAL AIRPORT FUND $2,500 $10,000 $12,500 0.0
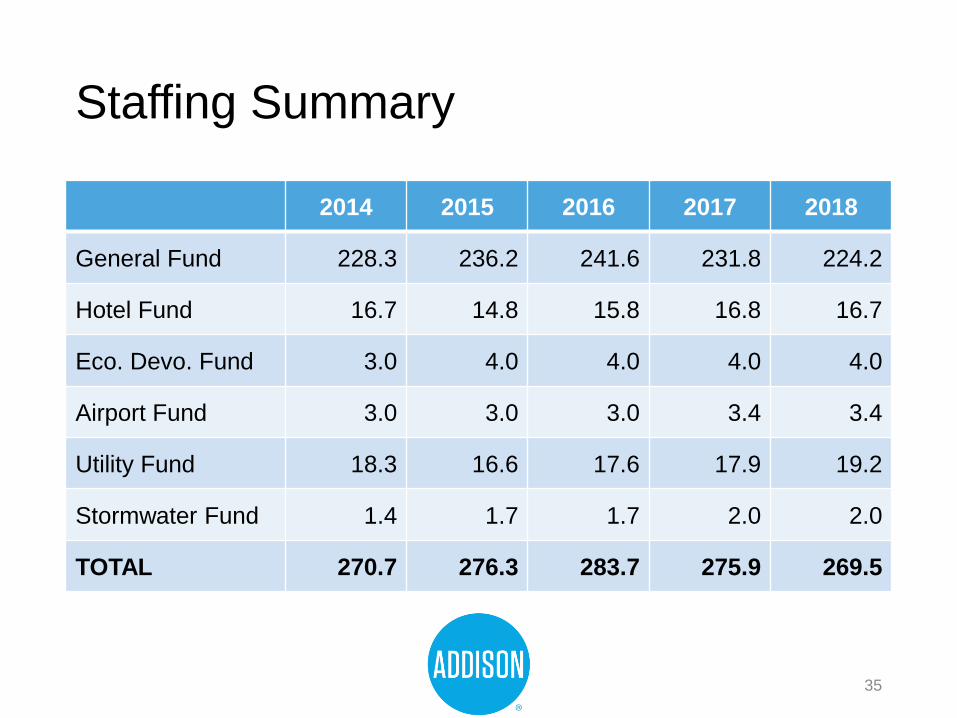
Staffing Summary
2014 2015 2016 2017 2018
General Fund 228.3 236.2 241.6 231.8 224.2
Hotel Fund 16.7 14.8 15.8 16.8 16.7
Eco. Devo. Fund 3.0 4.0 4.0 4.0 4.0
Airport Fund 3.0 3.0 3.0 3.4 3.4
Utility Fund 18.3 16.6 17.6 17.9 19.2
Stormwater Fund 1.4 1.7 1.7 2.0 2.0
TOTAL 270.7 276.3 283.7 275.9 269.5
35
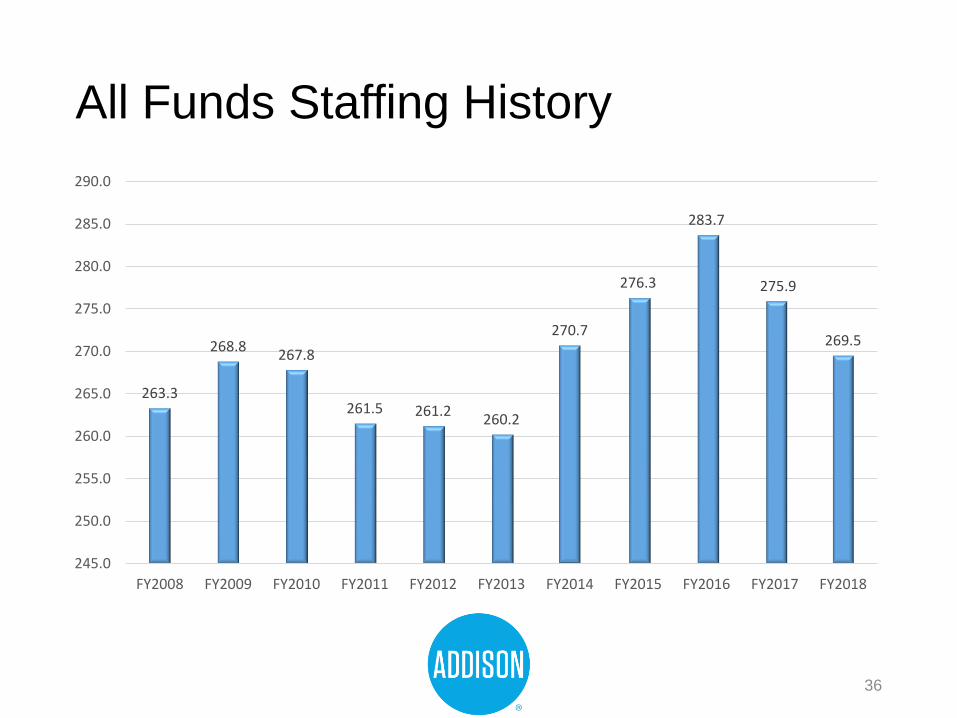
All Funds Staffing History
263.3
268.8267.8
261.5 261.2260.2
270.7
276.3
283.7
275.9
269.5
245.0
250.0
255.0
260.0
265.0
270.0
275.0
280.0
285.0
290.0
FY2008 FY2009 FY2010 FY2011 FY2012 FY2013 FY2014 FY2015 FY2016 FY2017 FY2018
36
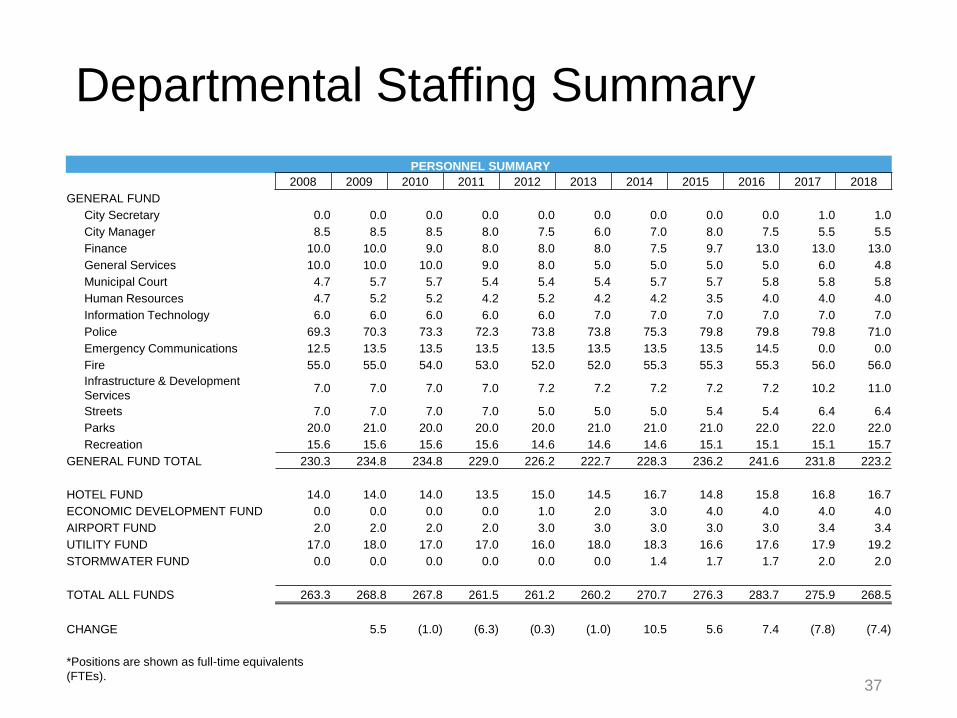
Departmental Staffing Summary
PERSONNEL SUMMARY
2008 2009 2010 2011 2012 2013 2014 2015 2016 2017 2018
GENERAL FUND
City Secretary 0.0 0.0 0.0 0.0 0.0 0.0 0.0 0.0 0.0 1.0 1.0
City Manager 8.5 8.5 8.5 8.0 7.5 6.0 7.0 8.0 7.5 5.5 5.5
Finance 10.0 10.0 9.0 8.0 8.0 8.0 7.5 9.7 13.0 13.0 13.0
General Services 10.0 10.0 10.0 9.0 8.0 5.0 5.0 5.0 5.0 6.0 4.8
Municipal Court 4.7 5.7 5.7 5.4 5.4 5.4 5.7 5.7 5.8 5.8 5.8
Human Resources 4.7 5.2 5.2 4.2 5.2 4.2 4.2 3.5 4.0 4.0 4.0
Information Technology 6.0 6.0 6.0 6.0 6.0 7.0 7.0 7.0 7.0 7.0 7.0
Police 69.3 70.3 73.3 72.3 73.8 73.8 75.3 79.8 79.8 79.8 71.0
Emergency Communications 12.5 13.5 13.5 13.5 13.5 13.5 13.5 13.5 14.5 0.0 0.0
Fire 55.0 55.0 54.0 53.0 52.0 52.0 55.3 55.3 55.3 56.0 56.0
Infrastructure & Development
Services7.0 7.0 7.0 7.0 7.2 7.2 7.2 7.2 7.2 10.2 11.0
Streets 7.0 7.0 7.0 7.0 5.0 5.0 5.0 5.4 5.4 6.4 6.4
Parks 20.0 21.0 20.0 20.0 20.0 21.0 21.0 21.0 22.0 22.0 22.0
Recreation 15.6 15.6 15.6 15.6 14.6 14.6 14.6 15.1 15.1 15.1 15.7
GENERAL FUND TOTAL 230.3 234.8 234.8 229.0 226.2 222.7 228.3 236.2 241.6 231.8 223.2
HOTEL FUND 14.0 14.0 14.0 13.5 15.0 14.5 16.7 14.8 15.8 16.8 16.7
ECONOMIC DEVELOPMENT FUND 0.0 0.0 0.0 0.0 1.0 2.0 3.0 4.0 4.0 4.0 4.0
AIRPORT FUND 2.0 2.0 2.0 2.0 3.0 3.0 3.0 3.0 3.0 3.4 3.4
UTILITY FUND 17.0 18.0 17.0 17.0 16.0 18.0 18.3 16.6 17.6 17.9 19.2
STORMWATER FUND 0.0 0.0 0.0 0.0 0.0 0.0 1.4 1.7 1.7 2.0 2.0
TOTAL ALL FUNDS 263.3 268.8 267.8 261.5 261.2 260.2 270.7 276.3 283.7 275.9 268.5
CHANGE 5.5 (1.0) (6.3) (0.3) (1.0) 10.5 5.6 7.4 (7.8) (7.4)
*Positions are shown as full-time equivalents
(FTEs).37
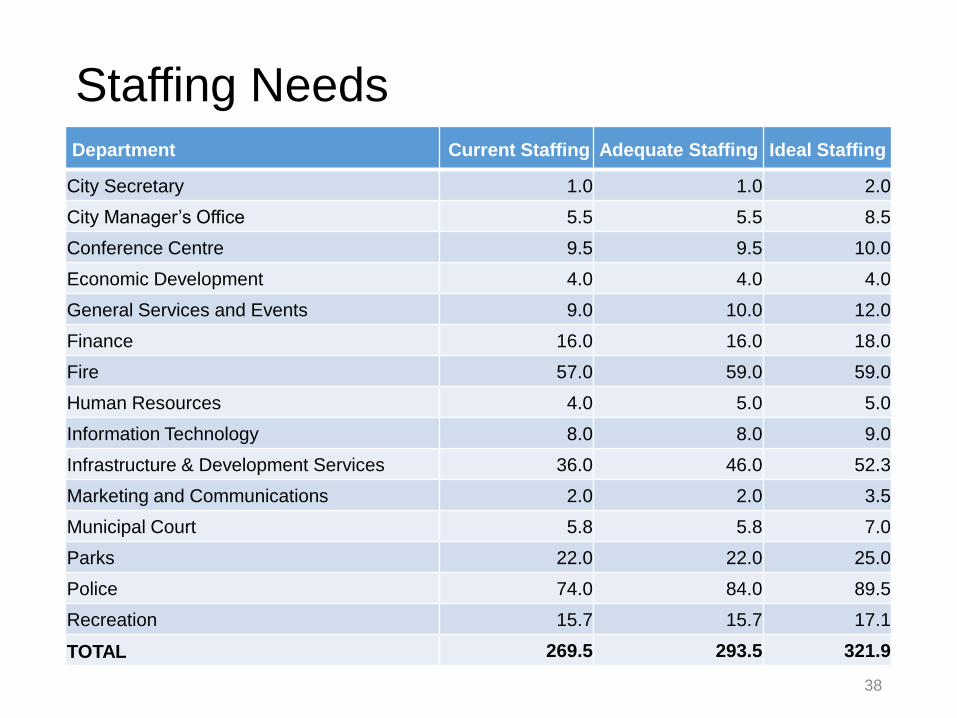
Staffing NeedsDepartment Current Staffing Adequate Staffing Ideal Staffing
City Secretary 1.0 1.0 2.0
City Manager’s Office 5.5 5.5 8.5
Conference Centre 9.5 9.5 10.0
Economic Development 4.0 4.0 4.0
General Services and Events 9.0 10.0 12.0
Finance 16.0 16.0 18.0
Fire 57.0 59.0 59.0
Human Resources 4.0 5.0 5.0
Information Technology 8.0 8.0 9.0
Infrastructure & Development Services 36.0 46.0 52.3
Marketing and Communications 2.0 2.0 3.5
Municipal Court 5.8 5.8 7.0
Parks 22.0 22.0 25.0
Police 74.0 84.0 89.5
Recreation 15.7 15.7 17.1
TOTAL 269.5 293.5 321.9
38
1
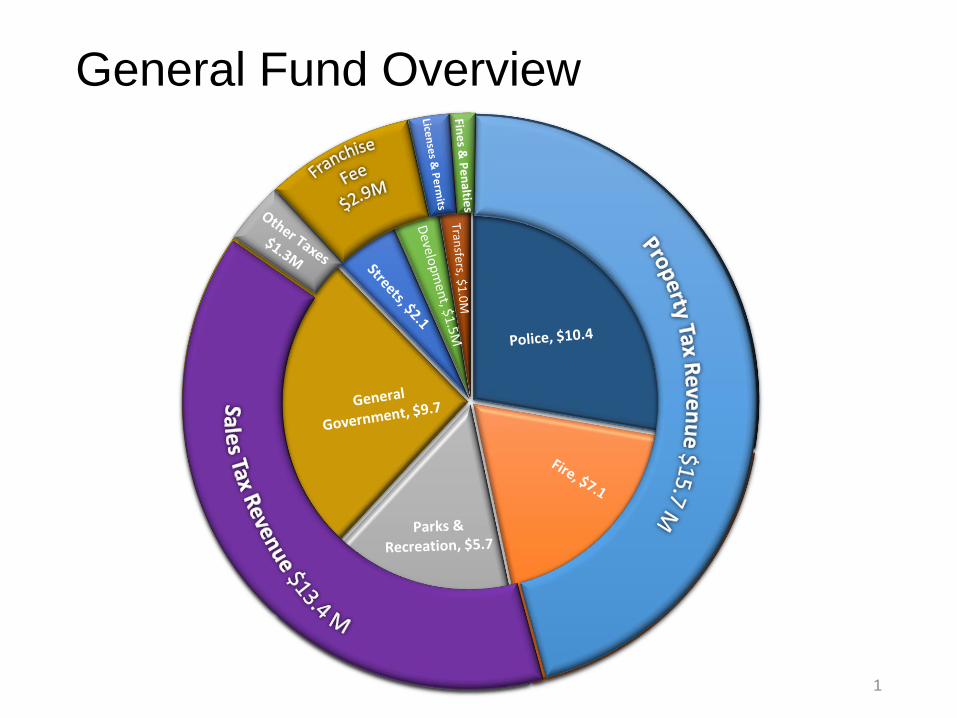
General Fund Overview

General Fund Overview(excluding transfers)
FY2017
Adopt.FY2018
Prop.Difference
Total
Revenue$35.7M $36.5M $0.8M
Total
Expense$35.7M $36.5M $0.8M
Revenue
to
Expense
$ - $ - $ -
• O&M Tax rate = $0.367041*
• O&M Tax levy = $15.8M• Increase of $900K
• Sales tax = $13.4M• No projected increase
*Portion of O&M rate $0.396958
for general fund operations.2

Interfund Transfers
3
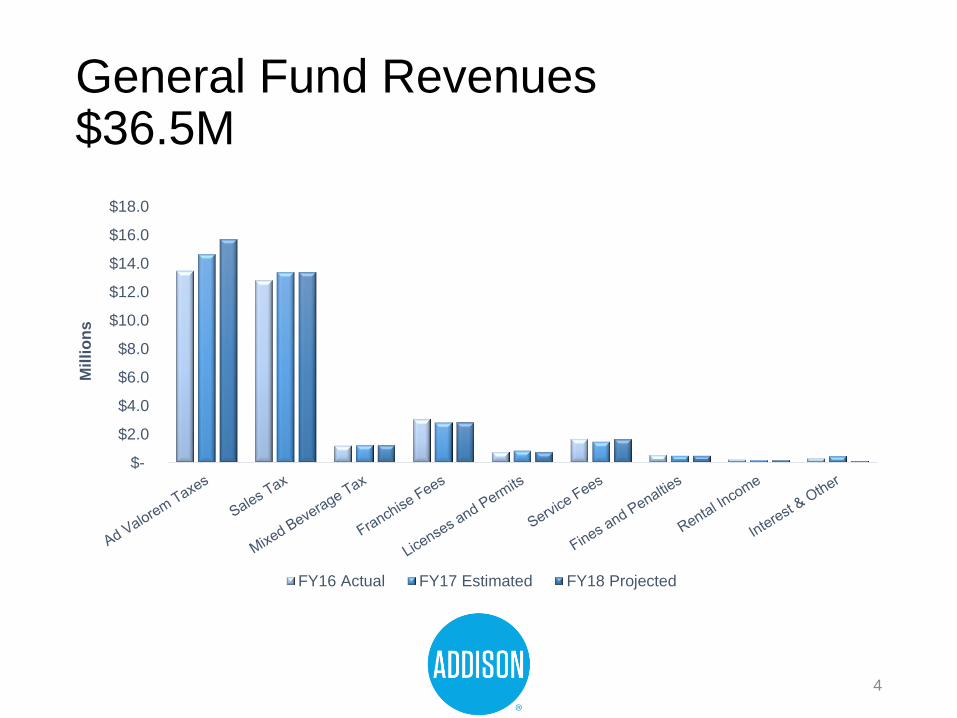
General Fund Revenues$36.5M
$-
$2.0
$4.0
$6.0
$8.0
$10.0
$12.0
$14.0
$16.0
$18.0
Mil
lio
ns
FY16 Actual FY17 Estimated FY18 Projected
4
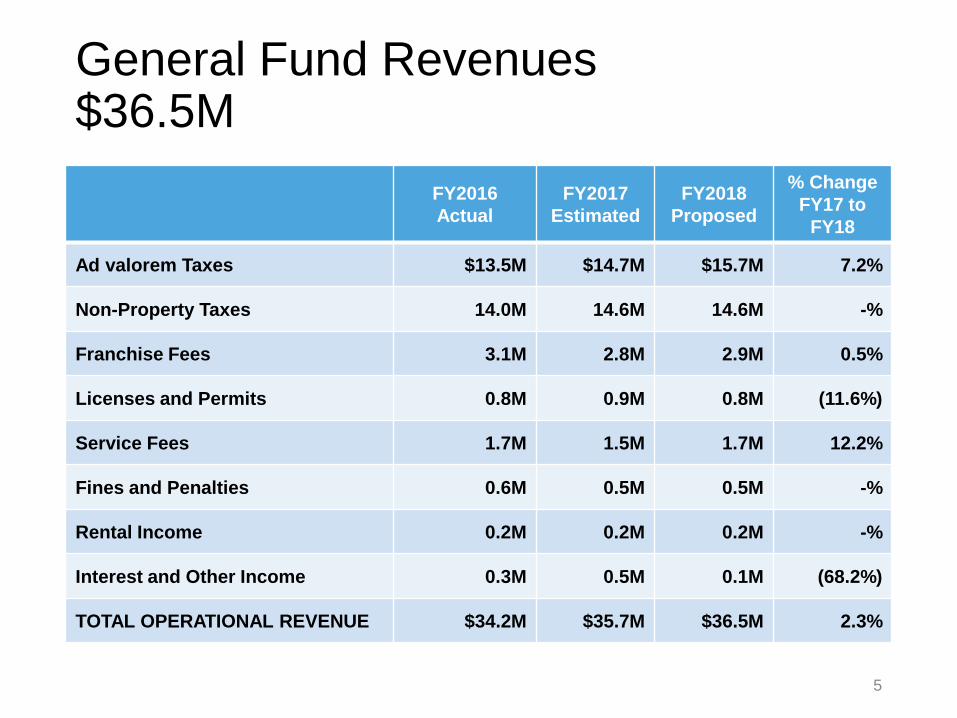
FY2016
Actual
FY2017
Estimated
FY2018
Proposed
% Change
FY17 to
FY18
Ad valorem Taxes $13.5M $14.7M $15.7M 7.2%
Non-Property Taxes 14.0M 14.6M 14.6M -%
Franchise Fees 3.1M 2.8M 2.9M 0.5%
Licenses and Permits 0.8M 0.9M 0.8M (11.6%)
Service Fees 1.7M 1.5M 1.7M 12.2%
Fines and Penalties 0.6M 0.5M 0.5M -%
Rental Income 0.2M 0.2M 0.2M -%
Interest and Other Income 0.3M 0.5M 0.1M (68.2%)
TOTAL OPERATIONAL REVENUE $34.2M $35.7M $36.5M 2.3%
General Fund Revenues$36.5M
5
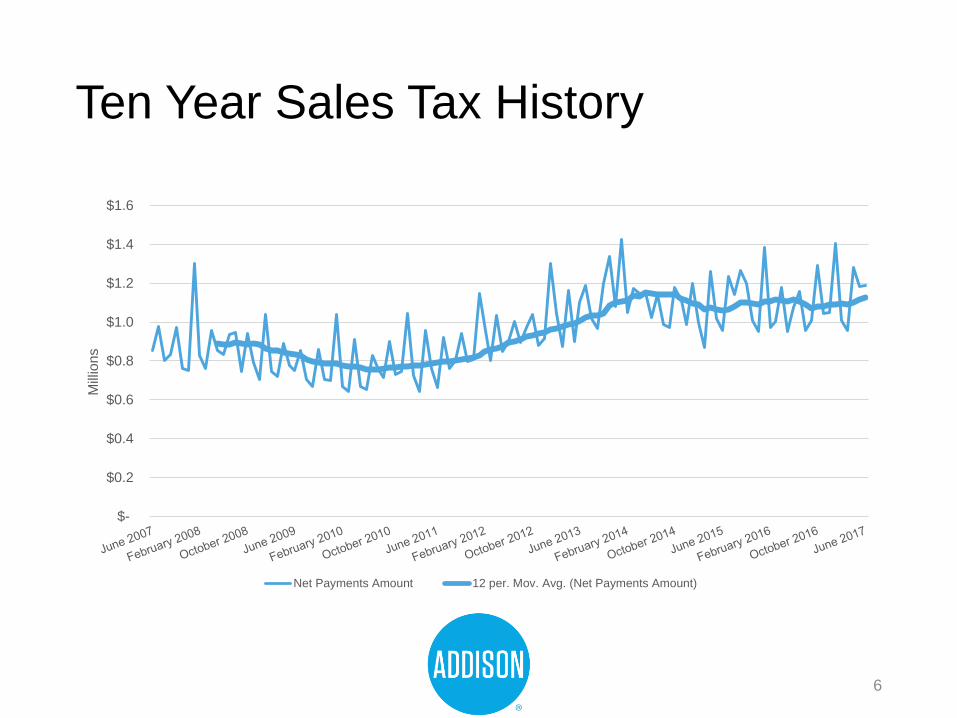
Ten Year Sales Tax History
$-
$0.2
$0.4
$0.6
$0.8
$1.0
$1.2
$1.4
$1.6
Mill
ion
s
Net Payments Amount 12 per. Mov. Avg. (Net Payments Amount)
6

Five Year Sales Tax History
$-
$0.2
$0.4
$0.6
$0.8
$1.0
$1.2
$1.4
$1.6
Mill
ion
s
Net Payments Amount 12 per. Mov. Avg. (Net Payments Amount)
7

Rate of Change in Sales Tax
5-Year
Average2013 2014 2015 2016
2017
Projected
2018
Proposed
13,074,470 12,398,529 13,703,186 13,038,912 12,831,723 13,400,000 13,400,000
Annual
Change4.0% 11.7% 10.5% -4.8% -1.6% 4.4% -
8

Property Tax Revenue Compared to Sales Tax
$-
$5
$10
$15
$20
$25
$30
2008 2009 2010 2011 2012 2013 2014 2015 2016 2017
Mill
ion
s
Property Tax Sales Tax
9
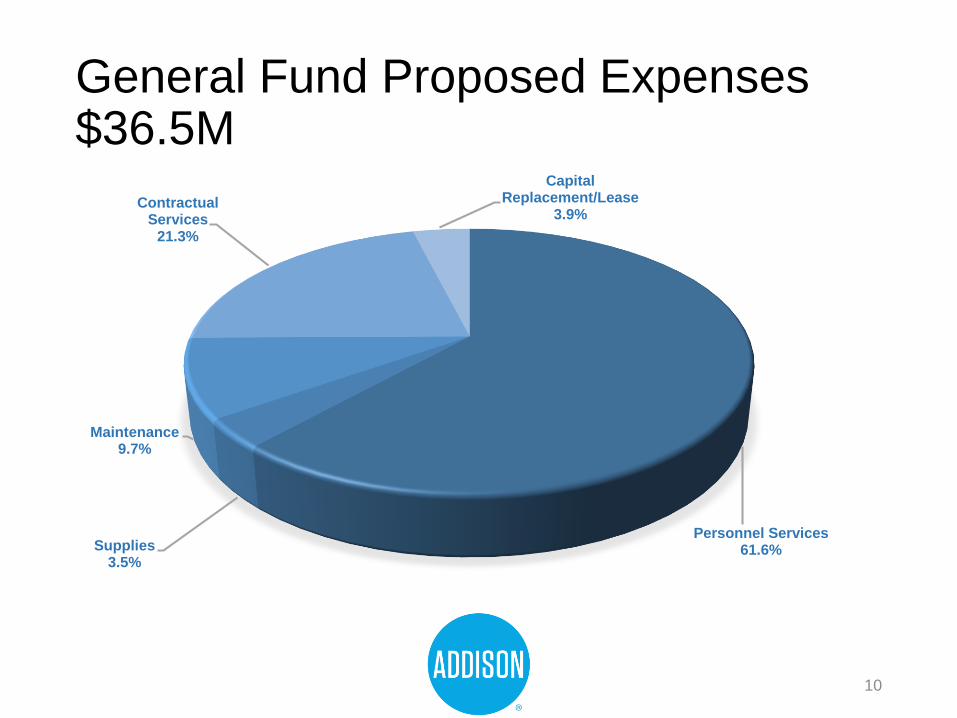
General Fund Proposed Expenses $36.5M
Personnel Services61.6%Supplies
3.5%
Maintenance9.7%
Contractual Services
21.3%
Capital Replacement/Lease
3.9%
10

General Fund Proposed Operational Expenses
FY2016
Actual
FY2017
Estimated
FY2018
Proposed
% Change
FY17 to
FY18
General Government
City Secretary $ - $0.2M $0.2M 13.7%
City Manager 1.4M 1.0M 1.1M 1.5%
Finance 1.4M 1.7M 1.7M 4.5%
General Services 0.8M 0.8M 0.7M (12.8%)
Municipal Court 0.6M 0.6M 0.6M -%
Human Resources 0.6M 0.6M 0.7M 8.0%
Information Technology 1.6M 1.9M 2.0M 4.3%
Combined Services 1.0M 1.0M 2.3M 130.0%
City Council 0.4M 0.3M 0.3M -%
Total General Government $7.6M $8.1M $9.6M 18.5%
11

General Fund Proposed Operational Expenses
FY2016
Actual
FY2017
Estimated
FY2018
Proposed
% Change
FY17 to
FY18
Public Safety
Police $8.1M $8.9M $8.9M -%
Emergency Communications 1.4M 1.7M 1.4M (16.6%)
Fire 6.8M 7.1M 7.2M 1.2%
Total Public Safety $16.3M $17.7M $17.5M (1.2%)
Development Services $1.1M $1.3M $1.5M 11.4%
Streets $1.8M $2.0M $2.1M 6.3%
12

General Fund Proposed Operational Expenses
FY2016
Actual
FY2017
Estimated
FY2018
Proposed
% Change
FY17 to
FY18
Parks and Recreation
Parks $3.2M $3.3M $3.8M 15.0%
Recreation 1.7M 1.7M 1.9M 11.0%
Total Parks and Recreation $4.9M $5.0M $5.7M 13.6%
TOTAL OPERATIONAL EXPENDITURES $31.8M $34.5M $36.5M 5.7%
Transfers to Other Funds 1.1M 2.0M 1.0M (46.7%)
TOTAL EXPENDITURES $32.9M $36.5M $37.5M 2.8%
13

General Fund Balance
FY2016
Actual
FY2017
Budget
FY2017
Estimated
FY2018
Proposed
Beginning Fund Balance $11.6M $11.9M $12.9M $12.1M
Total Operating Revenue 34.2M 35.7M 35.7M $36.5M
Total Operating Expense $31.8M $35.7M $34.5M $36.5M
Transfers
Transfer to Self-Funded Projects
Fund$0.8M $- $0.3M $1.0M
Transfer to IIF - 1.7M 1.7M -
Other Transfers 0.3M - - -
Ending Fund Balance $12.9M $10.2M $12.1M $11.1M
Fund Balance Percentage 40.5% 28.5% 35.0% 30.4%
14

General Fund Balance
FY2017
Budget
FY2017
EstimatedDifference
FY2018
Proposed
Beginning Fund Balance $11.9M $12.9M $1.0M $12.1M
Total Operating Revenue 35.7M 35.7M - 36.5M
Total Operating Expense $35.7M $34.5M ($1.2M) $36.5M
Transfers
Transfer to Self-Funded
Projects Fund (One-time)$- $0.3M $0.3M $1.0M
Transfer to IIF 1.7M 1.7M - -
Ending Fund Balance $10.2M $12.1M $1.9M $11.1M
Fund Balance Percentage 28.5% 35.0% 6.5% 30.4%
15
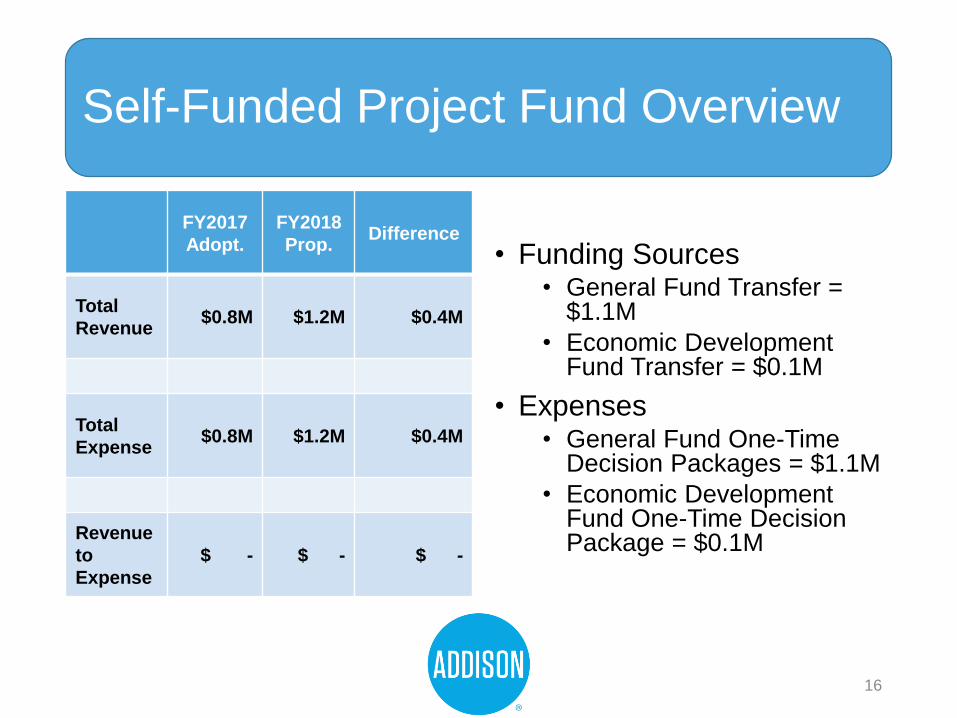
Self-Funded Project Fund Overview
FY2017
Adopt.
FY2018
Prop.Difference
Total
Revenue$0.8M $1.2M $0.4M
Total
Expense$0.8M $1.2M $0.4M
Revenue
to
Expense
$ - $ - $ -
• Funding Sources • General Fund Transfer =
$1.1M
• Economic Development Fund Transfer = $0.1M
• Expenses• General Fund One-Time
Decision Packages = $1.1M
• Economic Development Fund One-Time Decision Package = $0.1M
16

Project Funding
Asset Management Study (Phase 2) $157,000
Fire Training Center Equity Buy-in (Year 2 of 3)* 166,000
Records Management 50,000
Employee Handbook 15,000
Unified Development Code (Year 1 of 2) 175,000
Website Redesign 100,000
Parks Master Plan 125,000
Outdoor Pool Filters 128,000
Signal Timing 190,000
Economic Development Strategic Plan 100,000
*Fire Training Center budget should be $166K, not $110 as proposed.
Self-Funded Projects
17

Hotel Fund Overview(excluding transfers)
FY2017
Adopt.
FY2018
Prop.Difference
Total
Revenue$9.5M $8.9M ($0.6)M
Total
Expense$7.8M $7.7M ($0.1)M
Revenue
to
Expense
$1.7M $1.2M ($0.5)M
• Hotel Taxes = $5.8M
• Decrease of $240K
• Special Events Revenues = $2.4M
• Decrease of $337K
• Final Debt Payment
• $711K
1
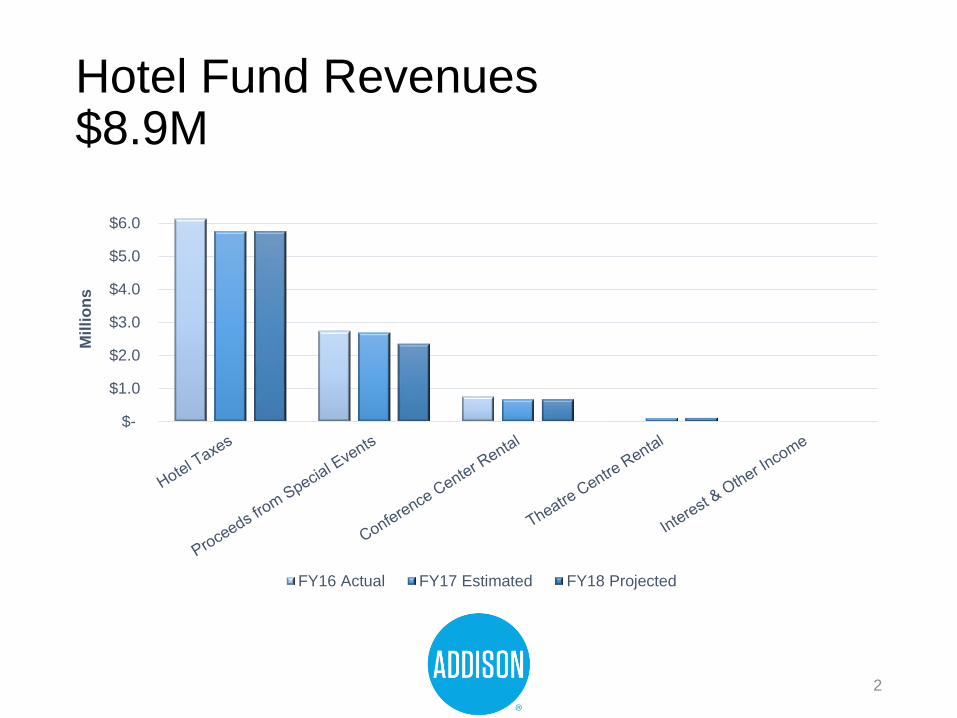
Hotel Fund Revenues$8.9M
$-
$1.0
$2.0
$3.0
$4.0
$5.0
$6.0
Mil
lio
ns
FY16 Actual FY17 Estimated FY18 Projected
2

Hotel Fund Revenues$8.9M
FY2016
Actual
FY2017
Budget
FY2018
Proposed
% Change
FY17 to
FY18
Hotel/Motel Occupancy Taxes $6.14M $6.00M $5.76M (4.0%)
Proceeds from Special Events 2.74M 2.69M 2.35M (12.5%)
Conference Centre Rental 0.76M 0.68M 0.68M -%
Theatre Centre Rental 0.03M 0.11M 0.12M 7.9%
Interest and Other Income 0.01M 0.02M 0.02M -%
TOTAL OPERATIONAL REVENUE $9.68M $9.50M $8.93M (6.0%)
3

Hotel Fund Expenses$7.7M (By category)
Personnel Services23.4%
Supplies1.4%
Maintenance5.9%
Contractual Services
67.7%
Capital Replacement/Lease
1.2%
Capital Outlay0.4%
4

Hotel Fund Expenses$7.7M (By function)
Marketing13.9%
Special Events Operations
12.3%
Special Events44.6%
Addison Theatre Centre5.4%
Conference Centre14.4%
Performing Arts5.8%
General Hotel Operations
3.6%
5
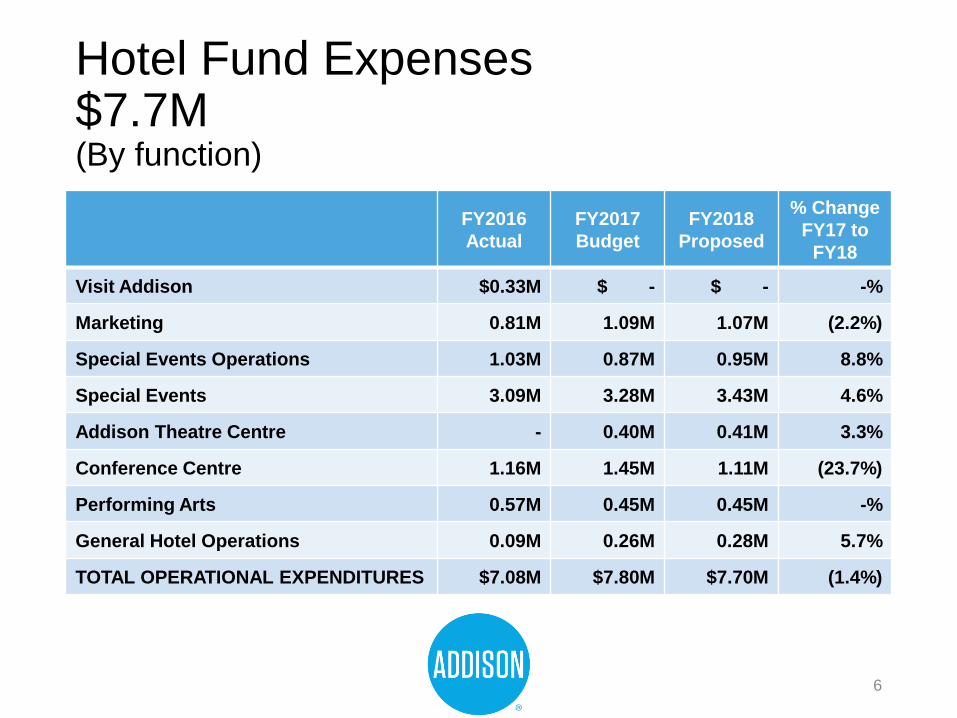
Hotel Fund Expenses$7.7M (By function)
FY2016
Actual
FY2017
Budget
FY2018
Proposed
% Change
FY17 to
FY18
Visit Addison $0.33M $ - $ - -%
Marketing 0.81M 1.09M 1.07M (2.2%)
Special Events Operations 1.03M 0.87M 0.95M 8.8%
Special Events 3.09M 3.28M 3.43M 4.6%
Addison Theatre Centre - 0.40M 0.41M 3.3%
Conference Centre 1.16M 1.45M 1.11M (23.7%)
Performing Arts 0.57M 0.45M 0.45M -%
General Hotel Operations 0.09M 0.26M 0.28M 5.7%
TOTAL OPERATIONAL EXPENDITURES $7.08M $7.80M $7.70M (1.4%)
6

FY2016
Actual
FY2017
Estimated
FY2018
Proposed
Taste of Addison
Revenue $ 790,202 $ 755,000 $ 690,000
Expense 1,025,500 1,151,000 1,227,667
Revenue to Expense ($235,298) ($396,000) ($537,667)
Kaboom Town
Revenue $ 86,549 $ 80,000 $ 82,000
Expense 355,000 350,000 426,875
Revenue to Expense ($268,451) ($270,000) ($344,875)
Oktoberfest
Revenue $1,856,840 $1,547,000 $1,554,000
Expense 1,711,000 1,391,154 1,466,250
Revenue to Expense $ 145,840 $ 155,846 $ 87,750
Special Events
7

Economic Development Fund
FY2017
Adopt.
FY2018
Prop.Difference
Total
Revenue$2.0M $1.7M ($0.3)M
Total
Expense$2.0M $1.7M ($0.3)M
Revenue
to
Expense
$ - $ - $ -
• Funding Sources • Ad Valorem = $1.0M
• Hotel Fund Transfer = $0.6M
• Expenses• Incentives = $0.3M
• Operations = $0.8M
• Tourism = $0.6M
8

Addison Grove Escrow Fund
FY2017
Adopt.
FY2018
Prop.Difference
Total
Revenue$1.0M $1.0M $-
Total
Expense$ - $ - $-
Revenue
to
Expense
$1.0M $1.0M $-
• Funding Sources • Utility Fund Transfer =
$0.5M
• Infrastructure Investment Fund Transfer = $0.5M
9
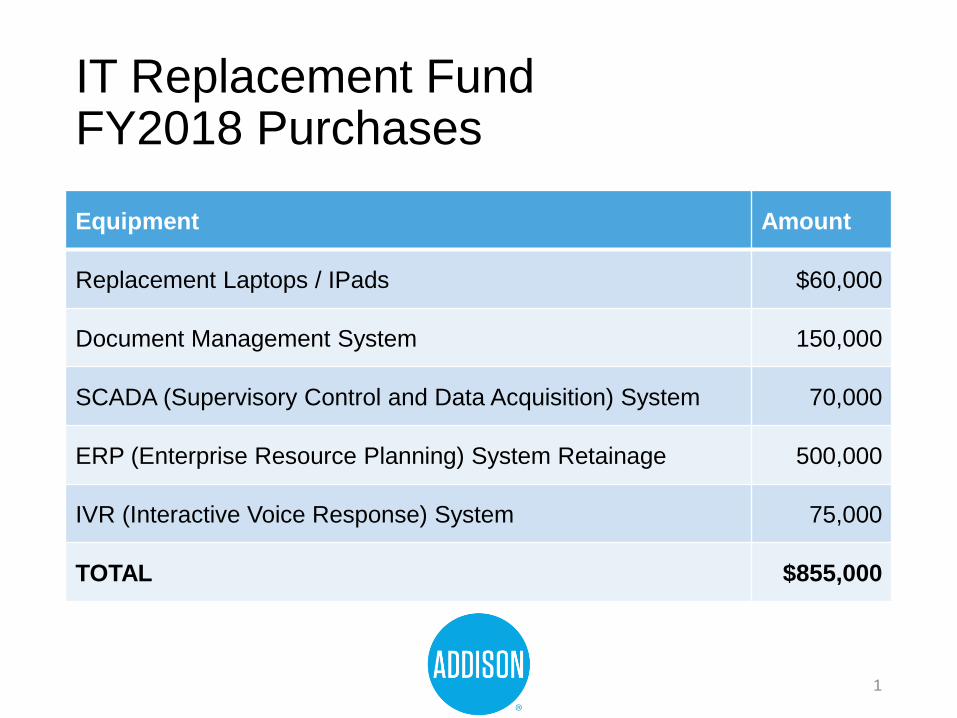
IT Replacement Fund FY2018 Purchases
Equipment Amount
Replacement Laptops / IPads $60,000
Document Management System 150,000
SCADA (Supervisory Control and Data Acquisition) System 70,000
ERP (Enterprise Resource Planning) System Retainage 500,000
IVR (Interactive Voice Response) System 75,000
TOTAL $855,000
1

Capital Replacement Fund FY2018 Purchases
Department Equipment Amount
FirePumper Truck $ 588,500
Utility Vehicle 227,310
PoliceACAP Vehicle (Hybrid-HEV)* 28,000
Two CID Vehicles 52,000
Streets Vermeer Chipper 75,000
General Services
CMAX Electric Vehicle 30,000
Fuel Dispenser & Monitor Replacement 70,000
TOTAL $1,070,810
*Cost-saving alternative has been found; this vehicle will not be replaced in FY2018.
2

Utility Operating Fund(excluding transfers)
FY2017
Adopt.
FY2018
Prop.Difference
Total
Revenue$10.7M $11.3M $0.6M
Total
Expense$11.2M $11.8M $0.6M
Revenue
to
Expense
($0.5)M ($0.5)M -
• Water • Sales = $6.3M• Purchases = $4.2M
• Wastewater• Charges = $4.9M• Treatment = $3.0M
• Operations = $3.5
• Debt Service = $1.1
1
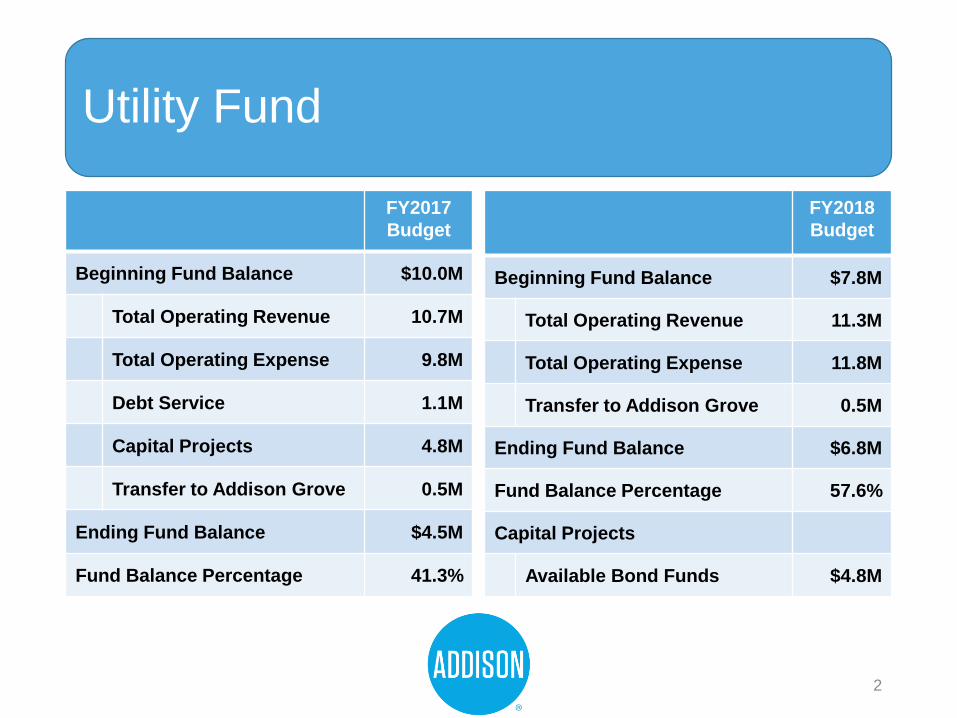
FY2017
Budget
Beginning Fund Balance $10.0M
Total Operating Revenue 10.7M
Total Operating Expense 9.8M
Debt Service 1.1M
Capital Projects 4.8M
Transfer to Addison Grove 0.5M
Ending Fund Balance $4.5M
Fund Balance Percentage 41.3%
FY2018
Budget
Beginning Fund Balance $7.8M
Total Operating Revenue 11.3M
Total Operating Expense 11.8M
Transfer to Addison Grove 0.5M
Ending Fund Balance $6.8M
Fund Balance Percentage 57.6%
Capital Projects
Available Bond Funds $4.8M
Utility Fund
2

Utility Fund Balance
FY2016
Actual
FY2017
Budget
FY2017
Estimated
FY2018
Proposed
Beginning Fund Balance $7.8M $10.1M $8.2M $7.8M
Total Operating Revenue 10.9M 10.7M 10.8M 11.3M
Total Operating Expense 10.5M 11.2M 10.7M 11.8M
Transfers
Transfer to Addison Grove
Fund- 0.5M 0.5M 0.5M
Ending Fund Balance $8.2M $9.1M $7.8M $6.8M
Fund Balance Percentage 77.6% 81.2% 73.3% 57.6%
3

Water and Sewer Rate Changes
Sample Residential Water and Sewer Bill
Consumption Existing New Rate
5,000 gallons $46.82 $48.99
8,000 gallons $68.57 $72.03
10,000 gallons $74.19 $77.91
4
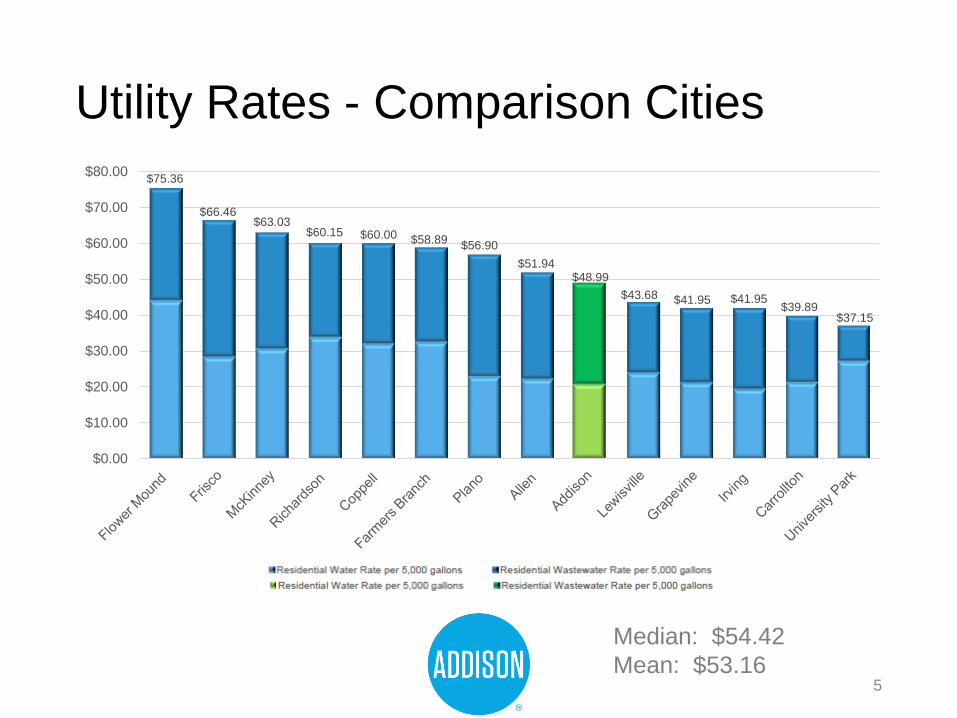
Utility Rates - Comparison Cities
Median: $54.42
Mean: $53.16
$75.36
$66.46$63.03
$60.15 $60.00 $58.89$56.90
$51.94$48.99
$43.68 $41.95 $41.95$39.89
$37.15
$0.00
$10.00
$20.00
$30.00
$40.00
$50.00
$60.00
$70.00
$80.00
5

Utility Rates – Dallas County
Median: $66.18
Mean: $64.48
$92.50
$87.94$87.50 $87.46
$83.72
$79.52 $77.47$75.28 $74.00
$73.30 $71.77 $71.04
$68.81 $67.26
$65.09$60.15 $60.04 $60.00 $58.89
$52.90 $52.10$48.99
$45.00$43.68
$41.95 $41.95$39.89
$37.15
$0.00
$10.00
$20.00
$30.00
$40.00
$50.00
$60.00
$70.00
$80.00
$90.00
$100.00
6

Stormwater Operating Fund(excluding transfers)
FY2017
Adopt.
FY2018
Prop.Difference
Total
Revenue$1.9M $2.0M $0.1M
Total
Expense$1.3M $1.3M $-
Revenue
to
Expense
$0.6M $0.7M $0.1M
• Drainage Fees = $2.0M• Rates increasing per
established schedule
• Expenses = $1.3M• Debt Payment of $0.5M
7

Stormwater Rates – FY2018
Rates Per Month FY2017 FY2018 Difference
Tier 1 Residential (1 to 1,999 SF) $5.70 $6.00 $0.30
Tier 2 Residential (2,000 to 3,399 SF) $9.50 $10.00 $0.50
Tier 3 Residential (3,400 to 4,999 SF) $14.25 $15.00 $0.75
Tier 4 Residential (5,000+ SF) $23.75 $25.00 $1.25
Nonresidential
(Per 1,000 SF of impervious area)$3.07 $3.23 $0.16
8

Airport Fund Overview
FY2017
Adopt.
FY2018
Prop.Difference
Total
Revenue$5.5M $5.5M $-
Total
Expense$4.9M $5.2M $0.3M
Revenue
to
Expense
$0.6 $0.3 ($0.3)M
• Funding Sources • Fuel Flowage =
$0.9M
• Leases = $4.4M
• Expenses• Operations = $4.6M
• Debt = $0.6M
9
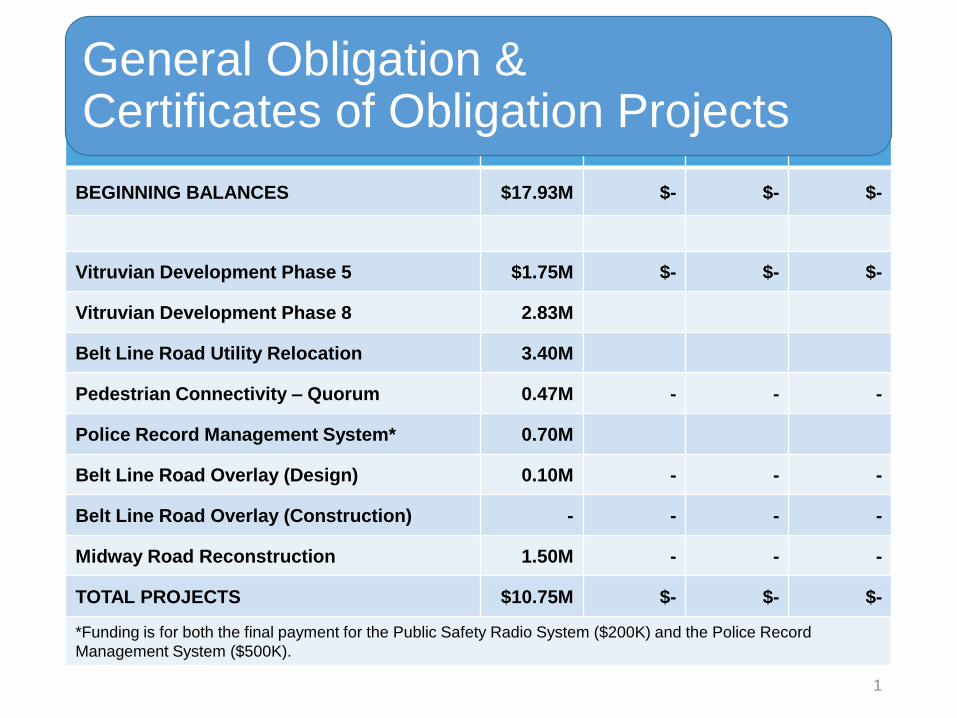
FY2018 FY2019 FY2020 FY2021
BEGINNING BALANCES $17.93M $- $- $-
Vitruvian Development Phase 5 $1.75M $- $- $-
Vitruvian Development Phase 8 2.83M
Belt Line Road Utility Relocation 3.40M
Pedestrian Connectivity – Quorum 0.47M - - -
Police Record Management System* 0.70M
Belt Line Road Overlay (Design) 0.10M - - -
Belt Line Road Overlay (Construction) - - - -
Midway Road Reconstruction 1.50M - - -
TOTAL PROJECTS $10.75M $- $- $-
*Funding is for both the final payment for the Public Safety Radio System ($200K) and the Police Record
Management System ($500K).
General Obligation & Certificates of Obligation Projects
1

FY2018 FY2019 FY2020 FY2021
BEGINNING BALANCES $4.79M $- $- $-
Surveyor Ground Storage Tank Rehabilitation $2.25M $- $- $-
Celestial Ground Storage Tank Rehabilitation
(Design)0.24M - - -
Kellway Lift Station Rehabilitation 0.37M - - -
Utility Plant Facilities and Pumps 0.18M - - -
Water Line Replacement 1.10M - - -
Sanitary Sewer Line Replacement 0.63M - - -
TOTAL PROJECTS $4.77M $- $- $-
Utility Fund Capital Projects
2
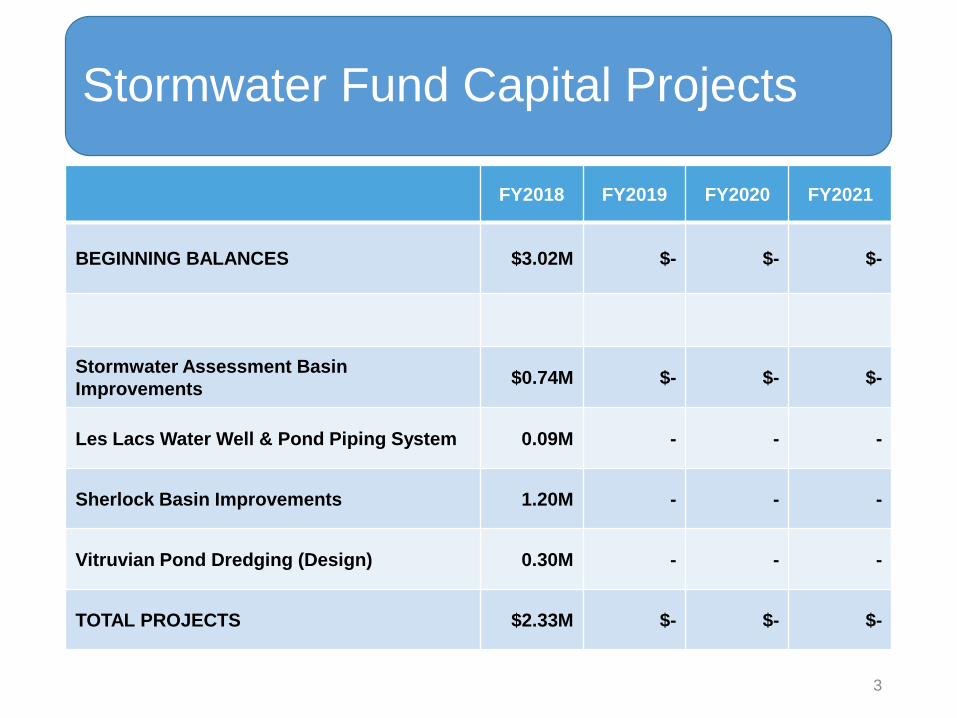
FY2018 FY2019 FY2020 FY2021
BEGINNING BALANCES $3.02M $- $- $-
Stormwater Assessment Basin
Improvements$0.74M $- $- $-
Les Lacs Water Well & Pond Piping System 0.09M - - -
Sherlock Basin Improvements 1.20M - - -
Vitruvian Pond Dredging (Design) 0.30M - - -
TOTAL PROJECTS $2.33M $- $- $-
Stormwater Fund Capital Projects
3
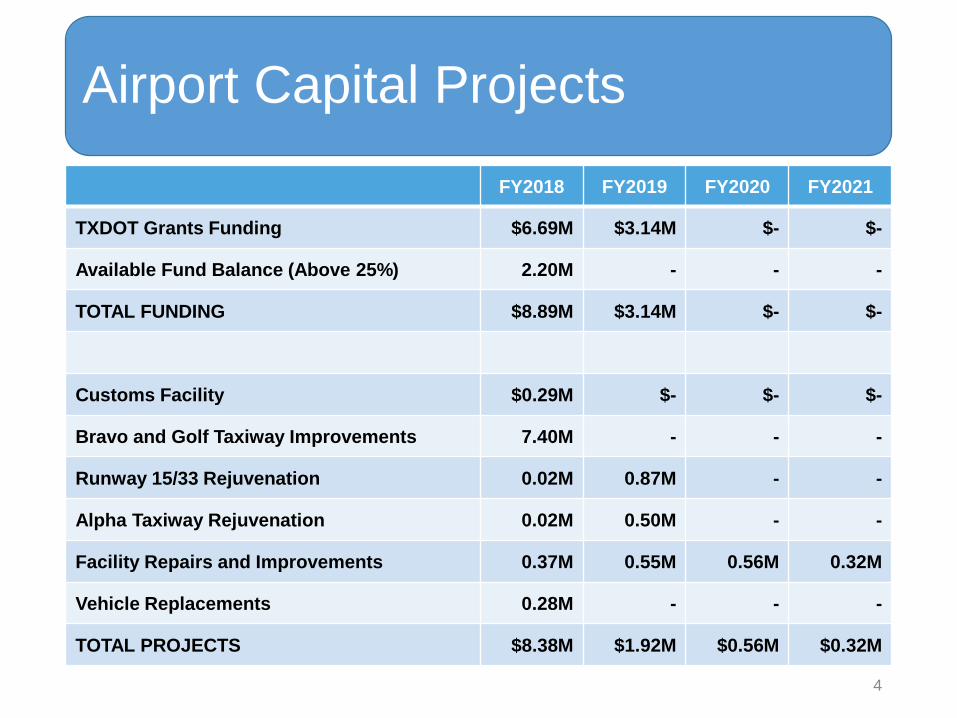
FY2018 FY2019 FY2020 FY2021
TXDOT Grants Funding $6.69M $3.14M $- $-
Available Fund Balance (Above 25%) 2.20M - - -
TOTAL FUNDING $8.89M $3.14M $- $-
Customs Facility $0.29M $- $- $-
Bravo and Golf Taxiway Improvements 7.40M - - -
Runway 15/33 Rejuvenation 0.02M 0.87M - -
Alpha Taxiway Rejuvenation 0.02M 0.50M - -
Facility Repairs and Improvements 0.37M 0.55M 0.56M 0.32M
Vehicle Replacements 0.28M - - -
TOTAL PROJECTS $8.38M $1.92M $0.56M $0.32M
Airport Capital Projects
4
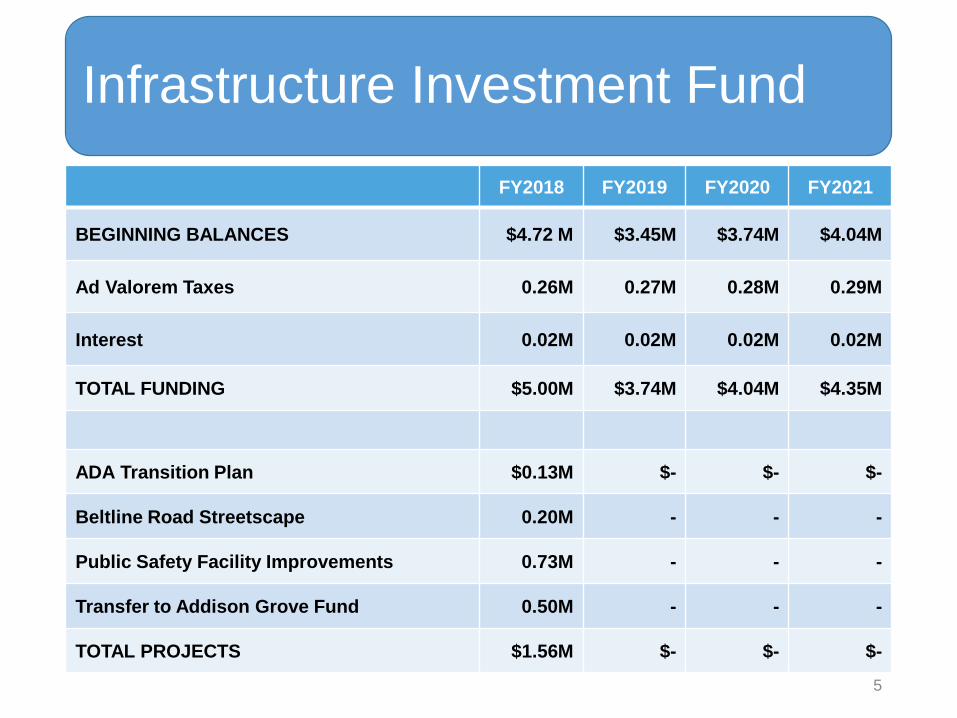
FY2018 FY2019 FY2020 FY2021
BEGINNING BALANCES $4.72 M $3.45M $3.74M $4.04M
Ad Valorem Taxes 0.26M 0.27M 0.28M 0.29M
Interest 0.02M 0.02M 0.02M 0.02M
TOTAL FUNDING $5.00M $3.74M $4.04M $4.35M
ADA Transition Plan $0.13M $- $- $-
Beltline Road Streetscape 0.20M - - -
Public Safety Facility Improvements 0.73M - - -
Transfer to Addison Grove Fund 0.50M - - -
TOTAL PROJECTS $1.56M $- $- $-
Infrastructure Investment Fund
5