budget briefs swachh bharat mission-urban (sbm-u)...
TRANSCRIPT
SUMMARY & ANALYSIS
HIGHLIGHTS
Accountability Initiative, Centre for Policy Research, Dharam Marg, Chanakyapuri, New Delhi - 110021
₹ 34,212 crGoI allocation for Ministry of Urban Development (MoUD) in FY 2017-18
₹ 2,300 crGoI allocations for SBM-U in FY 2017-18
Swachh Bharat Mission-Urban (SBM-U) GoI, 2017-18
BUDGET BRIEFSVol 10/ Issue 4
Prepared by: Devashish Deshpande, [email protected] & Avani Kapur, [email protected]
Swachh Bharat Mission (SBM) is the Government of India’s (GoI) nationwide flagship programme targeting universal sanitation coverage in urban areas .
Using government data, this brief reports on:
■ Allocations and releases ■ Physical progress of toilets built and Solid Waste Management (SWM)■ Funds released for Information, Education and Communication (IEC) activities■ Progress towards ending Open Defecation
Cost share and implementation: The total SBM-U project cost is estimated at `62,009 crore, of which GoI’s share is to be `14,787 crore. States and Union Territories (UTs) are to contribute a minimum of `4874 crore.
Complete expenditure data is publicly available up to FY 2016-17. Data for FY 2017-18 is till 10 January 2018.
■ In Financial Year (FY) 2017-18, GoI allocations for SBM-U stood at `2,300 crore (Budget Estimates), the same as the previous financial year but an increase of over 130 per cent from FY 2015-16.
■ Release of funds by GoI has been improving. In FY 2014-15, GoI released only 41 per cent of its allocation to states. This increased to 94 per cent in FY 2016-17. In FY 2017-18, till 10 January 2018, 61 per cent of GoI allocations had been released to states.
■ As on 10 January 2018, Rajasthan and Madhya Pradesh had already received 84 and 80 per cent of their total mission allocations, respectively. Karnataka, Punjab and Assam on the other hand, had received less than 20 per cent.
■ 44 per cent of total releases for FY 2017-18 till 10 January 2018, were for construction. As of November 2017, 42.72 lakh Individual Household Latrines(IHHL) had been constructed across India, accounting for 64 per cent of the revised IHHL mission target.
■ Release of funds for Information, Education and Communication (IEC) however remains low. Only 31 per cent of the total mission allocations for IEC had been released to states till 10 January 2018.
■ Till December 2017, 1,846 or 42 per cent of cities across India had been declared Open Defecation Free (ODF) and 30 per cent had been both declared verified.
2 ACCOUNTABILITY INITIATIVE, INDIA
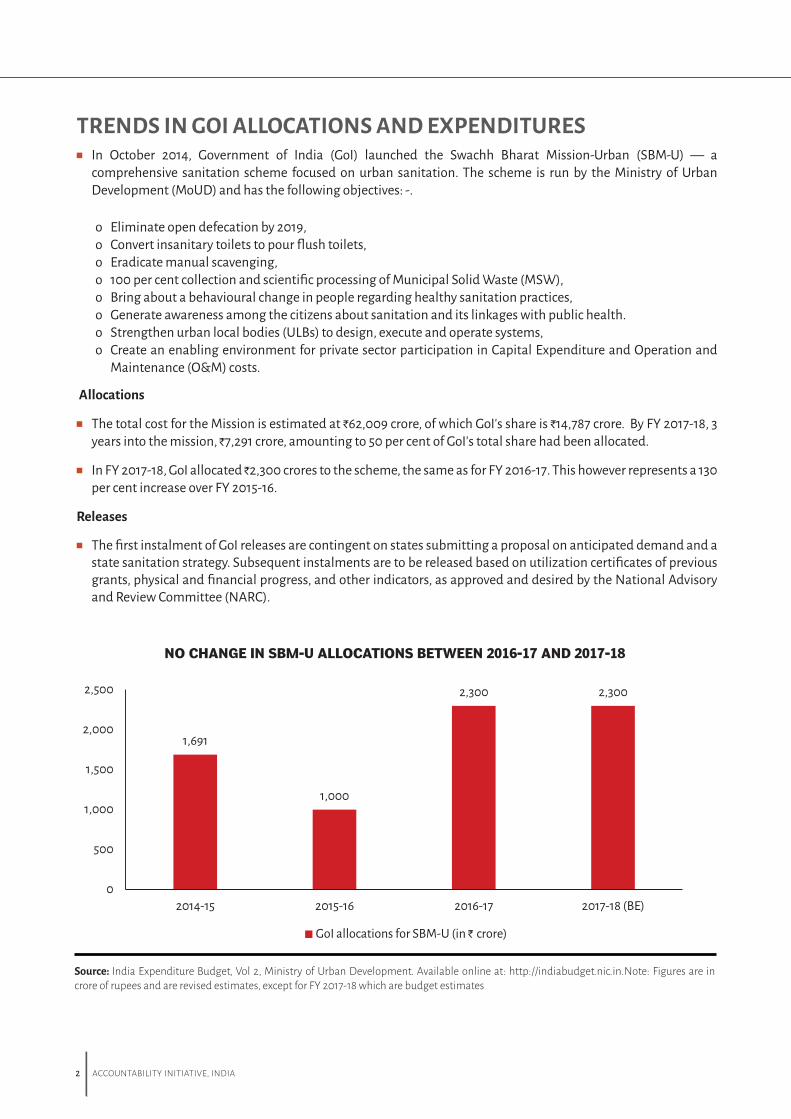
1,691
1,000
2,300 2,300
0
500
1,000
1,500
2,000
2,500
2014-15 2015-16 2016-17 2017-18 (BE)
GoI allocations for SBM-U (in ` crore)
■ In October 2014, Government of India (GoI) launched the Swachh Bharat Mission-Urban (SBM-U) — a comprehensive sanitation scheme focused on urban sanitation. The scheme is run by the Ministry of Urban Development (MoUD) and has the following objectives: -.
o Eliminate open defecation by 2019, o Convert insanitary toilets to pour flush toilets, o Eradicate manual scavenging, o 100 per cent collection and scientific processing of Municipal Solid Waste (MSW), o Bring about a behavioural change in people regarding healthy sanitation practices, o Generate awareness among the citizens about sanitation and its linkages with public health. o Strengthen urban local bodies (ULBs) to design, execute and operate systems, o Create an enabling environment for private sector participation in Capital Expenditure and Operation and
Maintenance (O&M) costs.
Allocations
■ The total cost for the Mission is estimated at `62,009 crore, of which GoI's share is `14,787 crore. By FY 2017-18, 3 years into the mission, `7,291 crore, amounting to 50 per cent of GoI's total share had been allocated.
■ In FY 2017-18, GoI allocated `2,300 crores to the scheme, the same as for FY 2016-17. This however represents a 130 per cent increase over FY 2015-16.
Releases
■ The first instalment of GoI releases are contingent on states submitting a proposal on anticipated demand and a state sanitation strategy. Subsequent instalments are to be released based on utilization certificates of previous grants, physical and financial progress, and other indicators, as approved and desired by the National Advisory and Review Committee (NARC).
TRENDS IN GOI ALLOCATIONS AND EXPENDITURES
Source: India Expenditure Budget, Vol 2, Ministry of Urban Development. Available online at: http://indiabudget.nic.in.Note: Figures are in crore of rupees and are revised estimates, except for FY 2017-18 which are budget estimates
NO CHANGE IN SBM-U ALLOCATIONS BETWEEN 2016-17 AND 2017-18
BUDGET BRIEFS, SBM-U, GOI 2017-18, VOL10/ISSUE4 3
■ There have, however, been year-wise variations in the release of funds. In FY 2014-15, GoI released 51 per cent of its allocation to states. In FY 2015-16, whilst allocations decreased, the release of funds improved and over 100 percent of total GoI allocations were released. Fund releases remained high in FY 2016-17 at 94 per cent of total allocations.
■ The pace of fund release however remains slow. In FY 2016-17, till January 2017, more than three quarters of the financial year, only 61 per cent of GoI allocations had been released. This trend continues in FY 2017-18 with 61 per cent of GoI allocations released till 10 January 2018.
TRENDS IN STATE-WISE ALLOCATIONS AND EXPENDITURES■ State-wise shares of total GoI allocations for the mission period (2014-2019) are determined based on the number
of statutory towns, their respective populations, and open defecation rates.
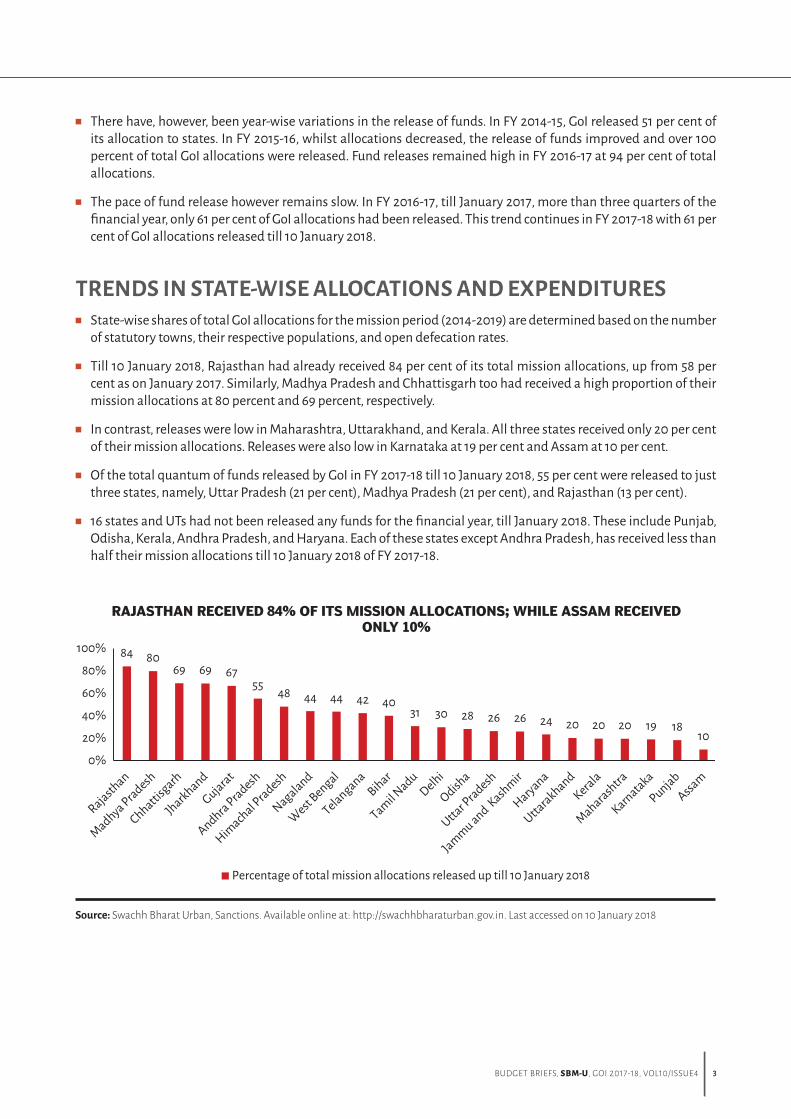
■ Till 10 January 2018, Rajasthan had already received 84 per cent of its total mission allocations, up from 58 per cent as on January 2017. Similarly, Madhya Pradesh and Chhattisgarh too had received a high proportion of their mission allocations at 80 percent and 69 percent, respectively.
■ In contrast, releases were low in Maharashtra, Uttarakhand, and Kerala. All three states received only 20 per cent of their mission allocations. Releases were also low in Karnataka at 19 per cent and Assam at 10 per cent.
■ Of the total quantum of funds released by GoI in FY 2017-18 till 10 January 2018, 55 per cent were released to just three states, namely, Uttar Pradesh (21 per cent), Madhya Pradesh (21 per cent), and Rajasthan (13 per cent).
■ 16 states and UTs had not been released any funds for the financial year, till January 2018. These include Punjab, Odisha, Kerala, Andhra Pradesh, and Haryana. Each of these states except Andhra Pradesh, has received less than half their mission allocations till 10 January 2018 of FY 2017-18.
Source: Swachh Bharat Urban, Sanctions. Available online at: http://swachhbharaturban.gov.in. Last accessed on 10 January 2018
RAJASTHAN RECEIVED 84% OF ITS MISSION ALLOCATIONS; WHILE ASSAM RECEIVED ONLY 10%
84 8069 69 67
55 48 44 44 42 4031 30 28 26 26 24 20 20 20 19 18
10
0%
20%
40%
60%
80%
100%
Percentage of total mission allocations released up till 10 January 2018
4 ACCOUNTABILITY INITIATIVE, INDIA
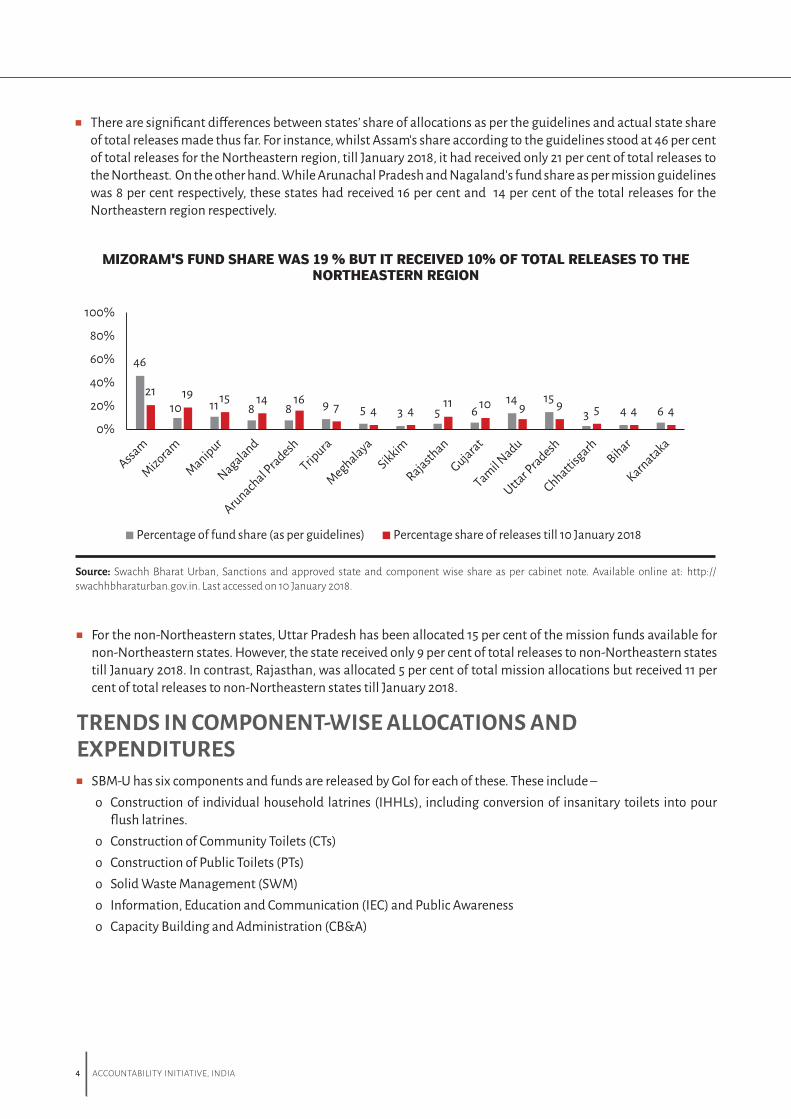
■ There are significant differences between states’ share of allocations as per the guidelines and actual state share of total releases made thus far. For instance, whilst Assam's share according to the guidelines stood at 46 per cent of total releases for the Northeastern region, till January 2018, it had received only 21 per cent of total releases to the Northeast. On the other hand. While Arunachal Pradesh and Nagaland's fund share as per mission guidelines was 8 per cent respectively, these states had received 16 per cent and 14 per cent of the total releases for the Northeastern region respectively.
Source: Swachh Bharat Urban, Sanctions and approved state and component wise share as per cabinet note. Available online at: http://swachhbharaturban.gov.in. Last accessed on 10 January 2018.
MIZORAM'S FUND SHARE WAS 19 % BUT IT RECEIVED 10% OF TOTAL RELEASES TO THE NORTHEASTERN REGION
Assam
Mizoram
Manipur
Nagaland
Arunachal Pradesh
Tripura
MeghalayaSikkim
Rajasthan
Gujarat
Tamil Nadu
Uttar P
radesh
Chhattisgarh
Bihar
Karnataka
46
10 11 8 8 9 5 3 5 614 15
3 4 621 19 15 14 16 7 4 4 11 10 9 9 5 4 4
0%
20%
40%
60%
80%
100%
Percentage of fund share (as per guidelines) Percentage share of releases till 10 January 2018
■ For the non-Northeastern states, Uttar Pradesh has been allocated 15 per cent of the mission funds available for non-Northeastern states. However, the state received only 9 per cent of total releases to non-Northeastern states till January 2018. In contrast, Rajasthan, was allocated 5 per cent of total mission allocations but received 11 per cent of total releases to non-Northeastern states till January 2018.
TRENDS IN COMPONENT-WISE ALLOCATIONS AND EXPENDITURES■ SBM-U has six components and funds are released by GoI for each of these. These include –
o Construction of individual household latrines (IHHLs), including conversion of insanitary toilets into pour flush latrines.
o Construction of Community Toilets (CTs)o Construction of Public Toilets (PTs)o Solid Waste Management (SWM)o Information, Education and Communication (IEC) and Public Awarenesso Capacity Building and Administration (CB&A)
BUDGET BRIEFS, SBM-U, GOI 2017-18, VOL10/ISSUE4 5
Source: Swachh Bharat Urban, Sanctions. Available online at: http://swachhbharaturban.gov.in. In 2014-15, Supplementary grants have not been included as the head under which they were released is not reported. Last accessed on 10 January 2018.
FOCUS SHIFTING TOWARDS SWM IN LAST TWO FISCAL YEARS
33
21
44 4651
74
44 44
105
10 73 1 2 3
0%
20%
40%
60%
80%
100%
2014-15 2015-16 2016-17 2017-18SWM releases as a proportion of total releases IHHL & CT/PT releases as a proportion of total releases
IEC releases as a proportion of total releases CB &A releases as a proportion of total releases
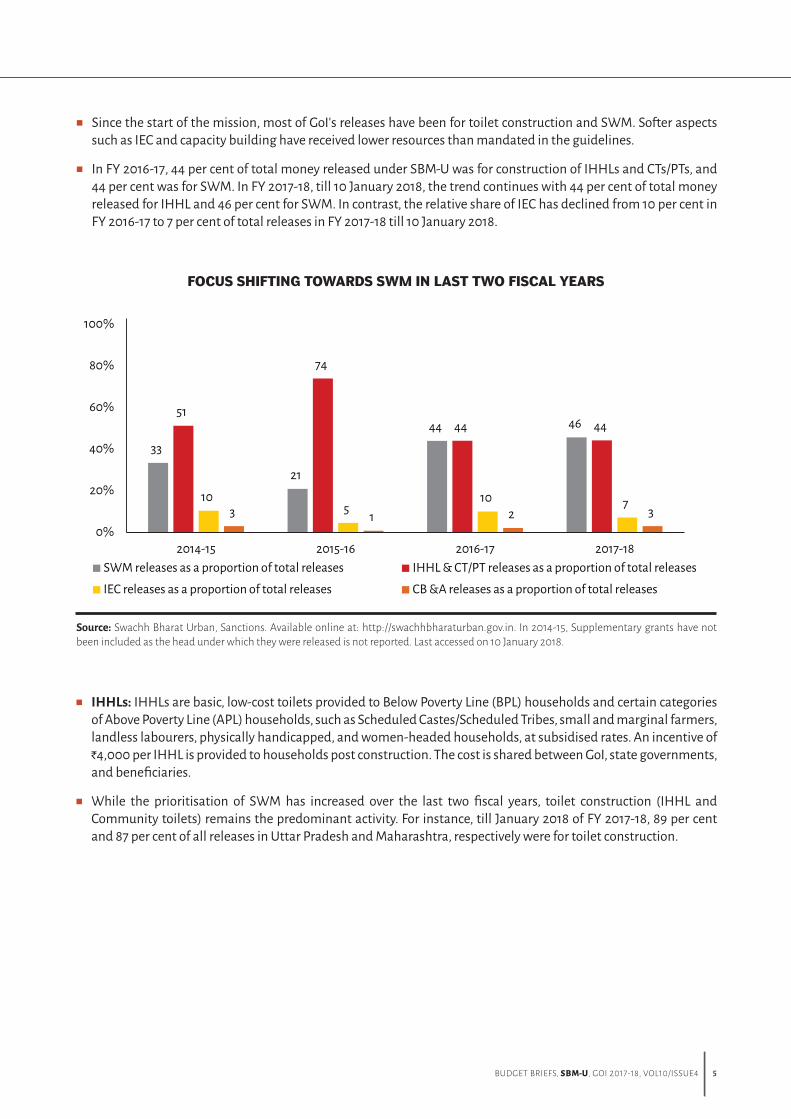
■ Since the start of the mission, most of GoI's releases have been for toilet construction and SWM. Softer aspects such as IEC and capacity building have received lower resources than mandated in the guidelines.
■ In FY 2016-17, 44 per cent of total money released under SBM-U was for construction of IHHLs and CTs/PTs, and 44 per cent was for SWM. In FY 2017-18, till 10 January 2018, the trend continues with 44 per cent of total money released for IHHL and 46 per cent for SWM. In contrast, the relative share of IEC has declined from 10 per cent in FY 2016-17 to 7 per cent of total releases in FY 2017-18 till 10 January 2018.
■ IHHLs: IHHLs are basic, low-cost toilets provided to Below Poverty Line (BPL) households and certain categories of Above Poverty Line (APL) households, such as Scheduled Castes/Scheduled Tribes, small and marginal farmers, landless labourers, physically handicapped, and women-headed households, at subsidised rates. An incentive of `4,000 per IHHL is provided to households post construction. The cost is shared between GoI, state governments, and beneficiaries.
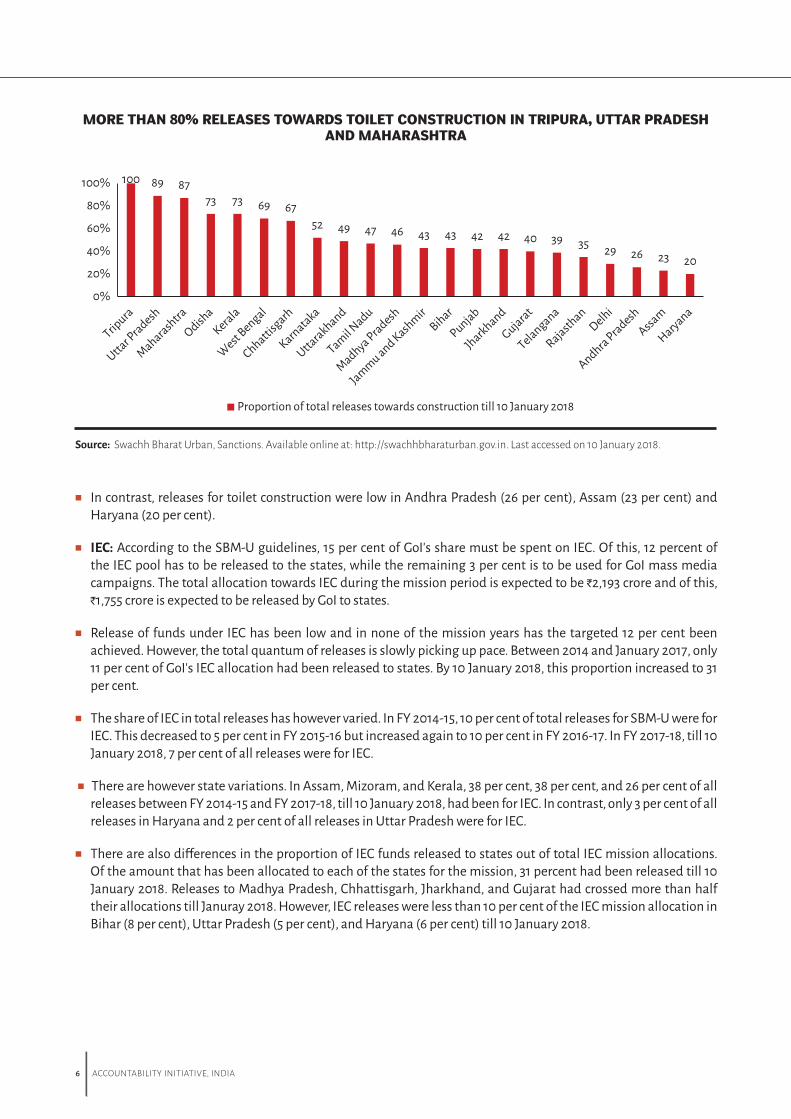
■ While the prioritisation of SWM has increased over the last two fiscal years, toilet construction (IHHL and Community toilets) remains the predominant activity. For instance, till January 2018 of FY 2017-18, 89 per cent and 87 per cent of all releases in Uttar Pradesh and Maharashtra, respectively were for toilet construction.
6 ACCOUNTABILITY INITIATIVE, INDIA
Source: Swachh Bharat Urban, Sanctions. Available online at: http://swachhbharaturban.gov.in. Last accessed on 10 January 2018.
MORE THAN 80% RELEASES TOWARDS TOILET CONSTRUCTION IN TRIPURA, UTTAR PRADESH AND MAHARASHTRA
100 89 8773 73 69 67
52 49 47 46 43 43 42 42 40 39 35 29 26 23 20
0%
20%
40%
60%
80%
100%
Proportion of total releases towards construction till 10 January 2018
■ In contrast, releases for toilet construction were low in Andhra Pradesh (26 per cent), Assam (23 per cent) and Haryana (20 per cent).
■ IEC: According to the SBM-U guidelines, 15 per cent of GoI's share must be spent on IEC. Of this, 12 percent of the IEC pool has to be released to the states, while the remaining 3 per cent is to be used for GoI mass media campaigns. The total allocation towards IEC during the mission period is expected to be `2,193 crore and of this, `1,755 crore is expected to be released by GoI to states.
■ Release of funds under IEC has been low and in none of the mission years has the targeted 12 per cent been achieved. However, the total quantum of releases is slowly picking up pace. Between 2014 and January 2017, only 11 per cent of GoI's IEC allocation had been released to states. By 10 January 2018, this proportion increased to 31 per cent.
■ The share of IEC in total releases has however varied. In FY 2014-15, 10 per cent of total releases for SBM-U were for IEC. This decreased to 5 per cent in FY 2015-16 but increased again to 10 per cent in FY 2016-17. In FY 2017-18, till 10 January 2018, 7 per cent of all releases were for IEC.
■ There are however state variations. In Assam, Mizoram, and Kerala, 38 per cent, 38 per cent, and 26 per cent of all releases between FY 2014-15 and FY 2017-18, till 10 January 2018, had been for IEC. In contrast, only 3 per cent of all releases in Haryana and 2 per cent of all releases in Uttar Pradesh were for IEC.
■ There are also differences in the proportion of IEC funds released to states out of total IEC mission allocations. Of the amount that has been allocated to each of the states for the mission, 31 percent had been released till 10 January 2018. Releases to Madhya Pradesh, Chhattisgarh, Jharkhand, and Gujarat had crossed more than half their allocations till Januray 2018. However, IEC releases were less than 10 per cent of the IEC mission allocation in Bihar (8 per cent), Uttar Pradesh (5 per cent), and Haryana (6 per cent) till 10 January 2018.
BUDGET BRIEFS, SBM-U, GOI 2017-18, VOL10/ISSUE4 7
Source: Swachh Bharat Urban, Sanctions, and Approved State and Component Wise Share of GoI Contribution. Available online at: http://swachhbharaturban.gov.in. Last accessed on 10 January 2018.
Source: Swachh Bharat Urban, Sanctions, and Approved State and Component Wise Share of GoI Contribution. Available online at: http://swachhbharaturban.gov.in. Last accessed on 10 January 2018.
BIHAR, HARYANA, AND UTTAR PRADESH HAD RECEIVED LESS THAN 10% OF THEIR IEC MISSION ALLOCATIONS TILL JANUARY 2018
KERALA HAS NOT BEEN RELEASED ANY FUNDS TOWARDS SWM
6254 52 51 47 46 39 36 35 33 33
26 2619 13 13 8 6 510
26
6 8 6 11 7 615
22 2210 8
176
38
2 3 20%
20%
40%
60%
80%
100%
Proportion of IEC allocation released till 10 January 2018 IEC releases as a proportion of all releases 10 January 2018
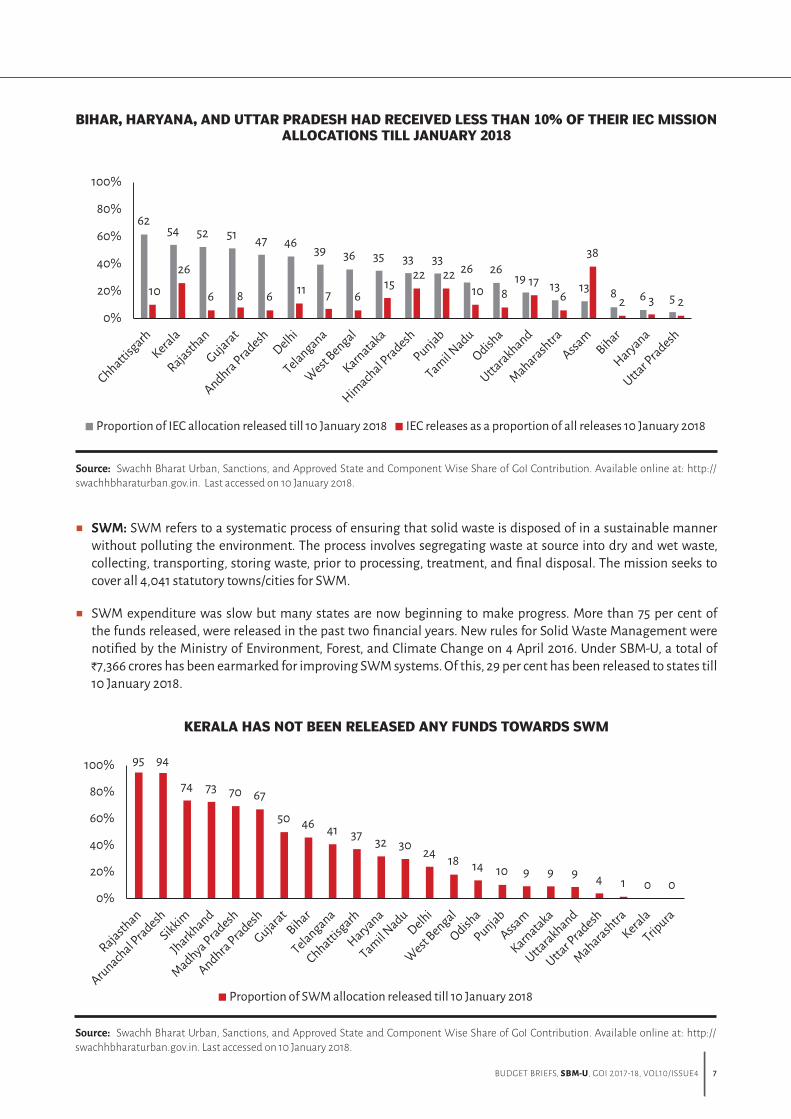
■ SWM: SWM refers to a systematic process of ensuring that solid waste is disposed of in a sustainable manner without polluting the environment. The process involves segregating waste at source into dry and wet waste, collecting, transporting, storing waste, prior to processing, treatment, and final disposal. The mission seeks to cover all 4,041 statutory towns/cities for SWM.
■ SWM expenditure was slow but many states are now beginning to make progress. More than 75 per cent of the funds released, were released in the past two financial years. New rules for Solid Waste Management were notified by the Ministry of Environment, Forest, and Climate Change on 4 April 2016. Under SBM-U, a total of `7,366 crores has been earmarked for improving SWM systems. Of this, 29 per cent has been released to states till 10 January 2018.
95 94
74 73 70 67
50 46 41 37 32 30 24 18 14 10 9 9 9 4 1 0 00%
20%
40%
60%
80%
100%
Proportion of SWM allocation released till 10 January 2018
8 ACCOUNTABILITY INITIATIVE, INDIA
■ There are however state variations. While Rajasthan (95 per cent), Madhya Pradesh (70 per cent), and Andhra Pradesh (67 per cent) had received more than half their mission allocations, Uttar Pradesh (4 per cent), and Maharashtra (1 per cent) had been released less than 5 per cent of their mission allocations.
■ Four states and UTs including Tripura, and Kerala are yet to get any releases from their SWM allocations during the mission period. In FY 2017-18, 24 states and UTs were yet to receive any funds for SWM till 10 January 2018.
■ Release of funds was concentrated in a few states. Five states, namely Rajasthan (16 per cent), Madhya Pradesh (14 per cent), Gujarat (13 per cent), Tamil Nadu (1o per cent), and Andhra Pradesh (10 per cent) account for 62 per cent of all releases for SWM during the mission period till 10 January 2018.
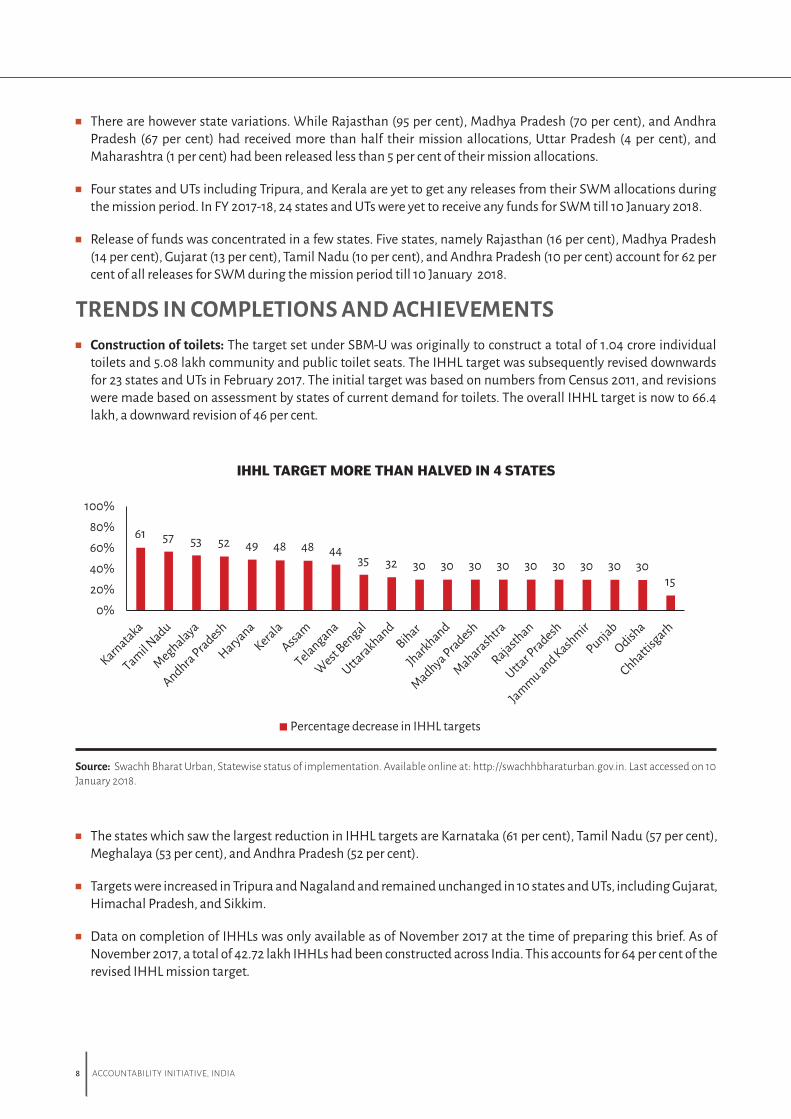
TRENDS IN COMPLETIONS AND ACHIEVEMENTS■ Construction of toilets: The target set under SBM-U was originally to construct a total of 1.04 crore individual
toilets and 5.08 lakh community and public toilet seats. The IHHL target was subsequently revised downwards for 23 states and UTs in February 2017. The initial target was based on numbers from Census 2011, and revisions were made based on assessment by states of current demand for toilets. The overall IHHL target is now to 66.4 lakh, a downward revision of 46 per cent.
Source: Swachh Bharat Urban, Statewise status of implementation. Available online at: http://swachhbharaturban.gov.in. Last accessed on 10 January 2018.
IHHL TARGET MORE THAN HALVED IN 4 STATES
61 57 53 52 49 48 48 4435 32 30 30 30 30 30 30 30 30 30
15
0%20%40%60%80%
100%
Percentage decrease in IHHL targets
■ The states which saw the largest reduction in IHHL targets are Karnataka (61 per cent), Tamil Nadu (57 per cent), Meghalaya (53 per cent), and Andhra Pradesh (52 per cent).
■ Targets were increased in Tripura and Nagaland and remained unchanged in 10 states and UTs, including Gujarat, Himachal Pradesh, and Sikkim.
■ Data on completion of IHHLs was only available as of November 2017 at the time of preparing this brief. As of November 2017, a total of 42.72 lakh IHHLs had been constructed across India. This accounts for 64 per cent of the revised IHHL mission target.
BUDGET BRIEFS, SBM-U, GOI 2017-18, VOL10/ISSUE4 9
142 138105 101 99 96 71 67 65 54 46 41 41 39 35 28 26 24 13 12
15 1 5 27
24 3 3 2570
41 25 916 40 31
3 30%
40%
80%
120%
160%
Percentage of revised IHHL target in progress till November 2017
Percentage of revised IHHL target completed till November 2017
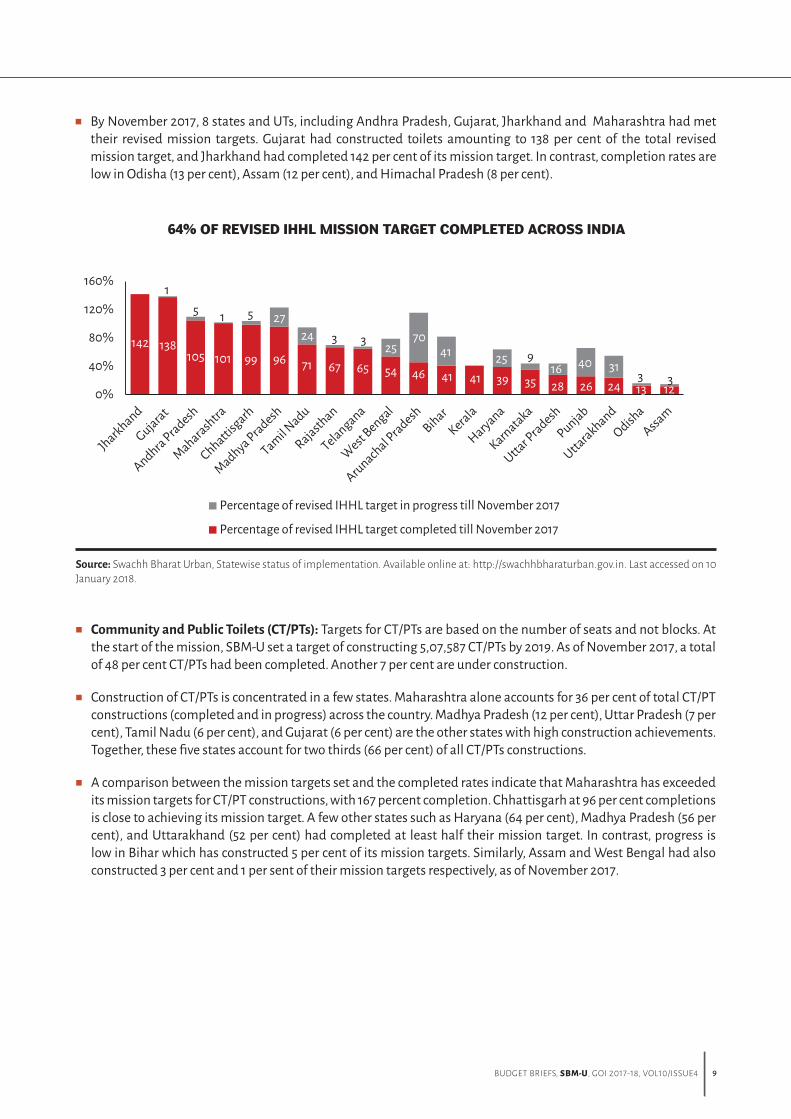
■ By November 2017, 8 states and UTs, including Andhra Pradesh, Gujarat, Jharkhand and Maharashtra had met their revised mission targets. Gujarat had constructed toilets amounting to 138 per cent of the total revised mission target, and Jharkhand had completed 142 per cent of its mission target. In contrast, completion rates are low in Odisha (13 per cent), Assam (12 per cent), and Himachal Pradesh (8 per cent).
64% OF REVISED IHHL MISSION TARGET COMPLETED ACROSS INDIA
Source: Swachh Bharat Urban, Statewise status of implementation. Available online at: http://swachhbharaturban.gov.in. Last accessed on 10 January 2018.
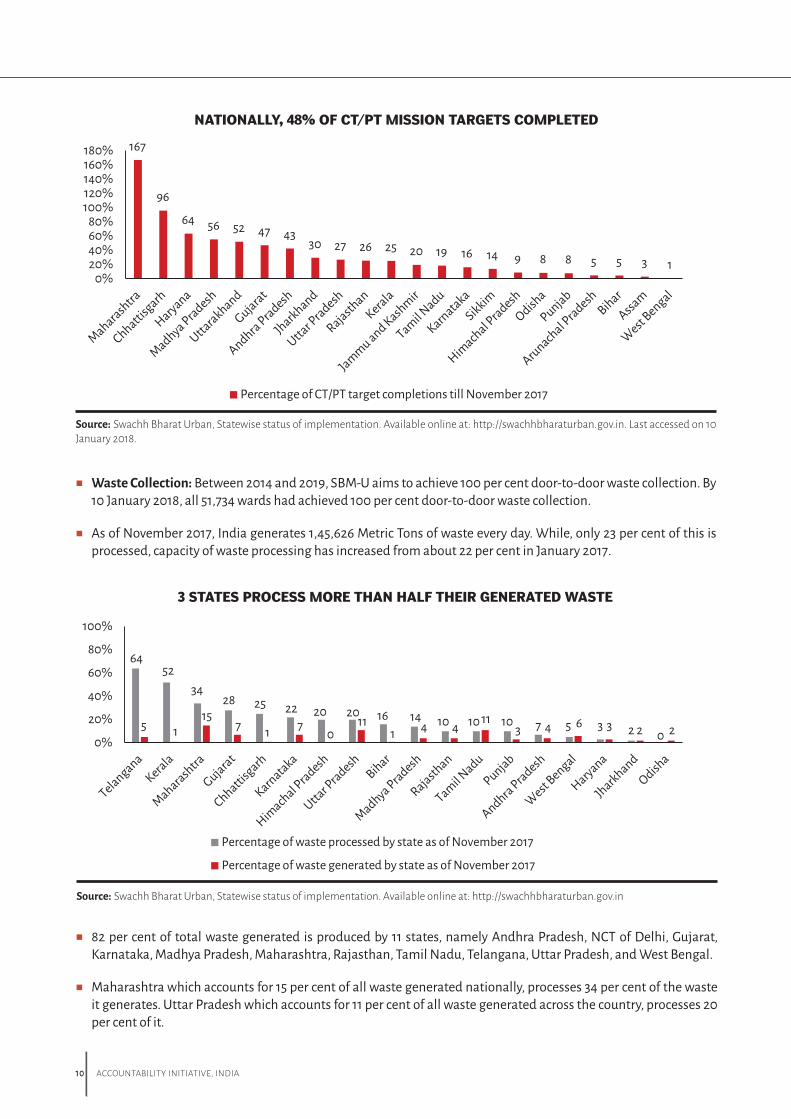
■ Community and Public Toilets (CT/PTs): Targets for CT/PTs are based on the number of seats and not blocks. At the start of the mission, SBM-U set a target of constructing 5,07,587 CT/PTs by 2019. As of November 2017, a total of 48 per cent CT/PTs had been completed. Another 7 per cent are under construction.
■ Construction of CT/PTs is concentrated in a few states. Maharashtra alone accounts for 36 per cent of total CT/PT constructions (completed and in progress) across the country. Madhya Pradesh (12 per cent), Uttar Pradesh (7 per cent), Tamil Nadu (6 per cent), and Gujarat (6 per cent) are the other states with high construction achievements. Together, these five states account for two thirds (66 per cent) of all CT/PTs constructions.
■ A comparison between the mission targets set and the completed rates indicate that Maharashtra has exceeded its mission targets for CT/PT constructions, with 167 percent completion. Chhattisgarh at 96 per cent completions is close to achieving its mission target. A few other states such as Haryana (64 per cent), Madhya Pradesh (56 per cent), and Uttarakhand (52 per cent) had completed at least half their mission target. In contrast, progress is low in Bihar which has constructed 5 per cent of its mission targets. Similarly, Assam and West Bengal had also constructed 3 per cent and 1 per sent of their mission targets respectively, as of November 2017.
10 ACCOUNTABILITY INITIATIVE, INDIA
167
96
64 56 52 47 4330 27 26 25 20 19 16 14 9 8 8 5 5 3 1
0%20%40%60%80%
100%120%140%160%180%
Percentage of CT/PT target completions till November 2017
NATIONALLY, 48% OF CT/PT MISSION TARGETS COMPLETED
Source: Swachh Bharat Urban, Statewise status of implementation. Available online at: http://swachhbharaturban.gov.in. Last accessed on 10 January 2018.
■ Waste Collection: Between 2014 and 2019, SBM-U aims to achieve 100 per cent door-to-door waste collection. By 10 January 2018, all 51,734 wards had achieved 100 per cent door-to-door waste collection.
■ As of November 2017, India generates 1,45,626 Metric Tons of waste every day. While, only 23 per cent of this is processed, capacity of waste processing has increased from about 22 per cent in January 2017.
6452
3428 25 22 20 20 16 14 10 10 10 7 5 3 2 0
5 115
7 1 70
111 4 4
113 4 6 3 2 2
0%
20%
40%
60%
80%
100%
Percentage of waste processed by state as of November 2017
Percentage of waste generated by state as of November 2017
3 STATES PROCESS MORE THAN HALF THEIR GENERATED WASTE
Source: Swachh Bharat Urban, Statewise status of implementation. Available online at: http://swachhbharaturban.gov.in
■ 82 per cent of total waste generated is produced by 11 states, namely Andhra Pradesh, NCT of Delhi, Gujarat, Karnataka, Madhya Pradesh, Maharashtra, Rajasthan, Tamil Nadu, Telangana, Uttar Pradesh, and West Bengal.
■ Maharashtra which accounts for 15 per cent of all waste generated nationally, processes 34 per cent of the waste it generates. Uttar Pradesh which accounts for 11 per cent of all waste generated across the country, processes 20 per cent of it.
BUDGET BRIEFS, SBM-U, GOI 2017-18, VOL10/ISSUE4 11
Source: Swachh Bharat Urban, monthly newsletter for December 2017. Last accessed on 10 January 2018.
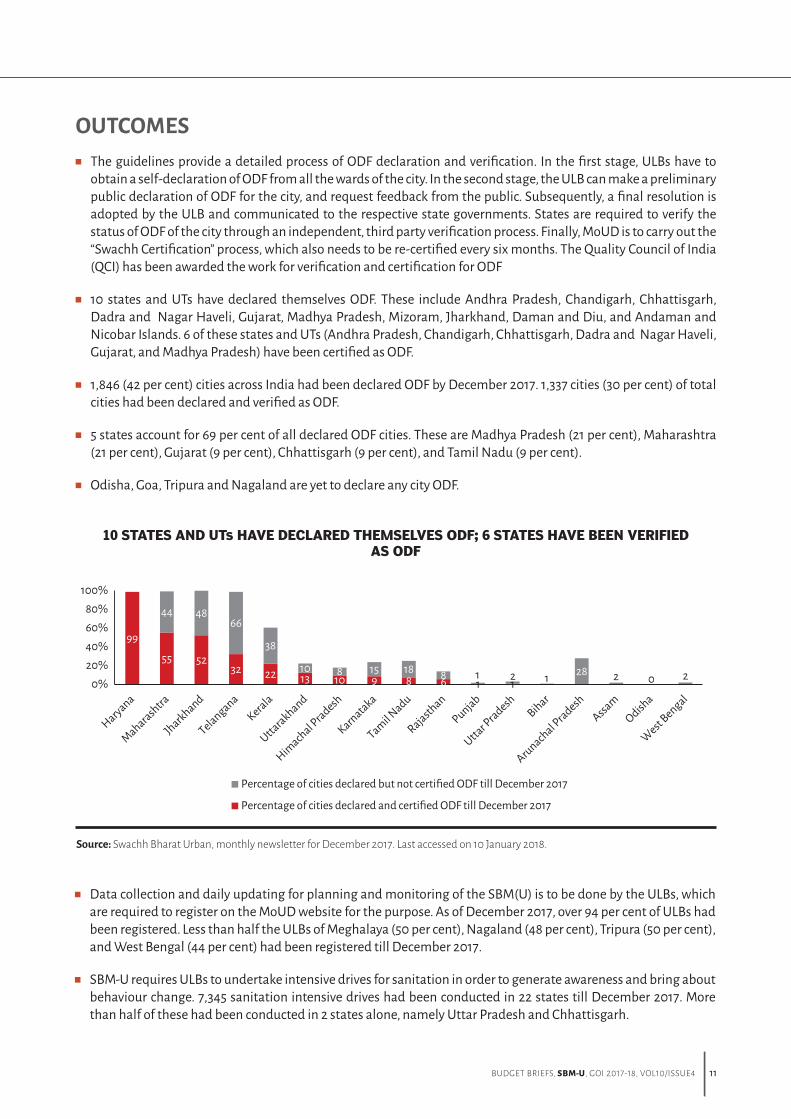
10 STATES AND UTs HAVE DECLARED THEMSELVES ODF; 6 STATES HAVE BEEN VERIFIED AS ODF
99
55 5232 22 13 10 9 8 6 1 1 1 0
44 4866
38
10 8 15 18 8 1 2 28 2 20%
20%40%60%80%
100%
Percentage of cities declared but not certified ODF till December 2017
Percentage of cities declared and certified ODF till December 2017
OUTCOMES■ The guidelines provide a detailed process of ODF declaration and verification. In the first stage, ULBs have to
obtain a self-declaration of ODF from all the wards of the city. In the second stage, the ULB can make a preliminary public declaration of ODF for the city, and request feedback from the public. Subsequently, a final resolution is adopted by the ULB and communicated to the respective state governments. States are required to verify the status of ODF of the city through an independent, third party verification process. Finally, MoUD is to carry out the “Swachh Certification” process, which also needs to be re-certified every six months. The Quality Council of India (QCI) has been awarded the work for verification and certification for ODF
■ 10 states and UTs have declared themselves ODF. These include Andhra Pradesh, Chandigarh, Chhattisgarh, Dadra and Nagar Haveli, Gujarat, Madhya Pradesh, Mizoram, Jharkhand, Daman and Diu, and Andaman and Nicobar Islands. 6 of these states and UTs (Andhra Pradesh, Chandigarh, Chhattisgarh, Dadra and Nagar Haveli, Gujarat, and Madhya Pradesh) have been certified as ODF.
■ 1,846 (42 per cent) cities across India had been declared ODF by December 2017. 1,337 cities (30 per cent) of total cities had been declared and verified as ODF.
■ 5 states account for 69 per cent of all declared ODF cities. These are Madhya Pradesh (21 per cent), Maharashtra (21 per cent), Gujarat (9 per cent), Chhattisgarh (9 per cent), and Tamil Nadu (9 per cent).
■ Odisha, Goa, Tripura and Nagaland are yet to declare any city ODF.
■ Data collection and daily updating for planning and monitoring of the SBM(U) is to be done by the ULBs, which are required to register on the MoUD website for the purpose. As of December 2017, over 94 per cent of ULBs had been registered. Less than half the ULBs of Meghalaya (50 per cent), Nagaland (48 per cent), Tripura (50 per cent), and West Bengal (44 per cent) had been registered till December 2017.
■ SBM-U requires ULBs to undertake intensive drives for sanitation in order to generate awareness and bring about behaviour change. 7,345 sanitation intensive drives had been conducted in 22 states till December 2017. More than half of these had been conducted in 2 states alone, namely Uttar Pradesh and Chhattisgarh.
12 ACCOUNTABILITY INITIATIVE, INDIA
■ 21,288 Swachhagrahis had been identified across the country till December 2017. Tamil Nadu (21 per cent), Andhra Pradesh (16 per cent), and Madhya Pradesh ( 15 per cent) account for more than half of them.
INCONSISTENCIES IN MIS■ The SBM-U website currently has data reported in 2 separate Management Information Systems(MIS). There is
incongruence between several data points presented in the two systems which makes it difficult to assess the true extent of progress made under the programme.
■ While one MIS reported that till December 2017, all wards (51,734) had achieved 100 per cent door-to-door waste collection, elsewhere it was reported that this proportion is 67 per cent (55,913 out of 82,607).
■ The number of completed IHHLs have decreased by 2,08,781 across 7 states and UTs between November 2016 and November 2017. These states and UTs are: Andhra Pradesh (-1,31,530), Uttar Pradesh (-36,904), Kerala (-26,056), Chandigarh (-12,833), Sikkim (-526), Himachal Pradesh (-490), and Goa (-442).
■ The number of CT/PTs have reduced by 36,754 across 5 states between November 2016 and November 2017. These states include Tamil Nadu (-32,780), Assam (-1,871), Andhra Pradesh (-1,479), Telangana (-539), and Manipur (-85).
■ Even between October 2017 and November 2017, the number CT/PTs completed reduced by 1,36,40 across 10 states. These include Andhra Pradesh (-3,330), Delhi (-3,777), Tamil Nadu (-3,271), Rajasthan (-1,082), and Telangana (-2,028).