british columbia municipal spending watch · bc municipal spending watch 2018 – trends in...
TRANSCRIPT
British Columbia Municipal Spending Watch
11th EDITION
Trends in Operating Spending, 2006-2016
September 2018
BC MUNICIPAL SPENDING WATCH 2018 – Trends in Operating Spending, 2006-2016
Contents
Executive Summary _____________________________________________________________ 3
Introduction ____________________________________________________________________ 3
2. Key Findings __________________________________________________________________ 6
Province-wide highlights _______________________________________________________________ 6
3. Twenty Largest Municipalities – Summary of the Results _______________________ 7
Short-term trends (2015 – 2016) ________________________________________________________ 9
4. Municipal Spending Trends___________________________________________________ 10
5. Municipal Revenues and Property Taxation ___________________________________ 11
6. Municipal Innovation in Cost Saving and Diversifying Revenue Streams _______ 14
Share resources _______________________________________________________________________ 15
Make the most of publically owned assets _____________________________________________ 15
Invest in new technologies ____________________________________________________________ 16
Change inefficient practices ___________________________________________________________ 16
8. Conclusions and Recommendations __________________________________________ 17
Appendix 1 ____________________________________________________________________ 21
Methodology __________________________________________________________________________ 21
Appendix 2 ____________________________________________________________________ 22
Appendix 3 ____________________________________________________________________ 27
Appendix 4 ____________________________________________________________________ 30
Appendix 5 ____________________________________________________________________ 35
Cumulative Wage Sources ______________________________________________________ 37
BC MUNICIPAL SPENDING WATCH 2018 – Trends in Operating Spending, 2006-2016
Executive Summary
The Canadian Federation of Independent Business (CFIB) has tracked municipal
spending growth for over 10 years. Every year has seen spending grow beyond a
sustainable rate, which raises the financial burden on British Columbians, including
entrepreneurs. Between 2006 and 2016, municipal spending increased 43 per cent
while BC’s population only grew by 12 per cent. This is far above the benchmark for
sustainable operating spending growth, which is to keep spending at or below the rate
of inflation plus population growth1. If municipal spending had been kept in line with
that benchmark, the average family of four could have saved $7,695 in municipal taxes
over this 10 year period. While it is clear that the current rate of municipal spending is
unsustainable, municipalities have many opportunities to innovate and trim excess
costs while providing better services. This report will both examine current trends in
municipal spending and highlight best practises BC municipalities have adopted to
curb costs.
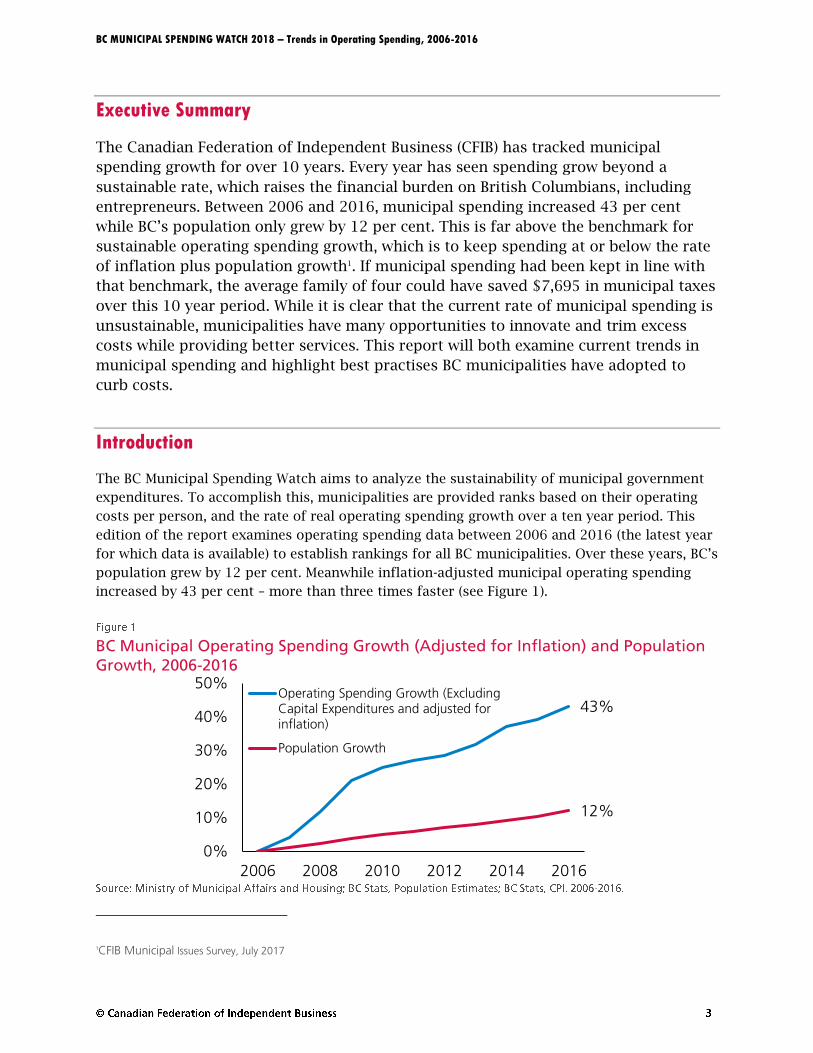
Introduction
The BC Municipal Spending Watch aims to analyze the sustainability of municipal government
expenditures. To accomplish this, municipalities are provided ranks based on their operating
costs per person, and the rate of real operating spending growth over a ten year period. This
edition of the report examines operating spending data between 2006 and 2016 (the latest year
for which data is available) to establish rankings for all BC municipalities. Over these years, BC’s
population grew by 12 per cent. Meanwhile inflation-adjusted municipal operating spending
increased by 43 per cent – more than three times faster (see Figure 1).
BC Municipal Operating Spending Growth (Adjusted for Inflation) and Population
Growth, 2006-2016
1CFIB Municipal Issues Survey, July 2017
43%
12%
0%
10%
20%
30%
40%
50%
2006 2008 2010 2012 2014 2016
Operating Spending Growth (ExcludingCapital Expenditures and adjusted forinflation)
Population Growth
BC MUNICIPAL SPENDING WATCH 2018 – Trends in Operating Spending, 2006-2016
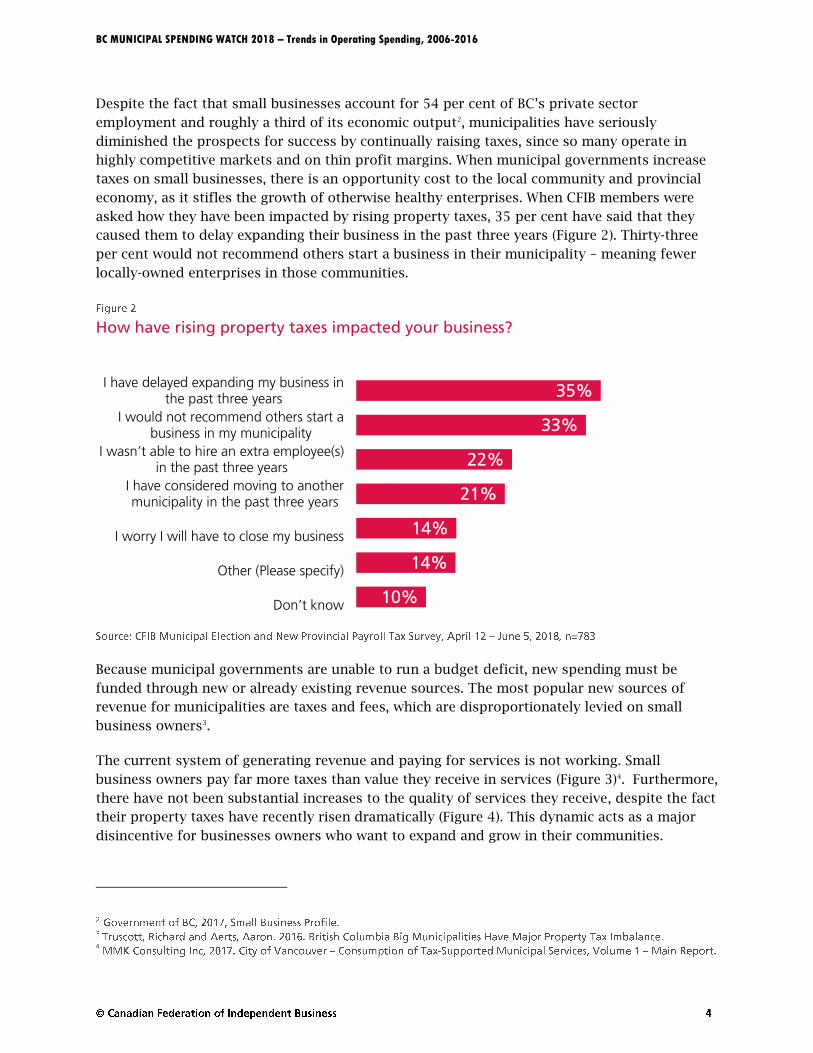
Despite the fact that small businesses account for 54 per cent of BC’s private sector
employment and roughly a third of its economic output2, municipalities have seriously
diminished the prospects for success by continually raising taxes, since so many operate in
highly competitive markets and on thin profit margins. When municipal governments increase
taxes on small businesses, there is an opportunity cost to the local community and provincial
economy, as it stifles the growth of otherwise healthy enterprises. When CFIB members were
asked how they have been impacted by rising property taxes, 35 per cent have said that they
caused them to delay expanding their business in the past three years (Figure 2). Thirty-three
per cent would not recommend others start a business in their municipality – meaning fewer
locally-owned enterprises in those communities.
How have rising property taxes impacted your business?
Because municipal governments are unable to run a budget deficit, new spending must be
funded through new or already existing revenue sources. The most popular new sources of
revenue for municipalities are taxes and fees, which are disproportionately levied on small
business owners3.
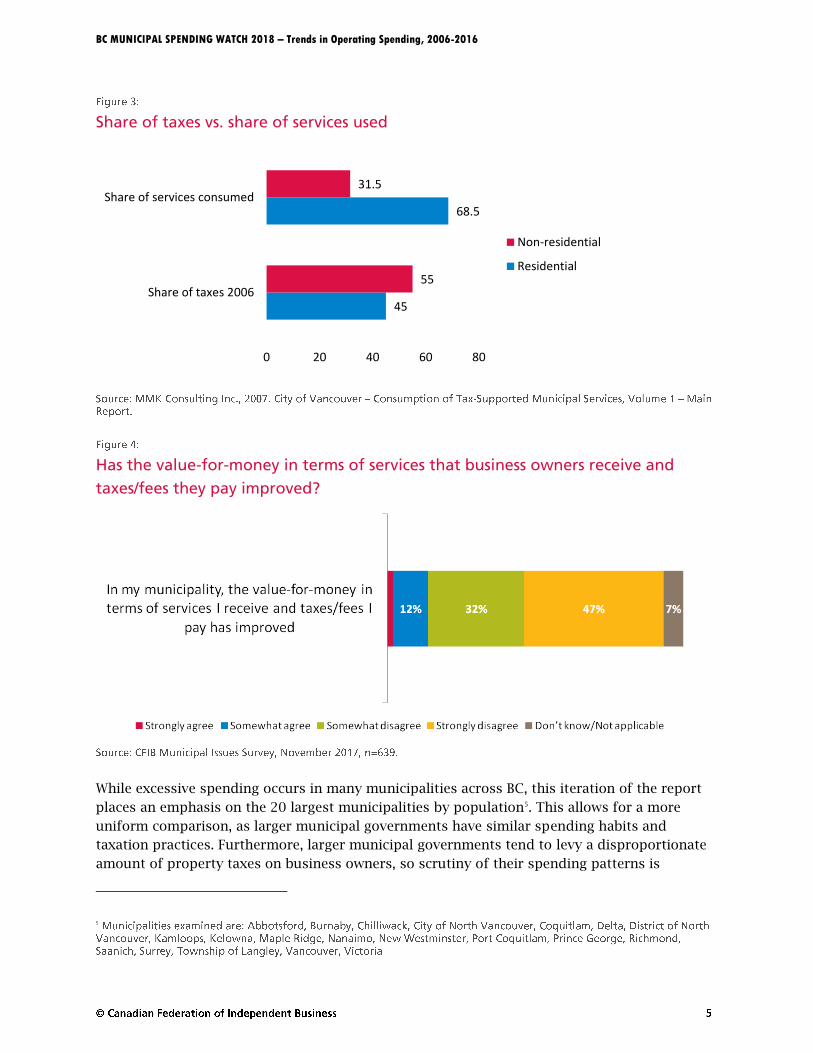
The current system of generating revenue and paying for services is not working. Small
business owners pay far more taxes than value they receive in services (Figure 3)4. Furthermore,
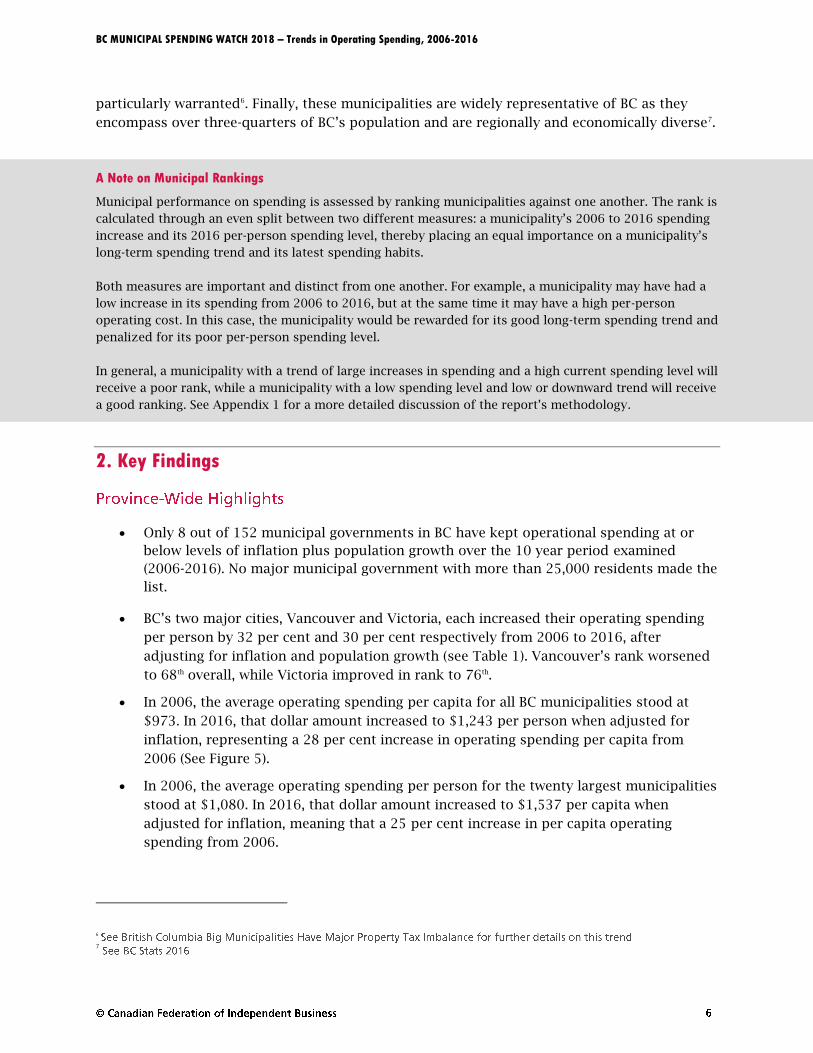
there have not been substantial increases to the quality of services they receive, despite the fact
their property taxes have recently risen dramatically (Figure 4). This dynamic acts as a major
disincentive for businesses owners who want to expand and grow in their communities.
4
10%
14%
14%
21%
22%
33%
35%
Don’t know
Other (Please specify)
I worry I will have to close my business
I have considered moving to anothermunicipality in the past three years
I wasn’t able to hire an extra employee(s) in the past three years
I would not recommend others start abusiness in my municipality
I have delayed expanding my business inthe past three years
BC MUNICIPAL SPENDING WATCH 2018 – Trends in Operating Spending, 2006-2016
Share of taxes vs. share of services used
Has the value-for-money in terms of services that business owners receive and
taxes/fees they pay improved?
While excessive spending occurs in many municipalities across BC, this iteration of the report
places an emphasis on the 20 largest municipalities by population5. This allows for a more
uniform comparison, as larger municipal governments have similar spending habits and
taxation practices. Furthermore, larger municipal governments tend to levy a disproportionate
amount of property taxes on business owners, so scrutiny of their spending patterns is
5
45
68.5
55
31.5
0 20 40 60 80
Share of taxes 2006
Share of services consumed
Non-residential
Residential
BC MUNICIPAL SPENDING WATCH 2018 – Trends in Operating Spending, 2006-2016
particularly warranted6. Finally, these municipalities are widely representative of BC as they
encompass over three-quarters of BC’s population and are regionally and economically diverse7.
A Note on Municipal Rankings
Municipal performance on spending is assessed by ranking municipalities against one another. The rank is
calculated through an even split between two different measures: a municipality’s 2006 to 2016 spending
increase and its 2016 per-person spending level, thereby placing an equal importance on a municipality’s
long-term spending trend and its latest spending habits.
Both measures are important and distinct from one another. For example, a municipality may have had a
low increase in its spending from 2006 to 2016, but at the same time it may have a high per-person
operating cost. In this case, the municipality would be rewarded for its good long-term spending trend and
penalized for its poor per-person spending level.
In general, a municipality with a trend of large increases in spending and a high current spending level will
receive a poor rank, while a municipality with a low spending level and low or downward trend will receive
a good ranking. See Appendix 1 for a more detailed discussion of the report’s methodology.
2. Key Findings
Only 8 out of 152 municipal governments in BC have kept operational spending at or
below levels of inflation plus population growth over the 10 year period examined
(2006-2016). No major municipal government with more than 25,000 residents made the
list.
BC’s two major cities, Vancouver and Victoria, each increased their operating spending
per person by 32 per cent and 30 per cent respectively from 2006 to 2016, after
adjusting for inflation and population growth (see Table 1). Vancouver’s rank worsened
to 68th overall, while Victoria improved in rank to 76th.
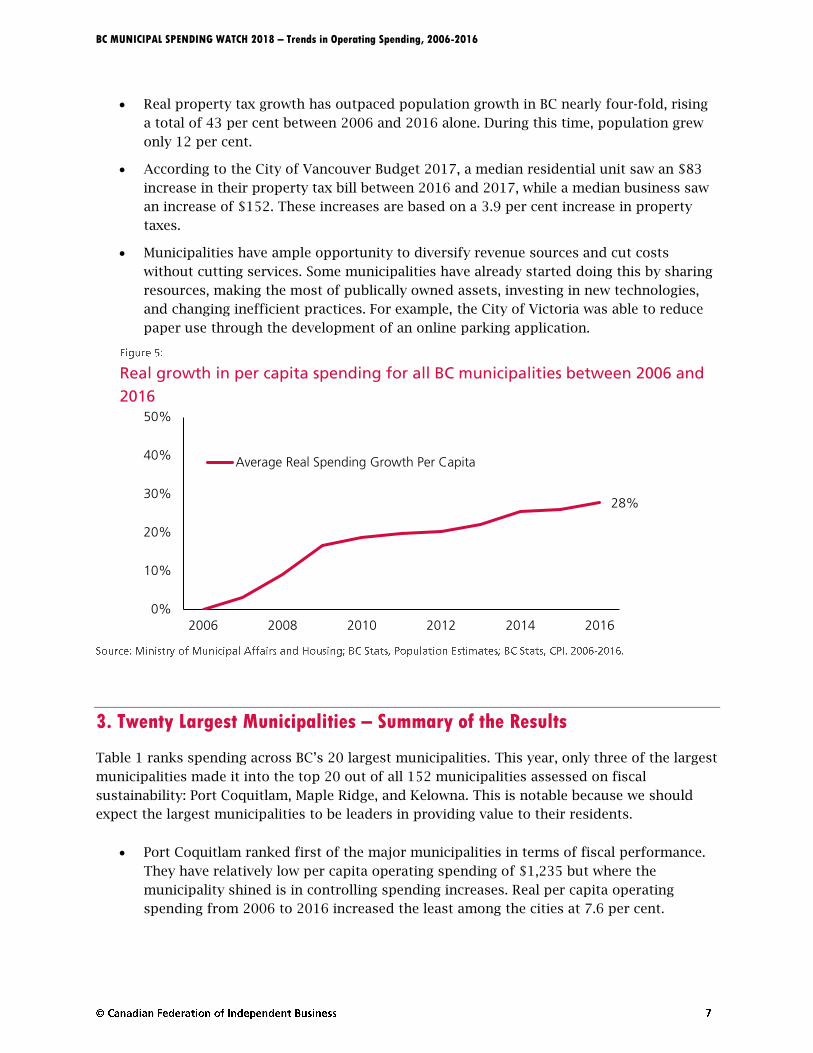
In 2006, the average operating spending per capita for all BC municipalities stood at
$973. In 2016, that dollar amount increased to $1,243 per person when adjusted for
inflation, representing a 28 per cent increase in operating spending per capita from
2006 (See Figure 5).
In 2006, the average operating spending per person for the twenty largest municipalities
stood at $1,080. In 2016, that dollar amount increased to $1,537 per capita when
adjusted for inflation, meaning that a 25 per cent increase in per capita operating
spending from 2006.
6
7
BC MUNICIPAL SPENDING WATCH 2018 – Trends in Operating Spending, 2006-2016
Real property tax growth has outpaced population growth in BC nearly four-fold, rising
a total of 43 per cent between 2006 and 2016 alone. During this time, population grew
only 12 per cent.
According to the City of Vancouver Budget 2017, a median residential unit saw an $83
increase in their property tax bill between 2016 and 2017, while a median business saw
an increase of $152. These increases are based on a 3.9 per cent increase in property
taxes.
Municipalities have ample opportunity to diversify revenue sources and cut costs
without cutting services. Some municipalities have already started doing this by sharing
resources, making the most of publically owned assets, investing in new technologies,
and changing inefficient practices. For example, the City of Victoria was able to reduce
paper use through the development of an online parking application.
Real growth in per capita spending for all BC municipalities between 2006 and
2016
3. Twenty Largest Municipalities – Summary of the Results
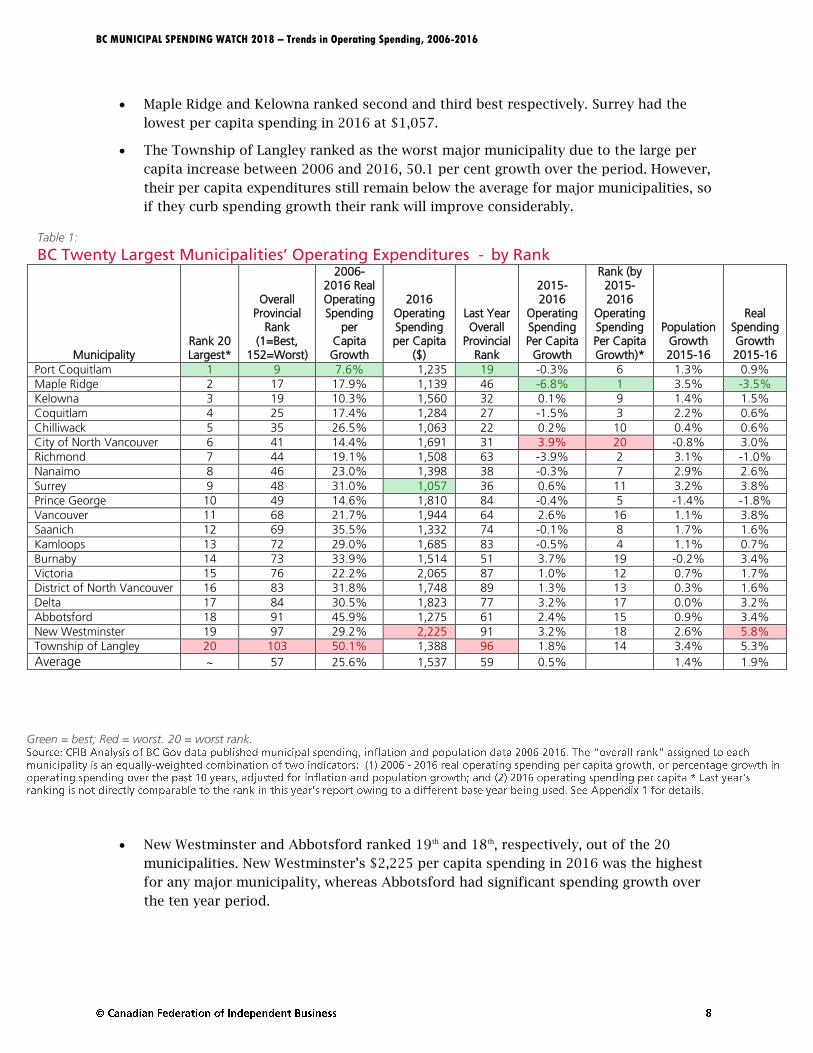
Table 1 ranks spending across BC’s 20 largest municipalities. This year, only three of the largest
municipalities made it into the top 20 out of all 152 municipalities assessed on fiscal
sustainability: Port Coquitlam, Maple Ridge, and Kelowna. This is notable because we should
expect the largest municipalities to be leaders in providing value to their residents.
Port Coquitlam ranked first of the major municipalities in terms of fiscal performance.
They have relatively low per capita operating spending of $1,235 but where the
municipality shined is in controlling spending increases. Real per capita operating
spending from 2006 to 2016 increased the least among the cities at 7.6 per cent.
28%
0%
10%
20%
30%
40%
50%
2006 2008 2010 2012 2014 2016
Average Real Spending Growth Per Capita
BC MUNICIPAL SPENDING WATCH 2018 – Trends in Operating Spending, 2006-2016
Maple Ridge and Kelowna ranked second and third best respectively. Surrey had the
lowest per capita spending in 2016 at $1,057.
The Township of Langley ranked as the worst major municipality due to the large per
capita increase between 2006 and 2016, 50.1 per cent growth over the period. However,
their per capita expenditures still remain below the average for major municipalities, so
if they curb spending growth their rank will improve considerably.
New Westminster and Abbotsford ranked 19th and 18th, respectively, out of the 20
municipalities. New Westminster’s $2,225 per capita spending in 2016 was the highest
for any major municipality, whereas Abbotsford had significant spending growth over
the ten year period.
Table 1: BC Twenty Largest Municipalities’ Operating Expenditures - by Rank
Green = best; Red = worst. 20 = worst rank.
Municipality Rank 20 Largest*
Overall Provincial
Rank (1=Best,
152=Worst)
2006-2016 Real Operating Spending
per Capita Growth
2016 Operating Spending per Capita
($)
Last Year Overall
Provincial Rank
2015-2016
Operating Spending Per Capita
Growth
Rank (by 2015-2016
Operating Spending Per Capita Growth)*
Population Growth 2015-16
Real Spending Growth 2015-16
Port Coquitlam 1 9 7.6% 1,235 19 -0.3% 6 1.3% 0.9%
Maple Ridge 2 17 17.9% 1,139 46 -6.8% 1 3.5% -3.5%
Kelowna 3 19 10.3% 1,560 32 0.1% 9 1.4% 1.5%
Coquitlam 4 25 17.4% 1,284 27 -1.5% 3 2.2% 0.6%
Chilliwack 5 35 26.5% 1,063 22 0.2% 10 0.4% 0.6%
City of North Vancouver 6 41 14.4% 1,691 31 3.9% 20 -0.8% 3.0%
Richmond 7 44 19.1% 1,508 63 -3.9% 2 3.1% -1.0%
Nanaimo 8 46 23.0% 1,398 38 -0.3% 7 2.9% 2.6%
Surrey 9 48 31.0% 1,057 36 0.6% 11 3.2% 3.8%
Prince George 10 49 14.6% 1,810 84 -0.4% 5 -1.4% -1.8%
Vancouver 11 68 21.7% 1,944 64 2.6% 16 1.1% 3.8%
Saanich 12 69 35.5% 1,332 74 -0.1% 8 1.7% 1.6%
Kamloops 13 72 29.0% 1,685 83 -0.5% 4 1.1% 0.7%
Burnaby 14 73 33.9% 1,514 51 3.7% 19 -0.2% 3.4%
Victoria 15 76 22.2% 2,065 87 1.0% 12 0.7% 1.7%
District of North Vancouver 16 83 31.8% 1,748 89 1.3% 13 0.3% 1.6%
Delta 17 84 30.5% 1,823 77 3.2% 17 0.0% 3.2%
Abbotsford 18 91 45.9% 1,275 61 2.4% 15 0.9% 3.4%
New Westminster 19 97 29.2% 2,225 91 3.2% 18 2.6% 5.8%
Township of Langley 20 103 50.1% 1,388 96 1.8% 14 3.4% 5.3%
Average ~ 57 25.6% 1,537 59 0.5% 1.4% 1.9%
BC MUNICIPAL SPENDING WATCH 2018 – Trends in Operating Spending, 2006-2016
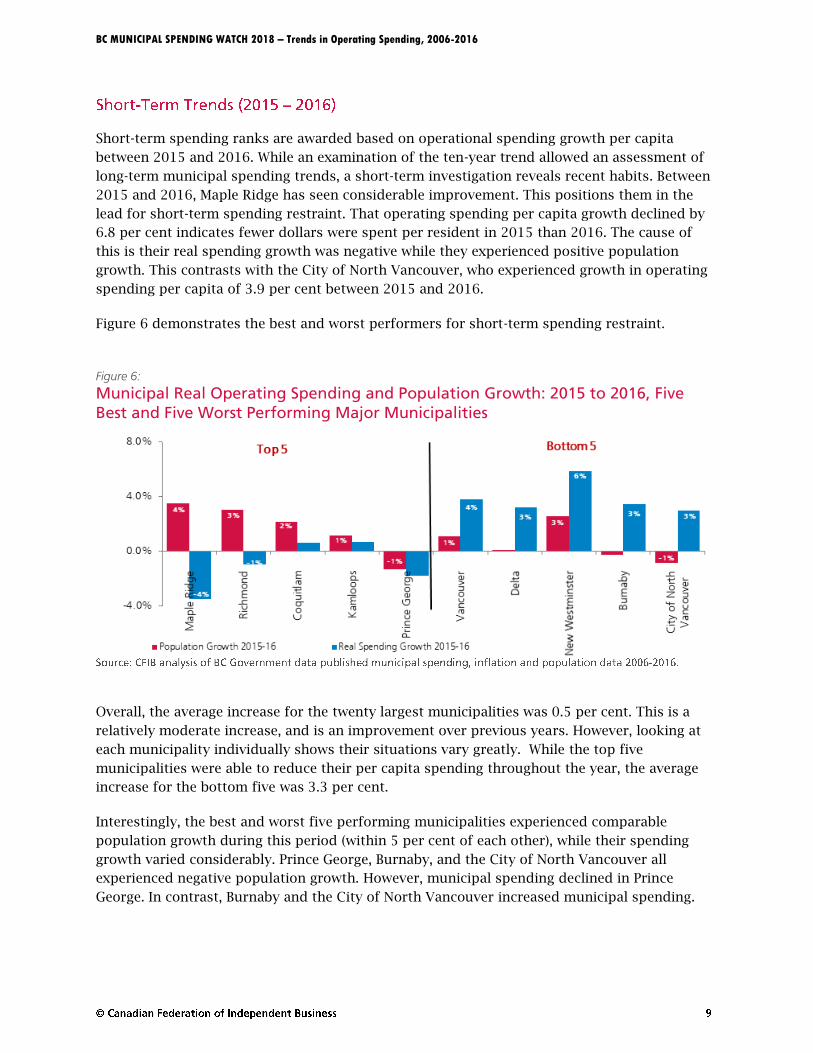
Short-term spending ranks are awarded based on operational spending growth per capita
between 2015 and 2016. While an examination of the ten-year trend allowed an assessment of
long-term municipal spending trends, a short-term investigation reveals recent habits. Between
2015 and 2016, Maple Ridge has seen considerable improvement. This positions them in the
lead for short-term spending restraint. That operating spending per capita growth declined by
6.8 per cent indicates fewer dollars were spent per resident in 2015 than 2016. The cause of
this is their real spending growth was negative while they experienced positive population
growth. This contrasts with the City of North Vancouver, who experienced growth in operating
spending per capita of 3.9 per cent between 2015 and 2016.
Figure 6 demonstrates the best and worst performers for short-term spending restraint.
Figure 6:
Municipal Real Operating Spending and Population Growth: 2015 to 2016, Five
Best and Five Worst Performing Major Municipalities
Overall, the average increase for the twenty largest municipalities was 0.5 per cent. This is a
relatively moderate increase, and is an improvement over previous years. However, looking at
each municipality individually shows their situations vary greatly. While the top five
municipalities were able to reduce their per capita spending throughout the year, the average
increase for the bottom five was 3.3 per cent.
Interestingly, the best and worst five performing municipalities experienced comparable
population growth during this period (within 5 per cent of each other), while their spending
growth varied considerably. Prince George, Burnaby, and the City of North Vancouver all
experienced negative population growth. However, municipal spending declined in Prince
George. In contrast, Burnaby and the City of North Vancouver increased municipal spending.
BC MUNICIPAL SPENDING WATCH 2018 – Trends in Operating Spending, 2006-2016
Prince George’s ability to decrease spending indicates they may have better practices in place to
control spending growth than Burnaby and the City of North Vancouver, and should be
commended. Additionally, Maple Ridge, Richmond, and Coquitlam decreased municipal
spending after adjusting for inflation, despite experiencing positive population growth. This
was likely possible without a sharp decline in services since they had experienced spending
growth beyond inflation and population growth in previous years.
The broader implications of these results is that population growth does not always necessitate
municipal spending growth. Thus, it is clear that municipalities have the capacity to decrease
their spending while their population grows and retain service levels. Additionally, it
demonstrates the current inflated state of spending across municipalities.
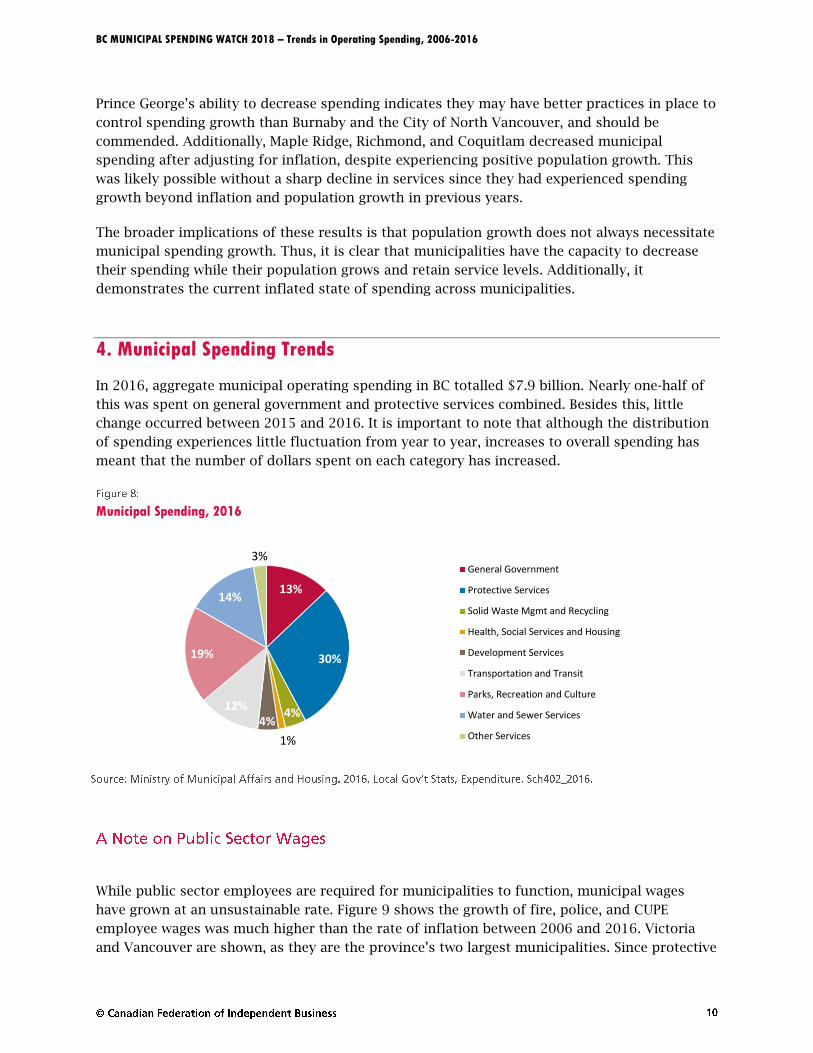
4. Municipal Spending Trends
In 2016, aggregate municipal operating spending in BC totalled $7.9 billion. Nearly one-half of
this was spent on general government and protective services combined. Besides this, little
change occurred between 2015 and 2016. It is important to note that although the distribution
of spending experiences little fluctuation from year to year, increases to overall spending has
meant that the number of dollars spent on each category has increased.
Municipal Spending, 2016
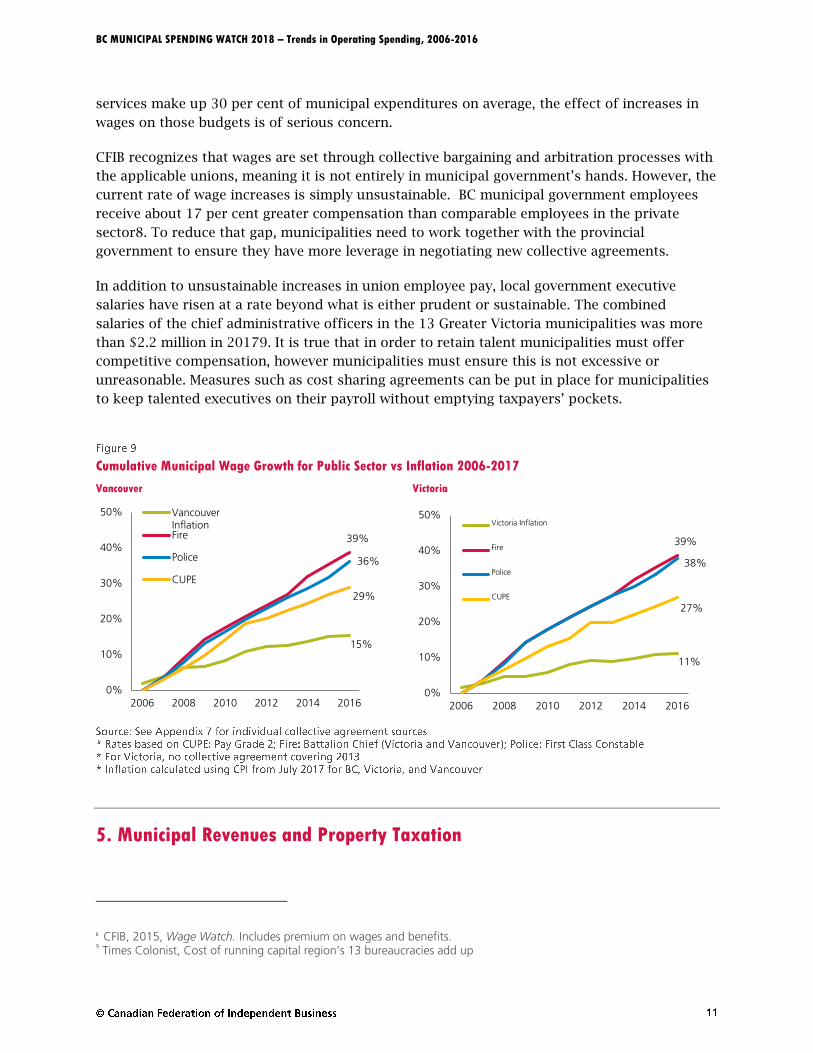
While public sector employees are required for municipalities to function, municipal wages
have grown at an unsustainable rate. Figure 9 shows the growth of fire, police, and CUPE
employee wages was much higher than the rate of inflation between 2006 and 2016. Victoria
and Vancouver are shown, as they are the province’s two largest municipalities. Since protective
13%
30%
4%
1%
4%12%
19%
14%
3%General Government
Protective Services
Solid Waste Mgmt and Recycling
Health, Social Services and Housing
Development Services
Transportation and Transit
Parks, Recreation and Culture
Water and Sewer Services
Other Services
BC MUNICIPAL SPENDING WATCH 2018 – Trends in Operating Spending, 2006-2016
services make up 30 per cent of municipal expenditures on average, the effect of increases in
wages on those budgets is of serious concern.
CFIB recognizes that wages are set through collective bargaining and arbitration processes with
the applicable unions, meaning it is not entirely in municipal government’s hands. However, the
current rate of wage increases is simply unsustainable. BC municipal government employees
receive about 17 per cent greater compensation than comparable employees in the private
sector8. To reduce that gap, municipalities need to work together with the provincial
government to ensure they have more leverage in negotiating new collective agreements.
In addition to unsustainable increases in union employee pay, local government executive
salaries have risen at a rate beyond what is either prudent or sustainable. The combined
salaries of the chief administrative officers in the 13 Greater Victoria municipalities was more
than $2.2 million in 20179. It is true that in order to retain talent municipalities must offer
competitive compensation, however municipalities must ensure this is not excessive or
unreasonable. Measures such as cost sharing agreements can be put in place for municipalities
to keep talented executives on their payroll without emptying taxpayers’ pockets.
Cumulative Municipal Wage Growth for Public Sector vs Inflation 2006-2017
Vancouver Victoria
5. Municipal Revenues and Property Taxation
8 CFIB, 2015, Wage Watch. Includes premium on wages and benefits.
9 Times Colonist, Cost of running capital region’s 13 bureaucracies add up
15%
39%
36%
29%
0%
10%
20%
30%
40%
50%
2006 2008 2010 2012 2014 2016
VancouverInflationFire
Police
CUPE
11%
39%
38%
27%
0%
10%
20%
30%
40%
50%
2006 2008 2010 2012 2014 2016
Victoria Inflation
Fire
Police
CUPE
BC MUNICIPAL SPENDING WATCH 2018 – Trends in Operating Spending, 2006-2016
In 2016, total municipal revenue in BC was more than $9.7 billion. As municipal revenue
streams enable government expenditures, analysis of sources of municipal revenue is
imperative in any examination of municipal spending. Figure 10 demonstrates that property
taxes, referred to as own-purpose taxation, made up 46 per cent of all municipal revenues in
2016.
Sources of Municipal Revenue, 2016
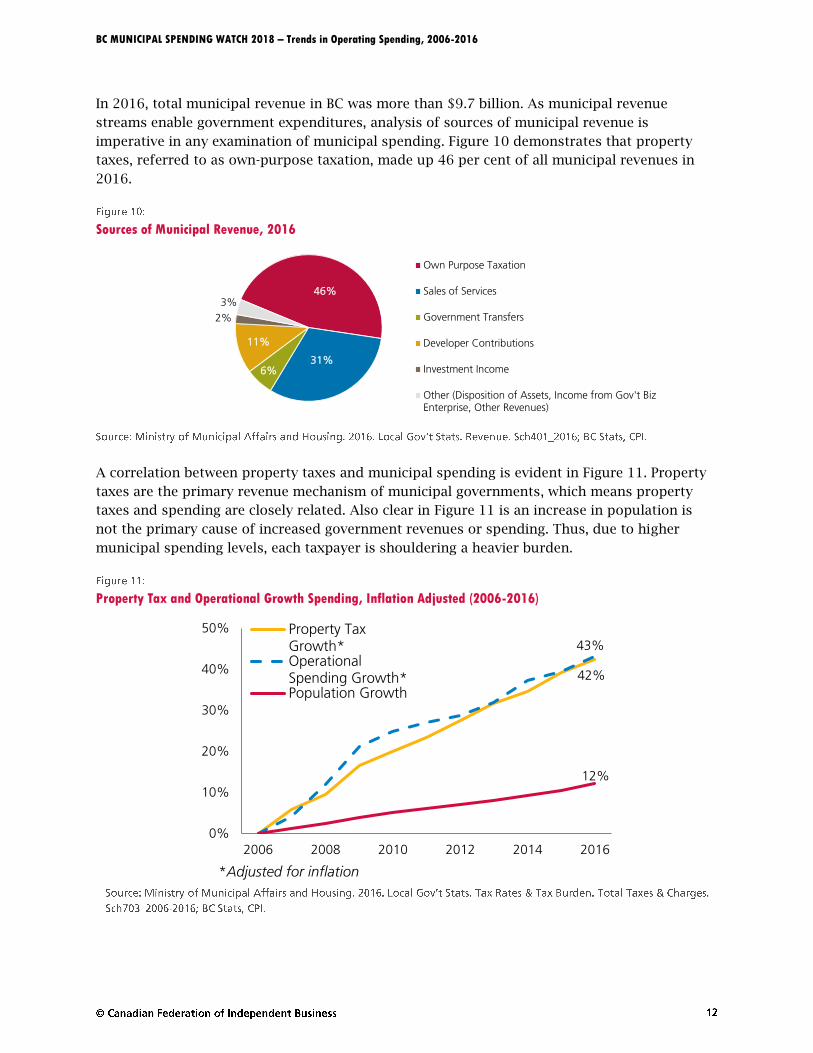
A correlation between property taxes and municipal spending is evident in Figure 11. Property
taxes are the primary revenue mechanism of municipal governments, which means property
taxes and spending are closely related. Also clear in Figure 11 is an increase in population is
not the primary cause of increased government revenues or spending. Thus, due to higher
municipal spending levels, each taxpayer is shouldering a heavier burden.
Property Tax and Operational Growth Spending, Inflation Adjusted (2006-2016)
46%
31%6%
11%
2%
3%
Own Purpose Taxation
Sales of Services
Government Transfers
Developer Contributions
Investment Income
Other (Disposition of Assets, Income from Gov't BizEnterprise, Other Revenues)
42%
43%
12%
0%
10%
20%
30%
40%
50%
2006 2008 2010 2012 2014 2016
Property TaxGrowth*OperationalSpending Growth*Population Growth
*Adjusted for inflation
BC MUNICIPAL SPENDING WATCH 2018 – Trends in Operating Spending, 2006-2016
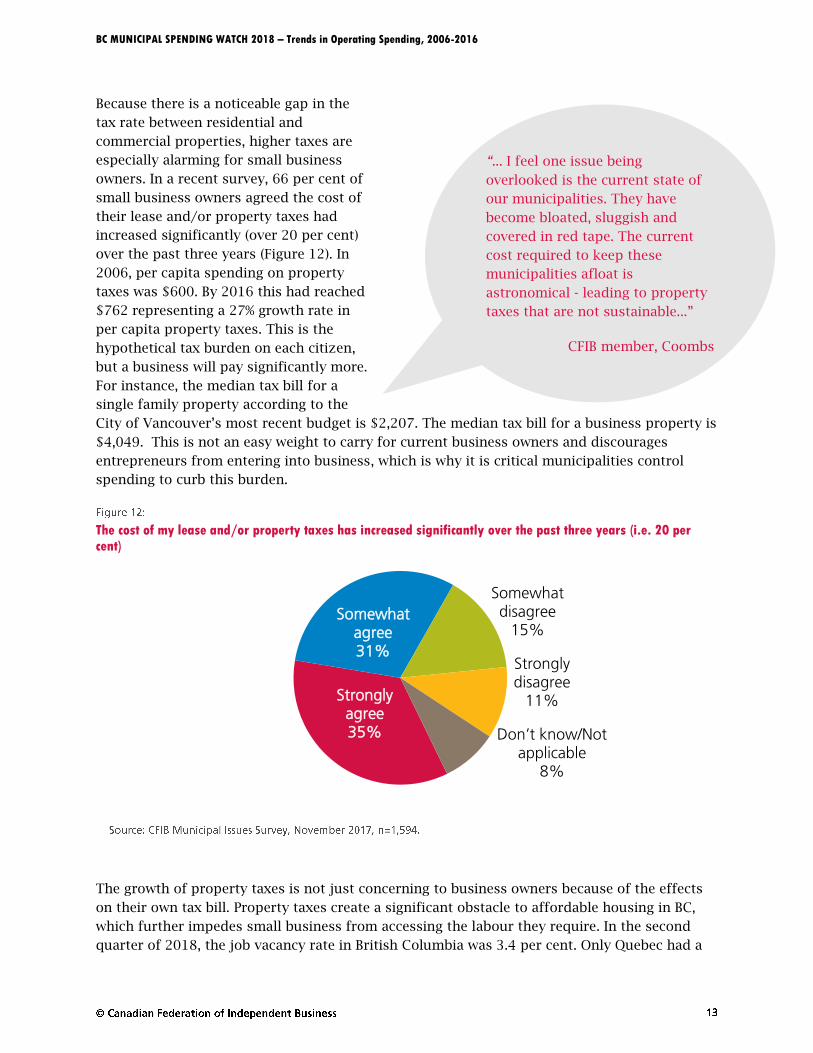
Because there is a noticeable gap in the
tax rate between residential and
commercial properties, higher taxes are
especially alarming for small business
owners. In a recent survey, 66 per cent of
small business owners agreed the cost of
their lease and/or property taxes had
increased significantly (over 20 per cent)
over the past three years (Figure 12). In
2006, per capita spending on property
taxes was $600. By 2016 this had reached
$762 representing a 27% growth rate in
per capita property taxes. This is the
hypothetical tax burden on each citizen,
but a business will pay significantly more.
For instance, the median tax bill for a
single family property according to the
City of Vancouver’s most recent budget is $2,207. The median tax bill for a business property is
$4,049. This is not an easy weight to carry for current business owners and discourages
entrepreneurs from entering into business, which is why it is critical municipalities control
spending to curb this burden.
The cost of my lease and/or property taxes has increased significantly over the past three years (i.e. 20 per cent)
The growth of property taxes is not just concerning to business owners because of the effects
on their own tax bill. Property taxes create a significant obstacle to affordable housing in BC,
which further impedes small business from accessing the labour they require. In the second
quarter of 2018, the job vacancy rate in British Columbia was 3.4 per cent. Only Quebec had a
Strongly agree35%
Somewhat agree31%
Somewhat disagree
15%
Strongly disagree
11%
Don’t know/Not applicable
8%
“... I feel one issue being
overlooked is the current state of
our municipalities. They have
become bloated, sluggish and
covered in red tape. The current
cost required to keep these
municipalities afloat is
astronomical - leading to property
taxes that are not sustainable...”
CFIB member, Coombs
BC MUNICIPAL SPENDING WATCH 2018 – Trends in Operating Spending, 2006-2016
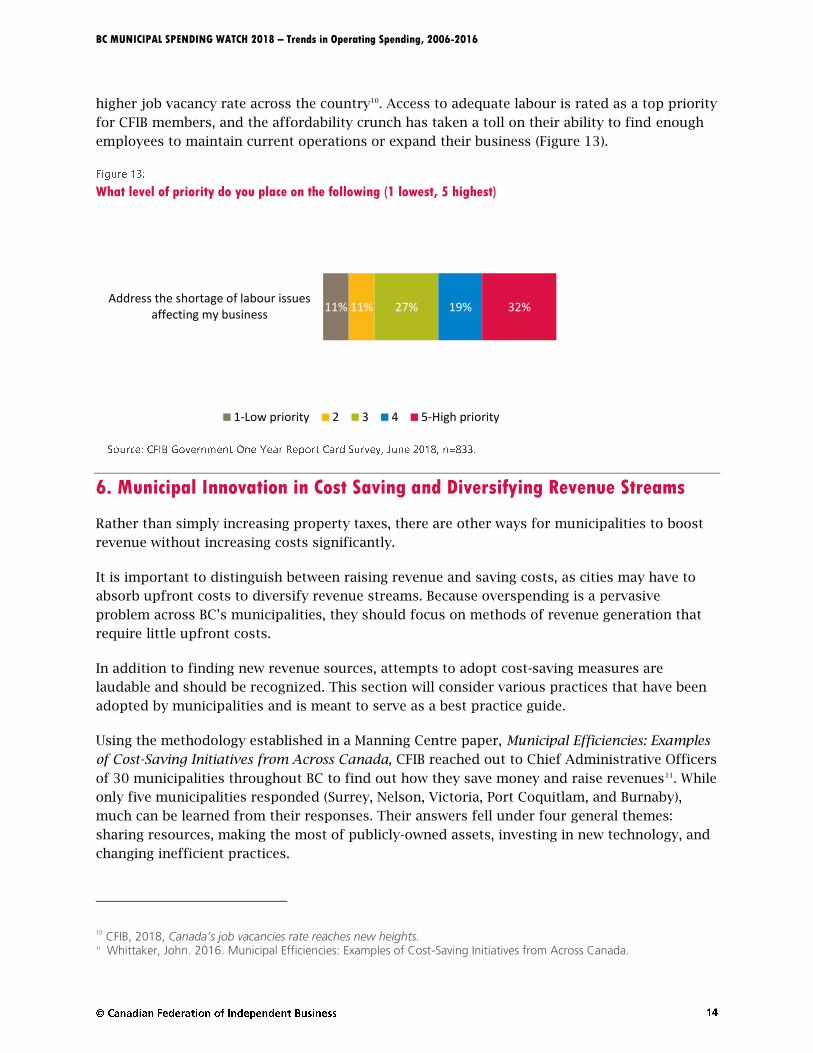
higher job vacancy rate across the country10. Access to adequate labour is rated as a top priority
for CFIB members, and the affordability crunch has taken a toll on their ability to find enough
employees to maintain current operations or expand their business (Figure 13).
What level of priority do you place on the following (1 lowest, 5 highest)
6. Municipal Innovation in Cost Saving and Diversifying Revenue Streams
Rather than simply increasing property taxes, there are other ways for municipalities to boost
revenue without increasing costs significantly.
It is important to distinguish between raising revenue and saving costs, as cities may have to
absorb upfront costs to diversify revenue streams. Because overspending is a pervasive
problem across BC’s municipalities, they should focus on methods of revenue generation that
require little upfront costs.
In addition to finding new revenue sources, attempts to adopt cost-saving measures are
laudable and should be recognized. This section will consider various practices that have been
adopted by municipalities and is meant to serve as a best practice guide.
Using the methodology established in a Manning Centre paper, Municipal Efficiencies: Examples
of Cost-Saving Initiatives from Across Canada, CFIB reached out to Chief Administrative Officers
of 30 municipalities throughout BC to find out how they save money and raise revenues11. While
only five municipalities responded (Surrey, Nelson, Victoria, Port Coquitlam, and Burnaby),
much can be learned from their responses. Their answers fell under four general themes:
sharing resources, making the most of publicly-owned assets, investing in new technology, and
changing inefficient practices.
10
CFIB, 2018, Canada’s job vacancies rate reaches new heights. 11 Whittaker, John. 2016. Municipal Efficiencies: Examples of Cost-Saving Initiatives from Across Canada.
11% 11% 27% 19% 32%Address the shortage of labour issues
affecting my business
1-Low priority 2 3 4 5-High priority
BC MUNICIPAL SPENDING WATCH 2018 – Trends in Operating Spending, 2006-2016
One important way for municipalities to ensure taxpayers receive quality services without the
depletion of city funds is for multiple municipalities to share resources. Last year’s report
discussed how the City of Nelson shares its Chief Financial Officer with Slocan, Silverton, and
Salmo12. This effectively curtails costs and helps smaller municipalities attain talent and
services they may not otherwise have access to due to financial limitations. It is a fiscally
responsible way to access high-end talent.
Sharing resources can also be helpful where many municipalities are clustered together. Earlier
in the report, it was noted that salaries for the Chief Administrative Officers of the 13
municipalities in the Greater Victoria Area combined were $2.2 million. This services a
population of 383,360 people – a size that is comparable to some of the largest municipalities
in the province13. To gain greater efficiency in the provision of services, municipalities in the
Greater Victoria Area could share resources in a similar way, which would considerably drive
down the costs to taxpayers.
Sharing resources does not necessarily have to occur between multiple municipalities. It can
also take place within the municipality if multiple departments share resources, as the City of
Burnaby demonstrates. By making changes to their staff schedules to make them more
efficient, vehicle users in the same department have been able to share vehicles, which has
enabled the city to achieve a net-zero increase to their City Hall fleet of vehicles. Municipalities
can also share resources with the private and non-profit sectors.
When planning for the development of a new headquarters for Victoria’s Fire Department, the
City consulted with both private and non-profit organizations throughout the process. This
resulted in plans for a multi-use space that can be shared.
Publicly-owned assets can be used to generate funds for municipalities. There are many
examples where municipalities have taken the lead on this. A popular option is leasing out city
facilities at times they are not being used – this method is utilized by four out of the five
municipalities who responded to our inquiry. Nelson estimates this increases their revenues by
approximately $600,000 per year; this represents about two per cent of Nelson’s total operating
budget – a significant source of revenue with little cost to the municipality.
Furthermore, Nelson contracts out its employees and services to smaller municipalities in the
region. One great example of this is the work it does with its police force. Nelson acts as the
remand centre for the region, puts its police officers on secondment to the RCMP road safety
unit, and provides 911 services for smaller municipalities. They estimate that altogether these
practices generate approximately $630,000 in revenue for the city and makes effective use of
12
Truscott, Richard, Aerts, Aaron, and Muriel Protzer. 2017. BC Municipal Spending Watch 2017: 10th ed. Trends in
Operating Spending, 2005-2015. 13
See “Costs of running capital regions 13 municipalities adds up”
BC MUNICIPAL SPENDING WATCH 2018 – Trends in Operating Spending, 2006-2016
their employees’ time. Nelson spends $5.9 million on protective services, meaning they are
recouping over 10 per cent of that by providing this service to neighboring municipalities.
The sale or lease of creative resources is another way municipalities can raise revenues. Port
Coquitlam, for example, has put this into practice. The City entered an agreement in 2017 for
digital signage within the city that will bring in revenue exceeding $3 million over 10 years.
When municipalities assess the best use of assets, they should consider the needs of industries
in their communities. This was put forward by Burnaby who capitalized on the growing needs
of the local film industry by charging a fee for access to city-owned spaces.
Many municipalities have gained efficiency through investments made in new technology. This
is an area where changes can have both a monetary and an environmental impact. One
commonly cited method was changing street light bulbs to LED technology. Surrey was able to
minimize their upfront costs by completing this during their annual re-lamping program. They
estimate that after eight years this program will save them $2 million per year.
When cities become more energy efficient and tech savvy, they can save resources while also
increasing accessibility. The adoption of an online mapping system that contains information
on property, capital projects, and road closures allowed Victoria to expand customer service
while reducing the time frontline staff spent on routine inquiries. Likewise, through the
development of a parking app, the city was able to decrease printing costs.
Another suggestion, put forward by the City of Burnaby, was the use of cost-effective synthetic
turf fields in suitable places. The city found that turf fields were better able to meet the needs
of the community as they are better equipped to handle high usage from sports teams.
Additionally, they require less maintenance like irrigation and weeding, which reduced the
operating costs of field maintenance in Burnaby by one-third.
Even small changes can make a big difference in the cost of municipal operations. For example,
a minor adjustment to the default settings on city printers so they print in black and white on
both sides decreased annual costs for Surrey by over $100,000. Similarly, cultural shifts can
reduce the amount municipalities spend on printing. Another suggestion from both Surrey and
Victoria was to distribute digital copies of Council’s Agenda. This reduces the amount of paper
used and the time city employees spend on the assembly of Council packages. This is both a
positive change for the environment and for the city’s budget.
As labour is a major component of municipal budgets, the adoption of practices that save
employee time should be a priority. For example, Victoria reduced the amount of time legal
staff spent on routine matters through the use of pre-approved templates.
BC MUNICIPAL SPENDING WATCH 2018 – Trends in Operating Spending, 2006-2016
Similarly, Surrey decreased the labour cost of illegal dumping clean up. The City created a
centralized business unit this crew reports to, allowing more effective distribution of labour.
This eliminated the need for seven paid staff and five to seven one-tonne trucks.
Municipalities should also look at regularly renegotiating contracts for external services. A good
example of the savings from renegotiation is from the City of Victoria. They renegotiated the
credit card fees they paid for city parking in 2012, decreasing fees from $243,256 in 2011 to
$180,592 in 2012 – savings of over 25 per cent with no change to services or convenience
provided.
7. Conclusions and Recommendations
Local business owners agree that municipal spending is sustainable when it is at or below the
rate of inflation and population growth14. However, between 2006 and 2016, spending for most
municipal governments was well beyond that measure. Excessive growth in operating spending
by local governments leads to higher taxes, which in turn puts pressure on local commerce and
stifles job growth, which is obviously bad for BC’s economy.
There is ample opportunity for municipalities across the province to take meaningful strides
towards sustainable spending practices. This iteration of the report can act as a starting point
for municipalities to become competitive through innovation and the initiation of more
responsible spending practices than are currently in place.
CFIB recommendations:
1. Limit increases in operating spending growth to no more than inflation and
population growth.
2. Increase transparency in reporting financial data. While the BC provincial government
collects and reports data on operating spending annually, there is considerable room to
improve reporting requirements. Discrepancies exist in the way data is reported. For
example, differences can exist in the way municipalities classify expenditures. Increased
oversight and uniform standards are necessary to ensure the data collected from one
municipality is comparable to that from another municipality. Additionally, increased
transparency on the generation of municipal revenues and expenses would increase
understanding of municipal spending and make it easier to commend improvements in
spending practices.
3. Limit increases to wages and benefits. Currently, wages and benefits for public
employees far exceed private sector norms. Not only does this have an acute impact on
property taxes, but it also makes it harder for small businesses to compete when they
wish to hire. The government needs to exercise restraint when providing employees with
wage increases such that private wages can catch up with the public sector. A big factor
14 CFIB Municipal Issues Survey, July 2017
BC MUNICIPAL SPENDING WATCH 2018 – Trends in Operating Spending, 2006-2016
why this is the case is the current collective bargaining and arbitration process.
Municipalities should work together and with the provincial government to reform how
bargaining works, with a particular focus on ensuring a municipality’s ability to pay is
considered.
4. Take measures to reduce the gap between what individuals pay in property taxes
and the amount paid by small business. In BC, business owners pay on average over
two and a half times more property taxes than a resident on the same assessed property
value.
5. Conduct regular service reviews to identify superfluous costs and ways to increase
revenue. This edition of the report included steps that some municipalities have taken
to curb costs and increase revenue. These practices can be considered a starting point
for other municipalities that hope to do the same. Governments need to learn innovative
new practices and processes from each other and from the private sector so they can
provide residents with high quality services while reducing their reliance on property
taxes for revenue.
Sources *For sources on collective agreements, see end of document.
Aerts, Aaron and Truscott, Richard. Canadian Federation of Independent Business. 2016. British Columbia Big Municipalities Have Major Property Tax Imbalance. http://www.cfib-fcei.ca/cfib-documents/bc1043.pdf Armstrong, Matthew and Jones, Laura. Canadian Federation of Independent Business. 2008. British Columbia Municipal Spending Watch. http://www.cfib-fcei.ca/english/article/229-bc-municipal-spending-watch.html Tourism Whistler, 2015, Stats & Facts. http://media.whistler.com/all-about-whistler/stats-and-facts/ City of Vancouver, 2016 Annual Financial Report. http://vancouver.ca/files/cov/2016-annual-financial-report.pdf City of Vancouver, 2017. Budget highlights. http://vancouver.ca/files/cov/vancouver-2017-budget-highlights.PDF City of Vancouver, 2016-2020 Budget Outlook http://vancouver.ca/files/cov/2016-city-of-vancouver-budget-outlook.pdf City of Victoria, 2016 Annual Report. http://www.victoria.ca/assets/Community/Documents/CoV%20Annual%20Report%202016.pdf Gouvernement du Québec, ministère des Affaires municipales et de l’occupation du territoire, Rapport financier des organismes municipaux http://www.mamrot.gouv.qc.ca/finances-indicateurs-de-gestion-et-fiscalite/information-financiere/profil-financier-et-autres-publications/rapport-financier-des-organismes-municipaux/ Government of Alberta, Ministry of Municipal Affairs. Municipal Financial and Statistical Data.
BC MUNICIPAL SPENDING WATCH 2018 – Trends in Operating Spending, 2006-2016
http://www.municipalaffairs.alberta.ca/municipal_financial_statistical_data.cfm Government of British Columbia. 2012. British Columbia Municipal Police Unit Agreement http://www.pssg.gov.bc.ca/policeservices/shareddocs/police-agreement-municipal-police-unit-2012.pdf Government of British Columbia, BC Stats. 2015. CPI BC, Vancouver, Victoria. http://www.bcstats.gov.bc.ca/StatisticsBySubject/Economy/ConsumerPriceIndex.aspx Government of British Columbia, BC Stats. 2015. Population of BC.
http://www.bcstats.gov.bc.ca/StatisticsBySubject/Demography/PopulationEstimates.aspx
Government of British Columbia, Ministry of Municipal Affairs and Housing. 2015. Provincial Guidance. http://www.cscd.gov.bc.ca/lgd/infra/library/municipal_lgde_help_manual_sec5b.pdf Government of British Columbia, Ministry of Community, Sport, & Cultural Development. 2015. Local Government Statistics. http://www.cscd.gov.bc.ca/lgd/infra/municipal_stats/municipal_stats2013.htm Government of British Columbia, Ministry of Jobs, Tourism and Skills Training. 2016. Small
Business Profile. http://www2.gov.bc.ca/assets/gov/employment-business-and-economic-
development/business-management/small-business/sb_profile.pdf
Government of British Columbia, Ministry of Justice. 2015. Police Resources in British Columbia,
2014 http://www2.gov.bc.ca/assets/gov/law-crime-and-justice/criminal-
justice/police/publications/statistics/2014-police-resources.pdf
Government of British Columbia, Queen’s Printer. 2017. Fire and Police Services Collective
Bargaining Act. http://www.bclaws.ca/civix/document/id/consol19/consol19/00_96142_01
Truscott, Richard and Aerts, Aaron. Canadian Federation of Independent Business. 2015. B.C.
Municipal Property Tax Gaps: A 10-Year Perspective. http://www.cfib-
fcei.ca/english/article/7649-cap-the-tax-gap.html
Canadian Federation of Independent Business, 2015. Municipal Wage Watch. http://www.cfib-
fcei.ca/cfib-documents/researchreporten/rr3354.pdf
MMK Consulting Inc, 2007. City of Vancouver - Consumption of Tax-Supported Municipal
Services, Volume 1 – Main Report.
http://fairtaxcoalition.com/pdf/ConsumptionStudyReport.pdf
UBCM, 2017. Provincial Election
Platform.http://www.ubcm.ca/assets/Resources~and~Links/2017~Provincial~Election~Platform
/UBCM_2017_ProvincialElectionPlatform.pdf
BC Laws, 2017. Fire and Police Services Collective Bargaining Act.
http://www.bclaws.ca/civix/document/id/complete/statreg/96142_01
Ersnt & Young, 2014. BC Public Sector Compensation Review.
http://www.bcbc.com/pdfs/EY%20-%20Public%20Sector%20Compensation%20Review2014.pdf
BC MUNICIPAL SPENDING WATCH 2018 – Trends in Operating Spending, 2006-2016
Whittaker, John. Manning Centre. Municipal Efficiencies: Examples of Cost-Saving Initiatives from Across Canada. https://www.manningcentre.ca/sites/default/files/final_rs_municipal_efficiencies-_examples_of_cost-saving_initiatives_from_across_.pdf
BC MUNICIPAL SPENDING WATCH 2018 – Trends in Operating Spending, 2006-2016
Appendix 1
The Municipal Spending Watch rankings are based on an equal weighting of growth in inflation-
adjusted operating spending per capita (2006 to 2016) and 2016 operating spending per
capita15. In order for the ranking system to be more intuitive, this year’s report’s ranking system
works so that the best performing municipality is given a rank of one. In previous editions of
this report, the worst ranked municipality was given a rank of one.
Capital expenditures, such as infrastructure building, are excluded from the report. This report
only looks at local government operating spending. Starting in 2014, policing costs are included
in this report (see Appendix 2). An implication of this inclusion is that this year’s report is not
comparable to previous editions (pre-2015) of the BC Municipal Spending Watch, since policing
costs were excluded in previous editions.
In total, 152 municipalities are covered in this report. Barriere, Canal Flats, Clearwater, Sun
Peaks, West Kelowna and Queen Charlotte were not included in this report since many of these
municipalities are newly incorporated and do not have data stretching back to 2006. Zeballos
has been excluded from this year’s report as the municipality has a very small population that
has decreased substantially since 2000. Spallumcheen has also been excluded since, at the time
this report was written, the municipality had not yet submitted their 2016 financial records to
the BC Ministry of Municipal Affairs and Housing for verification.
This report analyzes BC municipal spending statistics from 2006 to 2016, the most recent year
available. Unless otherwise stated, data on municipal revenues and expenditures have been
obtained from the Ministry of Municipal Affairs & Housing. Figures and tables on municipal
spending represent CFIB calculations based on this data.
The year 2006 is used as the base year for comparing operating spending. This inevitably
includes spending patterns during both economic upturns and economic downturns over the
past 10 years. Municipal operating spending is calculated using total municipal expenditures,
excluding capital spending. It is important to note that the rankings between this iteration of
the report and previous versions are not directly comparable to editions prior to 2015. This is a
result of CFIB’s methodology being altered in 2015’s and subsequent reports to look at a rolling
ten year period (i.e. 2004-2014, 2005-2015, etc) rather than in previous reports which used
2000 as the base year.
Municipal population growth rates and provincial inflation growth rates are calculated based on
BC Stats data from 2006 to 2016. The population figures have been updated from previous
BC MUNICIPAL SPENDING WATCH 2018 – Trends in Operating Spending, 2006-2016
reports to obtain more recent estimates. All municipalities have been allocated the provincial
inflation rate with the exception of those municipalities within the Greater Vancouver Region
and the Capital Region, as separate inflation values exist for these two regions. To evaluate the
degree of sustainable spending growth, CFIB considers population growth and inflation to be a
reasonable benchmark for optimal spending increases based on survey responses from small
business owners in BC16.
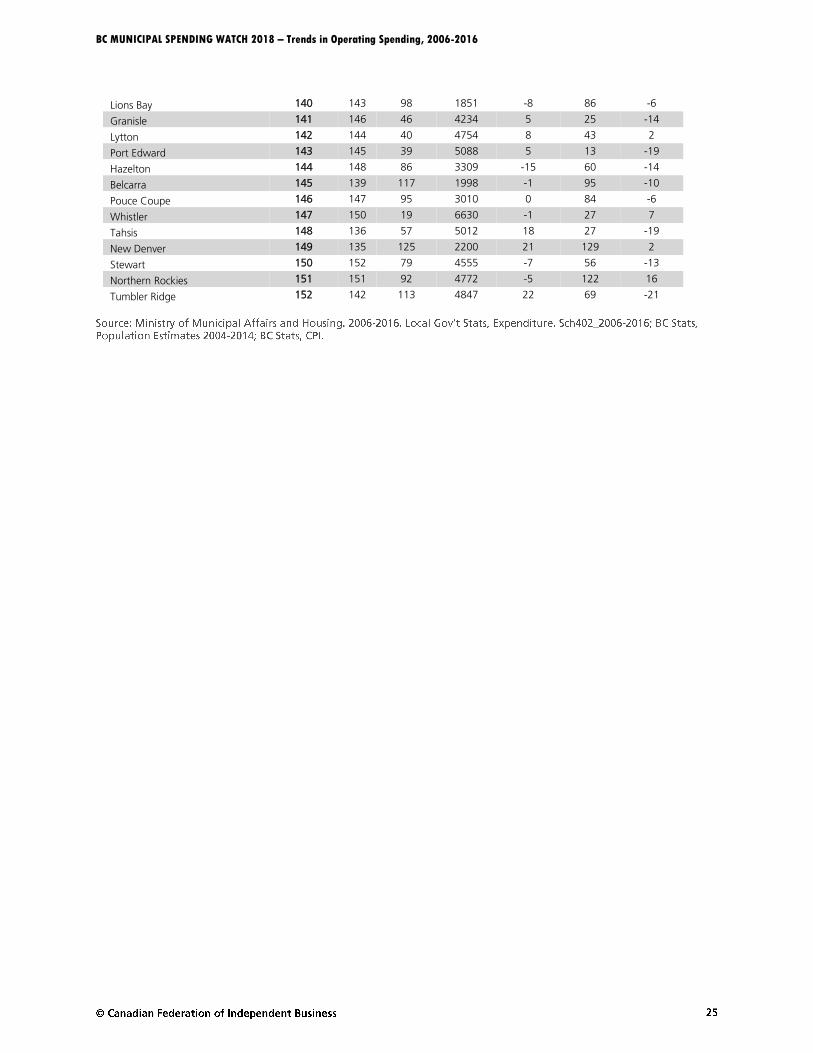
Appendix 2
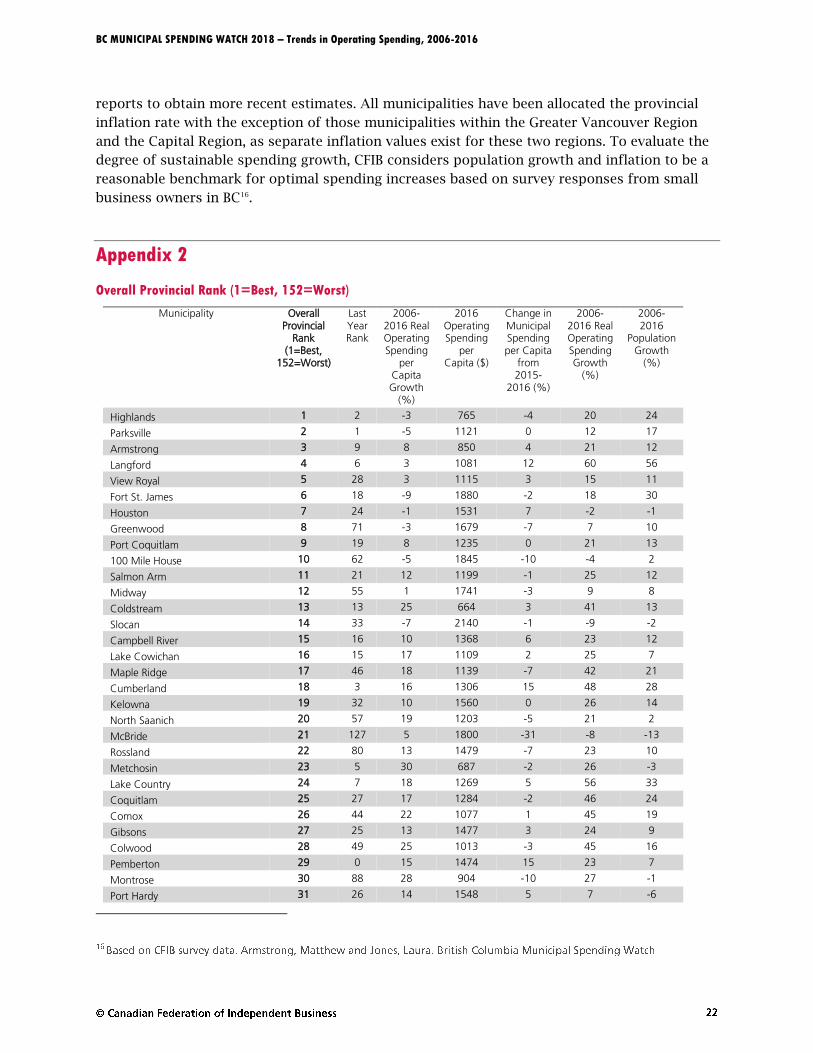
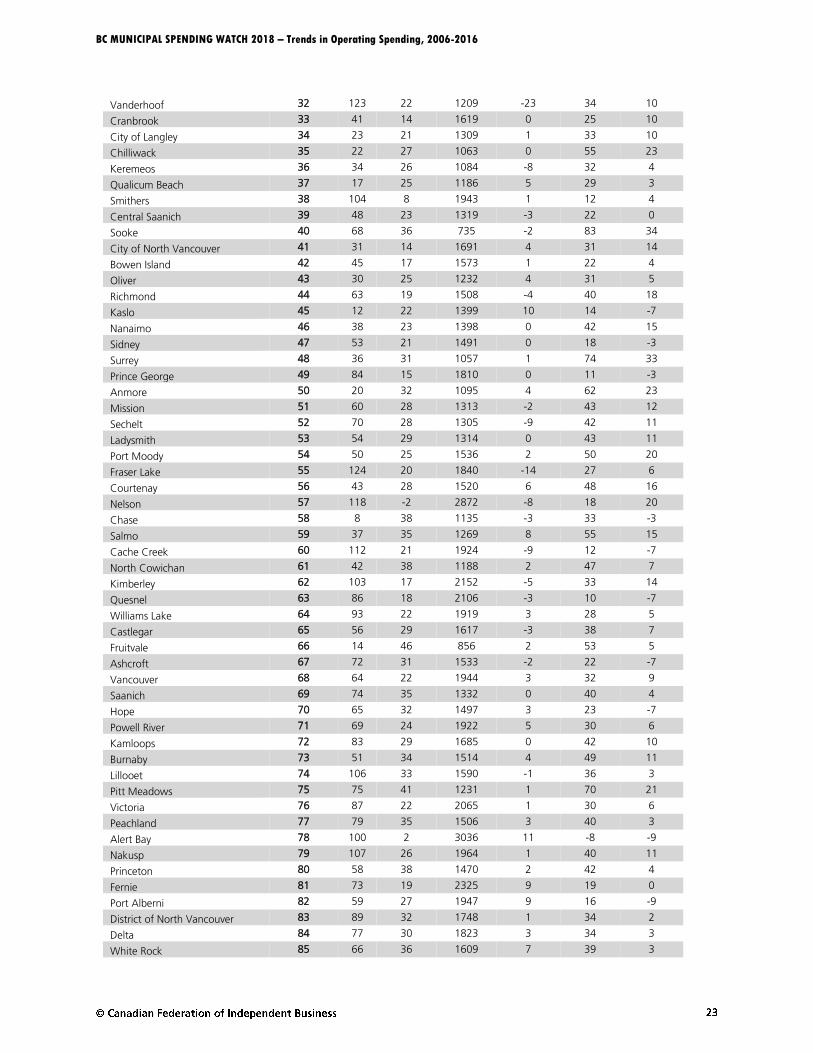
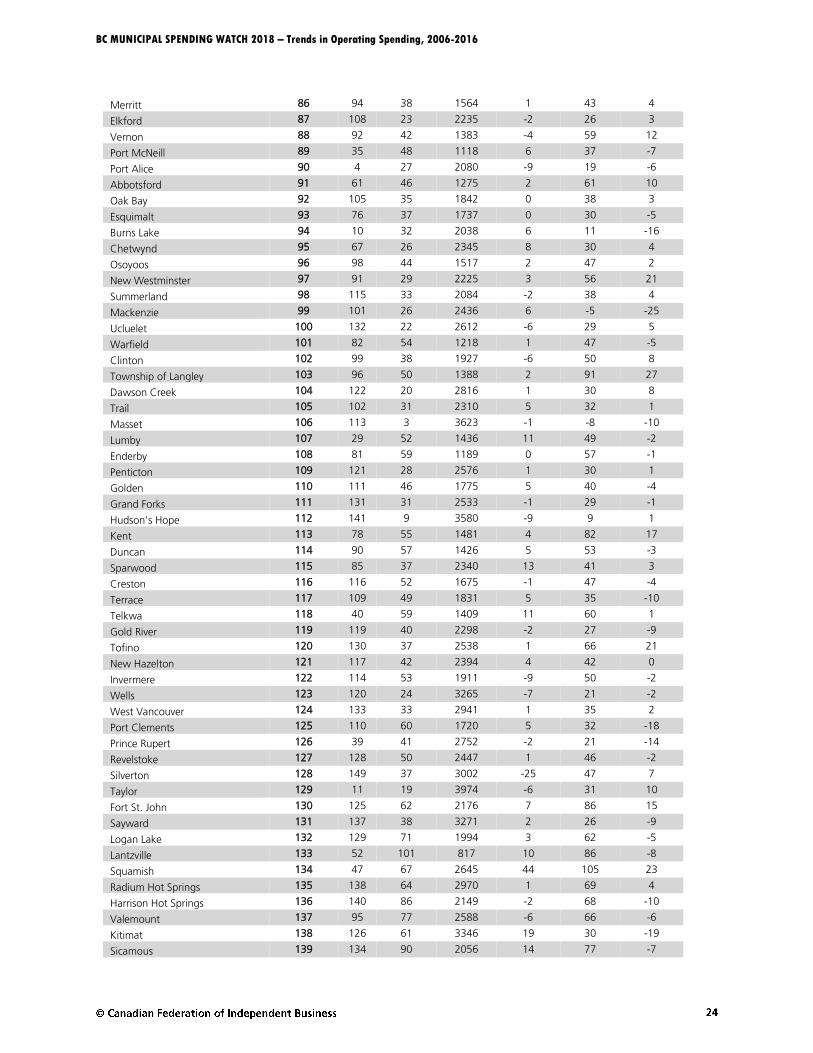
Overall Provincial Rank (1=Best, 152=Worst)
Municipality Overall Provincial
Rank (1=Best,
152=Worst)
Last Year Rank
2006-2016 Real Operating Spending
per Capita Growth
(%)
2016 Operating Spending
per Capita ($)
Change in Municipal Spending per Capita
from 2015-
2016 (%)
2006-2016 Real Operating Spending Growth
(%)
2006-2016
Population Growth
(%)
Highlands 1 2 -3 765 -4 20 24
Parksville 2 1 -5 1121 0 12 17
Armstrong 3 9 8 850 4 21 12
Langford 4 6 3 1081 12 60 56
View Royal 5 28 3 1115 3 15 11
Fort St. James 6 18 -9 1880 -2 18 30
Houston 7 24 -1 1531 7 -2 -1
Greenwood 8 71 -3 1679 -7 7 10
Port Coquitlam 9 19 8 1235 0 21 13
100 Mile House 10 62 -5 1845 -10 -4 2
Salmon Arm 11 21 12 1199 -1 25 12
Midway 12 55 1 1741 -3 9 8
Coldstream 13 13 25 664 3 41 13
Slocan 14 33 -7 2140 -1 -9 -2
Campbell River 15 16 10 1368 6 23 12
Lake Cowichan 16 15 17 1109 2 25 7
Maple Ridge 17 46 18 1139 -7 42 21
Cumberland 18 3 16 1306 15 48 28
Kelowna 19 32 10 1560 0 26 14
North Saanich 20 57 19 1203 -5 21 2
McBride 21 127 5 1800 -31 -8 -13
Rossland 22 80 13 1479 -7 23 10
Metchosin 23 5 30 687 -2 26 -3
Lake Country 24 7 18 1269 5 56 33
Coquitlam 25 27 17 1284 -2 46 24
Comox 26 44 22 1077 1 45 19
Gibsons 27 25 13 1477 3 24 9
Colwood 28 49 25 1013 -3 45 16
Pemberton 29 0 15 1474 15 23 7
Montrose 30 88 28 904 -10 27 -1
Port Hardy 31 26 14 1548 5 7 -6
BC MUNICIPAL SPENDING WATCH 2018 – Trends in Operating Spending, 2006-2016
Vanderhoof 32 123 22 1209 -23 34 10
Cranbrook 33 41 14 1619 0 25 10
City of Langley 34 23 21 1309 1 33 10
Chilliwack 35 22 27 1063 0 55 23
Keremeos 36 34 26 1084 -8 32 4
Qualicum Beach 37 17 25 1186 5 29 3
Smithers 38 104 8 1943 1 12 4
Central Saanich 39 48 23 1319 -3 22 0
Sooke 40 68 36 735 -2 83 34
City of North Vancouver 41 31 14 1691 4 31 14
Bowen Island 42 45 17 1573 1 22 4
Oliver 43 30 25 1232 4 31 5
Richmond 44 63 19 1508 -4 40 18
Kaslo 45 12 22 1399 10 14 -7
Nanaimo 46 38 23 1398 0 42 15
Sidney 47 53 21 1491 0 18 -3
Surrey 48 36 31 1057 1 74 33
Prince George 49 84 15 1810 0 11 -3
Anmore 50 20 32 1095 4 62 23
Mission 51 60 28 1313 -2 43 12
Sechelt 52 70 28 1305 -9 42 11
Ladysmith 53 54 29 1314 0 43 11
Port Moody 54 50 25 1536 2 50 20
Fraser Lake 55 124 20 1840 -14 27 6
Courtenay 56 43 28 1520 6 48 16
Nelson 57 118 -2 2872 -8 18 20
Chase 58 8 38 1135 -3 33 -3
Salmo 59 37 35 1269 8 55 15
Cache Creek 60 112 21 1924 -9 12 -7
North Cowichan 61 42 38 1188 2 47 7
Kimberley 62 103 17 2152 -5 33 14
Quesnel 63 86 18 2106 -3 10 -7
Williams Lake 64 93 22 1919 3 28 5
Castlegar 65 56 29 1617 -3 38 7
Fruitvale 66 14 46 856 2 53 5
Ashcroft 67 72 31 1533 -2 22 -7
Vancouver 68 64 22 1944 3 32 9
Saanich 69 74 35 1332 0 40 4
Hope 70 65 32 1497 3 23 -7
Powell River 71 69 24 1922 5 30 6
Kamloops 72 83 29 1685 0 42 10
Burnaby 73 51 34 1514 4 49 11
Lillooet 74 106 33 1590 -1 36 3
Pitt Meadows 75 75 41 1231 1 70 21
Victoria 76 87 22 2065 1 30 6
Peachland 77 79 35 1506 3 40 3
Alert Bay 78 100 2 3036 11 -8 -9
Nakusp 79 107 26 1964 1 40 11
Princeton 80 58 38 1470 2 42 4
Fernie 81 73 19 2325 9 19 0
Port Alberni 82 59 27 1947 9 16 -9
District of North Vancouver 83 89 32 1748 1 34 2
Delta 84 77 30 1823 3 34 3
White Rock 85 66 36 1609 7 39 3
BC MUNICIPAL SPENDING WATCH 2018 – Trends in Operating Spending, 2006-2016
Merritt 86 94 38 1564 1 43 4
Elkford 87 108 23 2235 -2 26 3
Vernon 88 92 42 1383 -4 59 12
Port McNeill 89 35 48 1118 6 37 -7
Port Alice 90 4 27 2080 -9 19 -6
Abbotsford 91 61 46 1275 2 61 10
Oak Bay 92 105 35 1842 0 38 3
Esquimalt 93 76 37 1737 0 30 -5
Burns Lake 94 10 32 2038 6 11 -16
Chetwynd 95 67 26 2345 8 30 4
Osoyoos 96 98 44 1517 2 47 2
New Westminster 97 91 29 2225 3 56 21
Summerland 98 115 33 2084 -2 38 4
Mackenzie 99 101 26 2436 6 -5 -25
Ucluelet 100 132 22 2612 -6 29 5
Warfield 101 82 54 1218 1 47 -5
Clinton 102 99 38 1927 -6 50 8
Township of Langley 103 96 50 1388 2 91 27
Dawson Creek 104 122 20 2816 1 30 8
Trail 105 102 31 2310 5 32 1
Masset 106 113 3 3623 -1 -8 -10
Lumby 107 29 52 1436 11 49 -2
Enderby 108 81 59 1189 0 57 -1
Penticton 109 121 28 2576 1 30 1
Golden 110 111 46 1775 5 40 -4
Grand Forks 111 131 31 2533 -1 29 -1
Hudson's Hope 112 141 9 3580 -9 9 1
Kent 113 78 55 1481 4 82 17
Duncan 114 90 57 1426 5 53 -3
Sparwood 115 85 37 2340 13 41 3
Creston 116 116 52 1675 -1 47 -4
Terrace 117 109 49 1831 5 35 -10
Telkwa 118 40 59 1409 11 60 1
Gold River 119 119 40 2298 -2 27 -9
Tofino 120 130 37 2538 1 66 21
New Hazelton 121 117 42 2394 4 42 0
Invermere 122 114 53 1911 -9 50 -2
Wells 123 120 24 3265 -7 21 -2
West Vancouver 124 133 33 2941 1 35 2
Port Clements 125 110 60 1720 5 32 -18
Prince Rupert 126 39 41 2752 -2 21 -14
Revelstoke 127 128 50 2447 1 46 -2
Silverton 128 149 37 3002 -25 47 7
Taylor 129 11 19 3974 -6 31 10
Fort St. John 130 125 62 2176 7 86 15
Sayward 131 137 38 3271 2 26 -9
Logan Lake 132 129 71 1994 3 62 -5
Lantzville 133 52 101 817 10 86 -8
Squamish 134 47 67 2645 44 105 23
Radium Hot Springs 135 138 64 2970 1 69 4
Harrison Hot Springs 136 140 86 2149 -2 68 -10
Valemount 137 95 77 2588 -6 66 -6
Kitimat 138 126 61 3346 19 30 -19
Sicamous 139 134 90 2056 14 77 -7
BC MUNICIPAL SPENDING WATCH 2018 – Trends in Operating Spending, 2006-2016
Lions Bay 140 143 98 1851 -8 86 -6
Granisle 141 146 46 4234 5 25 -14
Lytton 142 144 40 4754 8 43 2
Port Edward 143 145 39 5088 5 13 -19
Hazelton 144 148 86 3309 -15 60 -14
Belcarra 145 139 117 1998 -1 95 -10
Pouce Coupe 146 147 95 3010 0 84 -6
Whistler 147 150 19 6630 -1 27 7
Tahsis 148 136 57 5012 18 27 -19
New Denver 149 135 125 2200 21 129 2
Stewart 150 152 79 4555 -7 56 -13
Northern Rockies 151 151 92 4772 -5 122 16
Tumbler Ridge 152 142 113 4847 22 69 -21
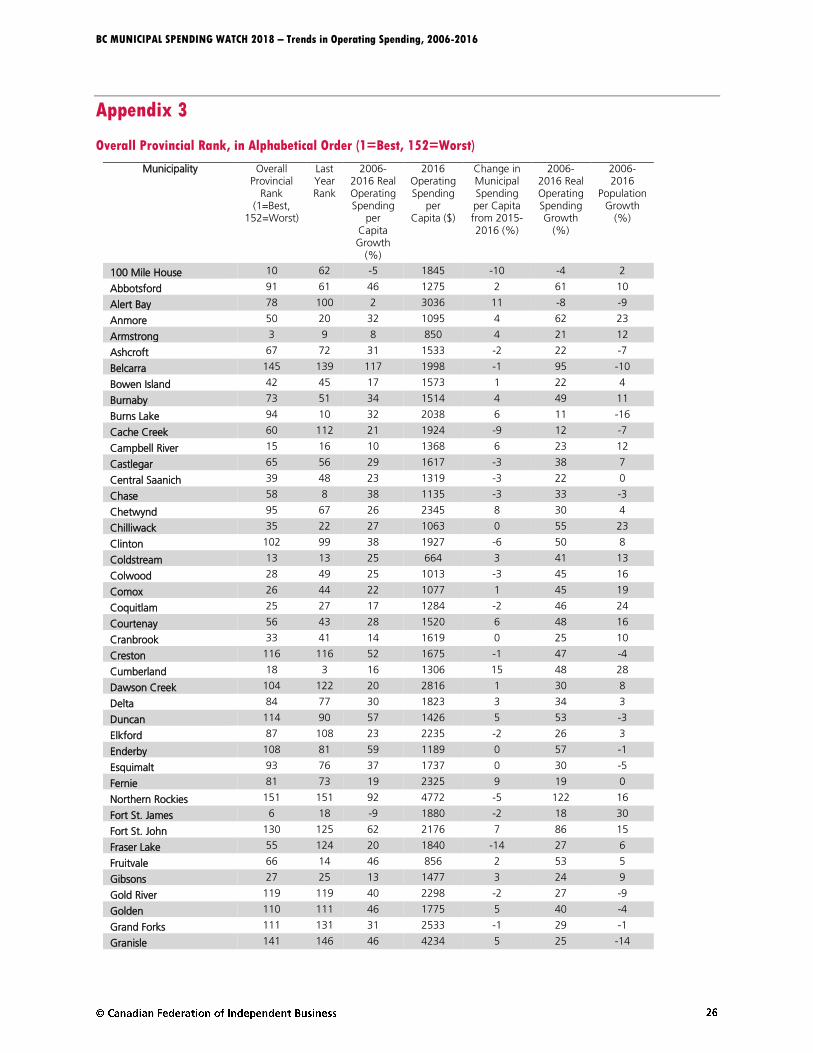
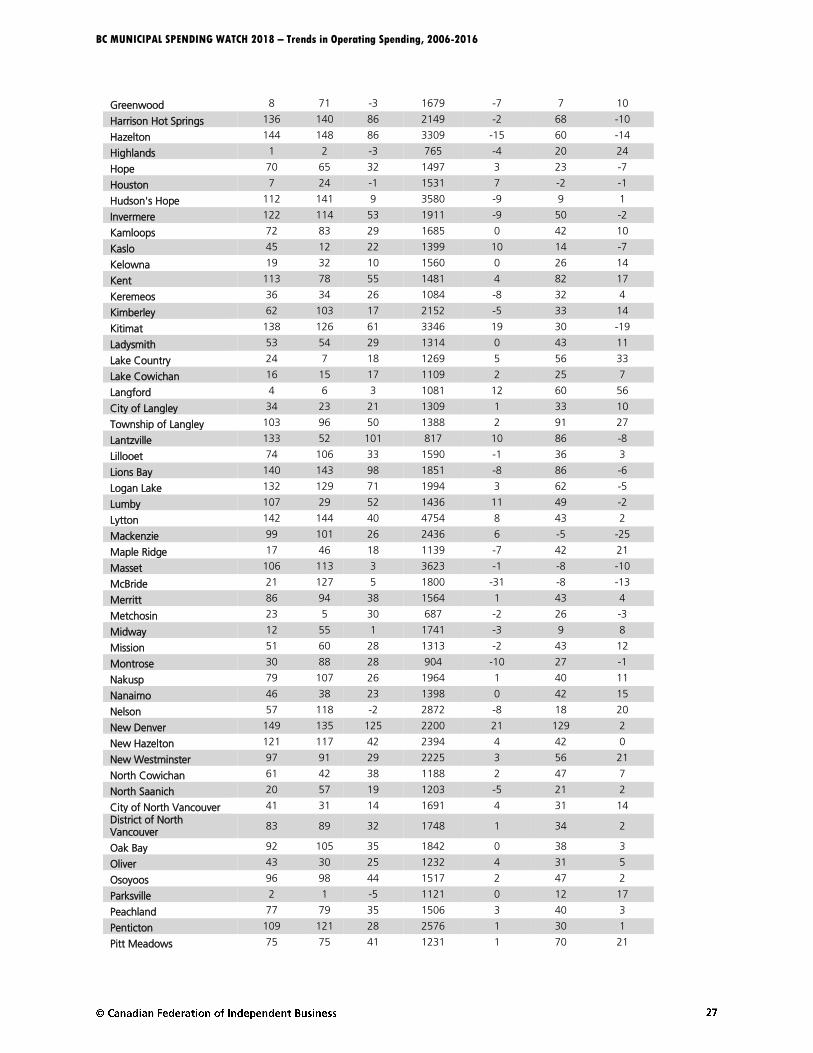
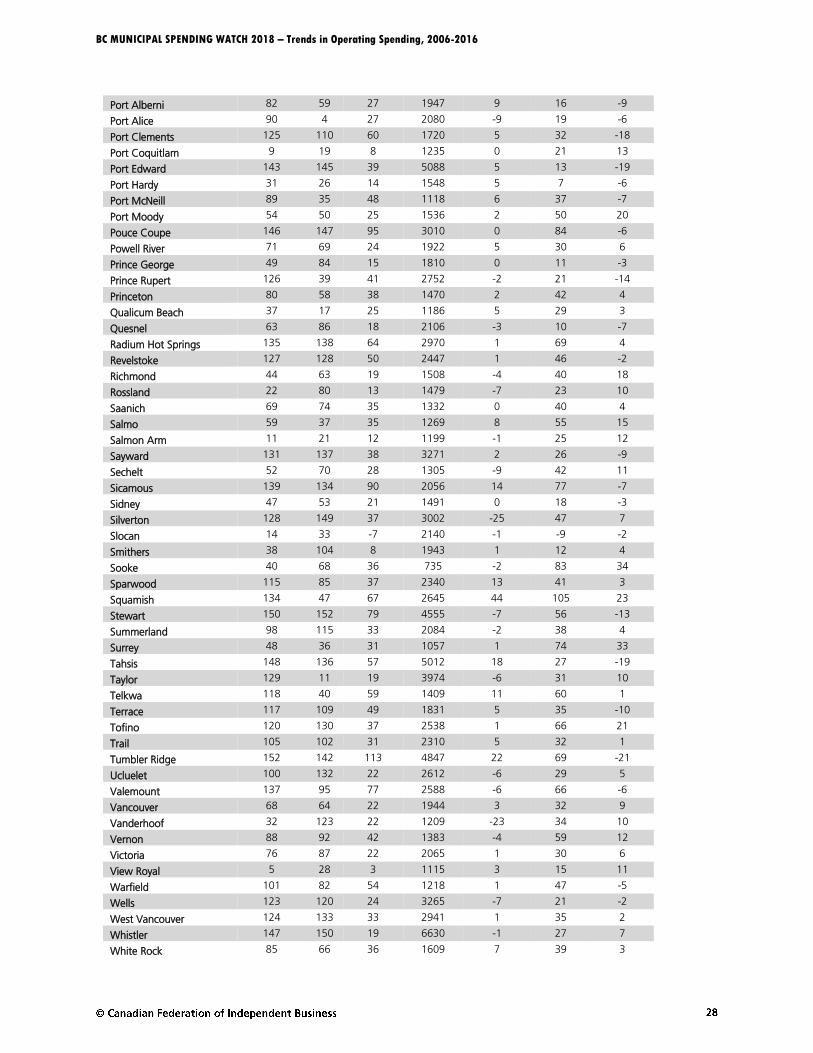
BC MUNICIPAL SPENDING WATCH 2018 – Trends in Operating Spending, 2006-2016
Appendix 3
Overall Provincial Rank, in Alphabetical Order (1=Best, 152=Worst)
Municipality Overall Provincial
Rank (1=Best,
152=Worst)
Last Year Rank
2006-2016 Real Operating Spending
per Capita Growth
(%)
2016 Operating Spending
per Capita ($)
Change in Municipal Spending per Capita from 2015-2016 (%)
2006-2016 Real Operating Spending Growth
(%)
2006-2016
Population Growth
(%)
100 Mile House 10 62 -5 1845 -10 -4 2
Abbotsford 91 61 46 1275 2 61 10
Alert Bay 78 100 2 3036 11 -8 -9
Anmore 50 20 32 1095 4 62 23
Armstrong 3 9 8 850 4 21 12
Ashcroft 67 72 31 1533 -2 22 -7
Belcarra 145 139 117 1998 -1 95 -10
Bowen Island 42 45 17 1573 1 22 4
Burnaby 73 51 34 1514 4 49 11
Burns Lake 94 10 32 2038 6 11 -16
Cache Creek 60 112 21 1924 -9 12 -7
Campbell River 15 16 10 1368 6 23 12
Castlegar 65 56 29 1617 -3 38 7
Central Saanich 39 48 23 1319 -3 22 0
Chase 58 8 38 1135 -3 33 -3
Chetwynd 95 67 26 2345 8 30 4
Chilliwack 35 22 27 1063 0 55 23
Clinton 102 99 38 1927 -6 50 8
Coldstream 13 13 25 664 3 41 13
Colwood 28 49 25 1013 -3 45 16
Comox 26 44 22 1077 1 45 19
Coquitlam 25 27 17 1284 -2 46 24
Courtenay 56 43 28 1520 6 48 16
Cranbrook 33 41 14 1619 0 25 10
Creston 116 116 52 1675 -1 47 -4
Cumberland 18 3 16 1306 15 48 28
Dawson Creek 104 122 20 2816 1 30 8
Delta 84 77 30 1823 3 34 3
Duncan 114 90 57 1426 5 53 -3
Elkford 87 108 23 2235 -2 26 3
Enderby 108 81 59 1189 0 57 -1
Esquimalt 93 76 37 1737 0 30 -5
Fernie 81 73 19 2325 9 19 0
Northern Rockies 151 151 92 4772 -5 122 16
Fort St. James 6 18 -9 1880 -2 18 30
Fort St. John 130 125 62 2176 7 86 15
Fraser Lake 55 124 20 1840 -14 27 6
Fruitvale 66 14 46 856 2 53 5
Gibsons 27 25 13 1477 3 24 9
Gold River 119 119 40 2298 -2 27 -9
Golden 110 111 46 1775 5 40 -4
Grand Forks 111 131 31 2533 -1 29 -1
Granisle 141 146 46 4234 5 25 -14
BC MUNICIPAL SPENDING WATCH 2018 – Trends in Operating Spending, 2006-2016
Greenwood 8 71 -3 1679 -7 7 10
Harrison Hot Springs 136 140 86 2149 -2 68 -10
Hazelton 144 148 86 3309 -15 60 -14
Highlands 1 2 -3 765 -4 20 24
Hope 70 65 32 1497 3 23 -7
Houston 7 24 -1 1531 7 -2 -1
Hudson's Hope 112 141 9 3580 -9 9 1
Invermere 122 114 53 1911 -9 50 -2
Kamloops 72 83 29 1685 0 42 10
Kaslo 45 12 22 1399 10 14 -7
Kelowna 19 32 10 1560 0 26 14
Kent 113 78 55 1481 4 82 17
Keremeos 36 34 26 1084 -8 32 4
Kimberley 62 103 17 2152 -5 33 14
Kitimat 138 126 61 3346 19 30 -19
Ladysmith 53 54 29 1314 0 43 11
Lake Country 24 7 18 1269 5 56 33
Lake Cowichan 16 15 17 1109 2 25 7
Langford 4 6 3 1081 12 60 56
City of Langley 34 23 21 1309 1 33 10
Township of Langley 103 96 50 1388 2 91 27
Lantzville 133 52 101 817 10 86 -8
Lillooet 74 106 33 1590 -1 36 3
Lions Bay 140 143 98 1851 -8 86 -6
Logan Lake 132 129 71 1994 3 62 -5
Lumby 107 29 52 1436 11 49 -2
Lytton 142 144 40 4754 8 43 2
Mackenzie 99 101 26 2436 6 -5 -25
Maple Ridge 17 46 18 1139 -7 42 21
Masset 106 113 3 3623 -1 -8 -10
McBride 21 127 5 1800 -31 -8 -13
Merritt 86 94 38 1564 1 43 4
Metchosin 23 5 30 687 -2 26 -3
Midway 12 55 1 1741 -3 9 8
Mission 51 60 28 1313 -2 43 12
Montrose 30 88 28 904 -10 27 -1
Nakusp 79 107 26 1964 1 40 11
Nanaimo 46 38 23 1398 0 42 15
Nelson 57 118 -2 2872 -8 18 20
New Denver 149 135 125 2200 21 129 2
New Hazelton 121 117 42 2394 4 42 0
New Westminster 97 91 29 2225 3 56 21
North Cowichan 61 42 38 1188 2 47 7
North Saanich 20 57 19 1203 -5 21 2
City of North Vancouver 41 31 14 1691 4 31 14
District of North Vancouver
83 89 32 1748 1 34 2
Oak Bay 92 105 35 1842 0 38 3
Oliver 43 30 25 1232 4 31 5
Osoyoos 96 98 44 1517 2 47 2
Parksville 2 1 -5 1121 0 12 17
Peachland 77 79 35 1506 3 40 3
Penticton 109 121 28 2576 1 30 1
Pitt Meadows 75 75 41 1231 1 70 21
BC MUNICIPAL SPENDING WATCH 2018 – Trends in Operating Spending, 2006-2016
Port Alberni 82 59 27 1947 9 16 -9
Port Alice 90 4 27 2080 -9 19 -6
Port Clements 125 110 60 1720 5 32 -18
Port Coquitlam 9 19 8 1235 0 21 13
Port Edward 143 145 39 5088 5 13 -19
Port Hardy 31 26 14 1548 5 7 -6
Port McNeill 89 35 48 1118 6 37 -7
Port Moody 54 50 25 1536 2 50 20
Pouce Coupe 146 147 95 3010 0 84 -6
Powell River 71 69 24 1922 5 30 6
Prince George 49 84 15 1810 0 11 -3
Prince Rupert 126 39 41 2752 -2 21 -14
Princeton 80 58 38 1470 2 42 4
Qualicum Beach 37 17 25 1186 5 29 3
Quesnel 63 86 18 2106 -3 10 -7
Radium Hot Springs 135 138 64 2970 1 69 4
Revelstoke 127 128 50 2447 1 46 -2
Richmond 44 63 19 1508 -4 40 18
Rossland 22 80 13 1479 -7 23 10
Saanich 69 74 35 1332 0 40 4
Salmo 59 37 35 1269 8 55 15
Salmon Arm 11 21 12 1199 -1 25 12
Sayward 131 137 38 3271 2 26 -9
Sechelt 52 70 28 1305 -9 42 11
Sicamous 139 134 90 2056 14 77 -7
Sidney 47 53 21 1491 0 18 -3
Silverton 128 149 37 3002 -25 47 7
Slocan 14 33 -7 2140 -1 -9 -2
Smithers 38 104 8 1943 1 12 4
Sooke 40 68 36 735 -2 83 34
Sparwood 115 85 37 2340 13 41 3
Squamish 134 47 67 2645 44 105 23
Stewart 150 152 79 4555 -7 56 -13
Summerland 98 115 33 2084 -2 38 4
Surrey 48 36 31 1057 1 74 33
Tahsis 148 136 57 5012 18 27 -19
Taylor 129 11 19 3974 -6 31 10
Telkwa 118 40 59 1409 11 60 1
Terrace 117 109 49 1831 5 35 -10
Tofino 120 130 37 2538 1 66 21
Trail 105 102 31 2310 5 32 1
Tumbler Ridge 152 142 113 4847 22 69 -21
Ucluelet 100 132 22 2612 -6 29 5
Valemount 137 95 77 2588 -6 66 -6
Vancouver 68 64 22 1944 3 32 9
Vanderhoof 32 123 22 1209 -23 34 10
Vernon 88 92 42 1383 -4 59 12
Victoria 76 87 22 2065 1 30 6
View Royal 5 28 3 1115 3 15 11
Warfield 101 82 54 1218 1 47 -5
Wells 123 120 24 3265 -7 21 -2
West Vancouver 124 133 33 2941 1 35 2
Whistler 147 150 19 6630 -1 27 7
White Rock 85 66 36 1609 7 39 3
BC MUNICIPAL SPENDING WATCH 2018 – Trends in Operating Spending, 2006-2016
Williams Lake 64 93 22 1919 3 28 5
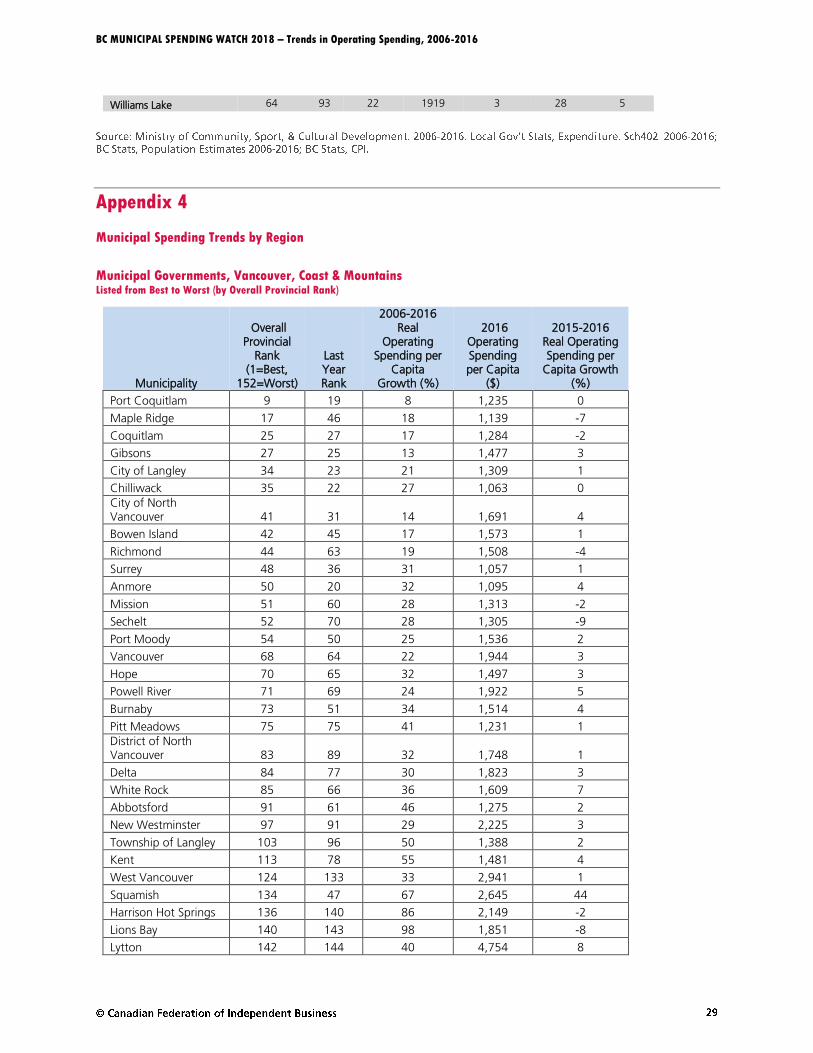
Appendix 4
Municipal Spending Trends by Region
Municipal Governments, Vancouver, Coast & Mountains Listed from Best to Worst (by Overall Provincial Rank)
Municipality
Overall Provincial
Rank (1=Best,
152=Worst)
Last Year Rank
2006-2016 Real
Operating Spending per
Capita Growth (%)
2016 Operating Spending per Capita
($)
2015-2016 Real Operating Spending per
Capita Growth (%)
Port Coquitlam 9 19 8 1,235 0
Maple Ridge 17 46 18 1,139 -7
Coquitlam 25 27 17 1,284 -2
Gibsons 27 25 13 1,477 3
City of Langley 34 23 21 1,309 1
Chilliwack 35 22 27 1,063 0
City of North Vancouver 41 31 14 1,691 4
Bowen Island 42 45 17 1,573 1
Richmond 44 63 19 1,508 -4
Surrey 48 36 31 1,057 1
Anmore 50 20 32 1,095 4
Mission 51 60 28 1,313 -2
Sechelt 52 70 28 1,305 -9
Port Moody 54 50 25 1,536 2
Vancouver 68 64 22 1,944 3
Hope 70 65 32 1,497 3
Powell River 71 69 24 1,922 5
Burnaby 73 51 34 1,514 4
Pitt Meadows 75 75 41 1,231 1
District of North Vancouver 83 89 32 1,748 1
Delta 84 77 30 1,823 3
White Rock 85 66 36 1,609 7
Abbotsford 91 61 46 1,275 2
New Westminster 97 91 29 2,225 3
Township of Langley 103 96 50 1,388 2
Kent 113 78 55 1,481 4
West Vancouver 124 133 33 2,941 1
Squamish 134 47 67 2,645 44
Harrison Hot Springs 136 140 86 2,149 -2
Lions Bay 140 143 98 1,851 -8
Lytton 142 144 40 4,754 8
BC MUNICIPAL SPENDING WATCH 2018 – Trends in Operating Spending, 2006-2016
Belcarra 145 139 117 1,998 -1
Whistler 147 150 19 6,630 -1
Regional Average 76 70 36 1,855 2
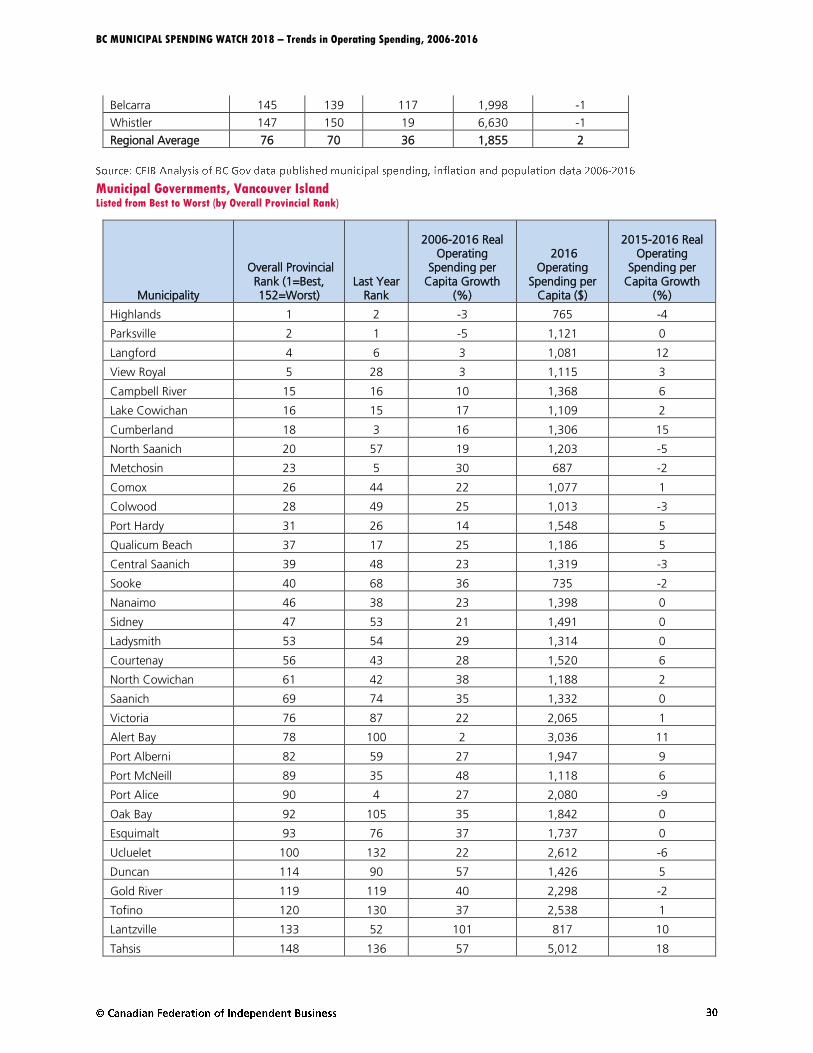
Municipal Governments, Vancouver Island Listed from Best to Worst (by Overall Provincial Rank)
Municipality
Overall Provincial Rank (1=Best, 152=Worst)
Last Year Rank
2006-2016 Real Operating
Spending per Capita Growth
(%)
2016 Operating
Spending per Capita ($)
2015-2016 Real Operating
Spending per Capita Growth
(%)
Highlands 1 2 -3 765 -4
Parksville 2 1 -5 1,121 0
Langford 4 6 3 1,081 12
View Royal 5 28 3 1,115 3
Campbell River 15 16 10 1,368 6
Lake Cowichan 16 15 17 1,109 2
Cumberland 18 3 16 1,306 15
North Saanich 20 57 19 1,203 -5
Metchosin 23 5 30 687 -2
Comox 26 44 22 1,077 1
Colwood 28 49 25 1,013 -3
Port Hardy 31 26 14 1,548 5
Qualicum Beach 37 17 25 1,186 5
Central Saanich 39 48 23 1,319 -3
Sooke 40 68 36 735 -2
Nanaimo 46 38 23 1,398 0
Sidney 47 53 21 1,491 0
Ladysmith 53 54 29 1,314 0
Courtenay 56 43 28 1,520 6
North Cowichan 61 42 38 1,188 2
Saanich 69 74 35 1,332 0
Victoria 76 87 22 2,065 1
Alert Bay 78 100 2 3,036 11
Port Alberni 82 59 27 1,947 9
Port McNeill 89 35 48 1,118 6
Port Alice 90 4 27 2,080 -9
Oak Bay 92 105 35 1,842 0
Esquimalt 93 76 37 1,737 0
Ucluelet 100 132 22 2,612 -6
Duncan 114 90 57 1,426 5
Gold River 119 119 40 2,298 -2
Tofino 120 130 37 2,538 1
Lantzville 133 52 101 817 10
Tahsis 148 136 57 5,012 18
BC MUNICIPAL SPENDING WATCH 2018 – Trends in Operating Spending, 2006-2016
Regional Average 58 53 27 1,571 2
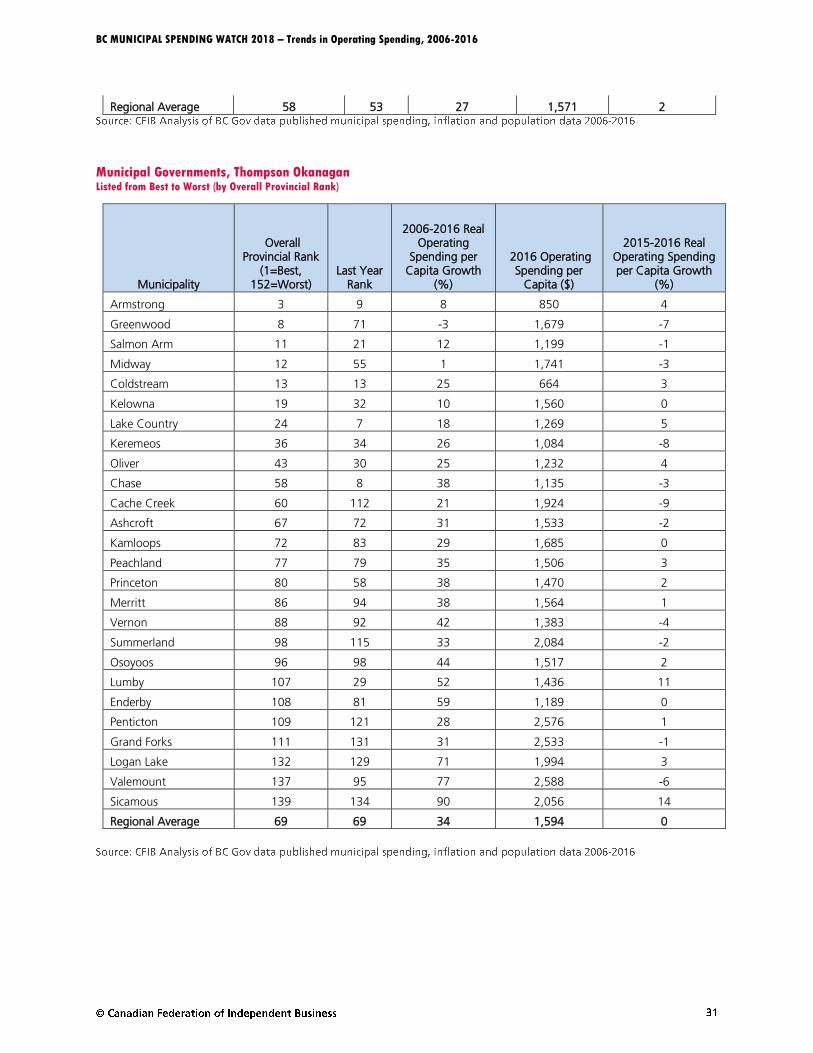
Municipal Governments, Thompson Okanagan Listed from Best to Worst (by Overall Provincial Rank)
Municipality
Overall Provincial Rank
(1=Best, 152=Worst)
Last Year Rank
2006-2016 Real Operating
Spending per Capita Growth
(%)
2016 Operating Spending per
Capita ($)
2015-2016 Real Operating Spending per Capita Growth
(%)
Armstrong 3 9 8 850 4
Greenwood 8 71 -3 1,679 -7
Salmon Arm 11 21 12 1,199 -1
Midway 12 55 1 1,741 -3
Coldstream 13 13 25 664 3
Kelowna 19 32 10 1,560 0
Lake Country 24 7 18 1,269 5
Keremeos 36 34 26 1,084 -8
Oliver 43 30 25 1,232 4
Chase 58 8 38 1,135 -3
Cache Creek 60 112 21 1,924 -9
Ashcroft 67 72 31 1,533 -2
Kamloops 72 83 29 1,685 0
Peachland 77 79 35 1,506 3
Princeton 80 58 38 1,470 2
Merritt 86 94 38 1,564 1
Vernon 88 92 42 1,383 -4
Summerland 98 115 33 2,084 -2
Osoyoos 96 98 44 1,517 2
Lumby 107 29 52 1,436 11
Enderby 108 81 59 1,189 0
Penticton 109 121 28 2,576 1
Grand Forks 111 131 31 2,533 -1
Logan Lake 132 129 71 1,994 3
Valemount 137 95 77 2,588 -6
Sicamous 139 134 90 2,056 14
Regional Average 69 69 34 1,594 0
BC MUNICIPAL SPENDING WATCH 2018 – Trends in Operating Spending, 2006-2016
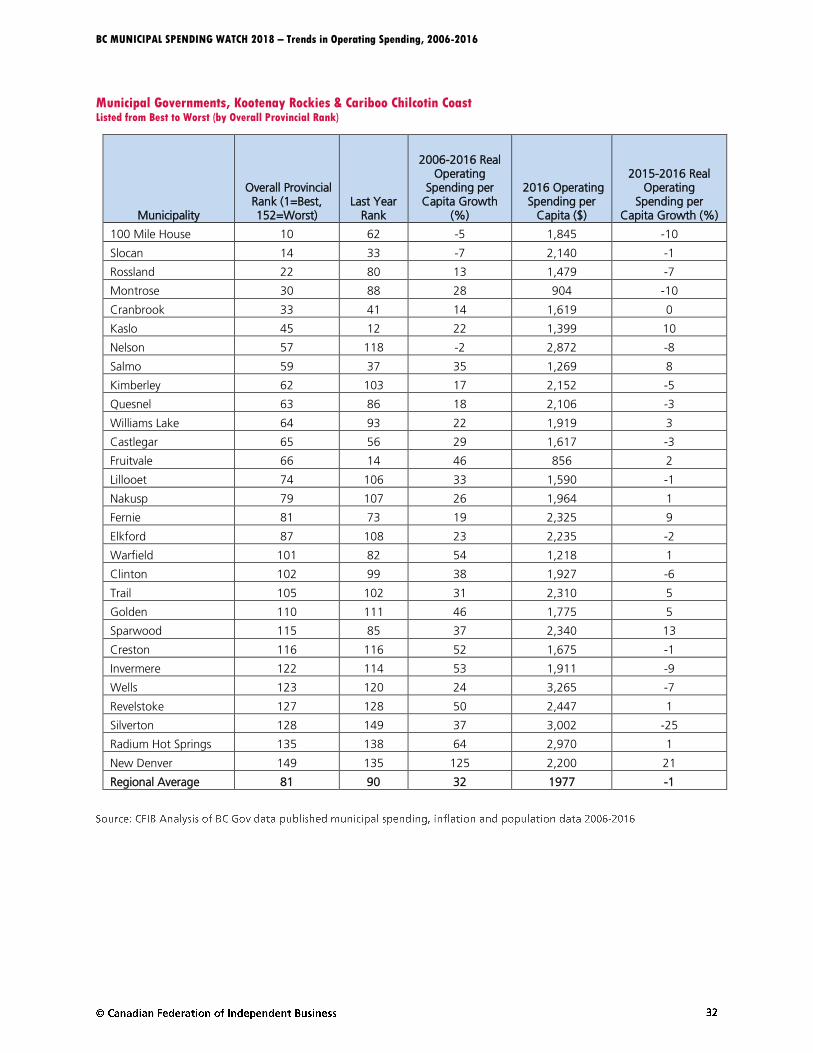
Municipal Governments, Kootenay Rockies & Cariboo Chilcotin Coast Listed from Best to Worst (by Overall Provincial Rank)
Municipality
Overall Provincial Rank (1=Best, 152=Worst)
Last Year Rank
2006-2016 Real Operating
Spending per Capita Growth
(%)
2016 Operating Spending per
Capita ($)
2015-2016 Real Operating
Spending per Capita Growth (%)
100 Mile House 10 62 -5 1,845 -10
Slocan 14 33 -7 2,140 -1
Rossland 22 80 13 1,479 -7
Montrose 30 88 28 904 -10
Cranbrook 33 41 14 1,619 0
Kaslo 45 12 22 1,399 10
Nelson 57 118 -2 2,872 -8
Salmo 59 37 35 1,269 8
Kimberley 62 103 17 2,152 -5
Quesnel 63 86 18 2,106 -3
Williams Lake 64 93 22 1,919 3
Castlegar 65 56 29 1,617 -3
Fruitvale 66 14 46 856 2
Lillooet 74 106 33 1,590 -1
Nakusp 79 107 26 1,964 1
Fernie 81 73 19 2,325 9
Elkford 87 108 23 2,235 -2
Warfield 101 82 54 1,218 1
Clinton 102 99 38 1,927 -6
Trail 105 102 31 2,310 5
Golden 110 111 46 1,775 5
Sparwood 115 85 37 2,340 13
Creston 116 116 52 1,675 -1
Invermere 122 114 53 1,911 -9
Wells 123 120 24 3,265 -7
Revelstoke 127 128 50 2,447 1
Silverton 128 149 37 3,002 -25
Radium Hot Springs 135 138 64 2,970 1
New Denver 149 135 125 2,200 21
Regional Average 81 90 32 1977 -1
BC MUNICIPAL SPENDING WATCH 2018 – Trends in Operating Spending, 2006-2016
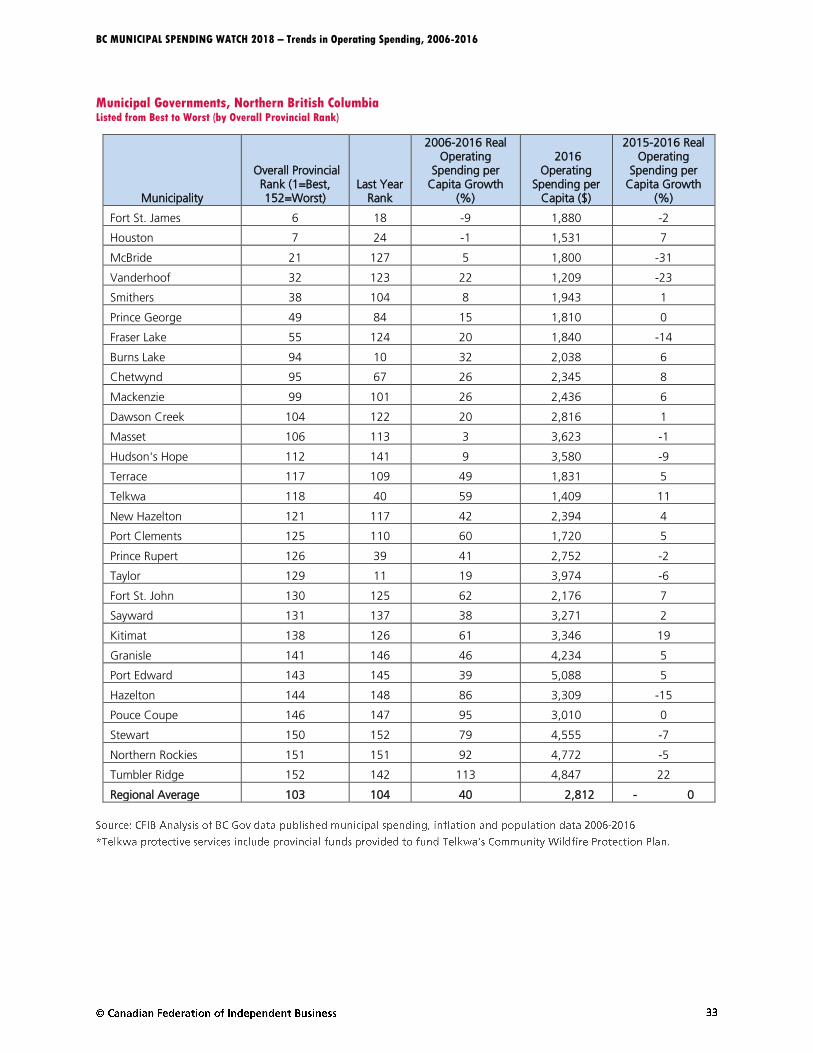
Municipal Governments, Northern British Columbia Listed from Best to Worst (by Overall Provincial Rank)
Municipality
Overall Provincial Rank (1=Best, 152=Worst)
Last Year Rank
2006-2016 Real Operating
Spending per Capita Growth
(%)
2016 Operating
Spending per Capita ($)
2015-2016 Real Operating
Spending per Capita Growth
(%)
Fort St. James 6 18 -9 1,880 -2
Houston 7 24 -1 1,531 7
McBride 21 127 5 1,800 -31
Vanderhoof 32 123 22 1,209 -23
Smithers 38 104 8 1,943 1
Prince George 49 84 15 1,810 0
Fraser Lake 55 124 20 1,840 -14
Burns Lake 94 10 32 2,038 6
Chetwynd 95 67 26 2,345 8
Mackenzie 99 101 26 2,436 6
Dawson Creek 104 122 20 2,816 1
Masset 106 113 3 3,623 -1
Hudson's Hope 112 141 9 3,580 -9
Terrace 117 109 49 1,831 5
Telkwa 118 40 59 1,409 11
New Hazelton 121 117 42 2,394 4
Port Clements 125 110 60 1,720 5
Prince Rupert 126 39 41 2,752 -2
Taylor 129 11 19 3,974 -6
Fort St. John 130 125 62 2,176 7
Sayward 131 137 38 3,271 2
Kitimat 138 126 61 3,346 19
Granisle 141 146 46 4,234 5
Port Edward 143 145 39 5,088 5
Hazelton 144 148 86 3,309 -15
Pouce Coupe 146 147 95 3,010 0
Stewart 150 152 79 4,555 -7
Northern Rockies 151 151 92 4,772 -5
Tumbler Ridge 152 142 113 4,847 22
Regional Average 103 104 40 2,812 - 0
BC MUNICIPAL SPENDING WATCH 2018 – Trends in Operating Spending, 2006-2016
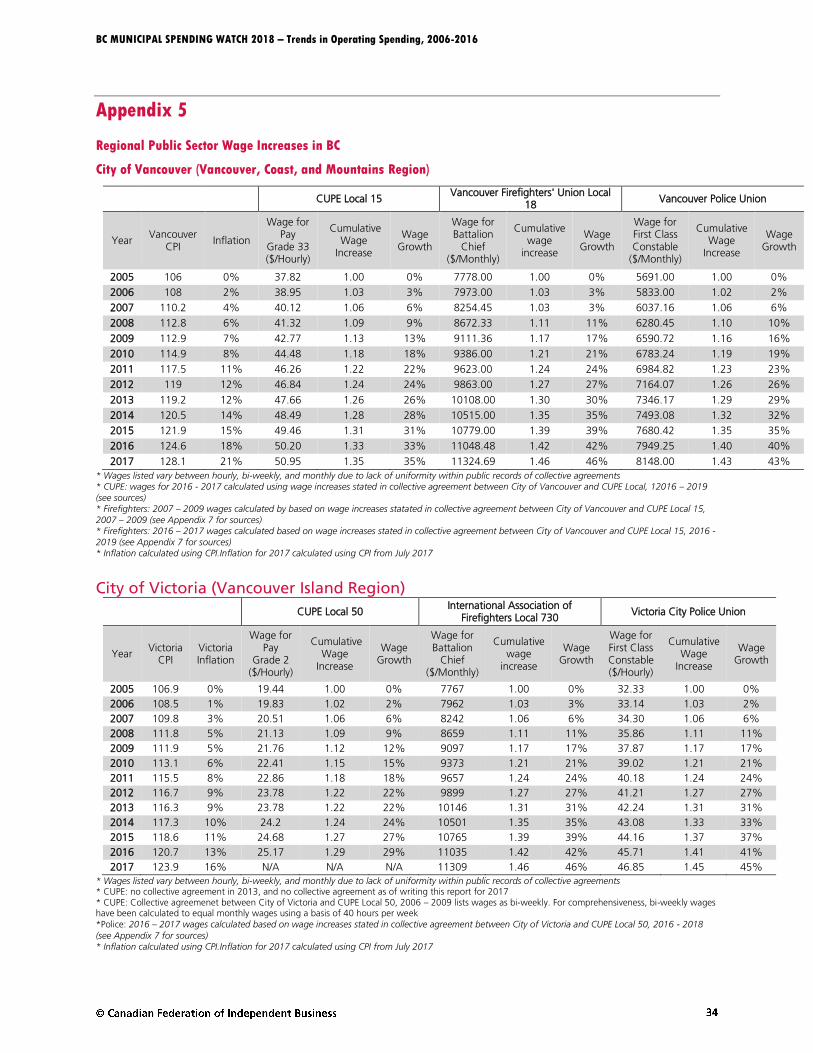
Appendix 5
Regional Public Sector Wage Increases in BC
City of Vancouver (Vancouver, Coast, and Mountains Region)
CUPE Local 15
Vancouver Firefighters' Union Local 18
Vancouver Police Union
Year Vancouver
CPI Inflation
Wage for Pay
Grade 33 ($/Hourly)
Cumulative Wage
Increase
Wage Growth
Wage for Battalion
Chief ($/Monthly)
Cumulative wage
increase
Wage Growth
Wage for First Class Constable
($/Monthly)
Cumulative Wage
Increase
Wage Growth
2005 106 0% 37.82 1.00 0% 7778.00 1.00 0% 5691.00 1.00 0%
2006 108 2% 38.95 1.03 3% 7973.00 1.03 3% 5833.00 1.02 2%
2007 110.2 4% 40.12 1.06 6% 8254.45 1.03 3% 6037.16 1.06 6%
2008 112.8 6% 41.32 1.09 9% 8672.33 1.11 11% 6280.45 1.10 10%
2009 112.9 7% 42.77 1.13 13% 9111.36 1.17 17% 6590.72 1.16 16%
2010 114.9 8% 44.48 1.18 18% 9386.00 1.21 21% 6783.24 1.19 19%
2011 117.5 11% 46.26 1.22 22% 9623.00 1.24 24% 6984.82 1.23 23%
2012 119 12% 46.84 1.24 24% 9863.00 1.27 27% 7164.07 1.26 26%
2013 119.2 12% 47.66 1.26 26% 10108.00 1.30 30% 7346.17 1.29 29%
2014 120.5 14% 48.49 1.28 28% 10515.00 1.35 35% 7493.08 1.32 32%
2015 121.9 15% 49.46 1.31 31% 10779.00 1.39 39% 7680.42 1.35 35%
2016 124.6 18% 50.20 1.33 33% 11048.48 1.42 42% 7949.25 1.40 40%
2017 128.1 21% 50.95 1.35 35% 11324.69 1.46 46% 8148.00 1.43 43%
* Wages listed vary between hourly, bi-weekly, and monthly due to lack of uniformity within public records of collective agreements * CUPE: wages for 2016 - 2017 calculated using wage increases stated in collective agreement between City of Vancouver and CUPE Local, 12016 – 2019
(see sources) * Firefighters: 2007 – 2009 wages calculated by based on wage increases statated in collective agreement between City of Vancouver and CUPE Local 15,
2007 – 2009 (see Appendix 7 for sources) * Firefighters: 2016 – 2017 wages calculated based on wage increases stated in collective agreement between City of Vancouver and CUPE Local 15, 2016 -
2019 (see Appendix 7 for sources) * Inflation calculated using CPI.Inflation for 2017 calculated using CPI from July 2017
City of Victoria (Vancouver Island Region)
CUPE Local 50
International Association of Firefighters Local 730
Victoria City Police Union
Year Victoria
CPI Victoria Inflation
Wage for Pay
Grade 2 ($/Hourly)
Cumulative Wage
Increase
Wage Growth
Wage for Battalion
Chief ($/Monthly)
Cumulative wage
increase
Wage Growth
Wage for First Class Constable ($/Hourly)
Cumulative Wage
Increase
Wage Growth
2005 106.9 0% 19.44 1.00 0% 7767 1.00 0% 32.33 1.00 0%
2006 108.5 1% 19.83 1.02 2% 7962 1.03 3% 33.14 1.03 2%
2007 109.8 3% 20.51 1.06 6% 8242 1.06 6% 34.30 1.06 6%
2008 111.8 5% 21.13 1.09 9% 8659 1.11 11% 35.86 1.11 11%
2009 111.9 5% 21.76 1.12 12% 9097 1.17 17% 37.87 1.17 17%
2010 113.1 6% 22.41 1.15 15% 9373 1.21 21% 39.02 1.21 21%
2011 115.5 8% 22.86 1.18 18% 9657 1.24 24% 40.18 1.24 24%
2012 116.7 9% 23.78 1.22 22% 9899 1.27 27% 41.21 1.27 27%
2013 116.3 9% 23.78 1.22 22% 10146 1.31 31% 42.24 1.31 31%
2014 117.3 10% 24.2 1.24 24% 10501 1.35 35% 43.08 1.33 33%
2015 118.6 11% 24.68 1.27 27% 10765 1.39 39% 44.16 1.37 37%
2016 120.7 13% 25.17 1.29 29% 11035 1.42 42% 45.71 1.41 41%
2017 123.9 16% N/A N/A N/A 11309 1.46 46% 46.85 1.45 45%
* Wages listed vary between hourly, bi-weekly, and monthly due to lack of uniformity within public records of collective agreements * CUPE: no collective agreement in 2013, and no collective agreement as of writing this report for 2017 * CUPE: Collective agreemenet between City of Victoria and CUPE Local 50, 2006 – 2009 lists wages as bi-weekly. For comprehensiveness, bi-weekly wages have been calculated to equal monthly wages using a basis of 40 hours per week
*Police: 2016 – 2017 wages calculated based on wage increases stated in collective agreement between City of Victoria and CUPE Local 50, 2016 - 2018
(see Appendix 7 for sources) * Inflation calculated using CPI.Inflation for 2017 calculated using CPI from July 2017
BC MUNICIPAL SPENDING WATCH 2018 – Trends in Operating Spending, 2006-2016
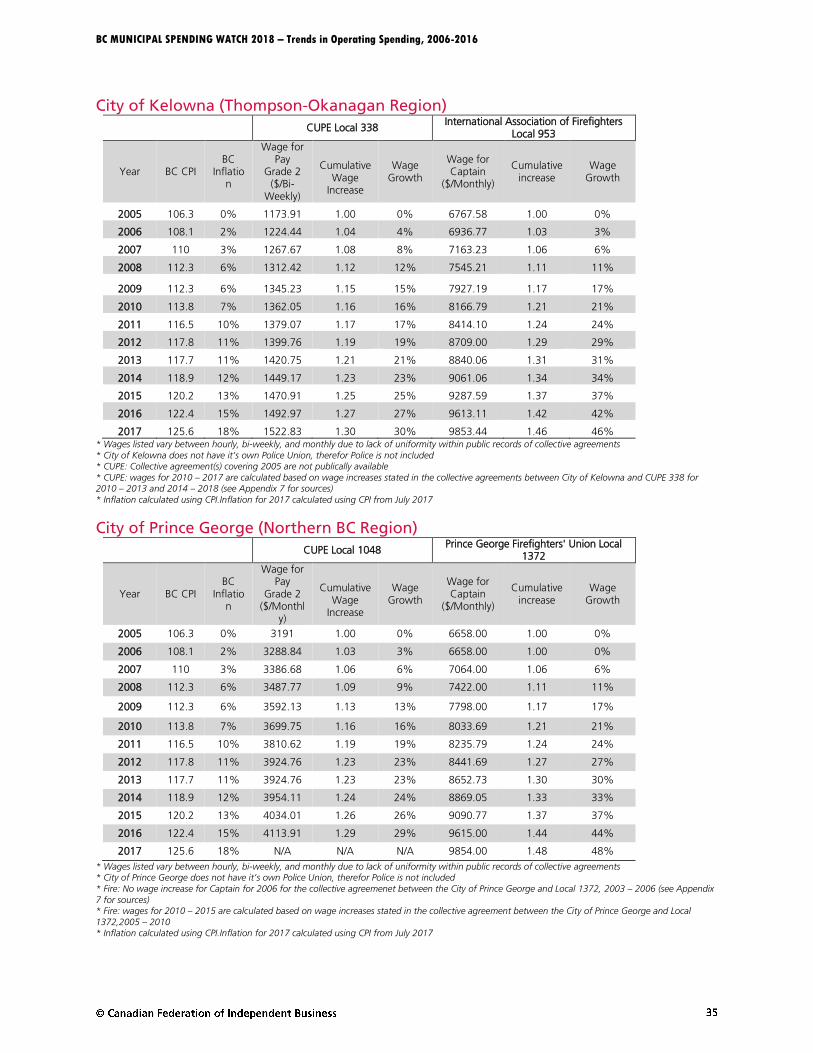
City of Kelowna (Thompson-Okanagan Region)
CUPE Local 338
International Association of Firefighters Local 953
Year BC CPI BC
Inflation
Wage for Pay
Grade 2 ($/Bi-
Weekly)
Cumulative
Wage Increase
Wage Growth
Wage for Captain
($/Monthly)
Cumulative increase
Wage Growth
2005 106.3 0% 1173.91 1.00 0% 6767.58 1.00 0%
2006 108.1 2% 1224.44 1.04 4% 6936.77 1.03 3%
2007 110 3% 1267.67 1.08 8% 7163.23 1.06 6%
2008 112.3 6% 1312.42 1.12 12% 7545.21 1.11 11%
2009 112.3 6% 1345.23 1.15 15% 7927.19 1.17 17%
2010 113.8 7% 1362.05 1.16 16% 8166.79 1.21 21%
2011 116.5 10% 1379.07 1.17 17% 8414.10 1.24 24%
2012 117.8 11% 1399.76 1.19 19% 8709.00 1.29 29%
2013 117.7 11% 1420.75 1.21 21% 8840.06 1.31 31%
2014 118.9 12% 1449.17 1.23 23% 9061.06 1.34 34%
2015 120.2 13% 1470.91 1.25 25% 9287.59 1.37 37%
2016 122.4 15% 1492.97 1.27 27% 9613.11 1.42 42%
2017 125.6 18% 1522.83 1.30 30% 9853.44 1.46 46% * Wages listed vary between hourly, bi-weekly, and monthly due to lack of uniformity within public records of collective agreements
* City of Kelowna does not have it’s own Police Union, therefor Police is not included * CUPE: Collective agreement(s) covering 2005 are not publically available
* CUPE: wages for 2010 – 2017 are calculated based on wage increases stated in the collective agreements between City of Kelowna and CUPE 338 for 2010 – 2013 and 2014 – 2018 (see Appendix 7 for sources)
* Inflation calculated using CPI.Inflation for 2017 calculated using CPI from July 2017
City of Prince George (Northern BC Region)
CUPE Local 1048
Prince George Firefighters' Union Local 1372
Year BC CPI BC
Inflation
Wage for Pay
Grade 2 ($/Monthl
y)
Cumulative
Wage Increase
Wage Growth
Wage for Captain
($/Monthly)
Cumulative increase
Wage Growth
2005 106.3 0% 3191 1.00 0% 6658.00 1.00 0%
2006 108.1 2% 3288.84 1.03 3% 6658.00 1.00 0%
2007 110 3% 3386.68 1.06 6% 7064.00 1.06 6%
2008 112.3 6% 3487.77 1.09 9% 7422.00 1.11 11%
2009 112.3 6% 3592.13 1.13 13% 7798.00 1.17 17%
2010 113.8 7% 3699.75 1.16 16% 8033.69 1.21 21%
2011 116.5 10% 3810.62 1.19 19% 8235.79 1.24 24%
2012 117.8 11% 3924.76 1.23 23% 8441.69 1.27 27%
2013 117.7 11% 3924.76 1.23 23% 8652.73 1.30 30%
2014 118.9 12% 3954.11 1.24 24% 8869.05 1.33 33%
2015 120.2 13% 4034.01 1.26 26% 9090.77 1.37 37%
2016 122.4 15% 4113.91 1.29 29% 9615.00 1.44 44%
2017 125.6 18% N/A N/A N/A 9854.00 1.48 48%
* Wages listed vary between hourly, bi-weekly, and monthly due to lack of uniformity within public records of collective agreements * City of Prince George does not have it’s own Police Union, therefor Police is not included
* Fire: No wage increase for Captain for 2006 for the collective agreemenet between the City of Prince George and Local 1372, 2003 – 2006 (see Appendix
7 for sources) * Fire: wages for 2010 – 2015 are calculated based on wage increases stated in the collective agreement between the City of Prince George and Local
1372,2005 – 2010 * Inflation calculated using CPI.Inflation for 2017 calculated using CPI from July 2017
BC MUNICIPAL SPENDING WATCH 2018 – Trends in Operating Spending, 2006-2016
Appendix 6
Cumulative Wage Sources
BC Bargaining Database. 2017. BC Collective Agreements – 2012 to 2015 Collective Agreement between the City of Vancouver and the Canadian Union of Public Employees Local 15. http://www.bcbargaining.ca/content/1340/Vancouver_CUPE_15_2012-15.pdf BC Bargaining Database. 2017. BC Collective Agreements – 2016 to 2019 Collective Agreement between the City of Vancouver and the Vancouver Firefighters’ Union Local 18. http://www.bcbargaining.ca/?search=1&company=Vancouver%2C+City+of§or%5B%5D=public§or%5B%5D=private&industry=&un=64178547dcbcf0bb992e6d6fee52c51e6adb3e7b5ab1b8498706d67f9164f6b6fcc0e3f05ba573e5961299ea3f4a8770&date_type=0&startdate=&enddate=&q= BC Bargaining Database. 2017. BC Collective Agreements – 2016 to 2018 Collective Agreement between City of Victoria and Victoria City Police Union. http://www.bcbargaining.ca/content/1749/GVLRA-Victoria%20Police%202016-2018.pdf BC Bargaining Database. 2017. BC Collective Agreements – 2016 to 2018 Collective Agreement between City of Victoria and Victoria City Police Union. http://www.bcbargaining.ca/content/1749/GVLRA-Victoria%20Police%202016-2018.pdf BC Bargaining Database. 2017. BC Collective Agreements – 2010 to 2012 Collective Agreement between City of Kelowna and the International Association of Fire Fighters Local 953. http://www.bcbargaining.ca/content/824/Kelowna_IAFF2012.pdf BC Bargaining Database. 2017. BC Collective Agreements – 2013 to 2019 Collective Agreement between City of Kelowna and the International Association of Fire Fighters Local 953. http://www.bcbargaining.ca/content/1860/iaff_collective_agreement_with_schedule_a_and_b_for_2013-01-01_to_2019-12-31_-_final_signed_copy.pdf
Canadian Federation of Independent Business. 2018. Canada’s job vacancies rate reaches new heights. https://www.cfib-fcei.ca/en/media/canadas-job-vacancies-rate-reaches-new-heights City of Kelowna, Compensation & Benefits Manager. 2017. 2002 to 2005 Collective Agreement between Okanagan Mainline Municipal Labour Relations Association on behalf of the City of Kelowna and Canadian Union of Public Employees, Local 338. PDF City of Kelowna, Human Resources. 2017. Collective Agreement between the City of Kelowna and the International Association of Fire Fighters Local 953. PDF City of Victoria. 2017. Human Resources Department – 2016 to 2019 Collective Agreement between The Corporation of The City of Victoria and International Association of Fire Fighters Local 730. http://www.victoria.ca/assets/Departments/Human~Resources/Documents/vfd-collectiveagreement-jan2017.pdf CUPE Local 15. 2017. Parks Collective Agreement – Memorandum of Agreement 2016 to 2019. http://www.cupe15.org/sites/all/files/City%20et%20al%20Memorandum%20of%20Agreement_0.pdf
BC MUNICIPAL SPENDING WATCH 2018 – Trends in Operating Spending, 2006-2016
Government of Canada. 2017. Negotech Search – 2003 to 2006 Collective Agreement between the City of Vancouver and the
Canadian Union of Public Employees Local 15. http://negotech.labour.gc.ca/eng/agreements/07/0732508a.pdf
Government of Canada. 2017. Negotech Search – 2007 to 2011 Collective Agreement between the City of Vancouver and the Canadian Union of Public Employees Local 15. http://negotech.labour.gc.ca/eng/agreements/07/0732509a.pdf
Government of Canada. 2017. Negotech Search – 2003 to 2006 Collective Agreement between the City of Vancouver and the Vancouver Firefighters’ Union Local 18. http://negotech.labour.gc.ca/eng/agreements/07/0732410a.pdf Government of Canada. 2017. Negotech Search – 2007 to 2009 Collective Agreement between the City of Vancouver and the Vancouver Firefighters’ Union Local 18. http://negotech.labour.gc.ca/eng/agreements/07/0732411a.pdf Government of Canada. 2017. Negotech Search – 2010 to 2011 Collective Agreement between the City of Vancouver and the Vancouver Firefighters’ Union Local 18. http://negotech.labour.gc.ca/eng/agreements/07/0732412a.pdf Government of Canada. 2017. Negotech Search – 2012 to 2015 Collective Agreement between the City of Vancouver and the Vancouver Firefighters’ Union Local 18. http://negotech.labour.gc.ca/eng/agreements/07/0732413a.pdf Government of Canada. 2017. Negotech Search – 2003 to 2006 Collective Agreement between the City Vancouver Police Board and the Vancouver Police Union. http://negotech.labour.gc.ca/eng/agreements/07/0732209a.pdf Government of Canada. 2017. Negotech Search – 2007 to 2009 Collective Agreement between the City Vancouver Police Board and the Vancouver Police Union. http://negotech.labour.gc.ca/eng/agreements/07/0732210a.pdf Government of Canada. 2017. Negotech Search – 2010 to 2012 Collective Agreement between the City Vancouver Police Board and the Vancouver Police Union. http://negotech.labour.gc.ca/eng/agreements/07/0732211a.pdf Government of Canada. 2017. Negotech Search – 2013 to 2015 Collective Agreement between the City Vancouver Police Board and the Vancouver Police Union. http://negotech.labour.gc.ca/eng/agreements/07/0732212a.pdf Government of Canada. 2017. Negotech Search – 2016 to 2018 Collective Agreement between the City Vancouver Police Board and the Vancouver Police Union. http://negotech.labour.gc.ca/eng/agreements/07/0732213a.pdf Government of Canada. 2017. Negotech Search – 2001 to 2006 Collective Agreement between the Corporation of the City of Victoria and the Canadian Union of Public Employees Local 50. http://negotech.labour.gc.ca/eng/agreements/13/1335401a.pdf Government of Canada. 2017. Negotech Search – 2007 to 2010 Collective Agreement between the Corporation of the City of Victoria and the Canadian Union of Public Employees Local 50. http://negotech.labour.gc.ca/eng/agreements/13/1335402a.pdf Government of Canada. 2017. Negotech Search – 2011 to 2013 Collective Agreement between the Corporation of the City of Victoria and the Canadian Union of Public Employees Local 50. http://negotech.labour.gc.ca/eng/agreements/13/1335403a.pdf
BC MUNICIPAL SPENDING WATCH 2018 – Trends in Operating Spending, 2006-2016
Government of Canada. 2017. Negotech Search – 2014 to 2016 Collective Agreement between the Corporation of the City of Victoria and the Canadian Union of Public Employees Local 50. http://negotech.labour.gc.ca/eng/agreements/13/1335404a.pdf Government of Canada. 2017. Negotech Search – 2004 to 2006 Collective Agreement between The Corporation of The City of Victoria and International Association of Fire Fighters Local 730. http://negotech.labour.gc.ca/eng/agreements/07/0728709a.pdf Government of Canada. 2017. Negotech Search – 2007 to 2009 Collective Agreement between The Corporation of The City of Victoria and International Association of Fire Fighters Local 730. http://negotech.labour.gc.ca/eng/agreements/07/0728710a.pdf Government of Canada. 2017. Negotech Search – 2010 to 2011 Collective Agreement between The Corporation of The City of Victoria and International Association of Fire Fighters Local 730. http://negotech.labour.gc.ca/eng/agreements/07/0728711a.pdf Government of Canada. 2017. Negotech Search – 2012 to 2015 Collective Agreement between The Corporation of The City of Victoria and International Association of Fire Fighters Local 730. http://negotech.labour.gc.ca/eng/agreements/07/0728712a.pdf Government of Canada. 2017. Negotech Search – 2003 to 2006 Collective Agreement between Victoria Police Board and Victoria City Police Union. http://negotech.labour.gc.ca/eng/agreements/07/0728510a.pdf Government of Canada. 2017. Negotech Search – 2007 to 2010 Collective Agreement between Victoria Police Board and Victoria City Police Union. http://negotech.labour.gc.ca/eng/agreements/07/0728511a.pdf Government of Canada. 2017. Negotech Search – 2010 to 2012 Collective Agreement between Victoria Police Board and Victoria City Police Union. http://negotech.labour.gc.ca/eng/agreements/07/0728512a.pdf Government of Canada. 2017. Negotech Search – 2013 to 2015 Collective Agreement between Victoria Police Board and Victoria City Police Union. http://negotech.labour.gc.ca/eng/agreements/07/0728513a.pdf Government of Canada. 2017. Negotech Search – 2006 to 2009 Collective Agreement between Okanagan Mainline Municipal Labour Relations Association on behalf of the City of Kelowna and Canadian Union of Public Employees Local 338. http://negotech.labour.gc.ca/eng/agreements/07/0729408a.pdf Government of Canada. 2017. Negotech Search – 2010 to 2013 Collective Agreement between City of Kelowna and Canadian Union of Public Employees Local 338. http://negotech.labour.gc.ca/eng/agreements/07/0729409a.pdf Government of Canada. 2017. Negotech Search – 2014 to 2018 Collective Agreement between City of Kelowna and Canadian Union of Public Employees Local 338. http://negotech.labour.gc.ca/eng/agreements/07/0729410a.pdf Labour Relations Board British Columbia. 2017. LBR Collective Agreements – 2005 to 2006 Collective Agreement between The Regional District of Central Okanagan and The Westside Professional Fire Fighters’ Association Local 4457. http://www.lrb.bc.ca/cas/WSM19.pdf Government of Canada. 2017. Negotech Search – 2005 to 2007 Collective Agreement between the City of Prince George and the Canadian Union of Public Employees Local 1048. http://negotech.labour.gc.ca/eng/agreements/07/0729810a.pdf

BC MUNICIPAL SPENDING WATCH 2018 – Trends in Operating Spending, 2006-2016
Government of Canada. 2017. Negotech Search – 2008 to 2012 Collective Agreement between the City of Prince George and CUPE Local 1048. http://negotech.labour.gc.ca/eng/agreements/07/0729811a.pdf Government of Canada. 2017. Negotech Search – 2013 to 2016 Collective Agreement between the City of Prince George and Canadian Union of Public Employees Local 1048. http://negotech.labour.gc.ca/eng/agreements/07/0729812a.pdf\ Government of Canada. 2017. Negotech Search – 2003 to 2006 Collective Agreement between the City of Prince George and the I.A.F.F., Local 1372. http://negotech.labour.gc.ca/eng/agreements/07/0729909a.pdf Government of Canada. 2017. Negotech Search – 2007 to 2010 Collective Agreement between the City of Prince George and the I.A.F.F., Local 1372. http://negotech.labour.gc.ca/eng/agreements/07/0729910a.pdf Government of Canada. 2017. Negotech Search – In the Matter of the Arbitration under the Fire and Police Services Collective Bargaining Act. 2010 to 2015 Collective Agreement between the City of Prince George and the Prince George Firefighters’ Union, Local 1372. http://negotech.labour.gc.ca/eng/agreements/07/0729911a.pdf Government of Canada. 2017. Negotech Search – 2016 to 2019 Collective Agreement between the City of Prince George and the I.A.F.F., Local 1372. http://negotech.labour.gc.ca/eng/agreements/07/0729912a.pdf Royal Canadian Mounted Police. 2015. Fair Compensation for the RCMP. RCMP Pay Council. http://publications.gc.ca/collections/collection_2015/grc-rcmp/PS64-123-2015-eng.pdf