bringing science to market: commercializing from...
TRANSCRIPT
Bringing science to market: Commercializing from NIH SBIR awards.
By: Albert N. Link and Christopher J. Ruhm
Link, A. N., & Ruhm, C. J. (November 23, 2009). Bringing science to market: Commercializing from NIH SBIR awards. Economics of Innovation and New Technology, 18, 4, 381-402.
This is an Author's Original Manuscript of an article whose final and definitive form, the Version of Record, has been published in Economics of Innovation and New Technology, 2009 [copyright Taylor & Francis], available online at: http://www.tandfonline.com/10.1080/10438590802208166.
Abstract:
We offer empirical information on the correlates of commercialization activity for research projects funded through the US National Institutes of Health's (NIH's) Small Business Innovation Research (SBIR) award program. Based on this analysis we suggest possible recommendations for improving this aspect of the performance of NIH's SBIR program. Specifically, we estimate a model of the probability of commercialization as a function of the project's ability to attract additional developmental funding, along with other control variables. We find that additional developmental funding from non-SBIR federal sources and from own internal sources are important predictors of commercialization success, relatively more so than additional developmental funding from venture capitalists. We also find, among other things, that university involvement in the underlying research increases the probability of commercialization. Thus, these factors should be considered by NIH when making awards, if increased commercialization is an objective.
small businesses | business innovation | small business innovation research program | Keywords:technology commercialization | research and development | economics
Article:
1. Introduction
In light of the productivity slowdown in the United States in the late-1970s and early-1980s, a number of public policy responses were initiated to enhance the rate of US innovation through increases in research and development (R&D) and related activities.1 The Bayh–Dole Act was passed in 1980, the R&E Tax Credit was enacted in 1981, the Small Business Innovation Research (SBIR) program was created in 1982, and the National Cooperative Research Act was legislated in 1984. The broad purpose of these policy responses was to renew technological growth throughout the nation.2
This paper focuses specifically on the management of the SBIR program, and it offers information relevant to the assessment of the program's objective of stimulating the private

sector's commercialization of the innovations resulting from the use of public resources. Based on that information, the paper also suggests possible policy recommendations to improve funding performance. We certainly do not claim that the SBIR program was the most significant of the post-productivity slowdown policy initiatives. However, our focus on it is particularly fruitful because of the availability of unique and rich data – recently collected by the National Research Council (NRC) within the National Academies as part of an overall evaluation of the SBIR program – related to SBIR projects funded by the National Institutes of Health (NIH) and because the SBIR program has yet to be analyzed statistically relative to its stated objectives.3
Statistical analysis of commercialization is important at two levels. Broadly, it is a dimension of public accountability (Link and Scott 1998), as stated in a recent NRC report: ‘Commercializing SBIR-supported innovation is necessary if the nation is to capitalize on its SBIR investments’ (National Research Council 2007, 5). And, at a narrower level, an assessment offers the potential for policy recommendations to improve the management of the SBIR program.
Commercialization of SBIR projects funded by the NIH is of particular interest for several reasons. First, as detailed below, the Department of Health and Human Services (2003) is the largest funder of non-defense related SBIR projects and most of these are through the NIH. Second, commercialized technologies that result in improvements in health are particularly likely to have high rates of return (social and private). For instance, recent research (e.g., Murphy and Topel 2006; Hall and Jones 2007) documents both the large net benefit of previous health spending, as well as the desirability of even higher expenditure shares in the future.
This paper is outlined as follows. In Section 2, we overview the history of the SBIR program with an emphasis on current funding activities. Section 3 describes the NIH SBIR data set analyzed, and therein we posit the empirical framework used for estimating the probability that an SBIR-funded project will be commercialized. Section 4 presents our econometric findings. Section 5 discusses endogeneity issues related to our econometric analysis, and Section 6 offers tentative policy recommendations subject to the limitations of our analysis.
2. Overview of the SBIR program
The SBIR program is a public/private partnership that provides grants to fund private R&D projects. It aims to help fulfill the government's mission to enhance private-sector R&D and to complement the results of federal research.4 A prototype of the SBIR program began at the National Science Foundation (NSF) in 1977 (Tibbetts 1999). At that time, the goal of the program was to encourage small businesses – increasingly recognized to be a source of innovation and employment in the US economy – to participate in NSF-sponsored research, especially research with commercial potential. Because of the early success of the program at NSF, Congress passed the Small Business Innovation Development Act of 1982 (P.L. 97-219; hereafter, the 1982 Act).
The 1982 Act required all government departments and agencies with external research programs of greater than $100 million to establish their own SBIR program and to set aside funds equal to 0.20% of the external research budget.5 In 1983, this amount totalled $45 million.
The objectives of the program as stated by the 1982 Act are as follows:
1 Simulating technological innovation.
2 Using small business to meet Federal research and development needs.
3 Fostering and encouraging participation by minority and disadvantaged persons in technological innovation.
4 Increasing private sector commercialization of innovations derived from Federal research and development.
As part of the 1982 Act, SBIR program awards were structured as defined by three phases (National Research Council 2004; Wessner 2007).6 Phase I awards are small, generally less than $100,000 for the six month award period. The purpose of Phase I awards is to assist businesses as they assess the feasibility of an idea's scientific and commercial potential in response to the funding agency's objectives.7 Phase II awards typically range up to $750,000 over two years.8 These awards are for the business to develop further its proposed research, ideally leading to a commercializable product, process, or service.9 The Phase II awards of public funds for development are sometimes augmented by outside private funding (Wessner 2000). Further work on the projects launched through the SBIR program occurs in what is called Phase III, which does not involve SBIR funds.10 At this stage businesses needing additional financing—to ensure that the product, process, or service can move into the marketplace—are expected to obtain it from sources other than the SBIR program.
In 1992, the SBIR program was reauthorized until 2000 through the Small Business Research and Development Enactment Act (P.L. 102-564). Under the 1982 Act, the set aside had increased to 1.25%; the 1992 reauthorization raised that amount over time to 2.50% and re-emphasized the commercialization intent of SBIR-funded technologies (see point (4) of the 1982 Act above).11 The 1992 reauthorization broadened objective (3) above to also focus on women: ‘to provide for enhanced outreach efforts to increase the participation of … small businesses that are 51 percent owned and controlled by women.’ The Small Business Reauthorization Act of 2000 (P.L. 106-554) extended the SBIR program until 2008 and kept the 2.50% set aside.12
Eleven agencies currently participate in the SBIR program: the Environmental Protection Agency (EPA), the National Aeronautics and Space Administration (NASA), the National Science Foundation (NSF), and the Departments of Agriculture (USDA), Commerce (DoC), Defense (DoD), Education (ED), Energy (DoE), Health and Human Services (HHS, particularly the NIH), Transportation (DoT), and, most recently, Homeland Security (DHS). In 2005, DoD
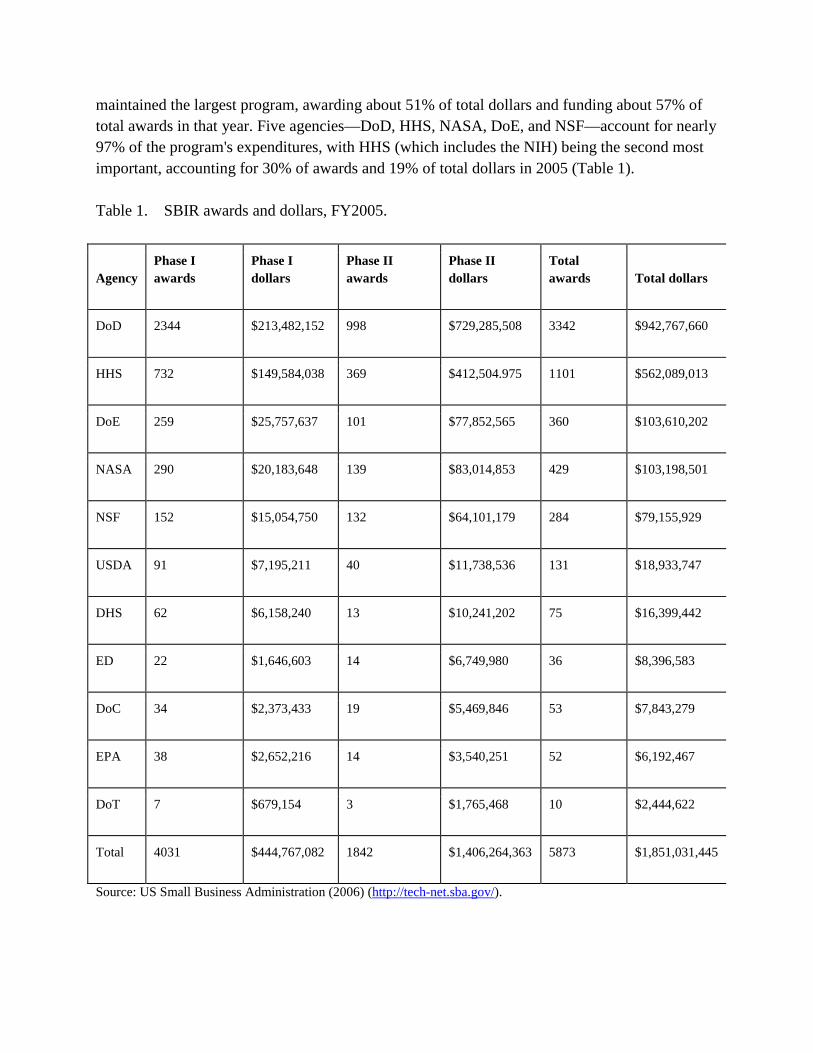
maintained the largest program, awarding about 51% of total dollars and funding about 57% of total awards in that year. Five agencies—DoD, HHS, NASA, DoE, and NSF—account for nearly 97% of the program's expenditures, with HHS (which includes the NIH) being the second most important, accounting for 30% of awards and 19% of total dollars in 2005 (Table 1).
Table 1. SBIR awards and dollars, FY2005.
Agency Phase I awards
Phase I dollars
Phase II awards
Phase II dollars
Total awards Total dollars
DoD 2344 $213,482,152 998 $729,285,508 3342 $942,767,660
HHS 732 $149,584,038 369 $412,504.975 1101 $562,089,013
DoE 259 $25,757,637 101 $77,852,565 360 $103,610,202
NASA 290 $20,183,648 139 $83,014,853 429 $103,198,501
NSF 152 $15,054,750 132 $64,101,179 284 $79,155,929
USDA 91 $7,195,211 40 $11,738,536 131 $18,933,747
DHS 62 $6,158,240 13 $10,241,202 75 $16,399,442
ED 22 $1,646,603 14 $6,749,980 36 $8,396,583
DoC 34 $2,373,433 19 $5,469,846 53 $7,843,279
EPA 38 $2,652,216 14 $3,540,251 52 $6,192,467
DoT 7 $679,154 3 $1,765,468 10 $2,444,622
Total 4031 $444,767,082 1842 $1,406,264,363 5873 $1,851,031,445
Source: US Small Business Administration (2006) (http://tech-net.sba.gov/).
3. The NRC data set and the statistical framework
The NRC data set on NIH SBIR awards was constructed for the broader purpose of conducting a cross-agency evaluation of the SBIR program, as requested by Congress as part of the Small Business Reauthorization Act of 2000.13 This is the data set analyzed herein.14
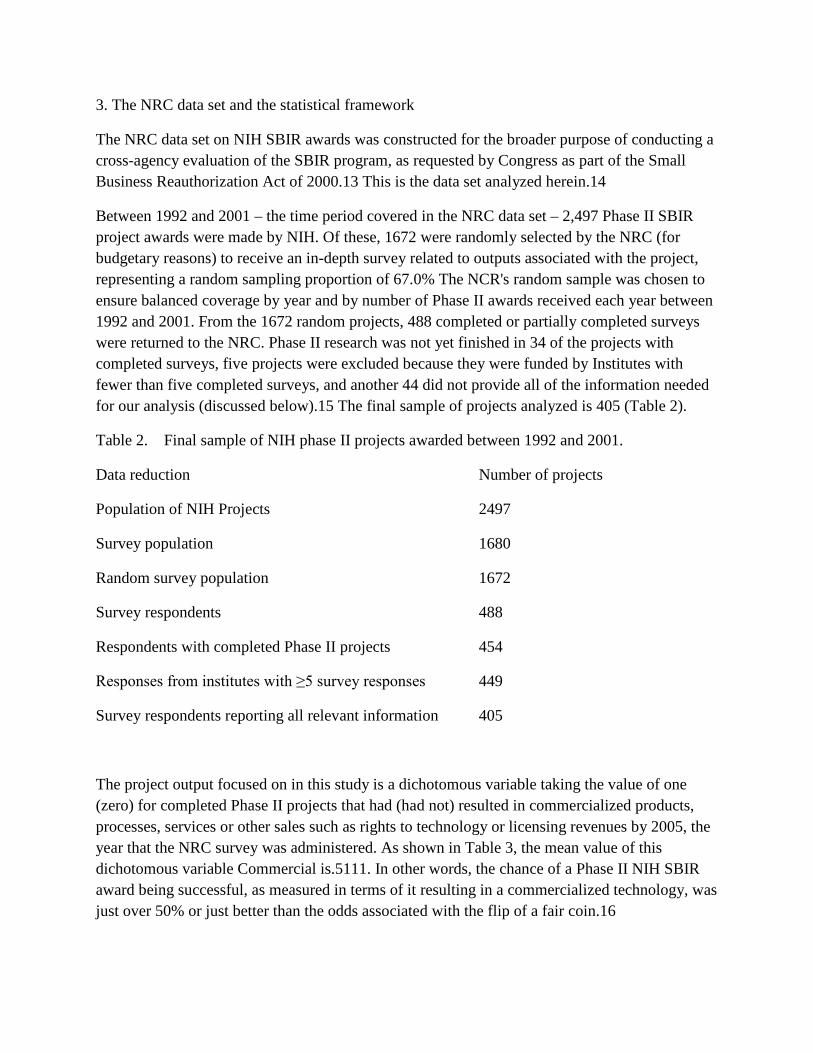
Between 1992 and 2001 – the time period covered in the NRC data set – 2,497 Phase II SBIR project awards were made by NIH. Of these, 1672 were randomly selected by the NRC (for budgetary reasons) to receive an in-depth survey related to outputs associated with the project, representing a random sampling proportion of 67.0% The NCR's random sample was chosen to ensure balanced coverage by year and by number of Phase II awards received each year between 1992 and 2001. From the 1672 random projects, 488 completed or partially completed surveys were returned to the NRC. Phase II research was not yet finished in 34 of the projects with completed surveys, five projects were excluded because they were funded by Institutes with fewer than five completed surveys, and another 44 did not provide all of the information needed for our analysis (discussed below).15 The final sample of projects analyzed is 405 (Table 2).
Table 2. Final sample of NIH phase II projects awarded between 1992 and 2001.
Data reduction Number of projects
Population of NIH Projects 2497
Survey population 1680
Random survey population 1672
Survey respondents 488
Respondents with completed Phase II projects 454
Responses from institutes with ≥5 survey responses 449
Survey respondents reporting all relevant information 405
The project output focused on in this study is a dichotomous variable taking the value of one (zero) for completed Phase II projects that had (had not) resulted in commercialized products, processes, services or other sales such as rights to technology or licensing revenues by 2005, the year that the NRC survey was administered. As shown in Table 3, the mean value of this dichotomous variable Commercial is.5111. In other words, the chance of a Phase II NIH SBIR award being successful, as measured in terms of it resulting in a commercialized technology, was just over 50% or just better than the odds associated with the flip of a fair coin.16
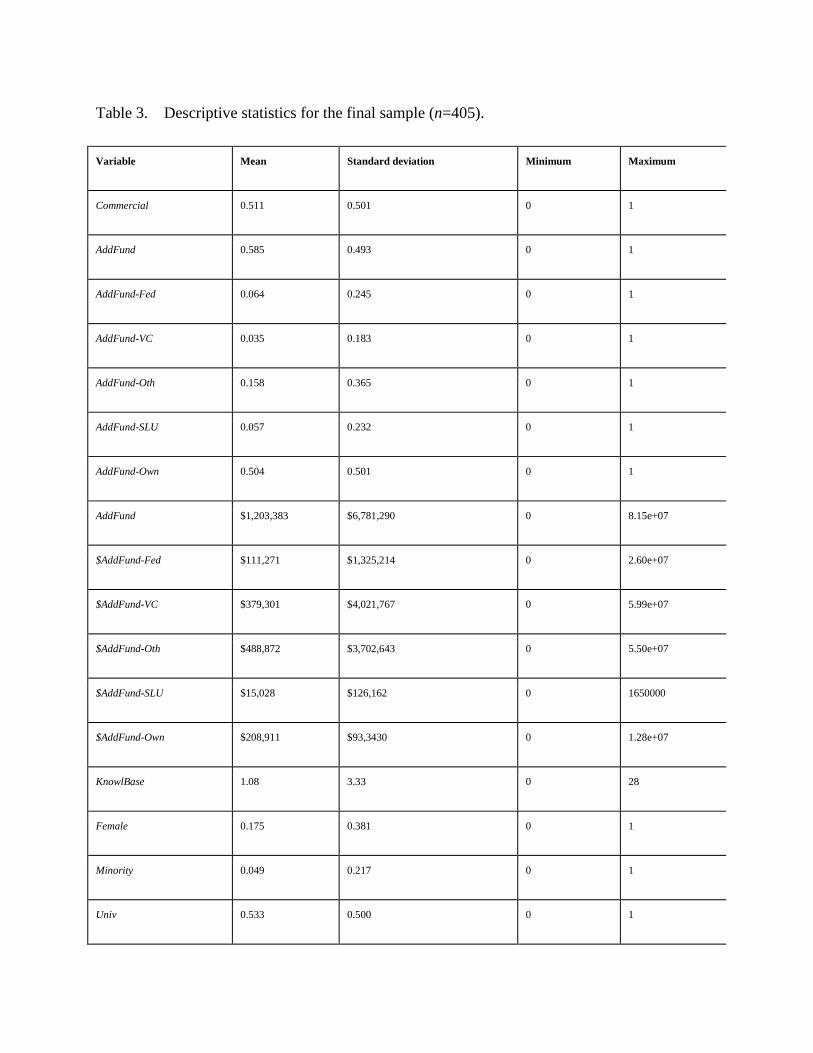
Table 3. Descriptive statistics for the final sample (n=405).
Variable Mean Standard deviation Minimum Maximum
Commercial 0.511 0.501 0 1
AddFund 0.585 0.493 0 1
AddFund-Fed 0.064 0.245 0 1
AddFund-VC 0.035 0.183 0 1
AddFund-Oth 0.158 0.365 0 1
AddFund-SLU 0.057 0.232 0 1
AddFund-Own 0.504 0.501 0 1
AddFund $1,203,383 $6,781,290 0 8.15e+07
$AddFund-Fed $111,271 $1,325,214 0 2.60e+07
$AddFund-VC $379,301 $4,021,767 0 5.99e+07
$AddFund-Oth $488,872 $3,702,643 0 5.50e+07
$AddFund-SLU $15,028 $126,162 0 1650000
$AddFund-Own $208,911 $93,3430 0 1.28e+07
KnowlBase 1.08 3.33 0 28
Female 0.175 0.381 0 1
Minority 0.049 0.217 0 1
Univ 0.533 0.500 0 1
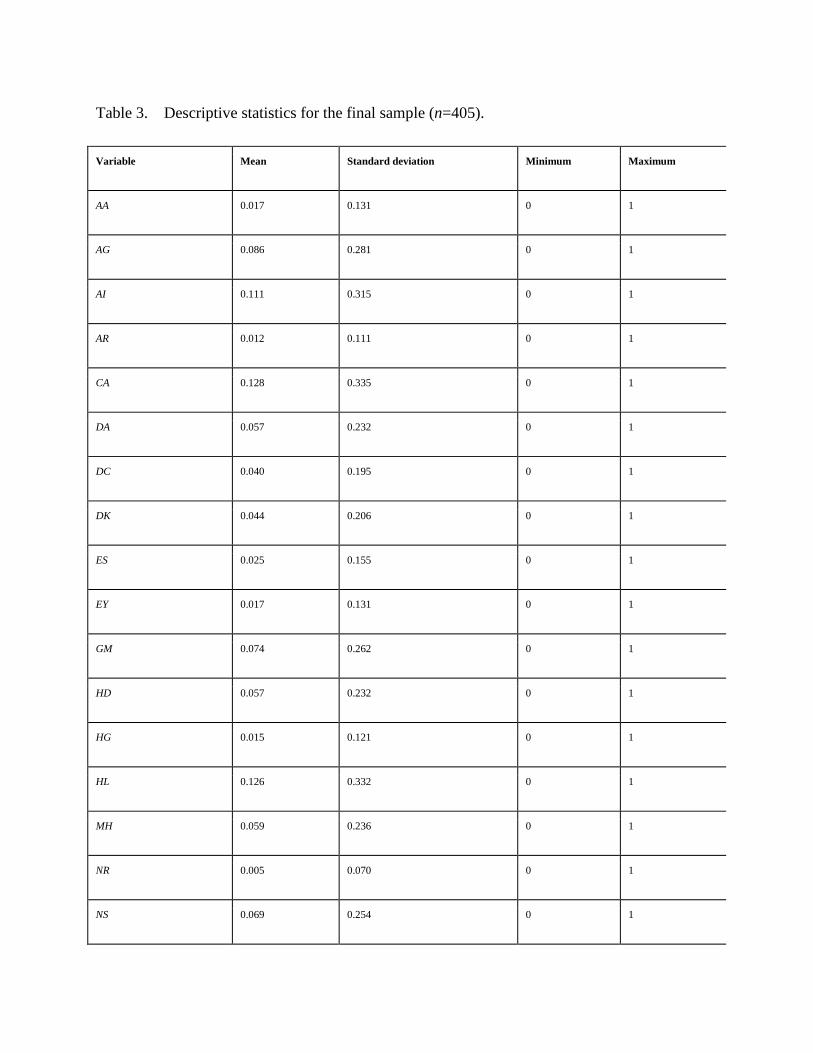
Table 3. Descriptive statistics for the final sample (n=405).
Variable Mean Standard deviation Minimum Maximum
AA 0.017 0.131 0 1
AG 0.086 0.281 0 1
AI 0.111 0.315 0 1
AR 0.012 0.111 0 1
CA 0.128 0.335 0 1
DA 0.057 0.232 0 1
DC 0.040 0.195 0 1
DK 0.044 0.206 0 1
ES 0.025 0.155 0 1
EY 0.017 0.131 0 1
GM 0.074 0.262 0 1
HD 0.057 0.232 0 1
HG 0.015 0.121 0 1
HL 0.126 0.332 0 1
MH 0.059 0.236 0 1
NR 0.005 0.070 0 1
NS 0.069 0.254 0 1
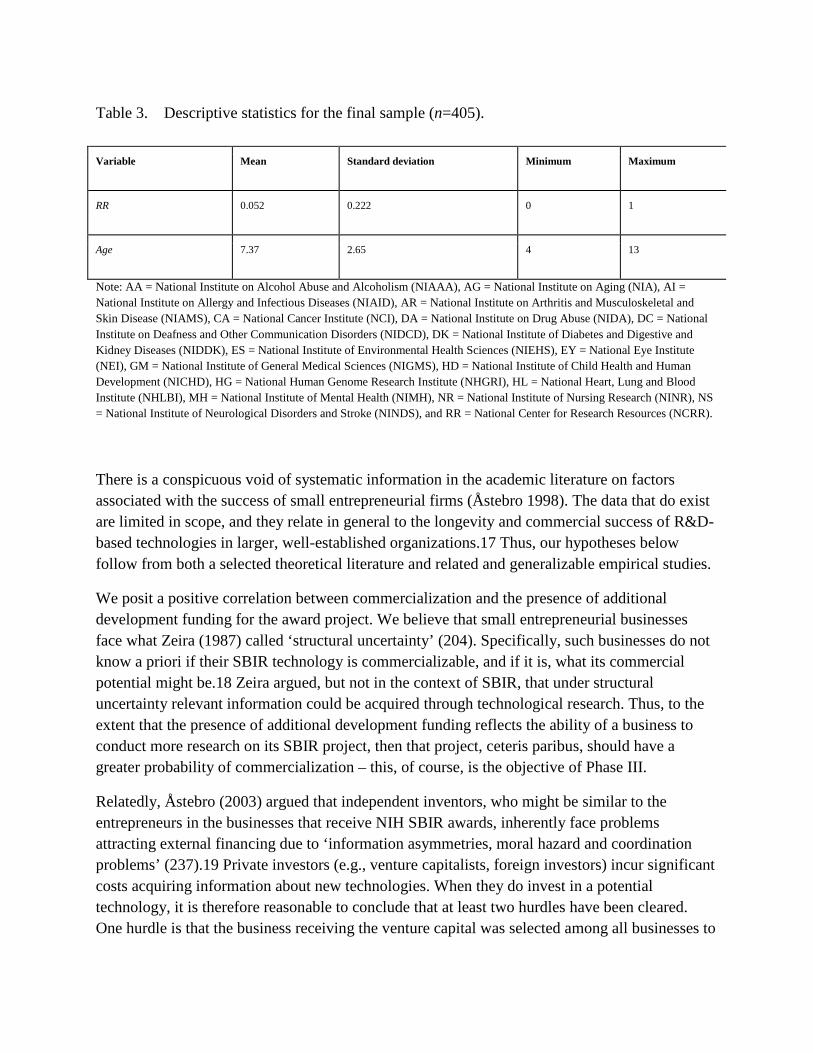
Table 3. Descriptive statistics for the final sample (n=405).
Variable Mean Standard deviation Minimum Maximum
RR 0.052 0.222 0 1
Age 7.37 2.65 4 13
Note: AA = National Institute on Alcohol Abuse and Alcoholism (NIAAA), AG = National Institute on Aging (NIA), AI = National Institute on Allergy and Infectious Diseases (NIAID), AR = National Institute on Arthritis and Musculoskeletal and Skin Disease (NIAMS), CA = National Cancer Institute (NCI), DA = National Institute on Drug Abuse (NIDA), DC = National Institute on Deafness and Other Communication Disorders (NIDCD), DK = National Institute of Diabetes and Digestive and Kidney Diseases (NIDDK), ES = National Institute of Environmental Health Sciences (NIEHS), EY = National Eye Institute (NEI), GM = National Institute of General Medical Sciences (NIGMS), HD = National Institute of Child Health and Human Development (NICHD), HG = National Human Genome Research Institute (NHGRI), HL = National Heart, Lung and Blood Institute (NHLBI), MH = National Institute of Mental Health (NIMH), NR = National Institute of Nursing Research (NINR), NS = National Institute of Neurological Disorders and Stroke (NINDS), and RR = National Center for Research Resources (NCRR).
There is a conspicuous void of systematic information in the academic literature on factors associated with the success of small entrepreneurial firms (Åstebro 1998). The data that do exist are limited in scope, and they relate in general to the longevity and commercial success of R&D-based technologies in larger, well-established organizations.17 Thus, our hypotheses below follow from both a selected theoretical literature and related and generalizable empirical studies.
We posit a positive correlation between commercialization and the presence of additional development funding for the award project. We believe that small entrepreneurial businesses face what Zeira (1987) called ‘structural uncertainty’ (204). Specifically, such businesses do not know a priori if their SBIR technology is commercializable, and if it is, what its commercial potential might be.18 Zeira argued, but not in the context of SBIR, that under structural uncertainty relevant information could be acquired through technological research. Thus, to the extent that the presence of additional development funding reflects the ability of a business to conduct more research on its SBIR project, then that project, ceteris paribus, should have a greater probability of commercialization – this, of course, is the objective of Phase III.
Relatedly, Åstebro (2003) argued that independent inventors, who might be similar to the entrepreneurs in the businesses that receive NIH SBIR awards, inherently face problems attracting external financing due to ‘information asymmetries, moral hazard and coordination problems’ (237).19 Private investors (e.g., venture capitalists, foreign investors) incur significant costs acquiring information about new technologies. When they do invest in a potential technology, it is therefore reasonable to conclude that at least two hurdles have been cleared. One hurdle is that the business receiving the venture capital was selected among all businesses to

be scrutinized, and the other hurdle is that the specific business was then selected among all that were scrutinized. This suggests, ceteris paribus, that the probability of commercialization should be greater for NIH SBIR projects for which there is additional developmental funding from private investors.
Thus, our empirical model is
where, commercialization is measured by the dichotomous variable Commercial, and where the variable AddFund represents additional developmental funding received by the business in support of the technology developed during its Phase II project. AddFund equals 1 if any additional developmental funding was received to support the project at some point in time, and 0 otherwise. Just under 59% of the projects in the sample received additional developmental funding (Table 3).
In some specifications of Equation (1) we disaggregate additional developmental funding into five non-mutually exclusive dichotomous categories. AddFund-Fed equals 1 if the project received additional non-SBIR funds from federal sources, and 0 otherwise; AddFund-VC equals 1 for US venture capital funds, and 0 otherwise; AddFund-Oth equals 1 for other private investment funds (e.g., foreign investment, other private equity, or other domestic private company), and 0 otherwise; AddFund-SLU equals 1 for state or local government or university funds, and 0 otherwise; and AddFund-Own equals 1 for personal and/or internal business funds, and 0 otherwise. Table 3 also shows mean amounts of external funding from each of these sources, denoted with a $ in front of the specified variable (e.g. $AddFund-Fed indicates that $ amount of non-SBIR federal funds received).
Five control variables are subsumed in vector X. The first represents the knowledge base, or absorptive capacity (Cohen and Levinthal 1989), of the business with respect to the technology being researched during the Phase II project. KnowlBase is the number of previous Phase II awards the business has previously received that are related to the project supported by the current Phase II award.20 Nearly 38% of the projects in our sample are related to previous Phase II awards (not shown in Table 3). To the extent there is learning-by-doing, in the sense of Arrow (1962), and/or economies of scope in research from an expanded knowledge base, and to the extent that this enriched knowledge base leads to subsequent research success, we posit a positive correlation between KnowlBase and the probability of commercialization, ceteris paribus.21 The distribution of previous related Phase II SBIR awards is skewed. Nearly 38% of the projects in our sample are related to previous Phase II awards (not shown in Table 3) but only 17% are in businesses with more than one previous related award while 5% are in businesses having previously received five or more Phase II awards.
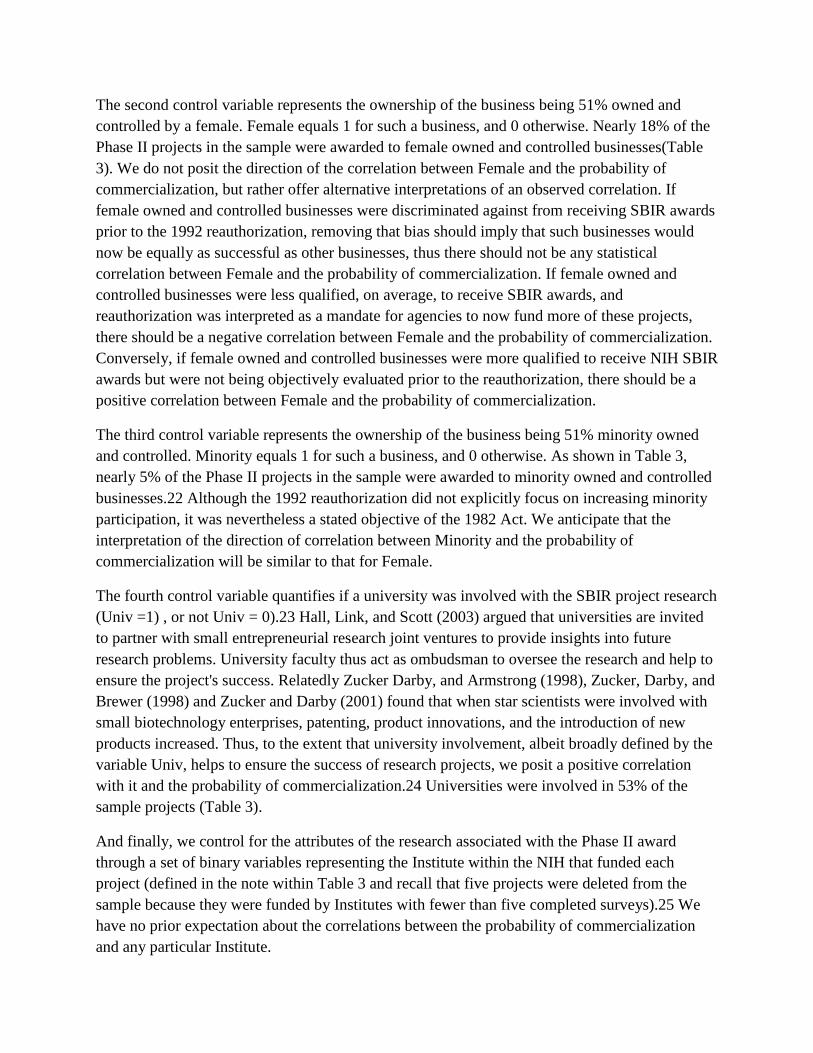
The second control variable represents the ownership of the business being 51% owned and controlled by a female. Female equals 1 for such a business, and 0 otherwise. Nearly 18% of the Phase II projects in the sample were awarded to female owned and controlled businesses(Table 3). We do not posit the direction of the correlation between Female and the probability of commercialization, but rather offer alternative interpretations of an observed correlation. If female owned and controlled businesses were discriminated against from receiving SBIR awards prior to the 1992 reauthorization, removing that bias should imply that such businesses would now be equally as successful as other businesses, thus there should not be any statistical correlation between Female and the probability of commercialization. If female owned and controlled businesses were less qualified, on average, to receive SBIR awards, and reauthorization was interpreted as a mandate for agencies to now fund more of these projects, there should be a negative correlation between Female and the probability of commercialization. Conversely, if female owned and controlled businesses were more qualified to receive NIH SBIR awards but were not being objectively evaluated prior to the reauthorization, there should be a positive correlation between Female and the probability of commercialization.
The third control variable represents the ownership of the business being 51% minority owned and controlled. Minority equals 1 for such a business, and 0 otherwise. As shown in Table 3, nearly 5% of the Phase II projects in the sample were awarded to minority owned and controlled businesses.22 Although the 1992 reauthorization did not explicitly focus on increasing minority participation, it was nevertheless a stated objective of the 1982 Act. We anticipate that the interpretation of the direction of correlation between Minority and the probability of commercialization will be similar to that for Female.
The fourth control variable quantifies if a university was involved with the SBIR project research (Univ =1) , or not Univ = 0).23 Hall, Link, and Scott (2003) argued that universities are invited to partner with small entrepreneurial research joint ventures to provide insights into future research problems. University faculty thus act as ombudsman to oversee the research and help to ensure the project's success. Relatedly Zucker Darby, and Armstrong (1998), Zucker, Darby, and Brewer (1998) and Zucker and Darby (2001) found that when star scientists were involved with small biotechnology enterprises, patenting, product innovations, and the introduction of new products increased. Thus, to the extent that university involvement, albeit broadly defined by the variable Univ, helps to ensure the success of research projects, we posit a positive correlation with it and the probability of commercialization.24 Universities were involved in 53% of the sample projects (Table 3).
And finally, we control for the attributes of the research associated with the Phase II award through a set of binary variables representing the Institute within the NIH that funded each project (defined in the note within Table 3 and recall that five projects were deleted from the sample because they were funded by Institutes with fewer than five completed surveys).25 We have no prior expectation about the correlations between the probability of commercialization and any particular Institute.
A potential empirical concern is selection bias resulting from the relatively low rate (29.2%) at which businesses returned the SBIR project surveys. We examined this possibility by estimating Equation (1), by maximum likelihood, as a bivariate probit model with selection, simultaneously with a model of the probability of response to the project survey specified by:
where Age measures the number of years since the Phase II award, defined as the year of the survey (2005) less the year of the Phase II award (between 1992 and 2001).26 Our key identification strategy in the selection model is that Age is included in the response equation but excluded from the commercialization model. If a strong theoretical foundation for why some businesses would respond to the survey for a particular project is absent, we posit that the older the Phase II award, the less institutional knowledge there is that still exists within the business for such a project and thus the less likely the business would respond to the survey. Thus, there should be a negative correlation between Age and the probability of response. This is confirmed by our econometric estimates.27
Conversely, Age is not included in the probability of commercialization model: Equation (1). One might reason that the probability of commercialization would increase over time as the business was first able to complete its Phase II award project and then seek and receive Phase III funding. However, the data do not support this. In fact, the age distributions of commercialized and non-commercialized projects are virtually identical, and the coefficient on Age is small and insignificant when entered as an additional covariate in Equation (1).28 A reasonable interpretation of these findings is that, if commercialization is going to occur, it will take place close to the date that the Phase II award project is completed.
The bivariate probit estimates provided no indication of selection bias. Specifically, the estimates always fail to reject the null hypothesis that the models of response and commercialization are independent of one another (the correlation of the errors in the two models is not significantly different from zero) and the parameter estimates of interest are always very close to those obtained without accounting for selection.29 For this reason, the results reported below are for single equation models that do not account for selection.
Table 4 provides sample average values of selected variables for commercialized and noncommercialized projects. The last column of the table shows p-values for the null hypothesis that the sample means are the same for the two groups. The most important findings are that commercialized projects are significantly more likely than non-commercialized projects to have received additional developmental funding (74% versus 42%), particularly non-SBIR funds from federal sources (9.2% versus 3.5%) and from personal or internal funds (63% versus 37%). They are also more than twice as likely to receive venture capital funds but, because this occurs infrequently (4.8% versus 2.0%), the difference is not significant at the.10 level. Projects are also significantly (at the.10 level) more likely to be commercialized when awarded to businesses with
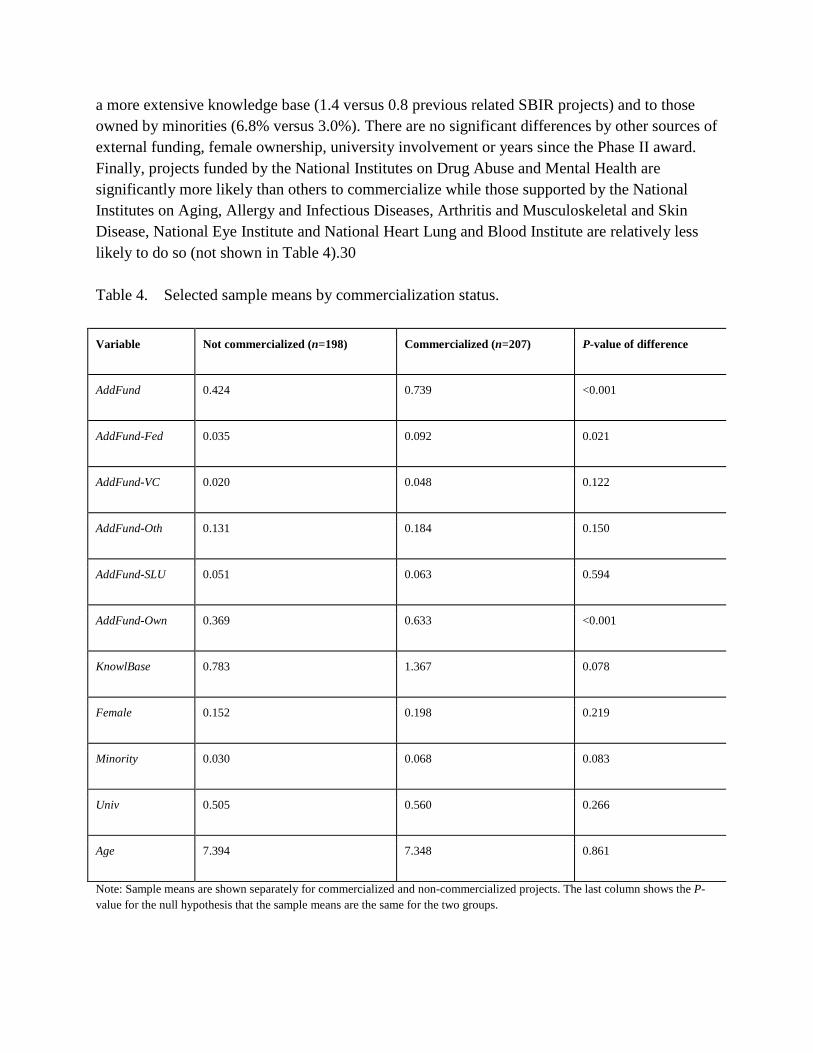
a more extensive knowledge base (1.4 versus 0.8 previous related SBIR projects) and to those owned by minorities (6.8% versus 3.0%). There are no significant differences by other sources of external funding, female ownership, university involvement or years since the Phase II award. Finally, projects funded by the National Institutes on Drug Abuse and Mental Health are significantly more likely than others to commercialize while those supported by the National Institutes on Aging, Allergy and Infectious Diseases, Arthritis and Musculoskeletal and Skin Disease, National Eye Institute and National Heart Lung and Blood Institute are relatively less likely to do so (not shown in Table 4).30
Table 4. Selected sample means by commercialization status.
Variable Not commercialized (n=198) Commercialized (n=207) P-value of difference
AddFund 0.424 0.739 <0.001
AddFund-Fed 0.035 0.092 0.021
AddFund-VC 0.020 0.048 0.122
AddFund-Oth 0.131 0.184 0.150
AddFund-SLU 0.051 0.063 0.594
AddFund-Own 0.369 0.633 <0.001
KnowlBase 0.783 1.367 0.078
Female 0.152 0.198 0.219
Minority 0.030 0.068 0.083
Univ 0.505 0.560 0.266
Age 7.394 7.348 0.861
Note: Sample means are shown separately for commercialized and non-commercialized projects. The last column shows the P-value for the null hypothesis that the sample means are the same for the two groups.
Despite large absolute differences in the magnitudes, none of the variables showing dollar amounts of external funding differ significantly with commercialization status (not shown in Table 4).31 Consider venture capital funding, which provides the most extreme example. The mean commercialized project received almost $689,000 of venture capital compared with less than $56,000 for non-commercialized projects, yet this difference is not significant at the 0.10 level. The reason is that the receipt of this funding is extremely skewed, with a small number of projects receiving virtually all of the funds. For instance, in our sample, just 10 commercialized projects obtained venture capital, with over 90% of all such funds received by just three projects.32 One implication is that it will be quite difficult to model econometrically how the amount of external funding influences commercialization probabilities, and that efforts to do so will need to account for the skewness in the distribution.33
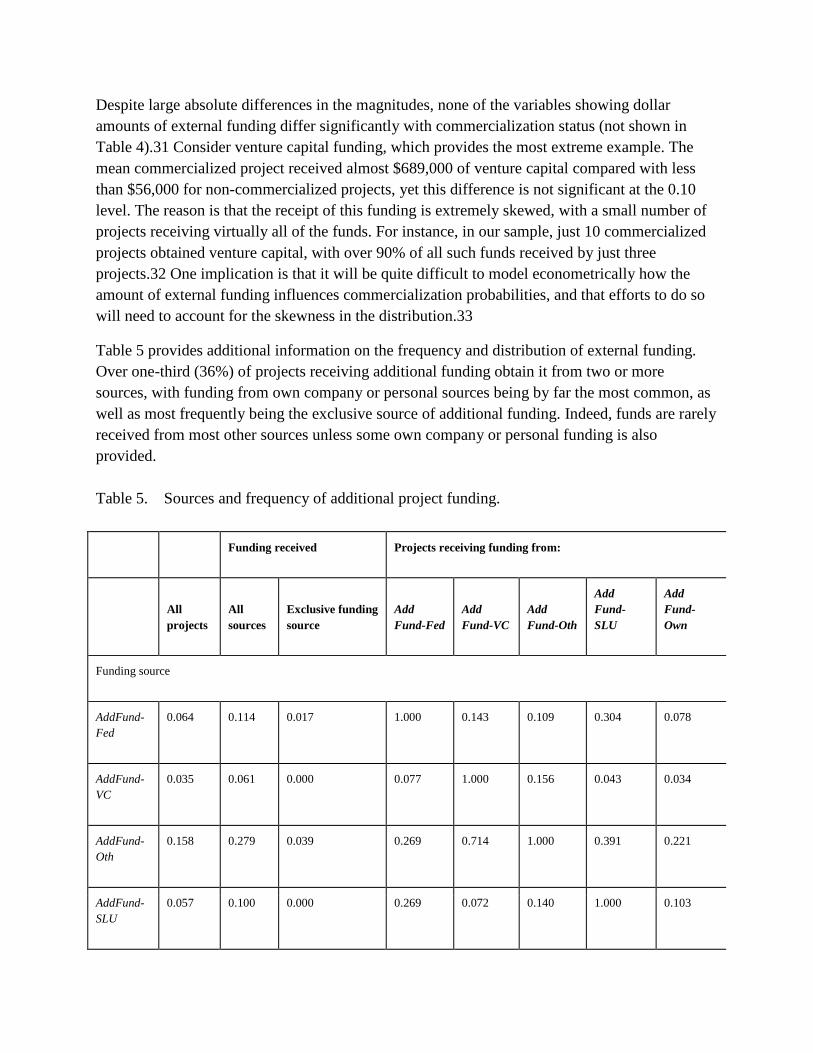
Table 5 provides additional information on the frequency and distribution of external funding. Over one-third (36%) of projects receiving additional funding obtain it from two or more sources, with funding from own company or personal sources being by far the most common, as well as most frequently being the exclusive source of additional funding. Indeed, funds are rarely received from most other sources unless some own company or personal funding is also provided.
Table 5. Sources and frequency of additional project funding.
Funding received Projects receiving funding from:
All projects
All sources
Exclusive funding source
Add Fund-Fed
Add Fund-VC
Add Fund-Oth
Add Fund-SLU
Add Fund-Own
Funding source
AddFund-Fed
0.064 0.114 0.017 1.000 0.143 0.109 0.304 0.078
AddFund-VC
0.035 0.061 0.000 0.077 1.000 0.156 0.043 0.034
AddFund-Oth
0.158 0.279 0.039 0.269 0.714 1.000 0.391 0.221
AddFund-SLU
0.057 0.100 0.000 0.269 0.072 0.140 1.000 0.103
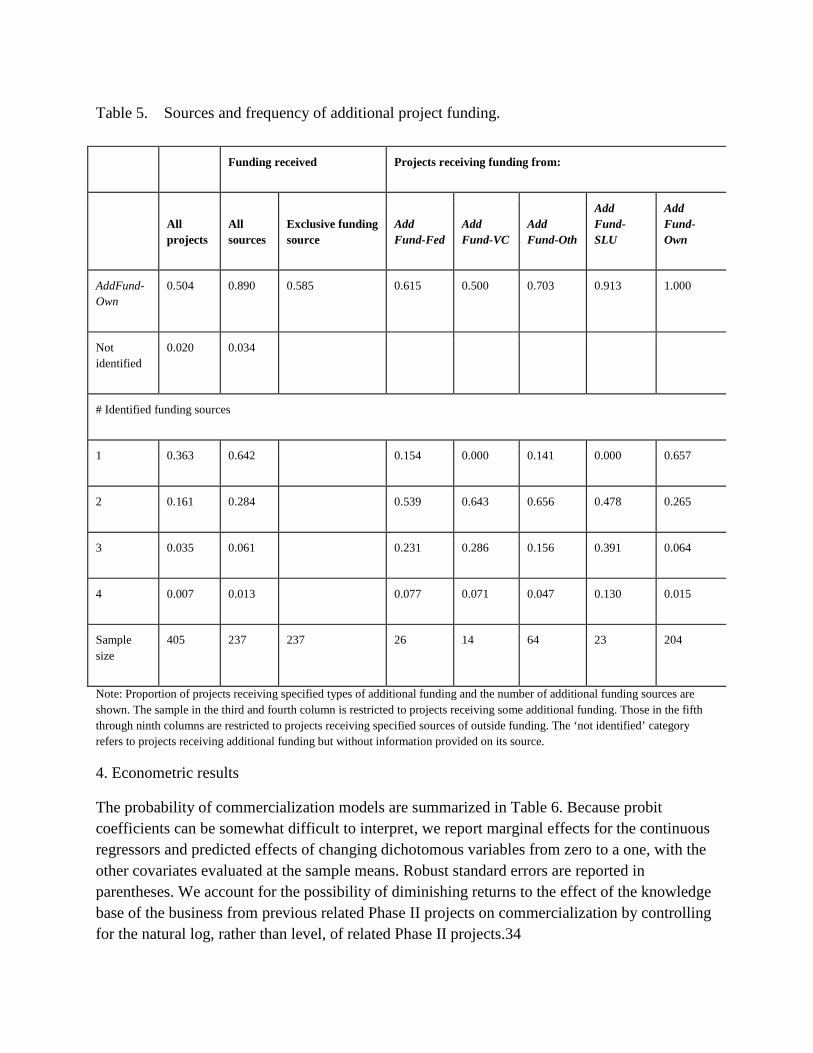
Table 5. Sources and frequency of additional project funding.
Funding received Projects receiving funding from:
All projects
All sources
Exclusive funding source
Add Fund-Fed
Add Fund-VC
Add Fund-Oth
Add Fund-SLU
Add Fund-Own
AddFund-Own
0.504 0.890 0.585 0.615 0.500 0.703 0.913 1.000
Not identified
0.020 0.034
# Identified funding sources
1 0.363 0.642 0.154 0.000 0.141 0.000 0.657
2 0.161 0.284 0.539 0.643 0.656 0.478 0.265
3 0.035 0.061 0.231 0.286 0.156 0.391 0.064
4 0.007 0.013 0.077 0.071 0.047 0.130 0.015
Sample size
405 237 237 26 14 64 23 204
Note: Proportion of projects receiving specified types of additional funding and the number of additional funding sources are shown. The sample in the third and fourth column is restricted to projects receiving some additional funding. Those in the fifth through ninth columns are restricted to projects receiving specified sources of outside funding. The ‘not identified’ category refers to projects receiving additional funding but without information provided on its source.
4. Econometric results
The probability of commercialization models are summarized in Table 6. Because probit coefficients can be somewhat difficult to interpret, we report marginal effects for the continuous regressors and predicted effects of changing dichotomous variables from zero to a one, with the other covariates evaluated at the sample means. Robust standard errors are reported in parentheses. We account for the possibility of diminishing returns to the effect of the knowledge base of the business from previous related Phase II projects on commercialization by controlling for the natural log, rather than level, of related Phase II projects.34
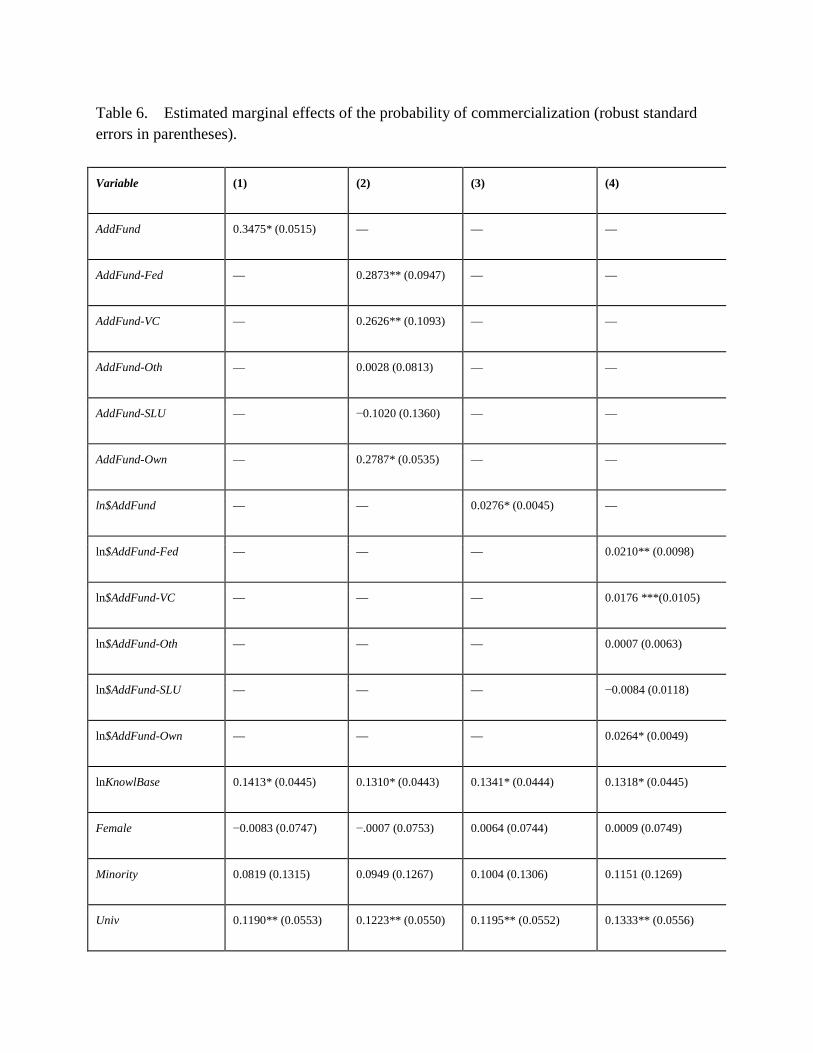
Table 6. Estimated marginal effects of the probability of commercialization (robust standard errors in parentheses).
Variable (1) (2) (3) (4)
AddFund 0.3475* (0.0515) — — —
AddFund-Fed — 0.2873** (0.0947) — —
AddFund-VC — 0.2626** (0.1093) — —
AddFund-Oth — 0.0028 (0.0813) — —
AddFund-SLU — −0.1020 (0.1360) — —
AddFund-Own — 0.2787* (0.0535) — —
ln$AddFund — — 0.0276* (0.0045) —
ln$AddFund-Fed — — — 0.0210** (0.0098)
ln$AddFund-VC — — — 0.0176 ***(0.0105)
ln$AddFund-Oth — — — 0.0007 (0.0063)
ln$AddFund-SLU — — — −0.0084 (0.0118)
ln$AddFund-Own — — — 0.0264* (0.0049)
lnKnowlBase 0.1413* (0.0445) 0.1310* (0.0443) 0.1341* (0.0444) 0.1318* (0.0445)
Female −0.0083 (0.0747) −.0007 (0.0753) 0.0064 (0.0744) 0.0009 (0.0749)
Minority 0.0819 (0.1315) 0.0949 (0.1267) 0.1004 (0.1306) 0.1151 (0.1269)
Univ 0.1190** (0.0553) 0.1223** (0.0550) 0.1195** (0.0552) 0.1333** (0.0556)
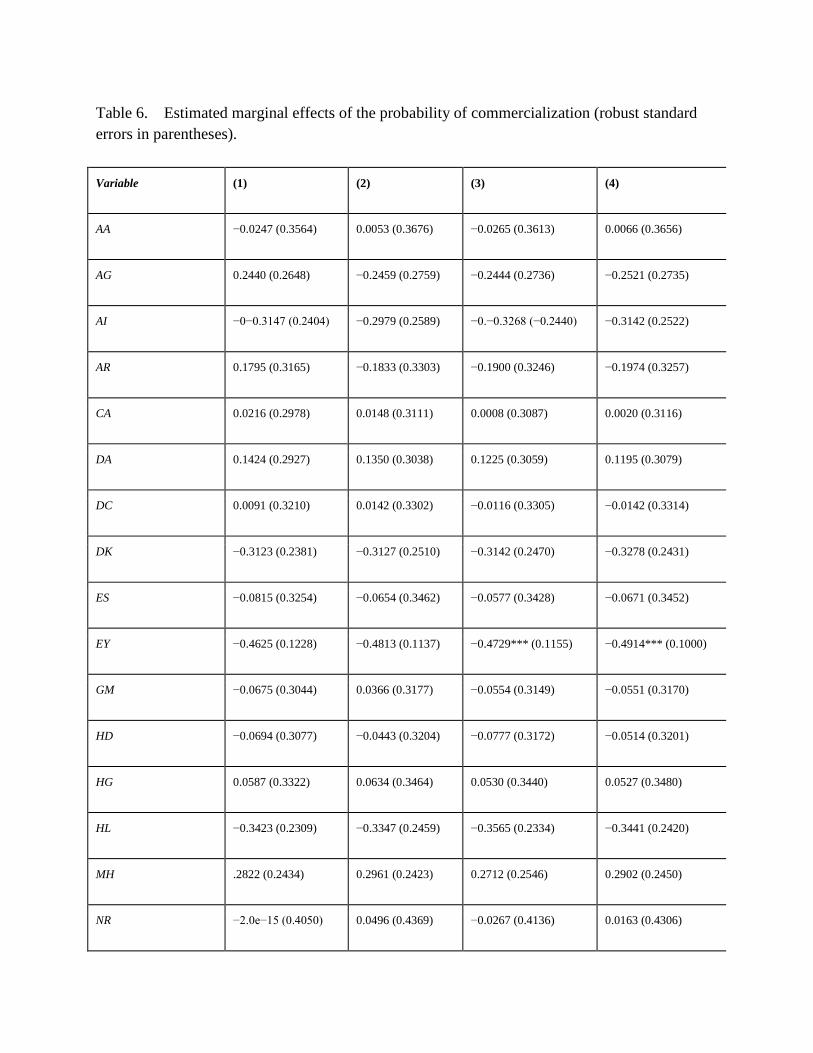
Table 6. Estimated marginal effects of the probability of commercialization (robust standard errors in parentheses).
Variable (1) (2) (3) (4)
AA −0.0247 (0.3564) 0.0053 (0.3676) −0.0265 (0.3613) 0.0066 (0.3656)
AG 0.2440 (0.2648) −0.2459 (0.2759) −0.2444 (0.2736) −0.2521 (0.2735)
AI −0−0.3147 (0.2404) −0.2979 (0.2589) −0.−0.3268 (−0.2440) −0.3142 (0.2522)
AR 0.1795 (0.3165) −0.1833 (0.3303) −0.1900 (0.3246) −0.1974 (0.3257)
CA 0.0216 (0.2978) 0.0148 (0.3111) 0.0008 (0.3087) 0.0020 (0.3116)
DA 0.1424 (0.2927) 0.1350 (0.3038) 0.1225 (0.3059) 0.1195 (0.3079)
DC 0.0091 (0.3210) 0.0142 (0.3302) −0.0116 (0.3305) −0.0142 (0.3314)
DK −0.3123 (0.2381) −0.3127 (0.2510) −0.3142 (0.2470) −0.3278 (0.2431)
ES −0.0815 (0.3254) −0.0654 (0.3462) −0.0577 (0.3428) −0.0671 (0.3452)
EY −0.4625 (0.1228) −0.4813 (0.1137) −0.4729*** (0.1155) −0.4914*** (0.1000)
GM −0.0675 (0.3044) 0.0366 (0.3177) −0.0554 (0.3149) −0.0551 (0.3170)
HD −0.0694 (0.3077) −0.0443 (0.3204) −0.0777 (0.3172) −0.0514 (0.3201)
HG 0.0587 (0.3322) 0.0634 (0.3464) 0.0530 (0.3440) 0.0527 (0.3480)
HL −0.3423 (0.2309) −0.3347 (0.2459) −0.3565 (0.2334) −0.3441 (0.2420)
MH .2822 (0.2434) 0.2961 (0.2423) 0.2712 (0.2546) 0.2902 (0.2450)
NR −2.0e−15 (0.4050) 0.0496 (0.4369) −0.0267 (0.4136) 0.0163 (0.4306)
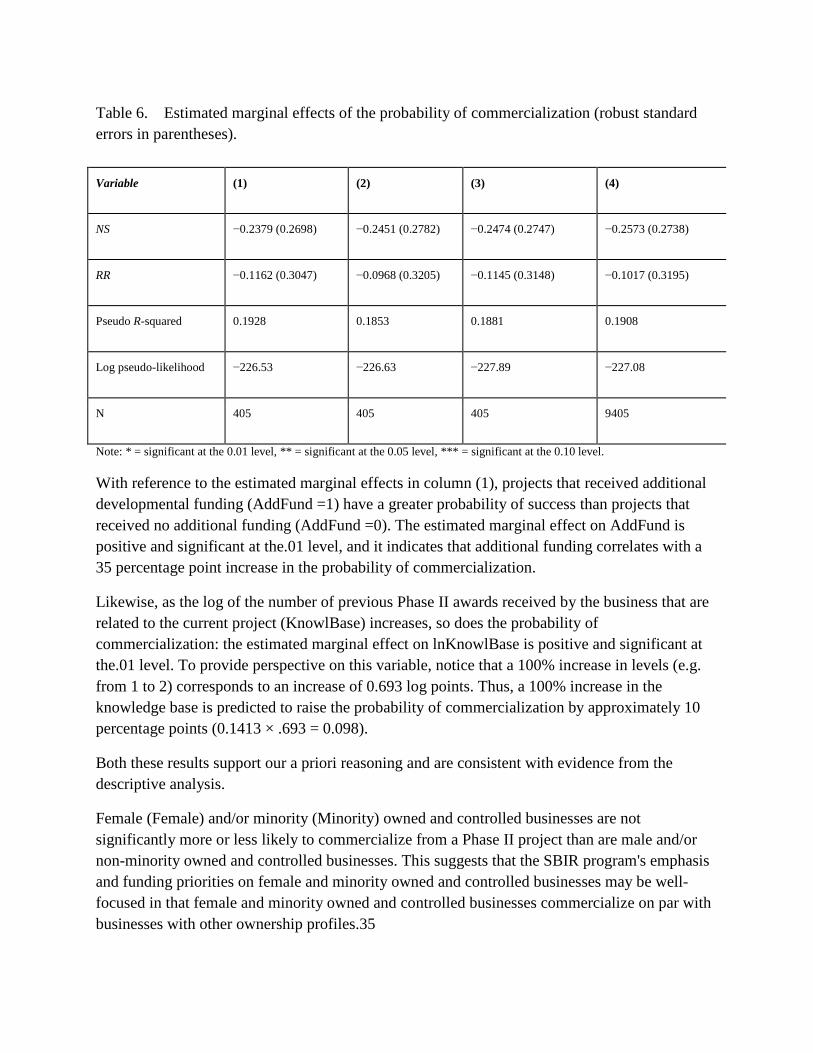
Table 6. Estimated marginal effects of the probability of commercialization (robust standard errors in parentheses).
Variable (1) (2) (3) (4)
NS −0.2379 (0.2698) −0.2451 (0.2782) −0.2474 (0.2747) −0.2573 (0.2738)
RR −0.1162 (0.3047) −0.0968 (0.3205) −0.1145 (0.3148) −0.1017 (0.3195)
Pseudo R-squared 0.1928 0.1853 0.1881 0.1908
Log pseudo-likelihood −226.53 −226.63 −227.89 −227.08
N 405 405 405 9405
Note: * = significant at the 0.01 level, ** = significant at the 0.05 level, *** = significant at the 0.10 level.
With reference to the estimated marginal effects in column (1), projects that received additional developmental funding (AddFund =1) have a greater probability of success than projects that received no additional funding (AddFund =0). The estimated marginal effect on AddFund is positive and significant at the.01 level, and it indicates that additional funding correlates with a 35 percentage point increase in the probability of commercialization.
Likewise, as the log of the number of previous Phase II awards received by the business that are related to the current project (KnowlBase) increases, so does the probability of commercialization: the estimated marginal effect on lnKnowlBase is positive and significant at the.01 level. To provide perspective on this variable, notice that a 100% increase in levels (e.g. from 1 to 2) corresponds to an increase of 0.693 log points. Thus, a 100% increase in the knowledge base is predicted to raise the probability of commercialization by approximately 10 percentage points (0.1413 × .693 = 0.098).
Both these results support our a priori reasoning and are consistent with evidence from the descriptive analysis.
Female (Female) and/or minority (Minority) owned and controlled businesses are not significantly more or less likely to commercialize from a Phase II project than are male and/or non-minority owned and controlled businesses. This suggests that the SBIR program's emphasis and funding priorities on female and minority owned and controlled businesses may be well-focused in that female and minority owned and controlled businesses commercialize on par with businesses with other ownership profiles.35
Conversely, university involvement (Univ =1) is positively related to the probability of commercialization; the estimated marginal effect is significant at the.05 level. University involvement increases the predicted probability of commercialization by 12 percentage points.
Finally, as a group the Institute effects are statistically significant at the.01 level in this and all models estimated, with the highest rates of commercialization for projects funded by the National Institute of Mental Health (MH) and the lowest for those funded by the National Eye Institute (EY).36
AddFunds is a binary variable quantifying additional developmental funding, from any source. The model underlying the results in column (2) disaggregates additional developmental funding into the five specific (although non-mutually exclusive) dichotomous categories. The presence of additional non-SBIR federal funds, US venture capital funds, and own funds are all positively related to the probability of commercialization. The estimated marginal effect of AddFund-Fed is positive and significant at the.05 level and indicates that the receipt of non-SBIR federal funds is correlated with a 29 percentage point increase in the probability of commercialization. The effect of AddFund-Own is positive and significant at the.01 level and is associated with a 28 percentage point rise in the probability of commercialization. Venture capital support, AddFund-VC, has a positive effect as well on the probability of commercialization, at the.05 level, and predicts a 26 percentage point higher commercialization probability.
The models underlying columns (3) and (4) of Table 6 replace the disaggregated binary variables that denoted additional developmental funding, in columns (1) and (2), with the natural log of the dollar amount from each source. Natural logs rather than levels are used because preliminary estimates suggested diminishing returns to investment amounts.37 The significance pattern for these estimates is similar to that of corresponding specifications in columns (1) and (2) (that used dichotomous variables for corresponding categories of additional developmental funding), as are the conclusions to be drawn from the results.38 For instance, a 100% increase in the total amount of additional funding is predicted to increase commercialization probabilities by 1.9 percentage points. One difference, however, is these specifications suggest that given amounts of additional developmental funding from non-SBIR federal funds and, particularly, own and/or internal business sources, may have a stronger positive effect on commercialization probabilities than similar amounts of venture capital support, and that the greatest effect is associated with own and/or internal business funding (where there would logically be the greatest information about the potential success of the project).
A summary of the marginal effects obtained from the probit models is useful to motivate a policy discussion in the last section of the paper. The probit estimates in column (4) of Table 6 imply that a 100% increase in developmental non-SBIR federal funding raises the predicted probability of commercialization by 1.5 percentage points; this probability similarly increases by 1.2 percentage points with corresponding growth in venture capital funding, and by 1.8 percentage points with additional developmental funding from the owners or from the business itself.39 The
probability of commercialization increases when the business’ knowledge base has been built through previous related Phase II research; it increases by 9.1 percentage points per 100% increase in the number of previous related Phase II awards. Female and minority owned and controlled businesses are equally as likely to commercialize as are other businesses. And, university involvement in Phase II award projects increase the probability of commercialization by 13 percentage points.
As previously shown (in Table 5), many projects receiving additional funding obtain it from multiple sources, with frequent arrangements being some combination of personal or own company contributions combined with one of the four sources of funds. We explicitly allowed for this possibility in specifications (not reported) that interacted AddFund-Own with AddFund-Fed, AddFund-VC, AddFund-Oth, and AddFund-SLU. Somewhat surprisingly, the first of these interactions was negative and significant at the.10 level, suggesting non-SBIR federal funding is strongly associated with commercialization probabilities when it is not accompanied by own company or personal contributions. This may reflect endogeneity in the federal funding process, an issue addressed in greater detail in the following section. None of the other three interaction coefficients approach statistical significance.
5. Endogeneity issues
Jump to section
1. Introduction
2. Overview of the SBIR program
3. The NRC data set and the statistical framework
4. Econometric results
5. Endogeneity issues
6. Discussion
The preceding econometric models treat the receipt of additional funding as exogenous. If this is correct, then the results indicate causal effects of the various types of funding (and of the other explanatory variables) on commercialization probabilities. However, this is a strong assumption. For instance, potential funders may be more likely to provide support for projects with relatively favorable prospects for commercialization, and some of these might also be more likely to have commercialized even in the absence of additional funds. Both possibilities suggest that our estimates may overstate the extent to which additional funding will cause increases in commercialization for the average project. The relevance of potential endogeneity for assessing the SBIR program depends on the particular goals of policy-makers, and it is described in greater detail in the final section of the paper.
We attempted to use instrumental variables techniques to examine potential endogeneity in the provision of non-SBIR federal funds, as well as from venture capital or other private sources. Not surprisingly, the principle difficulty was in obtaining good instruments – variables that strongly predict the receipt of additional funding without independently affecting commercialization probabilities. We instrumented for non-SBIR federal funding using the average amount of extramural award dollars provided, over the 1998–2006 period, by the NIH institute associated with the Phase II SBIR award.40 We then divided this average level of extramural funding by the number of Phase II SBIR awards in our data set and from the specified institute, so as to calculate a measure of funding availability per award.41 We also instrumented for funds from venture capital or other private sources using data from the PricewaterhouseCoopers/National Venture Capital Association MoneyTree Report (www.pwcmoneytree.com/MTPublic/ns/index.jsp) on average venture capital activity for 19 regions of the United States over the 1996-2006 period. The procedure used was to match the state in which the firm receiving the award was located to the relevant region and then to assign the average funding level and number of deals for the region (normalized by the number of associated surveyed SBIR projects) to that project.42
Our efforts to use IV estimates to explicitly account for endogeneity were largely unsuccessful. The venture capital activity variables had essentially no predictive power in the first stage.43 Conversely, the institute-specific level of NIH extramural award activity funding did strongly predict the first-stage probability of receiving non-SBIR federal funding. However, the IV point estimates of the effect of the latter on commercialization probabilities were almost identical to those obtained without instrumenting, while the associated standard errors increased dramatically. Therefore, while we did not uncover any evidence that our estimates were being seriously biased by endogeneity, our overall conclusion is that the issue remains potentially important and that future research will need to use creative approaches to examine its role.
6. Discussion
Jump to section
1. Introduction
2. Overview of the SBIR program
3. The NRC data set and the statistical framework
4. Econometric results
5. Endogeneity issues
6. Discussion
The NRC data set is rich in a number of dimensions, not the least of which is that the information is at the level of a project rather than at the business level. However, before discussing possible policy implications of our findings, we offer several words of caution related to the data and the analysis performed. First, while the NRC data set does contain limited self-reported information on commercialization in dollar terms, the number of projects for which those data are available is small, with the result that our analysis is restricted to a dichotomous commercialization variable. From an assessment perspective, however, this constraint may be less detrimental than it at first appears since the stated objective of the SBIR program is commercialization per se.
Second, we do not have information on when a project received additional developmental funds. Some projects may have received these monies during the Phase II research and others only after they attempt to or do commercialize an initial product/process/service. Or, additional developmental funding may have come in stages such as first obtaining non-SBIR federal funds and then obtaining venture capital funds. To offer some suggestive information on this question, we examined how the frequency of receipt of outside funds varied with the number of years since the Phase II award was granted. Our hypothesis is that if most outside funds were received after completion of the project as the research advanced towards commercialization, we would observe greater probabilities and larger amounts of additional funding for ‘older’ projects. There was no evidence of this, leading us to conclude that these funds are likely to be frequently provided during the project period and justifying our emphasis on the role of additional funding.44 That said, were we able to control for the timing of the additional developmental funds we might have been able to determine more precisely the relative importance of each source. For example, we could not investigate whether there was a ‘halo effect’ from additional non-SBIR federal support that subsequently increased the likelihood of the business obtaining venture capital funds (Toole and Turvey 2009).45
Third, our analysis does not control for the nature of the underlying technology being researched and/or commercialized. While we did include Institute effects in our model, as a proxy for the character of the research, more detailed technology controls would be useful. One promising avenue for future research would be to make use of information from the original project proposal on the types of technologies focused upon and the expected method of commercialization, although it may be difficult to develop a satisfactory rubric for classifying technology alternatives.
Caveats aside, several dimensions of our findings may have policy management relevance, and we offer piecemeal observations related to such issues, and then collectively we offer a numerical illustration of a specific recommendation. First, venture capital funding is positively related to the probability of commercialization. This is precisely the objective of Phase III. However, additional funding from the owner and/or business is much more common and has an equal or greater relative estimated impact on commercialization. Perhaps these results could be replicated in reality if Phase II awards were conditional on a commitment of matching internal funds.46
Interestingly, this policy implication may be valid even if additional development funding is endogenously determined, as has been discussed and seems likely. Consider that there are at least two reasons why additional funding may be associated with higher rates of commercialization. First, the extra funds may permit activities that lead to successful commercialization and that would otherwise not take place. In this case, the non-SBIR money causally affects commercialization rates. Alternatively, the funds could be provided because the project has a high potential for commercialization. For instance, businesses are likely to be more willing to put their own resources into projects they view as having a high potential for commercialization. Notice, however, that conditioning Phase II awards on matching funds is likely to be desirable even in this second situation, since the government is essentially using the willingness to provide outside funds as a signal of the project's potential.
Second, the NIH, and possibly other funding agencies, might consider incentives for Phase II award recipients to include university faculty and resources in research projects. A possible mechanism for doing so might be to award merit evaluation points during the Phase II award reviews for proposed university involvement, or to increase the funding amount for the same.47
Of course, an obvious policy issue is whether increasing the dollar amount of Phase II awards will increase the probability of commercialization. Our theoretical arguments for the specification of Equation (1) did not include the size of the award and, more to the point, the NIH regularly exceeds the $750,000 guideline so a policy recommendation to increase the upper bound on Phase II awards would be moot.48 Empirically, as a descriptive observation, the award amount is not correlated with the probability of commercialization.
Finally, we should emphasize that designing the SBIR award criteria so as to direct funds towards projects with the highest probabilities of commercialization does not necessarily increase the overall rate at which innovations are commercialized, since it is possible that sufficient private-sector support would have been obtained to commercialize these projects, even in the absence of the SBIR funds—in this case, the SBIR program is ‘crowding out’ private funds.49 Although we cannot definitively address this question, the available evidence suggests that the SBIR support is crucial for many of these projects. For instance, the NRC data set includes a question asking whether companies would have undertaken the projects in the absence of the SBIR award. The answer to this after-the-fact question was ‘definitely yes’ or ‘probably yes’ for less than 11% of the commercialized projects and ‘probably not’ or ‘definitely not’ for 75%.50 Thus, SBIR support appears to be critical for most of the projects that ultimately commercialize.
To combine aspects of the piecemeal observations above into a single policy simulation, consider the hypothetical numerical illustration in Table 7, which is based, mathematically, on the estimated probit equation underlying the results in column (4) of Table 6. As a base point of reference, consider a hypothetical Phase II project in a business that has no knowledge base, $0 own and/or internal business additional developmental funding and no university involvement
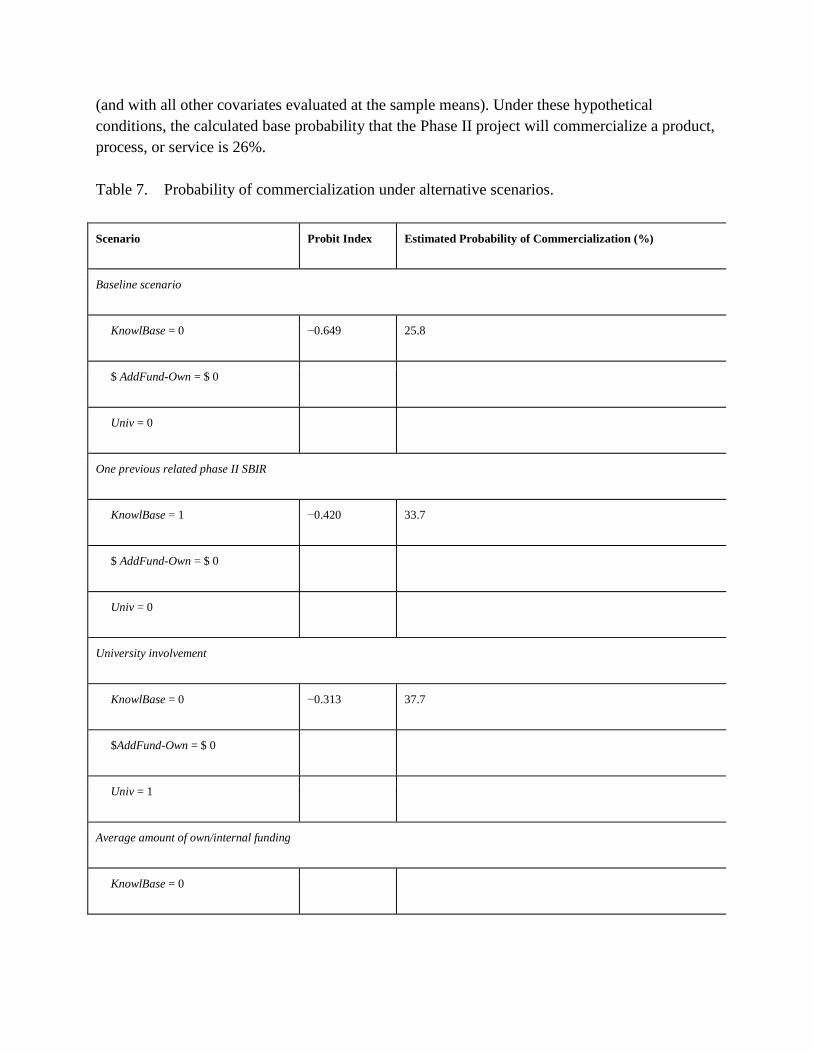
(and with all other covariates evaluated at the sample means). Under these hypothetical conditions, the calculated base probability that the Phase II project will commercialize a product, process, or service is 26%.
Table 7. Probability of commercialization under alternative scenarios.
Scenario Probit Index Estimated Probability of Commercialization (%)
Baseline scenario
KnowlBase = 0 −0.649 25.8
$ AddFund-Own = $ 0
Univ = 0
One previous related phase II SBIR
KnowlBase = 1 −0.420 33.7
$ AddFund-Own = $ 0
Univ = 0
University involvement
KnowlBase = 0 −0.313 37.7
$AddFund-Own = $ 0
Univ = 1
Average amount of own/internal funding
KnowlBase = 0
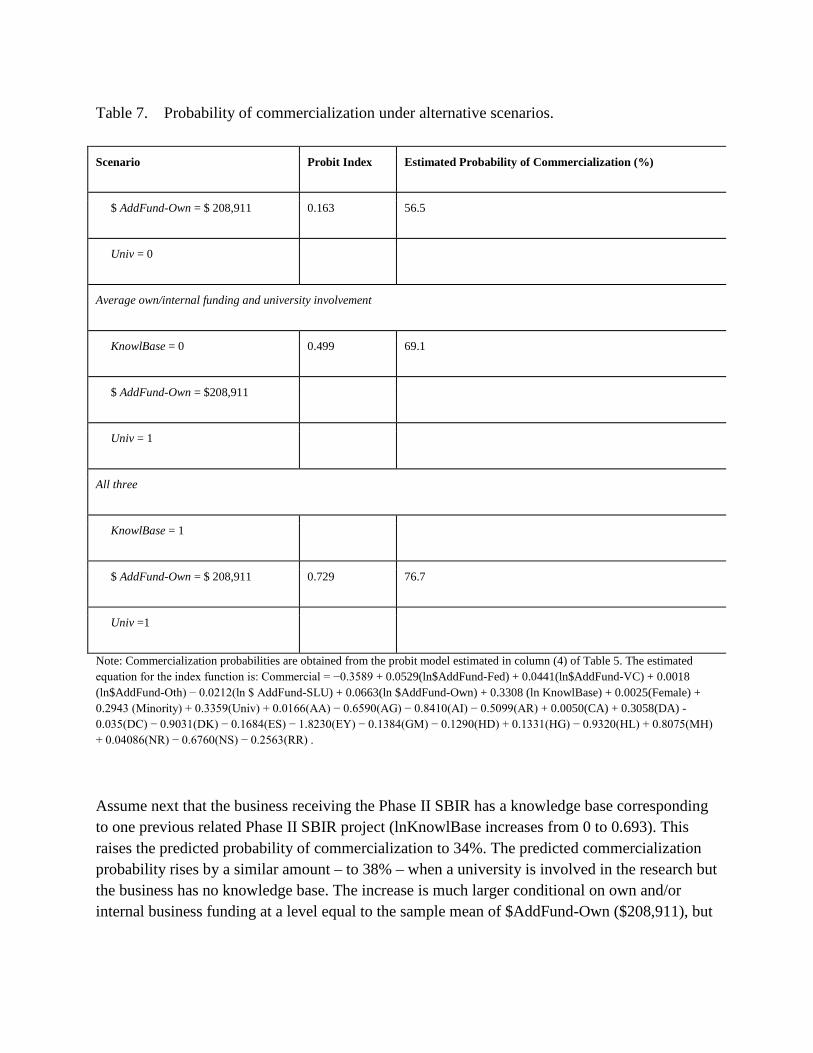
Table 7. Probability of commercialization under alternative scenarios.
Scenario Probit Index Estimated Probability of Commercialization (%)
$ AddFund-Own = $ 208,911 0.163 56.5
Univ = 0
Average own/internal funding and university involvement
KnowlBase = 0 0.499 69.1
$ AddFund-Own = $208,911
Univ = 1
All three
KnowlBase = 1
$ AddFund-Own = $ 208,911 0.729 76.7
Univ =1
Note: Commercialization probabilities are obtained from the probit model estimated in column (4) of Table 5. The estimated equation for the index function is: Commercial = −0.3589 + 0.0529(ln$AddFund-Fed) + 0.0441(ln$AddFund-VC) + 0.0018 (ln$AddFund-Oth) − 0.0212(ln $ AddFund-SLU) + 0.0663(ln $AddFund-Own) + 0.3308 (ln KnowlBase) + 0.0025(Female) + 0.2943 (Minority) + 0.3359(Univ) + 0.0166(AA) − 0.6590(AG) − 0.8410(AI) − 0.5099(AR) + 0.0050(CA) + 0.3058(DA) - 0.035(DC) − 0.9031(DK) − 0.1684(ES) − 1.8230(EY) − 0.1384(GM) − 0.1290(HD) + 0.1331(HG) − 0.9320(HL) + 0.8075(MH) + 0.04086(NR) − 0.6760(NS) − 0.2563(RR) .
Assume next that the business receiving the Phase II SBIR has a knowledge base corresponding to one previous related Phase II SBIR project (lnKnowlBase increases from 0 to 0.693). This raises the predicted probability of commercialization to 34%. The predicted commercialization probability rises by a similar amount – to 38% – when a university is involved in the research but the business has no knowledge base. The increase is much larger conditional on own and/or internal business funding at a level equal to the sample mean of $AddFund-Own ($208,911), but
with no previous knowledge base or university involvement, in which case the expected commercialization rate is 57%.
Thus, subject to the previously mentioned caveats, our results suggest that if the NIH is interested in managing its SBIR program so as to increase the probability of commercialization, it might wish to consider conditioning receipt of a Phase II award on university involvement and own and/or internal business funding. In this case, the commercialization probability is predicted to be 69%.51 Furthermore, for illustration purposes, and we are not suggesting this as a policy recommendation, Phase II awards were also conditioned on the receipt of at least one previous related award, so the probability of commercialization would increase even more, to 77%.52
Additional research is certainly warranted to better understand the nature of commercialization from SBIR awards and to assess more completely that program objective. Hopefully, future research will overcome some of the data limitations of this study. Alternative research methodologies – such as a matched pairs analysis of small entrepreneurial businesses with and without SBIR support – might be useful for investigating both factors associated with the propensity to commercialize as well as the private and social implications from such commercialization. We also need to understand how the nature of the technology being researched affects commercialization probabilities, when, in the development process, additional funds are most needed to promote success of the projects, and whether the development process and the role of SBIR support differ for commercialized projects ultimately generating large versus small amounts of revenue.
Acknowledgements
We are pleased to acknowledge the helpful comments and suggestions of our colleagues David Ribar and Ken Snowden, as well as the able research assistance of Rebecca Klimowicz. We would also like to thank four anonymous referees for their comments and suggestions on an earlier version of this paper.
Notes
Real R&D performed in US industries had been decreasing since 1970, and not until 1977 did it return to its 1969 pre-decline level. A number of culprits have been identified as related to the US productivity slowdown. For a review of this literature, see Link and Siegel (2003).
Public support for enhancing innovation in small firms can be traced to the 1960s (Turner and Brown 1999).
Previous studies of NIH, or of an institute within NIH, include US Department of Health and Human Services (HHS) (2003); Audretsch, Aldridge, and Oettl (2006); and Toole and Czarnitzki
(2007). None of these studies investigated within the context of an econometric model the determinants of the incidence of commercialization from SBIR-funded projects.
This section draws on Link and Scott (2000); Audretsch, Link, and Scott (2002); National Research Council (2004); and Wessner (2000, 2007). For a taxonomy of public/private partnerships, see Link (1999, 2006).
Since SBIR is a set aside program, it redirects existing R&D funds for competitive awards to small businesses rather than appropriating new monies for R&D. The 1982 Act allowed for this percentage to increase over time.
As stated in the 1982 Act, to be eligible for an SBIR award, the small business must be (i) independently owned and operated; other than the dominant firms in the field in which they are proposing to carry out SBIR projects; (ii) organized and operated for profit; the employer of 500 or fewer employees, including employees of subsidiaries and affiliates: the primary source of employment for the project's principal investigator at the time of award and during the period when the research is conducted; and (iv) at least 51% owned by US citizens or lawfully admitted permanent resident aliens. Our database does not cover projects funded under the related Small Business Technology Transfer (STTR) program, which has similar aims but different eligibility requirements.
‘The objective of Phase I is to determine the scientific or technical feasibility and commercial merit of the proposed research or R&D efforts and the quality of performance of the small business concern, prior to providing further Federal support in Phase II.’ See http://grants.nih.gov/grants/funding/SBIRContract/PHS2008-1.pdf, page 1.
It is not uncommon, however, for NIH Phase II awards to exceed the $750,000 threshold. While NIH offers no research assessment-based justification, the NRC, as part of its evaluation of SBIR programs (discussed below), recommended that NIH formalize criteria for larger awards (Wessner forthcoming). See note 12.
‘The objective of Phase II is to continue the research or R&D efforts initiated in Phase I. Funding shall be based on the results of Phase I and the scientific and technical merit and commercial potential of the Phase II proposal.’ See http://grants.nih.gov/grants/funding/SBIRContract/PHS2008-1.pdf, page 1. According to Wessner (forthcoming), in 2004 about 6% of Phase I applications were approved. Of those, just over one-third that requested Phase II funding were approved.
‘The objective of Phase III, where appropriate, is for the small business concern to pursue with non-SBIR funds the commercialization objectives resulting from the outcomes of the research or R&D funded in Phases I and II.’ See http://grants.nih.gov/grants/funding/SBIRContract/PHS2008-1.pdf, page 1.
The percentage increased to 1.5 in 1993 and 1994, 2.0 in 1995, and 2.5 in 1997.
At the time of writing this paper, the SBIR/STTR Authorization Act was introduced in the US House of Representatives as H.R. 5819. It would, among other things, extend the SBIR program until 2010, increase agency set asides from 2.50% to 3.00%, and increase Phase I and Phase II funding limits to $300,000 and $2.2 million, respectively.
This National Research Council initiative was mandated by the Small Business Reauthorization Act of 2000 (H.R. 5667). For background information on the Council's efforts, see National Research Council (2007) and Wessner (2007). The NRC, which graciously made these data available for this study, is also in the process of assessing the SBIR program in the Department of Defense, Department of Energy, NASA, and the National Science Foundation. See National Research Council (2004, 2007) for an overview of these agencies.
The dataset and survey questionnaires are described completely in Cahill (2006).
The National Institute of Dental and Craniofacial Research had only four funded projects with surveys returned, there was only a single project funded by the National Library of Medicine and no projects were funded by the National Center for Complementary and Alternative Medicine. We tested robustness of the econometric results (below) to including observations with missing values for one or more covariates by placing a value of zero on these regressors and also controlling for a set of missing value dummy variables. The findings were not materially different than those presented below; these results are available from the authors on request
We had no prior information about the percent of NIH SBIR projects that had been commercialized. The NIH's Phase I selection criteria focus, in part, on the significance of the project's commercialization potential: One criterion question is ‘Does the proposed project have commercial potential to lead to a marketable product, process or service?’ And, at the Phase II stage, there are additional related criteria, including’ ‘Did the applicant submit a concise Commercialization Plan?’ and ‘Does the project carry a high degree of commercial potential, as described in the Commercialization Plan?’ See http://grants.nih.gov/grants/funding/sbirsttr_ReviewCriteria.htm.
Mansfield et al. (1971), for example, reported an average probability of commercial success from R&D projects in three laboratories (one chemical laboratory and two proprietary drug laboratories) of 31%. We caution the reader about comparing the probability of commercial success from this, or other similar case studies, with the probability of commercialization from NIH SBIR awards and concluding that businesses receiving NIH SBIR awards are more successful. The size and underlying research structure of the two groups of businesses is too different for meaningful comparisons.
We thank an anonymous referee for pointing out the additional possibilities that (i) small businesses have greater difficulty obtaining external financing, so only the better projects are
accepted; (ii) larger businesses, are on average more productive than smaller businesses so the latter have to play catch up within a market niche; and (iii) subsidies are generally granted to smaller businesses for short-term projects for which results are more easily observed.
Link and Scott (2000) documented this fact through case studies of DoD SBIR awards.
The overall knowledge base of the business is broader than measured by this variable; our emphasis is on complementary knowledge from previous awards.
Link and Scott (2005) offered this same argument, and supported it empirically, with respect to various dimensions of success of small internal research projects conducted within the laboratories of the National Institute of Standards and Technology.
Sampled projects of 2.7% are in businesses that were both female and minority owned and controlled.
The survey question asks if (‘yes’ or ‘no’) there was any involvement by university faculty, graduate students, and/or university developed technologies.
For a review of the literature related to universities as research partners, see Hall (2004).
As examples of the project variation across Institutes, in 1997 the National Cancer Institute funded a California business to develop an image detector with 100 μ m spatial resolution applicable to the detection of cancer in small animals; in 1988 the National Heart, Lung, and Blood Institute funded a Virginia business to develop an optical imaging device to measure skin blood glow velocities for the treatment of vascular disease in diabetic patients; in 1999 the National Institute of Drug Abuse funded a New York business to develop an Internet-based dissemination plan for information and methods concerning drug abuse prevention approaches; and in 1994 the National Institute on Deafness and other Communication Disorders funded a Florida business to develop a hearing screener based on noise cancellation techniques to rapidly detect hearing problems in new-born infants.
The NRC's (2007) data collection methodology implicitly assumed that recent Phase II awards will be completed and will have had sufficient time to commercialize within four years.
Each additional year of age is predicted to reduce the probability of response by a statistically significant (at the.01 level) 1.12 percentage points.
For example, the average ages of commercialized and non-commercialized projects were 7.3 and 7.5 years, while the median age was 7.0 years for both. These results are available from the authors on request.
These results are available from the authors on request.
A table showing a complete set of sample means for commercialized and non-commercialized projects is available from the authors on request.
These results are available from the authors on request.
These three commercialized projects received $59.9, $50.1, and $20.0 million of venture capital funding.
Skewness is also an issue for sources of external funds that are received more frequently. For example, although 63% of commercialized projects obtain personal or internal funding, the average amount ($273,421) is over nine times as large as the median ($30,000).
If KnowlBase is redefined as the number of related Phase II projects, including the current one, there would be no (undefined) zero values. We obtained qualitatively similar results when controlling for the level rather than natural log of related previous Phase II projects. We also tested for diminishing returns by estimating specifications with controls for both linear and quadratic terms. The point estimates from these models suggest a concave relationship (with the commercialization probability predicted to reach a maximum at around 21 to 22 previous projects), consistent with the hypothesis of diminishing returns.
However, this conclusion is tentative since we do not know whether there are race/ethnicity or gender differences in the quality of projects initially receiving SBIR funding.
In an effort to also control for the ‘structural uncertainty’ of each project, in the context of Zeira (1987), we included dummy variables to account for how (i.e., in what non-mutually exclusive form) each project was commercialized (e.g., software, hardware, process technology, drug, biologic, research tool, etc.). Statistically, these dummies were not significant.
For instance, a specification that included linear and quadratic terms for the total dollar amount invested suggested weakly diminishing returns, with a maximum commercialization probability at around $81 million dollars, which is equal to the maximum investment observed in our sample. The estimated marginal effects from a linear specification of the dollar amount of alternative funding sources reveal little, as was expected given the highly skewed distributions for these variables.
Zero values for $AddFunds, $AddFunds-Fed, $AddFunds-VC, $AddFunds-Oth, $AddFunds-SLU, and $AddFund-Own were reset to equal 1 so that the log of each would be defined.
As above, the predicted effects of a 100% increase in explanatory variables expressed in natural logs are estimated by multiplying the marginal effect from the probit model by 0.693.
These data were obtained from http://grants.nih.gov/grants/award/awardtr.htm. See Wallsten (2000) who used a similar technique.
In performing this calculation, we used information on all awards surveyed, rather than just those with responses to it.
Thus, there were two instruments, one indicating the normalized amount (in dollars) invested and the second denoting the (normalized) number of venture capital deals. Four of the regions were located within the state of California (LA/Orange County, Northeastern California, Silicon Valley and the San Diego areas). These were consolidated into a single region for the state of California.
We estimated models where the first-stage dependent variable was all additional funding, additional funding from venture capital, or from either venture capital or other private sources. The instruments lacked predictive power in all of these cases.
For example, additional funding was received more frequently and in larger amounts for projects surveyed four, five or six years after the award date than for those examined in later years. (The data set does not contain information on projects aged less than four years.)
We did, however, examine whether the dollar amount of the SBIR award was related to the probability of receiving additional funding, thinking that award size might be viewed as a signal of the government's assessment of project potential. The data provide little support for this possibility. For instance, the average award of projects receiving outside funding was just 6% larger than for those that did not ($663,159 versus $627,186).
A handful of states (e.g., North Carolina) have programs that match federal Phase I awards. The insignificance of the additional developmental funding from state or local government variable in our models might be a cautionary sign to bring about a rethinking of extending such programs to Phase II, assuming that one of the state's objectives in so doing would be to increase commercialization. If commercialization is a state objective, perhaps tying a matching grants program to university involvement is worth consideration.
Our finding related to university involvement increasing the probability of commercialization has other possible implications. University technology transfer offices might broaden the scope of their mission to include assisting local and regional small entrepreneurial businesses during the Phase I and Phase II award process in anticipation of later involvement in the Phase II research and the possibility of sharing ownership with whatever is subsequently commercialized.
Phase II awards were higher than $750,000 for just over 20% of our sample.
There is a rich literature about the complementary versus substitutability between public R&D and private R&D. This so-called ‘crowding out’ literature traces to Blank and Stigler (1957), as reviewed by Leyden and Link (1992). David, Hall, and Toole (2000) have recently summarized the econometric literature on the subject and concluded that the empirical evidence to date is
inconclusive, and more recent research (González and Pazó 2007, Görg and Strobl (2007), and Piekkola (2007) does not contradict the David, Hall, and Toole conclusions.
The company was ‘uncertain’ for the remaining 14% of commercialized projects. It is not possible to provide the distribution of answers for noncommercialized projects (or for all projects) because this question was not asked for the majority of noncommercialized projects that had been ‘discontinued’ by the survey date.
These estimates assume additive effects of university involvement and own company/personal funding on commercialization probabilities. A specification that also included the interaction of these two variables, suggests still larger increase in predicted commercialization rates (the interaction coefficient is positive).
The SBIR program has made several institutional changes in recent years to increase the rate of commercialization. The Fast Track program permits businesses with projects of high commercialization success to submit the Phase I and Phase II applications for a concurrent review. Among other things, projects funded under Fast Track avoid the possibility of a funding gap between the completion of Phase I and the award/receipt of Phase II dollars. See Audretsch, Link, and Scott (2002) for an evaluation of the Fast Track program within the Department of Defense. According to Wessner (forthcoming), less than 6% of applicants current apply through the Fast Track Program. In 2002, NIH initiated their Commercialization Assistance Program (CAP) ‘ … to help some of the nation's most promising small life science and healthcare companies develop their commercial businesses and transition their SBIR-funded technologies into the marketplace’ through assistance with business development plans, marketing strategies, and formulating roadmaps for licensing. See http://www.larta.org/nihcap/NIHCAP-ProgramDescription.pdf.
References
Arrow, Kenneth J. 1962. The economic implications of learning by doing. Review of Economic Studies, 29(3): 155–73.
Åstebro, Thomas. 1998. Basic statistics on the success rate and profits for independent inventors. Entrepreneurship: Theory and Practice, 23(2): 41–8.
Åstebro, Thomas. 2003. The return to independent invention: Evidence of unrealistic optimism, rent seeking or skewness loving. The Economic Journal, 113(1): 226–39.
Audretsch, David B., Taylor, Aldridge and Alexander, Oettl. 2006. “The knowledge filter and economic growth: the role of scientist entrepreneurship”. Max Planck working paper #0611
Audretsch, David B, Link, Albert N. and Scott, John T. 2002. Public/private technology partnerships: Evaluating SBIR-supported research. Research Policy, 31(1): 145–58.

Blank, David M. and Stigler, George J. 1957. The demand and supply of scientific personnel, New York: National Bureau of Economic Research.
Cahill, Pete. 2006. “National research council survey of small business innovation research”. Preliminary report to the National Research Council
Cohen, Wesley M. and Levinthal, Daniel A. 1989. Innovation and learning: The two faces of R&D. Economic Journal, 99(397): 569–96.
David, Paul A., Hall, Bronwyn H. and Toole, Andrew A. 2002. Is public R&D a complement or substitute for private R&D? A review of the econometric evidence. Research Policy, 29(3–4): 497–529.
González, Xulia and Consuelo, Pazó. 2007. Do public subsidies stimulate private R&D spending?. Research Policy, 37(3): 371–89.
Görg, Holger and Eric, Strobl. 2007. The effect of R&D subsidies on private R&D. Economica, 74(294): 215–34.
Hall, Bronwyn H. 2004. “University–Industry Research Partnerships in the United States”. In Rethinking Science Systems and Innovation Policies, Edited by: Jean-Pierre, Contzen, Gibson, David and Manuel, Heitor. 1–31. West Lafayette, IN: Purdue University Press.
Hall, Bronwyn H., Link, Albert N. and Scott, John T. 2003. Universities as research partners. Review of Economics and Statistics, 85(2): 485–91.
Hall, Robert E. and Jones, Charles I. 2007. The value of life and the rise in health spending. Quarterly Journal of Economics, 122(1): 39–72.
Leyden, Dennis P and Link, Albert N. 1992. Government's role in innovation, Boston: Kluwer Academic Publishers.
Link, Albert N. 1999. Public/private partnerships in the United States. Industry and Innovation, 6(2): 191–217.
Link, Albert N. 2006. Public/private partnerships: innovation strategies and policy alternatives, Norwell, MA: Kluwer Academic Publishers.
Link, Albert N. and Scott, John T. 1998. Public accountability: evaluating technology-based institutions, Norwell, MA: Kluwer Academic Publishers.
Link, Albert N. and Scott, John T. 2000. “Estimates of the social returns to small business innovation research projects”. In The Small Business Innovation Research Program: An Assessment of the Department of Defense Fast Track Initiative, Edited by: Wessner, Charles W. 275–90. Washington, DC: National Academy Press.

Link, Albert N. and Scott, John T. 2005. Evaluating public research institutions: The U.S. advanced technology program's intramural research initiative, London: Routledge.
Link, Albert N. and Siegel, Donald S. 2003. Technology change and economic performance, London: Routledge.
Mansfield, Edwin, Rapoport, John, Schnee, Jerome, Samuel, Wagner and Michael, Hamburger. 1971. Research and innovation in the modern corporation, New York: W.W. Norton.
Murphy, Kevin M. and Topel, Robert H. 2006. The value of health and longevity. Journal of Political Economy, 114(5): 871–904.
National Research Council. 2004. SBIR: program diversity and assessment challenges, Washington, DC: National Academy Press.
National Research Council. 2007. Capitalizing on science, technology, and innovation: An assessment of the small business innovation research program, Washington, DC: National Academy Press.
Piekkola, Hannu T. 2007. Public funding of R&D and growth: Firm-level evidence from Finland. Economics of Innovation and New Technology, 16(3): 195–210.
Tibbetts, Ronald. 1999. “The small business innovation research program and NSF SBIR commercialization results”. Washington DC: National Science Foundation. Mimeograph
Toole, Andrew A. and Dirk, Czarnitzki. 2007. Biomedical academic entrepreneurship through the SBIR program. Journal of Economic Behavior and Organization, 63(4): 716–38.
Toole, Andrew A. and Calum, Turvey. 2009. How does initial public financing influence private incentives for follow-on investment in early-stage technologies?. Journal of Technology Transfer, 34(1): 43–58.
Turner, James and George, Brown. 1999. The federal role in small business research. Issues in Science and Technology, : 51–8.
U.S. Department of Health and Human Services (HHS). 2003. National survey to evaluate the NIH SBIR program, Washington, DC: National Institutes of Health.
Wallsten, Scott J. 2000. The effects of government–industry R&D programs on private R&D: The case of the small business innovation research program. RAND Journal of Economics, 31(1): 82–100.
Wessner, Charles W. 2000. The small business innovation research program: An assessment of the department of defense fast track initiative, Washington, DC: National Academy Press.
Wessner, Charles W. 2007. SBIR and the phase III challenge of commercialization, Washington, DC: National Academy Press.
Wessner, Charles W. Forthcoming. An assessment of the small business innovation research program at the national institutes of health, Washington, DC: National Academy Press.
Zeira, Joseph. 1987. Investment as a process of search. Journal of Political Economy, 95(1): 204–10.
Zucker, Lynne G., Darby, Michael R. and Armstrong, Jeff S. 1998a. Geographically localized knowledge: Spillovers or markets?. Economic Inquiry, 36(1): 65–86.
Zucker, Lynne G., Darby, Michael R. and Brewer, Marilynn B. 1998b. Intellectual human capital and the birth of U.S. biotechnology enterprises. American Economic Review, 88(1): 290–306.
Zucker, Lynne G. and Darby, Michael R. 2001. Capturing technological opportunity via Japan's star scientists: Evidence from Japanese firms’ biotech patents and products. Journal of Technology Transfer, 26(1–2): 37–58. [CrossRef]