briefing paper no 14/08 - parliament of nsw · nsw parliamentary library research service a world...
TRANSCRIPT
NSW PARLIAMENTARY LIBRARY RESEARCH SERVICE
A World Game: Events and Tourism in NSW
by
John Wilkinson
Briefing Paper No 14/08
RELATED PUBLICATIONS
• Tourism in NSW: Prospects for the Current Decade, by John Wilkinson. NSW Parliamentary Library Research Service Briefing Paper 8/06.
• Tourism in NSW: After September 11, by John Wilkinson. NSW
Parliamentary Library Research Service Research Service Briefing Paper 6/04.
• Overseas Visitors to NSW: Present Trends and Future Possibilities, by
John Wilkinson. NSW Parliamentary Library Research Service Briefing Paper 9/99.
ISSN 1325-5142 ISBN 978 0 7313 1845 2 November 2008 © 2008 Except to the extent of the uses permitted under the Copyright Act 1968, no part of this document may be reproduced or transmitted in any form or by any means including information storage and retrieval systems, without the prior written consent from the Librarian, New South Wales Parliamentary Library, other than by Members of the New South Wales Parliament in the course of their official duties.
A World Game: Events and Tourism in NSW
by
John Wilkinson

NSW PARLIAMENTARY LIBRARY RESEARCH SERVICE David Clune (MA, PhD, Dip Lib), Manager.............................................. (02) 9230 2484 Gareth Griffith (BSc (Econ) (Hons), LLB (Hons), PhD), Senior Research Officer, Politics and Government / Law………………..(02) 9230 2356 Jason Arditi, Research Officer (BA, LLB) Research Officer, Law ........... (02) 9230 2768 Tom Edwards (BSc (Hons)), Research Officer, Environment ................... (02) 9230 3085 Kathryn Simon (BA, LLB (Hons), LLM) Research Officer, Law……….(02) 9230 2003 Stewart Smith (BSc (Hons), MELGL), Research Officer, Environment ... (02) 9230 2798 John Wilkinson (MA, PhD), Research Officer, Economics……………...(02) 9230 2006 Should Members or their staff require further information about this publication please contact the author. Information about Research Publications can be found on the Internet at: www.parliament.nsw.gov.au/WEB_FEED/PHWebContent.nsf/PHPages/LibraryPublications
Advice on legislation or legal policy issues contained in this paper is provided for use in parliamentary debate and for related parliamentary purposes. This paper is not professional legal opinion.
CONTENTS
EXECUTIVE SUMMARY ...........................................................................................1
1.INTRODUCTION ......................................................................................................1
2. MAIN SOURCES OF TOURISTS TO AUSTRALIA AND NSW: DOMESTIC AND OVERSEAS..........................................................................................................1
(A)AUSTRALIA..............................................................................................................1 (B)NEW SOUTH WALES ................................................................................................2
3.TOURISM’S CONTRIBUTION TO GDP: AUSTRALIA AND NSW.................3
(A)AUSTRALIA..............................................................................................................3 (B)NEW SOUTH WALES ................................................................................................4
4.EMPLOYMENT IN TOURISM ...............................................................................5
(A)EMPLOYMENT IN TOURISM: AUSTRALIA .................................................................5 (B)EMPLOYMENT IN TOURISM: NEW SOUTH WALES ....................................................6 (C)REGIONAL NEW SOUTH WALES...............................................................................7
5.CONTRASTING COMPOSITION OF TOURISM: SYDNEY AND REGIONAL NSW ................................................................................................................................8
(A)SYDNEY...................................................................................................................8 (B)REGIONAL NEW SOUTH WALES...............................................................................9
6. BOOSTING TOURISM (THROUGH SPORTING AND BUSINESS EVENTS) TO ATTRACT DOMESTIC TOURISTS AND HIGHER-SPENDING OVERSEAS TOURISTS ............................................................................................10
(A)INTERNATIONAL AND DOMESTIC TOURIST EXPENDITURE .....................................10 (B) PREVIOUS MEASURES BY OTHER STATE GOVERNMENTS TO BOOST TOURISM BY ATTRACTING EVENTS: 1980S AND 1990S...................................................................11 (C)NSW STATE GOVERNMENT’S INITIATIVES TO ATTRACT MAJOR EVENTS .............11 (D)CONTRIBUTION OF EVENTS IN ATTRACTING DOMESTIC AND OVERSEAS TOURISTS12
7.FLUCTUATIONS IN DOMESTIC/INTERNATIONAL TOURIST ACTIVITY IN NEW SOUTH WALES..........................................................................................16
(A)DOMESTIC TOURISM..............................................................................................16 (B)INTERNATIONAL TOURISTS ....................................................................................20
8.CONTRIBUTING FACTORS IN THE FLUCTUATIONS IN VISITOR ARRIVALS ..................................................................................................................22
(A)DOMESTIC VISITORS..............................................................................................22 (B)INTERNATIONAL VISITORS.....................................................................................23
9.REVIEW OF TOURISM BY THE IEMMA GOVERNMENT...........................27
(A)IEMMA GOVERNMENT’S DECISION TO REASSESS TOURISM POLICY ......................27 (B)RECOMMENDATIONS OF THE O’NEILL REPORTS....................................................28
10.NSW GOVERNMENT RESPONSES TO THE O’NEILL REPORT ..............30
(A)NEW FUNDING.......................................................................................................30
(B) NEW EVENTS IN NSW ........................................................................................... 30 (C)SYDNEY CONVENTION AND EXHIBITION SPACE.....................................................30 (D)WORLD CUP BID....................................................................................................31
11.ASIAN FOOTBALL POPULARITY AND AUSTRALIA’S BID FOR THE WORLD CUP ..............................................................................................................31
(A)THE DEVELOPMENT OF PROFESSIONAL FOOTBALL IN ASIA...................................31 (B)BRITAIN AND THE GROWTH OF TELEVISED FOOTBALL IN ASIA .............................32 (C) 2002 WORLD CUP AND THE EXPANSION OF ASIAN FOOTBALL .............................35 (D)ASIAN PLAYERS AND ADMINISTRATORS IN BRITAIN IN THE TWENTY-FIRST CENTURY....................................................................................................................37
CONCLUSION ............................................................................................................39

A World Game: Events and Tourism in NSW
EXECUTIVE SUMMARY In recent years the overall number of people, engaging in tourist activity, in Australia and in NSW, has declined. While the number of inbound tourists has slightly increased, the number of Australians, locally participating in tourist activity, has decreased (pp.16-20, 22) The contribution of tourism, to the economy, has similarly decreased (pp.3-5) There is a small, but significant, number of people engaged in tourism-related employment: particularly in certain regional areas of NSW (pp.5-8) Overseas tourist visits to Australia (and NSW) have been increasing slightly, but Australia’s share of total overseas travel has been declining (pp.21-22) Overseas tourists, while a much smaller proportion of tourist numbers in Australia, individually spend much more than domestic tourists (pp.10-11) Events (in recent years) have been seen as a means to both boosting tourist activity overall and attracting increasing numbers of higher-spending overseas tourists ((pp.11-16) John O’Neill (CEO of the Australian Rugby Union from 1995-2003) produced three reviews, earlier in 2008, with significant observations for events and tourism in NSW (pp.27-30) The Rees government, in its mini-budget, has announced new funding initiatives for tourism in New South Wales (p.30) Asian countries have the potential to become the source of a faster growing number of inbound tourists (pp.23-27) Asian football popularity has the potential to enhance the success of a World Cup staged in Australia (pp.31-38)

A World Game: Events and Tourism in NSW
1
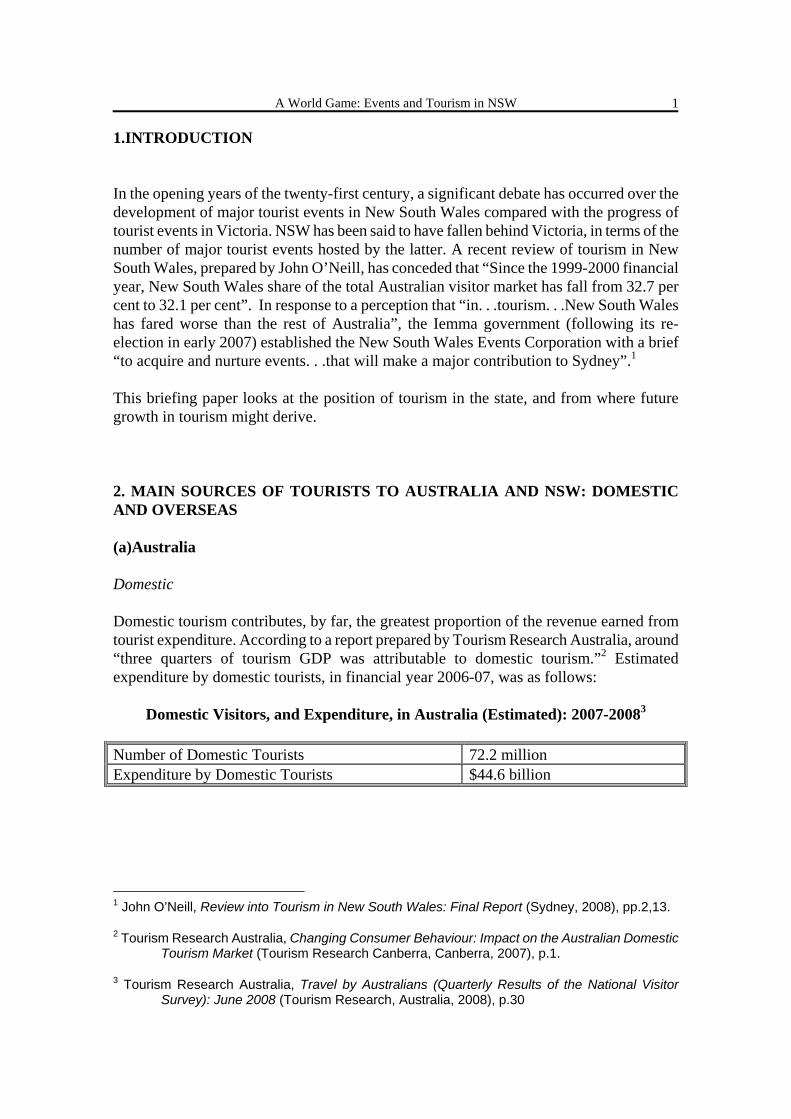
1.INTRODUCTION In the opening years of the twenty-first century, a significant debate has occurred over the development of major tourist events in New South Wales compared with the progress of tourist events in Victoria. NSW has been said to have fallen behind Victoria, in terms of the number of major tourist events hosted by the latter. A recent review of tourism in New South Wales, prepared by John O’Neill, has conceded that “Since the 1999-2000 financial year, New South Wales share of the total Australian visitor market has fall from 32.7 per cent to 32.1 per cent”. In response to a perception that “in. . .tourism. . .New South Wales has fared worse than the rest of Australia”, the Iemma government (following its re-election in early 2007) established the New South Wales Events Corporation with a brief “to acquire and nurture events. . .that will make a major contribution to Sydney”.1 This briefing paper looks at the position of tourism in the state, and from where future growth in tourism might derive. 2. MAIN SOURCES OF TOURISTS TO AUSTRALIA AND NSW: DOMESTIC AND OVERSEAS (a)Australia Domestic Domestic tourism contributes, by far, the greatest proportion of the revenue earned from tourist expenditure. According to a report prepared by Tourism Research Australia, around “three quarters of tourism GDP was attributable to domestic tourism.”2 Estimated expenditure by domestic tourists, in financial year 2006-07, was as follows:
Domestic Visitors, and Expenditure, in Australia (Estimated): 2007-20083 Number of Domestic Tourists 72.2 million Expenditure by Domestic Tourists $44.6 billion
1 John O’Neill, Review into Tourism in New South Wales: Final Report (Sydney, 2008), pp.2,13.
2 Tourism Research Australia, Changing Consumer Behaviour: Impact on the Australian Domestic Tourism Market (Tourism Research Canberra, Canberra, 2007), p.1.
3 Tourism Research Australia, Travel by Australians (Quarterly Results of the National Visitor Survey): June 2008 (Tourism Research, Australia, 2008), p.30
A World Game: Events and Tourism in NSW
2
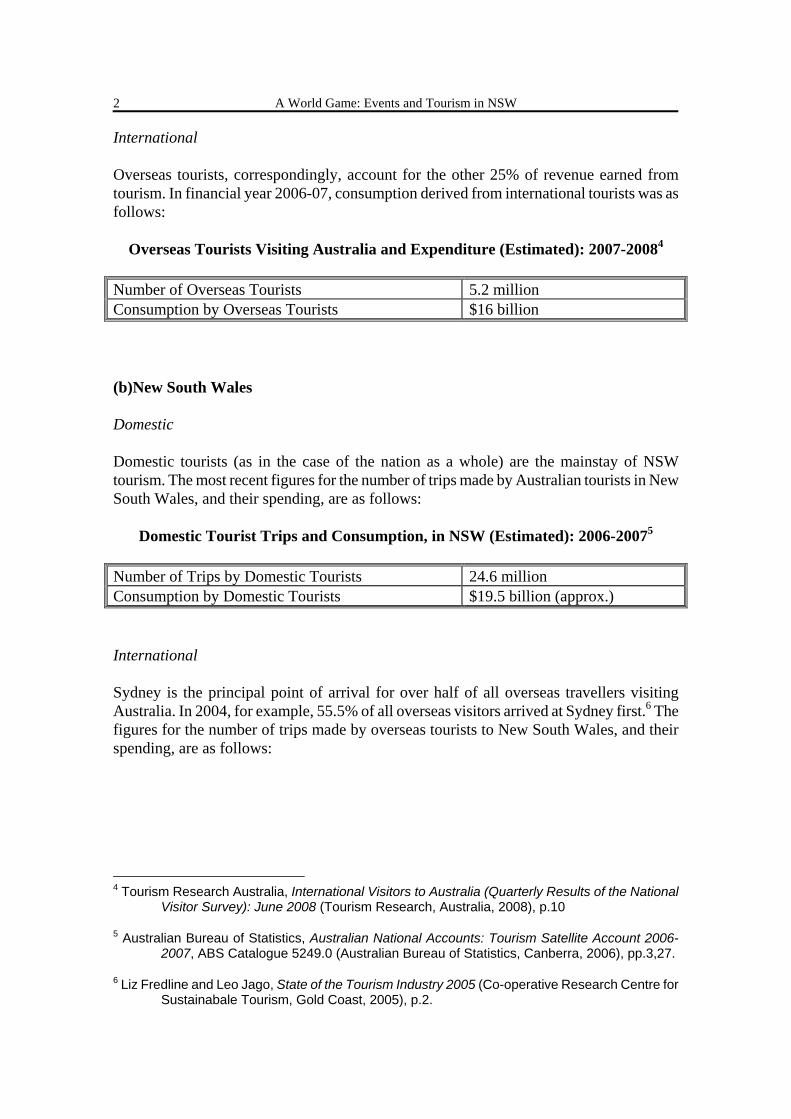
International Overseas tourists, correspondingly, account for the other 25% of revenue earned from tourism. In financial year 2006-07, consumption derived from international tourists was as follows:
Overseas Tourists Visiting Australia and Expenditure (Estimated): 2007-20084 Number of Overseas Tourists 5.2 million Consumption by Overseas Tourists $16 billion (b)New South Wales Domestic Domestic tourists (as in the case of the nation as a whole) are the mainstay of NSW tourism. The most recent figures for the number of trips made by Australian tourists in New South Wales, and their spending, are as follows:
Domestic Tourist Trips and Consumption, in NSW (Estimated): 2006-20075 Number of Trips by Domestic Tourists 24.6 million Consumption by Domestic Tourists $19.5 billion (approx.) International Sydney is the principal point of arrival for over half of all overseas travellers visiting Australia. In 2004, for example, 55.5% of all overseas visitors arrived at Sydney first.6 The figures for the number of trips made by overseas tourists to New South Wales, and their spending, are as follows:
4 Tourism Research Australia, International Visitors to Australia (Quarterly Results of the National
Visitor Survey): June 2008 (Tourism Research, Australia, 2008), p.10
5 Australian Bureau of Statistics, Australian National Accounts: Tourism Satellite Account 2006-2007, ABS Catalogue 5249.0 (Australian Bureau of Statistics, Canberra, 2006), pp.3,27.
6 Liz Fredline and Leo Jago, State of the Tourism Industry 2005 (Co-operative Research Centre for Sustainabale Tourism, Gold Coast, 2005), p.2.
A World Game: Events and Tourism in NSW
3
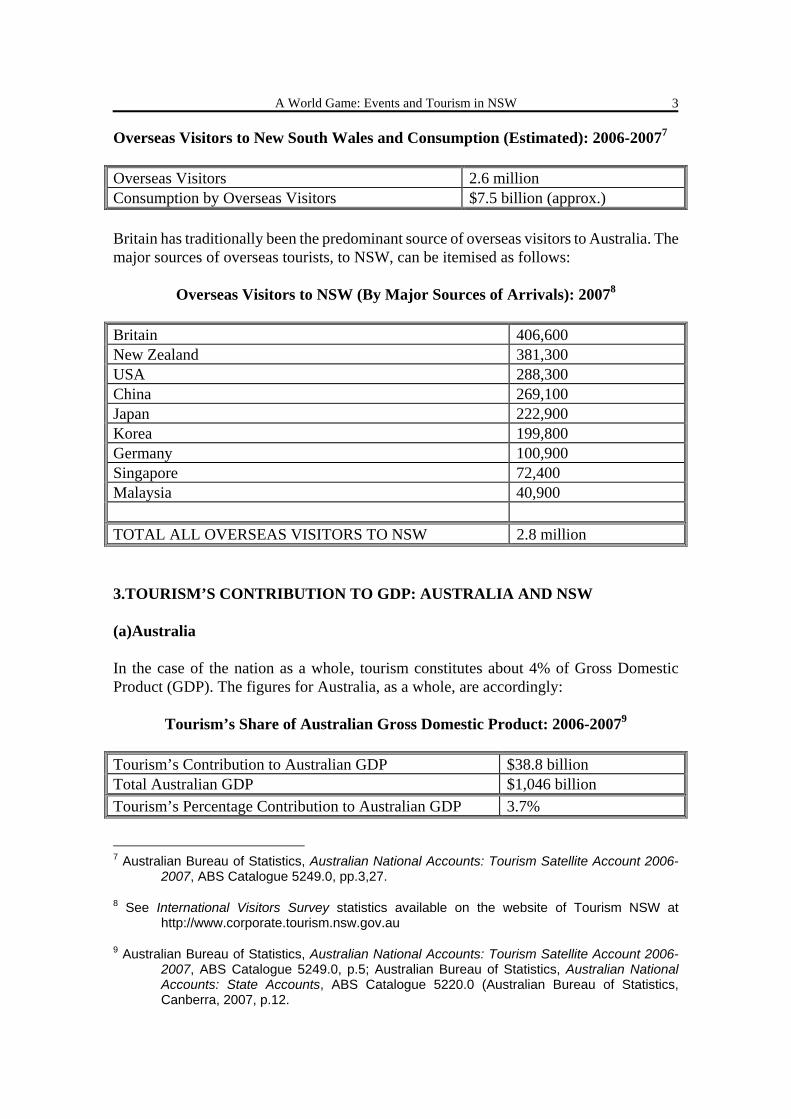
Overseas Visitors to New South Wales and Consumption (Estimated): 2006-20077 Overseas Visitors 2.6 million Consumption by Overseas Visitors $7.5 billion (approx.) Britain has traditionally been the predominant source of overseas visitors to Australia. The major sources of overseas tourists, to NSW, can be itemised as follows:
Overseas Visitors to NSW (By Major Sources of Arrivals): 20078 Britain 406,600 New Zealand 381,300 USA 288,300 China 269,100 Japan 222,900 Korea 199,800 Germany 100,900 Singapore 72,400 Malaysia 40,900 TOTAL ALL OVERSEAS VISITORS TO NSW 2.8 million 3.TOURISM’S CONTRIBUTION TO GDP: AUSTRALIA AND NSW (a)Australia In the case of the nation as a whole, tourism constitutes about 4% of Gross Domestic Product (GDP). The figures for Australia, as a whole, are accordingly:
Tourism’s Share of Australian Gross Domestic Product: 2006-20079 Tourism’s Contribution to Australian GDP $38.8 billion Total Australian GDP $1,046 billion Tourism’s Percentage Contribution to Australian GDP 3.7%
7 Australian Bureau of Statistics, Australian National Accounts: Tourism Satellite Account 2006-
2007, ABS Catalogue 5249.0, pp.3,27.
8 See International Visitors Survey statistics available on the website of Tourism NSW at http://www.corporate.tourism.nsw.gov.au
9 Australian Bureau of Statistics, Australian National Accounts: Tourism Satellite Account 2006-2007, ABS Catalogue 5249.0, p.5; Australian Bureau of Statistics, Australian National Accounts: State Accounts, ABS Catalogue 5220.0 (Australian Bureau of Statistics, Canberra, 2007, p.12.
A World Game: Events and Tourism in NSW
4
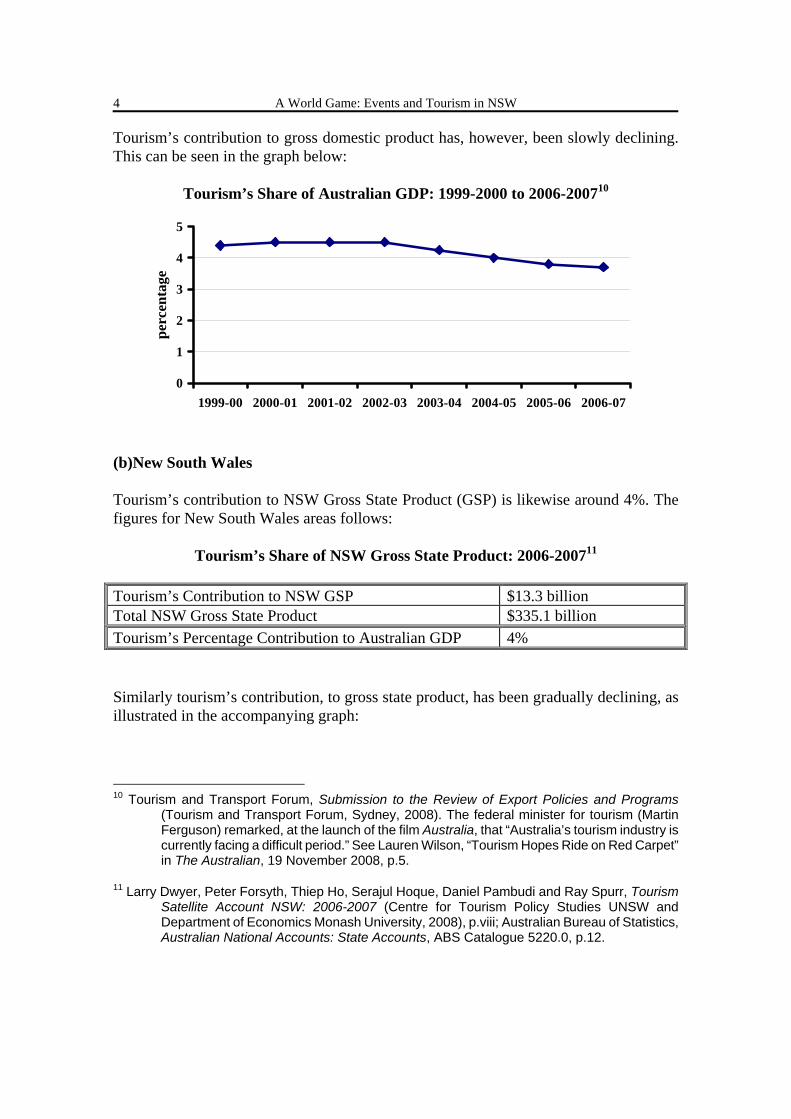
Tourism’s contribution to gross domestic product has, however, been slowly declining. This can be seen in the graph below:
Tourism’s Share of Australian GDP: 1999-2000 to 2006-200710
0
1
2
3
4
5
1999-00 2000-01 2001-02 2002-03 2003-04 2004-05 2005-06 2006-07
perc
enta
ge
(b)New South Wales Tourism’s contribution to NSW Gross State Product (GSP) is likewise around 4%. The figures for New South Wales areas follows:
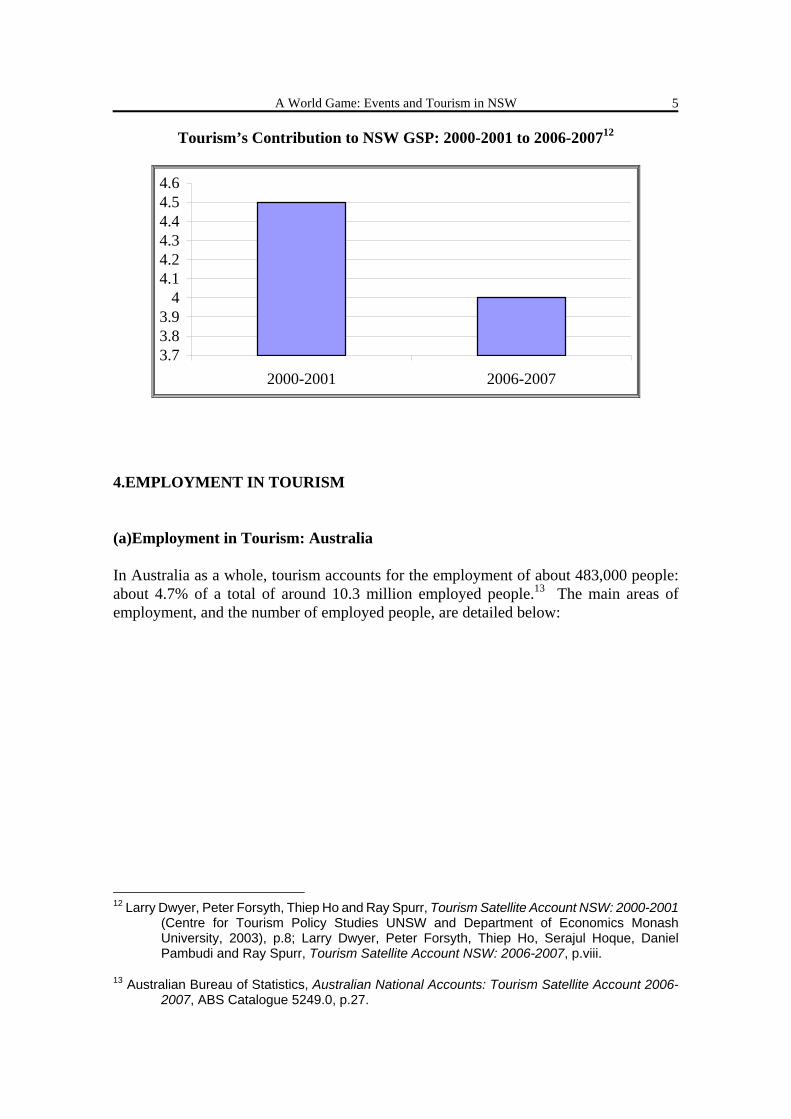
Tourism’s Share of NSW Gross State Product: 2006-200711 Tourism’s Contribution to NSW GSP $13.3 billion Total NSW Gross State Product $335.1 billion Tourism’s Percentage Contribution to Australian GDP 4% Similarly tourism’s contribution, to gross state product, has been gradually declining, as illustrated in the accompanying graph:
10 Tourism and Transport Forum, Submission to the Review of Export Policies and Programs
(Tourism and Transport Forum, Sydney, 2008). The federal minister for tourism (Martin Ferguson) remarked, at the launch of the film Australia, that “Australia’s tourism industry is currently facing a difficult period.” See Lauren Wilson, “Tourism Hopes Ride on Red Carpet” in The Australian, 19 November 2008, p.5.
11 Larry Dwyer, Peter Forsyth, Thiep Ho, Serajul Hoque, Daniel Pambudi and Ray Spurr, Tourism Satellite Account NSW: 2006-2007 (Centre for Tourism Policy Studies UNSW and Department of Economics Monash University, 2008), p.viii; Australian Bureau of Statistics, Australian National Accounts: State Accounts, ABS Catalogue 5220.0, p.12.
A World Game: Events and Tourism in NSW
5
Tourism’s Contribution to NSW GSP: 2000-2001 to 2006-200712
3.73.83.9
44.14.24.34.44.54.6
2000-2001 2006-2007
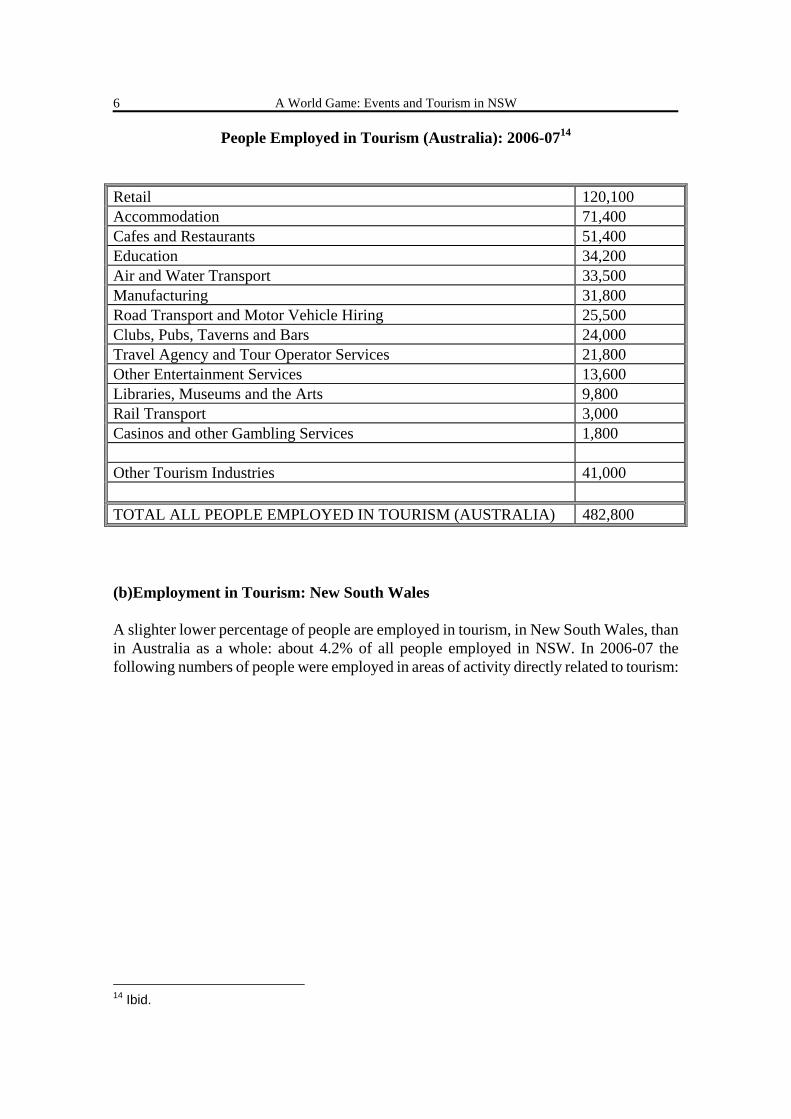
4.EMPLOYMENT IN TOURISM (a)Employment in Tourism: Australia In Australia as a whole, tourism accounts for the employment of about 483,000 people: about 4.7% of a total of around 10.3 million employed people.13 The main areas of employment, and the number of employed people, are detailed below:
12 Larry Dwyer, Peter Forsyth, Thiep Ho and Ray Spurr, Tourism Satellite Account NSW: 2000-2001
(Centre for Tourism Policy Studies UNSW and Department of Economics Monash University, 2003), p.8; Larry Dwyer, Peter Forsyth, Thiep Ho, Serajul Hoque, Daniel Pambudi and Ray Spurr, Tourism Satellite Account NSW: 2006-2007, p.viii.
13 Australian Bureau of Statistics, Australian National Accounts: Tourism Satellite Account 2006-2007, ABS Catalogue 5249.0, p.27.
A World Game: Events and Tourism in NSW
6
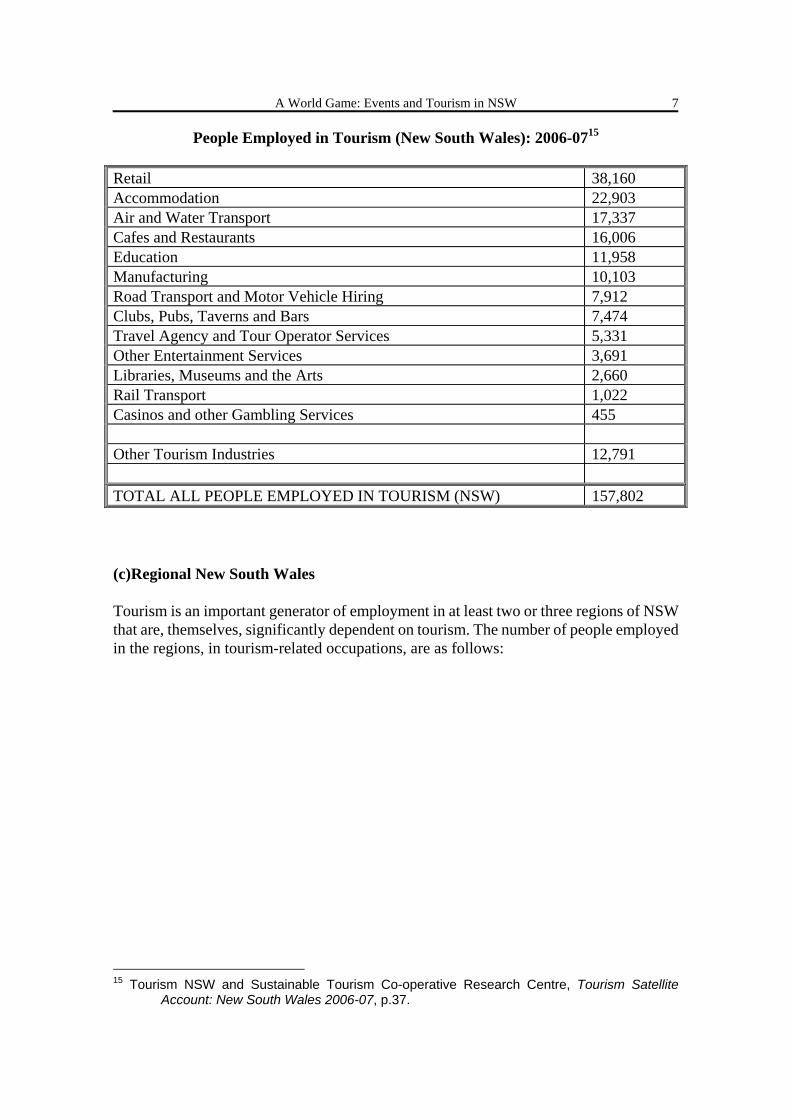
People Employed in Tourism (Australia): 2006-0714 Retail 120,100 Accommodation 71,400 Cafes and Restaurants 51,400 Education 34,200 Air and Water Transport 33,500 Manufacturing 31,800 Road Transport and Motor Vehicle Hiring 25,500 Clubs, Pubs, Taverns and Bars 24,000 Travel Agency and Tour Operator Services 21,800 Other Entertainment Services 13,600 Libraries, Museums and the Arts 9,800 Rail Transport 3,000 Casinos and other Gambling Services 1,800 Other Tourism Industries 41,000 TOTAL ALL PEOPLE EMPLOYED IN TOURISM (AUSTRALIA) 482,800 (b)Employment in Tourism: New South Wales A slighter lower percentage of people are employed in tourism, in New South Wales, than in Australia as a whole: about 4.2% of all people employed in NSW. In 2006-07 the following numbers of people were employed in areas of activity directly related to tourism:
14 Ibid.
A World Game: Events and Tourism in NSW
7
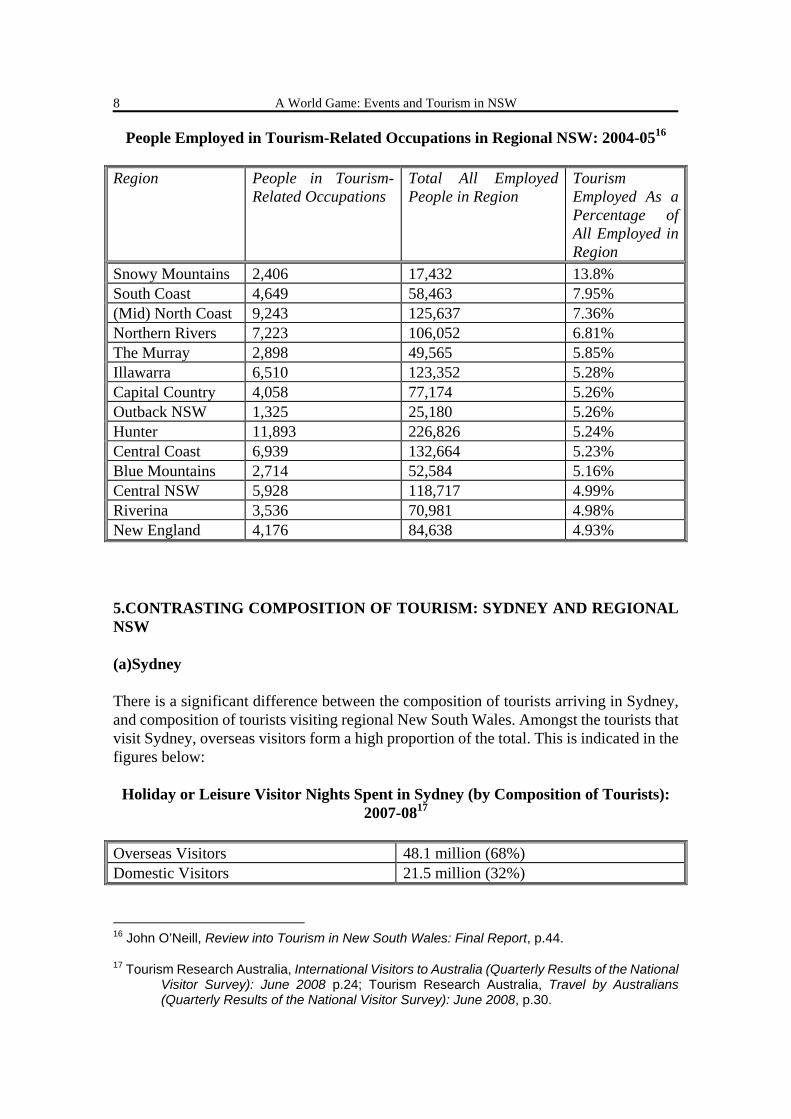
People Employed in Tourism (New South Wales): 2006-0715 Retail 38,160 Accommodation 22,903 Air and Water Transport 17,337 Cafes and Restaurants 16,006 Education 11,958 Manufacturing 10,103 Road Transport and Motor Vehicle Hiring 7,912 Clubs, Pubs, Taverns and Bars 7,474 Travel Agency and Tour Operator Services 5,331 Other Entertainment Services 3,691 Libraries, Museums and the Arts 2,660 Rail Transport 1,022 Casinos and other Gambling Services 455 Other Tourism Industries 12,791 TOTAL ALL PEOPLE EMPLOYED IN TOURISM (NSW) 157,802 (c)Regional New South Wales Tourism is an important generator of employment in at least two or three regions of NSW that are, themselves, significantly dependent on tourism. The number of people employed in the regions, in tourism-related occupations, are as follows:
15 Tourism NSW and Sustainable Tourism Co-operative Research Centre, Tourism Satellite
Account: New South Wales 2006-07, p.37.
A World Game: Events and Tourism in NSW
8
People Employed in Tourism-Related Occupations in Regional NSW: 2004-0516 Region People in Tourism-
Related Occupations Total All Employed People in Region
Tourism Employed As a Percentage of All Employed in Region
Snowy Mountains 2,406 17,432 13.8% South Coast 4,649 58,463 7.95% (Mid) North Coast 9,243 125,637 7.36% Northern Rivers 7,223 106,052 6.81% The Murray 2,898 49,565 5.85% Illawarra 6,510 123,352 5.28% Capital Country 4,058 77,174 5.26% Outback NSW 1,325 25,180 5.26% Hunter 11,893 226,826 5.24% Central Coast 6,939 132,664 5.23% Blue Mountains 2,714 52,584 5.16% Central NSW 5,928 118,717 4.99% Riverina 3,536 70,981 4.98% New England 4,176 84,638 4.93% 5.CONTRASTING COMPOSITION OF TOURISM: SYDNEY AND REGIONAL NSW (a)Sydney There is a significant difference between the composition of tourists arriving in Sydney, and composition of tourists visiting regional New South Wales. Amongst the tourists that visit Sydney, overseas visitors form a high proportion of the total. This is indicated in the figures below:
Holiday or Leisure Visitor Nights Spent in Sydney (by Composition of Tourists): 2007-0817
Overseas Visitors 48.1 million (68%) Domestic Visitors 21.5 million (32%)
16 John O’Neill, Review into Tourism in New South Wales: Final Report, p.44.
17 Tourism Research Australia, International Visitors to Australia (Quarterly Results of the National Visitor Survey): June 2008 p.24; Tourism Research Australia, Travel by Australians (Quarterly Results of the National Visitor Survey): June 2008, p.30.
A World Game: Events and Tourism in NSW
9
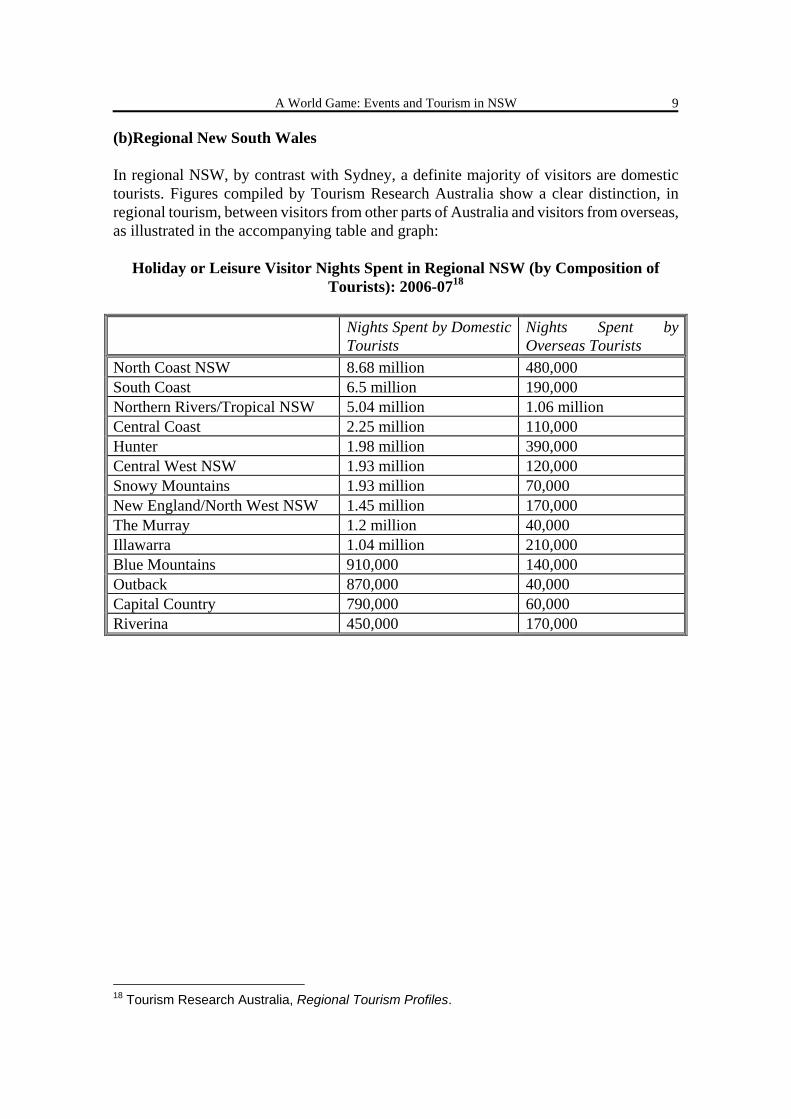
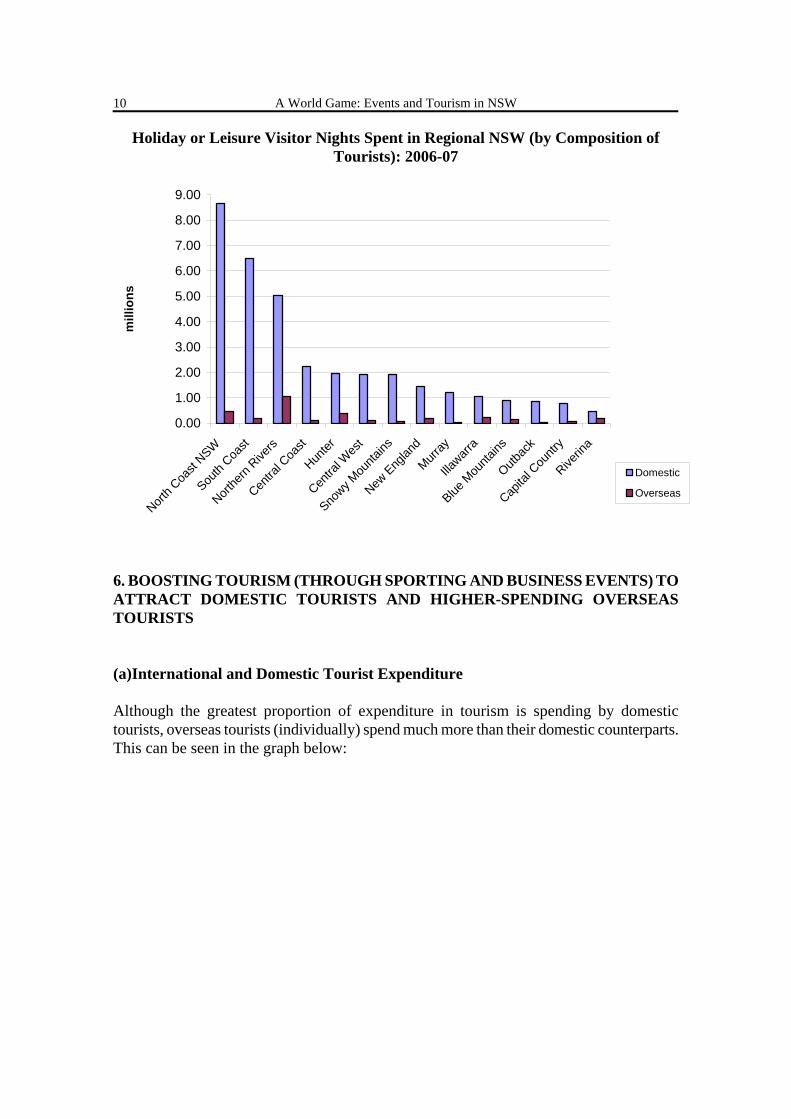
(b)Regional New South Wales In regional NSW, by contrast with Sydney, a definite majority of visitors are domestic tourists. Figures compiled by Tourism Research Australia show a clear distinction, in regional tourism, between visitors from other parts of Australia and visitors from overseas, as illustrated in the accompanying table and graph:
Holiday or Leisure Visitor Nights Spent in Regional NSW (by Composition of Tourists): 2006-0718
Nights Spent by Domestic
Tourists Nights Spent by Overseas Tourists
North Coast NSW 8.68 million 480,000 South Coast 6.5 million 190,000 Northern Rivers/Tropical NSW 5.04 million 1.06 million Central Coast 2.25 million 110,000 Hunter 1.98 million 390,000 Central West NSW 1.93 million 120,000 Snowy Mountains 1.93 million 70,000 New England/North West NSW 1.45 million 170,000 The Murray 1.2 million 40,000 Illawarra 1.04 million 210,000 Blue Mountains 910,000 140,000 Outback 870,000 40,000 Capital Country 790,000 60,000 Riverina 450,000 170,000
18 Tourism Research Australia, Regional Tourism Profiles.
A World Game: Events and Tourism in NSW
10
Holiday or Leisure Visitor Nights Spent in Regional NSW (by Composition of Tourists): 2006-07
0.00
1.00
2.00
3.00
4.00
5.00
6.00
7.00
8.00
9.00
North C
oast
NSW
South
Coast
Northe
rn Rive
rs
Centra
l Coa
st
Hunter
Centra
l Wes
t
Snowy M
ounta
ins
New E
nglan
d
Murray
Illawarr
a
Blue M
ounta
ins
Outbac
k
Capita
l Cou
ntry
Riverin
a
mill
ions
Domestic
Overseas
6. BOOSTING TOURISM (THROUGH SPORTING AND BUSINESS EVENTS) TO ATTRACT DOMESTIC TOURISTS AND HIGHER-SPENDING OVERSEAS TOURISTS (a)International and Domestic Tourist Expenditure Although the greatest proportion of expenditure in tourism is spending by domestic tourists, overseas tourists (individually) spend much more than their domestic counterparts. This can be seen in the graph below:

A World Game: Events and Tourism in NSW
11
International and Domestic Tourist Expenditure (per Tourist): 2007-200819
$0
$500
$1,000
$1,500
$2,000
$2,500
$3,000
$3,500
Overseas Tourists Domestic Tourists
(b) Previous Measures by Other State Governments to Boost Tourism by Attracting Events: 1980s and 1990s During the 1980s and the 1990s, state governments came to the conclusion that attracting major events would provide a boost to tourism and, in particular, could prove instrumental in attracting higher-spending overseas tourists. In 1986 the Western Australian government (led by Brian Burke) established EventsCorp (to capitalise on the staging of the Americas Cup). Three years later the Ahern government, in Queensland, created the Queensland Events Corporation (to take advantage of the 1988 World Expo). In 1992 the then premier of Victoria (Jeff Kennett) established the Victorian Major Events Company.20 (c)NSW State Government’s Initiatives to Attract Major Events In 1969, the Askin government established the Sydney Convention and Visitors Bureau (SCVB) as a (not-for-profit) joint venture between the state government and the tourism industry in New South Wales. The purpose of the SCVB was to identify, and secure bids for, business events to be held in Sydney. Currently the SCVB has a membership base of more than 300 providers of convention centres, exhibition venues, hotels, restaurants and the like.21
19 Derived from the expenditure figures on p.2 above.
20 Robyn Stokes, Inter-Organisational Relationships for Events Tourism Strategy Making in Australian States and Territories (PhD Thesis, Griffith University, 2003), pp.25-28.
21 John O’Neill, Review into a Possible Events Corporation for New South Wales (Sydney, 2007), p.30.
A World Game: Events and Tourism in NSW
12
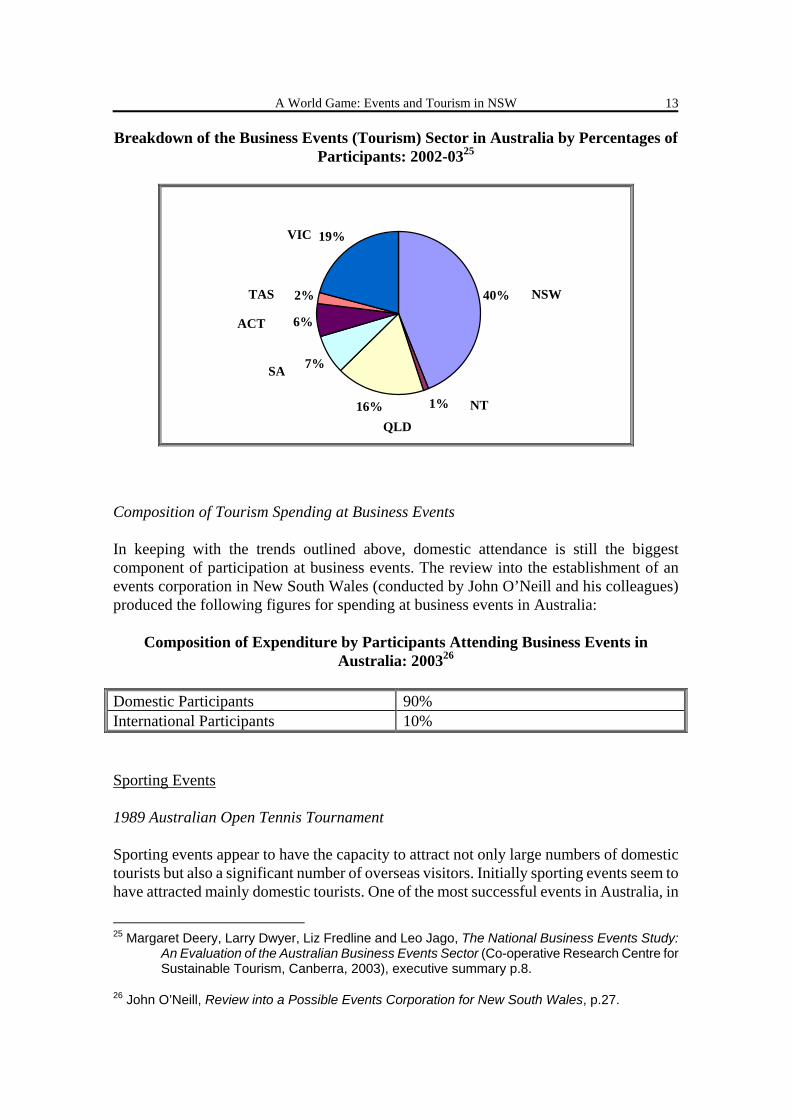
1n 1993 (one year after Jeff Kennett established the Victorian Major Events Company) the premier of New South Wales (John Fahey) established Special Events NSW Limited. A year after gaining office (in the 1995 elections), the Carr government (in New South Wales) decided to abolish Special Events NSW Limited. However the same government subsequently proceeded to establish a Major Events Unit within Tourism NSW (the state’s tourism body). In 1997, however, the Carr government set up a Major Sporting Events Unit within the premier’s department.22 Between 1999 and 2000, Tourism NSW supported 23 major events including the Bledisloe Cup and the Greg Norman International golf tournament.23 In 2000 (the year that the Olympic Games were held in Sydney), the Carr government replaced the Major Sporting Events Unit with a New South Wales Major Events Board: to be supported by the Major Events Unit in Tourism NSW. In financial year 2006-07 the Major Events Unit had a budget of $6.4 million.24 (d)Contribution of Events in Attracting Domestic and Overseas Tourists Business Events As well as sporting events having the capacity to attract tourists, many visitors travel to destinations for business events: conferences and meetings. In the early years of the this century, New South Wales had the major share of business events tourism as illustrated in the accompanying chart:
22 John O’Neill, Review into a Possible Events Corporation for New South Wales, pp.15,57.
23 Tourism NSW, Chairman’s Report to the Minister for Tourism: Activities and Achievements of Tourism New South Wales 1995-1998 (Tourism NSW, Sydney, 1999), pp.6-7.
24 John O’Neill, Review into a Possible Events Corporation for New South Wales (Sydney, 2007), pp.15-16,57.
A World Game: Events and Tourism in NSW
13
Breakdown of the Business Events (Tourism) Sector in Australia by Percentages of Participants: 2002-0325
40%
1%16%
7%
6%
2%
19%
NSW
NTQLD
SA
ACT
TAS
VIC
Composition of Tourism Spending at Business Events In keeping with the trends outlined above, domestic attendance is still the biggest component of participation at business events. The review into the establishment of an events corporation in New South Wales (conducted by John O’Neill and his colleagues) produced the following figures for spending at business events in Australia:
Composition of Expenditure by Participants Attending Business Events in Australia: 200326
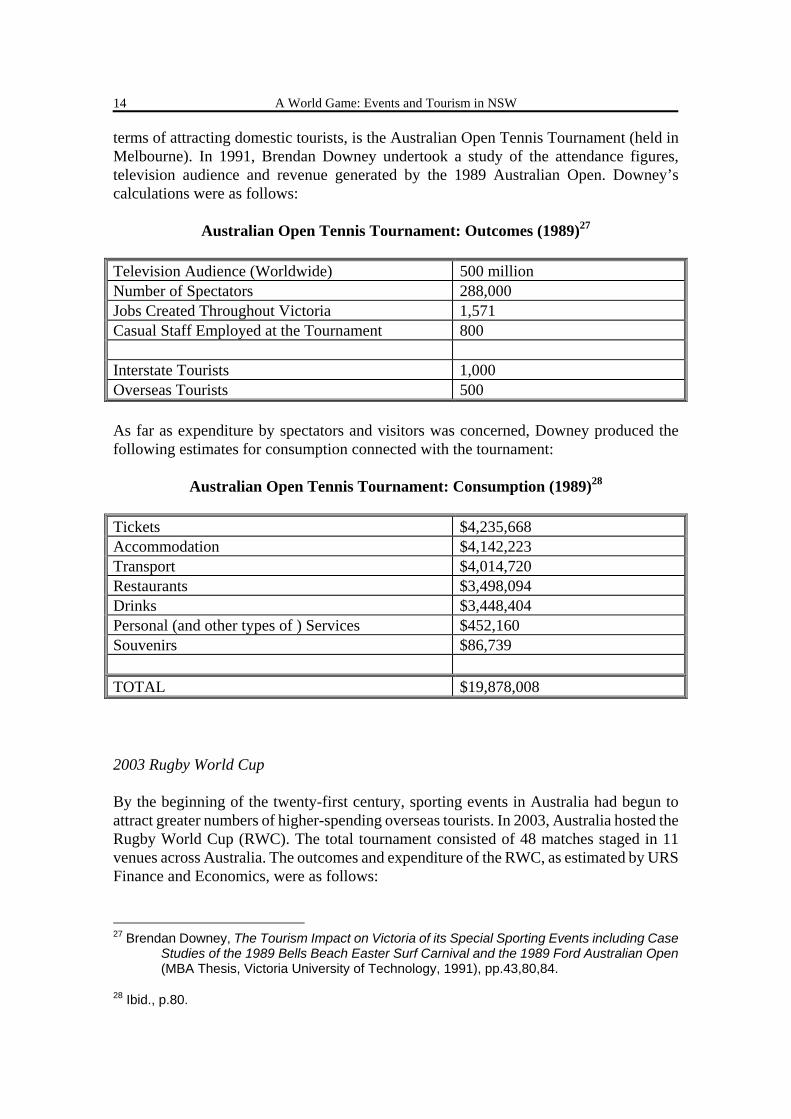
Domestic Participants 90% International Participants 10% Sporting Events 1989 Australian Open Tennis Tournament Sporting events appear to have the capacity to attract not only large numbers of domestic tourists but also a significant number of overseas visitors. Initially sporting events seem to have attracted mainly domestic tourists. One of the most successful events in Australia, in
25 Margaret Deery, Larry Dwyer, Liz Fredline and Leo Jago, The National Business Events Study:
An Evaluation of the Australian Business Events Sector (Co-operative Research Centre for Sustainable Tourism, Canberra, 2003), executive summary p.8.
26 John O’Neill, Review into a Possible Events Corporation for New South Wales, p.27.
A World Game: Events and Tourism in NSW
14
terms of attracting domestic tourists, is the Australian Open Tennis Tournament (held in Melbourne). In 1991, Brendan Downey undertook a study of the attendance figures, television audience and revenue generated by the 1989 Australian Open. Downey’s calculations were as follows:
Australian Open Tennis Tournament: Outcomes (1989)27 Television Audience (Worldwide) 500 million Number of Spectators 288,000 Jobs Created Throughout Victoria 1,571 Casual Staff Employed at the Tournament 800 Interstate Tourists 1,000 Overseas Tourists 500 As far as expenditure by spectators and visitors was concerned, Downey produced the following estimates for consumption connected with the tournament:
Australian Open Tennis Tournament: Consumption (1989)28 Tickets $4,235,668 Accommodation $4,142,223 Transport $4,014,720 Restaurants $3,498,094 Drinks $3,448,404 Personal (and other types of ) Services $452,160 Souvenirs $86,739 TOTAL $19,878,008 2003 Rugby World Cup By the beginning of the twenty-first century, sporting events in Australia had begun to attract greater numbers of higher-spending overseas tourists. In 2003, Australia hosted the Rugby World Cup (RWC). The total tournament consisted of 48 matches staged in 11 venues across Australia. The outcomes and expenditure of the RWC, as estimated by URS Finance and Economics, were as follows:
27 Brendan Downey, The Tourism Impact on Victoria of its Special Sporting Events including Case
Studies of the 1989 Bells Beach Easter Surf Carnival and the 1989 Ford Australian Open (MBA Thesis, Victoria University of Technology, 1991), pp.43,80,84.
28 Ibid., p.80.
A World Game: Events and Tourism in NSW
15
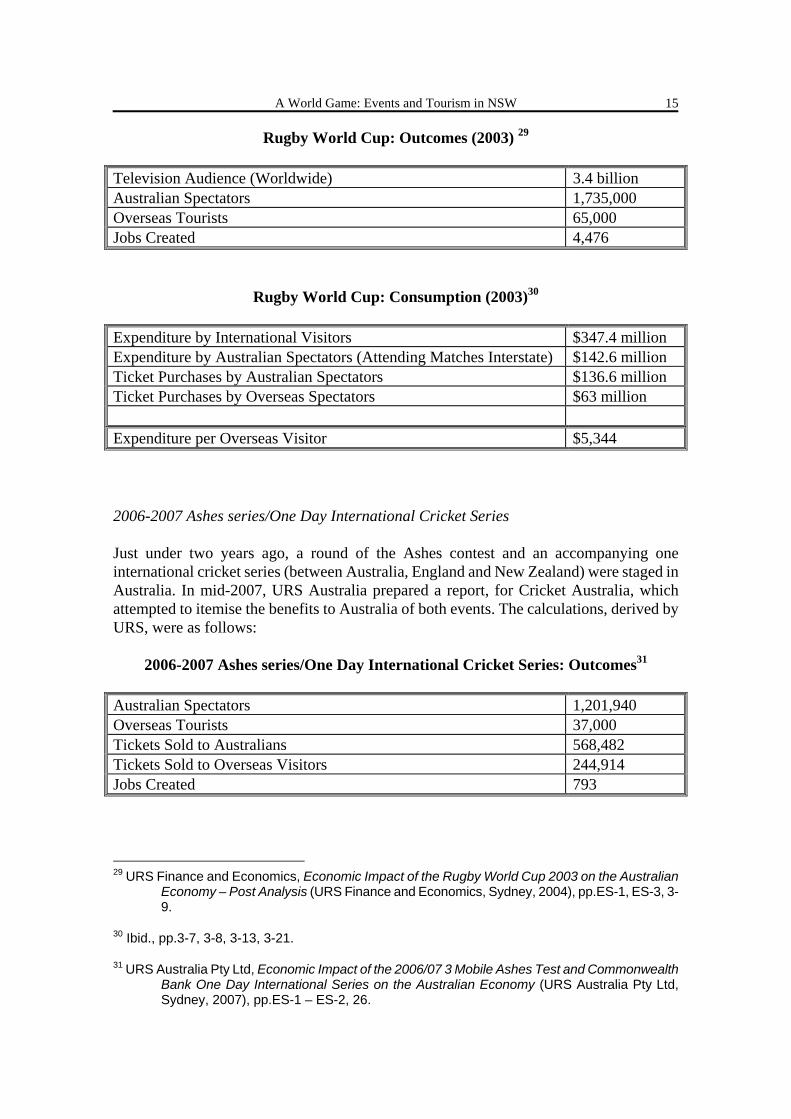
Rugby World Cup: Outcomes (2003) 29 Television Audience (Worldwide) 3.4 billion Australian Spectators 1,735,000 Overseas Tourists 65,000 Jobs Created 4,476
Rugby World Cup: Consumption (2003)30 Expenditure by International Visitors $347.4 million Expenditure by Australian Spectators (Attending Matches Interstate) $142.6 million Ticket Purchases by Australian Spectators $136.6 million Ticket Purchases by Overseas Spectators $63 million Expenditure per Overseas Visitor $5,344 2006-2007 Ashes series/One Day International Cricket Series Just under two years ago, a round of the Ashes contest and an accompanying one international cricket series (between Australia, England and New Zealand) were staged in Australia. In mid-2007, URS Australia prepared a report, for Cricket Australia, which attempted to itemise the benefits to Australia of both events. The calculations, derived by URS, were as follows:
2006-2007 Ashes series/One Day International Cricket Series: Outcomes31 Australian Spectators 1,201,940 Overseas Tourists 37,000 Tickets Sold to Australians 568,482 Tickets Sold to Overseas Visitors 244,914 Jobs Created 793
29 URS Finance and Economics, Economic Impact of the Rugby World Cup 2003 on the Australian
Economy – Post Analysis (URS Finance and Economics, Sydney, 2004), pp.ES-1, ES-3, 3-9.
30 Ibid., pp.3-7, 3-8, 3-13, 3-21.
31 URS Australia Pty Ltd, Economic Impact of the 2006/07 3 Mobile Ashes Test and Commonwealth Bank One Day International Series on the Australian Economy (URS Australia Pty Ltd, Sydney, 2007), pp.ES-1 – ES-2, 26.
A World Game: Events and Tourism in NSW
16
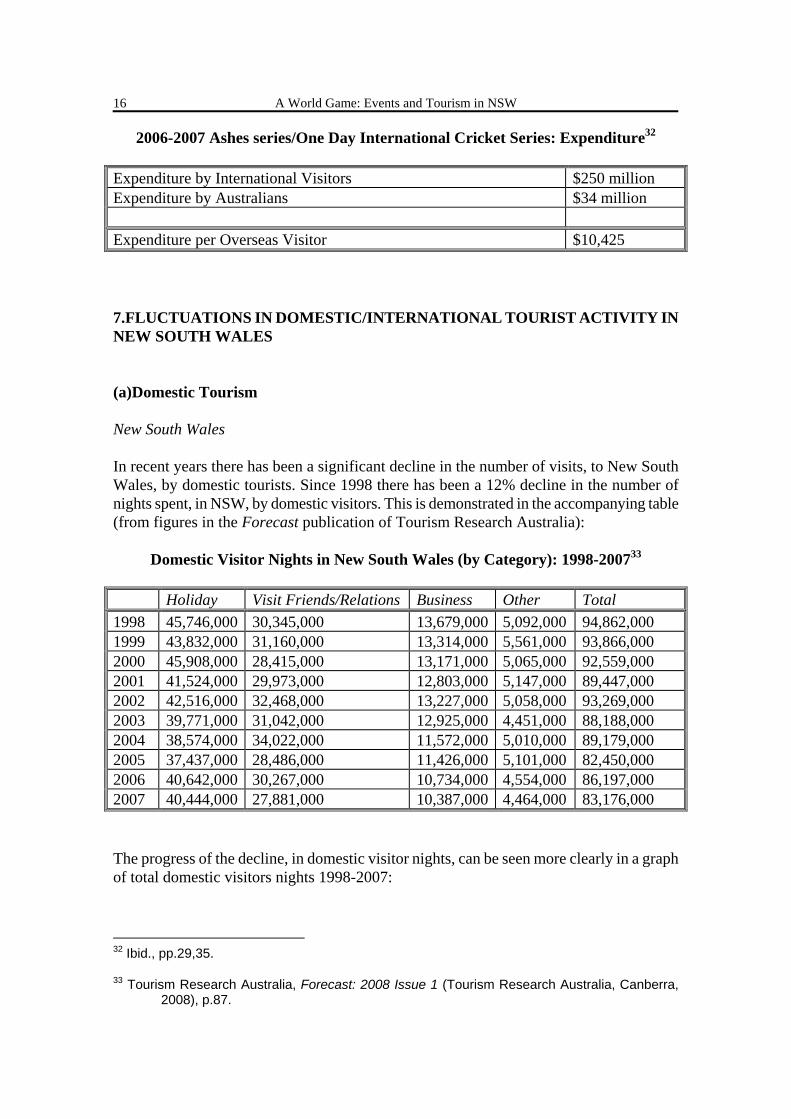
2006-2007 Ashes series/One Day International Cricket Series: Expenditure32 Expenditure by International Visitors $250 million Expenditure by Australians $34 million Expenditure per Overseas Visitor $10,425 7.FLUCTUATIONS IN DOMESTIC/INTERNATIONAL TOURIST ACTIVITY IN NEW SOUTH WALES (a)Domestic Tourism New South Wales In recent years there has been a significant decline in the number of visits, to New South Wales, by domestic tourists. Since 1998 there has been a 12% decline in the number of nights spent, in NSW, by domestic visitors. This is demonstrated in the accompanying table (from figures in the Forecast publication of Tourism Research Australia):
Domestic Visitor Nights in New South Wales (by Category): 1998-200733 Holiday Visit Friends/Relations Business Other Total 1998 45,746,000 30,345,000 13,679,000 5,092,000 94,862,000 1999 43,832,000 31,160,000 13,314,000 5,561,000 93,866,000 2000 45,908,000 28,415,000 13,171,000 5,065,000 92,559,000 2001 41,524,000 29,973,000 12,803,000 5,147,000 89,447,000 2002 42,516,000 32,468,000 13,227,000 5,058,000 93,269,000 2003 39,771,000 31,042,000 12,925,000 4,451,000 88,188,000 2004 38,574,000 34,022,000 11,572,000 5,010,000 89,179,000 2005 37,437,000 28,486,000 11,426,000 5,101,000 82,450,000 2006 40,642,000 30,267,000 10,734,000 4,554,000 86,197,000 2007 40,444,000 27,881,000 10,387,000 4,464,000 83,176,000 The progress of the decline, in domestic visitor nights, can be seen more clearly in a graph of total domestic visitors nights 1998-2007:
32 Ibid., pp.29,35.
33 Tourism Research Australia, Forecast: 2008 Issue 1 (Tourism Research Australia, Canberra, 2008), p.87.
A World Game: Events and Tourism in NSW
17
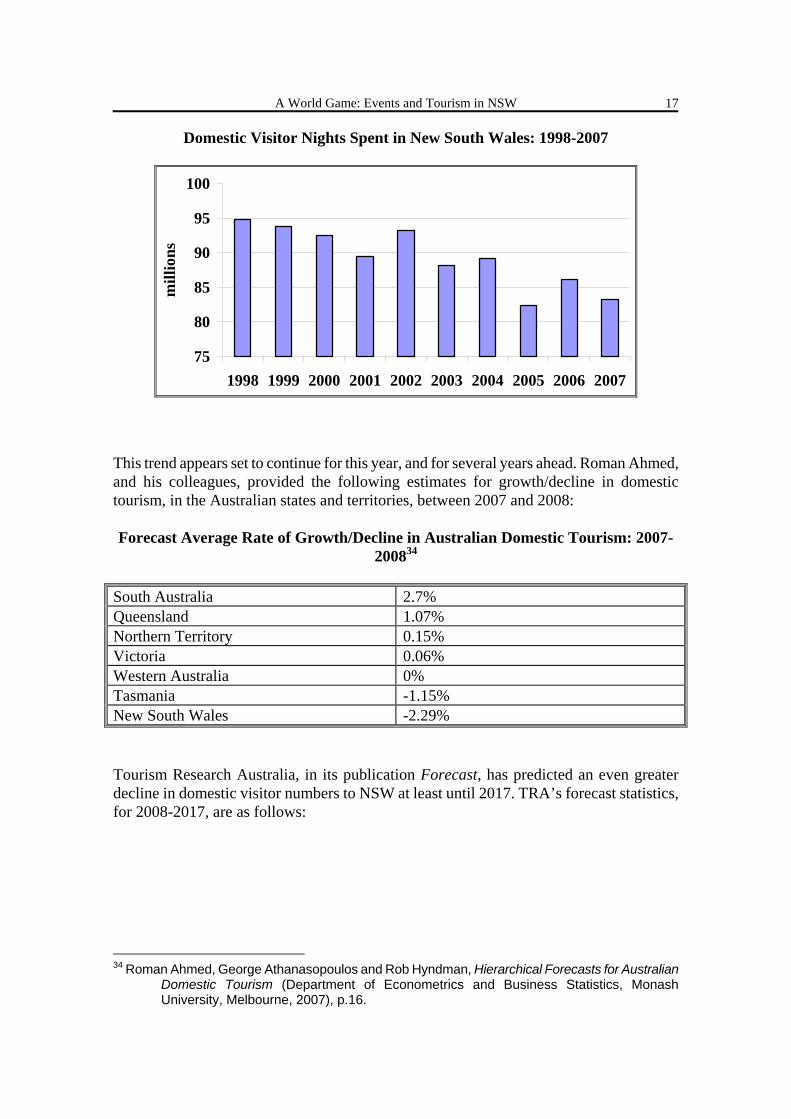
Domestic Visitor Nights Spent in New South Wales: 1998-2007
75
80
85
90
95
100
1998 1999 2000 2001 2002 2003 2004 2005 2006 2007
mill
ions
This trend appears set to continue for this year, and for several years ahead. Roman Ahmed, and his colleagues, provided the following estimates for growth/decline in domestic tourism, in the Australian states and territories, between 2007 and 2008: Forecast Average Rate of Growth/Decline in Australian Domestic Tourism: 2007-
200834 South Australia 2.7% Queensland 1.07% Northern Territory 0.15% Victoria 0.06% Western Australia 0% Tasmania -1.15% New South Wales -2.29% Tourism Research Australia, in its publication Forecast, has predicted an even greater decline in domestic visitor numbers to NSW at least until 2017. TRA’s forecast statistics, for 2008-2017, are as follows:
34 Roman Ahmed, George Athanasopoulos and Rob Hyndman, Hierarchical Forecasts for Australian
Domestic Tourism (Department of Econometrics and Business Statistics, Monash University, Melbourne, 2007), p.16.
A World Game: Events and Tourism in NSW
18
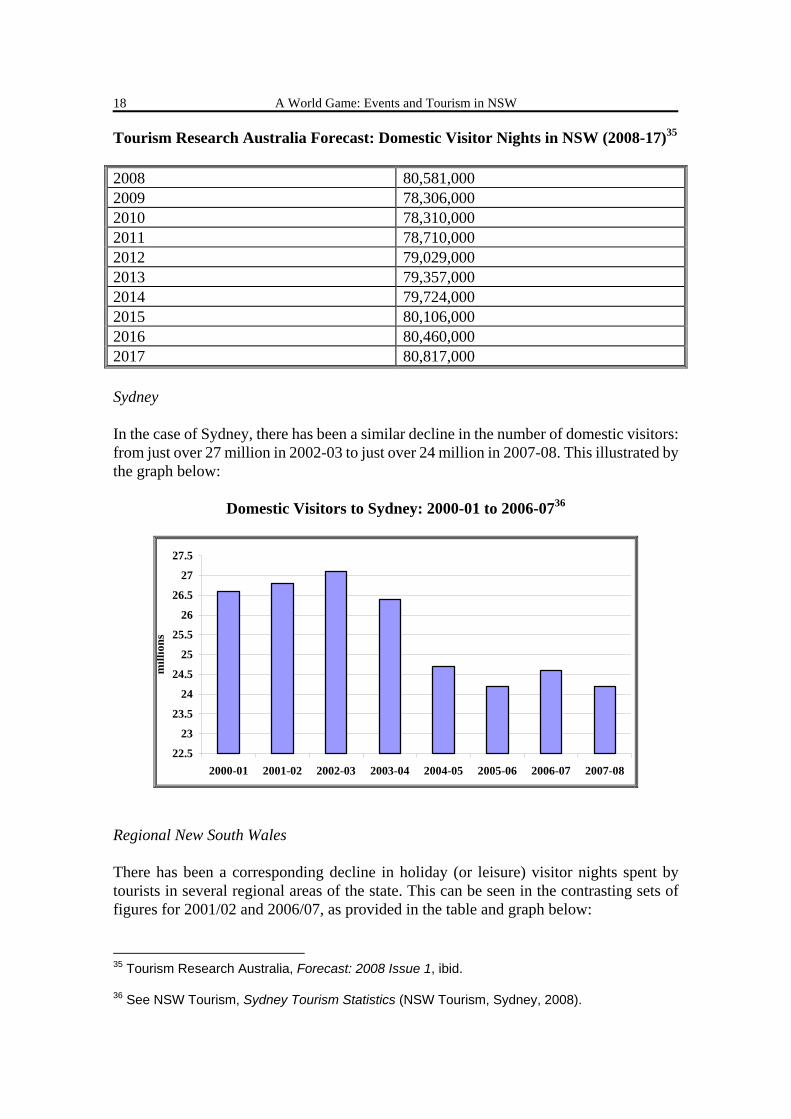
Tourism Research Australia Forecast: Domestic Visitor Nights in NSW (2008-17)35 2008 80,581,000 2009 78,306,000 2010 78,310,000 2011 78,710,000 2012 79,029,000 2013 79,357,000 2014 79,724,000 2015 80,106,000 2016 80,460,000 2017 80,817,000 Sydney In the case of Sydney, there has been a similar decline in the number of domestic visitors: from just over 27 million in 2002-03 to just over 24 million in 2007-08. This illustrated by the graph below:
Domestic Visitors to Sydney: 2000-01 to 2006-0736
22.5
23
23.5
24
24.5
25
25.5
26
26.5
27
27.5
2000-01 2001-02 2002-03 2003-04 2004-05 2005-06 2006-07 2007-08
mill
ions
Regional New South Wales There has been a corresponding decline in holiday (or leisure) visitor nights spent by tourists in several regional areas of the state. This can be seen in the contrasting sets of figures for 2001/02 and 2006/07, as provided in the table and graph below:
35 Tourism Research Australia, Forecast: 2008 Issue 1, ibid.
36 See NSW Tourism, Sydney Tourism Statistics (NSW Tourism, Sydney, 2008).
A World Game: Events and Tourism in NSW
19
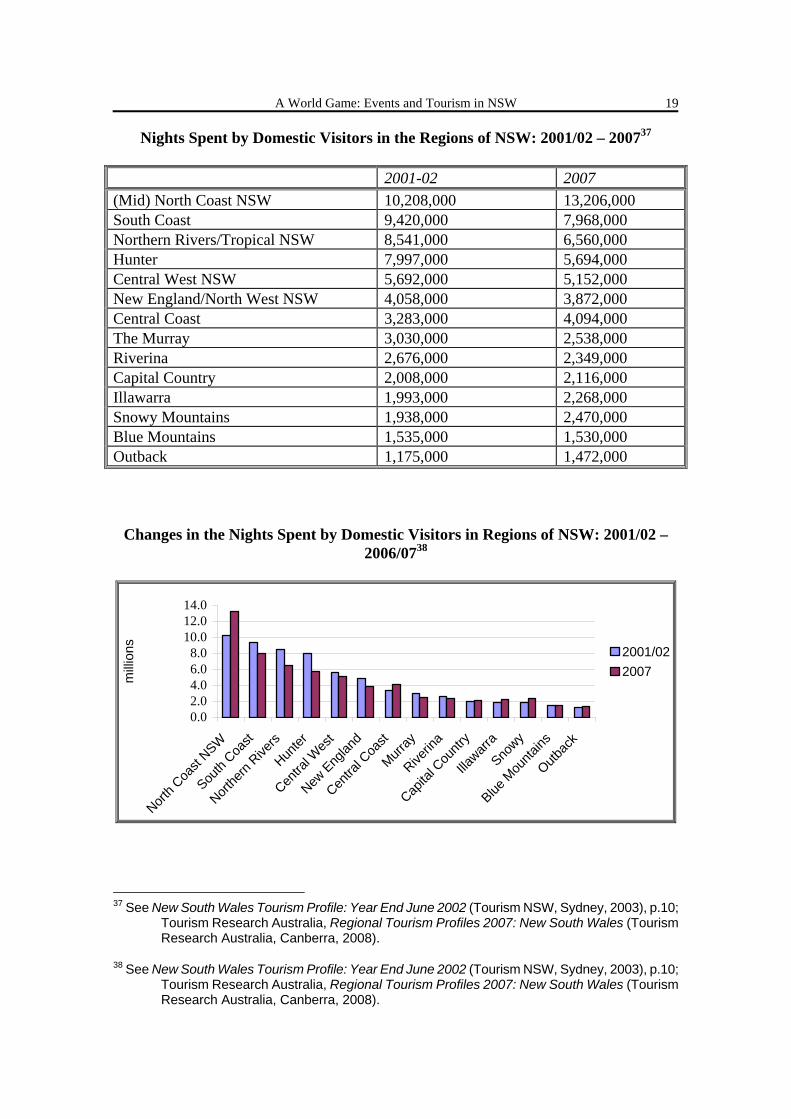
Nights Spent by Domestic Visitors in the Regions of NSW: 2001/02 – 200737 2001-02 2007 (Mid) North Coast NSW 10,208,000 13,206,000 South Coast 9,420,000 7,968,000 Northern Rivers/Tropical NSW 8,541,000 6,560,000 Hunter 7,997,000 5,694,000 Central West NSW 5,692,000 5,152,000 New England/North West NSW 4,058,000 3,872,000 Central Coast 3,283,000 4,094,000 The Murray 3,030,000 2,538,000 Riverina 2,676,000 2,349,000 Capital Country 2,008,000 2,116,000 Illawarra 1,993,000 2,268,000 Snowy Mountains 1,938,000 2,470,000 Blue Mountains 1,535,000 1,530,000 Outback 1,175,000 1,472,000
Changes in the Nights Spent by Domestic Visitors in Regions of NSW: 2001/02 – 2006/0738
0.02.04.06.08.0
10.012.014.0
North C
oast
NSW
South
Coast
Northe
rn Rive
rs
Hunter
Centra
l Wes
t
New Eng
land
Centra
l Coa
st
Murray
Riverin
a
Capita
l Cou
ntry
Illawarr
a
Snowy
Blue M
ounta
ins
Outbac
k
milli
ons
2001/022007
37 See New South Wales Tourism Profile: Year End June 2002 (Tourism NSW, Sydney, 2003), p.10;
Tourism Research Australia, Regional Tourism Profiles 2007: New South Wales (Tourism Research Australia, Canberra, 2008).
38 See New South Wales Tourism Profile: Year End June 2002 (Tourism NSW, Sydney, 2003), p.10; Tourism Research Australia, Regional Tourism Profiles 2007: New South Wales (Tourism Research Australia, Canberra, 2008).
A World Game: Events and Tourism in NSW
20
Domestic Tourists and Sports Events: NSW During the opening years of the twenty-first century there has been a noticeable decline in visitors attending major sports events in NSW, compared to an increase in people attending similar events in other states. This can be seen in the table below:
Growth Rate in Domestic Visitor Nights (Attendees at Major Sporting Events): NSW v. Rest of Australia (2002-06)39
Rest of Australia 5% New South Wales -1% Business Events in Sydney There has been a decline, of a similar nature, in the number of business events held in Sydney, as illustrated accordingly:
Business Association Meetings Held in Sydney: 2000/200440 2000 58 2004 34 (b)International Tourists Overall Decline in Australia’s Share of International Tourism Even though the number of overseas visitors to Australia has been increasing (after declining in temporarily 2003), Australia’s share of overseas travelers has been very gradually declining, as illustrated in the table below:
39 John O’Neill, Review into a Possible Events Corporation for New South Wales, p.18.
40 John O’Neill, Review into a Possible Events Corporation for New South Wales, p.34.
A World Game: Events and Tourism in NSW
21
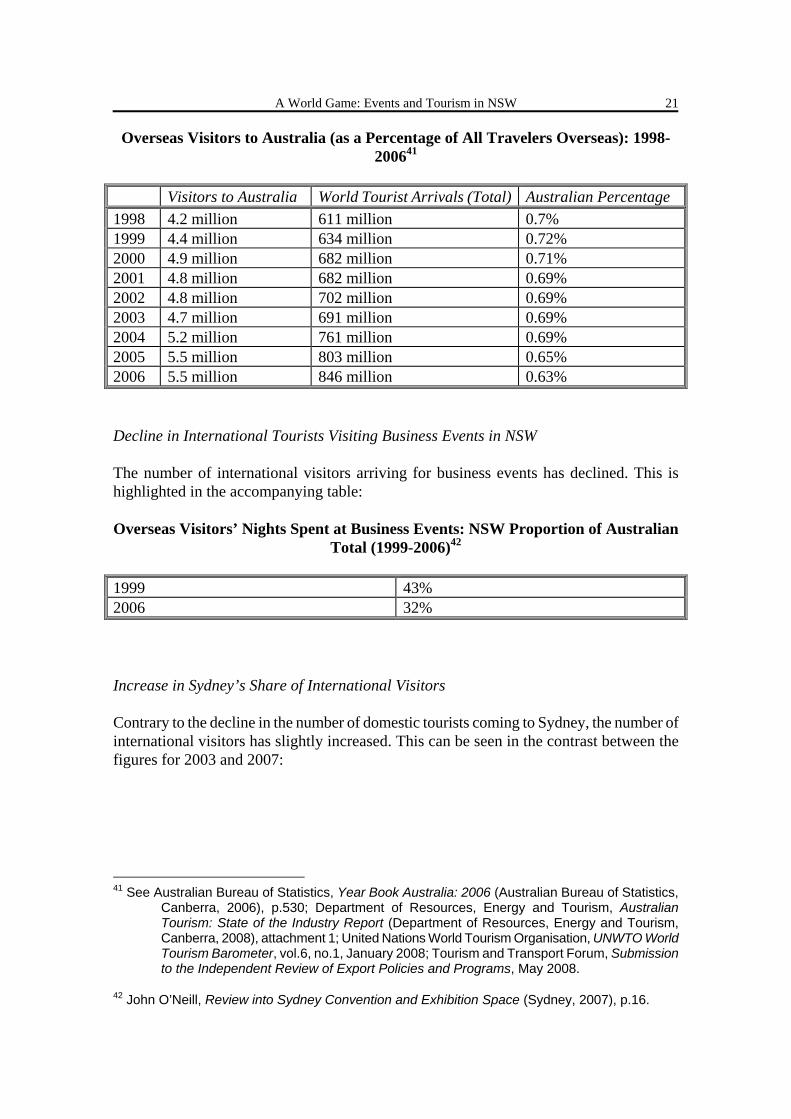
Overseas Visitors to Australia (as a Percentage of All Travelers Overseas): 1998-200641
Visitors to Australia World Tourist Arrivals (Total) Australian Percentage 1998 4.2 million 611 million 0.7% 1999 4.4 million 634 million 0.72% 2000 4.9 million 682 million 0.71% 2001 4.8 million 682 million 0.69% 2002 4.8 million 702 million 0.69% 2003 4.7 million 691 million 0.69% 2004 5.2 million 761 million 0.69% 2005 5.5 million 803 million 0.65% 2006 5.5 million 846 million 0.63% Decline in International Tourists Visiting Business Events in NSW The number of international visitors arriving for business events has declined. This is highlighted in the accompanying table: Overseas Visitors’ Nights Spent at Business Events: NSW Proportion of Australian
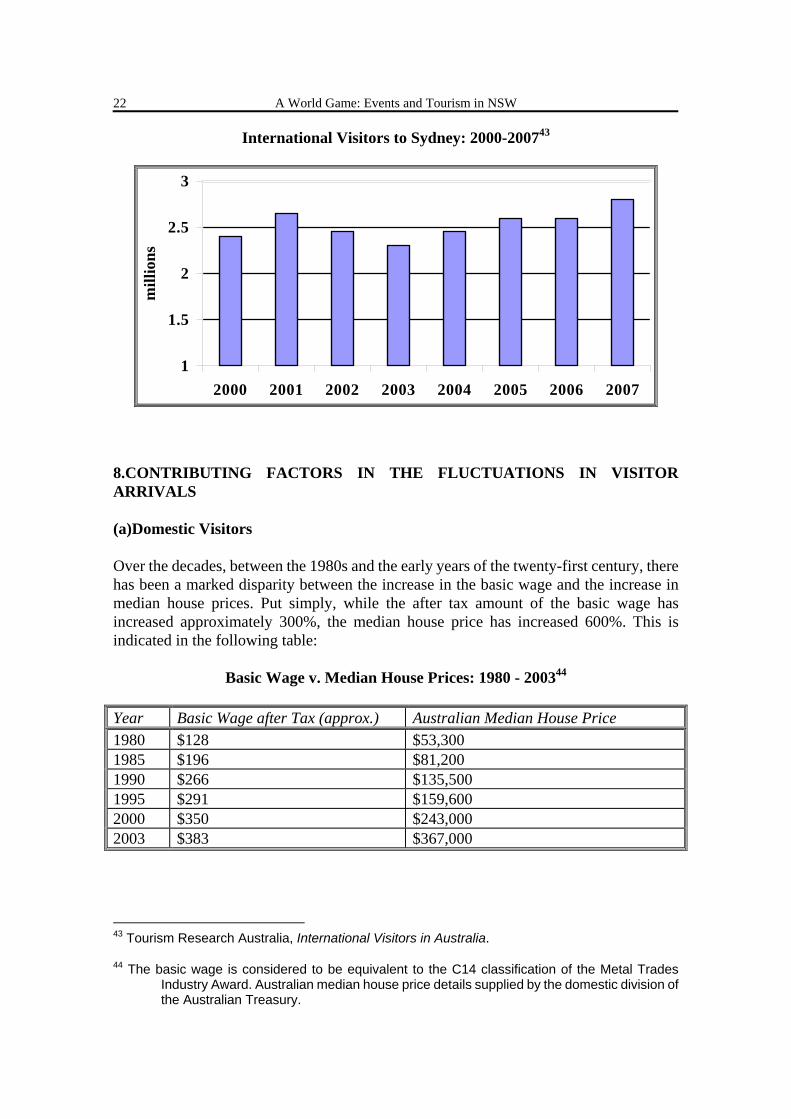
Total (1999-2006)42 1999 43% 2006 32% Increase in Sydney’s Share of International Visitors Contrary to the decline in the number of domestic tourists coming to Sydney, the number of international visitors has slightly increased. This can be seen in the contrast between the figures for 2003 and 2007:
41 See Australian Bureau of Statistics, Year Book Australia: 2006 (Australian Bureau of Statistics,
Canberra, 2006), p.530; Department of Resources, Energy and Tourism, Australian Tourism: State of the Industry Report (Department of Resources, Energy and Tourism, Canberra, 2008), attachment 1; United Nations World Tourism Organisation, UNWTO World Tourism Barometer, vol.6, no.1, January 2008; Tourism and Transport Forum, Submission to the Independent Review of Export Policies and Programs, May 2008.
42 John O’Neill, Review into Sydney Convention and Exhibition Space (Sydney, 2007), p.16.
A World Game: Events and Tourism in NSW
22
International Visitors to Sydney: 2000-200743
1
1.5
2
2.5
3
2000 2001 2002 2003 2004 2005 2006 2007
mill
ions
8.CONTRIBUTING FACTORS IN THE FLUCTUATIONS IN VISITOR ARRIVALS (a)Domestic Visitors Over the decades, between the 1980s and the early years of the twenty-first century, there has been a marked disparity between the increase in the basic wage and the increase in median house prices. Put simply, while the after tax amount of the basic wage has increased approximately 300%, the median house price has increased 600%. This is indicated in the following table:
Basic Wage v. Median House Prices: 1980 - 200344 Year Basic Wage after Tax (approx.) Australian Median House Price 1980 $128 $53,300 1985 $196 $81,200 1990 $266 $135,500 1995 $291 $159,600 2000 $350 $243,000 2003 $383 $367,000
43 Tourism Research Australia, International Visitors in Australia.
44 The basic wage is considered to be equivalent to the C14 classification of the Metal Trades Industry Award. Australian median house price details supplied by the domestic division of the Australian Treasury.
A World Game: Events and Tourism in NSW
23
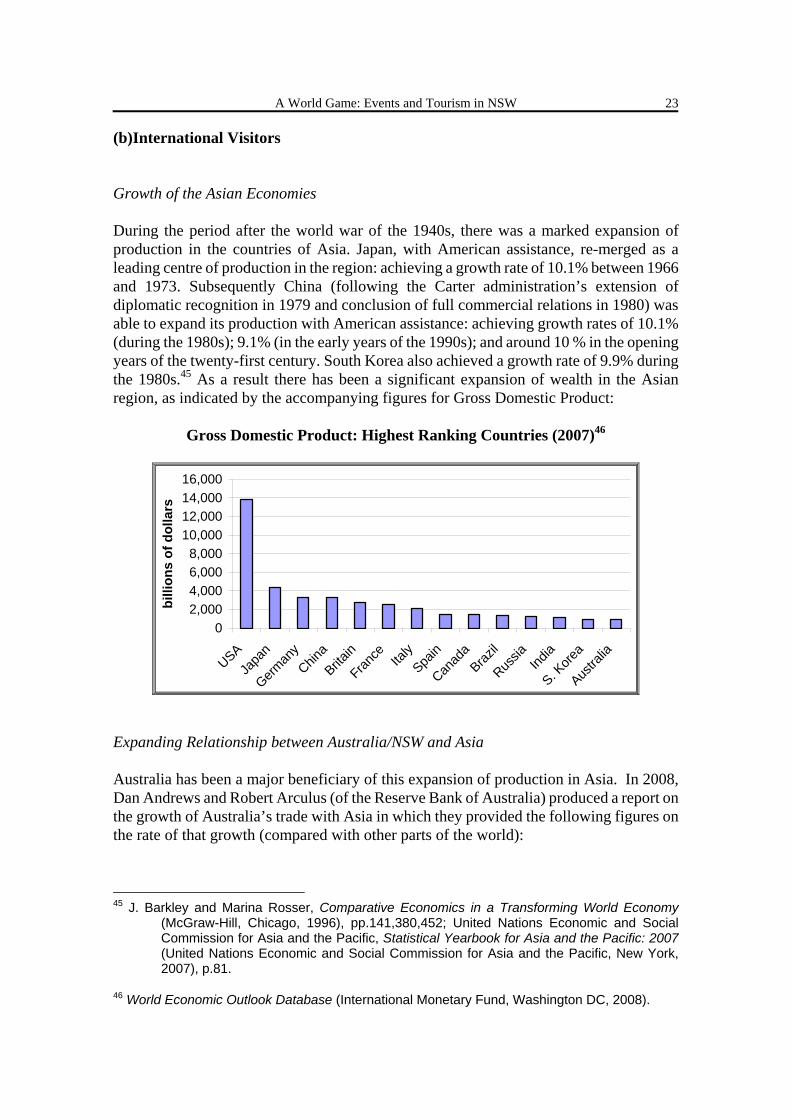
(b)International Visitors Growth of the Asian Economies During the period after the world war of the 1940s, there was a marked expansion of production in the countries of Asia. Japan, with American assistance, re-merged as a leading centre of production in the region: achieving a growth rate of 10.1% between 1966 and 1973. Subsequently China (following the Carter administration’s extension of diplomatic recognition in 1979 and conclusion of full commercial relations in 1980) was able to expand its production with American assistance: achieving growth rates of 10.1% (during the 1980s); 9.1% (in the early years of the 1990s); and around 10 % in the opening years of the twenty-first century. South Korea also achieved a growth rate of 9.9% during the 1980s.45 As a result there has been a significant expansion of wealth in the Asian region, as indicated by the accompanying figures for Gross Domestic Product:
Gross Domestic Product: Highest Ranking Countries (2007)46
02,0004,0006,0008,000
10,00012,00014,00016,000
USAJa
pan
German
yChin
aBrita
in
France Ita
lySpa
in
Canad
aBraz
il
Russia Ind
ia
S. Kore
a
Austra
lia
billi
ons
of d
olla
rs
Expanding Relationship between Australia/NSW and Asia Australia has been a major beneficiary of this expansion of production in Asia. In 2008, Dan Andrews and Robert Arculus (of the Reserve Bank of Australia) produced a report on the growth of Australia’s trade with Asia in which they provided the following figures on the rate of that growth (compared with other parts of the world):
45 J. Barkley and Marina Rosser, Comparative Economics in a Transforming World Economy
(McGraw-Hill, Chicago, 1996), pp.141,380,452; United Nations Economic and Social Commission for Asia and the Pacific, Statistical Yearbook for Asia and the Pacific: 2007 (United Nations Economic and Social Commission for Asia and the Pacific, New York, 2007), p.81.
46 World Economic Outlook Database (International Monetary Fund, Washington DC, 2008).
A World Game: Events and Tourism in NSW
24
Australian Exports of Goods and Services by Destination (Average Annual Growth): 1999-200747
Country Rate of Growth China 24.8% India 24.7% South Korea 10.5% Japan 7.1% Britain 6.5% USA 2.5% NSW, similarly, now has a strong trade relationship with Asia. The proportion of exports going to Asia, from New South Wales, is around 70% as highlighted by the following statistics:
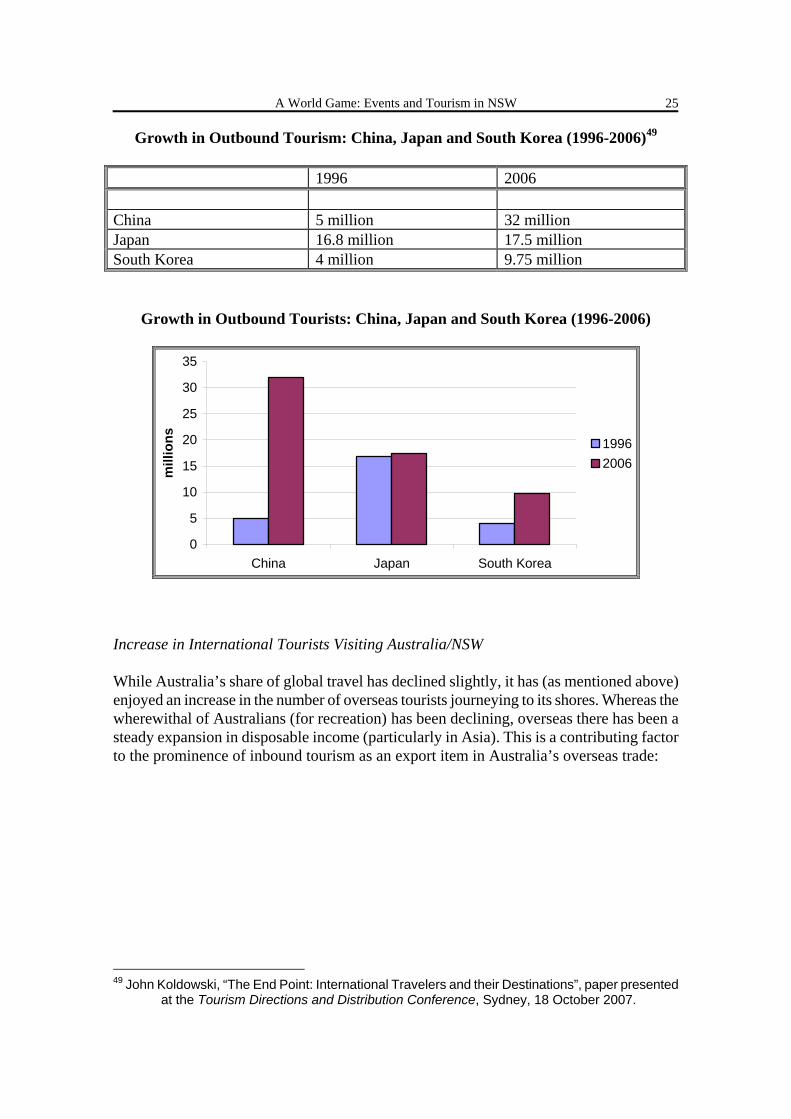
NSW Exports of Goods and Services by Region: 2002/03 – 2006/0748 Asia-Pacific (incl.China/Japan) Asia (excl. China/Japan) USA EU 2002-03 58.1% 12.9% 10.6% 9.5% 2003-04 59.3% 12% 10.9% 9% 2004-05 60.2% 12.7% 9.5% 8.1% 2005-06 59.7% 12.2% 9.4% 7.6% 2006-07 59.5% 11.8% 8.6% 7.3% Expansion of Asian Tourism With the expansion of wealth in the Asian region, there has been a significant growth in the number of people, from Asian countries, visiting other parts of the world. This can be seen in the accompanying table and graph:
47 Dan Andrews and Robert Arculus, “Australian Exports and Developing Asia” in the Reserve Bank
of Australia: Bulletin, June 2008, p.7.
48 Department of State and Regional Development, Export Markets by Region (Department of State and Regional Development, Sydney, 2008).
A World Game: Events and Tourism in NSW
25
Growth in Outbound Tourism: China, Japan and South Korea (1996-2006)49 1996 2006 China 5 million 32 million Japan 16.8 million 17.5 million South Korea 4 million 9.75 million
Growth in Outbound Tourists: China, Japan and South Korea (1996-2006)
0
5
10
15
20
25
30
35
China Japan South Korea
mill
ions 1996
2006
Increase in International Tourists Visiting Australia/NSW While Australia’s share of global travel has declined slightly, it has (as mentioned above) enjoyed an increase in the number of overseas tourists journeying to its shores. Whereas the wherewithal of Australians (for recreation) has been declining, overseas there has been a steady expansion in disposable income (particularly in Asia). This is a contributing factor to the prominence of inbound tourism as an export item in Australia’s overseas trade:
49 John Koldowski, “The End Point: International Travelers and their Destinations”, paper presented
at the Tourism Directions and Distribution Conference, Sydney, 18 October 2007.
A World Game: Events and Tourism in NSW
26
Australia’s Major Export Items (Goods and Services): 200750 Coal $20.7 billion Iron Ore $16.1 billion Education Services $12.5 billion Personal Travel Services $11.8 billion Non-Monetary Gold $11.5 billion Crude Petroleum $7.9 billion Aluminium Ores (including Alumina) $6 billion Aluminium $5.8 billion Professional, Technical and other Business Services $5.6 billion Gas (natural) $5 billion TOTAL ALL EXPORTS OF GOODS AND SERVICES $216.2 billion Tourism is also a significant component of the exports of New South Wales. In financial year 2006-07, tourism formed 9% of the state’s exports, as indicated in the following table:
NSW – Major Exports: 2006-0751 Elaborately Transformed Manufactures $7.9 billion Other Services $6.2 billion Fuels $6.2 billion Education-Related Travel $4.3 billion Personal Travel $4.1 billion Simply Transformed Manufactures $3.6 billion Transportation $3.4 billion Processed Food $2.9 billion Minerals $2.5 billion Other Primary Products $1.9 billion TOTAL ALL NSW EXPORTS $47.2 billion
50 Market Information and Analysis Section, Department of Foreign Affairs and Trade, Composition
of Trade Australia: 2007 (Market Information and Analysis Section, Department of Foreign Affairs and Trade, Canberra, 2008), p.15.
51 Market Information and Analysis Section, Department of Foreign Affairs and Trade, Australia’s Trade by State and Territory: 2006-07 (Market Information and Analysis Section, Department of Foreign Affairs and Trade, Canberra, 2008), p.16.
A World Game: Events and Tourism in NSW
27
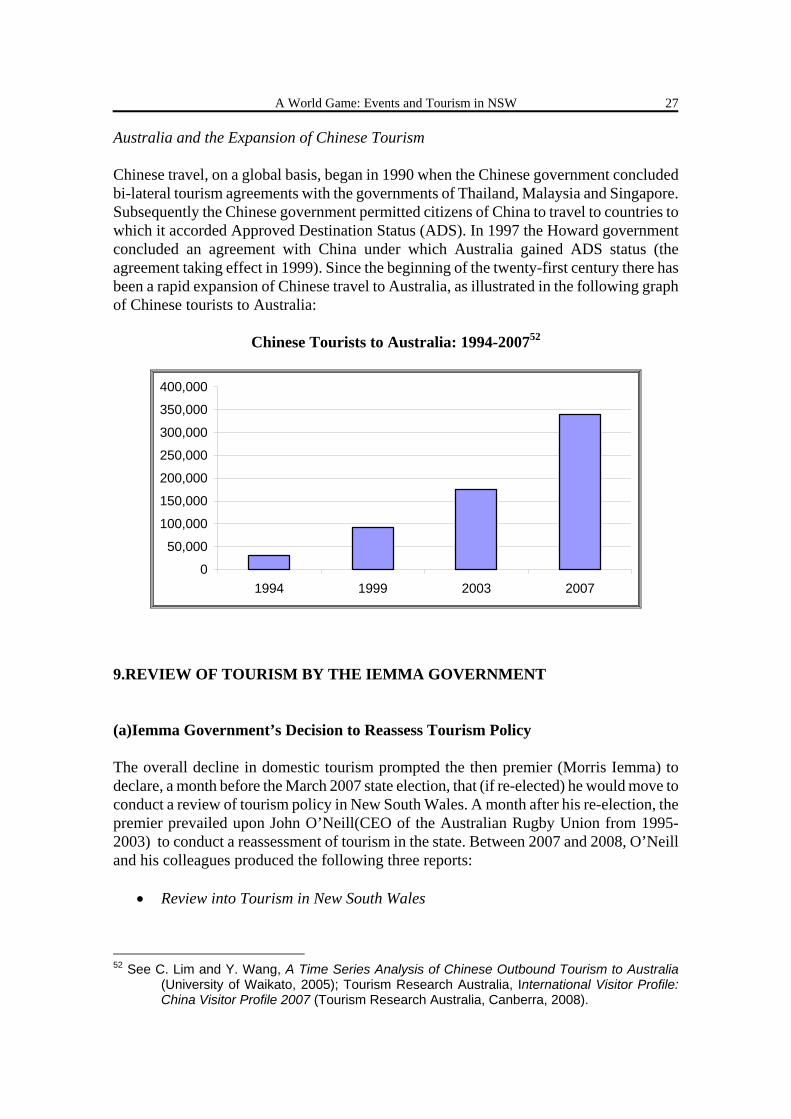
Australia and the Expansion of Chinese Tourism Chinese travel, on a global basis, began in 1990 when the Chinese government concluded bi-lateral tourism agreements with the governments of Thailand, Malaysia and Singapore. Subsequently the Chinese government permitted citizens of China to travel to countries to which it accorded Approved Destination Status (ADS). In 1997 the Howard government concluded an agreement with China under which Australia gained ADS status (the agreement taking effect in 1999). Since the beginning of the twenty-first century there has been a rapid expansion of Chinese travel to Australia, as illustrated in the following graph of Chinese tourists to Australia:
Chinese Tourists to Australia: 1994-200752
0
50,000
100,000
150,000
200,000
250,000
300,000
350,000
400,000
1994 1999 2003 2007
9.REVIEW OF TOURISM BY THE IEMMA GOVERNMENT (a)Iemma Government’s Decision to Reassess Tourism Policy The overall decline in domestic tourism prompted the then premier (Morris Iemma) to declare, a month before the March 2007 state election, that (if re-elected) he would move to conduct a review of tourism policy in New South Wales. A month after his re-election, the premier prevailed upon John O’Neill(CEO of the Australian Rugby Union from 1995-2003) to conduct a reassessment of tourism in the state. Between 2007 and 2008, O’Neill and his colleagues produced the following three reports:
• Review into Tourism in New South Wales
52 See C. Lim and Y. Wang, A Time Series Analysis of Chinese Outbound Tourism to Australia
(University of Waikato, 2005); Tourism Research Australia, International Visitor Profile: China Visitor Profile 2007 (Tourism Research Australia, Canberra, 2008).
A World Game: Events and Tourism in NSW
28
• Review into A Possible Events Corporation for New South Wales
• Review into Sydney Convention and Exhibition Space (b)Recommendations of the O’Neill Reports Review into Tourism in New South Wales The recommendations, in John O’Neill’s report into tourism in NSW, were divided into “Near-Medium Term” and “Medium-Long Term” categories. The two sets of recommendations were as follows: Near-Medium Term
• Maintain New South Wales’ share of visitor nights in Australia at the 2006-07 level
• Responsibility for promoting tourism in the regions to be given to existing Regional Tourism Organisations (RTOs) – with the provision of government funding to RTOs to be based on their performance in increasing visitor nights53
• Core Central Functions to be Strengthened (including the implementation of a
tourism-friendly aviation plan for the state, and an expanded international presence for Tourism NSW)
• Supportive Regulatory Regime (including engaging with the department of
planning to encourage the expansion of tourist accommodation in the Sydney CBD)
• Active Encouragement of the Opening of State Assets (including engaging with the National Parks and Wildlife Service to increase visits to state government parks and reserves)
• Increasing the Number of Education Visitors to NSW (including engaging with the
department of education to attract even more international students to its facilities)
• Formation of a “Brand Sydney” Organisation (to be inaugurated as a joint vehicle, for relevant government and business organisations, in the promotion of Sydney nationally and internationally)
53 Regional Tourism Organisations, in NSW, were established by the Wran government in 1985.
See John Jenkins, “The Dynamics of Regional Tourism Organisations in New South Wales, Australia: History, Structures and Operations” in Current Issues in Tourism, vol.3, no.3, 2000, p.189.
A World Game: Events and Tourism in NSW
29
Medium-Long Term
• Developing Sydney (and Contingent Areas) as an Attractive Destination for Interstate and Overseas Visitors (including developing rapid transport links to Newcastle)
• Providing (via the NSW and federal governments) Financial Assistance to Ventures
that Develop Tourism in Regional NSW54 Review into A Possible Events Corporation for New South Wales John O’Neill’s report, into the issue of establishing an events corporation in NSW, advised that the “shortcomings in acquiring events and benefiting from them” could be overcome through the combination of:
• Establishment of an Events Corporation
• A Substantial Increase in Funding (for the Corporation)
• The Corporation to Focus on Attracting Business, Sporting, Cultural and other Events to NSW
• Support, for the Corporation, to be Drawn from the Highest Levels of Government
• Maintenance of the Existing OPSE (Office of Protocol and Special Events), within
the Department of Premier and Cabinet, to Provide Co-ordination of the Government Services Needed to Facilitate Significant Events55
Review into Sydney Convention and Exhibition Space O’Neill’s review, into Sydney Convention and Exhibition Space, contained three significant recommendations:
• The Sydney Convention and Exhibition Centre (SCEC) to maintain its purpose of maximizing the economic and strategic benefits that New South Wales can attain from hosting particular business events
• The development of a facility (outside the Sydney CBD) larger than the current
SCEC
54 John O’Neill, Review into Tourism: Final Report, pp.93,95,108,113,116,118,120,122,125.
55 John O’Neill, Review into a Possible Events Corporation for New South Wales, p.3.
A World Game: Events and Tourism in NSW
30
• Expansion of Sydney CBD Convention and Exhibition Facilities (to facilitate the proposed intended increase in the number of international business events to be held in Sydney)56
10.NSW GOVERNMENT RESPONSES TO THE O’NEILL REPORT (a)New Funding In his mini-budget of 11 November 2008, Nathan Rees (who succeeded Morris Iemma as premier in the previous September) announced a series of new funding initiatives for tourism in the state. A total of $40 million has been allocated for tourism, over the next three and a half years, to be spent in the areas such as the following:
• $10.5 million for Regional Tourism Organisations (to assist them with developing further links with industry, and to develop their capacities for marketing)
• $13.25 million (out of the remaining $29.5 million) to be spent on developing an
increased presence (for New South Wales) in China, India and Korea
• $½ million to develop a Brand Sydney57 (b) New Events in NSW On 16 October 2008, Events NSW announced the launch of three new seasons of events in Sydney during 2009. The three would be as follows: Vivacity - A season of events incorporating Sydney’s New Year’s Eve Fireworks, the Sydney Festival, the New Year Cricket Test and Chinese New Year Vivid Sydney – a mid-year festival of presentations in visual art, performance and film Crave Sydney – a Spring festival of culture, food and wine (c)Sydney Convention and Exhibition Space In the mini-budget (produced by the current Rees government) John O’Neill’s proposals, regarding extra convention and exhibition space in Sydney, appear to have been postponed. According to Julian Lee, writing in the Sydney Morning Herald, “The proposal. . .to spend
56 John O’Neill, Review into Sydney Convention and Exhibition Space, pp.40-41.
57 Media Release. Jodi McKay (NSW Minister for Tourism). 11 November 2008, $40 million Package Launches New Era of Tourism Growth.
A World Game: Events and Tourism in NSW
31
$180 million transforming the showground [at Homebush Bay] into a venue for public and trade exhibitions was rejected in Tuesday’s mini-budget.”58 (d)World Cup Bid In August 2002, during the course of a visit to Australia by Sepp Blatter (president of the Federation of International Football Federations or FIFA), the then premier of NSW (Bob Carr) held a joint press conference with the FIFA president to declare that (in conjunction with Victoria) NSW would work with the Football Federation of Australia (FFA) to help the latter present a bid to FIFA to host the 2014 World Cup.59 Despite the formation of an intergovernmental working party to assist the FFA in preparing a submission, the FFA did not proceed with a bid. In 2007, Brazil gained the rights to host the 2014 World Cup: no other country having put forward a bid. On 26 March 2008, at the conclusion of a meeting of the Council of Australia Governments (COAG), it was reported that the federal and state governments had decided to work with the Football Federation of Australia in supporting its bid to host the 2018 World Cup.60 On 12 October 2008 it was reported in the Sun Herald that Pricewaterhouse Coopers (PwC) had forwarded a report on the bid, to the federal treasury, in which it estimated that, if Australia’s bid was successful, the event would deliver a benefit of $5.4 billion to the Australian economy.61 Just over a week later it was reported, on ABC radio, that federal cabinet might consider renewing Australia’s bid for the World Cup.62 11.ASIAN FOOTBALL POPULARITY AND AUSTRALIA’S BID FOR THE WORLD CUP (a)The Development of Professional Football in Asia Of all the sports followed in Asia, football is pre-eminent. Professional football emerged in Asia from the 1980s onwards. The Korean Professional Football League was the first of its kind to develop in Asia: inaugurated in 1983. Ten years later the J-League was established in Japan and, in 1994, the Chinese Professional Football Association was established in China.63
58 See Julian Lee, “Poor Decisions Could Cost $200 million” in the Sydney Morning Herald, 13
November 2008, p.5.
59 See NSW Parliamentary Debates. Hansard. Legislative Assembly. 13 November 2002, p.6691.
60 Council of Australian Governments, conference communiqué, 26 March 2008.
61 Matthew Hall, “A Few Billion Reasons to Bid for the 2018 World Cup” in the Sun Herald, 12 October 2008, p.86.
62 See “Cabinet To Consider World Cup Bid”, 22 October 2008 at www.abc.net.au/news.
63See Chung Hongik, “Government Involvement in Football in Korea”, Sugimoto Atsuo, “School Sport, Physical Education and the Development of Football Culture in Japan” and Robin
A World Game: Events and Tourism in NSW
32
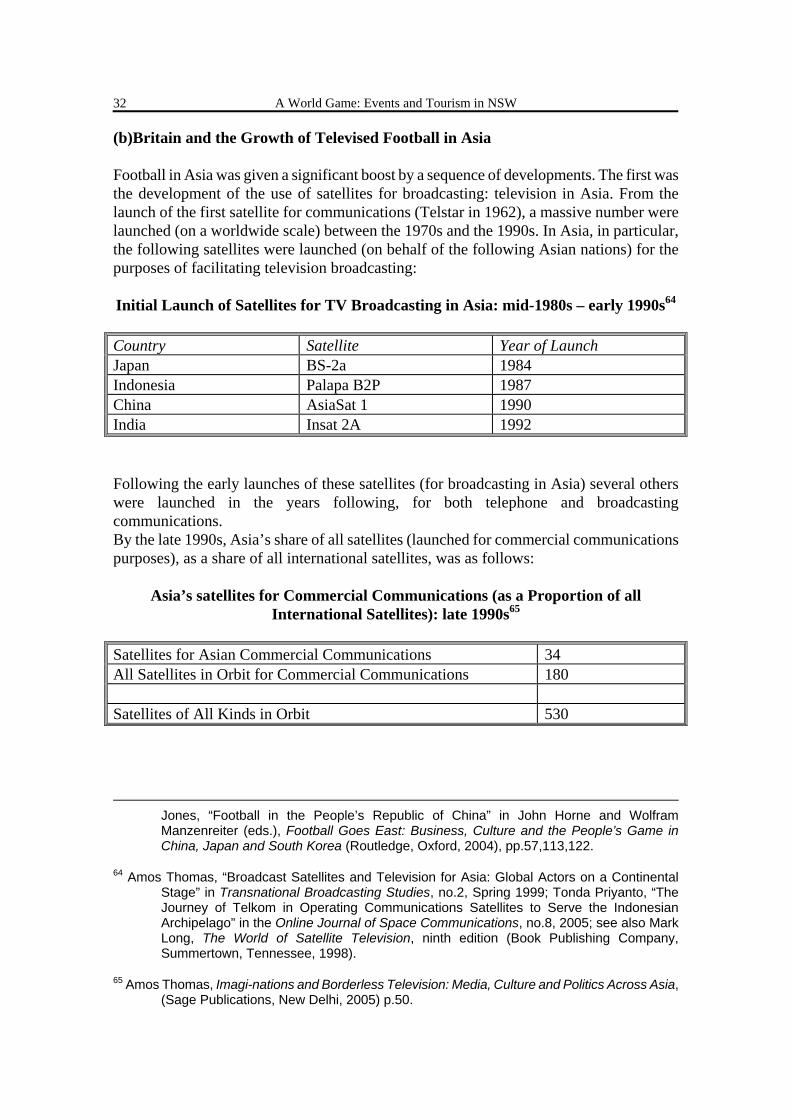
(b)Britain and the Growth of Televised Football in Asia Football in Asia was given a significant boost by a sequence of developments. The first was the development of the use of satellites for broadcasting: television in Asia. From the launch of the first satellite for communications (Telstar in 1962), a massive number were launched (on a worldwide scale) between the 1970s and the 1990s. In Asia, in particular, the following satellites were launched (on behalf of the following Asian nations) for the purposes of facilitating television broadcasting: Initial Launch of Satellites for TV Broadcasting in Asia: mid-1980s – early 1990s64 Country Satellite Year of Launch Japan BS-2a 1984 Indonesia Palapa B2P 1987 China AsiaSat 1 1990 India Insat 2A 1992 Following the early launches of these satellites (for broadcasting in Asia) several others were launched in the years following, for both telephone and broadcasting communications. By the late 1990s, Asia’s share of all satellites (launched for commercial communications purposes), as a share of all international satellites, was as follows:
Asia’s satellites for Commercial Communications (as a Proportion of all International Satellites): late 1990s65
Satellites for Asian Commercial Communications 34 All Satellites in Orbit for Commercial Communications 180 Satellites of All Kinds in Orbit 530
Jones, “Football in the People’s Republic of China” in John Horne and Wolfram Manzenreiter (eds.), Football Goes East: Business, Culture and the People’s Game in China, Japan and South Korea (Routledge, Oxford, 2004), pp.57,113,122.
64 Amos Thomas, “Broadcast Satellites and Television for Asia: Global Actors on a Continental Stage” in Transnational Broadcasting Studies, no.2, Spring 1999; Tonda Priyanto, “The Journey of Telkom in Operating Communications Satellites to Serve the Indonesian Archipelago” in the Online Journal of Space Communications, no.8, 2005; see also Mark Long, The World of Satellite Television, ninth edition (Book Publishing Company, Summertown, Tennessee, 1998).
65 Amos Thomas, Imagi-nations and Borderless Television: Media, Culture and Politics Across Asia, (Sage Publications, New Delhi, 2005) p.50.
A World Game: Events and Tourism in NSW
33
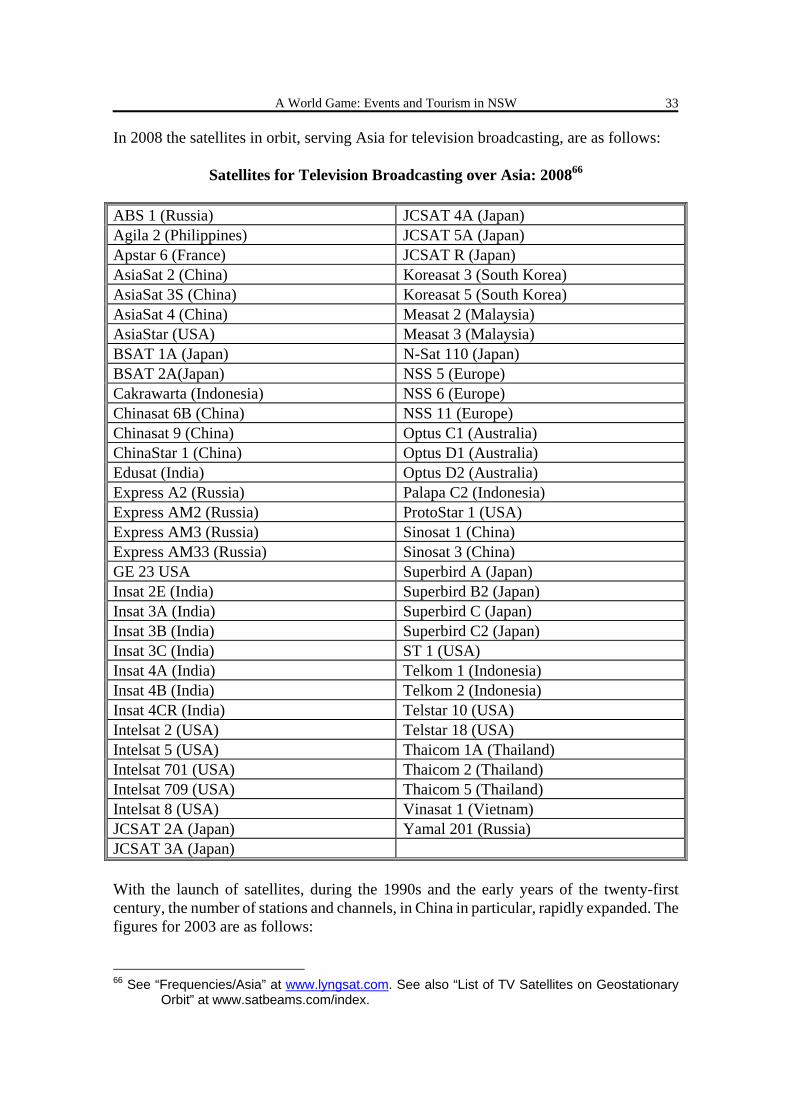
In 2008 the satellites in orbit, serving Asia for television broadcasting, are as follows:
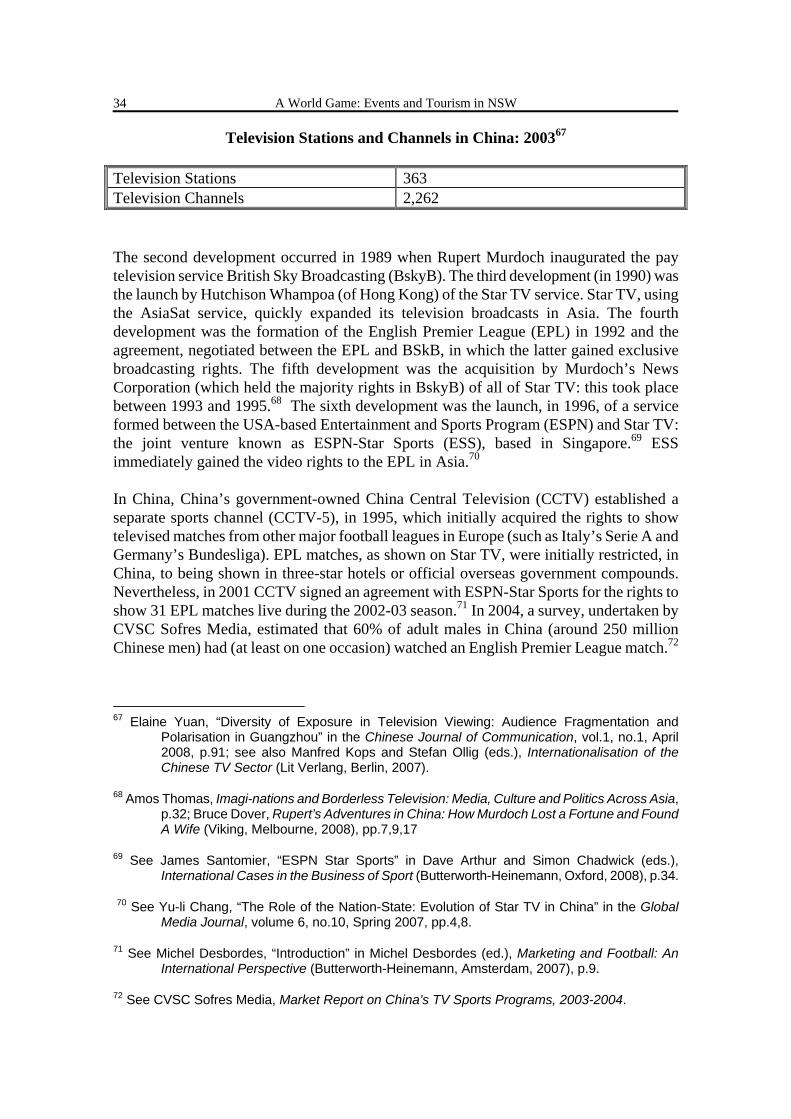
Satellites for Television Broadcasting over Asia: 200866 ABS 1 (Russia) JCSAT 4A (Japan) Agila 2 (Philippines) JCSAT 5A (Japan) Apstar 6 (France) JCSAT R (Japan) AsiaSat 2 (China) Koreasat 3 (South Korea) AsiaSat 3S (China) Koreasat 5 (South Korea) AsiaSat 4 (China) Measat 2 (Malaysia) AsiaStar (USA) Measat 3 (Malaysia) BSAT 1A (Japan) N-Sat 110 (Japan) BSAT 2A(Japan) NSS 5 (Europe) Cakrawarta (Indonesia) NSS 6 (Europe) Chinasat 6B (China) NSS 11 (Europe) Chinasat 9 (China) Optus C1 (Australia) ChinaStar 1 (China) Optus D1 (Australia) Edusat (India) Optus D2 (Australia) Express A2 (Russia) Palapa C2 (Indonesia) Express AM2 (Russia) ProtoStar 1 (USA) Express AM3 (Russia) Sinosat 1 (China) Express AM33 (Russia) Sinosat 3 (China) GE 23 USA Superbird A (Japan) Insat 2E (India) Superbird B2 (Japan) Insat 3A (India) Superbird C (Japan) Insat 3B (India) Superbird C2 (Japan) Insat 3C (India) ST 1 (USA) Insat 4A (India) Telkom 1 (Indonesia) Insat 4B (India) Telkom 2 (Indonesia) Insat 4CR (India) Telstar 10 (USA) Intelsat 2 (USA) Telstar 18 (USA) Intelsat 5 (USA) Thaicom 1A (Thailand) Intelsat 701 (USA) Thaicom 2 (Thailand) Intelsat 709 (USA) Thaicom 5 (Thailand) Intelsat 8 (USA) Vinasat 1 (Vietnam) JCSAT 2A (Japan) Yamal 201 (Russia) JCSAT 3A (Japan) With the launch of satellites, during the 1990s and the early years of the twenty-first century, the number of stations and channels, in China in particular, rapidly expanded. The figures for 2003 are as follows:
66 See “Frequencies/Asia” at www.lyngsat.com. See also “List of TV Satellites on Geostationary
Orbit” at www.satbeams.com/index.
A World Game: Events and Tourism in NSW
34
Television Stations and Channels in China: 200367 Television Stations 363 Television Channels 2,262 The second development occurred in 1989 when Rupert Murdoch inaugurated the pay television service British Sky Broadcasting (BskyB). The third development (in 1990) was the launch by Hutchison Whampoa (of Hong Kong) of the Star TV service. Star TV, using the AsiaSat service, quickly expanded its television broadcasts in Asia. The fourth development was the formation of the English Premier League (EPL) in 1992 and the agreement, negotiated between the EPL and BSkB, in which the latter gained exclusive broadcasting rights. The fifth development was the acquisition by Murdoch’s News Corporation (which held the majority rights in BskyB) of all of Star TV: this took place between 1993 and 1995.68 The sixth development was the launch, in 1996, of a service formed between the USA-based Entertainment and Sports Program (ESPN) and Star TV: the joint venture known as ESPN-Star Sports (ESS), based in Singapore.69 ESS immediately gained the video rights to the EPL in Asia.70 In China, China’s government-owned China Central Television (CCTV) established a separate sports channel (CCTV-5), in 1995, which initially acquired the rights to show televised matches from other major football leagues in Europe (such as Italy’s Serie A and Germany’s Bundesliga). EPL matches, as shown on Star TV, were initially restricted, in China, to being shown in three-star hotels or official overseas government compounds. Nevertheless, in 2001 CCTV signed an agreement with ESPN-Star Sports for the rights to show 31 EPL matches live during the 2002-03 season.71 In 2004, a survey, undertaken by CVSC Sofres Media, estimated that 60% of adult males in China (around 250 million Chinese men) had (at least on one occasion) watched an English Premier League match.72
67 Elaine Yuan, “Diversity of Exposure in Television Viewing: Audience Fragmentation and
Polarisation in Guangzhou” in the Chinese Journal of Communication, vol.1, no.1, April 2008, p.91; see also Manfred Kops and Stefan Ollig (eds.), Internationalisation of the Chinese TV Sector (Lit Verlang, Berlin, 2007).
68 Amos Thomas, Imagi-nations and Borderless Television: Media, Culture and Politics Across Asia, p.32; Bruce Dover, Rupert’s Adventures in China: How Murdoch Lost a Fortune and Found A Wife (Viking, Melbourne, 2008), pp.7,9,17
69 See James Santomier, “ESPN Star Sports” in Dave Arthur and Simon Chadwick (eds.), International Cases in the Business of Sport (Butterworth-Heinemann, Oxford, 2008), p.34.
70 See Yu-li Chang, “The Role of the Nation-State: Evolution of Star TV in China” in the Global Media Journal, volume 6, no.10, Spring 2007, pp.4,8.
71 See Michel Desbordes, “Introduction” in Michel Desbordes (ed.), Marketing and Football: An International Perspective (Butterworth-Heinemann, Amsterdam, 2007), p.9.
72 See CVSC Sofres Media, Market Report on China’s TV Sports Programs, 2003-2004.
A World Game: Events and Tourism in NSW
35
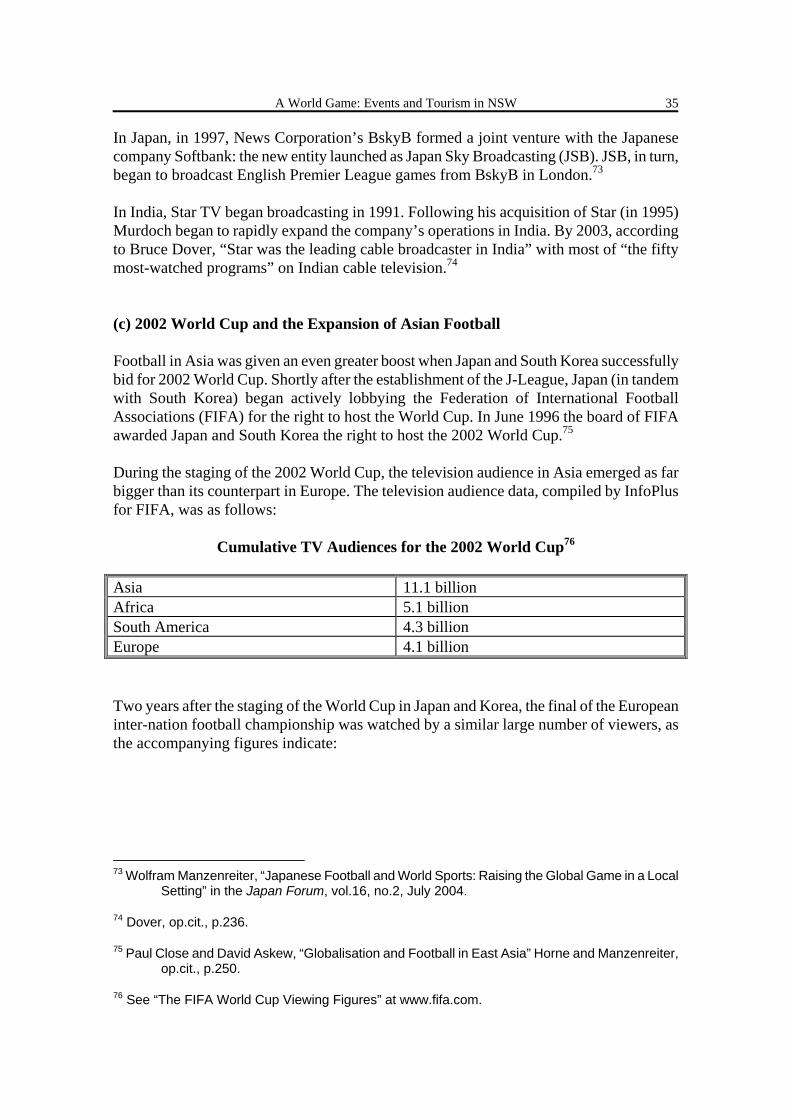
In Japan, in 1997, News Corporation’s BskyB formed a joint venture with the Japanese company Softbank: the new entity launched as Japan Sky Broadcasting (JSB). JSB, in turn, began to broadcast English Premier League games from BskyB in London.73 In India, Star TV began broadcasting in 1991. Following his acquisition of Star (in 1995) Murdoch began to rapidly expand the company’s operations in India. By 2003, according to Bruce Dover, “Star was the leading cable broadcaster in India” with most of “the fifty most-watched programs” on Indian cable television.74 (c) 2002 World Cup and the Expansion of Asian Football Football in Asia was given an even greater boost when Japan and South Korea successfully bid for 2002 World Cup. Shortly after the establishment of the J-League, Japan (in tandem with South Korea) began actively lobbying the Federation of International Football Associations (FIFA) for the right to host the World Cup. In June 1996 the board of FIFA awarded Japan and South Korea the right to host the 2002 World Cup.75 During the staging of the 2002 World Cup, the television audience in Asia emerged as far bigger than its counterpart in Europe. The television audience data, compiled by InfoPlus for FIFA, was as follows:
Cumulative TV Audiences for the 2002 World Cup76 Asia 11.1 billion Africa 5.1 billion South America 4.3 billion Europe 4.1 billion Two years after the staging of the World Cup in Japan and Korea, the final of the European inter-nation football championship was watched by a similar large number of viewers, as the accompanying figures indicate:
73 Wolfram Manzenreiter, “Japanese Football and World Sports: Raising the Global Game in a Local
Setting” in the Japan Forum, vol.16, no.2, July 2004.
74 Dover, op.cit., p.236.
75 Paul Close and David Askew, “Globalisation and Football in East Asia” Horne and Manzenreiter, op.cit., p.250.
76 See “The FIFA World Cup Viewing Figures” at www.fifa.com.
A World Game: Events and Tourism in NSW
36
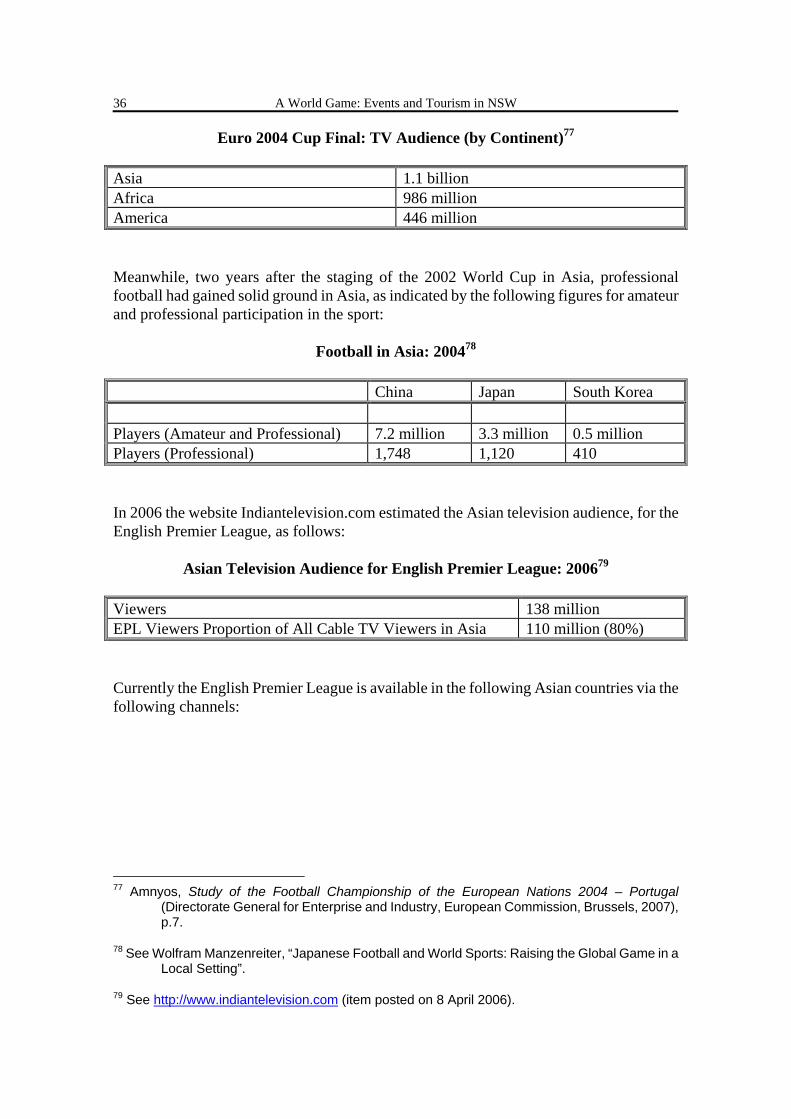
Euro 2004 Cup Final: TV Audience (by Continent)77 Asia 1.1 billion Africa 986 million America 446 million Meanwhile, two years after the staging of the 2002 World Cup in Asia, professional football had gained solid ground in Asia, as indicated by the following figures for amateur and professional participation in the sport:
Football in Asia: 200478 China Japan South Korea Players (Amateur and Professional) 7.2 million 3.3 million 0.5 million Players (Professional) 1,748 1,120 410 In 2006 the website Indiantelevision.com estimated the Asian television audience, for the English Premier League, as follows:
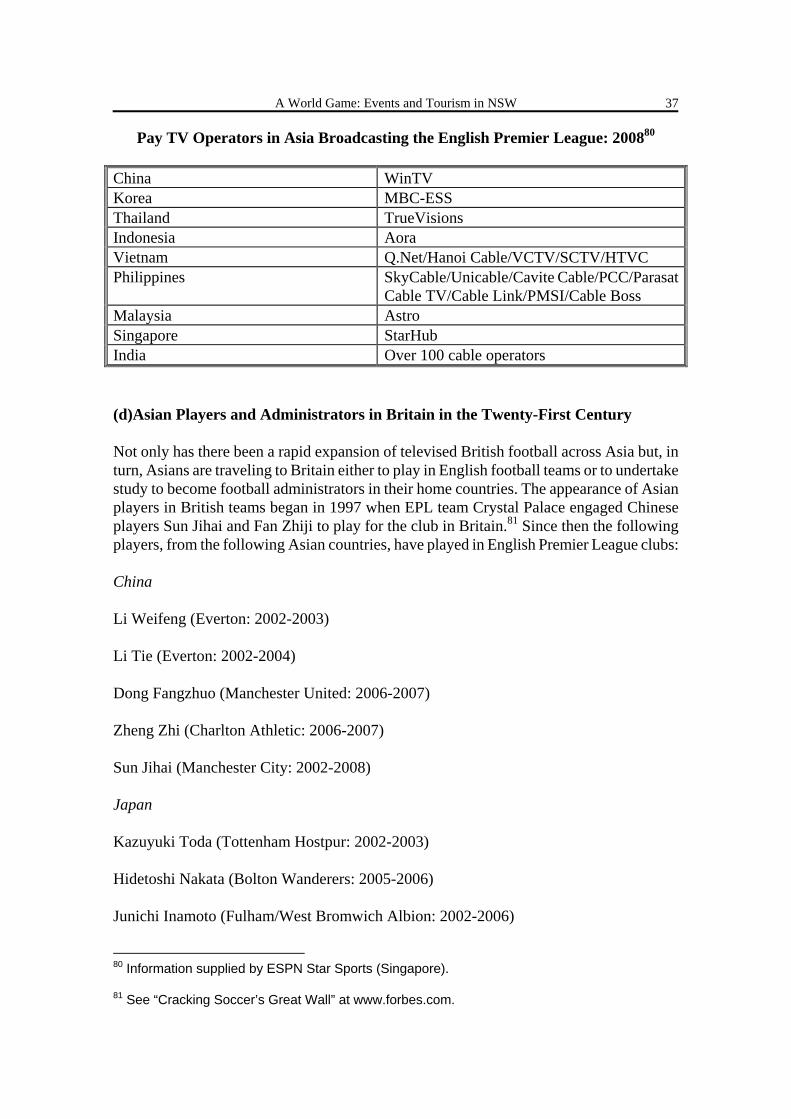
Asian Television Audience for English Premier League: 200679 Viewers 138 million EPL Viewers Proportion of All Cable TV Viewers in Asia 110 million (80%) Currently the English Premier League is available in the following Asian countries via the following channels:
77 Amnyos, Study of the Football Championship of the European Nations 2004 – Portugal
(Directorate General for Enterprise and Industry, European Commission, Brussels, 2007), p.7.
78 See Wolfram Manzenreiter, “Japanese Football and World Sports: Raising the Global Game in a Local Setting”.
79 See http://www.indiantelevision.com (item posted on 8 April 2006).
A World Game: Events and Tourism in NSW
37
Pay TV Operators in Asia Broadcasting the English Premier League: 200880 China WinTV Korea MBC-ESS Thailand TrueVisions Indonesia Aora Vietnam Q.Net/Hanoi Cable/VCTV/SCTV/HTVC Philippines SkyCable/Unicable/Cavite Cable/PCC/Parasat
Cable TV/Cable Link/PMSI/Cable Boss Malaysia Astro Singapore StarHub India Over 100 cable operators (d)Asian Players and Administrators in Britain in the Twenty-First Century Not only has there been a rapid expansion of televised British football across Asia but, in turn, Asians are traveling to Britain either to play in English football teams or to undertake study to become football administrators in their home countries. The appearance of Asian players in British teams began in 1997 when EPL team Crystal Palace engaged Chinese players Sun Jihai and Fan Zhiji to play for the club in Britain.81 Since then the following players, from the following Asian countries, have played in English Premier League clubs: China Li Weifeng (Everton: 2002-2003) Li Tie (Everton: 2002-2004) Dong Fangzhuo (Manchester United: 2006-2007) Zheng Zhi (Charlton Athletic: 2006-2007) Sun Jihai (Manchester City: 2002-2008) Japan Kazuyuki Toda (Tottenham Hostpur: 2002-2003) Hidetoshi Nakata (Bolton Wanderers: 2005-2006) Junichi Inamoto (Fulham/West Bromwich Albion: 2002-2006)
80 Information supplied by ESPN Star Sports (Singapore).
81 See “Cracking Soccer’s Great Wall” at www.forbes.com.
A World Game: Events and Tourism in NSW
38
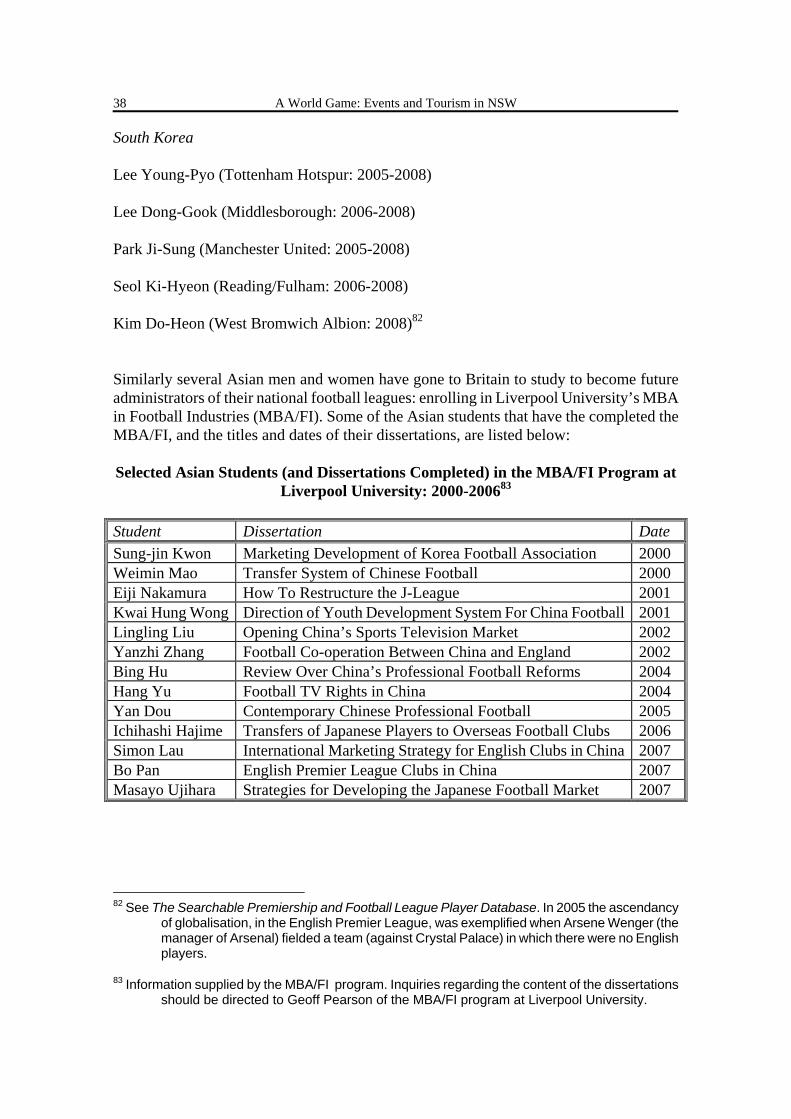
South Korea Lee Young-Pyo (Tottenham Hotspur: 2005-2008) Lee Dong-Gook (Middlesborough: 2006-2008) Park Ji-Sung (Manchester United: 2005-2008) Seol Ki-Hyeon (Reading/Fulham: 2006-2008) Kim Do-Heon (West Bromwich Albion: 2008)82 Similarly several Asian men and women have gone to Britain to study to become future administrators of their national football leagues: enrolling in Liverpool University’s MBA in Football Industries (MBA/FI). Some of the Asian students that have the completed the MBA/FI, and the titles and dates of their dissertations, are listed below: Selected Asian Students (and Dissertations Completed) in the MBA/FI Program at
Liverpool University: 2000-200683 Student Dissertation Date Sung-jin Kwon Marketing Development of Korea Football Association 2000 Weimin Mao Transfer System of Chinese Football 2000 Eiji Nakamura How To Restructure the J-League 2001 Kwai Hung Wong Direction of Youth Development System For China Football 2001 Lingling Liu Opening China’s Sports Television Market 2002 Yanzhi Zhang Football Co-operation Between China and England 2002 Bing Hu Review Over China’s Professional Football Reforms 2004 Hang Yu Football TV Rights in China 2004 Yan Dou Contemporary Chinese Professional Football 2005 Ichihashi Hajime Transfers of Japanese Players to Overseas Football Clubs 2006 Simon Lau International Marketing Strategy for English Clubs in China 2007 Bo Pan English Premier League Clubs in China 2007 Masayo Ujihara Strategies for Developing the Japanese Football Market 2007
82 See The Searchable Premiership and Football League Player Database. In 2005 the ascendancy
of globalisation, in the English Premier League, was exemplified when Arsene Wenger (the manager of Arsenal) fielded a team (against Crystal Palace) in which there were no English players.
83 Information supplied by the MBA/FI program. Inquiries regarding the content of the dissertations should be directed to Geoff Pearson of the MBA/FI program at Liverpool University.
A World Game: Events and Tourism in NSW
39
CONCLUSION Tourism planning, in New South Wales, is confronted by a number of dilemmas. Firstly while the mainstay of tourism (domestic holidaying) is relatively static, tourism from overseas is gradually increasing. Secondly while tourism from overseas is increasing, Australia’s (and presumably NSW) share of global travel is declining. Thirdly while the western European countries (that have traditionally provided tourists to Australia) continue to maintain their steady rate of tourist arrivals, the rate of tourist arrivals, from China (for example), has the potential to grow more quickly (given the rate of economic progress in Asia). Encouraging more Asians to travel to Australia (given the rise in Asian overseas travel) necessitates getting Asians to know Australia better. One way, to do this, could be taking advantage of the surge in popularity of football in Asia. In particular, hosting the World Cup in 2018 holds out the prospect of attracting visitors from the fastest growing source of visitors to Australia: China. On the surface, there appears to be a significant interest in football in China and this could be taken advantage of, to encourage even more Chinese tourists to visit Australia. Beyond simply attracting more visitors to Australia, it would seem clear that the football boom in Asia offers Australia opportunities in realms of activity beyond tourism. As the national football leagues develop and expand, in Asia, Australian institutions might be able to train Asian football administrators; Australian clubs might be able to offer playing opportunities. Other countries clearly see the possibilities. Given that the Iemma and Rees governments have particularly decided to focus on events to boost tourism in New South Wales, and given that sports events form the biggest component of tourism events, it would seem that increasing the degree of engagement with Asia – in the area of sports events – has the potential to attract increased numbers of tourists from Asia (the location of some of Australia’s fastest growing tourism markets).
Recent Research Service Publications To anticipate and fulfil the information needs of Members of Parliament and the Parliamentary Institution. [Library Mission Statement] Note: For a complete listing of all Research Service Publications contact the
Research Service on 9230 2093. The complete list is also on the Internet at: http://www.parliament.nsw.gov.au/prod/web/PHWebContent.nsf/PHPages/LibraryPublist
BACKGROUND PAPERS The Science of Climate Change by Stewart Smith 1/06 NSW State Electoral Districts Ranked by 2001 Census Characteristics by Talina Drabsch 2/06 NSW Electorate Profiles: 2004 Redistribution by Talina Drabsch 3/06 Parliamentary Privilege: Major Developments and Current Issues by Gareth Griffith 1/07 2007 NSW Election: Preliminary Analysis by Antony Green 2/07 Manufacturing and Services in NSW by John Wilkinson 3/07 2007 New South Wales Election: Final Analysis by Antony Green 1/08 New South Wales By-elections 1965-2008 by Antony Green, Update to Background Paper 3/05 BRIEFING PAPERS Sedition, Incitement and Vilification: issues in the current debate by Gareth Griffith 1/06 The New Federal Workplace Relations System by Lenny Roth 2/06 The Political Representation of Ethnic and Racial Minorities by Karina Anthony 3/06 Preparing for the Impact of Dementia by Talina Drabsch 4/06 A NSW Charter of Rights? The Continuing Debate by Gareth Griffith 5/06 Native Vegetation: an update by Stewart Smith 6/06 Parental Responsibility Laws by Lenny Roth 7/06 Tourism in NSW: Prospects for the Current Decade by John Wilkinson 8/06 Legal Recognition of Same Sex Relationships by Karina Anthony and Talina Drabsch 9/06 Uranium and Nuclear Power by Stewart Smith 10/06 DNA Evidence, Wrongful Convictions and Wrongful Acquittals by Gareth Griffith and Lenny Roth 11/06 Law and Order Legislation in the Australian States and Territories: 2003-2006 by Lenny Roth 12/06 Biofuels by Stewart Smith 13/06 Sovereign States and National Power: Transition in Federal- State Finance by John Wilkinson 14/06 Reducing the Risk of Recidivism by Talina Drabsch 15/06 Recent Developments in Planning Legislation by Stewart Smith 16/06 Commonwealth-State Responsibilities for Health – ‘Big Bang’ or Incremental Reform? by Gareth Griffith 17/06 The Workplace Relations Case – Implications for the States by Lenny Roth and Gareth Griffith 18/06 Crystal Methamphetamine Use in NSW by Talina Drabsch 19/06 Government Policy and Services to Support and Include People with Disabilities by Lenny Roth 1/07 Greenhouse Gas Emission Trading by Stewart Smith 2/07 Provocation and Self-defence in Intimate Partner and Homophobic Homicides by Lenny Roth 3/07 Living on the Edge: Sustainable Land Development in Sydney by Jackie Ohlin 4/07 Women, Parliament and the Media by Talina Drabsch 5/07 Freedom of Information: Issues and Recent Developments in NSW by Gareth Griffith 6/07 Domestic Violence in NSW by Talina Drabsch 7/07 Election Finance Law: Recent Developments and Proposals for Reform by Gareth Griffith and Talina Drabsch 8/07 Multiculturalism by Lenny Roth 9/07
Protecting Children From Online Sexual Predators by Gareth Griffith and Lenny Roth 10/07 Older Drivers: A Review of Licensing Requirements and Research Findings by Gareth Griffith 11/07 Liquor Licensing Laws: An Update by Lenny Roth 12/07 Residential Tenancy Law in NSW by Gareth Griffith and Lenny Roth 13/07 The NSW Economy: A Survey by John Wilkinson 14/07 The NSW Planning System: Proposed Reforms by Stewart Smith 1/08 Carbon Capture and Storage by Stephanie Baldwin 2/08 A Commissioner for Older People in NSW? by Gareth Griffith 3/08 Education in Country and City NSW by John Wilkinson 4/08 The Regulation of Lobbying by Gareth Griffith 5/08 Transport Problems Facing Large Cities by Tom Edwards and Stewart Smith 6/08 Privacy: the Current Situation by Jason Arditi 7/08 Marine Protected Areas by Tom Edwards 8/08 Child Pornography Law by Gareth Griffith and Kathryn Simon 9/08 Oil Supply and Petrol Prices by Stewart Smith 10/08 Local Government in NSW by Jason Arditi 11/08 Emissions Trading by Tom Edwards and Stewart Smith 12/08 Asylum Seekers by Kathryn Simon 13/08 A World Game: Events and Tourism in NSW by John Wilkinson 14/08 E BRIEFS (available electronically only) Intoxication and the Criminal Law by Gareth Griffith 1/08 Child Pornography Law Update by Gareth Griffith 2/08 Road Congestion Charging by Stewart Smith 3/08 Liquor, Licenses and Lockouts by Jason Arditi 4/08 Internet Censorship and Mandatory Filtering by Tom Edwards and Gareth Griffith 5/08