briefing notes submission - treasury · briefing notes. canberra to the south west – city within...
TRANSCRIPT
COMMONWEALTH GRANTS COMMISSION
2004 REVIEW
AUSTRALIAN CAPITAL TERRITORY
WORKPLACE DISCUSSIONS
13-15 NOVEMBER 2002
BRIEFING NOTES
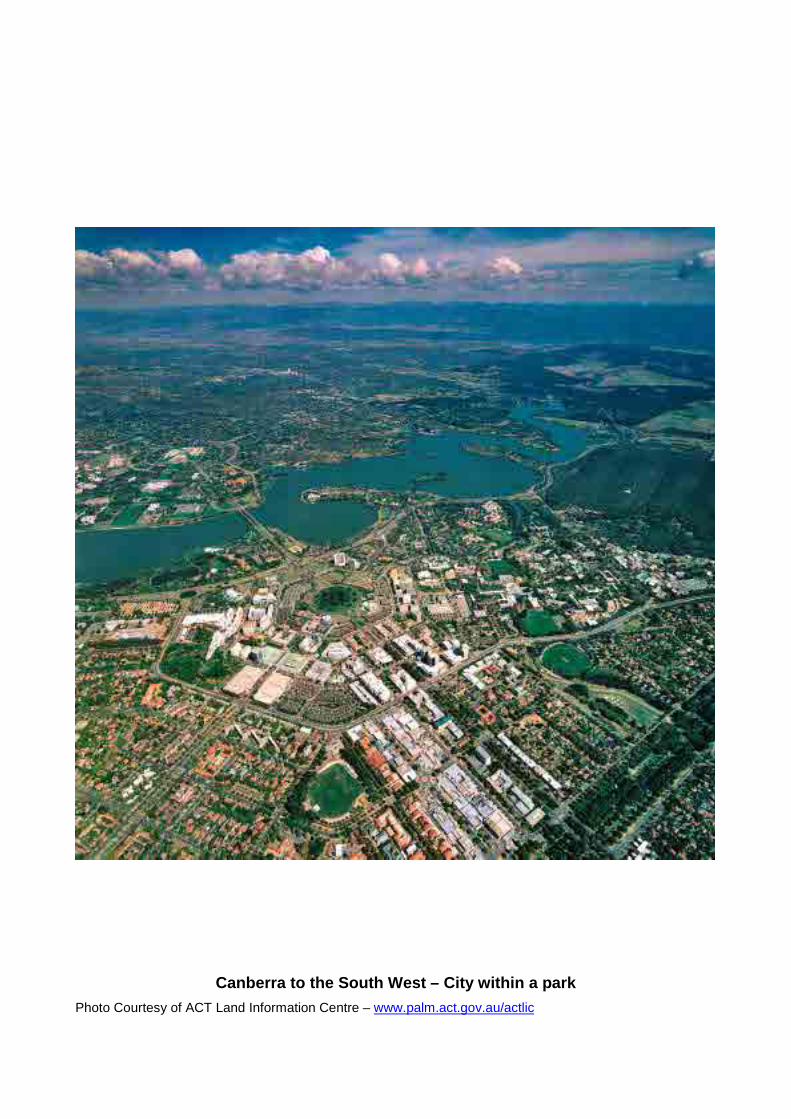
Canberra to the South West – City within a park
Photo Courtesy of ACT Land Information Centre – www.palm.act.gov.au/actlic
Contents - ACT Workplace Discussions
1
CONTENTS
Session Page No.
Itinerary. 3
Route Map. 7
Participants. 9
1 Welcome and Business Canberra 15
(A) Introduction and Overview.
(B) Canberra’s Economic and Business Profile.
(C) Services to Industry – Tourism.
17
31
37
2 Small Government – ‘Superannuation burden, case studies ofdiseconomies of small scale and Cross Border issues’
42
(A) Superannuation Issues - CSS and PSS.
(B) Administrative Scale – Diseconomies of Scale Impacts on theACT.
(C) Cross Border Assessments.
43
59
81
3 National Capital Influences – ‘All pervasive in service delivery’ 89
(A) General Public Services.
(B) Culture and Recreation.
(C) Economic Activities – Roads.
91
106
114
4 Welfare Services – ‘There is poverty in the ACT’ and Housing -‘The Territory’s accommodation constraints’
121
• Homelessness and General Welfare. 122
5 Non Inpatient Health Services – ‘Service demand and supplyside restrictions’
139
(A) Non-Inpatient and Community Health Services.
(B) Population and Preventative Health.
140
148
6 The ACT – ‘A National Park’ 153
(A) National Parks and Wildlife.
(B) Services to Industry - Forestry.
154
174
7 Education – ‘High participation and retention rates, the wayforward’
179
(A) Schools Education.
(B) Planning Issues – National Capital Influences – Gungahlin DrivePresentation.
180
196
Contents - ACT Workplace Discussions
2
Session Page No.
8 Law and Order and Public Safety – ‘Uncertain times’ 202
(A) Public Safety and Emergency Services.
(B) Law and Order - Police.
204
216
9 The ACT – ‘Pursuing a healthy Community for the Region’ 234
• Inpatient Services. 235
10 Corrective Services – ‘The state of origin of ACT prisoners’ and‘A collaborative regional approach’
246
• Corrective Services. 247
11 Gambling – ‘Household Disposable Income – an appropriatemeasure?’ and Revenue Raising and Future Security ‘Now & forfuture income support’
263
(A) Gambling.
(B) Revenue Raising Capacity.
264
271
12 Wrap up of Discussions 278

Itinerary - ACT Workplace Discussions
3
ITINERARY
Timing Venues, travel andmeal arrangements
Presenters Presentation Topics
Session 1: Welcome and Business Canberra
8:30am Regatta Point -Canberra BusinessPromotion Centre
• Mrs Tu Pham• Mr Rob Tonkin• Mr Ross McDiarmid
• Introduction & overview of 3days.
• Overview & economic profile &related support measures.
• Services to Industry – Tourism.10:15am Morning Tea – Regatta Point - Canberra Business Promotion Centre
Session 2: Small Government – ‘Superannuation burden, case studies of diseconomies of smallscale and Cross Border issues’
10:30am • Ms Pam Davoren• Mr Roger Broughton• Mr David Butt• Ms Meredith Whitten
• Superannuation issues – CSS& PSS.
• Diseconomies of small scale.Case studies – MicroeconomicReform and AdministrativeArrangements.
• Cross Border Assessments.12:15pm Lunch – Regatta Point - Canberra Business Promotion Centre
Session 3: National Capital Influences – ‘all pervasive in service delivery’
1:15pm • Mr Colin Adrian• Mr Lincoln Hawkins• Ms Dorte Ekelund• Mr Martin Hehir• Mr Gordon Davidson• Mr Hamish McNulty
• Overview.• National Capital Claims –
Planning & development costs.• Cross Border – Culture &
Recreation.• National Capital Claims –
Culture & Recreation.• National Capital Claims –
Roads.3:00pm Afternoon tea – Regatta Point - Canberra Business Promotion Centre
Session 4: Welfare Services – ‘there is poverty in the ACT’ and Housing – ‘the Territory’saccommodation constraints’
3:15pm • Ms Sandra Lambert• Mr John Wynants• Ms Bronwen Overton-
Clarke• Ms Chris Purdon• Mr Bob Hutchison• Mr Bruce McKenzie
• Overview.• SAAP issues.• Housing issues.• Housing – Land tax.
Day 1 - Wednesday 13 November
Itinerary - ACT Workplace Discussions
4
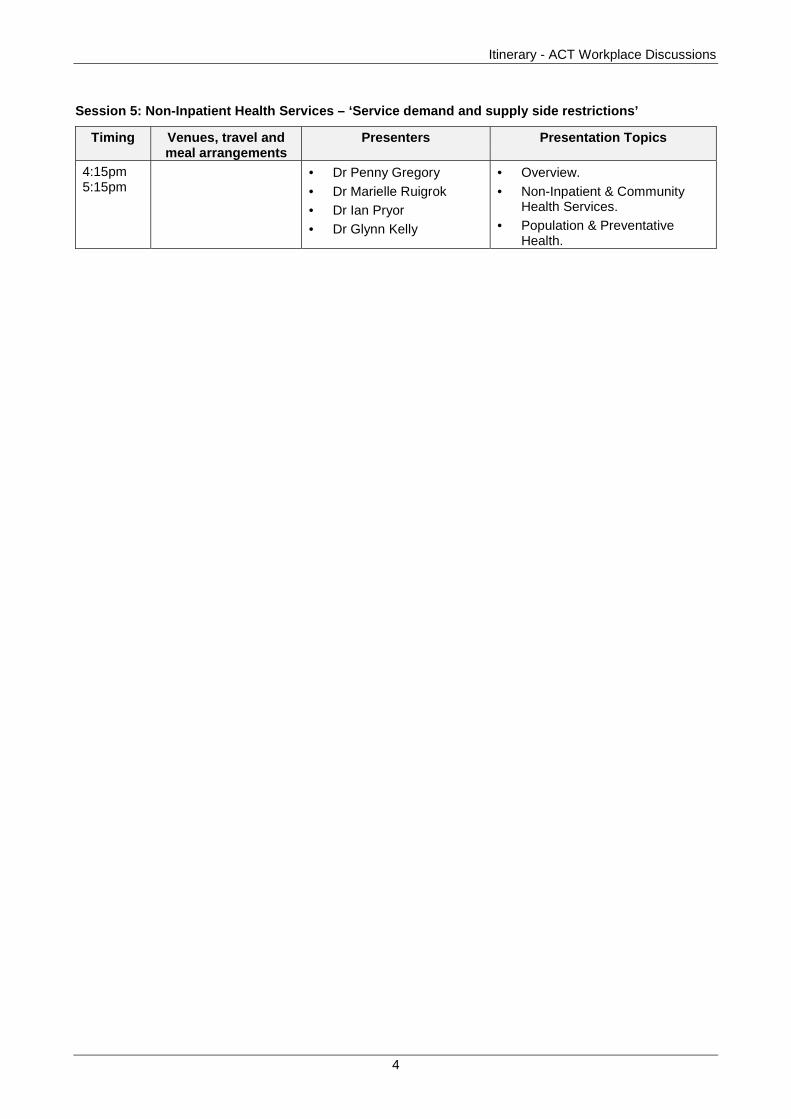
Session 5: Non-Inpatient Health Services – ‘Service demand and supply side restrictions’
Timing Venues, travel andmeal arrangements
Presenters Presentation Topics
4:15pm5:15pm
• Dr Penny Gregory• Dr Marielle Ruigrok• Dr Ian Pryor• Dr Glynn Kelly
• Overview.• Non-Inpatient & Community
Health Services.• Population & Preventative
Health.

Itinerary - ACT Workplace Discussions
5
Timing Venues, travel andmeal arrangements
Presenters Presentation Topics
Session 6: The ACT – ‘a National Park’
8:30am Bus from CrownePlaza to NamadgiNational Park Visitors’Centre
• Mr Karl Cloos• Mr Geoff Wells
• National Capital Claims –Roads.
9:35am Namadgi Visitors’Centre
• Ngunnawal Elder. • Welcome to NgunnawalCountry.
9:50am • Dr Maxine Cooper• Mr Geoff Wells• Dr David Shorthouse• Mr Brett McNamara• Mr Terence Uren
• National Parks & WildlifeServices.
10:20am Morning tea – Namadgi Visitors’ Centre10:35am Bus from Namadgi
Visitors’ Centre toDickson College
• Mr Tony Bartlett• Ms Alice Heather• Mr Geoff Wells
• Services to Industry - Forestry.
Session 7: Education – ‘high participation and retention rates, the way forward’
11:45am Dickson College • Mr Trevor Wheeler• Mr James Coleborne• Mr Craig Curry• Ms Wendy Coutts• Mr Peter Veenker• Mr Chris Peters
• Overview.• Government Primary &
Secondary Education.
12:45pm Lunch – Dickson College1:30pm • Government Primary &
Secondary Education –continued.
3:00pm Bus to Gungahlin JointEmergency ServicesCentre
• Mr Hamish McNulty• Ms Dorte Ekelund• Mr Martin Hehir
• Special Circumstances of theACT – National CapitalInfluences
Session 8: Law and Order and Public Safety– ‘uncertain times’
3:35pm Afternoon tea – Gungahlin Joint Emergency Services Centre3:45pm • Mr Tim Keady
• Mr Mike Castle• Mr Andy Hughes
• Overview.• Public Safety & Emergency
Services.• Police.
4:45pm Bus to ACT Legislative Assembly5:10pm to5:45pm
ACT LegislativeAssembly - Civic
• Meeting –Mr Ted QuinlanDeputy Chief Ministerand Treasurer
• Overview of the 2004 Review &related issues.
Day 2 – Thursday 14 November

Itinerary - ACT Workplace Discussions
6
Timing Venues, travel andmeal arrangements
Presenters Presentation Topics
8:30am Bus from Crowne Plaza to The Canberra Hospital
Session 9: The ACT – ‘pursuing a healthy community for the region’
8:50am The Canberra Hospital • Dr Penny Gregory• Prof. David Ellwood• Assoc. Prof.
Mark Bassett• Assoc. Prof.
Graham Reynolds
• Overview.• Inpatient Services.
10:00am Morning Tea – The Canberra Hospital10:15am The Canberra Hospital • Inpatient Services - continued.12:00pm Lunch – The Canberra Hospital12:45pm Bus to Supreme Court Building
Session 10: Corrective Services – ‘the State of origin of ACT prisoners’ and ‘a collaborative regionalapproach’
1:05pm Supreme CourtBuilding
• Mr Tim Keady• Mr James Ryan• Dr David Hughes
• Corrective Services.
2:15pm Bus to Casino Canberra
Session 11: Gambling – ‘household disposable income’ and Revenue Raising and Future Security –‘now and for future income support’
2:30pm Afternoon tea –Casino Canberra2:45pm Casino Canberra • Mr John Broome
• Mr Tony Curtis• Factors impacting on gambling
behaviour.
3:15pm • Dr Mark Mullins • Revenue raising capacity andtax leakage.
Session 12: Wrap up of Discussions
3:45pm to4:30pm
Casino Canberra • Mr Roger Broughton • Concluding comments.
Day 3 – Friday 15 November
Route Map - ACT Workplace Discussions
7
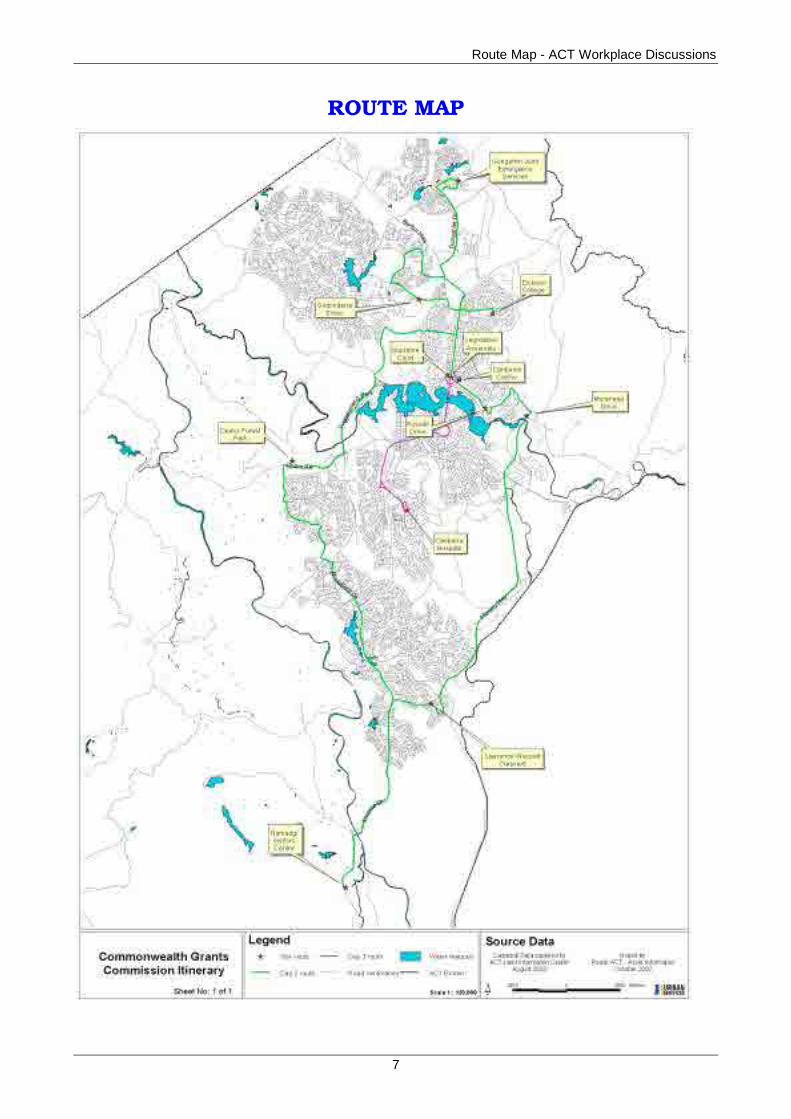
ROUTE MAP
Route Map - ACT Workplace Discussions
8
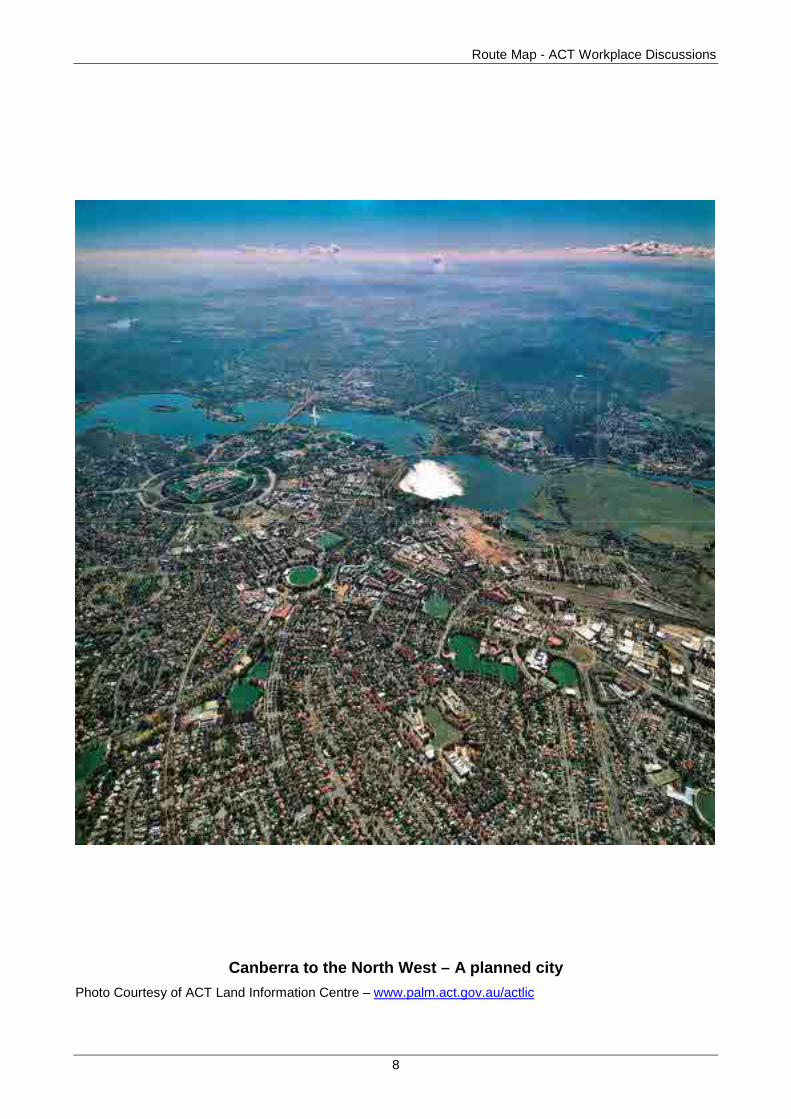
Canberra to the North West – A planned city
Photo Courtesy of ACT Land Information Centre – www.palm.act.gov.au/actlic
Participants - ACT Workplace Discussions
9
PARTICIPANTS
Commissioners
Mr Alan Morris Chairman
Mr Len Early Commissioner
Ms Hylda Rolfe Commissioner
Mr Ross Williams Commissioner
Mr Ken Wiltshire Commissioner
Staff
Mr Bob Searle Secretary
Ms Catherine Hull Assistant Secretary, Expenditure Analysis
Malcolm Nicholas Assistant Secretary, Revenue, Budgets & ResearchBranch
Mr Peter Stubbs Assessment Officer, State Finances –Revenue &Relativities Section
Priscilla Kan Director, State Finances – Budget Analysis Section
Marc Boisseau Director, State Finances – Expenditure C
John Barker Director, State Finances – Expenditure B
Lintong Feng Director, State Finances – Revenue & Relativities Section
Malcolm Pascoe Director, State Finances – Expenditure A
David Saunders Assessment Officer, State Finances – Expenditure B
Bob Wills Assessment Officer, State Finances – Expenditure B
Hema De Silva Assessment Officer, State Finances – Expenditure B
Suet-Lam Mui Assessment Officer, State Finances – Expenditure A
Nina Savolainen Assessment Officer, State Finances – Expenditure C
Jenifer Rahmoy Assessment Officer, State Finances – Expenditure A
Peter Urban Assessment Officer, State Finances – Revenue &Relativities Section
Zaid Tseggai-Bocurezion Assessment Officer, State Finances – Revenue &Relativities Section
Allison Shoobridge Assessment Officer, State Finances – Expenditure C
Jana Padmanathan Assessment Officer, State Finances – Expenditure B
Rosa Benedictos Assessment Officer, State Finances – Expenditure A
Fahmida Ehsan Assessment Officer, State Finances – Expenditure B
Commonwealth Grants Commission
Participants - ACT Workplace Discussions
10
Treasury
Mrs Tu Pham A/g Under Treasurer
Mr Roger Broughton A/g Deputy Under Treasurer
Mr John Purcell Manager, Commonwealth-State Finances
Mr Andrew Philip Project Manager, Commonwealth-State Finances
Mr Peter Johnson Commonwealth-State Finances
Mr Koroush Ghazi Commonwealth-State Finances
Mr David Jones Commonwealth-State Finances
Dr Mark Mullins A/g Commissioner for ACT Revenue
Mr David Butt Director, Economic Management
Dr David Hughes Manager, Major Projects & Policy Analysis, EconomicManagement
Mr Angel Marina Manager, Rates & Land Tax, ACT Revenue Office
Ms Kathy Goth A/g Manager Economics & Finance, ACT Revenue Office
Mr David Butt Director, Economic Management Branch
Ms Robyn Hardy A/g Manager, Microeconomic Reform Unit
Mr Matthew Powell Senior Research Officer, Microeconomic Reform Unit
Ms Bethany Anderson Research Officer, Microeconomic Reform Unit
Chief Minister’s Department
Mr Rob Tonkin Chief Executive
Mr Peter Gordon Executive Director, Office of Business & Tourism
Mr George Tomlins Executive Director, CMD Policy Group
Ms Pam Davoren Director, Public Sector Management Group
Mr Geoff Keogh Director, BusinessACT
Ms Meredith Whitten Director, Corporate Services
Department of Disability, Housing & Community Services
Ms Sandra Lambert Chief Executive
Ms Chris Healy Executive Director, Disability ACT
Mr Bob Hutchison Executive Director, ACT Housing
Ms Bronwen Overton-Clarke Director, Organisation Service & Strategic Policy
Australian Capital Territory
Participants - ACT Workplace Discussions
11
Mr John Wynants Senior Manager, Strategic Projects
Ms Sarah King Assistant Manager, Community Services
Department of Education, Youth & Family Services
Mr Trevor Wheeler A/g Chief Executive, Department of Education, Youth andFamily Services
Mr Peter Veenker Chief Executive, Canberra Institute of Technology
Ms Sue Birtles Executive Director, Children’s Youth & Family Services
Mr James Coleborne Executive Director, Schools Education
Mr Craig Curry Director, School Operations – Southside and specialeducation and student support services
Ms Wendy Coutts Principal, Dickson College
Mr Stephen Tregea-Collett Manager, Data Analysis & Planning
Department of Health & Community Care
Dr Penny Gregory Chief Executive
Mr Robert Cusack Chief Executive, Calvary Hospital
Mr Ted Rayment Chief Executive, The Canberra Hospital
Mr Gordon Lee Koo Deputy Chief Executive, The Canberra Hospital
Dr Wayne Ramsey Clinical Deputy Chief Executive Officer, The CanberraHospital
Ms Susan Killion Executive Director, Health Policy Planning and Information
Dr Robert Griffin Director, Medical Administration, Calvary Public Hospital
Assoc Prof Graham Reynolds Director, Neonatology, Paediatrics and Child Health, TheCanberra Hospital
Dr Marielle Ruigrok Director, Emergency Department, Calvary Public Hospital
Mr Ian Thompson Director, Health Policy and Primary Care
Department of Justice & Community Safety
Mr Tim Keady Chief Executive
Mr Mike Castle Executive Director, ACT Emergency Services Bureau
Ian Bennett ACT Fire Commissioner
Mr Andy Hughes Deputy Chief Police Officer for the ACT
Peter Lucas-Smith Director, ACT Bushfire and Emergency Services
Dr Tony Murney Director, Services Australian Federal Police
Mr James Ryan Director, ACT Corrective Services

Participants - ACT Workplace Discussions
12
Mr Eddie Issa Manager, Business, Policy and Co-ordination
Ms Ronia McDade Manager, Community Based Corrections
Department of Urban Services
Dr Colin Adrian A/g Chief Executive
Dr Maxine Cooper Executive Director, Environment ACT
Mr Lincoln Hawkins Executive Director, Planning & Land Management
Mr Tony Bartlett Director, ACT Forests
Dorte Ekelund Director, Territory Planning Branch, Planning and LandManagement
Martin Hehir Director, Land Group, City Management
Mr Hamish McNulty Director, Roads ACT
Karl Cloos Manager, Planning, Policy and Coordination, Roads ACT
Ms Alice Heather Manager, Canberra Urban Parks and Places
Mr Brett McNamara Manager of West District (Namadgi National Park,Murrumbidgee River Corridor), ACT Parks andConservation Service, Environment ACT
Dr David Shorthouse FEIA Manager, Wildlife Research and Monitoring, EnvironmentACT
Ms Rebecca Vassarotti Manager, Policy Planning & Liaison
Mr Geoff Wells Manager, ACT Parks and Conservation Service,Environment ACT
Mr Gary Luck Senior Project Officer, Policy Planning & Liaison
Mr Terence Uren Project Officer, Environment Planning and Legislation
ACT Affordable Housing Taskforce
Ms Chris Purdon Chair, ACT Affordable Housing Taskforce
ACT Chamber of Commerce
Mr Christopher Peters Chief Executive, ACT Chamber of Commerce
ACT Division of General Practice
Dr Glynn Kelly President, ACT Division of General Practice
Mr Richard Bialkowski Chief Executive, ACT Division of General Practice
ACT Gambling and Racing Commission
Mr John Broome Chairman, ACT Gambling and Racing Commission
Participants - ACT Workplace Discussions
13
Tony Curtis Chief Executive Officer, ACT Gambling and RacingCommission
Australian Medical Association, ACT Branch
Dr Ian Pryor President, Australian Medical Association, ACT Branch
Canberra Clinical School
Professor David Ellwood Associate Dean, Canberra Clinical School
Assoc Prof Mark Bassett Director, Gastroenterology Department, Canberra ClinicalSchool
Canberra Tourism & Events Corporation
Mr Ross McDiarmid Chief Executive
Community Housing Canberra
Mr Bruce McKenzie Chief Executive Officer, Community Housing Canberra
Ms Andrée Wheeler Revenue Policy, Victoria
Dr Gary Ward Director, Regulatory & Inter-Governmental Relations,Queensland
Mr Anhi Vong Research Officer, Public Finance Division,Northern Territory
Interstate Observers
Participants - ACT Workplace Discussions
14
Session 1 - ‘Welcome and Business Canberra’
15
DAY ONE
WEDNESDAY, 13 NOVEMBER 2002
SESSION 1. – ‘WELCOME AND BUSINESS CANBERRA’:
(A) Introduction and Overview.
(B) Canberra’s Economic and Business Profile.
(C) Services to Industry – Tourism.
Session 1 - ‘Welcome and Business Canberra’
16
Session 1 - ‘Welcome and Business Canberra’
17
(A) INTRODUCTION AND OVERVIEW
Regatta Point – Canberra Business Promotion Centre
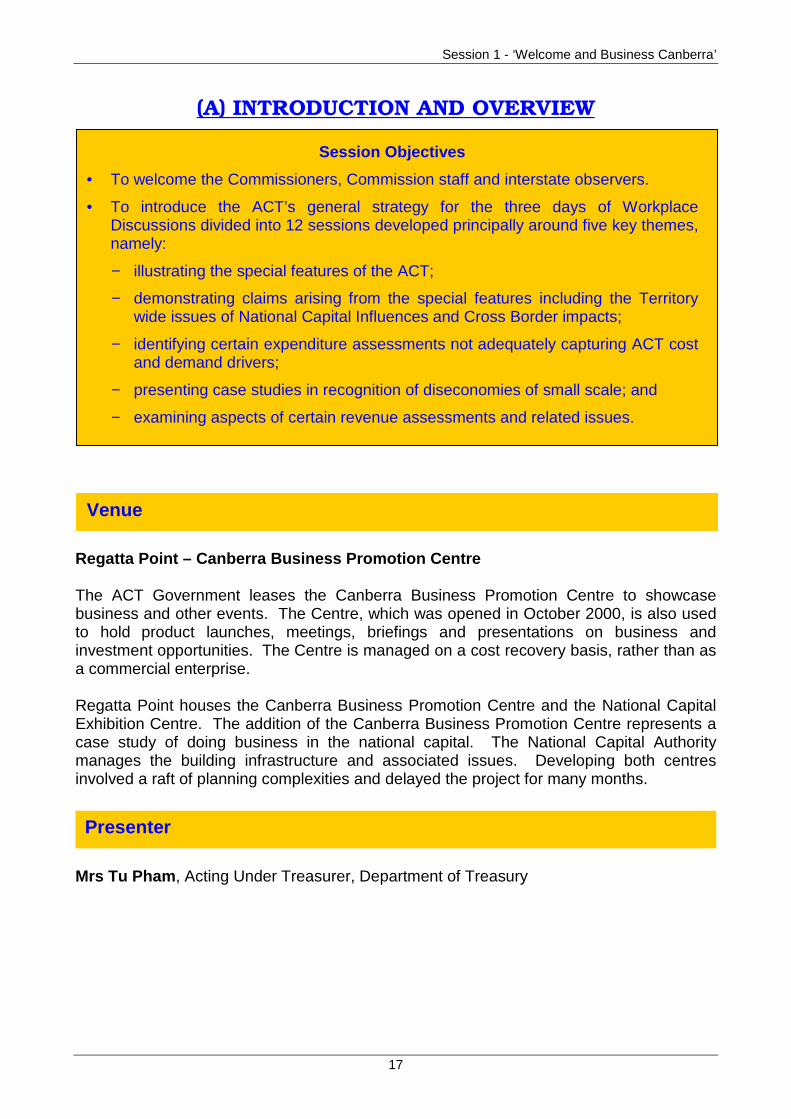
The ACT Government leases the Canberra Business Promotion Centre to showcasebusiness and other events. The Centre, which was opened in October 2000, is also usedto hold product launches, meetings, briefings and presentations on business andinvestment opportunities. The Centre is managed on a cost recovery basis, rather than asa commercial enterprise.
Regatta Point houses the Canberra Business Promotion Centre and the National CapitalExhibition Centre. The addition of the Canberra Business Promotion Centre represents acase study of doing business in the national capital. The National Capital Authoritymanages the building infrastructure and associated issues. Developing both centresinvolved a raft of planning complexities and delayed the project for many months.
Mrs Tu Pham, Acting Under Treasurer, Department of Treasury
Presenter
Session Objectives
• To welcome the Commissioners, Commission staff and interstate observers.
• To introduce the ACT’s general strategy for the three days of WorkplaceDiscussions divided into 12 sessions developed principally around five key themes,namely:
− illustrating the special features of the ACT;
− demonstrating claims arising from the special features including the Territorywide issues of National Capital Influences and Cross Border impacts;
− identifying certain expenditure assessments not adequately capturing ACT costand demand drivers;
− presenting case studies in recognition of diseconomies of small scale; and
− examining aspects of certain revenue assessments and related issues.
Venue
Session 1 - ‘Welcome and Business Canberra’
18
1.1. The ACT welcomes the Commissioners, Commission staff and interstate observersto the Territory for three days of workplace discussions.
1.2. The Commission last visited the ACT in 1997, and it would be fair to say that in theintervening 5 year period, the profile of the Territory, its population, economy and capacityto provide government services have not undergone any radical transformations. Theissues facing the ACT in respect of revenue raising and service provision are much thesame as they were in the 1999 Review.
1.3. What has changed somewhat since the last visit, is the maturing of the ACTGovernment leading to improvements in management and accounting practices. This initself has led to a better understanding of the influences affecting the delivery of services.
1.4. The Territory has placed a high priority on these Workplace Discussions which havebeen condensed into three days of deliberations, divided into 12 sessions, and are to beconducted at six different locations within the city metropolitan and surrounding ruralenvironment.
1.5. Indeed, the preparations leading up to the discussions have helped to galvanise theDepartments’ understanding of the processes underpinning the Commission’s workthrough general application of the theory to practical presentations, which the ACTwelcomes.
1.6. The program of sessions deliberately targets the major claims in the ACT’s MainSubmission. The order of the sessions reflect, in the main, the ACT Departmental profilesto ensure as best as possible minimal disruption to all parties concerned.
1.7. Particular emphasis has been placed on illustrating the cost and demanddisadvantages in relation to both the provision of services to non-residents and increasedcosts resulting from Canberra's role as the national capital while at the same time takingthe opportunity to progress the ACT’s claims for changes in a number of assessments.
1.8. The ACT is aware that national capital influences and cross border impacts of thisdegree of significance, are issues which relate only to the ACT. These specialcircumstances can only be demonstrated in the ACT. The Commission will not get first-hand exposure to these issues in its visits to other jurisdictions.
1.9. The Workplace Discussion Briefing Notes outlined in this publication are designedto both draw out the objectives of each of the sessions, and at the same time, provide theCommission with further information underpinning earlier claims.
1.10. Finally, while the ACT appreciates the need for, and effort required, by Commissionofficers to complete Discussion Papers for the forthcoming November officers’ conference,it would be fair to say that this has both helped the ACT and somewhat hindered thedevelopment of a suitable program due principally, to the timing of their release so close tothe date of the ACT discussions. The Territory consequently, did not have the opportunityto fully explore all discussion papers, and in some instances, presentations may not
Introduction
Session 1 - ‘Welcome and Business Canberra’
19
necessarily reflect or inter-react with the views outlined by Commission officers. Theattached briefing notes are somewhat longer than would normally be expected, due to thefact that some issues in the November discussion papers have been addressed, hence, itis likely that the ACT will not comment on these issues in the February 2003 RejoinderSubmission.
1.11. The workplace discussions are divided into 12 sessions developed principallyaround five key themes, namely:
• illustrating the special features of the ACT;
• demonstrating claims arising from special features;
• targeting improvements in certain expenditure assessments not adequately capturingACT cost and demand drivers;
• presenting case studies in recognition of diseconomies of small scale; and
• targeting changes in certain revenue assessments and related issues.
Special Features of the ACT
1.12. While it is acknowledged that all jurisdictions have special and unique features, theapplication of fiscal equalisation in respect of the ACT has its particular difficulties that arebecoming even more pronounced as the Government and its bureaucracy matures.
1.13. Parties must remember that self-government is only in its thirteenth year, whileother jurisdictions, with the exception of the NT, have been in existence for well over 100years.
1.14. In this context, Commissioners are asked to revisit these special Territorycharacteristics, namely:
• a different socio-demographic profile to most other jurisdictions with consequentialimplications for the Commission’s assessments across the board;
• a markedly different economic base, still disproportionately reliant on the public sectorand lacking in substantial manufacturing, primary industries and resources; and
• a markedly different geographical and physical locality with the ACT a land-lockedisland within NSW, the only jurisdiction with 100% of its population living within 25kilometres of another jurisdiction, and thus creating cross border considerations at aunprecedented level.
1.15. These special characteristics are captured to a high degree in the current per capitarelativity which is 15% above the national average and due, in the main, to a lack of thesubstantial revenue sources available to the four most populated States, including:
Overview
Session 1 - ‘Welcome and Business Canberra’
20
• significant business activity from large taxable corporations;
• substantial resource wealth, such as minerals, petroleum and gas; and
• locational advantage resulting in high wealth bases, such as that accumulated in realestate property.
1.16. This relatively low revenue raising capacity of the ACT can be simply demonstratedby the following comparison previously provided in the Main Submission:
• 51% of the top ASX-200 companies (in 2002) are located in NSW, 26% in Victoria,10.5% in WA and 0% in the ACT;
• the value of just two of Sydney’s premier buildings is larger than the value of the entireCanberra commercial property sector; and
• WA collected $777.0m in royalties in 1999-00, Queensland $464.0m, NSW $215.0mand the ACT less than $1.0m.
1.17. While the ACT believes that the Commission’s relativities are reasonable, both froma practical and intuitive sense, the Territory still considers that its citizens are having tobear costs associated with some of these special features or circumstances, which shouldbe rightly shared among the whole Australian community.
1.18. These special features permeate throughout all the sessions of the WorkplaceDiscussions.
ACT’s claims arising from Special Features
1.19. As foreshadowed in the ACT’s Main Submission, further work by the relevant ACTagencies has been undertaken and will be presented at the appropriate sessions. TheTerritory has also engaged the services of Ernst & Young to independently and rigorouslyexamine the claims and develop additional supporting data in conjunction with the ACT fora number of the national capital impacts, which will form part of the relevant presentations.
1.20. In summary, the bulk of the ACT’s claims for national capital circumstances will beraised in the following sessions:
• Session 1 will elaborate on the difficulties faced by the Territory in a national tourismmarket;
• Session 3 will reinforce and introduce new material supporting the ACT’s claims in theMain Submission for National Capital allowances for the General Public Services,Roads and Culture and Recreation categories;
• Session 4 will clarify the ACT’s claim for an allowance for the unfunded maintenanceliability arising from housing stock passed to the Territory at time of self government;
• Session 6 will reinforce and clarify a number of claims relating to Roads, Forests,National Parkes and Wildlife Services and the inter-relationship with urbanisation.Some practical examples will be provided;
Session 1 - ‘Welcome and Business Canberra’
21
• Session 7 will illustrate and reinforce claims underpinning the impact of the NationalCapital Plan on planning and land management activities and road provision in theTerritory; and
• Session 8 will illustrate the claim for fire protection of the bush/urban interface.
1.21. Similarly, the ACT has developed a modified assessment approach to the vexedquestion of cross border utilisation. The ACT continues to believe, based on a range ofdata, that the Territory draws non-residents from further afield, and in greater numbersthan is currently recognised by the Commission.
1.22. The impact of non-residents will be illustrated at a number of sessions:
• Session 1 will outline a claim for regional cross promotion;
• Session 2 will provide an overview of the proposed approach recommended by theACT for assessing a cross border approach in the absence of direct supportive dataand outline other related issues;
• Session 3 will cover the ACT’s claim in the culture and recreation assessment;
• Session 5 will clarify the ACT’s claim for a cross border impact in the non-inpatienthealth services area;
• Session 7 will raise the issue of cross border students accessing ACT schools;
• Session 8 will highlight the extent of policing cross border crime;
• Session 9 will discuss Australian Health Care Agreement cross-border arrangementsand associated issues as well as a number of other health related concerns;
• Session 10 will canvas issues associated with cross border prisoner numbers; and
• Session 11 will raise issues with tax leakage.
Identified Change to Current Assessments
1.23. The ACT has highlighted a number of priority areas in the Main Submission seekingchange to assessments in the 2004 Review.
1.24. Two prime areas relate to the treatment of superannuation, and the measurementof post-compulsory school participation.
1.25. In regard to superannuation, the ACT considers that its above averagesuperannuation costs, driven by employees’ CSS/PSS membership represents anunavoidable an ongoing cost and should be recognised by the Commission’sassessments.
1.26. Likewise, rigorous data analysis by NATSEM dismisses any notion that the ACTinfluences retention/participation for post compulsory schooling through its policies to anysignificant extent.
1.27. The following sessions are designed to expand on the ACT’s submission and allowdiscussion between the parties:
Session 1 - ‘Welcome and Business Canberra’
22
• Session 2 will present further arguments underlying the Territory’s unavoidable costsassociated with the superannuation schemes;
• Session 7 is designed to reinforce a number of claims in the education sector with theprinciple element focusing on the ACT’s strongly held view that high participation andretention rates are not policy influenced; and
• Sessions 4, 5, and 8 will discuss aspects of the economic environment assessmentsapplied in the housing, inpatient and non-inpatient health services (GPs), and publicsafety assessments.
Presenting case studies in diseconomies of small scale
1.28. The ACT supports the Commission’s conclusions regarding the existence of, andthe need to continue assessing administrative scale disabilities as the less populousStates continue to face higher per capita expenditures for administrative functions relatedto the provision of the standard range of government services. However, the ACTconsiders that far from being diminished, scale disabilities are increasing as the complexityof government activities and greater accountability requirements increase.
1.29. The ACT in Sessions 2 and 10 will provide three case studies illustrating themagnitude of scale issues confronting the Territory in the provision of services under theauspices of National Competition Policy, Administration of the Freedom of Information Act,and other corporate related service functions and the prison project.
Changes to certain Revenue Assessments
1.30. As previously outlined, the main contributing factor to the ACT receiving an aboveequal per capita share of the GST pool is the Territory’s limited revenue base.
1.31. The ACT is not able to tax the Commonwealth as the predominant employer in theTerritory.
1.32. The ACT raised some concerns with a number of the current revenue assessmentsin its Main Submission and will comment further on a number of items in Session 11.
1.33. In particular, the ACT has held a long term view that the current assessment forgambling taxation which uses Household Disposable Income (HDI) as a broad measure ofStates capacities to raise revenue from gambling activities is inaccurate, and indeed, anincorrect measure.
1.34. Under a number of measures, the ACT’s tax effort in relation to gambling revenue iswell above the national average – and has recently attracted criticism for this very fact.However, the current assessment, inappropriately leads to the opposite conclusion. Theuse of HDI as a sub-global measure of the revenue base is in fact, a measure of thecommunity’s capacity to pay, not the Territory’s capacity to raise revenue. This isinconsistent with the first of the ‘three pillars’.
Session 1 - ‘Welcome and Business Canberra’
23
1.35. The findings from gambling research undertaken on behalf of the ACT will be raisedin this session in conjunction with the difficulties faced by Casino operations in theTerritory relative to other jurisdictions.
1.36. Other topic areas to be covered in this session include the general lack of revenueopportunities relative to other jurisdictions and compliance issues in regard to mobility (taxleakage) issues.
1.37. The ACT is requesting that the Commission give further consideration to thespecific issues raised by the Territory in these Workplace Discussions.
1.38. The Territory cannot be placed in a position of fiscal equalisation without takingaccount of the special circumstances the ACT finds itself.
1.39. The ACT’s claims are not directly pitched at expenditure disabilities in the normalsense. In the main, they are directed at clarifying the cost and demand disadvantages inrelation to the provision of services to non-residents and increased costs as a result ofCanberra’s role as the national capital.
Conclusion
Session 1 - ‘Welcome and Business Canberra’
24
OBJECTIVES
Timing Presenters Objectives
Session 1: Welcome and Business Canberra
Venue - Regatta Point - Canberra Business Promotion Centre
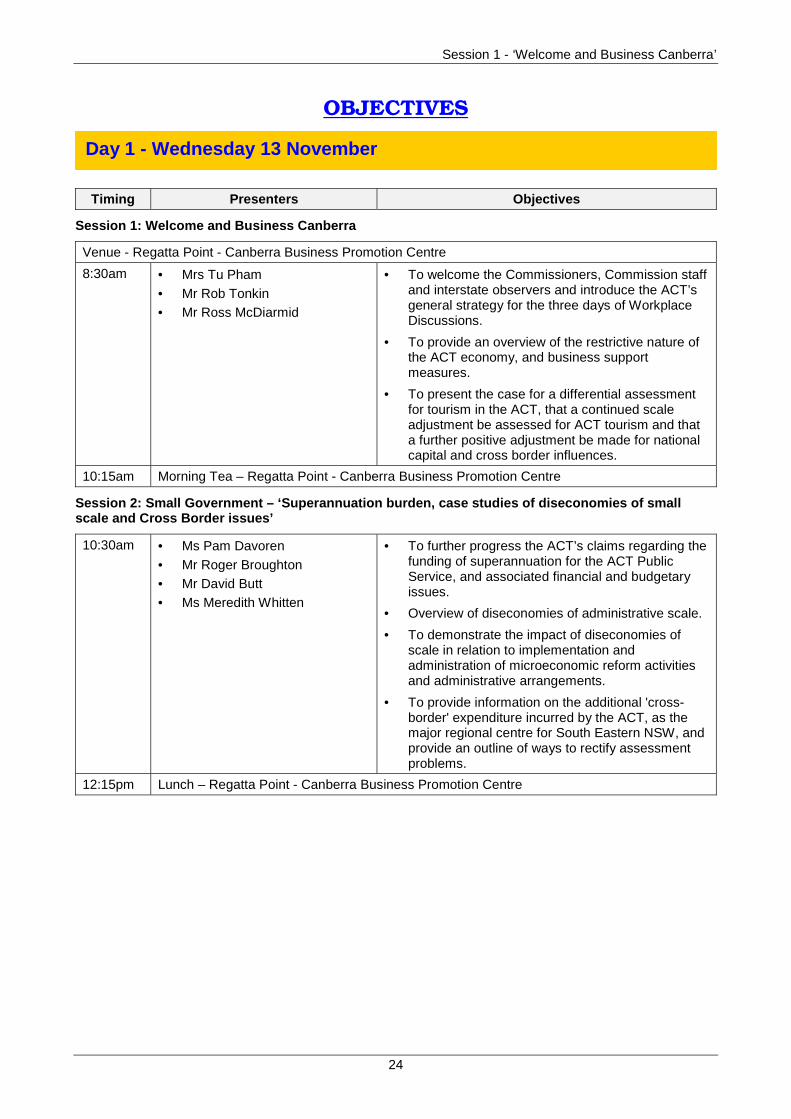
8:30am • Mrs Tu Pham• Mr Rob Tonkin• Mr Ross McDiarmid
• To welcome the Commissioners, Commission staffand interstate observers and introduce the ACT’sgeneral strategy for the three days of WorkplaceDiscussions.
• To provide an overview of the restrictive nature ofthe ACT economy, and business supportmeasures.
• To present the case for a differential assessmentfor tourism in the ACT, that a continued scaleadjustment be assessed for ACT tourism and thata further positive adjustment be made for nationalcapital and cross border influences.
10:15am Morning Tea – Regatta Point - Canberra Business Promotion Centre
Session 2: Small Government – ‘Superannuation burden, case studies of diseconomies of smallscale and Cross Border issues’
10:30am • Ms Pam Davoren• Mr Roger Broughton• Mr David Butt• Ms Meredith Whitten
• To further progress the ACT’s claims regarding thefunding of superannuation for the ACT PublicService, and associated financial and budgetaryissues.
• Overview of diseconomies of administrative scale.
• To demonstrate the impact of diseconomies ofscale in relation to implementation andadministration of microeconomic reform activitiesand administrative arrangements.
• To provide information on the additional 'cross-border' expenditure incurred by the ACT, as themajor regional centre for South Eastern NSW, andprovide an outline of ways to rectify assessmentproblems.
12:15pm Lunch – Regatta Point - Canberra Business Promotion Centre
Day 1 - Wednesday 13 November
Session 1 - ‘Welcome and Business Canberra’
25
Timing Presenters Objectives
Session 3: National Capital Influences – ‘all pervasive in service delivery’
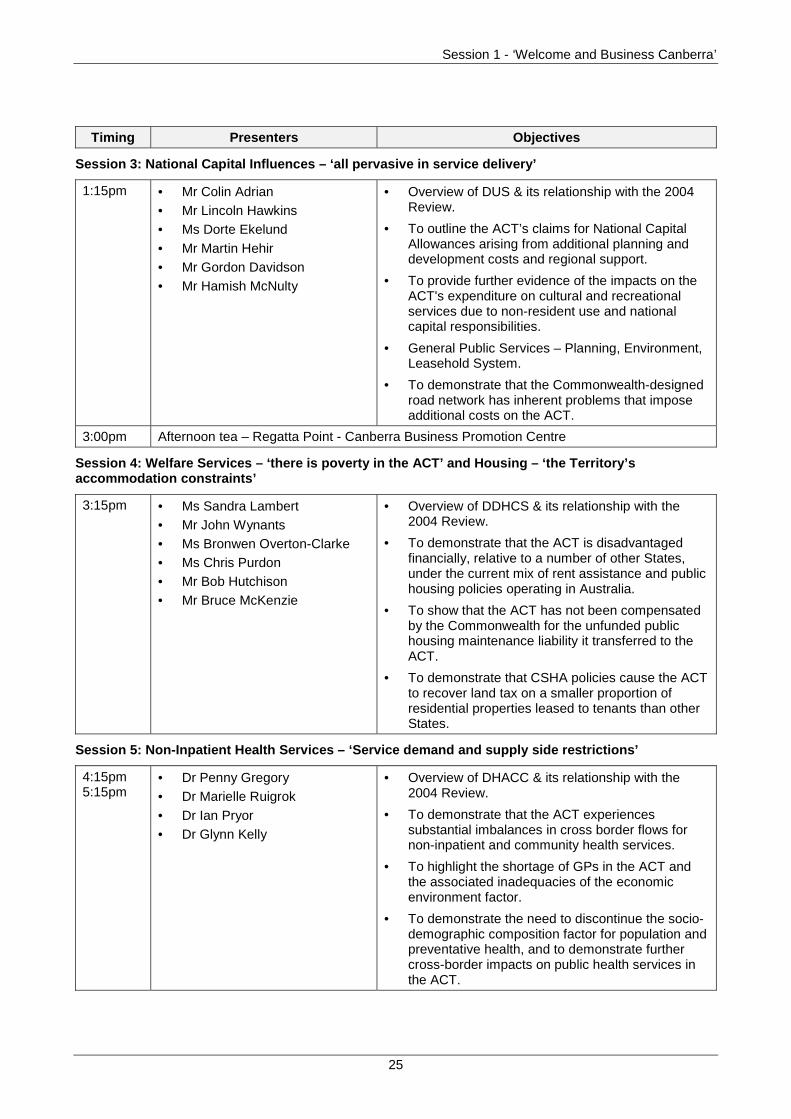
1:15pm • Mr Colin Adrian• Mr Lincoln Hawkins• Ms Dorte Ekelund• Mr Martin Hehir• Mr Gordon Davidson• Mr Hamish McNulty
• Overview of DUS & its relationship with the 2004Review.
• To outline the ACT’s claims for National CapitalAllowances arising from additional planning anddevelopment costs and regional support.
• To provide further evidence of the impacts on theACT's expenditure on cultural and recreationalservices due to non-resident use and nationalcapital responsibilities.
• General Public Services – Planning, Environment,Leasehold System.
• To demonstrate that the Commonwealth-designedroad network has inherent problems that imposeadditional costs on the ACT.
3:00pm Afternoon tea – Regatta Point - Canberra Business Promotion Centre
Session 4: Welfare Services – ‘there is poverty in the ACT’ and Housing – ‘the Territory’saccommodation constraints’
3:15pm • Ms Sandra Lambert• Mr John Wynants• Ms Bronwen Overton-Clarke• Ms Chris Purdon• Mr Bob Hutchison• Mr Bruce McKenzie
• Overview of DDHCS & its relationship with the2004 Review.
• To demonstrate that the ACT is disadvantagedfinancially, relative to a number of other States,under the current mix of rent assistance and publichousing policies operating in Australia.
• To show that the ACT has not been compensatedby the Commonwealth for the unfunded publichousing maintenance liability it transferred to theACT.
• To demonstrate that CSHA policies cause the ACTto recover land tax on a smaller proportion ofresidential properties leased to tenants than otherStates.
Session 5: Non-Inpatient Health Services – ‘Service demand and supply side restrictions’
4:15pm5:15pm
• Dr Penny Gregory• Dr Marielle Ruigrok• Dr Ian Pryor• Dr Glynn Kelly
• Overview of DHACC & its relationship with the2004 Review.
• To demonstrate that the ACT experiencessubstantial imbalances in cross border flows fornon-inpatient and community health services.
• To highlight the shortage of GPs in the ACT andthe associated inadequacies of the economicenvironment factor.
• To demonstrate the need to discontinue the socio-demographic composition factor for population andpreventative health, and to demonstrate furthercross-border impacts on public health services inthe ACT.

Session 1 - ‘Welcome and Business Canberra’
26
Timing Presenters Objectives
Session 6: The ACT – ‘a National Park’
8:30am Bus from Crowne Plaza to Namadgi National Park Visitors’ Centre
• Mr Karl Cloos • Roadside inspections – National Capital claims forsubstandard Commonwealth designed roads.
Venue - Namadgi Visitors’ Centre
9:35am • Ngunnawal Elder. • Welcome to Ngunnawal Country.
9:50am • Dr Maxine Cooper• Mr Geoff Wells• Dr David Shorthouse• Mr Brett McNamara• Mr Terence Uren
• To demonstrate how the design and developmentof Canberra as the National Capital has providedan extensive network of open space areas(including parks and reserves) across the ACT.
• To provide an understanding and acknowledgmentof the extent and location of the ACT’s protectedopen spaces, and their impact on managementcosts, particularly with regard to urbanisationfactors and national capital factors, and indigenousinvolvement in park management.
10:20am Morning tea – Namadgi Visitors’ Centre
10:35am Bus from Namadgi Visitors’ Centre to Dickson College
• Mr Gordon Davidson• Mr Tony Bartlett
• To show that the planning and development ofCanberra prior to self-government led to theintegration of the forest plantation with urban areasand designated parks and reserves.
Session 7: Education – ‘high participation and retention rates, the way forward’
Venue - Dickson College
11:45am • Mr Trevor Wheeler• Mr James Coleborne• Mr Craig Curry• Ms Wendy Coutts• Mr Peter Veenker• Mr Chris Peters
• Overview of DEYFS & its relationship with the2004 Review.
• To re-enforce the ACT's points that the Territory'shigh post-compulsory education participation ratesare the result of the socio-demographic nature ofthe ACT and the nature of its industry and do notresult from above standard service provision.
• To demonstrate the costs of educating children ofnon-diplomatic temporary residents and educatingstudents with a disability.
• To draw out the fact that the ACT continues toattract students from NSW to its schools, in largepart because it is more convenient for parentsrather than because of a perceived above standardlevel of service.
12:45pm Lunch – Dickson College
1:30pm • Government Primary & Secondary Education(continued).
3:00pm Bus to Gungahlin Joint Emergency Services Centre
3:00pm • Mr Hamish McNulty• Ms Dorte Ekelund• Mr Martin Hehir
• Planning issues – National Capital Influences -Gungahlin Drive extension.
Day 2 – Thursday 14 November
Session 1 - ‘Welcome and Business Canberra’
27
Session 8: Law and Order and Public Safety– ‘uncertain times’
Venue – Gungahlin Joint Emergency Services Centre
3:35pm Afternoon tea – Gungahlin Joint Emergency Services Centre
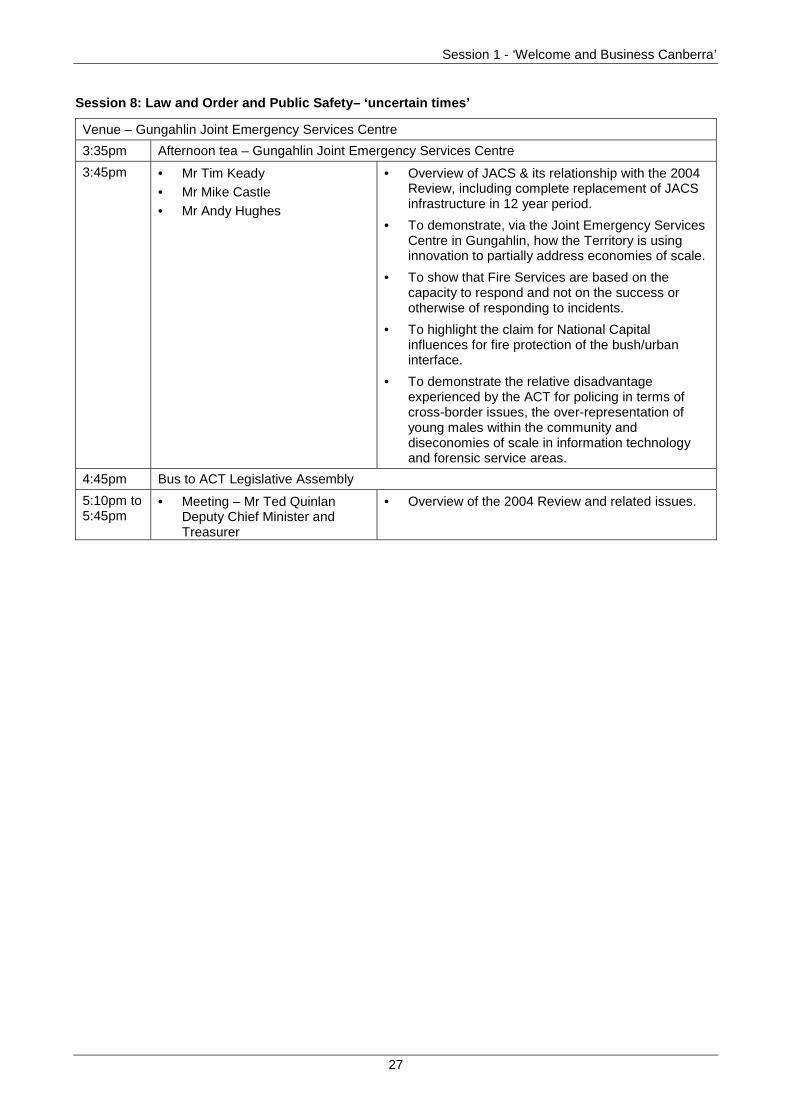
3:45pm • Mr Tim Keady• Mr Mike Castle• Mr Andy Hughes
• Overview of JACS & its relationship with the 2004Review, including complete replacement of JACSinfrastructure in 12 year period.
• To demonstrate, via the Joint Emergency ServicesCentre in Gungahlin, how the Territory is usinginnovation to partially address economies of scale.
• To show that Fire Services are based on thecapacity to respond and not on the success orotherwise of responding to incidents.
• To highlight the claim for National Capitalinfluences for fire protection of the bush/urbaninterface.
• To demonstrate the relative disadvantageexperienced by the ACT for policing in terms ofcross-border issues, the over-representation ofyoung males within the community anddiseconomies of scale in information technologyand forensic service areas.
4:45pm Bus to ACT Legislative Assembly
5:10pm to5:45pm
• Meeting – Mr Ted QuinlanDeputy Chief Minister andTreasurer
• Overview of the 2004 Review and related issues.
Session 1 - ‘Welcome and Business Canberra’
28
Timing Presenters Objectives
Session 9: The ACT – ‘pursuing a healthy community for the region’
8:30am Bus from Crowne Plaza to The Canberra Hospital
Venue - The Canberra Hospital
8:50am • Dr Penny Gregory• Prof. David Ellwood• Assoc. Prof. Mark Bassett• Assoc. Prof. Graham Reynolds
• Overview of DHACC & its relationship with the2004 Review.
• To demonstrate the impact of service deliveryscale on the ACT's costs of delivering inpatientservices.
• To reiterate that ACT health services are heavilyaccessed by socio-demographically different non-resident populations, for which the Territoryreceives minimal reimbursement.
• To demonstrate the difficulties faced by the ACT inattracting qualified medical staff and the additionalcosts imposed on the Territory in doing so.
10:00am Morning Tea – The Canberra Hospital
10:15am • Inpatient Services (continued).
12:00pm Lunch – The Canberra Hospital
Session 10: Corrective Services – ‘the State of origin of ACT prisoners’ and ‘a collaborative regionalapproach’
12:45pm Bus to Supreme Court Building
Venue - Supreme Court Building
1:05pm • Mr Tim Keady• Mr James Ryan• Dr David Hughes
• Creation of the Court of Appeal – service deliveryscale issues.
• To demonstrate the disadvantage the ACTexperiences in comparison with other jurisdictionsin terms of high risk prisoner cost weight, crossborder issues, and to outline the reasons whypersons on Community Based Orders should beincluded in the assessment.
• To demonstrate diseconomies of small scale facedby the ACT in the provision of Corrective Services– Prison case study.
2:15pm Bus to Canberra Casino
Session 11: Gambling – ‘household disposable income’ and Revenue Raising and Future Security –‘now and for future income support’
Venue – Canberra Casino
2:30pm Afternoon tea – Canberra Casino
2:45pm • Mr John Broome• Mr Tony Curtis
• To provide an understanding of the factorsimpacting on gambling behaviour and the impact ofthis for the ACT. In particular, to demonstrate thatHDI is a less than ideal measure of gamblingrevenue raising capacity, and the impact of morerelevant factors on revenue such as high rollers..
Day 3 – Friday 15 November
Session 1 - ‘Welcome and Business Canberra’
29
3:15pm • Dr Mark Mullins • To display the disadvantage that the ACT faces inits ability to raise revenue compared to largerStates, primarily because the Territory has noresource wealth, little business activity and nolocational advantages that result in high wealthbases.
• To reinforce the ACT’s inability to raise revenuefrom the Commonwealth, and the effect that thishas on the capacity to raise payroll tax, land taxand stamp duty revenue.
• To demonstrate the tax leakage that occurs in boththe payroll tax and financial transaction tax basesas a result of the Territory's small geographic sizeand unique location.
Session 12: Wrap up of Discussions
3:45pm to4:30pm
• Mr Roger Broughton • Concluding comments by both the ACT and theCommission on the ACT Workplace Discussions.
Session 1 - ‘Welcome and Business Canberra’
30
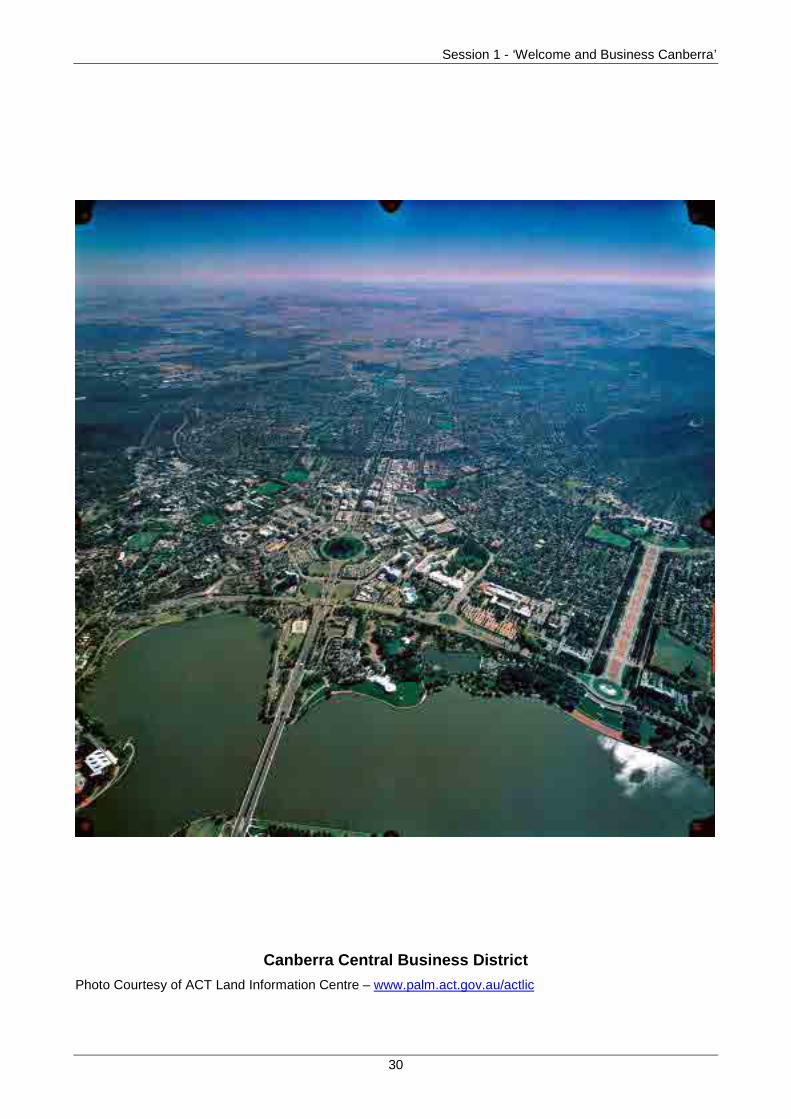
Canberra Central Business District
Photo Courtesy of ACT Land Information Centre – www.palm.act.gov.au/actlic
Session 1 - ‘Welcome and Business Canberra’
31
(B) CANBERRA’S ECONOMIC AND BUSINESS PROFILE
Regatta Point – Canberra Business Promotion Centre.
Mr Robert Tonkin, Chief Executive, ACT Chief Minister’s Department
Robert Tonkin has been the Chief Executive of the ACT Chief Minister’s Department sinceMay 2000. As such, Mr Tonkin is the Head of Administration of the ACT. The Departmentprovides leadership at a whole of government level for the planning, development,coordination and implementation of key Government strategies.
The Department provides a whole of government focus on policy and strategic advice toGovernment; policy and support on women’s and indigenous issues and multiculturalaffairs; the promotion of the economic development of Canberra; information managementpolicy; enhanced public sector management; and management of sport and recreationalprograms.
Prior to his current appointment, Mr Tonkin held the position of Deputy Secretary,Resources and Management within the Department of Defence, following extensiveexperience across a range of Defence policy areas.
Other Departmental Representatives
Mr George Tomlins, Executive Director, CMD Policy Group.
Mr Peter Gordon, Executive Director, Office of Business & Tourism.
Mr Geoff Keogh, Director, BusinessACT.
Presenter
Session Objectives
• The objective of this session is to provide Commissioners with:
− an overview of the ACT economy, including the public/private sector mix;
− action the ACT is undertaking to grow the private sector and to foster economicdevelopment;
− evidence that indicates that the ACT must undertake these business supportactivities because of its unique economic structure in the Australian federation;and
− information that reinforces the need for the ACT to take steps to encouragelocal business activity in a city that was not designed to be self-sustaining.
Venue
Session 1 - ‘Welcome and Business Canberra’
32
1.40. The ACT economy is a direct legacy of the Commonwealth and is constrained bythe structures that were put in place under the previous Commonwealth administration andthese constraints continue because Canberra is the national capital.
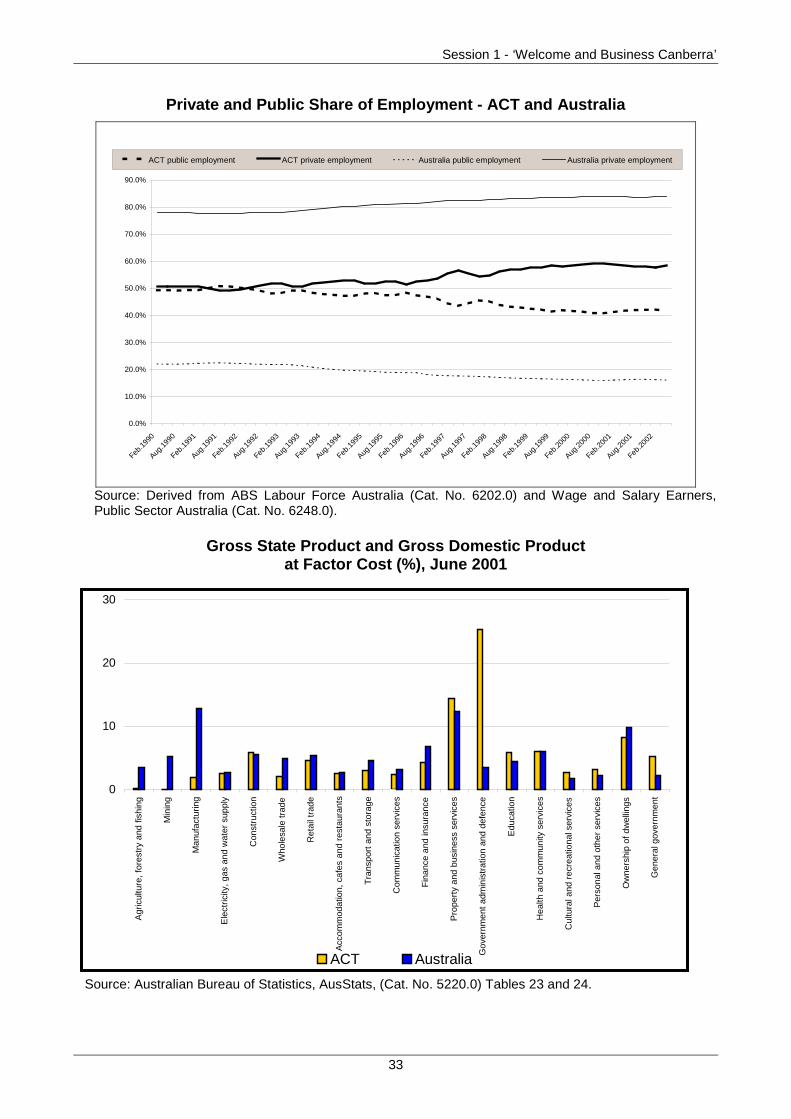
1.41. The ACT has a narrow economic base, and is markedly different to all otherjurisdictions, being disproportionately reliant on the public sector. The following figureshows the proportion of public and private sector employment in both the ACT andAustralia. This lack of diversity has implications for the economy’s ability to sustain itselfthrough the collection of State taxes.
1.42. It has a highly specific economic profile due to the nature of its services andindustries with a high proportion of people in Commonwealth or government employment.
1.43. In 2000-01, public administration and defence, general government, education, andthe health and community service sectors accounted for 42.4% of ACT Gross StateProduct (GSP) compared to 16.1% of national Gross Domestic Product (GDP).
1.44. The ACT does not have a large primary or secondary labour-intensive industry.The contribution to the ACT economy by primary industries (agriculture, forestry andfishing) and mining is negligible, whereas nationally these industries provide 8.8% of GDP.Additionally, the contribution of the manufacturing sector is much lower for the ACT at1.9% compared with 12.8% nationally. This is a large discrepancy and further impacts onthe ACT economic base. The latter figure displays the factor proportions for both ACTGSP and Australian GDP.
Key Points from the ACT Main Submission
• The ACT is opposed to the inclusion of State expenditure assisting industry withinthe scope of the standard budget, and considers that:
- these types of expenses are entirely policy driven, and that no standard policyexists across all States;
- inclusion is contrary to State economic efficiency and would provide a 'safety net'for poor State government policy decisions;
- inclusion could encourage interstate competition, at the expense of the smallerStates;
- depending on the way in which disabilities are assessed, could providesubstantial grant design effects;
- it is unclear how such an assessment would be undertaken; and
- it is not consistent with equalisation.
Structure of the ACT Economy
Session 1 - ‘Welcome and Business Canberra’
33
Private and Public Share of Employment - ACT and Australia
0.0%
10.0%
20.0%
30.0%
40.0%
50.0%
60.0%
70.0%
80.0%
90.0%
Feb.1
990
Aug.1
990
Feb.1
991
Aug.1
991
Feb.1
992
Aug.1
992
Feb.1
993
Aug.1
993
Feb.1
994
Aug.1
994
Feb.1
995
Aug.1
995
Feb.1
996
Aug.1
996
Feb.1
997
Aug.1
997
Feb.1
998
Aug.1
998
Feb.1
999
Aug.1
999
Feb.2
000
Aug.2
000
Feb.2
001
Aug.2
001
Feb.2
002
ACT public employment ACT private employment Australia public employment Australia private employment
Source: Derived from ABS Labour Force Australia (Cat. No. 6202.0) and Wage and Salary Earners,Public Sector Australia (Cat. No. 6248.0).
Gross State Product and Gross Domestic Productat Factor Cost (%), June 2001
Source: Australian Bureau of Statistics, AusStats, (Cat. No. 5220.0) Tables 23 and 24.
0
10
20
30
Agr
icul
ture
, for
estr
y an
d fis
hing
Min
ing
Man
ufac
turin
g
Ele
ctric
ity, g
as a
nd w
ater
sup
ply
Con
stru
ctio
n
Who
lesa
le tr
ade
Ret
ail t
rade
Acc
omm
odat
ion,
caf
es a
nd r
esta
uran
ts
Tra
nspo
rt a
nd s
tora
ge
Com
mun
icat
ion
serv
ices
Fin
ance
and
insu
ranc
e
Pro
pert
y an
d bu
sine
ss s
ervi
ces
Gov
ernm
ent a
dmin
istr
atio
n an
d de
fenc
e
Edu
catio
n
Hea
lth a
nd c
omm
unity
ser
vice
s
Cul
tura
l and
rec
reat
iona
l ser
vice
s
Per
sona
l and
oth
er s
ervi
ces
Ow
ners
hip
of d
wel
lings
Gen
eral
gov
ernm
ent
ACT Australia
Session 1 - ‘Welcome and Business Canberra’
34
1.45. Small business currently represents about 96% of the total number of ACTbusinesses and provides 78% of the private sector employment. It is estimated that10,600 small businesses do not employ staff, other than a single operator and immediatefamily members, who are not always paid.
Commonwealth Legacies
1.46. The Commonwealth did not provide the type of infrastructure necessary to facilitatea vibrant and competitive private sector. In particular, the ACT lacks the transportinfrastructure of other States, including:
• direct access to a port facility;
• an airport with international capacity; and
• adequate rail facilities.
1.47. Increased freight costs impact on the cost of business in the ACT and the size ofthe transport and storage industry.
1.48. The influence of the Commonwealth continues to encroach on the ACT'sinvestment in infrastructure. The Commonwealth maintains control over planning, landmanagement and environmental issues. The overlay of two regulatory regimes makesCanberra uncompetitive and it difficult to compete with other states to attract business tothe ACT.
1.49. The ACT faces additional costs to encourage private sector development andfacilitate a more balanced and diversified economy.
Revenue Base
1.50. The highly concentrated nature of the ACT economy means that options forrevenue raising are considerably more limited than the other States. This has majorimplications for the budget flexibility and fiscal independence of the ACT. Relevant factorsinclude:
• the ACT’s proximity to NSW and its small size, which reduces flexibility in regard to taxpolicy;
• its highly concentrated economy (narrow economic base), which limits the range oftaxes that can be applied; and
• the general exemption available to the Commonwealth, which excludes a substantialproportion of its economic base from its taxable capacity.
1.51. The ACT’s own-source revenue is highly dependent on housing and landtransactions, which affect individuals rather than large companies. Other States have amuch greater diversity of revenue sources, particularly from manufacturing and mining
Restrictions on the ACT’s Capacity to Undertake Industry Assistance
Session 1 - ‘Welcome and Business Canberra’
35
industries. Revenue from commercial property is considerably lower in the ACT, whichhas few high value commercial properties.
1.52. The ACT does not believe that State expenditure assisting industry should beincluded within the scope of the standard budget. If this was to occur, it is unclear howsuch an assessment would be undertaken and if the Territory’s inherent economicdisabilities would be given appropriate recognition.
1.53. The provision of industry assistance is a policy decision. The policy adopted byeach State will vary according to its particular economic circumstances, and there is nostandard policy across jurisdictions. The Territory is mindful, however, of the varyingviews of all jurisdictions expressed at the Commission’s October Conference on this issueand the Commission’s intention to prepare a further discussion paper
1.54. Due to its unique structure in the Australian federation, the ACT must undertakebusiness support activities to overcome the disabilities it faces in the area of economicdevelopment. Apart from a lack of revenue, the ACT cannot compete with other States toattract industry because it does not have State-like infrastructure or the constitutionalpower to autonomously make development decisions.
Business Support Programs
1.55. Programs to encourage investment and support business are primarily targeted atthe small business sector:
• Trade Development Programs, which help business establish or grow offshorecommercial activities. These include market entry facilitation projects, provision of aMarket Development Manager or other specialist assistance.
• Strategic Business Development Programs, which provide a range of flexibleapproaches to supporting developing companies from the start up phase through toexpansion activities. These include the Small Business Employment Ready Program,a free service that enables non-employing businesses located in the ACT to overcomelegislative and procedural barriers to taking on their first and subsequent employees;the Fast Track Assistance Program, offering a range of matched funding supportoptions that will highlight key business areas, issues and opportunities; and ComplexStrategic Development, providing in-depth analysis by a consultant to provide astrategic developmental outcome.
• The Knowledge Fund, comprising a number of separate but integrated grants,established to assist businesses with research and development, especially wherethere are significant commercial applications or social benefit. This includes Grants forProof of Concept, Commercialisation, Industry Development, to StrengthenManagement of High Tech Start-Ups, and Equity Investment. The first of four roundsof Knowledge Fund grants was recently completed.
• The ACT Business Incentive Fund (ACTBIF), which is directed toward assistingbusiness operators to locate, or expand significant new business investment in the
Economic Development / Industry Assistance in the ACT
Session 1 - ‘Welcome and Business Canberra’
36
ACT through tax waivers and land grants, provision of land, or of infrastructure servicessuch as water, sewerage and roads.
• a range of 1 to 1 matched funding for eligible small businesses wishing to have arange of business services provided by an external consultant. These services coverbusiness mentoring, subsidies for business management training, supply chainmanagement, and a range of other services.
• Canberra Business Advisory Service, a program providing small and micro-businessoperators advice and support in the establishment and development of their businessin the Canberra Region.
1.56. The ACT must invest disproportionately large amounts in national initiatives in theeffort to boost its economy. An example of this is the ACT investment of over $10m in theNational Information Communication Technology Centre of Excellence. This Centrewill help build the research and technology sector in the ACT and will focus on small tomedium enterprises.
1.57. The Canberra Commercialisation Council was established this year to bringtogether research institutions, government and business to work collaboratively oncommercialisation systems and infrastructure. Key players in this initiative include theAustralian National University, the Commonwealth Scientific and Industrial ResearchOrganisation and the University of Canberra.
1.58. All States undertake economic development or industry assistance, and theACT, despite its peculiar economic constraints, is no different in this regard.
1.59. However, the lack of a diverse economy restricts ACT policies and vastlyreduces its capacity to compete on a level playing field with other jurisdictions. Theabsence, to any significant degree, of primary industries, manufacturing and mininglimits the range of taxes that the ACT can apply compared with other jurisdictions.This means that the ACT must focus its revenue effort on a smaller range of taxes,however, it has major constraints on the rates it can apply due to its location andsize.
1.60. The narrower range of taxes limits the ability of the ACT to adopt tax policiesdesigned to encourage investment and activity in certain economic areas whilecompensating through higher taxes on other activities. These limitations havemajor consequences for the ACT, which is attempting to create a more diversifiedeconomy and reduce its dependency on the public sector.
Conclusion
Session 1 - ‘Welcome and Business Canberra’
37
(C) SERVICES TO INDUSTRY - TOURISM
Regatta Point – Canberra Business Promotion Centre.
Mr Ross MacDiarmid, Chief Executive, Canberra Tourism and Events Corporation.
In March 2002 Ross took on what he has described as the challenging but very excitingposition as Chief Executive, Canberra Tourism and Events Corporation (CTEC).Challenging because of the lack of critical mass and awareness of the industry within theACT, as well as the external generally negative perceptions of Canberra. He hasdescribed the role as exciting because when considered in the context of the extraordinaryproducts within the Capital Region the ACT has so much to offer any visitor.
Prior to joining CTEC Ross was the Regional General Manager of Ansett Australia for theACT and Region.
Between 1987 and 1994 Ross worked for the Smorgons in Melbourne in a range ofcorporate planning and marketing positions with the last eighteen months as GeneralManager of Smorgon Weldmesh and Fencing. From 1994 to 1998 he was General
Presenters
Venue
Session Objectives
• This session argues for a differential assessment for tourism in the ACT, that acontinued scale adjustment should be assessed for ACT tourism and that a furtherpositive adjustment be made for national capital and cross border influences.
National Capital Influences
• Compliance costs for major events held on national land.
• Revenue loss flowing from National Capital restrictions on commercial activity.
• Costs incurred through marketing National Capital institutions and events.
Cross Border Influences
• Similar to the regional planning cross border payment received for the Territory’sinvolvement in various regional planning forums, the ACT has cross border issuesin relation to tourism.
Scale affected expenditure
• The ACT has significant diseconomies of scale in tourism administration and assuch supports the continued assessment of the disability in the tourism category.
Session 1 - ‘Welcome and Business Canberra’
38
Manager of Lockwood Australia where Ross initiated an aggressive organisation changeprogram, launched a range of new products and merged two competing companies toform Australia’s largest security products company.
Ross has a degree in Economics and a post graduate degree in Business Administration.
1.61. Canberra Tourism and Events Corporation (CTEC) was established by the ACTGovernment to market and develop the ACT as a tourism and events destination. CTECis charged with:
• Marketing the ACT as a tourism destination;
• Encouraging sustainable tourism development;
• Managing major tourism events; and
• Providing visitor services and information and identifying tourism opportunities for theACT.
1.62. Additionally, the ACT Government invests in tourism through a number of otherGovernment agencies. These include national and other parks, heritage sites, theatres,galleries, sports and event venues. Tourists use all facilities of the host region, so ACTGovernment transport services, signage, parks and gardens, roads and parking are allsubject to tourism impacts and the subsequent costs associated with those impacts.
• Tourism is a key generator of economic growth in the ACT. The tourism industrycontributes $1.1 billion across a range of sectors including accommodation, attractionsand transport.
Overview of Tourism Service Delivery in the ACT
Key Points from the ACT Main Submission
Canberra Tourism and Events Corporation has a number of regulatory and complianceobligations placed on the operations it conducts on Commonwealth land by the NationalCapital Authority. These costs are not faced by other states, and include:
• compliance costs for major events held on national land or designated Territoryland;
• additional construction and bond costs;
• losses of revenues from the limitations placed on signage/billboards at major events;
• losses of revenues due to car parking limitations; and
• requirements to maintain and upgrade a variety of public amenities after tourismevents have been held.
Session 1 - ‘Welcome and Business Canberra’
39
• Much tourism expenditure flows to the Commonwealth through revenues generated atnational institutions such as the National Gallery of Australia, the National Science andTechnology Centre and the National Museum of Australia.
• Tourism impacts across the community, contributing to retail sales, with almost half ofall tourism expenditure being on shopping, and reaching into services that are nottraditionally seen as tourism such as the arts, education and sport.
• Tourism employs approximately 14,000 people making tourism the second largestprivate industry in the ACT.
1.63. In Discussion Paper CGC 2002/38 Services to Industry the view was expressedthat the activities of CTEC specifically located in the parliamentary triangle were policydecisions of the ACT Government and commercially motivated. Consequently a view wasexpressed that this should be discussed in the context of deliberations by the Commissionunder the title of economic development.
1.64. Regardless, the Commission paper went on to suggest that promotional expensesincurred by the States are assessed equal per capita and the Commission saw no reasonto recommend to the Commission that the ACT’s claim for a national capital allowanceshould be assessed differentially.
1.65. The ACT contends that the discussion paper does not satisfactorily reflect the basisof the ACT’s claim.
1.66. The Territory is operating a CTEC under impedients unique to its circumstancesarising directly from national capital circumstances and should be accounted for in theServices to Industry category of the 2004 framework. From an ACT perspective, theOctober Conference discussion on Economic Development costs was inconclusive andwould appear to be heading in the direction of possibly assessing headline infrastructureproject costs only.
1.67. The facts are that the ACT incurs additional tourism related costs when utilising itsspecial strengths - the city’s role as the National Capital and one could argue, its onlystrength.
1.68. All jurisdictions have special or unique strengths that are the pivotal plank thatdrives their respective tourism strategies, however, such planning is under the completecontrol of the State in question. This is simply not the case in the ACT.
1.69. The Territory in conducting a tourism industry is faced with supplementarycompliance measures and a regulatory framework that is unique to the ACT and appliedby Commonwealth agencies, most notably the National Capital Authority (NCA). It isoutside the policy control of the ACT Government.
1.70. This regulatory regime ranges from high level policies down to restrictions onsignage. Particular emphasis is placed on the entry corridors to Canberra, tourist drives,tourist facilities and the use of Commonwealth land and Lake Burley Griffin for tourismoperations and events.
Session 1 - ‘Welcome and Business Canberra’
40
1.71. The degree of consultation required by the NCA to obtain approval increases coststo the ACT. CTEC, in conducting its normal operations, estimates that the cost of time andresources incurred in negotiating, liaison and consulting with the NCA and subsequentcompliance with NCA requirements on tourism events and related issues totals a minimumof $1m per year.
1.72. The NCA also imposes disproportionately high compliance costs on individualevents owned by the Territory and conducted on Commonwealth land. This, together withan often confusing and inconsistent approvals process impacts on the Territory’s ability toattract events.
1.73. The ACT Government does not have ownership or direct access to the central apexof the City/State, with the parliamentary triangle and lake foreshores under the directcontrol of the NCA. Nor does the Territory have direct control or access to the nationalinstitutions that are the centrepiece of Canberra’s existence. There are very limitedopportunities available to the ACT Government other than to utilise Commonwealthinfrastructure in attracting and marketing events to the national capital.
1.74. To illustrate the point, the ACT recently lost a national powerboat event, and theeconomic benefits that flow from new events, following an approvals process that wasreversed after event organisers had committed and secured sponsors. This inconsistencysends messages to event organisers across the country. Floriade, Canberra’s nationalfloral festival, incurs many additional costs due to NCA requirements. These additionalrequirements are due to the fact the Floriade event organisers must completely rebuild theevent infrastructure each year and return Commonwealth Park to its original state oncompletion of the event.
1.75. NCA regulation also impacts on the revenue base for tourism and event operatorsby imposing severe restrictions on signs upon Commonwealth land, limiting exposure forsponsors and, consequently, revenue for event organisers.
1.76. The ACT Government, through CTEC, estimates it spends in the order of $2m tomarket Canberra as the National Capital, in addition to any separate outlay by the NCAitself, which one could possibly argue should be entirely a Commonwealth responsibility.
1.77. In a similar vein to the ACT participation in regional planning, for which a crossborder payment is received, the ACT government supports a regional approach to tourismby funding the operation of CTEC, and the ACT and Region Tourism Industry Council.
1.78. The latter organisation has a regional membership base and incurs costs servicingthat base. CTEC works closely with Tourism NSW to coordinate tourism partnershipsacross the region, and provides a regional gateway tourism centre on the main approachto Canberra.
1.79. CTEC’s marketing collateral includes a significant proportion of regional material,promoting Capital Country, the Snowy Mountains and the NSW South Coast. The totalcost of the provision of these services to the region is in the order of $1m.
Cross Border Issues
Session 1 - ‘Welcome and Business Canberra’
41
1.80. The ACT continues to face higher per capita costs associated in relation to theadministration of tourism expenditure relative to the majority of States. All States arecompelled to be a part of the national agenda on tourism despite competing for the samevisitors.
1.81. The ACT suffers from significant diseconomies of scale in tourism marketing andadministration. Essentially, tourism promotion in the ACT compared with the larger Statesrequires disproportionately higher levels of government expenditure to maintain areasonable market position.
1.82. As a consequence of these diseconomies of small scale the ACT supports thecontinued assessment of an administrative scale disability for the Tourism category andrevision of the estimate of fixed costs.
1.83. The ACT Government faces many additional tourism costs due to the uniqueenvironment created by National Capital Influences that tourism in the ACT mustoperate in.
1.84. The ACT believes that an assessment of administrative scale and input costdisabilities for the tourism assessment is appropriate and a national capitalallowance and cross border impact be assessed for the Territory as part of the 2004review.
Conclusion
Scale Affected Expenditure
Session 2 - ‘Superannuation Burden, Diseconomies of Small Scale and Cross Border Issues’
42
DAY ONE
WEDNESDAY, 13 NOVEMBER 2002
SESSION 2. – SMALL GOVERNMENT – ‘SUPERANNUATIONBURDEN, CASE STUDIES OF DISECONOMIES OF SMALL
SCALE AND CROSS BORDER ISSUES’:
(A) Superannuation Issues - CSS and PSS.
(B) Administrative Scale – Diseconomies of Scale Impacts on the ACT.
(C) Cross Border Assessments.
Session 2 - ‘Superannuation Burden, Diseconomies of Small Scale and Cross Border Issues’
43
(A) SUPERANNUATION ISSUES – CSS AND PSS
Regatta Point - Canberra Business Promotion Centre.
Ms Pam Davoren, Executive Director, Public Sector Management and Labour PolicyGroup, ACT Chief Minister’s Department.
Ms Davoren has extensive senior management experience across the full spectrum ofpublic sector employment matters, including industrial relations, employment legislationand employment policy.
Pam is currently responsible for public sector employment policy as well as public andprivate sector industrial relations policy in the ACT.
Mr Roger Broughton, Acting Deputy Under Treasurer, ACT Department of Treasury.
Presenters
Venue
Session Objectives
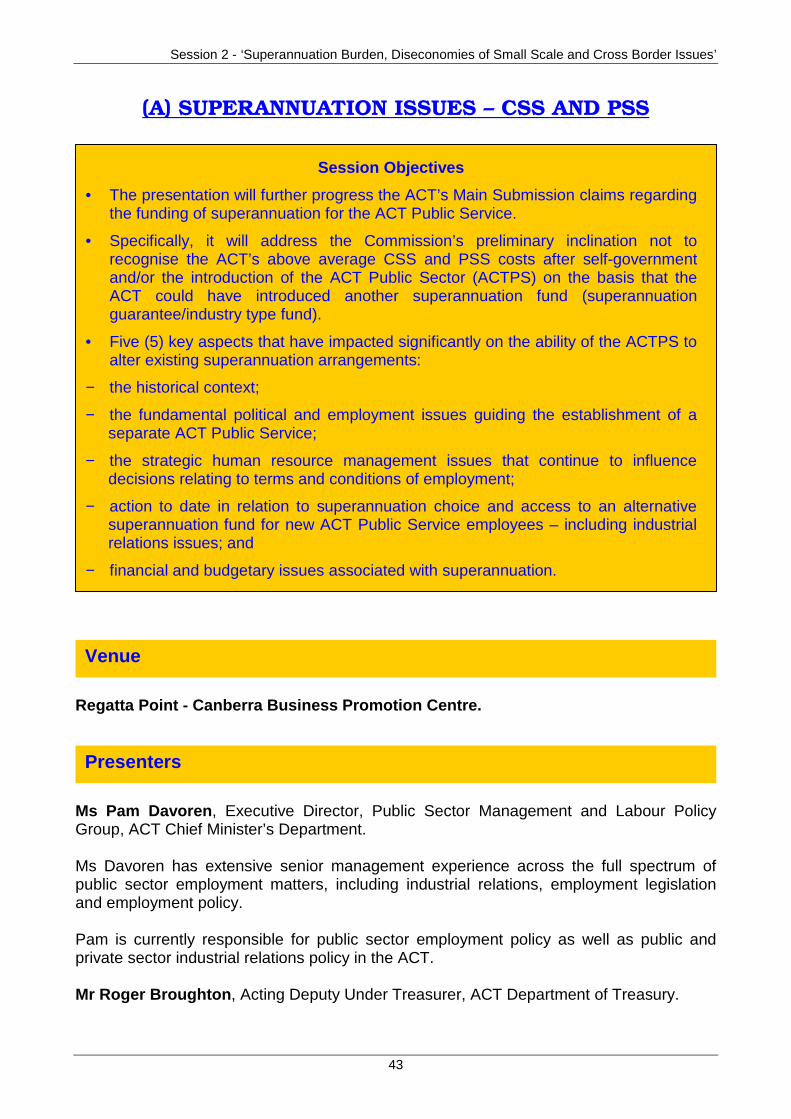
• The presentation will further progress the ACT’s Main Submission claims regardingthe funding of superannuation for the ACT Public Service.
• Specifically, it will address the Commission’s preliminary inclination not torecognise the ACT’s above average CSS and PSS costs after self-governmentand/or the introduction of the ACT Public Sector (ACTPS) on the basis that theACT could have introduced another superannuation fund (superannuationguarantee/industry type fund).
• Five (5) key aspects that have impacted significantly on the ability of the ACTPS toalter existing superannuation arrangements:
− the historical context;
− the fundamental political and employment issues guiding the establishment of aseparate ACT Public Service;
− the strategic human resource management issues that continue to influencedecisions relating to terms and conditions of employment;
− action to date in relation to superannuation choice and access to an alternativesuperannuation fund for new ACT Public Service employees – including industrialrelations issues; and
− financial and budgetary issues associated with superannuation.
Session 2 - ‘Superannuation Burden, Diseconomies of Small Scale and Cross Border Issues’
44
2.1. In considering the ACT’s Main Submission, Commission staff were inclined torecommend to the Commission that additional superannuation costs incurred by theTerritory for members of the CSS inherited at the time of self-government should continueto be recognised. However, the Commission were inclined not to recommend anydisability associated with CSS membership after self-government (or after some date closeto self-government).
Key points from the ACT Main Submission
Superannuation Scheme Costs for ACT Government Employees
• The ACT has been unable to reduce its superannuation costs because:
− it does not have the legislative power to amend the Acts under which it providessuperannuation;
− under the Superannuation Guarantee Guidelines, the ACT Government, as anemployer, can not force existing employees into lower yielding funds; and
− the close proximity and dominance of the Commonwealth Public Sector in theACT, which requires the Territory to offer comparable employment conditions,including superannuation contributions, in order to remain competitive in the locallabour market - the ACT’s superannuation policy choices are constrained by theCommonwealth’s policies.
Superannuation Scheme Administration Costs
• Unlike the majority of other superannuation schemes, members of the CSS and PSSare not charged administration fees, these costs are borne entirely by employers.
• The ACT requests that a disability factor be assessed to reflect the additionaladministration costs borne by the ACT for its CSS and PSS member employees,which total approximately $2.5m per annum.
Adjustments to the Superannuation Assessment
• The ACT requests that the CSS adjustment be revised upwards, as the current 5%allowance significantly underestimates the ACT’s accruing liabilities:
− the ACT incurs $30.7m in superannuation expenses for the above standard costsof the CSS.
• The ACT also requests the introduction of a PSS adjustment to reflect the abovestandard superannuation costs accruing to the ACT as a result of the PSS:
− the ACT incurs $6.8m in superannuation expenses for the above standard costs ofthe PSS.
Key points from the Commission’s Discussion Paper
Session 2 - ‘Superannuation Burden, Diseconomies of Small Scale and Cross Border Issues’
45
2.2. Furthermore, Commission staff were not inclined to accept:
• any additional costs associated with the PSS as its costs are considered to reflectstandard levels; nor
• the claim that the ACT must offer the same superannuation conditions as theCommonwealth Government to allow it to obtain comparable staff.
2.3. Commission staff stated that the Territory would need to demonstrate why morethan the ‘inherited’ CSS costs should be included. Commission staff consider that theACT could have established its own schemes from close to the time of self-government, orfrom the time of the establishment of its Public Service separate from the Commonwealth.
2.4. The following dot points capture the issues relevant to further consideration byCommission staff:
• does the ACT really have no choice but to tie its superannuation arrangements to thoseof the Commonwealth and why was it constrained from introducing its ownsuperannuation scheme?;
• why should the ACT’s above average CSS/PSS costs be recognised after self-government and/or the formation of the ACT Pubic Service (ACTPS)?;
• what is superannuation actually costing the Territory?; and
• what should the Commission accept as the standard State policy for superannuation?
2.5. The answers to these questions, and additional information provided in supports ofthe ACT’s case are provided in the following paragraphs.
Prior to Self Government
2.6. Public administration of the ACT prior to self government was undertaken by arange of administrative units attached to Commonwealth departments.
2.7. The move to self government of the ACT in 1989 provided the catalyst for futureplanning for the kind of public service required to support the workings of a government ofthe Territory.
Post Self Government – 1989
2.8. During the period from 1989 to 1994, the public administration of the ACT wasmanaged in a transitional manner. Employees from eleven (11) Commonwealthdepartments, five (5) major statutory authorities and numerous smaller agencies (over140) were moved into one administration, and subsequently became a government servicedevoted solely to serving the residents of the ACT.
Historical Overview of the ACT Public Service
Session 2 - ‘Superannuation Burden, Diseconomies of Small Scale and Cross Border Issues’
46
2.9. An Office of Public Sector Management was established in 1990 to both advise theChief Minister on the ministerial responsibilities for managing the public sector, and toassist the head of administration in the management of the public service. It is importantto note that, prior to 1 July 1994, all employees were still part of the Australian PublicService. They were effectively ‘on loan’ to the ACT from the Commonwealth andemployed under the terms and conditions that applied to the Commonwealth at that time.
2.10. In April 1992, the then Chief Minister, Ms Rosemary Follett, received a letter fromthe then Prime Minister, Mr Paul Keating, proposing the Commonwealth and the Territorycommence moves towards establishing a separate ACT Public Service.
2.11. This move to a separate public service was progressed on the basis of agreementto three threshold issues:
• that the transition to a separate service would occur only with full union involvement;
• an establishment grant be provided to cover the costs of establishing a task force tomanage the transition to a separate service; and
• the Commonwealth guarantee the rights and entitlements of ACT Governmentemployees. This was done to allay any concerns that staff moving into the new publicservice might have in relation to issues such as terms and conditions, portability, andtransfer and mobility arrangements between the new service and Commonwealthdepartments.
2.12. These threshold issues were agreed in December 1992.
2.13. At this time, it was agreed that a commencement date for the new service beidentified as July 1994, and work was commenced toward this target.
Separate Service – July 1994
2.14. The separate ACT Public Service (at that stage referred to as the ACT GovernmentService) was formally established on 1 July 1994, with passage of legislation by theCommonwealth and the ACT.
2.15. The creation of the separate service brought with it a series of mobilityarrangements with the Commonwealth, which were set out in some detail in the PublicService Commission document, “Mobility Arrangements for Officers of the AustralianPublic Service and the ACT Government Service”, dated September 1995. Thesearrangements included the portability of certain benefits, which would, at that time, haveincluded ongoing access to the Commonwealth superannuation schemes.
2.16. It was not until the commencement of the Public Employment (Consequential andTransitional) Amendment Act 1999 (PECTA Act) in early December 1999 that thetransitional arrangements were formally repealed.

Session 2 - ‘Superannuation Burden, Diseconomies of Small Scale and Cross Border Issues’
47
Transfer, Attraction, Retention and Competitors
2.17. As can be seen by the emphasis contained in the three threshold matters discussedand agreed with the Commonwealth as a precursor to establishing a separate ACT PublicService, the issues of transfer (in the short term) and attraction and retention in the longerterm were fundamental to the Government of the day as it proceeded to negotiate with theCommonwealth.
2.18. In a Ministerial Statement on a separate ACT Public Service made to the Assemblyon 11 May 1993, the Chief Minister made a series of statements, in the context of theapproach proposed by the Commonwealth, relating to the future employmentarrangements for the public service. In summary, these were:
• a formalisation of a strong relationship between the two services, with endorsement ofthis by the Prime Minister and the Unions;
• a vision for mobility of staff between the ACT Public Service and the Australian PublicService - the aim of this arrangement was to maximise career opportunities and giveour public service the broadest possible pool from which to recruit talented staff toserve the community;
• an acknowledgment that the ACT Public Service would be sharing the employmentmarket with Canberra’s largest employer, the Australian Public Service, and in manycases would be competing with them for the same talented staff;
• a need to ensure that mobility is easy to facilitate between the two services to enhancethe ability of the ACT Public Service to attract the best people; and
• a reassurance of access to some key employment arrangements, including:
− continued access to the Commonwealth superannuation schemes;
− continued access to workers compensation arrangements through Comcare;
− the option to continue to use a range of Commonwealth recruitment and traineeshipprograms;
− continued access to the Merit Protection and Review Agency; and
− continued use of Commonwealth training and development and competencystandards.
2.19. These requirements set the framework for the structure and terms and conditionsfor the new ACT Public Service, to be achieved through a variety of methods including thePublic Sector Management Act 1994 (ACT), the 1994 Enterprise Bargaining processesand a range of administrative and employment related arrangements.
Creating a Separate ACT Public Service
Session 2 - ‘Superannuation Burden, Diseconomies of Small Scale and Cross Border Issues’
48
2.20. For the ACT Public Service to remain competitive within the employment market,particularly within the public sector employment market in the ACT, it must pay attention toa range of strategic human resource management issues.
Government policy parameters
2.21. Government policy as it relates to the public service sets the key directions forchange. The current ACT Government considers that removal of access to the PSSsuperannuation scheme would be unacceptable, as it would erode the consistency andequity of employment conditions within the service which is considered a fundamentalemployment principle.
Terms and conditions of employment
2.22. The terms and conditions of employment must, as a minimum, enable the ACTPSto employ sufficiently skilled people to enable it to provide the services required by theGovernment and the community. Superannuation is a key component of the terms andconditions package for all employees within the public service.
Industrial relations
2.23. Any changes to employment arrangements need to be achievable and manageablewithin the industrial relations environment in which they operate. The ACT operates on acollaborative basis with unions in relation to employment related matters.
2.24. Unions strongly oppose changes to access for new employees to the PSS scheme.In the absence of a replacement scheme that mirrors the current PSS scheme, unions willresist any attempts at change. Further, the establishment of any replacement schememirroring the PSS, while likely to be acceptable to the unions, will bring with it theassociated additional establishment and administrative costs for the Territory, as well as acontinuation of the longer term budgetary pressures currently associated with the PSS.
Total remuneration packages
2.25. Superannuation is an important part of a total remuneration package. Anyapproach to reducing the overall superannuation benefit as a component of the totalremuneration package (quite aside from the industrial issues already identified) is likely toalso attract demands for additional salary payments to offset the reduced value of theoverall remuneration package.
Supply and demand
2.26. The ACT Public Service is operating in a unique public service employment market.Unlike other jurisdictions, where Australian Public Service employment opportunities maybe both limited in number and scope of function, the ACTPS is in direct competition with a
Strategic Human Resource Management Issues
Session 2 - ‘Superannuation Burden, Diseconomies of Small Scale and Cross Border Issues’
49
range of large Australian Public Service agencies for the services of experienced publicservants living in Canberra.
2.27. Each week, via the press and Gazette, public sector employees have access to alarge number of Canberra based positions, across a wide range of employing agencies.
2.28. The public sector employment market in the ACT is also much more fragmentedthan in the recent past, with agency based certified agreements providing for a wide rangeof pay and terms and conditions related outcomes. The ACT Public Service currentlystruggles to compete.
2.29. Any change to the superannuation arrangements for the ACT Public Servicein advance of changes in the Australian Public Service will impact adversely on itsability to compete for staff.
2.30. Further, this would restrict the movement of staff between the ACT and theAustralian Public Services. Consistency in core conditions such as superannuationis critical to maintaining continued mobility between the two services.
Commonwealth legislative changes
2.31. The Commonwealth closed access to the CSS superannuation scheme in 1990.While this had the obvious effect of preventing new members from joining the scheme,existing members were able to continue to contribute and the existing employer obligationsunder the scheme were required to continue to be met.
2.32. The Commonwealth has proposed for a number of years that superannuationchoice should be implemented and that the current Commonwealth public sectorsuperannuation scheme, PSS, should be closed to new members. Closure of the PSSwas first announced on 23 September 1997, with access to new members to cease from 1July 1998.
2.33. These proposed legislative changes have encountered repeated problems sincebeing first introduced into the Federal Parliament. In particular the closure of the PSSscheme has been problematic. As a result, the proposed legislative changes have still notbeen passed by the Parliament.
2.34. It is understood that the current approach by the Federal Government to theseissues will be to introduce legislation relating to superannuation choice separately to theissue of closure of the PSS scheme. It is understood that splitting the legislation meansthat closure of the PSS scheme is now unlikely to occur before July 2004.
ACT Public Service action to date
2.35. The ACT has long been aware of the financial implications that continued access tothe PSS scheme has on the Territory’s finances.
Superannuation Choice
Session 2 - ‘Superannuation Burden, Diseconomies of Small Scale and Cross Border Issues’
50
2.36. In the 1997-98 ACT Budget, the medium to longer-term impact of the continuationof access to the PSS scheme was identified and costed.
2.37. As a result of both the budget analysis and the Federal Government’sannouncement of the closure of the PSS, a review of the Public Sector superannuationarrangements as they applied to the ACT Public Service was commissioned in November1997.
2.38. The terms of reference for the review were as follows:
• review the work done to date on superannuation liabilities for the ACT Public Service;
• gain a sound understanding of the implications of Commonwealth proposals and theirimplications for the ACT public sector;
• assess the characteristics of the ACT public sector now and in the future in relation tosuperannuation;
• gain a sound understanding of superannuation arrangements and expectations in thepublic and private sectors across Australia including a view on community standards.
• bring forward options for addressing the unfunded liabilities; and
• develop options for, and a preferred approach to, future superannuation arrangementsfor the ACT public sector.
2.39. This work was to be completed by 31 March 1998.
2.40. Towers Perrin was selected to undertake this work and a report was provided inApril 1998.
2.41. Following on from the recommendations in this report, and despite theannouncement of the delay of the choice of fund regime by the Federal Government on 8April 1998, the ACT Government proceeded to establish an alternative superannuationarrangement for the ACT Public Service.
2.42. Further work towards an alternative superannuation fund was considered necessarygiven the Federal Government’s express commitment to proceed with the choice of fundregime and the obvious financial issues as identified in both the budget and the TowersPerrin report.
2.43. In May 1998, the ACT decided to introduce superannuation choice arrangementsfor new ACT Public Service employees with effect from 1 July 1999.
2.44. A default fund (AMP Customsuper) was selected as the default fund, and theemployer contributions were set at the Superannuation Guarantee Act level applicable atthat time – 7%.
2.45. At that time, it was still unclear as to whether the Federal Government would beable to achieve passage of the choice of fund legislation and closure of the PSS fund tonew members.
Session 2 - ‘Superannuation Burden, Diseconomies of Small Scale and Cross Border Issues’
51
2.46. The implementation of the revised arrangements in the ACT from 1 July 1999 wasprevented by industrial action commenced by a range of unions in mid-June 1999. Theunions involved included the Australian Education Union (AEU) and the Australian NursesFederation (ANF). The central point of dispute was whether the proposed changes couldbe introduced, as the unions argued that they were inconsistent with the clauses within anumber of certified agreements that prevented diminution of core terms and conditions.
2.47. On the basis of legal advice the proposed changes were deferred until such time asthe impediments to change contained in a range of agency certified agreements wereaddressed.
2.48. At the direction of the Australian Industrial Relations Commission (AIRC), at ahearing in relation to this matter on 29 June 1999, the ACT Government undertook to:
• withdraw an earlier request to the Commonwealth to close access to the PSS for newstarters to the ACT Public Service;
• make no future request to the Commonwealth without providing the AIRC and relevantunions with at least one month’s notice; and
• that the Government would not be moving to change the superannuation entitlement ofexisting employees under the PSS and CSS schemes
2.49. While the issues in relation to the clauses in enterprise agreements were resolvedin the next round of agency agreements, further implementation work has been delayed.
2.50. Given the industrial sensitivities and the importance of the ACT to maintainits ability to compete with the Commonwealth for staff, the ACT Government at thattime decided that any further movement to close access to the PSS scheme to newemployees must await the implementation of similar changes to superannuationarrangements within the Commonwealth.
Future scenarios
2.51. The current ACT Government shares the same view of the desirability ofsuperannuation choice and closure of the PSS scheme as the previous government did.
2.52. As a result, closure of access to the PSS scheme for new ACTPS employees andestablishment of a replacement default scheme will not occur in advance of closure of thePSS by the Federal Government.
Superannuation Arrangements
2.53. Full-time ACT Government employees participate in two superannuation schemes:
Financial and Budgetary Issues
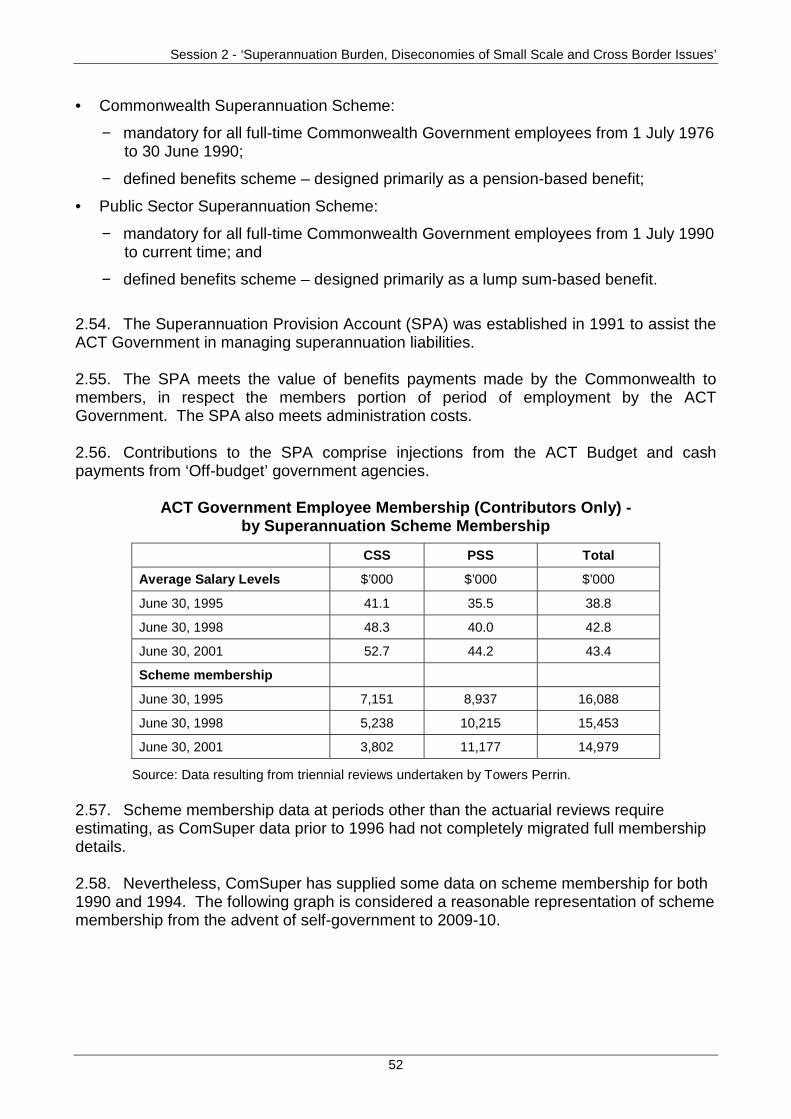
Session 2 - ‘Superannuation Burden, Diseconomies of Small Scale and Cross Border Issues’
52
• Commonwealth Superannuation Scheme:
− mandatory for all full-time Commonwealth Government employees from 1 July 1976to 30 June 1990;
− defined benefits scheme – designed primarily as a pension-based benefit;
• Public Sector Superannuation Scheme:
− mandatory for all full-time Commonwealth Government employees from 1 July 1990to current time; and
− defined benefits scheme – designed primarily as a lump sum-based benefit.
2.54. The Superannuation Provision Account (SPA) was established in 1991 to assist theACT Government in managing superannuation liabilities.
2.55. The SPA meets the value of benefits payments made by the Commonwealth tomembers, in respect the members portion of period of employment by the ACTGovernment. The SPA also meets administration costs.
2.56. Contributions to the SPA comprise injections from the ACT Budget and cashpayments from ‘Off-budget’ government agencies.
ACT Government Employee Membership (Contributors Only) -by Superannuation Scheme Membership
CSS PSS Total
Average Salary Levels $’000 $’000 $’000
June 30, 1995 41.1 35.5 38.8
June 30, 1998 48.3 40.0 42.8
June 30, 2001 52.7 44.2 43.4
Scheme membership
June 30, 1995 7,151 8,937 16,088
June 30, 1998 5,238 10,215 15,453
June 30, 2001 3,802 11,177 14,979
Source: Data resulting from triennial reviews undertaken by Towers Perrin.
2.57. Scheme membership data at periods other than the actuarial reviews requireestimating, as ComSuper data prior to 1996 had not completely migrated full membershipdetails.
2.58. Nevertheless, ComSuper has supplied some data on scheme membership for both1990 and 1994. The following graph is considered a reasonable representation of schememembership from the advent of self-government to 2009-10.
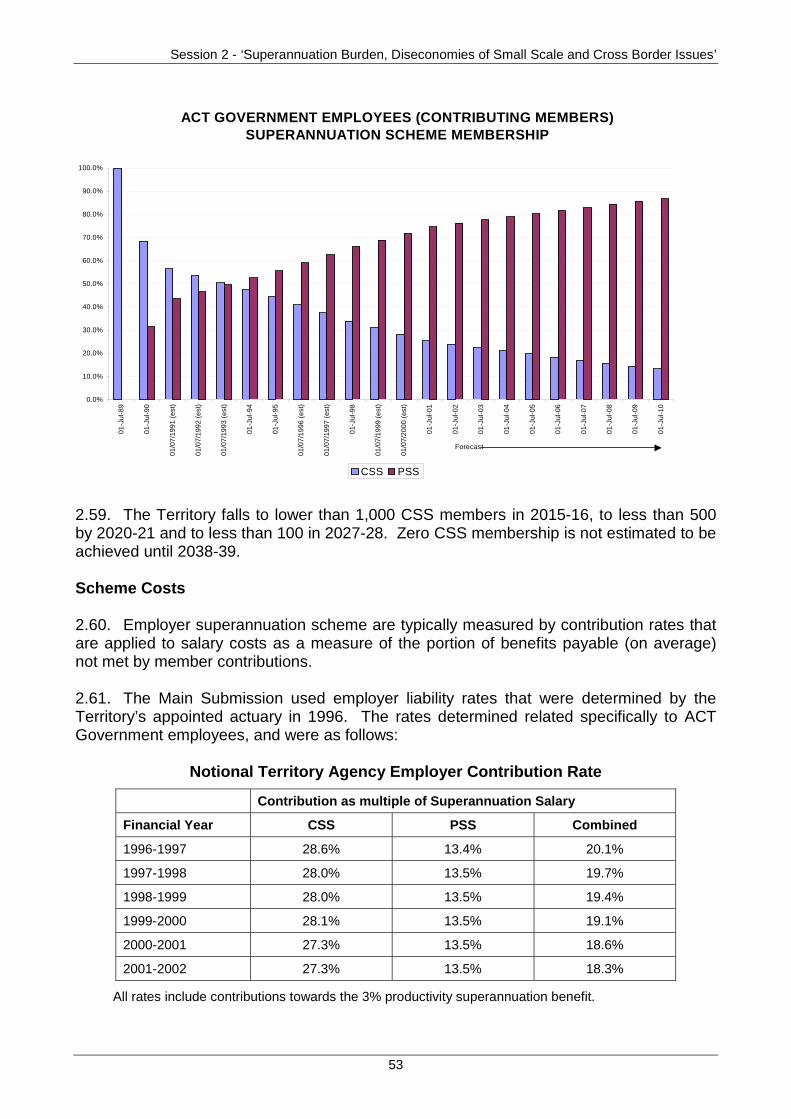
Session 2 - ‘Superannuation Burden, Diseconomies of Small Scale and Cross Border Issues’
53
2.59. The Territory falls to lower than 1,000 CSS members in 2015-16, to less than 500by 2020-21 and to less than 100 in 2027-28. Zero CSS membership is not estimated to beachieved until 2038-39.
Scheme Costs
2.60. Employer superannuation scheme are typically measured by contribution rates thatare applied to salary costs as a measure of the portion of benefits payable (on average)not met by member contributions.
2.61. The Main Submission used employer liability rates that were determined by theTerritory’s appointed actuary in 1996. The rates determined related specifically to ACTGovernment employees, and were as follows:
Notional Territory Agency Employer Contribution Rate
Contribution as multiple of Superannuation Salary
Financial Year CSS PSS Combined
1996-1997 28.6% 13.4% 20.1%
1997-1998 28.0% 13.5% 19.7%
1998-1999 28.0% 13.5% 19.4%
1999-2000 28.1% 13.5% 19.1%
2000-2001 27.3% 13.5% 18.6%
2001-2002 27.3% 13.5% 18.3%
All rates include contributions towards the 3% productivity superannuation benefit.
ACT GOVERNMENT EMPLOYEES (CONTRIBUTING MEMBERS) SUPERANNUATION SCHEME MEMBERSHIP
0.0%
10.0%
20.0%
30.0%
40.0%
50.0%
60.0%
70.0%
80.0%
90.0%
100.0%
01-J
ul-8
9
01-J
ul-9
0
01/0
7/19
91 (
est)
01/0
7/19
92 (
est)
01/0
7/19
93 (
est)
01-J
ul-9
4
01-J
ul-9
5
01/0
7/19
96 (
est)
01/0
7/19
97 (
est)
01-J
ul-9
8
01/0
7/19
99 (
est)
01/0
7/20
00 (
est)
01-J
ul-0
1
01-J
ul-0
2
01-J
ul-0
3
01-J
ul-0
4
01-J
ul-0
5
01-J
ul-0
6
01-J
ul-0
7
01-J
ul-0
8
01-J
ul-0
9
01-J
ul-1
0
CSS PSS
Forecast
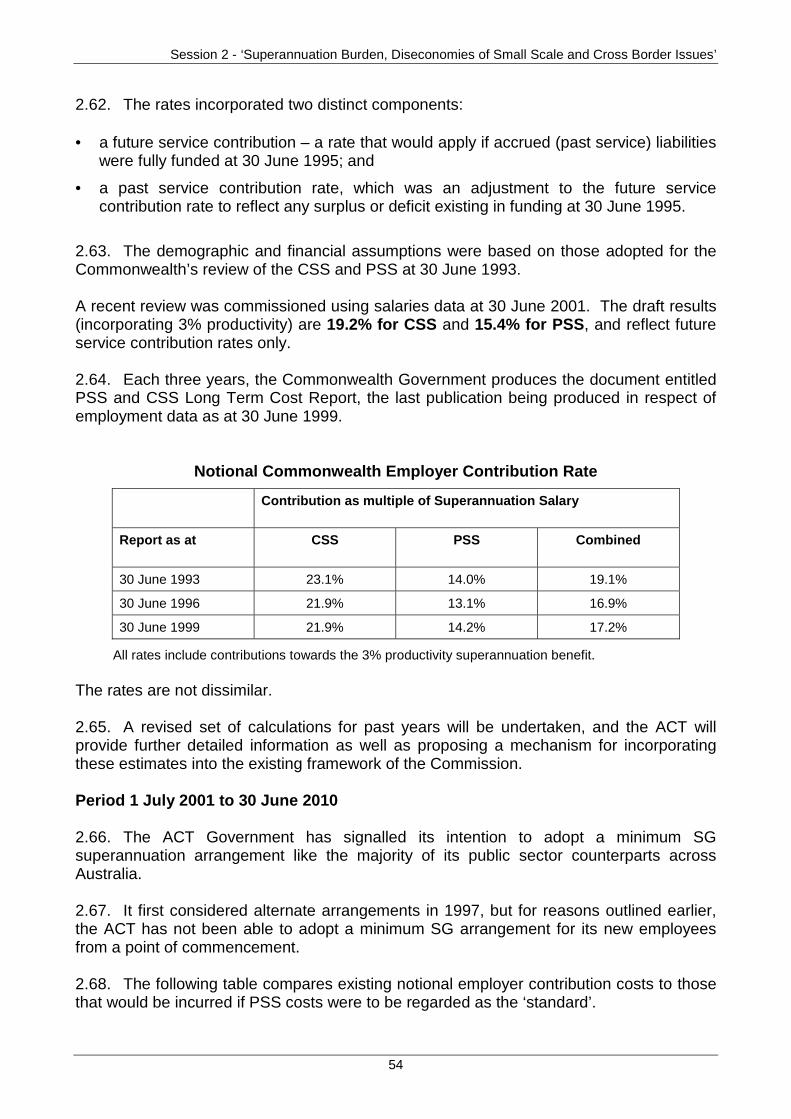
Session 2 - ‘Superannuation Burden, Diseconomies of Small Scale and Cross Border Issues’
54
2.62. The rates incorporated two distinct components:
• a future service contribution – a rate that would apply if accrued (past service) liabilitieswere fully funded at 30 June 1995; and
• a past service contribution rate, which was an adjustment to the future servicecontribution rate to reflect any surplus or deficit existing in funding at 30 June 1995.
2.63. The demographic and financial assumptions were based on those adopted for theCommonwealth’s review of the CSS and PSS at 30 June 1993.
A recent review was commissioned using salaries data at 30 June 2001. The draft results(incorporating 3% productivity) are 19.2% for CSS and 15.4% for PSS, and reflect futureservice contribution rates only.
2.64. Each three years, the Commonwealth Government produces the document entitledPSS and CSS Long Term Cost Report, the last publication being produced in respect ofemployment data as at 30 June 1999.
Notional Commonwealth Employer Contribution Rate
Contribution as multiple of Superannuation Salary
Report as at CSS PSS Combined
30 June 1993 23.1% 14.0% 19.1%
30 June 1996 21.9% 13.1% 16.9%
30 June 1999 21.9% 14.2% 17.2%
All rates include contributions towards the 3% productivity superannuation benefit.
The rates are not dissimilar.
2.65. A revised set of calculations for past years will be undertaken, and the ACT willprovide further detailed information as well as proposing a mechanism for incorporatingthese estimates into the existing framework of the Commission.
Period 1 July 2001 to 30 June 2010
2.66. The ACT Government has signalled its intention to adopt a minimum SGsuperannuation arrangement like the majority of its public sector counterparts acrossAustralia.
2.67. It first considered alternate arrangements in 1997, but for reasons outlined earlier,the ACT has not been able to adopt a minimum SG arrangement for its new employeesfrom a point of commencement.
2.68. The following table compares existing notional employer contribution costs to thosethat would be incurred if PSS costs were to be regarded as the ‘standard’.
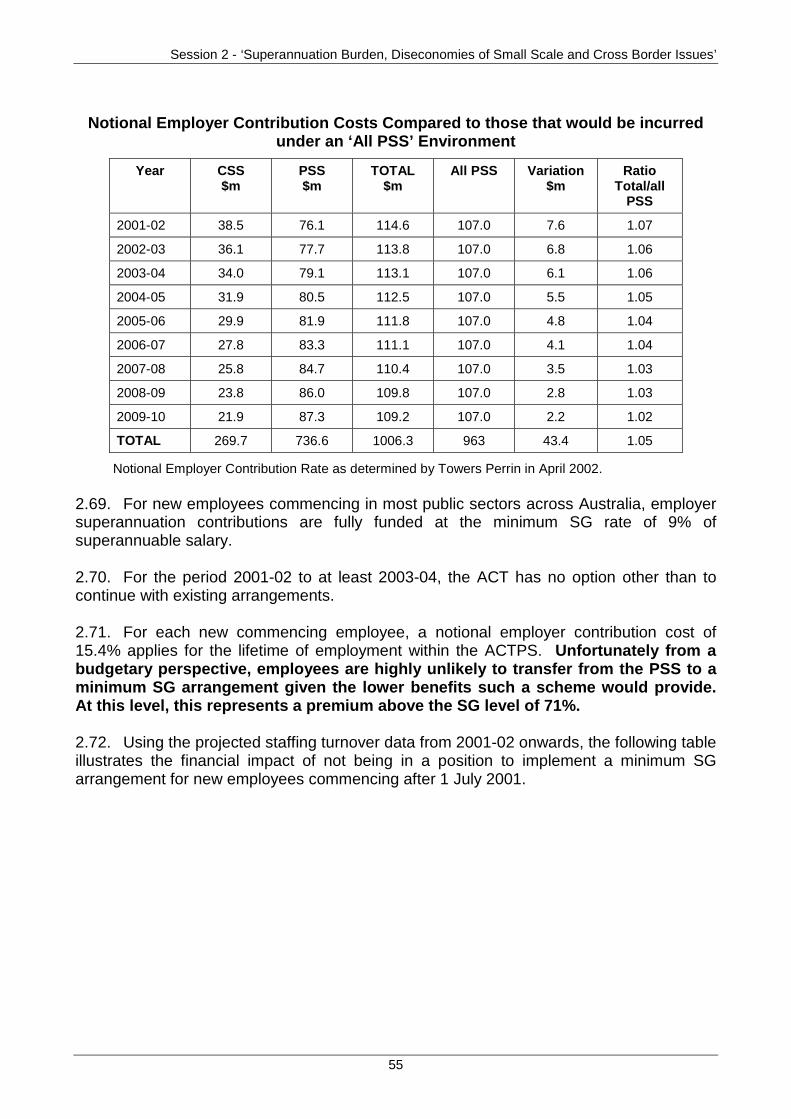
Session 2 - ‘Superannuation Burden, Diseconomies of Small Scale and Cross Border Issues’
55
Notional Employer Contribution Costs Compared to those that would be incurredunder an ‘All PSS’ Environment
Year CSS$m
PSS$m
TOTAL$m
All PSS Variation$m
RatioTotal/all
PSS
2001-02 38.5 76.1 114.6 107.0 7.6 1.07
2002-03 36.1 77.7 113.8 107.0 6.8 1.06
2003-04 34.0 79.1 113.1 107.0 6.1 1.06
2004-05 31.9 80.5 112.5 107.0 5.5 1.05
2005-06 29.9 81.9 111.8 107.0 4.8 1.04
2006-07 27.8 83.3 111.1 107.0 4.1 1.04
2007-08 25.8 84.7 110.4 107.0 3.5 1.03
2008-09 23.8 86.0 109.8 107.0 2.8 1.03
2009-10 21.9 87.3 109.2 107.0 2.2 1.02
TOTAL 269.7 736.6 1006.3 963 43.4 1.05
Notional Employer Contribution Rate as determined by Towers Perrin in April 2002.
2.69. For new employees commencing in most public sectors across Australia, employersuperannuation contributions are fully funded at the minimum SG rate of 9% ofsuperannuable salary.
2.70. For the period 2001-02 to at least 2003-04, the ACT has no option other than tocontinue with existing arrangements.
2.71. For each new commencing employee, a notional employer contribution cost of15.4% applies for the lifetime of employment within the ACTPS. Unfortunately from abudgetary perspective, employees are highly unlikely to transfer from the PSS to aminimum SG arrangement given the lower benefits such a scheme would provide.At this level, this represents a premium above the SG level of 71%.
2.72. Using the projected staffing turnover data from 2001-02 onwards, the following tableillustrates the financial impact of not being in a position to implement a minimum SGarrangement for new employees commencing after 1 July 2001.
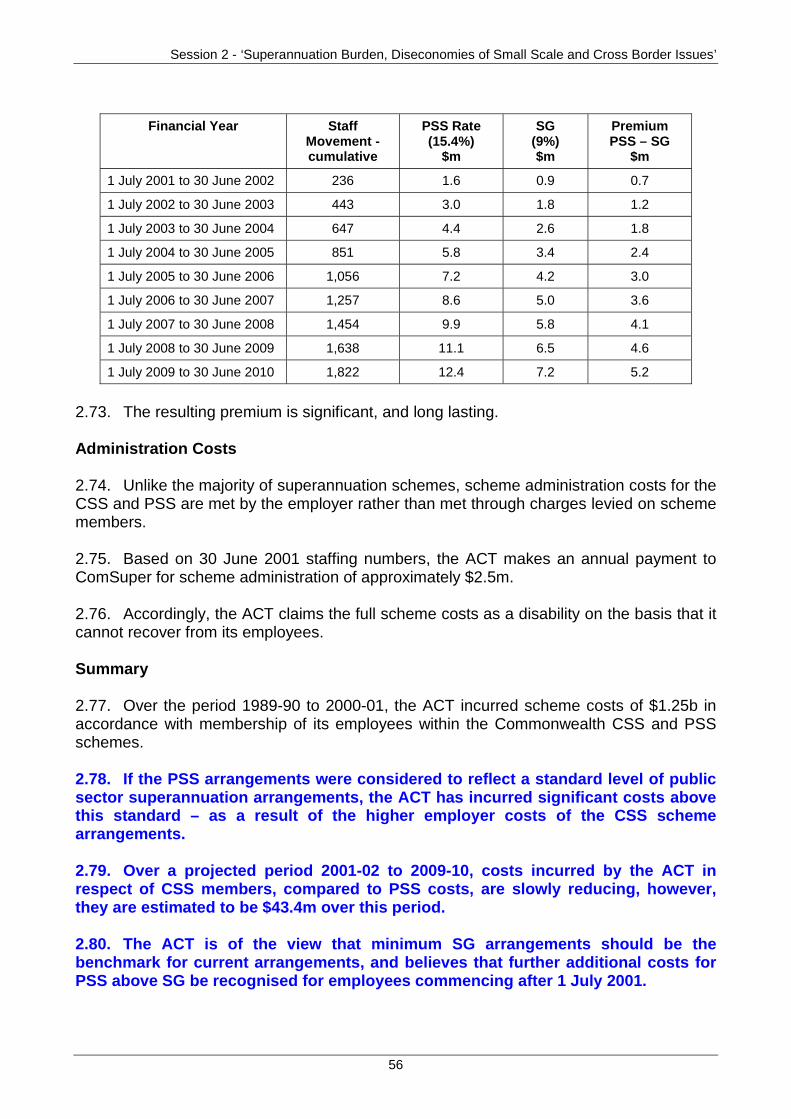
Session 2 - ‘Superannuation Burden, Diseconomies of Small Scale and Cross Border Issues’
56
Financial Year StaffMovement -cumulative
PSS Rate(15.4%)
$m
SG(9%)$m
PremiumPSS – SG
$m
1 July 2001 to 30 June 2002 236 1.6 0.9 0.7
1 July 2002 to 30 June 2003 443 3.0 1.8 1.2
1 July 2003 to 30 June 2004 647 4.4 2.6 1.8
1 July 2004 to 30 June 2005 851 5.8 3.4 2.4
1 July 2005 to 30 June 2006 1,056 7.2 4.2 3.0
1 July 2006 to 30 June 2007 1,257 8.6 5.0 3.6
1 July 2007 to 30 June 2008 1,454 9.9 5.8 4.1
1 July 2008 to 30 June 2009 1,638 11.1 6.5 4.6
1 July 2009 to 30 June 2010 1,822 12.4 7.2 5.2
2.73. The resulting premium is significant, and long lasting.
Administration Costs
2.74. Unlike the majority of superannuation schemes, scheme administration costs for theCSS and PSS are met by the employer rather than met through charges levied on schememembers.
2.75. Based on 30 June 2001 staffing numbers, the ACT makes an annual payment toComSuper for scheme administration of approximately $2.5m.
2.76. Accordingly, the ACT claims the full scheme costs as a disability on the basis that itcannot recover from its employees.
Summary
2.77. Over the period 1989-90 to 2000-01, the ACT incurred scheme costs of $1.25b inaccordance with membership of its employees within the Commonwealth CSS and PSSschemes.
2.78. If the PSS arrangements were considered to reflect a standard level of publicsector superannuation arrangements, the ACT has incurred significant costs abovethis standard – as a result of the higher employer costs of the CSS schemearrangements.
2.79. Over a projected period 2001-02 to 2009-10, costs incurred by the ACT inrespect of CSS members, compared to PSS costs, are slowly reducing, however,they are estimated to be $43.4m over this period.
2.80. The ACT is of the view that minimum SG arrangements should be thebenchmark for current arrangements, and believes that further additional costs forPSS above SG be recognised for employees commencing after 1 July 2001.
Session 2 - ‘Superannuation Burden, Diseconomies of Small Scale and Cross Border Issues’
57
2.81. Additionally, the ACT Government incurs annual member administrationcosts of around $2.5m per annum. This does not occur for other jurisdictions(except perhaps the NT), where these costs are levied on, and borne by thesuperannuation members, not the Government.
2.82. The ACT contends that there are very strong reasons why the ACT wasconstrained from introducing its own superannuation scheme and why the ACT’sabove average CSS/PSS costs should be recognised after self-government and/orthe formation of the ACTPS.
2.83. The ACT notes that historically:
• any move to force employees to a new superannuation fund (to reduce its aboveaverage CSS and PSS) costs would have contravened the agreement reachedbetween the Chief Minister, Ms Rosemary Follett, and the Prime Minister, Mr PaulKeating, given that the Commonwealth guaranteed the rights and entitlements ofACT Government employees, including issues such as terms and conditions,portability, and transfer and mobility arrangements between the new service andCommonwealth departments; and
• a series of mobility arrangements with the Commonwealth, which were set out insome detail by the Public Service Commission and included the portability ofcertain benefits, including ongoing access to the CSS and PSS.
2.84. In terms of the creation of the ACTPS, forcing employees off the CSS andclosing the PSS was not possible for a range of reasons, particularly because of theapproach adopted by the Commonwealth to ensure, amongst other things, the:
• formalisation of a strong relationship between the two services, withendorsement of this by the Prime Minister and the Unions; and
• mobility of staff between the ACTPS and the Australian Public Service,particularly in order to enhance the ability of the ACT Public Service to attract thebest people and compete with the Australian Public Service.
2.85. Regarding the strategic human resource management issues that continue toinfluence decisions relating to terms and conditions of employment, the currentACT Government considers that removal of access to the PSS superannuationscheme would be unacceptable, as it would erode the consistency and equity ofemployment conditions within the service which is considered a fundamentalemployment principle:
• Unions strongly oppose changes to access for new employees to the PSSscheme and in the absence of a replacement scheme that mirrors the currentPSS scheme, unions will resist any attempts at change - such a move would alsocompromise the Commonwealth-ACT agreement formalisation of a strong
Conclusion
Session 2 - ‘Superannuation Burden, Diseconomies of Small Scale and Cross Border Issues’
58
relationship between the two services, with endorsement of this by the PrimeMinister and the Unions
2.86. Additionally, any change to the superannuation arrangements for the ACTPSin advance of changes in the Australian Public Service will impact adversely on itsability to compete for staff.
2.87. Further, this would restrict the movement of staff between the ACT and theAustralian Public Services. Consistency in core conditions such as superannuationis critical to maintaining continued mobility between the two services.
2.88. In terms of the financial and budgetary issues associated withsuperannuation, the ACT will undertake additional calculations and will propose amechanism to the Commission for incorporating its claim into the existingassessment framework.
2.89. It is clear that the Commission should recognise the continuing aboveaverage CSS and PSS costs after the formation of the ACTPS given that even if theACT had been able to introduce its own superannuation scheme (which it could nothave because of the previously outlined reasons), this would not have reducedcosts for existing members as:
• employees could not be forced to move from the CSS and/or PSS to asuperannuation guarantee industry type scheme;
• employees would not choose to move out of the PSS and CSS to a scheme thatprovided them with reduced benefits:
− the only way to encourage this movement would be to introduce a schemewith comparable benefits to the CSS and/or PSS – the ACT notes thatbecause of the cost impediments this would impose, this is not a viableoption, and indeed, it does not represent the standard policy of the Stateswhich have moved towards cheaper, superannuation guarantee type industryfunds;
− the establishment of any replacement scheme mirroring the CSS and/or PSS,while likely to be acceptable to the unions, will bring with it the associatedadditional establishment and administrative costs for the Territory, as well asa continuation of the longer term budgetary pressures currently associatedwith these schemes;
• even though the Commonwealth closed access to the CSS in 1990, and this hadthe obvious effect of preventing new members from joining the scheme, existingmembers were able to continue to contribute and the existing employerobligations under the scheme were required to continue to be met.
Session 2 - ‘Superannuation Burden, Diseconomies of Small Scale and Cross Border Issues’
59
(B) ADMINISTRATIVE SCALE – DISECONOMIES OF SCALEIMPACTS ON THE ACT
Regatta Point - Canberra Business Promotion Centre.
Roger Broughton, Acting Deputy Under Treasurer, ACT Department of Treasury.
Presenters
Venue
Session Objectives
• To introduce the topic of diseconomies of small scale in relation to central officeadministrative costs and reinforce the ACT’s case that head office administrativescale costs are increasing over time because of the:
− increasing range of services;
− the complexity of services;
− increased expectations of the community being serviced; and
− and the adoption of technology in providing services.
• Two case studies will be introduced, microeconomic reform and corporategovernance, providing evidence of the ACT’s claims.
Session 2 - ‘Superannuation Burden, Diseconomies of Small Scale and Cross Border Issues’
60
2.90. The ACT believes the fundamental basis underpinning the current approach toassessing the administrative scale disability is correct. The concept of the disability basedon the States’ population size captures the ability of larger States to utilise economies ofscale in the head office context, and minimum fixed costs factors are related to the size ofa State’s population.
2.91. While the relative disability remains tied to population, the size of the minimum fixedcosts can and do change over time. The ACT considers that minimum fixed costsincrease over time as a result of the adoption of new technologies, and publicadministration reform.
2.92. State government central office functions are changing in nature, notably increasingthe range of services provided, and thus policy and planning required, and the types ofservices being provided are becoming more complex. Generally, these new services do
Administrative Scale
• The ACT supports the Commission’s conclusions regarding the existence of, andthe need to continue assessing the administrative scale factor, as some States,notably the less populous (or smaller) States, continue to face higher expenditureper capita to provide the standard range of government services.
• Administrative Scale disabilities are related to the population size, the larger thepopulation the greater the capacity to access economies of scale and the lower thedisability. Essentially, the fixed cost factors do not change as they are based onStates’ proportions of the Australian population.
• The ACT contends that governments in all jurisdictions now face a greater role incommunity life, including:
− undertaking a wider range of activities, that are not directly involved with servicedelivery; and
− greater accountability to, and expectations of, the community.
• The greater demands on governments increases fixed or minimum costs as aproportion of total expenditure for category assessments.
• The ACT maintained that increased central office costs caused by new technologybe recognised. Technological improvements cause fixed or minimum costs toincrease as a proportion of total expenditure for category assessments.
• The ACT considered that outsourcing had no impact on the relative administrativescale disabilities, and supported the Commission’s views as stated in the 1999Review on the impact of outsourcing.
Key Points from the ACT Main Submission
Administrative Scale
Session 2 - ‘Superannuation Burden, Diseconomies of Small Scale and Cross Border Issues’
61
not replace existing services but are additional service provided to satisfy the expectationsof the community.
2.93. Examples of this situation include the implementation of microeconomic reform inthe ACT economy and the raft of new corporate administrative requirements required of alljurisdictions.
2.94. The two case studies that will be presented in this session will illustrate the issuesraised by the Territory in the ACT Main Submission.
Session 2 - ‘Superannuation Burden, Diseconomies of Small Scale and Cross Border Issues’
62
MICROECONOMIC REFORM CASE STUDY
Regatta Point - Canberra Business Promotion Centre.
Mr David Butt, Director, Economic Management Branch Previously, Director, GBE Management Branch, long history in Commonwealth PublicService, co-author of Senate Select Committee on National Competition Policy Reports. Ms Robyn Hardy, Acting Manager, Microeconomic Reform Unit Co-author of Senate Select Committee on National Competition Policy Reports, longexperience in the Commonwealth Public Service and Senate Committee Office. Other Departmental Representatives Mr Matthew Powell, Senior Research Officer, Microeconomic Reform Unit Ms Bethany Anderson, Research Officer, Microeconomic Reform Unit
Session Objectives
• To demonstrate the impact of diseconomies of scale in relation to implementationand administration of microeconomic reform activities undertaken in the ACTeconomy since self-government.
Presenters
Venue
Session 2 - ‘Superannuation Burden, Diseconomies of Small Scale and Cross Border Issues’
63
2.95. In the Main Submission the Territory outlined impending difficulties it will face in thefuture with the ongoing implementation of Microeconomic reform relative to the largerjurisdictions. 2.96. The Territory also flagged its support for the Commission’s conclusions inDiscussion Paper CGC 2001/16 regarding the existence of, and the need to continueassessing the administrative scale factor. This was mainly due to some States, notablythe less populous (or smaller) States, continuing to face higher expenditure per capita toprovide the standard range of government services. 2.97. The implementation of Microeconomic reform in the ACT presents a classic casestudy of the diseconomies of administrative scale facing a small jurisdiction inimplementing national public policy.
• The ACT supported the view that although there were signs that publicadministration reforms are lowering overall service provision and delivery costs,there is no evidence that these are reflected in head office costs.
• The ACT also noted that Discussion Paper CGC 2001/16 Administrative Scalealso stated that “… it is likely that the continuing reforms of public administrationwill again lower the administrative scale needs in the 2004 Review”. Thisstatement concerned the ACT, as there is no evidence of these reforms loweringStates’ costs in the provision of services. The ACT contended that the Micro-Economic Reforms have actually increased the complexity of governmentservice provision, and led to increased scale disabilities.
• Most of the micro-economic reforms work to increase the role of government inthe range and complexity of matters in which it undertakes reform. Indeedreforms will actually increase the proportion of expenditure that is subject toscale disabilities.
• Compliance with National Competition Policy (NCP) places abnormally high percapita costs on the ACT because of the high fixed cost of the NCP program.
• Each jurisdiction has, within their sovereign rights, applied the reformsdifferently. Hence, there is limited scope for any national systems of regulatoryoversight, nor is such a move necessarily appropriate.
• The ACT is required to undertake the reform activities required of the largerStates, but with a smaller population base supporting it. The ensuing disabilityis compounded by the fact that the ACT has undertaken a broader scope ofreform compared to other jurisdictions, eg. by requiring regulatory reviews of alllegislation.
Key Points from the ACT Main Submission
Overview of Microeconomic Reforms, Administrative Activity,Regulatory Activity and Service Delivery in the ACT
Session 2 - ‘Superannuation Burden, Diseconomies of Small Scale and Cross Border Issues’
64
The Definition of Microeconomic Reform 2.98. Microeconomic reform refers to the process of changing regulatory controls toimprove the allocation of scarce resources and to provide a better framework for increasedproductivity and economic growth. Major microeconomic reforms were commenced in the1990’s, with the Council of Australian Government agreements in relation to transport, gas,electricity and water reforms. The development of these reforms coincided with thedeveloping new ACT economy since self-government in 1989. Further major jurisdictional-based reform emanated from the National Competition Policy Agreements in April 1995.Microeconomic reform includes implementing initiatives outlined in the NationalCompetition Policy and initiatives recommended by the Council of Australian Governments
2.99. Since the early 1990s, the Territory has applied considerable resources to complywith NCP and COAG Agreements and has undertaken an extensive program ofmicroeconomic reform. The program of changes includes:
• the corporatisation and commercialisation of government business enterprises;
• the separation of regulatory, policy and service provision functions of Government;
• an audit of all 262 pieces of ACT legislation and associated regulations;
• introduction of competitive-tendering and contracting-out;
• introduction of competitive neutrality principles;
• changes to the provision of utility services namely, water, electricity and gas; and
• harmonisation of road transport regulations with other States.
The ACT Economy in perspective Geography/Population 2.100. The ACT is a small, landlocked city-state of 2,358 square kilometres, constitutingless than 0.03% of Australia’s total land area. It is roughly half the size of the Sydneymetropolitan area, but only approximately 12% of the ACT’s land is developed for urbanusage, as displayed in the figure on the following page.
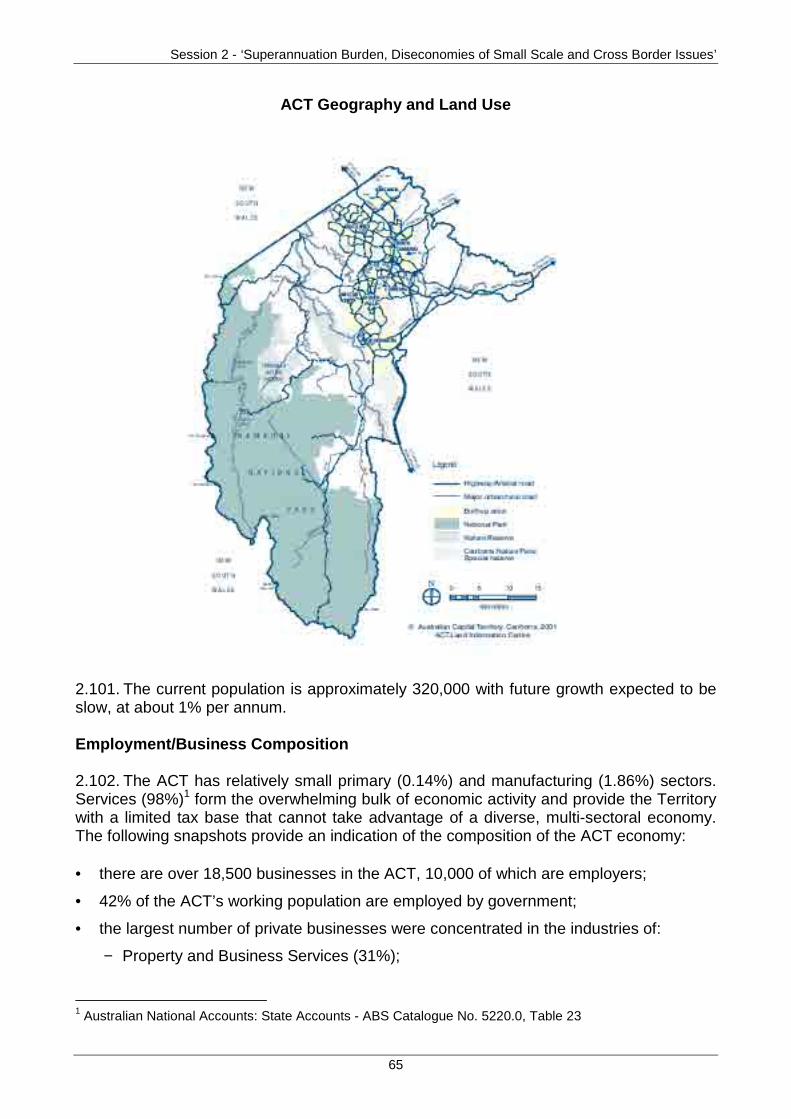
Session 2 - ‘Superannuation Burden, Diseconomies of Small Scale and Cross Border Issues’
65
ACT Geography and Land Use
2.101. The current population is approximately 320,000 with future growth expected to beslow, at about 1% per annum.
Employment/Business Composition 2.102. The ACT has relatively small primary (0.14%) and manufacturing (1.86%) sectors.Services (98%)1 form the overwhelming bulk of economic activity and provide the Territorywith a limited tax base that cannot take advantage of a diverse, multi-sectoral economy.The following snapshots provide an indication of the composition of the ACT economy:
• there are over 18,500 businesses in the ACT, 10,000 of which are employers;
• 42% of the ACT’s working population are employed by government;
• the largest number of private businesses were concentrated in the industries of:
− Property and Business Services (31%);
1 Australian National Accounts: State Accounts - ABS Catalogue No. 5220.0, Table 23
Session 2 - ‘Superannuation Burden, Diseconomies of Small Scale and Cross Border Issues’
66
− Retail Trade (15%);
− Construction (11%); and
− Health and Community Services (9%) (as at June 2001);
• 97% of ACT business is small or micro business, employing around 40,000 people;
• the largest single employer in the Territory is the Commonwealth Government (34,000people):
− the Commonwealth does not pay payroll tax, stamp duty or land taxes severelylimiting the ACT’s revenue raising capacity;
− self-government was only instituted in 1989 and there is a legacy from the longhistory of Commonwealth governance, with controls over land use and planning stillheld by the Commonwealth; and
− changes in the operations of the Federal Government, have a particularly strongimpact on the Territory and its economy.
2.103. Despite these disadvantages of scale, the Territory has implemented thesame reforms and undertakes essentially the same scope of activities that occur inthe other jurisdictions.
2.104. Microeconomic reform involves a high degree of fixed administrative costs. TheACT has attempted to mitigate these disadvantages by implementing what is consideredthe most efficient and effective administrative regime possible. For example, instead ofhaving several utility service regulators (for example, like WA) the ACT has a single verysmall-scale independent regulatory body – the Independent Competition and RegulatoryCommission.
2.105. The Microeconomic Reform Unit and the Energy Policy Unit in Treasury overseethe broadest range of reform activities including:
• National Competition Policy reporting;
• legislative reviews;
• regulatory impact assessments of new legislative proposals;
• energy and utility policy;
• competitive neutrality policy; and
• representative duties on intergovernmental forums.
2.106. These responsibilities are usually spread across a range of larger administrativeagencies in the larger States. Despite these efficiencies, the nature and level of the reformagendas has demanded a high level of administrative input over the past six years and willcontinue to do so well into this decade due to reforms yet to be implemented.
Microeconomic Reform in the ACT
Session 2 - ‘Superannuation Burden, Diseconomies of Small Scale and Cross Border Issues’
67
2.107. The ACT is subject to the highest per capita cost of microeconomic reformadministration due to:
• the ACT’s small population; and
• the requirement for the ACT to undertake the wide range of complex tasks associatedwith microeconomic reform.
2.108. The Competition Principles Agreement (CPA), the Conduct Code Agreement (theCode) and the Agreement on Related Reforms set out the framework for the agreed actionplan as shown in the following table:
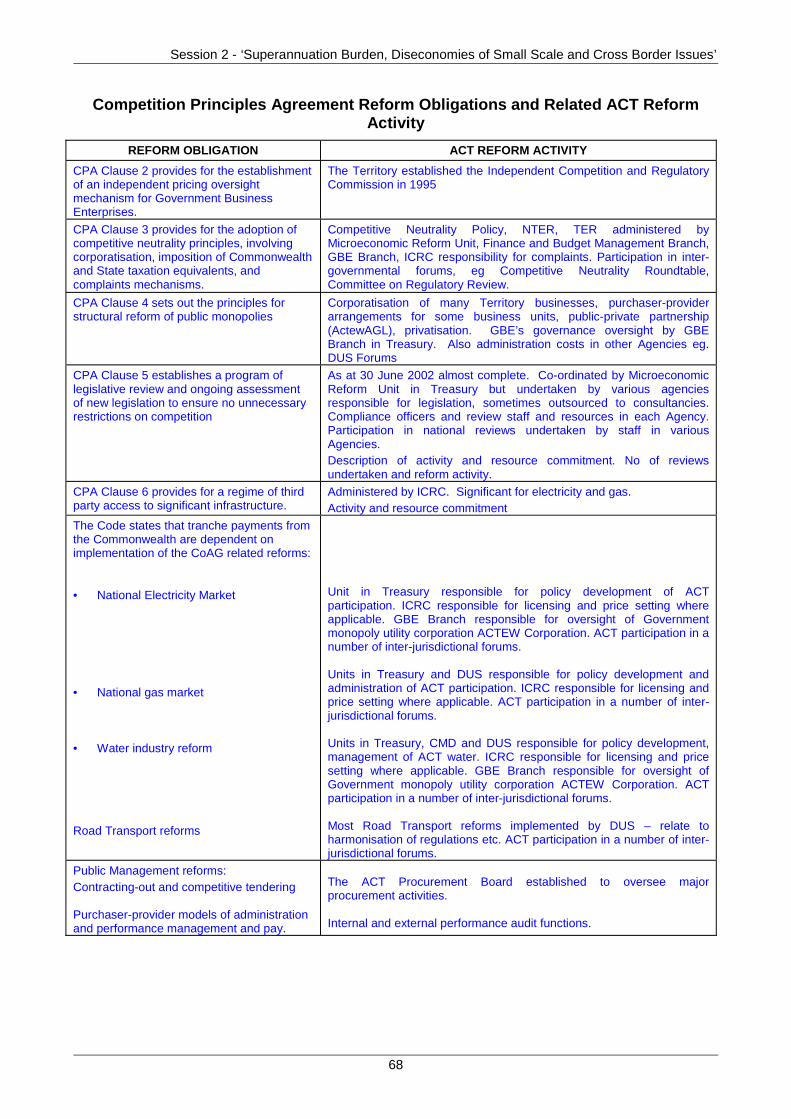
Session 2 - ‘Superannuation Burden, Diseconomies of Small Scale and Cross Border Issues’
68
Competition Principles Agreement Reform Obligations and Related ACT ReformActivity
REFORM OBLIGATION ACT REFORM ACTIVITY
CPA Clause 2 provides for the establishmentof an independent pricing oversightmechanism for Government BusinessEnterprises.
The Territory established the Independent Competition and RegulatoryCommission in 1995
CPA Clause 3 provides for the adoption ofcompetitive neutrality principles, involvingcorporatisation, imposition of Commonwealthand State taxation equivalents, andcomplaints mechanisms.
Competitive Neutrality Policy, NTER, TER administered byMicroeconomic Reform Unit, Finance and Budget Management Branch,GBE Branch, ICRC responsibility for complaints. Participation in inter-governmental forums, eg Competitive Neutrality Roundtable,Committee on Regulatory Review.
CPA Clause 4 sets out the principles forstructural reform of public monopolies
Corporatisation of many Territory businesses, purchaser-providerarrangements for some business units, public-private partnership(ActewAGL), privatisation. GBE’s governance oversight by GBEBranch in Treasury. Also administration costs in other Agencies eg.DUS Forums
CPA Clause 5 establishes a program oflegislative review and ongoing assessmentof new legislation to ensure no unnecessaryrestrictions on competition
As at 30 June 2002 almost complete. Co-ordinated by MicroeconomicReform Unit in Treasury but undertaken by various agenciesresponsible for legislation, sometimes outsourced to consultancies.Compliance officers and review staff and resources in each Agency.Participation in national reviews undertaken by staff in variousAgencies.Description of activity and resource commitment. No of reviewsundertaken and reform activity.
CPA Clause 6 provides for a regime of thirdparty access to significant infrastructure.
Administered by ICRC. Significant for electricity and gas.Activity and resource commitment
The Code states that tranche payments fromthe Commonwealth are dependent onimplementation of the CoAG related reforms:
• National Electricity Market
• National gas market
• Water industry reform
Road Transport reforms
Unit in Treasury responsible for policy development of ACTparticipation. ICRC responsible for licensing and price setting whereapplicable. GBE Branch responsible for oversight of Governmentmonopoly utility corporation ACTEW Corporation. ACT participation in anumber of inter-jurisdictional forums.
Units in Treasury and DUS responsible for policy development andadministration of ACT participation. ICRC responsible for licensing andprice setting where applicable. ACT participation in a number of inter-jurisdictional forums.
Units in Treasury, CMD and DUS responsible for policy development,management of ACT water. ICRC responsible for licensing and pricesetting where applicable. GBE Branch responsible for oversight ofGovernment monopoly utility corporation ACTEW Corporation. ACTparticipation in a number of inter-jurisdictional forums.
Most Road Transport reforms implemented by DUS – relate toharmonisation of regulations etc. ACT participation in a number of inter-jurisdictional forums.
Public Management reforms:Contracting-out and competitive tendering
Purchaser-provider models of administrationand performance management and pay.
The ACT Procurement Board established to oversee majorprocurement activities.
Internal and external performance audit functions.
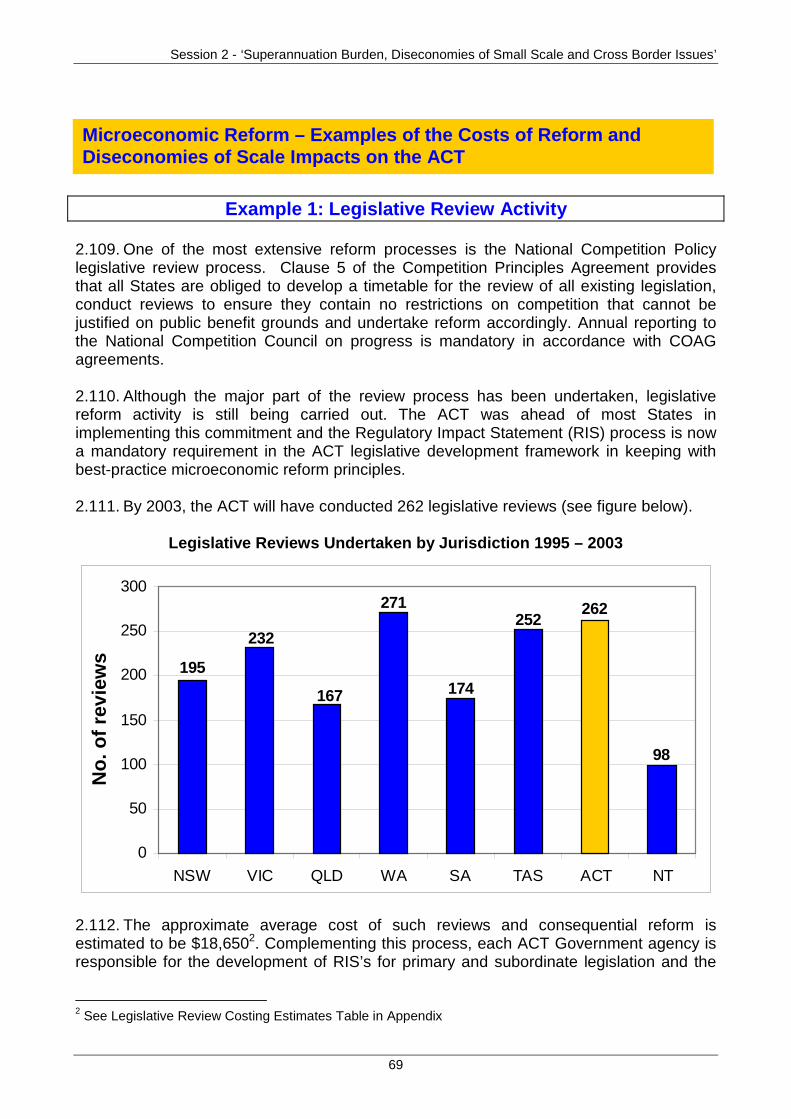
Session 2 - ‘Superannuation Burden, Diseconomies of Small Scale and Cross Border Issues’
69
Example 1: Legislative Review Activity
2.109. One of the most extensive reform processes is the National Competition Policylegislative review process. Clause 5 of the Competition Principles Agreement providesthat all States are obliged to develop a timetable for the review of all existing legislation,conduct reviews to ensure they contain no restrictions on competition that cannot bejustified on public benefit grounds and undertake reform accordingly. Annual reporting tothe National Competition Council on progress is mandatory in accordance with COAGagreements.
2.110. Although the major part of the review process has been undertaken, legislativereform activity is still being carried out. The ACT was ahead of most States inimplementing this commitment and the Regulatory Impact Statement (RIS) process is nowa mandatory requirement in the ACT legislative development framework in keeping withbest-practice microeconomic reform principles.
2.111. By 2003, the ACT will have conducted 262 legislative reviews (see figure below).
Legislative Reviews Undertaken by Jurisdiction 1995 – 2003
98
262252
174
271
167
232
195
0
50
100
150
200
250
300
NSW VIC QLD WA SA TAS ACT NT
No
. of
revi
ews
2.112. The approximate average cost of such reviews and consequential reform isestimated to be $18,6502. Complementing this process, each ACT Government agency isresponsible for the development of RIS’s for primary and subordinate legislation and the
2 See Legislative Review Costing Estimates Table in Appendix
Microeconomic Reform – Examples of the Costs of Reform andDiseconomies of Scale Impacts on the ACT
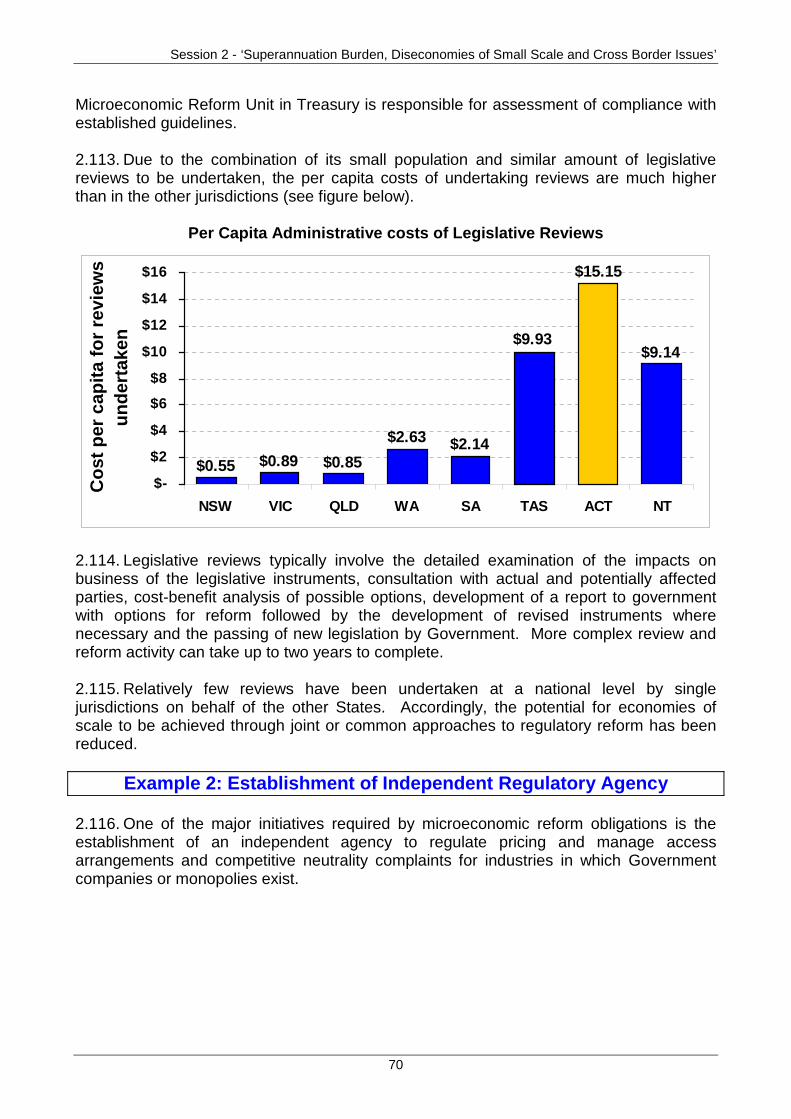
Session 2 - ‘Superannuation Burden, Diseconomies of Small Scale and Cross Border Issues’
70
Microeconomic Reform Unit in Treasury is responsible for assessment of compliance withestablished guidelines. 2.113. Due to the combination of its small population and similar amount of legislativereviews to be undertaken, the per capita costs of undertaking reviews are much higherthan in the other jurisdictions (see figure below).
Per Capita Administrative costs of Legislative Reviews
$9.14
$15.15
$9.93
$2.14$2.63
$0.85$0.89$0.55$-
$2
$4
$6
$8
$10
$12
$14
$16
NSW VIC QLD WA SA TAS ACT NT
Co
st p
er c
apit
a fo
r re
view
s u
nd
erta
ken
2.114. Legislative reviews typically involve the detailed examination of the impacts onbusiness of the legislative instruments, consultation with actual and potentially affectedparties, cost-benefit analysis of possible options, development of a report to governmentwith options for reform followed by the development of revised instruments wherenecessary and the passing of new legislation by Government. More complex review andreform activity can take up to two years to complete.
2.115. Relatively few reviews have been undertaken at a national level by singlejurisdictions on behalf of the other States. Accordingly, the potential for economies ofscale to be achieved through joint or common approaches to regulatory reform has beenreduced.
Example 2: Establishment of Independent Regulatory Agency
2.116. One of the major initiatives required by microeconomic reform obligations is theestablishment of an independent agency to regulate pricing and manage accessarrangements and competitive neutrality complaints for industries in which Governmentcompanies or monopolies exist.
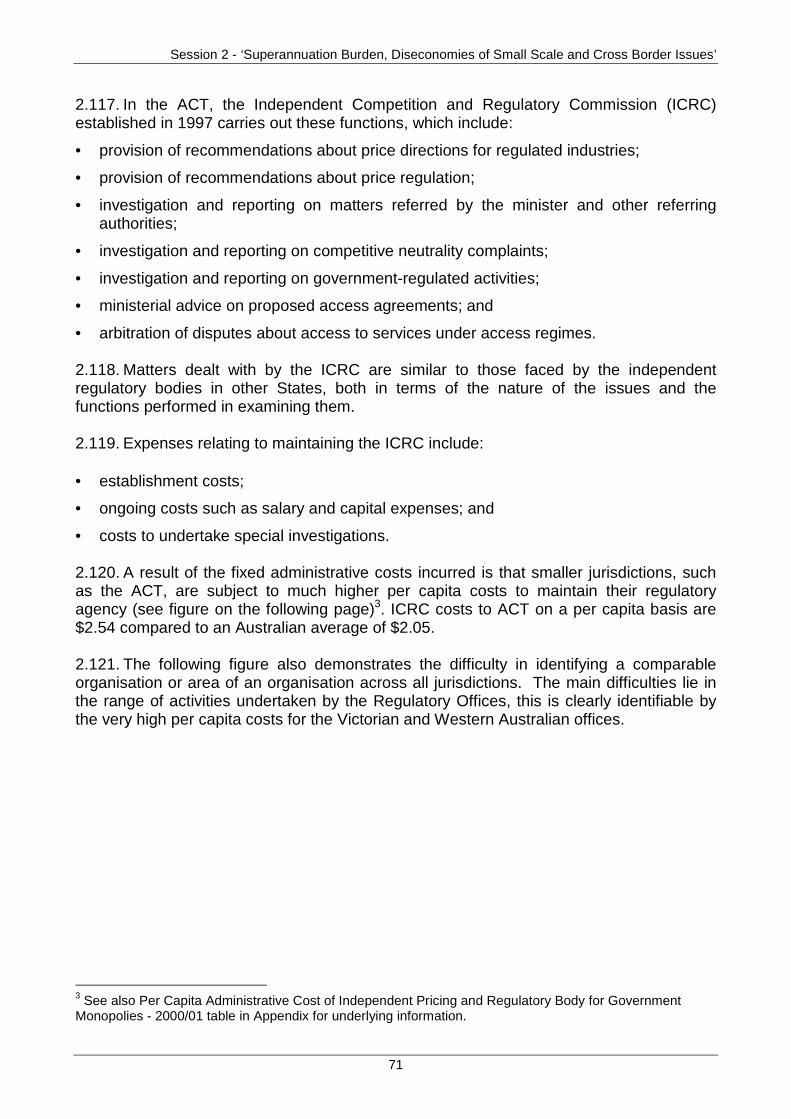
Session 2 - ‘Superannuation Burden, Diseconomies of Small Scale and Cross Border Issues’
71
2.117. In the ACT, the Independent Competition and Regulatory Commission (ICRC)established in 1997 carries out these functions, which include:
• provision of recommendations about price directions for regulated industries;
• provision of recommendations about price regulation;
• investigation and reporting on matters referred by the minister and other referringauthorities;
• investigation and reporting on competitive neutrality complaints;
• investigation and reporting on government-regulated activities;
• ministerial advice on proposed access agreements; and
• arbitration of disputes about access to services under access regimes.
2.118. Matters dealt with by the ICRC are similar to those faced by the independentregulatory bodies in other States, both in terms of the nature of the issues and thefunctions performed in examining them.
2.119. Expenses relating to maintaining the ICRC include:
• establishment costs;
• ongoing costs such as salary and capital expenses; and
• costs to undertake special investigations.
2.120. A result of the fixed administrative costs incurred is that smaller jurisdictions, suchas the ACT, are subject to much higher per capita costs to maintain their regulatoryagency (see figure on the following page)3. ICRC costs to ACT on a per capita basis are$2.54 compared to an Australian average of $2.05.
2.121. The following figure also demonstrates the difficulty in identifying a comparableorganisation or area of an organisation across all jurisdictions. The main difficulties lie inthe range of activities undertaken by the Regulatory Offices, this is clearly identifiable bythe very high per capita costs for the Victorian and Western Australian offices.
3 See also Per Capita Administrative Cost of Independent Pricing and Regulatory Body for GovernmentMonopolies - 2000/01 table in Appendix for underlying information.
Session 2 - ‘Superannuation Burden, Diseconomies of Small Scale and Cross Border Issues’
72
Per Capita Administrative cost of Independent Pricing and Regulatory Agency forGovernment Monopolies
$1.19
$2.64
$1.72
$3.49
$1.82
$0.70
$2.54$2.27
$-
$0.50
$1.00
$1.50
$2.00
$2.50
$3.00
$3.50
$4.00
IPARTNSW
ORGVVIC
QCAQLD
WAWA
SAIRSA
GPOCTAS
ICRCACT
NTUCNT
Agency Name (by State)
Example 3: Attendance at Intergovernmental Forums
2.122. The ACT was represented at approximately 400 intergovernmental forums in2000-01 4. Of these, 141 (or 35%) either related directly to microeconomic reform activitiesor dealt with issues that have been scheduled as areas for reform in the NCP agreements.
2.123. These include sectors of the economy such as:
• food (Australian-New Zealand Food Standards Council);
• construction (Australian Building Codes Board, Intergovernmental Working Group onReform of Architects);
• transport (Committee for Transport of Dangerous Goods);
• social regulation (National Education Performance Monitoring Taskforce, Family DayCare Accreditation and Licensing Conference, Interactive Gambling Working Group);
• health (National Public Health Partnership – Legislative Reform Working Group);
• retail trading (Liquor Licensing Conference);
• consumer affairs (Consumer Product Advisory Committee);
• primary industry (Commonwealth Forestry Conference);
• energy and utilities (Electrical Regulatory Authorities Committee, National Gas PipelineAdvisory Committee); and
4 See National Forums that require States involvement, 2000-01, Chapter 7 – Administrative Scale,Australian Capital Territory Submission to the Commonwealth Grants Commission 2004 Review May 2002.
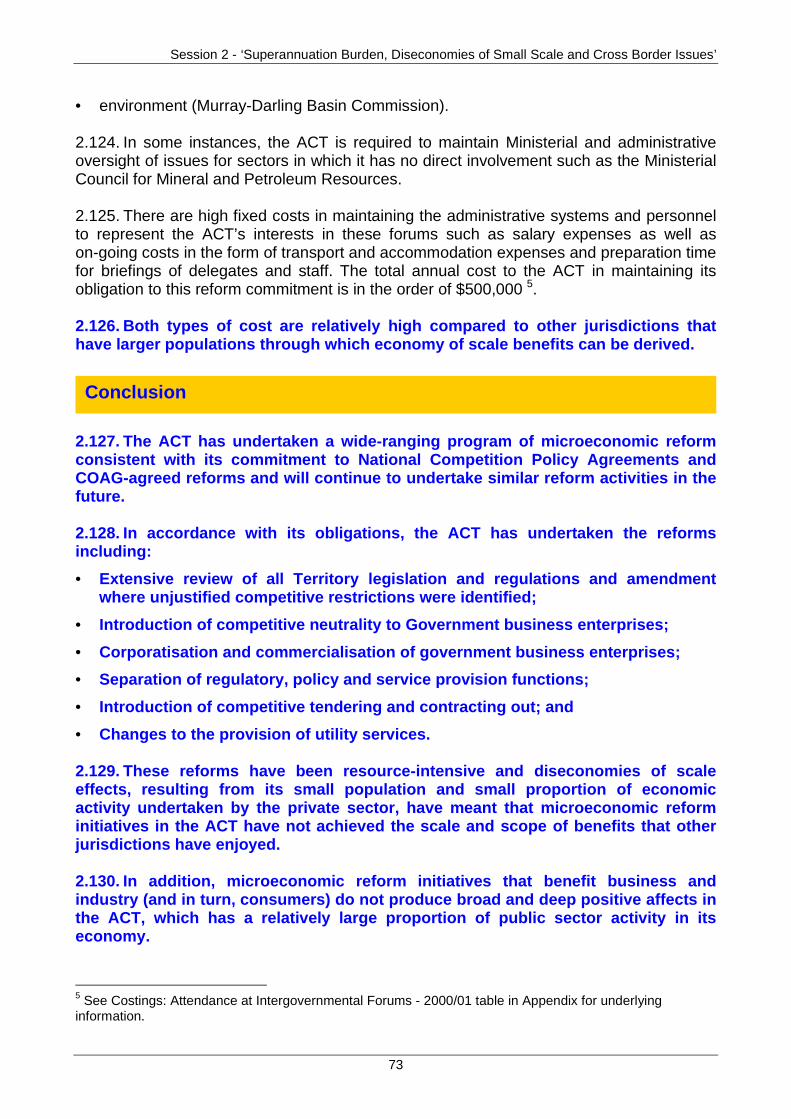
Session 2 - ‘Superannuation Burden, Diseconomies of Small Scale and Cross Border Issues’
73
• environment (Murray-Darling Basin Commission).
2.124. In some instances, the ACT is required to maintain Ministerial and administrativeoversight of issues for sectors in which it has no direct involvement such as the MinisterialCouncil for Mineral and Petroleum Resources.
2.125. There are high fixed costs in maintaining the administrative systems and personnelto represent the ACT’s interests in these forums such as salary expenses as well ason-going costs in the form of transport and accommodation expenses and preparation timefor briefings of delegates and staff. The total annual cost to the ACT in maintaining itsobligation to this reform commitment is in the order of $500,000 5.
2.126. Both types of cost are relatively high compared to other jurisdictions thathave larger populations through which economy of scale benefits can be derived.
2.127. The ACT has undertaken a wide-ranging program of microeconomic reformconsistent with its commitment to National Competition Policy Agreements andCOAG-agreed reforms and will continue to undertake similar reform activities in thefuture.
2.128. In accordance with its obligations, the ACT has undertaken the reformsincluding:
• Extensive review of all Territory legislation and regulations and amendmentwhere unjustified competitive restrictions were identified;
• Introduction of competitive neutrality to Government business enterprises;
• Corporatisation and commercialisation of government business enterprises;
• Separation of regulatory, policy and service provision functions;
• Introduction of competitive tendering and contracting out; and
• Changes to the provision of utility services.
2.129. These reforms have been resource-intensive and diseconomies of scaleeffects, resulting from its small population and small proportion of economicactivity undertaken by the private sector, have meant that microeconomic reforminitiatives in the ACT have not achieved the scale and scope of benefits that otherjurisdictions have enjoyed.
2.130. In addition, microeconomic reform initiatives that benefit business andindustry (and in turn, consumers) do not produce broad and deep positive affects inthe ACT, which has a relatively large proportion of public sector activity in itseconomy.
5 See Costings: Attendance at Intergovernmental Forums - 2000/01 table in Appendix for underlyinginformation.
Conclusion
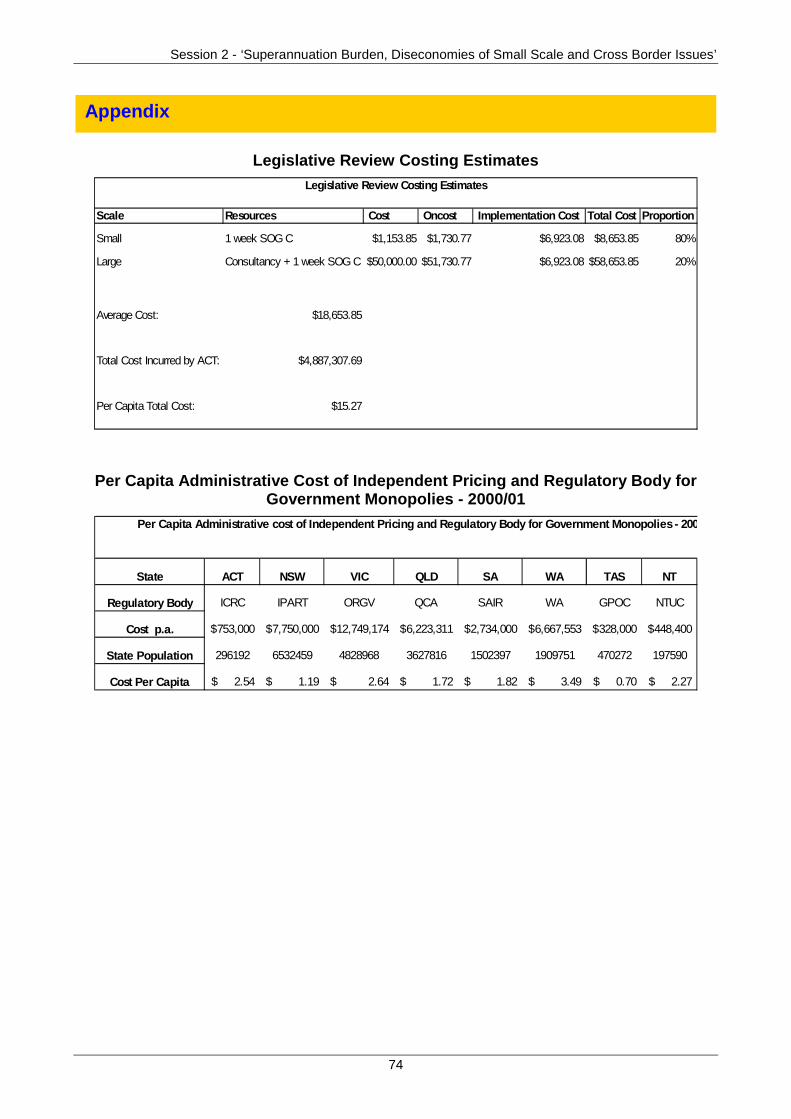
Session 2 - ‘Superannuation Burden, Diseconomies of Small Scale and Cross Border Issues’
74
Legislative Review Costing Estimates
Scale Resources Cost Oncost Implementation Cost Total Cost Proportion
Small 1 week SOG C $1,153.85 $1,730.77 $6,923.08 $8,653.85 80%
Large Consultancy + 1 week SOG C $50,000.00 $51,730.77 $6,923.08 $58,653.85 20%
Average Cost: $18,653.85
Total Cost Incurred by ACT: $4,887,307.69
Per Capita Total Cost: $15.27
Legislative Review Costing Estimates
Per Capita Administrative Cost of Independent Pricing and Regulatory Body forGovernment Monopolies - 2000/01
State ACT NSW VIC QLD SA WA TAS NT
Regulatory Body ICRC IPART ORGV QCA SAIR WA GPOC NTUC
Cost p.a. 753,000$ 7,750,000$ 12,749,174$ 6,223,311$ 2,734,000$ 6,667,553$ 328,000$ 448,400$
State Population 296192 6532459 4828968 3627816 1502397 1909751 470272 197590
Cost Per Capita 2.54$ 1.19$ 2.64$ 1.72$ 1.82$ 3.49$ 0.70$ 2.27$
Per Capita Administrative cost of Independent Pricing and Regulatory Body for Government Monopolies - 200
Appendix
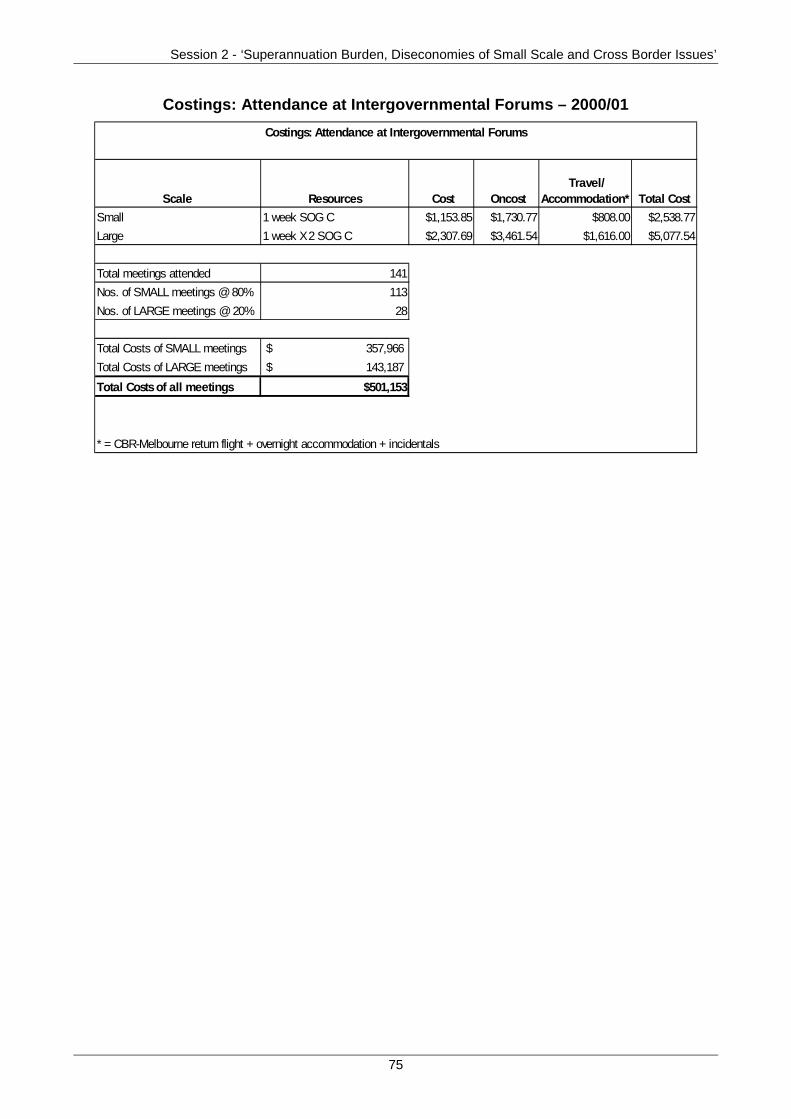
Session 2 - ‘Superannuation Burden, Diseconomies of Small Scale and Cross Border Issues’
75
Costings: Attendance at Intergovernmental Forums – 2000/01
Scale Resources Cost Oncost Travel/
Accommodation* Total Cost
Small 1 week SOG C $1,153.85 $1,730.77 $808.00 $2,538.77
Large 1 week X 2 SOG C $2,307.69 $3,461.54 $1,616.00 $5,077.54
Total meetings attended 141
Nos. of SMALL meetings @ 80% 113
Nos. of LARGE meetings @ 20% 28
Total Costs of SMALL meetings 357,966$
Total Costs of LARGE meetings 143,187$
Total Costs of all meetings $501,153
* = CBR-Melbourne return flight + overnight accommodation + incidentals
Costings: Attendance at Intergovernmental Forums
Session 2 - ‘Superannuation Burden, Diseconomies of Small Scale and Cross Border Issues’
76
ADMINISTRATIVE ARRANGEMENTS CASE STUDY
Regatta Point - Canberra Business Promotion Centre.
Meredith Whitten, Director, Corporate Services, ACT Chief Minister’s Department andACT Department of Treasury.
Ms Whitten has fourteen years experience with the ACT Government primarily in the ChiefMinister’s and Health Departments following four years managing public library services inSouth Australia. Recent work achievements have included developing the sharedcorporate services function of the Chief Minister’s Department and the Department ofTreasury and the management of Cabinet Office, including inter-governmental relations.
Presenter
Session Objectives
• The aim of this session is to demonstrate that over time the administrativearrangements of government are becoming more complex and greater demandsare imposed on States, particularly as governments are required to be moreconsultative, more accountable and more transparent.
• This case study demonstrates that the increasingly complex nature of theadministration of government adds to the administrative cost that the ACT faces.
Scale Affected Expenditure
• Increased complexity in government service provision has led to increasedlegislative and regulatory change and monitoring requirements.
• Since 1999-2000, the ACT Legislative Assembly has passed four key Acts, inaddition to existing legislation, which require a greater level of accountability bygovernment to the community.
• In addition, more immediate methods of accessing information by electronic meansby a highly educated community has led to increased costs in managing theseservices through the employment of more qualified and experienced employees.
Venue
Session 2 - ‘Superannuation Burden, Diseconomies of Small Scale and Cross Border Issues’
77
2.131. In the context of open and accountable government, the significant benefits derivedby the community incur an administrative cost, which in the ACT is funded across a limitedpopulation base.
2.132. Existing statutory accountability requirements in the ACT, such as budgetstatements, quarterly financial and output performance reports, annual reports andFreedom of Information Act 1989 requirements, have been supplemented by newlegislation, which requires greater accountability and monitoring by Government to theAssembly and the community. Four new Acts have commenced since 1999-2000 whichrequire an accountability focus:
• Executive Documents Release Act 2001 – provides for the publication of certainexecutive documents 10 years after submission;
• Government Procurement Act 2001 – established a government procurement boardand makes provision about the procurement of goods and services by Territory entities;
• Public Access to Government Contracts Act 2000 – provides for public access, as faras possible, to the terms of government contracts over $50,000; and
• Territory Records Act 2002 – encourages open and accountable government byensuring that government records are made, managed and preserved in an accessibleform.
2.133. These types of legislative and monitoring requirements are usually managed as acentral office or corporate service of departments and government agencies. Thecommencement of new procurement and records management legislation imposes
Key Points from the ACT Main Submission
• The established Administrative Scale Framework recognises small jurisdictionsface higher per capita costs, as a result of fixed or minimum expenditure, toprovide a standard level of government services.
Increasing Complexity of Government Services
• The ACT contends that governments in all jurisdictions now face a greater role incommunity life, including:
− undertaking a wider range of activities, that are not directly involved with servicedelivery; and
− greater accountability to and expectations of the community.
• The greater demands on governments increases fixed or minimum costs as aproportion of total expenditure for category assessments.
Overview
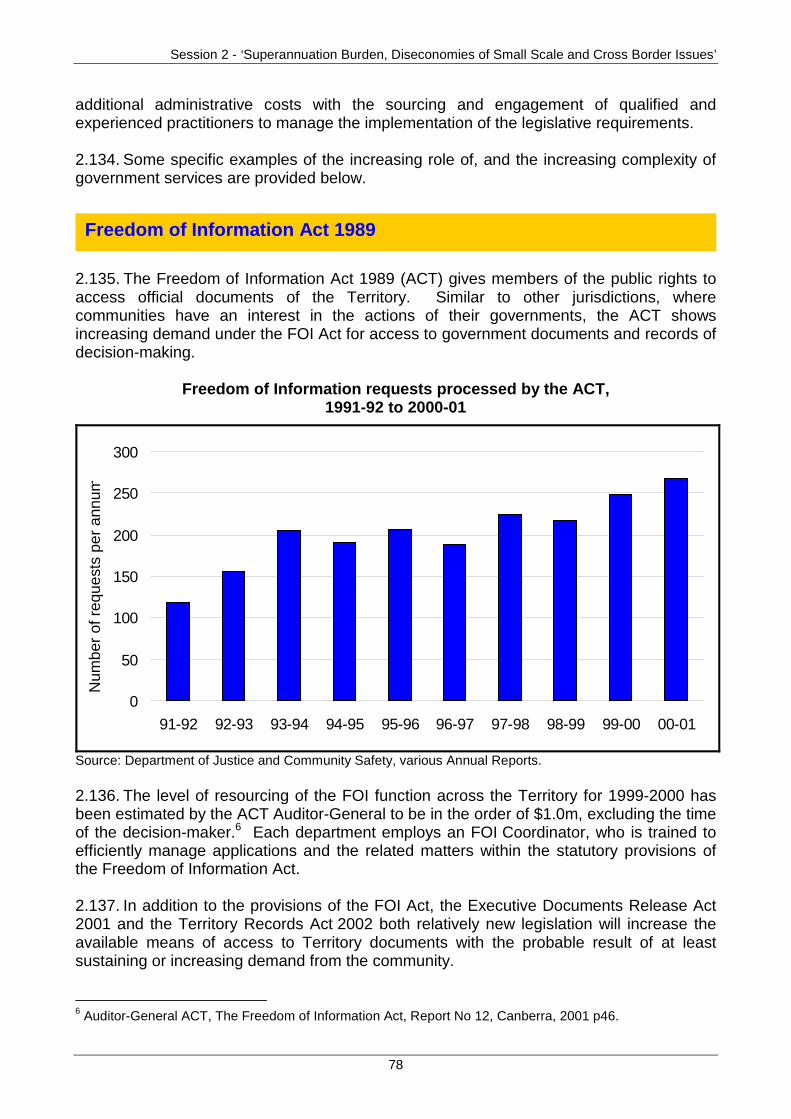
Session 2 - ‘Superannuation Burden, Diseconomies of Small Scale and Cross Border Issues’
78
additional administrative costs with the sourcing and engagement of qualified andexperienced practitioners to manage the implementation of the legislative requirements.
2.134. Some specific examples of the increasing role of, and the increasing complexity ofgovernment services are provided below.
2.135. The Freedom of Information Act 1989 (ACT) gives members of the public rights toaccess official documents of the Territory. Similar to other jurisdictions, wherecommunities have an interest in the actions of their governments, the ACT showsincreasing demand under the FOI Act for access to government documents and records ofdecision-making.
Freedom of Information requests processed by the ACT,1991-92 to 2000-01
0
50
100
150
200
250
300
91-92 92-93 93-94 94-95 95-96 96-97 97-98 98-99 99-00 00-01
Num
ber
of r
eque
sts
per
annu
m
Source: Department of Justice and Community Safety, various Annual Reports.
2.136. The level of resourcing of the FOI function across the Territory for 1999-2000 hasbeen estimated by the ACT Auditor-General to be in the order of $1.0m, excluding the timeof the decision-maker.6 Each department employs an FOI Coordinator, who is trained toefficiently manage applications and the related matters within the statutory provisions ofthe Freedom of Information Act.
2.137. In addition to the provisions of the FOI Act, the Executive Documents Release Act2001 and the Territory Records Act 2002 both relatively new legislation will increase theavailable means of access to Territory documents with the probable result of at leastsustaining or increasing demand from the community.
6 Auditor-General ACT, The Freedom of Information Act, Report No 12, Canberra, 2001 p46.
Freedom of Information Act 1989
Session 2 - ‘Superannuation Burden, Diseconomies of Small Scale and Cross Border Issues’
79
2.138. The Freedom of Information Act 1989, Executive Documents Release Act 2001and the Territory Records Act 2002 provide the public with a right to access certaingovernment records. The administrative arrangements arising from the FOI Act inparticular is similar to any other State.
2.139. As the community awareness, across all States, about the accessibility ofgovernment records has increased, due to the existence of legislation and theprecedent set by other community members successful requests, the number ofapplications for and the amount of government activity required to process theserequests has increased.
2.140. Under the Government Procurement Act 2001, the Government Procurement Boardestablished the Territory’s procurement accreditation system. A key mechanism of thesystem was the establishment of approved procurement units in departments, whichprovide an advisory and review role of procurement proposals for goods, services andworks over $50,000. The total value of contractual commitments, for proposals over$50,000 entered into by Territory entities in 2001-02 was $377.7m.7
2.141. The Public Access to Government Contracts Act 2000 (“PAGC Act”) provides forpublic access to the terms of government contracts or amended contracts over $50,000with disclosure set by a statutory timeframe. In addition, any contracts over $50,000containing a confidentiality clause within the provisions of the Act are to be provided to theAuditor-General within a set statutory timeframe.
2.142. Both Acts provide a greater level of accountability to the community. However, theTerritory incurs administrative costs to support the implementation and complianceprovisions of the Acts. The key costs across government comprise enhanced salarypackages to attract suitably qualified employees in a limited public sector market, trainingfees to support existing employees attaining identified accreditation competencies, andsystems development to confidently account for the disclosure of contracts under thePAGC Act.
2.143. The administrative costs under the Government Procurement Act have yet to bequantified across government. However, the investment in the Territory is significant,including Board support costs of $286,000 per annum, the seven Board members and upto 96 officers in the 12 APUs costs and compliance and governance costs.
2.144. Other States would have in place similar arrangements, if not legislation, to achievethe outcomes of the Government Procurement Act 2001 and the Public Access toGovernment Contracts Act 2000.
2.145. The Government Procurement Act 2001 and the Public Access to GovernmentContracts Act 2000 provide a greater level of accountability to the community aboutgovernment procurement. The administrative arrangements arising from theGovernment Procurement Act 2001 in particular is similar to any other State.
7 ACT Government Procurement Board, Annual Report 2001-02, Canberra 2002 p18.
Procurement
Session 2 - ‘Superannuation Burden, Diseconomies of Small Scale and Cross Border Issues’
80
2.146. Nationally, the complexity of procurement activities has increased over thelast two decades as States responded to changes in the services Governmentdirectly provided. The growth of the importance of procurement has seenresponsibility for procurement shift transfer from the general administration to theexecutive through the establishment of procurement boards and the recognition ofpolicy procurement as a tool to drive government reform in a range of policy areas.
2.147. The complexity of the procurement task has increased in the past decade andcontinues to accelerate primarily as a result of demands of technology but alsoassociated management reforms including contracting out, outsourcing,competitive tendering, alliances and strategic partnerships, to name a few. As thecomplexity of the task has increased, States have faced increasing fixed costsassociated with the creation of and implementation of procurement policies thatrespond to the changing nature of services governments require to meet theircommunity’s expectations.
2.148. Generally, the ACT has the same public sector administrative arrangementsand the same responsibilities as other States (excluding municipal services), butfaces higher per capita administrative costs, due to the Territory’s smallerpopulation.
2.149. All States are required to have greater accountability to their communitiesand the expectations of those communities are higher. Two examples are, theadministrative arrangements arising from the FOI Act and statutory requirementsfor government procurement.
2.150. The ACT contends that these examples demonstrate that the fixedadministrative costs, to provide a standard level of service, faced by all Statesincrease over time. Further, the estimates of fixed costs used by the Commission inits assessment of the Administrative Scale disability should reflect the increase,over time, in fixed administrative costs.
Conclusion
Session 2 - ‘Superannuation Burden, Diseconomies of Small Scale and Cross Border Issues’
81
(C) CROSS BORDER ASSESSMENTS
Regatta Point - Canberra Business Promotion Centre.
Mr Roger Broughton, Acting Deputy Under Treasurer, ACT Department of Treasury.
Presenters
Venue
Session Objectives
• To reinforce the deficiencies in the current assessment method for cross bordereffects which do not compensate the ACT for the full recurrent and capital costsprovided to non-residents.
• To outline the ACT’s support for the use of actual cross-border data where it isavailable, and the need for the Commission to apply the modified general methodof assessment where actual use is not available.
• To provide an outline of the ACT’s proposal for the:
− adoption of a modified general method of assessment which is considered to bea more accurate measure of cross border use where actual data is unavailable;
− application of a socio-demographic factor to the non-resident population used inthe cross border assessment given that the ACT faces higher costs in servicingspecific groups (socio-demographic composition weights are appliedthroughout the expenditure assessments to a range of special groups); and
− inclusion of an adjustment to the depreciation and debt charges assessmentsfor cross-border influences which would reflect NSW residents’ contribution totheir use of ACT community service infrastructure, maintenance anddevelopment.
Session 2 - ‘Superannuation Burden, Diseconomies of Small Scale and Cross Border Issues’
82
2.151. The ACT is situated as an 'island' within the State of NSW and as such, is readilyaccessible to a large number of non-ACT residents living in the surrounding NSW region.These regional populations use a wide range of ACT community services includingeducational, medical, hospital, judicial, welfare, cultural and recreational services.
2.152. The non-resident use of ACT services imposes additional costs on the ACTGovernment for which it is not fully compensated, either through existing cross border
Key Points from the ACT Main Submission
Overview
• The continued assessment of cross border impacts is required given the costburden placed on the Territory's budget. Clearly, as the regional centre for SouthEastern NSW, the ACT faces significant use of its services by non-residents, whodo not contribute to the ACT's revenues. Non-resident use places additionaldemand on a range of ACT services, and increases the costs of providing theseservices.
• The general cross border assessment methods, developed in the 1993 Review andwhich will be over 10 years old by the 2004 Review, require amendment. They donot compensate the ACT for the full recurrent and capital costs associated with theprovision of cross border services to non-residents.
• The ACT believes there are deficiencies in the cross border assessment, including:
- failure to acknowledge the socio-demographic differences between the ACTand regional populations procuring Territory services, and apply the appropriatecost weights to these populations;
- application of too narrow a definition of the NSW regional area that is servicedby the ACT – the 'ACT Region' based on LGAs; and
- underestimation of the proportion of the regional population procuring ACTservices (population weights).
• The ACT has developed a modified general method of assessment to overcomethe deficiencies in the assessment. This method provides a proxy for cross borderuse of ACT services based on sound data in areas that are representative ofnon-resident use generally. The ACT believes this method will measurecross-border use and the associated recurrent costs more accurately than thecurrent broad judgement approach adopted by the Commission, leading to a moretransparent process for the benefit of all parties.
• The ACT believes that the cross border assessment needs to take intoconsideration capital costs emanating from the cross border use of the ACT'sfacilities and infrastructure and that these additional costs should be incorporatedinto the depreciation and debt charges assessments.
Session 2 - ‘Superannuation Burden, Diseconomies of Small Scale and Cross Border Issues’
83
agreements or the Commission's assessments. Furthermore these non-residentsthemselves do not recompense the ACT for the services used.
2.153. The Commission has recognised this issue as being material to the ACT, andattempted to address it in past Reviews. It is not new to the Commission. However, thecurrent assessment method was developed as part of the 1993 Review, and will be over10 years old by the time of the 2004 Review. Factors contributing to non-resident use ofACT services have changed significantly since the method was devised.
2.154. Population weights are a prime example, where the LGAs immediately surroundingthe ACT (the 'ACT Region') have grown at a much faster rate than the Territory itself.Queanbeyan is one such LGA, growing at twice the rate of the ACT between 1996 and2000. This growth means that the population weights used by the Commission no longerrepresent the actual proportions of non-Territory residents accessing ACT services.
2.155. Indeed, in a Canberra Times article dated 27 October 2002, the Manager of theWingecarribee Shire Council was reported as stating that the population of the SouthernHighlands, north of the ACT, is predicted to swell by 25% during the next 10 years, orsome 4800 new home opportunities – the equivalent of four East Bowrals – opening up inMittagong, Moss Vale, New Berrima, and Colo Vale, the shire’s population will grow by13,000 people, from about 42,000 to 55,000.
2.156. A number of NSW councillors have also stated that they are planning substantialdevelopments on the NSW/ACT border. For example, Yarrowlumla Shire Council iscurrently undertaking an environmental impact study for a proposed 13,000 homeresidential development south of Queanbeyan in the area stretching from Googong Damto the Monaro Highway. It is proposed that the population will be greater than 40,000 overtime.
2.157. The extent to which ACT services will be utilised by the residents of thesedevelopments is highlighted by the comments made by Yarrowlumla Shire Council.Yarrowlumla Mayor Ian Marjason stated that “We’ve always been looked at as a rural shirein the past and that will continue to a large extent, but this land which is right on the ACTborder, linked in with all the ACT services, there’s no reason why it can’t go ahead”.8
2.158. The definition of the 'ACT Region' itself is also of some concern. Based onevidence provided in the ACT's submission, it can be seen that the Territory servicespopulations from further afield than just the South Eastern NSW region. In particular, theACT believes that weighted populations from the Illawarra and Central MurrumbidgeeStatistical Divisions should also be included in the assessment, as many residents in theseareas are actually in closer proximity to the ACT than residents in the existing 'ACTRegion':
• it is an anomaly, for example, that Bombala is included in the cross-borderassessment, while areas that are closer to the ACT, such as the Illawarra andMurrumbidgee Statistical Divisions, are excluded.
8 ABC News, 26 August 2002 – http://www.abc.net.au/news/australia/act/metact-26aug2002-2.htm

Session 2 - ‘Superannuation Burden, Diseconomies of Small Scale and Cross Border Issues’
84
2.159. The ACT notes that the Regional Leaders’ Forum (RLF) which is chaired by theChief Minister, and attended by Mayors and General Managers of 20 Shires and the Chairof the ACRDC is growing each year given the interest of NSW LGAs and their relationshipwith the ACT is expanding in terms of economic development, service provision, planningand the like. The extent of service provision that should be covered by the Commission inits cross-border assessment approach is highlighted by the fact that a number of membersof the RLF are outside the South Eastern Statistical Division such as Tumbarumba(Murray Stat. Div.); Cootamundra (Murrumbidgee Stat. Div); Tumut (Murrumbidgee Stat.Div) and Gundagai (Murrumbidgee Stat. Div). Discussions with a number of other Shiresto join the RLF are ongoing.
2.160. As a result of the deficiencies in the current assessment method, the ACT now findsitself in a situation where there is insufficient recognition of the full recurrent costs ofproviding community services to the region, and no allowance made for the capital costs ofmaintaining the infrastructure required to provide such services.
2.161. To rectify the situation, the ACT has provided recent data for a range of services inits submission, which should be taken into account when assessing the cross bordereffect. Where actual data is available, the Commission is urged to use it. Where actualdata is not available, however, the ACT would like the Commission to adopt the Territory'sproposed modified general method of assessment.
2.162. The modified general method has been developed by the ACT to measurecross-border use and the associated recurrent costs more accurately than theCommission's previous application of broad judgement. The ACT has derived across border weight of approximately 20%, based on the latest cross border dataand a range of anecdotal evidence.
2.163. In general terms, the modified general method retains the hallmarks of the generalapproach adopted by the Commission in the pass (the use of LGAs and applyingpopulation weights to them). However, it is far less judgemental as it reflects actualnon-resident usage patterns and is predominantly based on hospital separation data, butwith some reference to community health services data. These data sets were chosenbecause they are very robust, comprehensive and transparent, and are by all accounts,indicative of the extent of cross-border use.
2.164. The modified general method is based on an analysis of this data, whereby:
• separation weights were determined by dividing the number of LGA separations fromthe ACT by the relevant LGA population;
• population weights were then determined by dividing the separation weight for therespective LGA by the ACT separation weight - this indicated the extent of the usage,which showed that in a number of cases, the proportion of non-residents using ACTservices were greater than the proportion of ACT residents using their own services;and
• LGAs were then grouped on the basis of like population weights.
2.165. These calculations led to the following LGA groupings and population weights:
Session 2 - ‘Superannuation Burden, Diseconomies of Small Scale and Cross Border Issues’
85
• 100% of the Queanbeyan population (Group 1);
• 80% of the Boorowa, Tallaganda, and Yass LGA populations (Group 2);
• 50% of the Bombala, Cooma-Monaro, Gunning and Yarrowlumla LGA populations(Group 3);
• 20% of the Bega Valley, Crookwell, Eurobodalla, Goulburn, Harden, Mulwaree, SnowyRiver and Young LGA populations (Group 4);
• 12% of the Cootamundra, Gundagai and Tumut LGA populations (Group 5); and
• 3% of the Coolamon, Junee, Temora and Wagga Wagga LGA populations and theIllawarra Statistical Division population (Group 6).
2.166. These groupings provide an overall weight of 30% for the regional population. 2.167. The ACT is aware that these data may not be wholly representative of the crossborder demand for other non-health related services. It is unlikely that the Queanbeyanpopulation’s demand for services other than health would be 100%. In view of this, theACT proposes a discounting of the calculated weights by approximately one-third. Thiswould reduce the overall weighting to 20%, which is consistent with other general evidenceof cross border usage, including:
• police services, where 18% of offenders apprehended in the ACT are non-ACTresidents (however, latest available data indicates that this is closer to 30% based onevidence provided by the Australian Federal Police);
• corrective services, where 45% of the prisoners serving ACT sentences are from NSW;
• road maintenance, where NSW residents account for 34% of all unpaid fines in theACT;
• charity services, where 20% of St. Vincent De Paul Society assistance is provided tonon-ACT residents;
• hospital services, where 23% of the total separations were from non residents;
• community health services and the use of the Queen Elizabeth II Family Centre, where50% of services are consumed by NSW residents;
• TAFE courses, where 19.8% of student contact hours are consumed by non-ACTresidents; and
• the use of cultural and recreation facilities in the ACT by non-residents which isestimated to be 15%.
2.168. Accordingly, the proposed population weights for the modified generalassessment method are:
• 70% of the Queanbeyan population (Group 1);
• 55% of the Boorowa, Tallaganda and Yass LGA populations (Group 2);
• 35% of the Bombala, Cooma-Monaro, Gunning and Yarrowlumla LGApopulations (Group 3); and
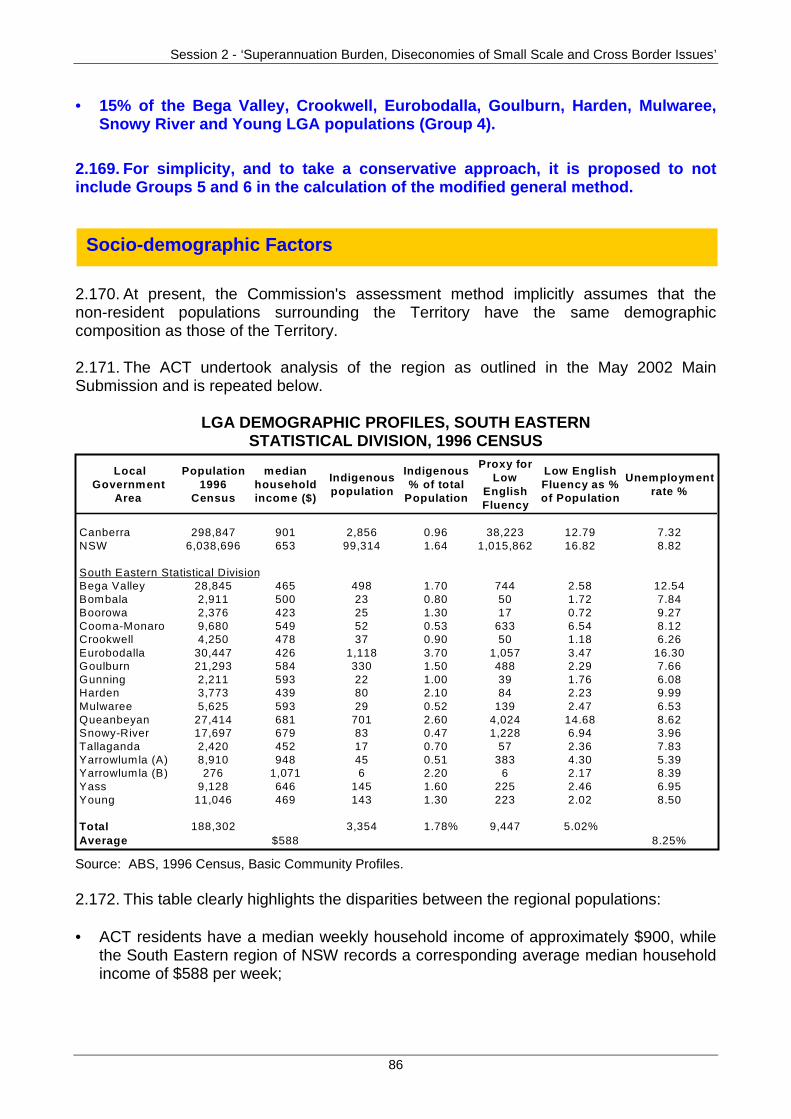
Session 2 - ‘Superannuation Burden, Diseconomies of Small Scale and Cross Border Issues’
86
• 15% of the Bega Valley, Crookwell, Eurobodalla, Goulburn, Harden, Mulwaree,Snowy River and Young LGA populations (Group 4).
2.169. For simplicity, and to take a conservative approach, it is proposed to notinclude Groups 5 and 6 in the calculation of the modified general method.
2.170. At present, the Commission's assessment method implicitly assumes that thenon-resident populations surrounding the Territory have the same demographiccomposition as those of the Territory.
2.171. The ACT undertook analysis of the region as outlined in the May 2002 MainSubmission and is repeated below.
LGA DEMOGRAPHIC PROFILES, SOUTH EASTERNSTATISTICAL DIVISION, 1996 CENSUS
Source: ABS, 1996 Census, Basic Community Profiles.
2.172. This table clearly highlights the disparities between the regional populations:
• ACT residents have a median weekly household income of approximately $900, whilethe South Eastern region of NSW records a corresponding average median householdincome of $588 per week;
Socio-demographic Factors
LocalGovernment
Area
Population1996
Census
medianhouseholdincome ($)
Indigenouspopulation
Indigenous% of total
Population
Proxy forLow
EnglishFluency
Low EnglishFluency as %of Population
Unemploymentrate %
Canberra 298,847 901 2,856 0.96 38,223 12.79 7.32NSW 6,038,696 653 99,314 1.64 1,015,862 16.82 8.82
South Eastern Statistical DivisionBega Valley 28,845 465 498 1.70 744 2.58 12.54Bombala 2,911 500 23 0.80 50 1.72 7.84Boorowa 2,376 423 25 1.30 17 0.72 9.27Cooma-Monaro 9,680 549 52 0.53 633 6.54 8.12Crookwell 4,250 478 37 0.90 50 1.18 6.26Eurobodalla 30,447 426 1,118 3.70 1,057 3.47 16.30Goulburn 21,293 584 330 1.50 488 2.29 7.66Gunning 2,211 593 22 1.00 39 1.76 6.08Harden 3,773 439 80 2.10 84 2.23 9.99Mulwaree 5,625 593 29 0.52 139 2.47 6.53Queanbeyan 27,414 681 701 2.60 4,024 14.68 8.62Snowy-River 17,697 679 83 0.47 1,228 6.94 3.96Tallaganda 2,420 452 17 0.70 57 2.36 7.83Yarrowlumla (A) 8,910 948 45 0.51 383 4.30 5.39Yarrowlumla (B) 276 1,071 6 2.20 6 2.17 8.39Yass 9,128 646 145 1.60 225 2.46 6.95Young 11,046 469 143 1.30 223 2.02 8.50
Total 188,302 3,354 1.78% 9,447 5.02%Average $588 8.25%
Session 2 - ‘Superannuation Burden, Diseconomies of Small Scale and Cross Border Issues’
87
• the surrounding region has almost twice the proportion of Indigenous people onaverage (1.78%) than the Territory (0.96%); and
• the ACT has an unemployment rate of 7.32% while the surrounding region has anaverage rate of 8.25%.
2.173. The existing methodology already recognises in other assessments that certainsocio-economic groups cost more to service. Where there are higher (lower) proportionsof the population with particular socio-demographic profiles in a State the methodologyassumes that this flows directly through to proportionately higher (lower) usage of relevantservices. The onus does not fall on the State to provide actual usage data to support suchan assumption, as it is effectively built into the assessment methodology.
2.174. The ACT believes that the Commission should apply a socio-demographic factor tothe non-resident population used in the cross border assessment. 2.175. The approach adopted should ideally identify the individual socio-demographicprofiles of the cross border populations accessing ACT services, applying the same rulesused to derive the socio-demographic factors in other expenditure categories, such asAge-Sex, Indigeneity and Economic Environment.
2.176. However, if this approach is too complex, a fall back position would be to simply usethe socio-demographic composition factors that are applied to the expenditure categoriesfor NSW as a proxy. This would be less than ideal given that evidence suggests thepopulation of the South Eastern NSW region is actually more costly to service than theaverage NSW population.
2.177. The ACT considers that the Commission to be consistent in its assessment ofthe relative costs of providing services to specific groups (socio-demographiccomposition weights are applied throughout the expenditure assessments), asocio-demographic factor should be applied to the non-resident population used inthe cross border assessment
2.178. The ACT’s Main Submission also noted that the current cross-border assessmentsfails to recognise the use of infrastructure by NSW residents, and the costs that this usageimposes on the ACT. This infrastructure obviously carries with it a range of capital relatedcosts – building, maintenance, and other capital costs including depreciation costs.Additionally, the commitment of funding to this infrastructure effectively means that theACT’s borrowing charges also increase.
2.179. Intuitively, given that NSW residents use this infrastructure, they should be alsocontributing to these capital related costs. The additional burdens placed on communityservices by cross border usage lead to higher rates of service infrastructure depreciationand renewal than would otherwise be the case. In particular, given the socio-demographiccharacteristics of the non-resident population accessing the Territory's services, there is adisproportionately larger impact through cross border usage.
Capital costs
Session 2 - ‘Superannuation Burden, Diseconomies of Small Scale and Cross Border Issues’
88
2.180. Currently the ACT is not compensated for this usage by NSW. Even in more clearlyrecognised instances of cross border usage, such as medical services, NSW only repaysaround half of the capital costs involved. This leaves the ACT without compensation forthe bulk of the additional capital costs it incurs due to non-resident usage.
2.181. The ACT has requested that the assessment take into account theseconcerns by introducing a cross border adjustment into the depreciation and debtcharges assessments. In the absence of actual data on capital costs, the Territorysuggests that the ACT's modified general method should be applied – that is, afactor of approximately 20% could be incorporated into the respective assessments.
2.182. The introduction of a cross border adjustment for capital related costs withinthe depreciation and debt charges assessments would ensure a symmetricalapproach to the calculation of expenditure disabilities.
2.183. As the Commission assesses the additional recurrent costs of non-residentusage , it would follow intuitively that the additional capital related costs in the formof depreciation rates and debt incurred relating to community service infrastructuremaintenance and development for the ACT Region should also be accounted for.
2.184. Finally, a number of these claims will be raised in more detail at different sessionsas illustrated below:
• Session 3 will cover the ACT’s claim in the culture and recreation assessment;
• Session 5 will clarify the ACT’s claim for a cross border impact in the non-inpatienthealth services area;
• Session 7 will raise the issue of cross border students accessing ACT schools;
• Session 8 will highlight the extent of policing cross border crime;
• Session 9 will discuss Australian Health Care Agreement cross-border arrangementsand associated issues as well as a number of other health related issues;
• Session 10 will canvas issues associated with cross border prisoner numbers; and
• Session 11 will raise tax leakage issues.
2.185. The ACT believes that the proposed modified general method of assessmentwill measure cross border use and the associated recurrent costs more accurately,leading to a more transparent process for the benefit of all parties.
2.186. The Territory would urge the Commissioners to review its application incircumstances where data is unavailable, however, use actual data where provided.
Conclusion
Session 3 - National Capital Influences – ‘All Pervasive in Service Delivery’
89
DAY ONE
WEDNESDAY, 13 NOVEMBER 2002
SESSION 3. – NATIONAL CAPITAL INFLUENCES – ‘ALLPERVASIVE IN SERVICE DELIVERY’:
(A) General Public Services.
(B) Culture and Recreation.
(C) Economic Activities - Roads
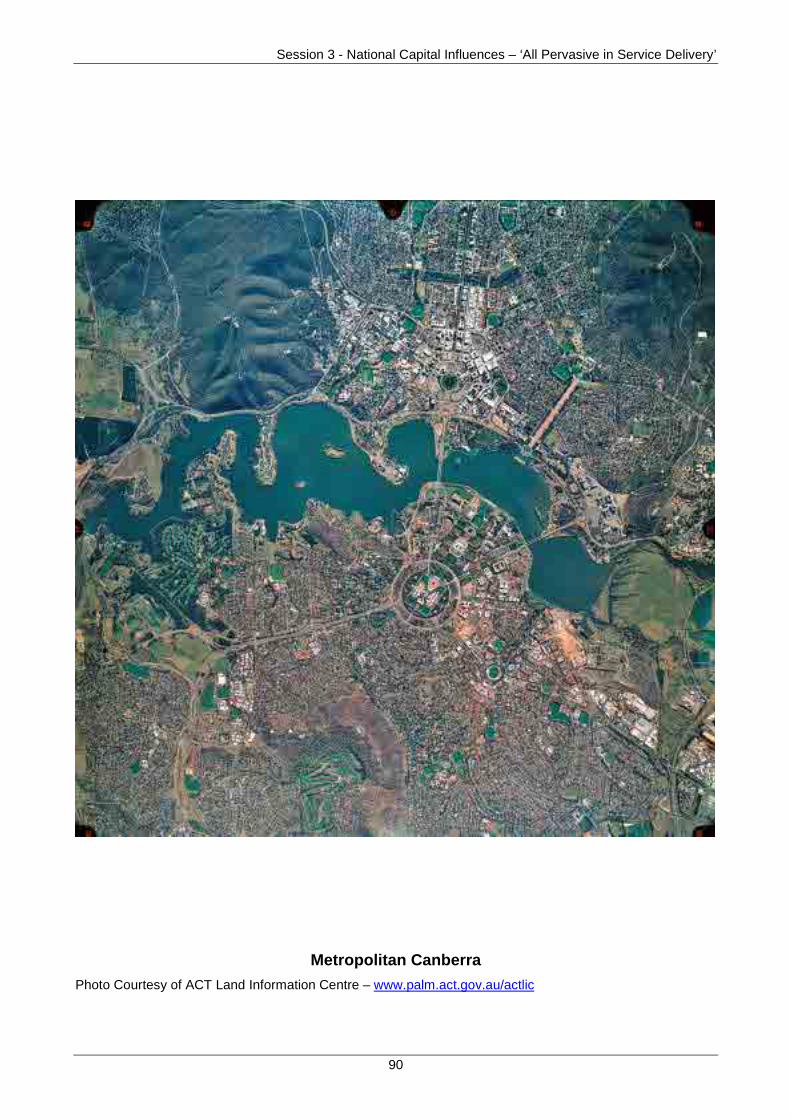
Session 3 - National Capital Influences – ‘All Pervasive in Service Delivery’
90
Metropolitan Canberra
Photo Courtesy of ACT Land Information Centre – www.palm.act.gov.au/actlic
Session 3 - National Capital Influences – ‘All Pervasive in Service Delivery’
91
(A) GENERAL PUBLIC SERVICES
Regatta Point - Canberra Business Promotion Centre.
Dr Colin Adrian is the Executive Director, Policy Coordination, Urban Services.
This Group has responsibility for a range of activities including the international work of theDepartment, Road Transport policy, Housing Policy and overall Departmental policycoordination. Prior to commencing this role, Dr Adrian fulfilled the role of ExecutiveDirector, Environment ACT. Dr Adrian has eleven years experience in senior executivepositions with the ACT Government. He spent two years as an executive with the NationalCapital Development Commission, and has held senior research and teaching positions atthe Australian National University and the University of NSW. Dr Adrian has qualificationsin economics and holds a PhD in economics."
Lincoln Hawkins is the Executive Director, of the Planning and Land Management Group(PALM) which is responsible for ACT urban planning, development management and landadministration.
Mr Hawkins has experience in urban planning and environmental management in variouslocal governments as well as the ACT Administration; and a professional background in
Session Objectives
• The objectives of this session are to demonstrate to the Commission how, unlike theplanning obligations of State counterparts, planning and development in the ACT hasto achieve a balance between the interests of the nation and the interests of theCanberra community. This has a consequential cost impact that for the ACT issignificant and the extent of which has not previously been recognised.
• Based on further investigations by the ACT in conjunction with Ernst & Young, theACT contends that evidence supports the continued assessment of a national capitaldisability factor in recognition of Commonwealth involvement in the detailed planningof Canberra:
− at this point in time, given that further work is still being carried out, an increase inthe allowance of at least $11.3m is necessary to reflect the following threeseparate claims:
! additional planning and development costs;
! foregone economic opportunities and costs; and
! ACT role in strategic planning of the local region.
Venue
Presenters

Session 3 - National Capital Influences – ‘All Pervasive in Service Delivery’
92
planning, environmental health, his Masters degree postgraduate studies focussed on theManagement of Cities.
Lincoln has represented bodies such as the International Union of Local Authorities onSustainable Development issues.
Dorte Ekelund is the Director of the Territory Planning Branch within PALM.
Dorte has worked in urban and regional planning for over 20 years and has extensiveexperience in NSW local government planning as well as with the ACT Government. Shehas qualifications in Urban and Regional Planning and a Masters of BusinessAdministration through the University of Canberra. Until February this year, Dorte was theDirector of Development Management within PALM.
Since February, Dorte has headed up the Planning Minister’s Taskforce to establish anindependent Planning and Land Authority, the reintroduction of government landdevelopment to the ACT, and a review of the planning appeals system.
Martin Hehir is the Director of the Land Group, which manages the Government’s land toensure sustainable use and best return to the community.
Mr Hehir holds a Bachelor of Economics, Graduate Diploma in Applied Finance andInvestment and has worked with the Land Group for the past five years and hasresponsibilities including the development of the Land Release Program.
Martin is also a member of the Independent Planning and Land Management Taskforce.Prior to working with Land, Martin was a member of the ACT Government’s StrategicAsset Management Taskforce.
Session 3 - National Capital Influences – ‘All Pervasive in Service Delivery’
93
Key Points from the ACT Main Submission
National Capital Influences
• The ACT contends the evidence supports the continued assessment of a nationalcapital disability factor in recognition of Commonwealth involvement in thedetailed planning of Canberra, and an increase in the allowance to $11.3mreflecting three separate claims:
− part one relating to additional planning costs incorporating:
! the additional cost burden on the ACT’s capital works program ($1.0m);
! the additional ‘layers’ of planning and negotiation necessary for the ACT toimplement its urban planning policies and for development projects($2.0m); and
! the impact on the ACT of maintaining the ACT Leasehold System whichhas administration imposts ($2.5m);
− part two relating to foregone economic opportunities and associated costs($5.0m) comprising:
! revenue losses through a reduced capacity to lease land for residentialand/or commercial uses;
! the underutilisation of infrastructure necessary to support urbanpopulations in the ACT’s townships;
! economic losses to the ACT arising from revised and/or reduced scale ofdevelopment proposals;
! economic losses to the ACT arising from the inherent delays in negotiatingand finalising development proposals that require the input and/or approvalof relevant Commonwealth bodies;
! revenue losses to the ACT due to the timing for project approvals andongoing ‘rent stream’ and other receivables;
! economic and revenue losses through the release of Commonwealth landsfor residential and/or commercial purposes; and
− part three relating to the ACT’s role in the strategic planning of the local regionestimated at $0.8m.
Scale factor
• The assessment of diseconomies of small scale and input costs faced by theACT in maintaining a planning regime with a leasehold system should becontinued.
Session 3 - National Capital Influences – ‘All Pervasive in Service Delivery’
94
Basis of Claim
3.1. The Main Submission described the features of the ACT’s planning frameworkwhich are not only different from those present in other States, but which provide aninsight in to the types of activities which impose additional cost burdens upon the ACT.The features of the planning and leasehold framework described included the:
• the overall framework;
• role of the National Capital Authority;
• Commonwealth’s planning role;
• National Capital Plan;
• Designated Land Areas;
• the requirement to prepare Development Control Plans for development in DesignatedLand Areas; and
• administration of the Leasehold System.
3.2. These various aspects of the overall planning framework impose a number ofdifferent costs on the ACT. Two types of costs were identified in the Main Submission,being:
• ongoing capital costs of meeting design requirements of the NCA; and
• additional administrative cost burdens in progressing development applications, anddealing with the administration of the ACT’s leasehold system.
Capital Costs
3.3. The ACT has claimed an allowance of $1.0m per annum in relation to ongoingadditional costs incurred in order to meet the various design needs of the NCA, particularlyin the Civic area.
3.4. Two examples were provided in the original submission, in relation the developmentof City Hill (costing additional recurrent costs of $0.5m and capital costs of $3.0m) and theACT Library (which has cost $1.2m to date). The ACT is currently developing additionalinformation in relation to other projects to provide additional examples of the costs incurredby the ACT.
Development Proposals
3.5. The extra layers of administration in relation to having to meet NCA and othernational capital aspects of the planning framework creates additional cost burdens on theACT Government which is not the case in other States. A number of examples of projectswhich have resulted in additional work by the ACT Government, including:
Additional Planning and Development Costs
Session 3 - National Capital Influences – ‘All Pervasive in Service Delivery’
95
• Gungahlin Drive Extension;
• North Gungahlin Structure Plan;
• Abattoir site at Oaks Estate (Symonston);
• Northbourne Avenue Median; and
• Dunlop 2 Estate.
3.6. The additional ‘layers’ of planning and negotiation necessary for the ACT toimplement its urban planning policies and for development projects results in additionalcosts to the Territory of $2.0m.
3.7. This is a result of:
• duplication of effort in relation to competing priorities and objectives between the twoplanning systems;
• the statutory requirement for the Territory Plan (TP) to be not inconsistent with the NCPrequires TP variations (over 200 since gazettal in September 1993) to be checkedagainst the NCP and often there is a need to negotiate over details;
• where there is a requirement for NCA concurrence in approval of an application,another layer of administrative procedure is added, which consumes staff time. Often,negotiation between the ACT and the NCA will occur on the details of a DevelopmentControl Plan (DCP) and what it will/will not permit. This can then require additionalnegotiation with an applicant; and
• where development proposals require an amendment to the NCP, it is estimated thatabout $4,000 in staff resources, including site inspection and appearance at FederalJoint Parliamentary Committees for some staff, are required.
3.8. The ACT worked with Ernst & Young to examine more closely the actual costsfacing the Territory. In this context, the Territory has re-examined the applicable costs andhas estimated that approximately 20% of the 1000 development applications each year onaverage (excluding standard residential) are affected by National Capital influences andthat in respect of these, there is an additional cost burden of 30%. Applying these factorsto the actual costs incurred by the ACT in the year ended 30 June 20029 shows:
9 Costs reflected in output statements contained in Department of Urban Services Annual Report2001-02
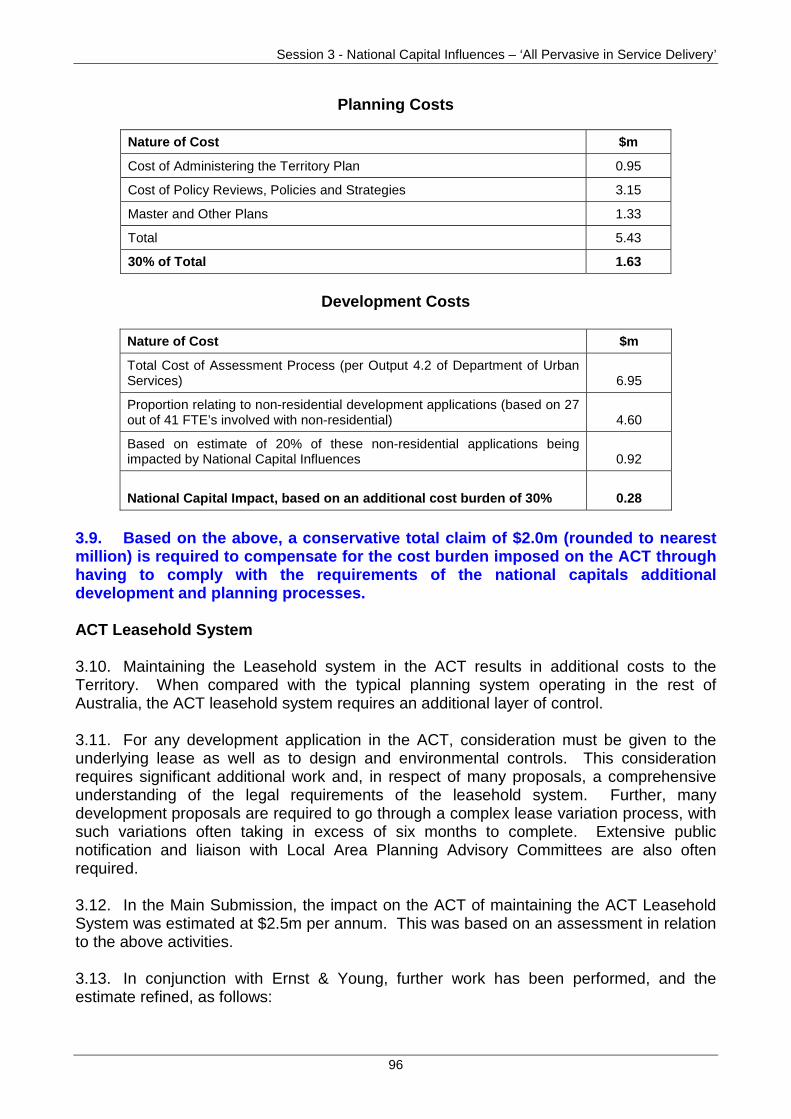
Session 3 - National Capital Influences – ‘All Pervasive in Service Delivery’
96
Planning Costs
Nature of Cost $m
Cost of Administering the Territory Plan 0.95
Cost of Policy Reviews, Policies and Strategies 3.15
Master and Other Plans 1.33
Total 5.43
30% of Total 1.63
Development Costs
Nature of Cost $m
Total Cost of Assessment Process (per Output 4.2 of Department of UrbanServices) 6.95
Proportion relating to non-residential development applications (based on 27out of 41 FTE’s involved with non-residential) 4.60
Based on estimate of 20% of these non-residential applications beingimpacted by National Capital Influences 0.92
National Capital Impact, based on an additional cost burden of 30% 0.28
3.9. Based on the above, a conservative total claim of $2.0m (rounded to nearestmillion) is required to compensate for the cost burden imposed on the ACT throughhaving to comply with the requirements of the national capitals additionaldevelopment and planning processes.
ACT Leasehold System
3.10. Maintaining the Leasehold system in the ACT results in additional costs to theTerritory. When compared with the typical planning system operating in the rest ofAustralia, the ACT leasehold system requires an additional layer of control.
3.11. For any development application in the ACT, consideration must be given to theunderlying lease as well as to design and environmental controls. This considerationrequires significant additional work and, in respect of many proposals, a comprehensiveunderstanding of the legal requirements of the leasehold system. Further, manydevelopment proposals are required to go through a complex lease variation process, withsuch variations often taking in excess of six months to complete. Extensive publicnotification and liaison with Local Area Planning Advisory Committees are also oftenrequired.
3.12. In the Main Submission, the impact on the ACT of maintaining the ACT LeaseholdSystem was estimated at $2.5m per annum. This was based on an assessment in relationto the above activities.
3.13. In conjunction with Ernst & Young, further work has been performed, and theestimate refined, as follows:
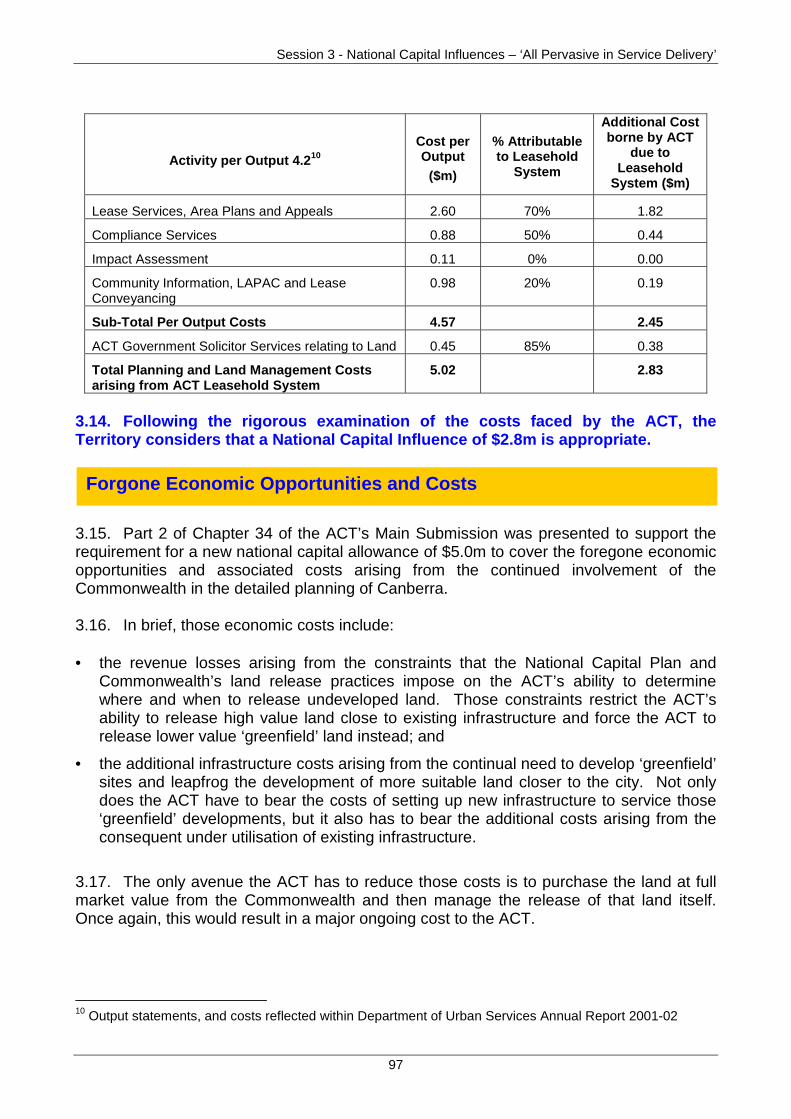
Session 3 - National Capital Influences – ‘All Pervasive in Service Delivery’
97
Activity per Output 4.210Cost perOutput
($m)
% Attributableto Leasehold
System
Additional Costborne by ACT
due toLeasehold
System ($m)
Lease Services, Area Plans and Appeals 2.60 70% 1.82
Compliance Services 0.88 50% 0.44
Impact Assessment 0.11 0% 0.00
Community Information, LAPAC and LeaseConveyancing
0.98 20% 0.19
Sub-Total Per Output Costs 4.57 2.45
ACT Government Solicitor Services relating to Land 0.45 85% 0.38
Total Planning and Land Management Costsarising from ACT Leasehold System
5.02 2.83
3.14. Following the rigorous examination of the costs faced by the ACT, theTerritory considers that a National Capital Influence of $2.8m is appropriate.
3.15. Part 2 of Chapter 34 of the ACT’s Main Submission was presented to support therequirement for a new national capital allowance of $5.0m to cover the foregone economicopportunities and associated costs arising from the continued involvement of theCommonwealth in the detailed planning of Canberra.
3.16. In brief, those economic costs include:
• the revenue losses arising from the constraints that the National Capital Plan andCommonwealth’s land release practices impose on the ACT’s ability to determinewhere and when to release undeveloped land. Those constraints restrict the ACT’sability to release high value land close to existing infrastructure and force the ACT torelease lower value ‘greenfield’ land instead; and
• the additional infrastructure costs arising from the continual need to develop ‘greenfield’sites and leapfrog the development of more suitable land closer to the city. Not onlydoes the ACT have to bear the costs of setting up new infrastructure to service those‘greenfield’ developments, but it also has to bear the additional costs arising from theconsequent under utilisation of existing infrastructure.
3.17. The only avenue the ACT has to reduce those costs is to purchase the land at fullmarket value from the Commonwealth and then manage the release of that land itself.Once again, this would result in a major ongoing cost to the ACT.
10 Output statements, and costs reflected within Department of Urban Services Annual Report 2001-02
Forgone Economic Opportunities and Costs
Session 3 - National Capital Influences – ‘All Pervasive in Service Delivery’
98
3.18. This section:
• outlines the case for a new national capital allowance to cover these opportunity costs;
• discusses the potential magnitude of that allowance; and
• provides specific examples of those economic costs.
The case for a new national capital allowance
3.19. As noted in the Commission’s Guidelines for Implementing Horizontal FiscalEqualisation 11:
• in the 1999 Review, the Commission decided that only operating revenues and therecurring operating expenses incurred in providing services should be included in theequalisation budgets. Capital outlays on the purchase of land, buildings and majorequipment and capital revenues from the sale of assets and capital grants wereconsidered to be outside the scope of equalisation. However, depreciation expensesresulting from the use of capital, and debt charges associated with capital acquisition,were considered to be within the scope of equalisation; and
• In the discussion paper Scope and Structure of the Standard Budget (CGC 2001/12),the Commission proposed expanding the scope of the equalisation budget for the 2004Review to include all transactions that the ABS includes in deriving State operatingresults under its Government Finance Statistics (GFS) processes.
3.20. The ACT agrees with the Commission that “… all recurrent sources of fundingavailable to a State, including its revenue from related SPPs, should be taken into accountin calculating its relevant need for GST revenue”.12 In particular, the ACT supports theCommission’s practice of examining the nature and purpose of transactions to determinewhether they are capital or recurrent regardless of how they are classified by the States orthe Commonwealth.
3.21. The practice of excluding the revenue from most sales of State government assetsis appropriate given that:
• those sales tend to be ‘one-off’ in nature and not recurrent;
• State governments have the freedom to determine their policies in relation to whichassets to sell and when to sell those assets; and
• it is important to avoid potentially distorting State government policy decisionsregarding the transfer of ownership of State assets to the private sector.
3.22. However, the situation in relation to the ACT Government’s sale of land is quitedifferent:
• land sales are recurrent and provide an important ongoing source of revenue for theACT. Indeed, originally the Commonwealth was going to return any of its unwanted
11 Commonwealth Grants Commission, Guidelines for Implementing Horizontal Fiscal Equalisation,
Information Paper CGC 2002/1, September 2002, p 12.12 Ibid, p 14.
Session 3 - National Capital Influences – ‘All Pervasive in Service Delivery’
99
undeveloped land to the ACT free of charge to supply the ACT with a source ofrevenue. However, it has now decided to sell that land at full market value either to theACT or directly to the private sector;
• the ACT does not have complete freedom to manage its land release program in amanner that best meets the development needs of the ACT at least cost to the ACT.Rather, as outlined below, the Commonwealth imposes major constraints on the ACT’sability to plan its land release program, maximise the revenue it receives from its landreleases and minimise the infrastructure costs of new land releases;
• land sales do not raise major policy issues regarding privatisation as does the sale ofother significant State-owned assets; and
• regardless of the manner in which the Commission decides to classify the ACT’s landsales for the purposes of allocating GST revenue, the Australian Capital Territory (Self-Government) Act 1988 establishes that the intention of the Commonwealth Parliamentis to avoid the ACT community incurring costs arising from national capital influences.In addition, section 5 of the Commonwealth Grants Commission Act 1973 supports thatintent.
3.23. For these reasons, the ACT considers that it is appropriate for theCommission to establish a new national capital allowance to cover the foregoneeconomic opportunities and associated costs arising from the continuedinvolvement of the Commonwealth in the detailed planning of Canberra.
The potential magnitude of those opportunity costs
3.24. The $5m allowance claimed in the ACT Main Submission was derived using adegree of broad judgement based on extensive experience over the past twelve years withindividual claims.
3.25. As already foreshadowed, the ACT engaged Ernst & Young to review thesearguments and assist in quantifying the direct economic consequences of both past andpresent Commonwealth decisions in the areas of planning and leasehold administration.
3.26. Initial estimates suggest that the original $5m estimate significantly understates themagnitude of those costs. For example, in order to illustrate the potential size of this claimon an annual basis, it is useful to:
• consider the actual revenue raised by the ACT from land sales in the last two financialyears; and
• compare that with an alternative scenario that considers revenue from potentialdevelopment opportunities completely free from all National Capital restrictions.
3.27. Such a comparison of likely returns demonstrates the opportunity cost of thedevelopment restrictions imposed on the ACT.
3.28. Over 1999-2000 and 2000-01, the ACT sold between 800-900 lots each year,mainly in the new district of Gungahlin. By comparison, approximately the same numberof lots could have potentially been developed in the proposed suburb of Lawson in the
Session 3 - National Capital Influences – ‘All Pervasive in Service Delivery’
100
same time frame. Whilst Gungahlin is in an outer area of Canberra and appeals to the firsthome-buyer, Lawson is more centrally located and surrounded by establisheddevelopment and would attract the premium end of the Canberra housing market.
3.29. Abstracting from the different infrastructure costs involved, it is conservativelyestimated that an average serviced lot in Lawson would have sold for a minimum of$20,000 more than a serviced lot in Gungahlin over the period 1999-2000 and 2000-01.This price differential takes into consideration a range of low to medium density housing.Evidence suggests that the premium end of the market was under supplied during theperiod in question and the development of Lawson would not have adversely influencedthe premium.
3.30. On the basis of 800 lots per year, the opportunity cost of not being able to developLawson is around $16m per annum (800 times $20,000).
3.31. This annual cost would be even greater once an allowance is made for the higherinfrastructure costs associated with 'greenfield’ developments.
3.32. The ACT is continuing the process of undertaking a complete analysis ofthese opportunity costs. However, the illustration above supports our view that theopportunity costs arising from national capital influences significantly exceeds theoriginal $5m claim.
3.33. The ACT will be providing the Commission with more detailed information insupport of its costings, including a final claim in its Rejoinder Submission.
Examples of opportunity costs
3.34. All land in the Territory, except that reserved by the Commonwealth for a nationalpurpose, became Territory land at self-government. The Commonwealth retained largetracts of undeveloped land for its future use. It was the Territory’s understanding(supported by correspondence between Ministers and officer level discussions at thetime), that should the Commonwealth no longer require the land retained, it would bereturned to the ACT at no charge consistent with the treatment of all land atself-government.
3.35. The Commonwealth has begun a process of divesting its now unwantedundeveloped land. The Commonwealth’s position on returning this land to the ACT is nowthat, in the absence of any written and signed agreement to return land to the Territory, itmust be sold at full market value.
3.36. The Commonwealth has sold two major sites in the last two years (Barton andGreenway) totalling approximately 10 hectares, and in the current year proposes to sell inexcess of 25 sites totalling 815 hectares, if the Territory does not purchase the sites atcurrent market value. This compares to actual land releases of approximately 93 hectaresby the Territory in 2001-02 and 98 hectares in 2000-01. The massive impact ofCommonwealth land sales is clearly evident, with the Commonwealth proposing to releasethe equivalent of in excess of 8 years land supply at one time.

Session 3 - National Capital Influences – ‘All Pervasive in Service Delivery’
101
3.37. It is also important to note that upon sale and the subsequent revocation of itsnational land status, all commitments and obligations entered into by the Commonwealth,become commitments and obligations of the Territory.
3.38. It is calculated that the Commonwealth’s sale of undeveloped land over the last twoyears will cost the Territory approximately $4.3m (car parking and road works at Bartonand Storm water and intersection improvements at Greenway plus increased borrowingcosts as a result of deferred revenue). The cost to the Territory will, however, escalaterapidly in the coming years as the level of Commonwealth land release escalates.
3.39. Land release is unique in the Territory, with the government providing all newdevelopment land to the market in accordance with a 5 year land release program. Landis released to achieve 3 principal objectives:
• ensure the market has sufficient land to accommodate Canberra’s residential andcommercial growth, without allowing a significant surplus or deficit in supply to develop;
• to achieve both long and short term planning outcomes in terms of physicalinfrastructure utilisation, location of residential and commercial growth, businessdevelopment and the provision of social and community infrastructure; and
• to generate revenue, which is in part used to meet infrastructure costs, associated withthe land release program. Net revenue generation runs at around $45m per annumfrom these recurrent sales.
3.40. The Commonwealth’s sale of undeveloped land outside of the ACT’s land releaseprogram has a number of impacts on the Territory, which are described in the followingparagraphs.
The Commonwealth in releasing its land does not consider off site requirements
3.41. The Territory in releasing the land may have imposed off site works as part of thedevelopment such as down stream storm water works; traffic intersection improvements,additional road connections, parking contributions or water and sewerage supplyaugmentation. Other jurisdictions have the right to impose such requirements as part ofany development conditions, the Territory does not. Development rights are granted bythe Commonwealth when they grant the lease.
3.42. In effect the Commonwealth takes the lease premium at sale, and leaves theTerritory to pick up the cost of integrating the development into the surrounding area.
Session 3 - National Capital Influences – ‘All Pervasive in Service Delivery’
102
Commonwealth land releases impact upon the Territory’s ability to release land,denying or deferring part of the Territory’s recurrent revenue stream
3.43. Land sales by the Commonwealth force the Territory to modify its land releaseprogram so as to ensure excessive land supply does not lead to economic and socialconsequences detrimental to the Territory. This results in the loss or deferral of revenuewith subsequent increased borrowing costs to the Territory.
Example – Barton and Lawson
The Commonwealth’s land sale in Barton in February 2001 removed 300 car spacesfrom the Barton area parking, exacerbating an already critical parking shortage in thearea. The Commonwealth did not make provision in the lease for the purchaser toreplace the parking thereby transferring a cost in the order of $3.75m to the Territory toprovide structured car parking.
The cost of providing enhanced traffic flow and access in the area, together with waterand sewerage augmentation was likewise not imposed on the developer resulting in anadditional cost impost of some $400,000 on the Territory. Likewise the cost of downstream storm water augmentation, traffic flow improvements and parking impactsresulting from the sale of the Greenway site were not passed to the developer by theCommonwealth, resulting in the Territory having to pick up costs of some $550,000.
The current planned sale of Defence land in Lawson will result in the costs of majorintersection, storm water and water and sewerage works being passed to the Territory.The cost of water and sewerage provision to the area via major trunks is estimated at inexcess of $2m, with road works likely to be of a similar amount. These costs wouldnormally be imposed on the developer, however the Commonwealth takes the full leasepremium and imposes no obligations on the developer.
Example - Greenway
The Commonwealth’s sale of 5 hectares in Greenway necessitated the Territory’swithdrawal of two commercial sites it had proposed to sell. This represented foregonerevenue to the Territory of approximately $2.5m. It is unlikely the Territory will be ableto release these sites for 5 – 7 years. This represents a cost to the Territory ofapproximately $150,000 pa in borrowing costs.
Session 3 - National Capital Influences – ‘All Pervasive in Service Delivery’
103
Commonwealth land releases are not made consistent with Territory developmentplanning, thereby imposing significant additional costs on the Territory, or bringingforward planned expenditure
3.44. In order to protect the Territory’s long term planning and land release strategies itmay be necessary to purchase the strategic sites that the Commonwealth is offering forsale. This may cost the Territory in excess of $100m. This would enable the land to bereleased and developed in an orderly manner properly reflecting development costs at thetime of sale. The Territory though is unlikely to be able to recover any of its money within8 years, and would take up to 15 years to fully recover its outlay. This course of actionwould add approximately $6m per annum to the Territory’s debt servicing costs, and riskthe Territory’s credit rating.
3.45. Additionally the Territory would crystallise a loss over the price paid to theCommonwealth, as the Commonwealth’s valuation would not be reflective of off sitedevelopment costs that the Territory would pay/pass on to developers when it came to sell.This loss is estimated at $10m.
Impact on economic and regional development of Commonwealth decisionsregarding major employment locations within the capital
3.46. The Commonwealth has put in place a planning system that calls for developmentaround Town Centres with a stand-alone city (serving inner North). This has ongoing costimplications dealt with elsewhere in the Territory’s submission.
3.47. This system was underpinned by control of where Commonwealth agencies werelocated. Commonwealth agencies continue to be the major source of employment in theACT.
3.48. Since self-government the decentralisation of office accommodation decisionmaking has escalated with agencies now free to choose their own accommodationstandards and location. The NCA has also relinquished any control or coordinationfunction it has over the location of Commonwealth agencies.
Example - Crace
The clearest example is that of the Commonwealth’s land release in Gungahlin. Itcomprises a whole new residential suburb (Crace) of up to 2,000 dwellings. TheTerritory has an alternative releases program that would not see development for atleast 8 years. This program of release would enable the Territory to rely on a primaryschool that has just been completed to reflect the expected land release pattern.
The Commonwealth’s release would necessitate the construction of a new primaryschool at a cost of some $8m and additional running costs of some $2m per annum.The Commonwealth’s release will also reduce the Territory’s ability to release its ownland in Gungahlin, resulting in the deferral of at least $16m per annum in Territoryrevenue over 5 years.
Session 3 - National Capital Influences – ‘All Pervasive in Service Delivery’
104
3.49. The down sizing that occurred in the Commonwealth public service in the mid 90’s,also has a disproportional effect on Town Centres and the city in comparison to otherjurisdictions, where the overall impact was negligible.
3.50. To date, the major impacts of agency relocations have been on Civic, where themigration of agencies to Barton resulted in a significant downturn in the city and hasplaced pressure on the ACT to provide facilities, parking and adequate public transport inBarton.
3.51. A further factor impacting on Civic and other Town Centres at the Territory’sexpense, is the Commonwealth’s sale of the Canberra airport.
3.52. The development rights sold with the airport are seeing the emergence of what is ineffect a new unplanned employment centre. This will place pressure on existing TownCentres and the city, with some tenants already locating out of Civic to the airport. Inaddition the Territory will come under increasing pressure to provide services to the newemployment centre, without any supporting population mass.
3.53. The NCA’s response to this is to consider amendments to the NCP that will removeany requirement that the employment have an airport link, thus exacerbating the problem.
3.54. The NCA has a special interest in Civic and controls many aspects of itsdevelopment (often against the Territory’s wishes – see other parts of submission onSection 6, link building and magistrates court building).
3.55. The Chief Executive of the NCA as recently as 25 September 2002, was in thepress advocating that the Territory redirect spending from Town Centres to the city in theinterests of the National Capital. Ms Annabelle Pegram advocated immediate action to‘upgrade’ Civic and that Civic would be the ‘first’ among equals in terms of other TownCentres.
3.56. It is ironic that the NCA should be insisting the Territory redirect its resources intothe city, when the single most negative factor to affect the city since the 60’s has been theNCA allowing major Commonwealth agencies to vacate Civic.
3.57. The negative impact of the movement of Commonwealth agencies out of Civic iscompounded as support workers (lawyers, accountants etc) follow the Commonwealthagencies.
3.58. In response to the rapid deterioration in Civic caused by Commonwealth downsizingand office migration, the Territory initiated the ‘Our Canberra’ strategy. This strategy wasin response to Commonwealth actions and the Territory’s obligations to the NationalCapital.
3.59. The ‘Our Canberra’ strategy was aimed at encouraging people not to abandonCivic. It included initiative such as waiver of Betterment and change of use charges,combined with Civic infrastructure upgrades. This was achieved at the expense of otherTown Centres and upgrading is ongoing.
Session 3 - National Capital Influences – ‘All Pervasive in Service Delivery’
105
3.60. Over a three-year period the Territory has foregone revenue of approximately$3.5m (change of use and stamp duty) and has spent $12.5m upgrading Civicinfrastructure to encourage people to remain in Civic.
3.61. The past and ongoing costs of this program have been in excess of $4m and do notyet envisage the NCA’s call for greater spending.
3.62. In its Main Submission, the ACT requested an increase in the national capitalallowance in recognition of its role in the strategic planning of the local region, from $0.4mto $0.8m, based on the increased activity it is required to undertake, for example throughinvolvement in the Regional Leaders Forum, the ACRDC and other such forums. Thisclaim is still relevant.
3.63. The ACT engaged Ernst & Young to undertake a consultancy to rigorouslyand independently analyse the ACT’s claims in regard to planning National Capitalallowances.
3.64. The ACT contends that the evidence supports the continued assessment ofa national capital disability factor in recognition of Commonwealth involvement inthe detailed planning of Canberra.
3.65. At this point in time, given that further work is still being carried out by theACT with the assistance of Ernst & Young, an increase in the allowance of at least$11.3m is necessary to reflect the following three separate claims:
• additional planning and development costs;
• foregone economic opportunities and costs; and
• ACT role in strategic planning of the local region.
3.66. The Commission should note, however, that additional information will beprovided in the ACT’s Rejoinder Submission on this matter.
ACT Role in Strategic Planning of the Local Region
Conclusion
Session 3 - National Capital Influences – ‘All Pervasive in Service Delivery’
106
(B) CULTURE AND RECREATION
Regatta Point - Canberra Business Promotion Centre.
Mr Gordon Davidson, Executive Director of City Management.
Mr Davidson has an engineering, urban planning and transport background. He holdsqualifications in engineering and has extensive experience in infrastructure development,management and maintenance. He was previously, Director of Roads ACT and ExecutiveDirector of City Operations, having worked in this area of Canberra over the last 25 years.
Other Departmental Representatives
Ms Alice Heather, Manager, Canberra Urban Parks and Places.
Ms Heather's responsibilities include the management of Canberra's urban parks,sportsgrounds, lakes (excluding Lake Burley Griffin), public pools, public trees andsuburban precincts.
Alice holds a Bachelor of Horticultural Science and has extensive experience in parkmanagement, previously working in local government in New Zealand.
Presenters
Session Objectives
• This session expands on those issues raised by the ACT in its Main Submission tothe Commission’s 2004 Review.
• In particular, the ACT is seeking that the Commission address a number ofperceived weaknesses in the application of the following components:
− national capital influences; and
− cross border impacts.
• Further evidence is provided in support the use of the ACT’s proposed generalmethod of assessment for cross border impacts.
• Similarly, through the provision of updated data, further information is provided insupport of the ACT’s National Capital allowances claim.
Venue
Session 3 - National Capital Influences – ‘All Pervasive in Service Delivery’
107
3.67. In its Main Submission, the ACT provided two additional examples of cross borderimpacts within the Culture & Recreation category of $235,374 per annum in respect oflibrary services used by interstate members, and $840,000 per annum in respect of artsand cultural facilities used by interstate visitors.
3.68. The cross border impact upon ACT library services was easily displayed throughthe use of the ACT library services borrowers database, showing that out of a total of124,010 borrowers registered, 3,140 of those were residents of the surrounding NSWregion who were actively using the ACT library service.
3.69. The ACT is also seen within the region as a ‘cultural centre’ and not just an‘information centre’, providing arts services and cultural programs within the Territory andalso grants to assist artists and community festivals immediately beyond the borders of theACT.
3.70. As an example, Bungendore artist Michael Le Grand was a recipient of an ACT ArtsFellowship, Yass resident and glass artist Peter Crisp was awarded the 2000 ACTBusiness Export Award in Arts and Culture and the Tuggeranong Arts Centre holdsexhibitions by regional artists and regional festivals such as the Vietnamese MoonFestival.
3.71. It is estimated that 15% of total arts and cultural overheads are attributable to crossborder users, and this is demonstrated by the cross border membership of key ACT artsorganisations. For example 40% of CraftACT members, 33% of Canberra Contemporary
Key Points from the ACT Main Submission
Cross border
• The ACT supports the continued assessment of cross border influences (albeit usingthe ACT’s proposed modified general method of assessment).
• Cross border library services and cultural costs were provided as examples of costsfaced by the ACT, and which had not previously been provided to the Commission.
National Capital Influences
• A National Capital Allowance should continue to be assessed for the ACT’s abovestandard area of sportsgrounds and urban open space.
• These costs should, however, also incorporate an allowance for the costs incurredby the ACT in managing and maintaining Commonwealth Designated Areas.
Scale Affected Expenditure
• A scale factor should continue to be assessed for diseconomies of small scaletogether with input costs disabilities experienced by the ACT.
Cross Border
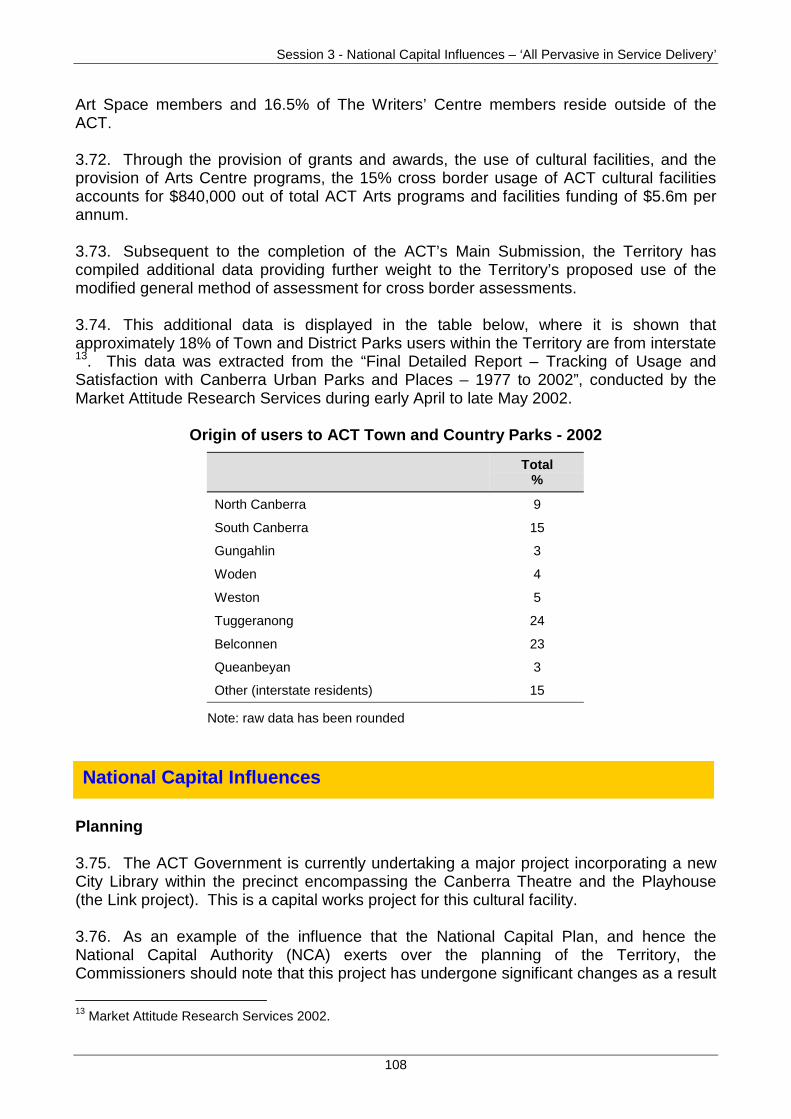
Session 3 - National Capital Influences – ‘All Pervasive in Service Delivery’
108
Art Space members and 16.5% of The Writers’ Centre members reside outside of theACT.
3.72. Through the provision of grants and awards, the use of cultural facilities, and theprovision of Arts Centre programs, the 15% cross border usage of ACT cultural facilitiesaccounts for $840,000 out of total ACT Arts programs and facilities funding of $5.6m perannum.
3.73. Subsequent to the completion of the ACT’s Main Submission, the Territory hascompiled additional data providing further weight to the Territory’s proposed use of themodified general method of assessment for cross border assessments.
3.74. This additional data is displayed in the table below, where it is shown thatapproximately 18% of Town and District Parks users within the Territory are from interstate13. This data was extracted from the “Final Detailed Report – Tracking of Usage andSatisfaction with Canberra Urban Parks and Places – 1977 to 2002”, conducted by theMarket Attitude Research Services during early April to late May 2002.
Origin of users to ACT Town and Country Parks - 2002
Total%
North Canberra 9
South Canberra 15
Gungahlin 3
Woden 4
Weston 5
Tuggeranong 24
Belconnen 23
Queanbeyan 3
Other (interstate residents) 15
Note: raw data has been rounded
Planning
3.75. The ACT Government is currently undertaking a major project incorporating a newCity Library within the precinct encompassing the Canberra Theatre and the Playhouse(the Link project). This is a capital works project for this cultural facility.
3.76. As an example of the influence that the National Capital Plan, and hence theNational Capital Authority (NCA) exerts over the planning of the Territory, theCommissioners should note that this project has undergone significant changes as a result
13 Market Attitude Research Services 2002.
National Capital Influences
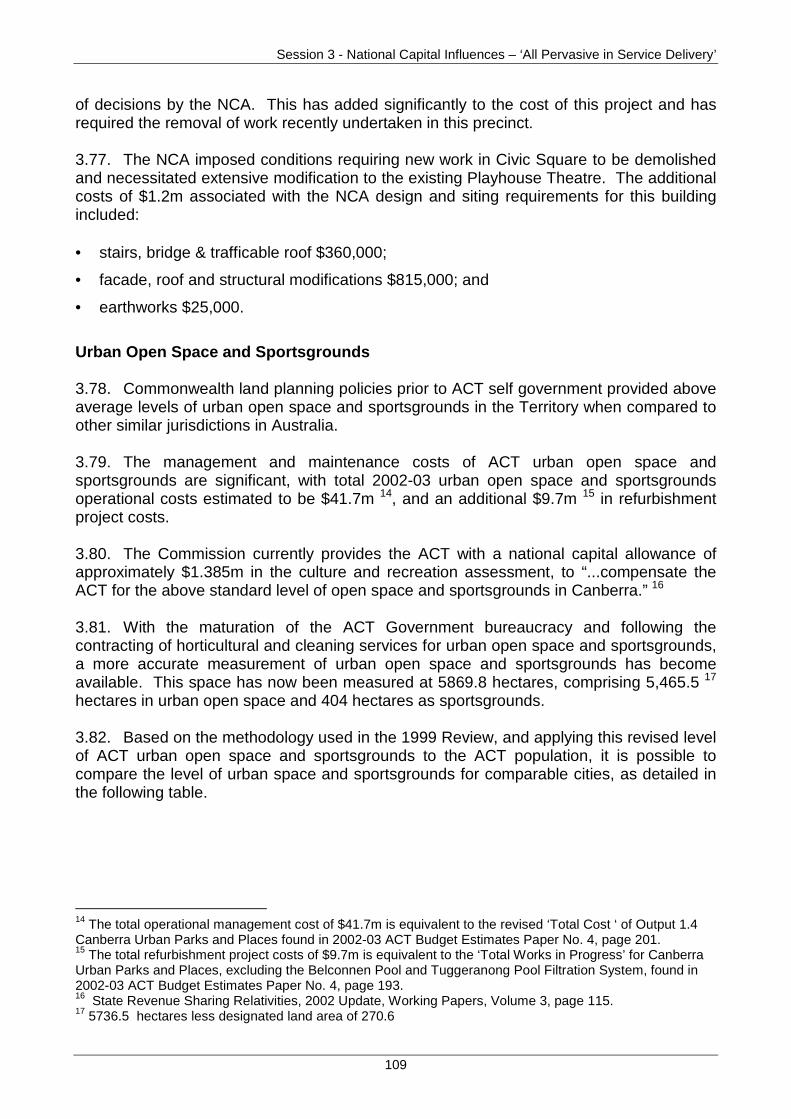
Session 3 - National Capital Influences – ‘All Pervasive in Service Delivery’
109
of decisions by the NCA. This has added significantly to the cost of this project and hasrequired the removal of work recently undertaken in this precinct.
3.77. The NCA imposed conditions requiring new work in Civic Square to be demolishedand necessitated extensive modification to the existing Playhouse Theatre. The additionalcosts of $1.2m associated with the NCA design and siting requirements for this buildingincluded:
• stairs, bridge & trafficable roof $360,000;
• facade, roof and structural modifications $815,000; and
• earthworks $25,000.
Urban Open Space and Sportsgrounds 3.78. Commonwealth land planning policies prior to ACT self government provided aboveaverage levels of urban open space and sportsgrounds in the Territory when compared toother similar jurisdictions in Australia. 3.79. The management and maintenance costs of ACT urban open space andsportsgrounds are significant, with total 2002-03 urban open space and sportsgroundsoperational costs estimated to be $41.7m 14, and an additional $9.7m 15 in refurbishmentproject costs. 3.80. The Commission currently provides the ACT with a national capital allowance ofapproximately $1.385m in the culture and recreation assessment, to “...compensate theACT for the above standard level of open space and sportsgrounds in Canberra.” 16
3.81. With the maturation of the ACT Government bureaucracy and following thecontracting of horticultural and cleaning services for urban open space and sportsgrounds,a more accurate measurement of urban open space and sportsgrounds has becomeavailable. This space has now been measured at 5869.8 hectares, comprising 5,465.5 17
hectares in urban open space and 404 hectares as sportsgrounds. 3.82. Based on the methodology used in the 1999 Review, and applying this revised levelof ACT urban open space and sportsgrounds to the ACT population, it is possible tocompare the level of urban space and sportsgrounds for comparable cities, as detailed inthe following table.
14 The total operational management cost of $41.7m is equivalent to the revised ‘Total Cost ‘ of Output 1.4Canberra Urban Parks and Places found in 2002-03 ACT Budget Estimates Paper No. 4, page 201. 15 The total refurbishment project costs of $9.7m is equivalent to the ‘Total Works in Progress’ for CanberraUrban Parks and Places, excluding the Belconnen Pool and Tuggeranong Pool Filtration System, found in2002-03 ACT Budget Estimates Paper No. 4, page 193. 16 State Revenue Sharing Relativities, 2002 Update, Working Papers, Volume 3, page 115.17 5736.5 hectares less designated land area of 270.6
Session 3 - National Capital Influences – ‘All Pervasive in Service Delivery’
110
City Space (h) Population 18 H/1000 persons
Canberra 5,869.8 311,947 18.8
Wollongong 2,677 19 181,612 14.7
Newcastle 1,440 20 137,307 10.5
Gold Coast 4,015 21 441,736 9.1
3 City Average 11.4
3.83. The average urban open space and sportsground provision rate for these threecities is therefore 11.4 hectares per 1,000 persons (as compared to the 9.6 hectares per1,000 people used in the 1999 Review). Assuming that this average is a benchmark forsimilar sized cities, the ACT has approximately 1.65 times the average level of urban openspace and sportsgrounds. 3.84. On this basis, the additional maintenance costs due to the above average level ofprovision of open space and sportsgrounds inherited from the Commonwealth can becalculated as:
(1 - average level of space / ACT level of space) * ACT operational costs =Additional costs due to Commonwealth over-provision of urban open space andsportsgrounds; shown as
(1-11.4/18.8) * $41.7m = $16.41m
3.85. Utilising the data above, where the ACT’s operational costs of $16.41m are 65%above standard, a standard operational cost of $9.95m per annum may be derived. Whichin turn results in a total above standard cost for the ACT of $6.46m per annum or $20.71per capita. 3.86. Using the data above it is now possible to calculate a revised National CapitalFactor based upon the methodology used in the 1999 Review, and detailed below: a. actual ACT expenditure per capita (five year average) for the Culture and Recreation
category of $97.52 22 less the above standard cost of $20.71 results in an actualexpenditure per capita of $76.81, if the ACT had a standard amount of open space andsportsgrounds.
b. standard expenditure per capita (five-year average) of $59.39 23 divided by $76.81equals the proportion of standard expenditure to ACT actual expenditure (0.77).
c. the above standard cost of $20.71 multiplied by 0.77 equals the cost of serviceprovision of the above standard amount of open spaces at the standard cost rate,giving a National Capital Allowance of $15.95 per capita or $5.0m per annum.
18 2001 Census, Australian Bureau of Statistics.19 2000-01 State of the Environment Report, Wollongong City Council,20 1999-00, 1998-99 and 1997-98 State of the Environment Reports, Newcastle City Council21 Gold Coast Data unavailable. Average growth in the Wollongong and Newcastle urban open space andsportsgrounds was applied to the 1999 Review Gold Coast figure to derive an updated figure.22 Culture & Recreation assessment, CGC Report on State Revenue Sharing Relativities 2002 Update, p213.23 Ibid, p213.
Session 3 - National Capital Influences – ‘All Pervasive in Service Delivery’
111
Designated Land Areas 3.87. As stated in the Main Submission, the ACT is required to maintain the urban openspace on Designated Land (Attachment A), but does not have development or planningcontrol over the areas, which include:
• parklands adjacent to Lake Burley Griffin, (not identified as National Land), includingareas such as Weston Park and Black Mountain Peninsula;
• the City area, and environs, which are out of the ACT’s planning control; and
• land adjacent to the major arterial roads leading in and out of Canberra, including theMonaro highway, Commonwealth and Kings Avenue, Parkes Way and MorseheadDrive.
3.88. Designated Land urban open space has been measured by the ACT at 270.6hectares or 1.6% of the total area managed by the Territory as urban open space. 3.89. The ACT is required to maintain many of these areas at a very high standard asindicated by the following:
“… main avenues are to be enhanced in their formal character and maintained to thehighest standards” 24; and also
“… they (Designated Land Areas) form the setting for the Lake and the National Area, andare very popular with tourists and locals, the parklands surrounding the lake are areas of
special national concern, and their present high standard of maintenance is thereforejustified” 25,
3.90. The cost to the Territory of maintaining these areas is significant, including:
• an assessed annual maintenance cost of $667,000 (based on an area of 1.6% out of atotal cost of $41.7m); and
• specific maintenance costs attributable to the English Garden ($150,000), Weston Park($40,000) and Black Mountain Peninsula ($30,000), totalling $220,000 in 2000-01.
24 National Capital Plan, Section 2 Main Avenues and Approach Routes, p 73.25 Lake Burley Griffin Technical and Management Guidelines, Appendix J, p 143.
Session 3 - National Capital Influences – ‘All Pervasive in Service Delivery’
112
3.91. The further evidence supplied supports the ACT’s proposed use of themodified general method for cross border assessments.
3.92. The Commission should note that based on a more accurate calculation ofthe ACT’s level of urban open space and sportsgrounds, and not an increase spacedue to revised ACT Government planning practices, the National Capital Allowanceof $2.2m claimed in the ACT Main Submission has been revised to a total of $5.0mp.a. 3.93. Direct management and maintenance costs incurred in managing urban openspace by the Territory in connection with Designated Land, amount toapproximately $1m per annum.
Conclusion
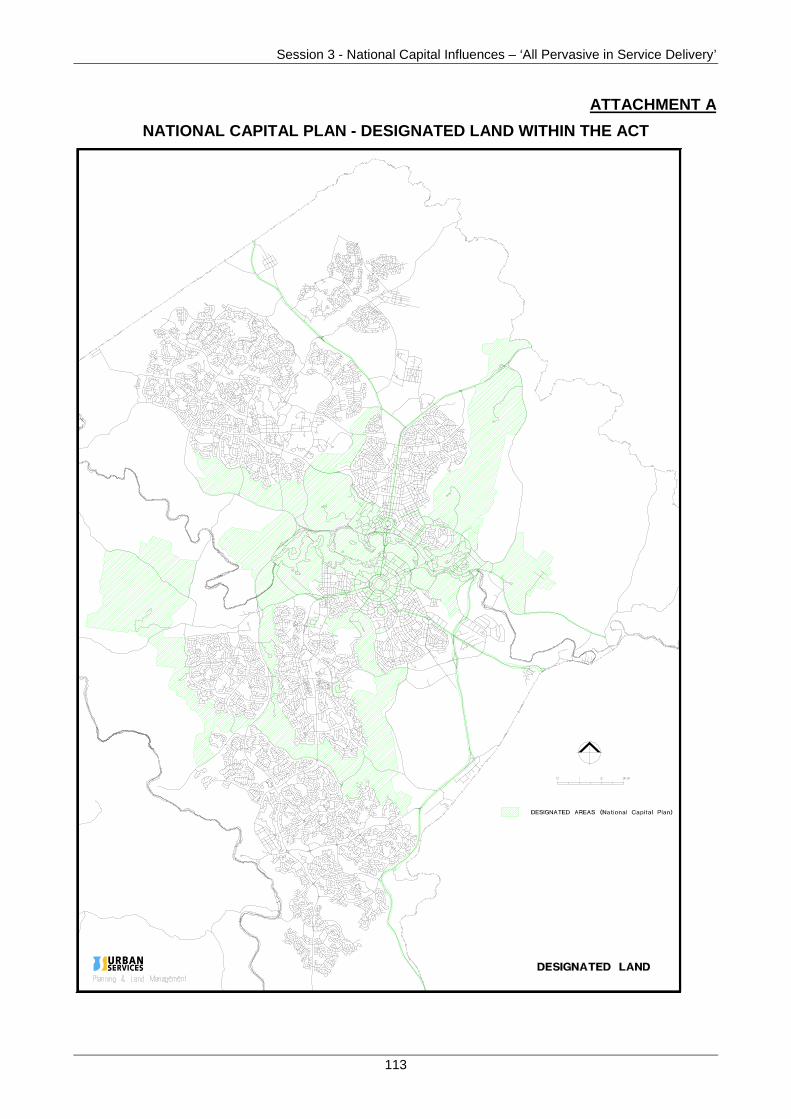
Session 3 - National Capital Influences – ‘All Pervasive in Service Delivery’
113
ATTACHMENT A
NATIONAL CAPITAL PLAN - DESIGNATED LAND WITHIN THE ACT
Session 3 - National Capital Influences – ‘All Pervasive in Service Delivery’
114
(C) ECONOMIC ACTIVITIES - ROADS
Regatta Point - Canberra Business Promotion Centre.
Gordon Davidson, Executive Director of City Management.
Mr Davidson’s responsibilities include the management of Canberra’s roads andstormwater, parks and precincts, ACT Forests, waste management and the delivery of themajority of roads, stormwater and public place capital works projects.
Gordon holds qualifications in engineering. He has extensive experience in infrastructuredevelopment, management and maintenance and has worked in the Shoalhaven ShireCouncil, the National Capital Development Commission and the ACT Government.
Hamish McNulty, Director Roads ACT.
Mr McNulty has an engineering, infrastructure and transport background. He holdsqualifications in Civil Engineering and Business Administration and has extensiveexperience in local government engineering and management in a number of New SouthWales local Councils and the ACT Government.
Session Objectives
National Capital Influences
• To demonstrate that the Commonwealth designed road network has inherentproblems that impose additional costs on the ACT.
• The ACT contends national capital factors should be assessed to reflect the:
− excessive widths of the road system put in place by the Commonwealth; and
− additional costs imposed on the ACT because of the poor quality of the roadsystem built when the Commonwealth administered the Territory.
• The inherent weaknesses in the design and construction of Commonwealthinherited pavements, and resultant problems, will be practically demonstrated tothe Commission via the viewing of the following pavements on the drive toNamadgi National Park (Day two):
− Morshead Drive; and
− Lawrence Wackett Crescent.
• The ACT has engaged Ernst & Young to undertake a consultancy to rigorously andindependently analyse the ACT’s claim for roads National Capital allowances.Further information based on this consultancy is provided in support of this claim.
Presenters
Venue
Session 3 - National Capital Influences – ‘All Pervasive in Service Delivery’
115
Hamish represents the ACT on the AUSTROADS Asset Management Reference Group.Prior to joining the ACT Government he was Group Manager Physical Services withSydney City Council.
Karl Cloos, Manager, Planning, Policy and Coordination, Roads ACT.
Mr Cloos has an engineering and infrastructure background and has qualifications in CivilEngineering in Hydraulics and Hydrology.
Karl has extensive experience in local government engineering through the ACTGovernment and the Commonwealth. Prior to joining the ACT Government, he was withACTEW in the Water Supply and Sewerage Branch. He joined the ACT Government’sStormwater Section and reached the level of Manager Stormwater.
National Capital Influences
• The ACT requested a National Capital allowance of $4.7m per annumcomprising:
− $0.9m for excessively wide roads built by the Commonwealth; and
− $3.8m for the shorter lifespan due to the Commonwealth’s sub-standarddesign and poor supervision of road construction which has resulted in theearlier rehabilitation and maintenance of a significant portion of the roadnetwork.
Arterial Roads - Urbanisation
• The ACT requested the use of updated arterial road length data as the basis ofthe urbanisation calculation which is predicated on roads that have traffic levelsgreater than 40,000 Annual Average Daily Traffic (AADT):
− the latest AADT data illustrates that the ACT has 142.5 lane-kilometres ofroad, rather than 105 lane-kilometres with an AADT in excess of 40,000.
Bridges and Major Culverts Component – Physical Environment
• The ACT requests the removal of the physical environment factor from theassessment of the bridge and major culvert component as:
− the physical environment should already be accounted for in the design andconstruction of bridges; and
− extending the use of the roads physical environment factor to the bridgesassessment is inappropriate.
Scale Affected Expenditure
• The ACT requested that the diseconomies of small scale and input costsdisabilities experienced by the Territory should continue to be assessed.
Key Points from the ACT Main Submission
Session 3 - National Capital Influences – ‘All Pervasive in Service Delivery’
116
3.94. Roads ACT is a unit providing infrastructure services, including the management ofTerritory and municipal roads, national highways, community paths, driveways, stormwaterdrainage, public carpark facilities, traffic and street lighting.
3.95. The expenditure associated with the roads covers the management andmaintenance the three categories of roads, and supporting infrastructure. The roads of theACT are split into several categories:
• the suburban roads or municipal roads that allow traffic to flow throughout a suburb;
• feeder roads that carry traffic to arterial roads; and
• arterials roads that carry traffic between suburbs, districts and town centres.
3.96. The roads provide a means for the people of Canberra to move around and fromacross the boarder to move into and transect the city boundaries.
3.97. Unlike other State Road Authorities, Roads ACT is responsible for both state andmunicipal functions relating to roads and related infrastructure assets. The managementof the roads is complicated by the two tier planning structure in the ACT under whichplanning consent must be sought from either Territory or Commonwealth planningauthorities and at times from both authorities.
3.98. Canberra from its inception was a planned city, a fact that has resulted in a roadnetwork and other infrastructure being different to other State cities.
3.99. The majority of other Australian State capital cities grew along transport routeswhere housing and strip shopping centres grew along these routes in an unstructured way,thus confining space available to place the infrastructure. Canberra’s planning resulted ina lot more space and provision for infrastructure such as roads. The Commonwealthembarked on a planning and infrastructure system, which promoted a feeling of grandeur,reflective of Australia’s national capital. Inherent in this approach was the design andcreation of wide roads.
3.100. The ACT Main Submission requested a National Capital allowance of $0.9m for theexcessively wide roads inherited from the Commonwealth. Based on the Australian RoadsResearch Board consultancy report for the Commission in the 1999 Review, the ACTidentified that Territorial roads are wider, 3.96 metres compared to the implicit Australianaverage of 3.0 metres.
3.101. To calculate the additional cost faced by the ACT for wider than average roads inthe Main Submission, the calculated extra width (0.96m) and data from the 1999 Reviewon Australian road maintenance cost per lane-kilometre ($4,835) and the ACT’s roadlength in lane-kilometres (1,712) was used as per the following formula:
Overview of Service Delivery in the ACT
National Capital Influences – Excessively Wide Roads
Session 3 - National Capital Influences – ‘All Pervasive in Service Delivery’
117
Additional cost faced by the ACT for wider than average roads = (roadmaintenance cost per lane-km/average lane width) * excess width * (roadlength in lane-km/average lane width).
3.102. In the Commission’s Roads Discussion Paper (CGC 2002/34), Commission staffrecognised that the ACT had established that it has wider than average roads, and thatthese were the result of actions beyond the control of the Territory. Further the DiscussionPaper stated:
“An allowance of $0.9m to assist the ACT to maintain roads of more than average widthinherited from the Commonwealth will be proposed.” (CGC 2002/34 p. 20)
3.103. The ACT notes that the Commission has recognised the additional costs facedbecause of the excessively wide roads as a result of the Commonwealth’s actions.However, based on an independent and rigorous analysis conducted by Ernst & Young,who were engaged in a consultancy to exaimine a range of national capital claims for theassessments pertinent to the Deprtment of Urban Servcies, the basis of the calculationused in the Main Submission has been reviewed and it has been revealed that the formuladoes not provide an accurate reflection of the costs the ACT faces.
3.104. Conceptually, the process for calculating the costs faced by the ACT for maintainingthe additional road width can be thought of as four steps:
1 determine the maintenance unit cost, which using the available data provides the costfor maintaining an area 1 kilometre long by 1 m wide (1000 m2). This component of theoriginal formula is:
(road maintenance cost per lane-km/average lane width);
2 insert the previously calculated excess road width. Shown in the original formula as:(excess width);
3 multiply 1 by 2 to derive the additional maintenance cost per 1000 m2; and
4 multiply 3 by the total road length in lane-kms, as the additional cost applies to thelength of all lanes on all roads.
3.105. In the original formula used in the ACT Main Submission, an error was made in thefinal step, where the additional maintenance cost was applied to what was assumed to bethe length of roads in the ACT in kilometres. The original formula expressed this as (roadlength in lane-km/average lane width), however, this part of the formula only holds wherethe number of lanes is equal to the average road width.26
3.106. The corrected formula, based on the steps above for the additional maintenancecosts faced by the ACT for the additional road width is:
Additional cost faced by the ACT for wider than average roads = (roadmaintenance cost per lane-km/average lane width) * excess width * roadlength in lane-kms; or
(4835/3) * 0.96 * 1712 = $2.6m. 26 An illustration of this is a 1 kilometre length of road that has 3 average width lanes is equal to 3 lane kmsand dividing the road length in lane-kms by the average width of 3 m the length of the road is 1 km. Yet, ifthe road has only 2 lanes then the calculation yields 0.67 kms or if the road has 4 lanes then the calculationproduces 1.33 kms.
Session 3 - National Capital Influences – ‘All Pervasive in Service Delivery’
118
3.107. Using the above formula increases the aadditional cost faced by the ACT for widerthan average roads as a result of the Commonwealth’s road program from $0.9m to$2.6m.
3.108. On the basis of the data provided in the context of the Ernst & Youngconsultancy, the ACT requests the Commission to adjust the National Capitalallowance from $0.9m to $2.6m per annum to reflect the correction in the calculationof the additional road width on arterial roads built by the Commonwealth.
3.109. In the ACT’s Main Submission, the Territory requested $3.8m per annum for worksthat are required to upkeep roads that should have been designed for a period of life inaccordance with national road standards. However, the Commonwealth at the time choseto build them to a sub-standard.
3.110. The ACT notes that the Commission has, in part, rejected the ACT’s claim for anational capital factor for sub-standard design as outlined in Discussion Paper 2002/34 -“Staff do not propose to make an allowance for deteriorating roads due to poor design orlack of load controls on heavy vehicles because we are not convinced that the roads in theACT are in demonstrably worse condition than in other States.”
3.111. The ACT also notes that to support its case, the Commission has used theAustroads published data on the roughness of urban arterials in the States using the‘NAASRA Roughness Meter’(NRM) which indicates that 95% of the ACT’s roads have aroughness less than 110 NRM.
3.112. The ACT notes that roughness measures, such as the one outlined by NAASRA, donot in any way indicate the maintenance costs involved with arterial roads. This isbecause roughness measures indicate the appearance of roads in terms of their surface,but do not indicate the extent of their condition below this ‘smooth’ surface. The ACT’sCommonwealth inherited roads exibit a poor condition under the smooth road surface,creating extensive ongoing maintenance costs.
3.113. The Australian public has a perception that roads in the ACT are generally smoothcompared with other parts of Australia. This perception could be further reinforced bydrivers coming from other States to drive on wider roads with smooth cross falls. Asexamples, the RTA, NSW (2001 Annual Report) reported that 89.6% of State Roads ridequality rated ‘good or better’. VicRoads in their recently published “Stitch in Time”document indicated that approximately 11.3% of their network had an undesirableroughness (>110 NRM). This implies that 88.7% of their network is in an acceptablecondition.
3.114. ACT contracted Pavement Management Services Pty Ltd (PMS) to monitor its roadnetwork condition. The most recent report from PMS (Issue Date: 02/07/02) shows that16.9% of our arterial network exceeds the 100 NRM, indicating that the perceivedperception that all Canberra roads are smooth is not true. Therefore, the ACT questionsnot only the relationship being drawn by the Commission between smoothness and
National Capital Influences – Sub-standard quality of construction
Session 3 - National Capital Influences – ‘All Pervasive in Service Delivery’
119
maintenance costs, but the validity of the Austroads (1999), DoTaRS unpublished data asstated in Road Facts 2000.
3.115. Research conducted by the ACT shows that most of the roads constructed by theCommonwealth have lasted only half of their expected design life (most have requiredmaintenance and rehabilitation after 10-12 years, rather than after 20-25 years – thegenerally accepted standard).
3.116. Unfortunately poor design and supervision, lack of subsoil drain installation anddelay by the Commonwealth to control heavy vehicles in the ACT has contributed to mostof the maintenance burden. Any single major rehabilitation project can easily consume 10-20% of the ACT’s total maintenance budget.
3.117. The original calculations for the $3.8m claim was based on summing past andexpected additional rehabilitation expenditure on selected Commonwealth roads, andannualising the expenditure over the number of years that these roads have requiredabove normal maintenance to reach their design life, that is, $26.7m divided by7 years = $3.8m per annum).
3.118. The ACT contracted Ernst & Young to more vigourously analyse the actual costsfacing the ACT. In this context, the Territory has reassessed these figures and hasconstructed a model which is premised on the difference between the annual maintenancecost per lane–km borne by the ACT and the agreed average maintenance cost per lanekm as per the Grants Commission’s 1999 Review methodology.
3.119. The following table summarises the analysis undertaken of Commonwealth builtroads in terms of the above average costs of maintenance and repair faced by the ACT.The table generally incorporates the larger, more heavily used roads as a proxy for thecosts facing the ACT. That is, it underestimates the costs given that not all roads areincluded in the analysis. The ACT does not intend to claim a greater amount than listed asit is adopting a conservative approach to these costs.
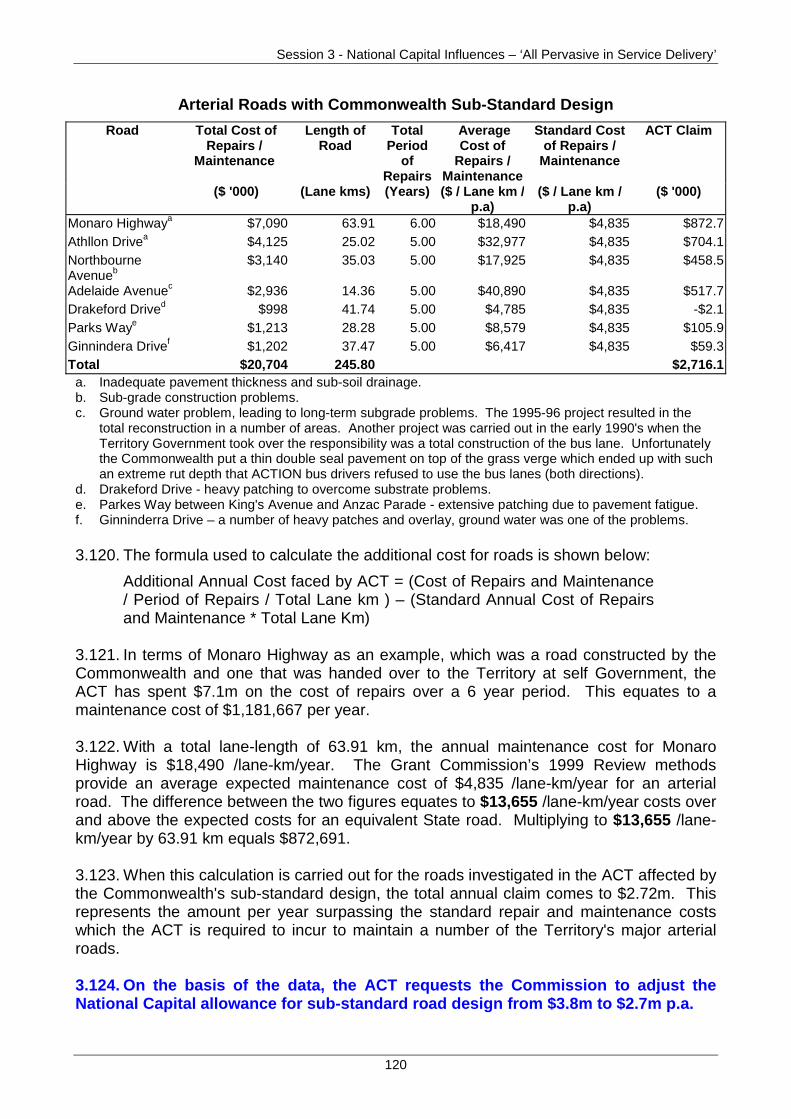
Session 3 - National Capital Influences – ‘All Pervasive in Service Delivery’
120
Arterial Roads with Commonwealth Sub-Standard Design
Road Total Cost ofRepairs /
Maintenance
Length ofRoad
TotalPeriod
ofRepairs
AverageCost of
Repairs /Maintenance
Standard Costof Repairs /
Maintenance
ACT Claim
($ '000) (Lane kms) (Years) ($ / Lane km /p.a)
($ / Lane km /p.a)
($ '000)
Monaro Highwaya $7,090 63.91 6.00 $18,490 $4,835 $872.7Athllon Drivea $4,125 25.02 5.00 $32,977 $4,835 $704.1NorthbourneAvenueb
$3,140 35.03 5.00 $17,925 $4,835 $458.5
Adelaide Avenuec $2,936 14.36 5.00 $40,890 $4,835 $517.7Drakeford Drived $998 41.74 5.00 $4,785 $4,835 -$2.1Parks Waye $1,213 28.28 5.00 $8,579 $4,835 $105.9Ginnindera Drivef $1,202 37.47 5.00 $6,417 $4,835 $59.3Total $20,704 245.80 $2,716.1
a. Inadequate pavement thickness and sub-soil drainage.b. Sub-grade construction problems.c. Ground water problem, leading to long-term subgrade problems. The 1995-96 project resulted in the
total reconstruction in a number of areas. Another project was carried out in the early 1990's when theTerritory Government took over the responsibility was a total construction of the bus lane. Unfortunatelythe Commonwealth put a thin double seal pavement on top of the grass verge which ended up with suchan extreme rut depth that ACTION bus drivers refused to use the bus lanes (both directions).
d. Drakeford Drive - heavy patching to overcome substrate problems.e. Parkes Way between King's Avenue and Anzac Parade - extensive patching due to pavement fatigue.f. Ginninderra Drive – a number of heavy patches and overlay, ground water was one of the problems.
3.120. The formula used to calculate the additional cost for roads is shown below:
Additional Annual Cost faced by ACT = (Cost of Repairs and Maintenance/ Period of Repairs / Total Lane km ) – (Standard Annual Cost of Repairsand Maintenance * Total Lane Km)
3.121. In terms of Monaro Highway as an example, which was a road constructed by theCommonwealth and one that was handed over to the Territory at self Government, theACT has spent $7.1m on the cost of repairs over a 6 year period. This equates to amaintenance cost of $1,181,667 per year.
3.122. With a total lane-length of 63.91 km, the annual maintenance cost for MonaroHighway is $18,490 /lane-km/year. The Grant Commission’s 1999 Review methodsprovide an average expected maintenance cost of $4,835 /lane-km/year for an arterialroad. The difference between the two figures equates to $13,655 /lane-km/year costs overand above the expected costs for an equivalent State road. Multiplying to $13,655 /lane-km/year by 63.91 km equals $872,691.
3.123. When this calculation is carried out for the roads investigated in the ACT affected bythe Commonwealth's sub-standard design, the total annual claim comes to $2.72m. Thisrepresents the amount per year surpassing the standard repair and maintenance costswhich the ACT is required to incur to maintain a number of the Territory's major arterialroads.
3.124. On the basis of the data, the ACT requests the Commission to adjust theNational Capital allowance for sub-standard road design from $3.8m to $2.7m p.a.
Session 4 – Welfare Services – ‘Poverty in the ACT’ & Housing – ‘Accommodation Constraints’
121
DAY ONE
WEDNESDAY, 13 NOVEMBER 2002
SESSION 4. – WELFARE SERVICES ‘THERE IS POVERTY INTHE ACT’ AND HOUSING – ‘THE TERRITORY'S
ACCOMMODATION CONSTRAINTS’:
• Homelessness & General Welfare and Housing.
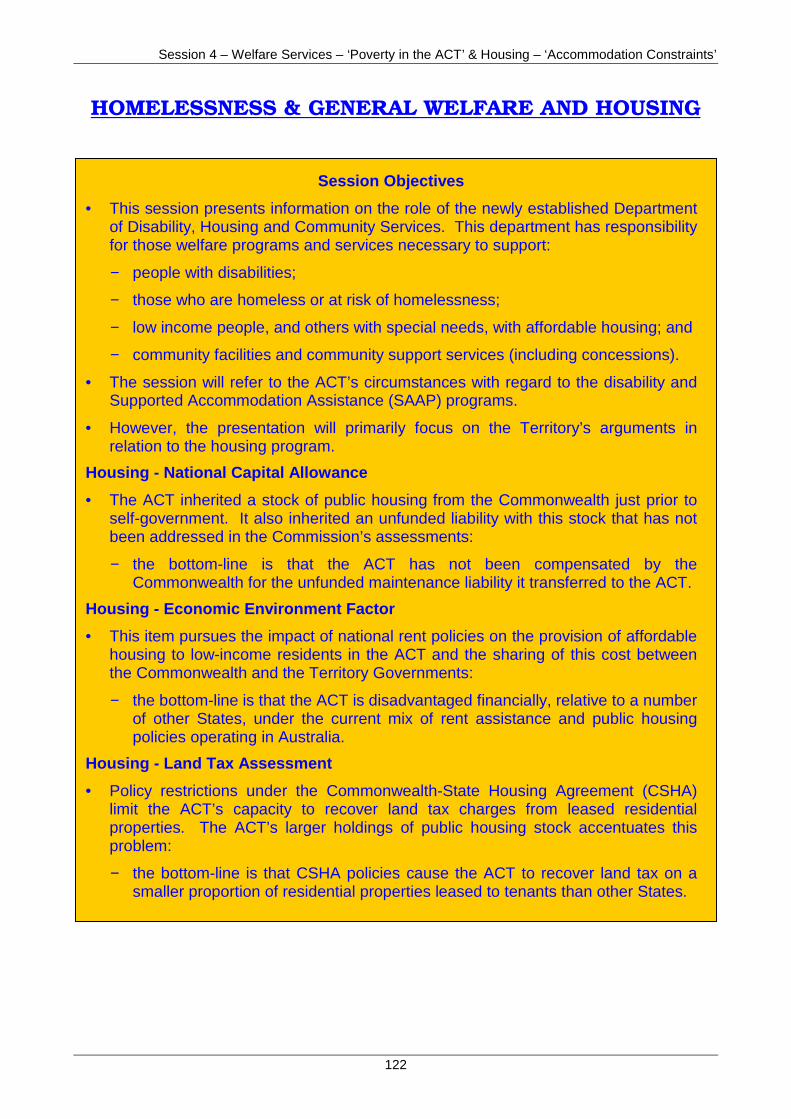
Session 4 – Welfare Services – ‘Poverty in the ACT’ & Housing – ‘Accommodation Constraints’
122
HOMELESSNESS & GENERAL WELFARE AND HOUSING
Session Objectives
• This session presents information on the role of the newly established Departmentof Disability, Housing and Community Services. This department has responsibilityfor those welfare programs and services necessary to support:
− people with disabilities;
− those who are homeless or at risk of homelessness;
− low income people, and others with special needs, with affordable housing; and
− community facilities and community support services (including concessions).
• The session will refer to the ACT’s circumstances with regard to the disability andSupported Accommodation Assistance (SAAP) programs.
• However, the presentation will primarily focus on the Territory’s arguments inrelation to the housing program.
Housing - National Capital Allowance
• The ACT inherited a stock of public housing from the Commonwealth just prior toself-government. It also inherited an unfunded liability with this stock that has notbeen addressed in the Commission’s assessments:
− the bottom-line is that the ACT has not been compensated by theCommonwealth for the unfunded maintenance liability it transferred to the ACT.
Housing - Economic Environment Factor
• This item pursues the impact of national rent policies on the provision of affordablehousing to low-income residents in the ACT and the sharing of this cost betweenthe Commonwealth and the Territory Governments:
− the bottom-line is that the ACT is disadvantaged financially, relative to a numberof other States, under the current mix of rent assistance and public housingpolicies operating in Australia.
Housing - Land Tax Assessment
• Policy restrictions under the Commonwealth-State Housing Agreement (CSHA)limit the ACT’s capacity to recover land tax charges from leased residentialproperties. The ACT’s larger holdings of public housing stock accentuates thisproblem:
− the bottom-line is that CSHA policies cause the ACT to recover land tax on asmaller proportion of residential properties leased to tenants than other States.

Session 4 – Welfare Services – ‘Poverty in the ACT’ & Housing – ‘Accommodation Constraints’
123
Regatta Point - Canberra Business Promotion Centre.
Mr John Wynants, Senior Manager, Strategic Projects with the Department of Disability,Housing and Community Services.
Mr Wynants has worked in a number of senior executive and senior officer roles acrossthe ACT Public Service, including whole-of-government strategic, economic and socialpolicy roles and has worked in housing service delivery and administration.
Ms Sandra Lambert, Chief Executive, Department of Disability, Housing and CommunityServices.
Ms Lambert is the inaugural Chief Executive of the new department. Previously,Ms Lambert held the position of Deputy Chief Executive in the Chief Minister’sDepartment, which included Territory-wide policy oversight, and was an Executive Directorin the (then) Department of Education and Community Services.
Ms Lambert will introduce this session and provide the overview of the department’sestablishment and its programs and services.
Ms Bronwen Overton-Clarke, Director Organisational Services and Strategic Policy,Department of Disability, Housing and Community Services.
Ms Overton-Clarke has department-wide responsibility for strategic policy matters,including the integration of key social policy outcomes in the ACT. Prior to transferring tothe new department, Ms Overton-Clarke held senior executive positions in the policy andcorporate areas of the Chief Minister’s Department. Ms Overton-Clarke will briefly touchon the issues related to the disability and SAAP programs.
Ms Chris Purdon, Chair of the ACT’s Affordable Housing Taskforce.
Ms Purdon is a private practitioner and a Director of the specialist consulting firm, PurdonAssociates Pty Ltd. Ms Purdon has held a number of appointments under successivegovernments, including as Chair of the ACT Housing Minister’s Advisory Committee since1995.
Ms Purdon will speak on the findings and conclusions arising from the work of herCommittee, in particular the difficulties for low-income people to secure adequateaffordable housing in the ACT. The work of Ms Purdon’s Committee follows the findingsand conclusions of the ACT Poverty Task Group.
Presenters
Venue
Session 4 – Welfare Services – ‘Poverty in the ACT’ & Housing – ‘Accommodation Constraints’
124
Mr Bob Hutchison, Executive Director, ACT Housing.
Mr Hutchison has overall responsibility for strategic management of the ACT’s publichousing assets, tenancy services and housing policy matters. Prior to being appointed asthe head of ACT Housing in 2000, Mr Hutchison was a senior executive with the NSWDepartment of Housing with responsibility for a regional area.
Mr Hutchison will discuss the ACT’s public housing stock, outlining the efforts taken to re-profile the portfolio and the burden of addressing the backlog of work to bring stock up toacceptable standards.
Mr Bruce McKenzie, Chief Executive Officer, Community Housing Canberra (CHC).
Mr McKenzie is the CEO of the ACT’s largest provider of community-based housing. Priorto his appointment as CEO to CHC, Mr McKenzie was a senior officer with both the ACTand Commonwealth Public Services working in housing and business-related areas.
CHC was established to provide an alternative form of social housing in the ACT and hasleased rental properties from the ACT Government and undertaken private developmentprojects to supply housing for low-income or special needs tenants. Mr McKenzie will offera different perspective to the difficulties in securing and allocating affordable housingsolutions to people with a housing need.
Other Departmental Representatives
Ms Sue Birtles, Executive Director, Children’s Youth and Family Services, Department ofEducation, Youth and Family Services.
Ms Birtles has held ACT senior executive positions in program, service delivery andcorporate service areas across the welfare, housing and urban services portfolios. MsBirtles will be available for general discussions with the Commission.
Ms Chris Healy, Executive Director, Disability ACT.
Ms Healy has held ACT senior executive positions in program and service delivery areasacross the disability and family services portfolios. Ms Healy will be available for generaldiscussions with the Commission.
Ms Sarah King, Assistant Manager, Community Services.
Ms King has held senior officer positions across the community and youth servicessectors. Ms King will be available for general discussions with the Commission.
Ms Kathy Goth, Manager Policy, Legislation and Projects, ACT Revenue Office.
Ms Goth has held senior officer positions in the policy and strategy areas of theACT Revenue Office and has worked in key Commonwealth agencies, including ABS,CGC, DAS and AGS. Ms Goth will be available for general discussions with theCommission.
Session 4 – Welfare Services – ‘Poverty in the ACT’ & Housing – ‘Accommodation Constraints’
125
Key Points from the ACT Main Submission
SAAP
• The ACT has well above average demand and cost for SAAP services. The ACTis proposing that the Commission use a modified method of assessment for SAAPservices that reflects actual numbers of SAAP clients and the actual costs ofservicing SAAP clients.
Housing
• The ACT considers that a new approach to assessing housing services should beadopted. This would place the primary focus on the affordability of rental housingto tenants and the cost of providing housing assistance. This acknowledges thecurrent emphasis of national housing assistance policies and includes the impactof the Commonwealth’s Rent Assistance program as well as the impact of rentrebates for public housing tenants.
• The ACT is seeking a one-off payment of $65m (annualised at $13m over theperiod 2004 to 2009) to compensate for the unfunded liability attached to theportfolio of rental properties inherited from the Commonwealth. The ACT notesthat transitional funding was not allocated for housing at the time of ACT self-government.
• Account needs to be taken of the ACT’s reduced capacity to generate revenuefrom land tax on leased residential properties. This is the direct result of CSHApolicies that prevent the imposition of land tax charges on State HousingAuthorities.
Additional Arguments
• The ACT seeks the incorporation of a disability for the higher costs of housingservices for youth and an adjustment to the assessment to account for the directcost on the ACT in providing aboriginal housing.
• The ACT supports the continued assessment of disabilities for buildingmaintenance costs, input costs and diseconomies of small scale for housingservices.
• The ACT supports the continued assessment of cross border impacts on thedelivery of disabled and SAAP services.
• The ACT supports the continued assessment of diseconomies of small scale andinput costs in the family and child services and disabled services categories.

Session 4 – Welfare Services – ‘Poverty in the ACT’ & Housing – ‘Accommodation Constraints’
126
4.1. Session 4 touches on the welfare services relevant to the Department of Disability,Housing and Community Services – mainly the delivery of disability services and theprovision of SAAP services (Chapters 17 to 19).
4.2. The session, however, primarily focuses on the assessment of the housing servicescategory (Chapter 20 of the ACT Submission) and land tax revenues related to publichousing (Chapter 38).
Disabled Services (Chapter 18)
4.3. The ACT, together with the States and Territories27, is a party to theCommonwealth-State Disability Agreement (CSDA). This is a multi-lateral agreement withCommonwealth funds matched by the ACT (ratio 18:82, Cwlth:ACT)28. In fact, the ACTover-matches its required funding level in order to meet the demand for, and cost of,disability services.
4.4. Further, the ACT is disadvantaged by approximately $1.427m under the formulaapplied by the Commonwealth for the distribution of funds. The Commonwealth uses anhistorical arrangement from the first CSDA to allocate funds, however this is significantlyunder the ACT’s per capita proportion of people with disabilities.
4.5. Disability services are provided in the form of accommodation support, communitysupport, community access, respite care, advocacy, information and peak services,including individual funding packages. Residential care is largely delivered in group homesettings and, depending on the degree of disability (physical and/or intellectual), in thehome of the consumer. The ACT also allocates funds to organisations providingassistance to people with disabilities other than a severe physical or intellectual disability.
4.6. General support within the community is also provided to people with disabilitiesthrough the ACT’s education system, children’s therapy services, the public transportsystem and planning and building rules and regulations.
4.7. Disability services are provided by the ACT Government agency – ACT DisabilityProgram – and by community-based and charitable service providers. In a single daysnapshot survey of service users, the ACT recorded contact with 707 individuals29.
4.8. An ABS survey conducted in 1998 determined that the ACT had a total populationwho would be eligible for disability services numbered around 16,30030. The total figuresprovided with assistance in the ACT for a full year would be much greater, but are notpossible to obtain under current data collection procedures. The care needs of theseindividuals range from minimal supervision to intensive one-on-one support.
27 From herein, the States and Territories are referred to by the word ‘States’ unless otherwise specified.28 Commonwealth-State Disability Agreement 1997-2002, Schedule A.29 Productivity Commission, 2002, Report on Government Services 2002.30 ABS, 1999, Disability, Ageing and Carers Australia: Summary of findings 1998.
Overview of Service Delivery in the ACT
Session 4 – Welfare Services – ‘Poverty in the ACT’ & Housing – ‘Accommodation Constraints’
127
4.9. People receiving services in the ACT range in age from birth to 90 years with anincreasing number in the older age groups. For example, in 1996, the peak age wasaround 32 years while, in 2001, this peak age had increased to approximately 38 years.Included in the support arrangements are programs to assist people with disabilities toparticipate in community activities and remain in the accommodation of their choice.
4.10. As a regional centre, the ACT attracts a high number of people from local townsand shires in NSW requiring long-term accommodation, care and support. The ACT doesnot receive full compensation for the costs of providing services to this group from NSW.
4.11. The ACT has negotiated accommodation and care arrangements with NSW for anumber of people requiring specialist support or needing to be close to family. The“purchasing” State/Territory provides the funding necessary for these arrangements.However, such arrangements are not significant in number and are considerably less thanthe number of people from outside the ACT now in care in the ACT.
4.12. The provision of services in the ACT to people with a disability is currentlyundergoing major policy and program reform following a long-running Inquiry by a formerSupreme Court judge and the Government’s response to the recommendations of thatInquiry. Principal in this reform will be a policy shift to a person-centred approach ofsupport and integrated community living, consistent with national and international bestpractice.
Supported Accommodation Assistance Program Services (Chapter 19)
4.13. Similar to the CSDA, the ACT is a party to the SAAP Agreement. This also is amulti-lateral agreement to address the needs of homeless people and those at risk ofhomelessness. Commonwealth funds are matched by the ACT (ratio close to 50:50).
4.14. In the ACT, there were 2,750 support periods provided in the 2000-01 year topeople who are homeless. This is provided solely by 33 community-based and charitableorganisations located across the Territory. In addition to this supply response, ACT SAAPservice providers had to turn away the following requests for accommodation and supportduring that year31:
• 24,900 requests for support of which 10% were unmet;
• 15% for a further 1,890 requests for services for children were unmet; and
• 550 clients in a SAAP service had 1,050 occasions of unmet need for personalsupport.
4.15. Similar to the use of disability services by people from the surrounding NSW region,the ACT is an attractor of people seeking SAAP services. These services are sought bypeople unable to find or secure low cost accommodation in the ACT.
4.16. While SAAP services are intended to be short-term, the ACT’s experience is thatservice recipients are remaining longer. The average stay in the ACT is 62 dayscompared to the Australian average of 40 days. The key factor is the difficulty people 31 Needs Analysis of Homelessness in the ACT – 2000-01.
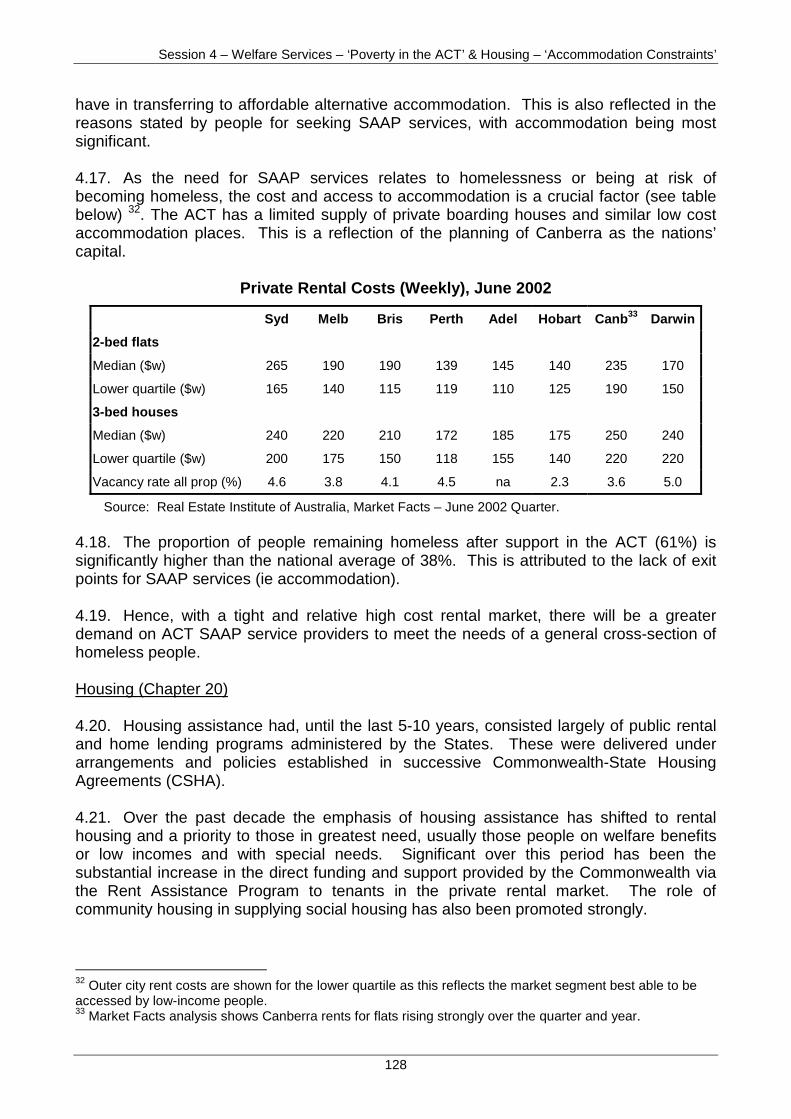
Session 4 – Welfare Services – ‘Poverty in the ACT’ & Housing – ‘Accommodation Constraints’
128
have in transferring to affordable alternative accommodation. This is also reflected in thereasons stated by people for seeking SAAP services, with accommodation being mostsignificant.
4.17. As the need for SAAP services relates to homelessness or being at risk ofbecoming homeless, the cost and access to accommodation is a crucial factor (see tablebelow) 32. The ACT has a limited supply of private boarding houses and similar low costaccommodation places. This is a reflection of the planning of Canberra as the nations’capital.
Private Rental Costs (Weekly), June 2002
Syd Melb Bris Perth Adel Hobart Canb33 Darwin
2-bed flats
Median ($w) 265 190 190 139 145 140 235 170
Lower quartile ($w) 165 140 115 119 110 125 190 150
3-bed houses
Median ($w) 240 220 210 172 185 175 250 240
Lower quartile ($w) 200 175 150 118 155 140 220 220
Vacancy rate all prop (%) 4.6 3.8 4.1 4.5 na 2.3 3.6 5.0
Source: Real Estate Institute of Australia, Market Facts – June 2002 Quarter.
4.18. The proportion of people remaining homeless after support in the ACT (61%) issignificantly higher than the national average of 38%. This is attributed to the lack of exitpoints for SAAP services (ie accommodation).
4.19. Hence, with a tight and relative high cost rental market, there will be a greaterdemand on ACT SAAP service providers to meet the needs of a general cross-section ofhomeless people.
Housing (Chapter 20)
4.20. Housing assistance had, until the last 5-10 years, consisted largely of public rentaland home lending programs administered by the States. These were delivered underarrangements and policies established in successive Commonwealth-State HousingAgreements (CSHA).
4.21. Over the past decade the emphasis of housing assistance has shifted to rentalhousing and a priority to those in greatest need, usually those people on welfare benefitsor low incomes and with special needs. Significant over this period has been thesubstantial increase in the direct funding and support provided by the Commonwealth viathe Rent Assistance Program to tenants in the private rental market. The role ofcommunity housing in supplying social housing has also been promoted strongly.
32 Outer city rent costs are shown for the lower quartile as this reflects the market segment best able to beaccessed by low-income people.33 Market Facts analysis shows Canberra rents for flats rising strongly over the quarter and year.
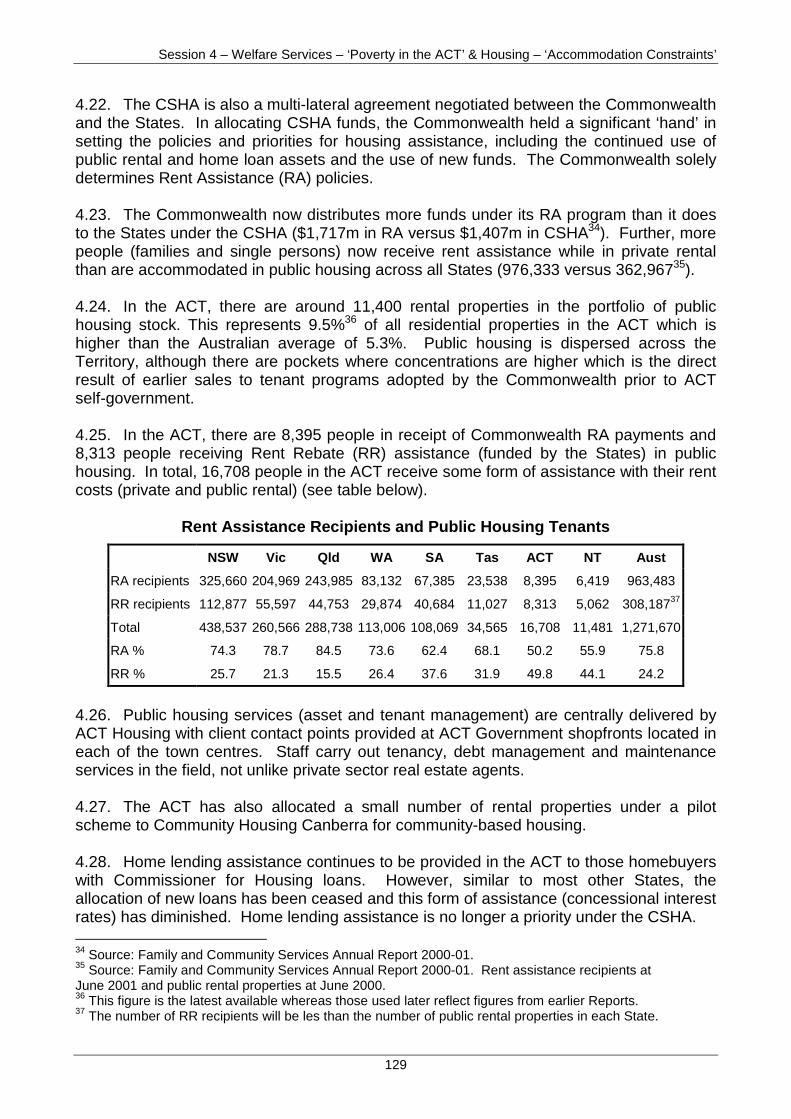
Session 4 – Welfare Services – ‘Poverty in the ACT’ & Housing – ‘Accommodation Constraints’
129
4.22. The CSHA is also a multi-lateral agreement negotiated between the Commonwealthand the States. In allocating CSHA funds, the Commonwealth held a significant ‘hand’ insetting the policies and priorities for housing assistance, including the continued use ofpublic rental and home loan assets and the use of new funds. The Commonwealth solelydetermines Rent Assistance (RA) policies.
4.23. The Commonwealth now distributes more funds under its RA program than it doesto the States under the CSHA ($1,717m in RA versus $1,407m in CSHA34). Further, morepeople (families and single persons) now receive rent assistance while in private rentalthan are accommodated in public housing across all States (976,333 versus 362,96735).
4.24. In the ACT, there are around 11,400 rental properties in the portfolio of publichousing stock. This represents 9.5%36 of all residential properties in the ACT which ishigher than the Australian average of 5.3%. Public housing is dispersed across theTerritory, although there are pockets where concentrations are higher which is the directresult of earlier sales to tenant programs adopted by the Commonwealth prior to ACTself-government.
4.25. In the ACT, there are 8,395 people in receipt of Commonwealth RA payments and8,313 people receiving Rent Rebate (RR) assistance (funded by the States) in publichousing. In total, 16,708 people in the ACT receive some form of assistance with their rentcosts (private and public rental) (see table below).
Rent Assistance Recipients and Public Housing Tenants
NSW Vic Qld WA SA Tas ACT NT Aust
RA recipients 325,660 204,969 243,985 83,132 67,385 23,538 8,395 6,419 963,483
RR recipients 112,877 55,597 44,753 29,874 40,684 11,027 8,313 5,062 308,18737
Total 438,537 260,566 288,738 113,006 108,069 34,565 16,708 11,481 1,271,670
RA % 74.3 78.7 84.5 73.6 62.4 68.1 50.2 55.9 75.8
RR % 25.7 21.3 15.5 26.4 37.6 31.9 49.8 44.1 24.2
4.26. Public housing services (asset and tenant management) are centrally delivered byACT Housing with client contact points provided at ACT Government shopfronts located ineach of the town centres. Staff carry out tenancy, debt management and maintenanceservices in the field, not unlike private sector real estate agents.
4.27. The ACT has also allocated a small number of rental properties under a pilotscheme to Community Housing Canberra for community-based housing.
4.28. Home lending assistance continues to be provided in the ACT to those homebuyerswith Commissioner for Housing loans. However, similar to most other States, theallocation of new loans has been ceased and this form of assistance (concessional interestrates) has diminished. Home lending assistance is no longer a priority under the CSHA. 34 Source: Family and Community Services Annual Report 2000-01.35 Source: Family and Community Services Annual Report 2000-01. Rent assistance recipients atJune 2001 and public rental properties at June 2000.36 This figure is the latest available whereas those used later reflect figures from earlier Reports.37 The number of RR recipients will be les than the number of public rental properties in each State.
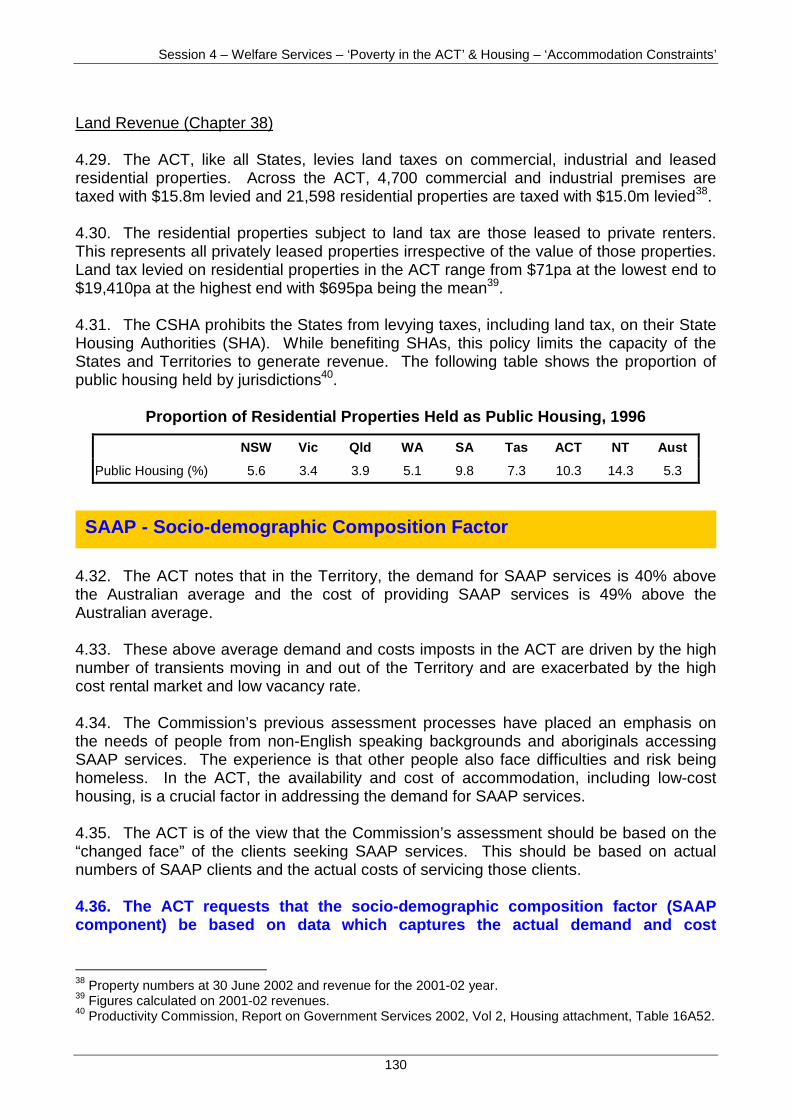
Session 4 – Welfare Services – ‘Poverty in the ACT’ & Housing – ‘Accommodation Constraints’
130
Land Revenue (Chapter 38)
4.29. The ACT, like all States, levies land taxes on commercial, industrial and leasedresidential properties. Across the ACT, 4,700 commercial and industrial premises aretaxed with $15.8m levied and 21,598 residential properties are taxed with $15.0m levied38.
4.30. The residential properties subject to land tax are those leased to private renters.This represents all privately leased properties irrespective of the value of those properties.Land tax levied on residential properties in the ACT range from $71pa at the lowest end to$19,410pa at the highest end with $695pa being the mean39.
4.31. The CSHA prohibits the States from levying taxes, including land tax, on their StateHousing Authorities (SHA). While benefiting SHAs, this policy limits the capacity of theStates and Territories to generate revenue. The following table shows the proportion ofpublic housing held by jurisdictions40.
Proportion of Residential Properties Held as Public Housing, 1996
NSW Vic Qld WA SA Tas ACT NT Aust
Public Housing (%) 5.6 3.4 3.9 5.1 9.8 7.3 10.3 14.3 5.3
4.32. The ACT notes that in the Territory, the demand for SAAP services is 40% abovethe Australian average and the cost of providing SAAP services is 49% above theAustralian average.
4.33. These above average demand and costs imposts in the ACT are driven by the highnumber of transients moving in and out of the Territory and are exacerbated by the highcost rental market and low vacancy rate.
4.34. The Commission’s previous assessment processes have placed an emphasis onthe needs of people from non-English speaking backgrounds and aboriginals accessingSAAP services. The experience is that other people also face difficulties and risk beinghomeless. In the ACT, the availability and cost of accommodation, including low-costhousing, is a crucial factor in addressing the demand for SAAP services.
4.35. The ACT is of the view that the Commission’s assessment should be based on the“changed face” of the clients seeking SAAP services. This should be based on actualnumbers of SAAP clients and the actual costs of servicing those clients.
4.36. The ACT requests that the socio-demographic composition factor (SAAPcomponent) be based on data which captures the actual demand and cost
38 Property numbers at 30 June 2002 and revenue for the 2001-02 year.39 Figures calculated on 2001-02 revenues.40 Productivity Commission, Report on Government Services 2002, Vol 2, Housing attachment, Table 16A52.
SAAP - Socio-demographic Composition Factor
Session 4 – Welfare Services – ‘Poverty in the ACT’ & Housing – ‘Accommodation Constraints’
131
disabilities associated with the provision of SAAP services as the current approachdoes not capture these imposts accurately.
4.37. To remove possible policy influences with this actual data, a factor could bebased on half of the observed difference between:
• States’ actual numbers of SAAP clients and the Australian average level; and
• States’ actual costs of servicing SAAP clients and the Australian average level.
4.38. The cross border impacts on ACT services will have been addressed in detail inSession 2 of the Territory’s Workplace Discussions
4.39. The ACT wishes to also highlight that there is a significant demand for, and cost of,ACT SAAP and disability services by people from surrounding towns and shires in NSW.
4.40. The ACT inherited a portfolio of public housing rental stock from theCommonwealth. This comprised the stock of houses, townhouses, flats and units used bythe Commonwealth for public housing purposes in Canberra and a debt profile attached tothat stock. This transfer occurred prior to ACT self-government on 1 July 1987.
4.41. The stock transferred was the residual of past construction programs to supply,firstly, Commonwealth employee housing and, later, welfare housing in the ACT andsuccessive sales-to-tenant programs. Units in the major flat complexes were not sold asthese were not separately titled. Those properties remaining after the tenant sales were inthe main the high maintenance properties in the less desirable locations.
4.42. At 11 May 1989, the public housing stock was managed in a Trust Account. Thisincluded the debt obligations (capital and interest payments), the rent receipts and theexpenses of managing the portfolio. Cash management rather than full accrual accountingprinciples were applied at that time, although modified accrual-based financial statementswere prepared. This arrangement was established by the Commonwealth and legislated inthe (then) Housing Assistance Ordinance 1987.
4.43. A key factor in the accounting arrangements was the treatment (or, more correctly,lack of treatment) for the future maintenance requirements on rental properties. TheCommonwealth had previously collected the ‘return of capital’ through depreciationcharges. However, these funds had never been set aside in a ‘sinking fund’ to allow theirre-investment in the maintenance or replacement of run-down stock.
4.44. The ACT carried the burden of this unfunded liability after self-government.However, the ACT was not provided any transitional funds at the time of self-governmentor in subsequent years to compensate for, or address, the unfunded liability.
National Capital Influences – Housing
Welfare - Cross Border Factor
Session 4 – Welfare Services – ‘Poverty in the ACT’ & Housing – ‘Accommodation Constraints’
132
4.45. In addition to having to address the unfunded liability, the nature of public housingpolicies under the CSHA – whereby rent collected from tenants was less than the cost ofmanaging and maintaining the houses – meant that the ACT had a limited capacity toaddress ongoing repairs and maintenance work let alone address the backlog of work.
4.46. Notwithstanding the difficulties in addressing the housing asset maintenance andreplacement responsibilities, the ACT has taken steps to reprofile its public housing stock.This has involved:
• the sale of aged and high maintenance houses;
• the demolition and/or sale of bed-sit accommodation where social problems hadexisted; and
• the re-development and refurbishment of unit complexes to match the needs of currenttenants.
4.47. While there are no figures on the extent of unfunded liability at ACT self-government, the ACT has undertaken some studies to identify the backlog of maintenanceon its housing stock. This includes a study undertaken by consultants, KPMG in 1995 anda more recent survey conducted by ACT Housing’s strategic asset maintenancemanagers.
4.48. The ACT believes that a ‘one off’ payment to compensate for the unfundedliability inherited at the time of ACT self-government is justified. The ACT notes thatno transitional funds were provided to the ACT to assist with the costs.
4.49. The previous studies into the backlog of maintenance provide a reasonableproxy to calculating a payment. This has been assessed at a total $65m annualisedat $13m in each of the 5 years from 2004 to 2009.
4.50. The assessment of the housing category has in previous Commission reviewsfocussed on the operation of the State public housing systems with a major factor beingthe number of welfare recipients in each jurisdiction.
4.51. This approach was consistent with an arrangement whereby the States deliveredhousing assistance, although the extent to which States provided assistance did differ.
4.52. However, this approach no longer reflects the full cost of providing housingassistance in each State, nor does it reflect the distribution of those costs between theCommonwealth and each State.
4.53. There has been a shift over the past decade in how housing assistance is beingdelivered across Australia. The Commonwealth has injected considerable funds into theprovision of direct rent assistance to welfare beneficiaries and lower income people livingin private rental accommodation. Through the CSHA, State Housing Authorities (SHAs)
Economic Environment Factor – Housing
Session 4 – Welfare Services – ‘Poverty in the ACT’ & Housing – ‘Accommodation Constraints’
133
are delivering similar rent policies in requiring public tenants to contribute 25% of theirincomes towards their weekly rent cost.
4.54. It is noticeable that in those States where holdings of public housing are lower, thenumber of people requiring rent assistance from the Commonwealth is higher (see tablesabove). As CSHA funds are distributed on a per capita basis, this results in an unequaldistribution of the total Commonwealth funding for housing assistance across Australia(ie CSHA plus RA).
4.55. Despite the fact that the Commonwealth (private tenants) and the ACT (publictenants) are provided rental assistance, the form this takes and the level of assistancediffers when applied in the ACT (this occurs in all States).
4.56. The costs of rent assistance are higher for the States than the Commonwealth foreach person assisted. This reflects the different policies, whereby:
• Commonwealth rent assistance is a ‘cash’ payment to a maximum amount when theweekly rent cost is above 30% of the tenant’s income – hence tenants pay the balancewhich, in the high rent cost markets, will be higher (see Attachment A for rates);
• public housing tenants ‘contribute’ 25% of their income with the balance of the rentrebated – hence the States (via the SHAs) forego rent receipts which, in the high rentcost markets, will be higher; and
• in high rent cost markets, more people need assistance because rent becomes agreater proportion of a person’s income - this includes wage earners as well as welfarebeneficiaries [Rent costs should reflect the lower quartile rather than the average rentcosts as this is the market segment that low income people can access].
4.57. The Commission has used the number of welfare recipients in each State as aproxy to determine the need for housing assistance. Included in this number are peoplewho are home owners and home buyers who do not need assistance with theiraccommodation costs.
4.58. It is time that the assessment of housing services reflects contemporarynational housing assistance policies and funding. This is a new approach but onethat better reflects the cost burden carried by each State – both by Governmentsand communities.
4.59. In the ACT’s view, the assessment should:
• calculate the total cost of rent rebates provided to public tenants(acknowledging that CSHA policies are applied consistently);
• use the Australian average holdings of public housing (ie 5.3%) as the ‘standard’and calculate the rent rebate cost above/below this level as the disabilityexperienced by each State; and
• include an adjustment to the ‘standard’ to reflect the market cost of rent (lowerquartile) as a ‘hardship factor’ on tenants accessing rental accommodation.
Session 4 – Welfare Services – ‘Poverty in the ACT’ & Housing – ‘Accommodation Constraints’
134
4.60. This new approach will require the acceptance that changes to the currentassessment principles will occur:
• acknowledging that the efficient operation of rental housing portfolios are theresponsibility of SHAs;
• accepting that a wider group of people than welfare recipients requireassistance with their accommodation costs, especially in the high rent costmarkets;
• noting that those welfare beneficiaries (Centrelink and Veterans Affairs) who arehome owners do not require assistance with their accommodation costs; and
• noting that an assessment process that uses rent rebates as the primary costfactor will provide an incentive for States to better target public housingallocations to those people in most need.
4.61. The ACT has a growing aboriginal population. This reflects the fact that Canberrais a regional centre for employment, education and services.
4.62. As the Commission is aware from its Indigenous Funding Inquiry, the ACT does notreceive any funding under the Aboriginal Rental Housing Program and those fundsallocated under ATSIC’s Community Housing and Infrastructure Program are targeted toregional locations outside the ACT.
4.63. The ACT proposes that, rather than assessing the ACT’s disabilities in thisarea, a simple process should be adopted whereby the ACT is allocated theAustralian standard to recognise that it does not receive any direct funding forindigenous housing.
4.64. The ACT notes the Commission’s Discussion Paper favours the inclusion of landtax chargeable on residential properties in the Commission’s assessment of State revenueraising capacities. Should the Commission proceed with this, it should take account of thelimitations imposed by the CSHA.
4.65. Besides dictating how housing assistance policies are applied in the States, theCSHA also impacts on the ACT’s revenue raising capacity. Section 4(16) of the CSHAprohibits the ACT from applying a tax equivalent regime on its State Housing Authority –ACT Housing. This includes the levying of land taxes on leased residential properties.
4.66. While this impact applies equally to all States, it is felt greatest where the holdingsof public housing stock are higher. This includes South Australia, the Northern Territoryand Tasmania as well as the ACT.
Land Tax Assessment Approach and Structure
Socio-demographic Composition Factor – Housing
Session 4 – Welfare Services – ‘Poverty in the ACT’ & Housing – ‘Accommodation Constraints’
135
4.67. The ACT’s argument is not to revise this policy and hence include all public housingstock in the calculation of land tax revenue raising. However, the ACT supports theCommission including in its assessment the ACT’s reduced capacity relative to a numberof other States to levy land tax on leased residential property.
4.68. The calculation of this disability should use the Australian average holdings ofpublic housing (ie 5.3%) as the ‘standard’ and calculate the tax chargeable above/belowthis level as the disability experienced by each State and Territory.
4.69. In addition to those properties owned by the SHA, properties owned and leased bythe Defence Housing Authority are not subject to land tax.
4.70. An adjustment should be made to the land tax assessment to take account ofthe fact that States cannot levy land tax on their SHAs. This adjustment should bebased on the variance from the Australian average for public housing stock.
4.71. The ACT has argued that account should continue to be taken of the diseconomiesof small scale and the higher input costs in providing services in the ACT. This applies tothe provision of housing, disability and SAAP services as well as other services in theACT.
4.72. The ACT has also provided a suggested method to overcome the Commission’sconcerns about fluctuations in the redistribution of funding connected with buildingmaintenance costs.
Scale Affected Expenditure and Input Costs Factor
Session 4 – Welfare Services – ‘Poverty in the ACT’ & Housing – ‘Accommodation Constraints’
136
4.73. In terms of the ACT’s ‘bottom-line’ positions:
• The ACT should be allocated a ‘once only’ payment of $65m to compensate forthe unfunded liability transferred to it by the Commonwealth. This will recognisethe fact that the ‘return of capital’ was retained by the Commonwealth and thattransitional funding had not been provided earlier to address this liability;
• The Commission should adopt a new approach to assessing the housingcategory that recognises contemporary housing assistance policies and fundingarrangements. This assessment process should include an appropriateadjustment to account for the real cost to tenants in accessing low-cost housing;[See Attachment B - reworked table prepared by NATSEM]
• The Commission in regard to the land tax assessment, should also take accountof the limits to raising land tax imposed by the Commonwealth-State HousingAgreement (CSHA); and
• The socio-demographic factors for the housing and homelessness (SAAP)categories should take account of the current profile of people requiring thoseservices.
Conclusion
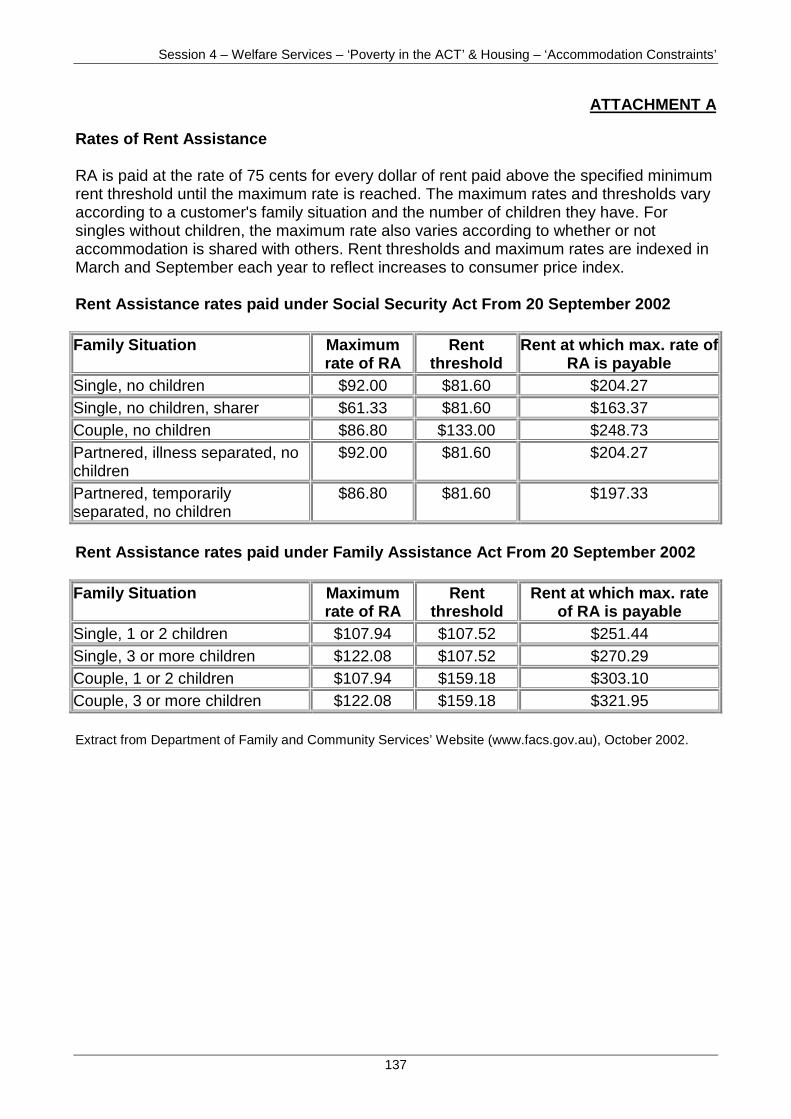
Session 4 – Welfare Services – ‘Poverty in the ACT’ & Housing – ‘Accommodation Constraints’
137
ATTACHMENT A
Rates of Rent Assistance
RA is paid at the rate of 75 cents for every dollar of rent paid above the specified minimumrent threshold until the maximum rate is reached. The maximum rates and thresholds varyaccording to a customer's family situation and the number of children they have. Forsingles without children, the maximum rate also varies according to whether or notaccommodation is shared with others. Rent thresholds and maximum rates are indexed inMarch and September each year to reflect increases to consumer price index.
Rent Assistance rates paid under Social Security Act From 20 September 2002
Family Situation Maximumrate of RA
Rentthreshold
Rent at which max. rate ofRA is payable
Single, no children $92.00 $81.60 $204.27Single, no children, sharer $61.33 $81.60 $163.37Couple, no children $86.80 $133.00 $248.73Partnered, illness separated, nochildren
$92.00 $81.60 $204.27
Partnered, temporarilyseparated, no children
$86.80 $81.60 $197.33
Rent Assistance rates paid under Family Assistance Act From 20 September 2002
Family Situation Maximumrate of RA
Rentthreshold
Rent at which max. rateof RA is payable
Single, 1 or 2 children $107.94 $107.52 $251.44Single, 3 or more children $122.08 $107.52 $270.29Couple, 1 or 2 children $107.94 $159.18 $303.10Couple, 3 or more children $122.08 $159.18 $321.95
Extract from Department of Family and Community Services’ Website (www.facs.gov.au), October 2002.
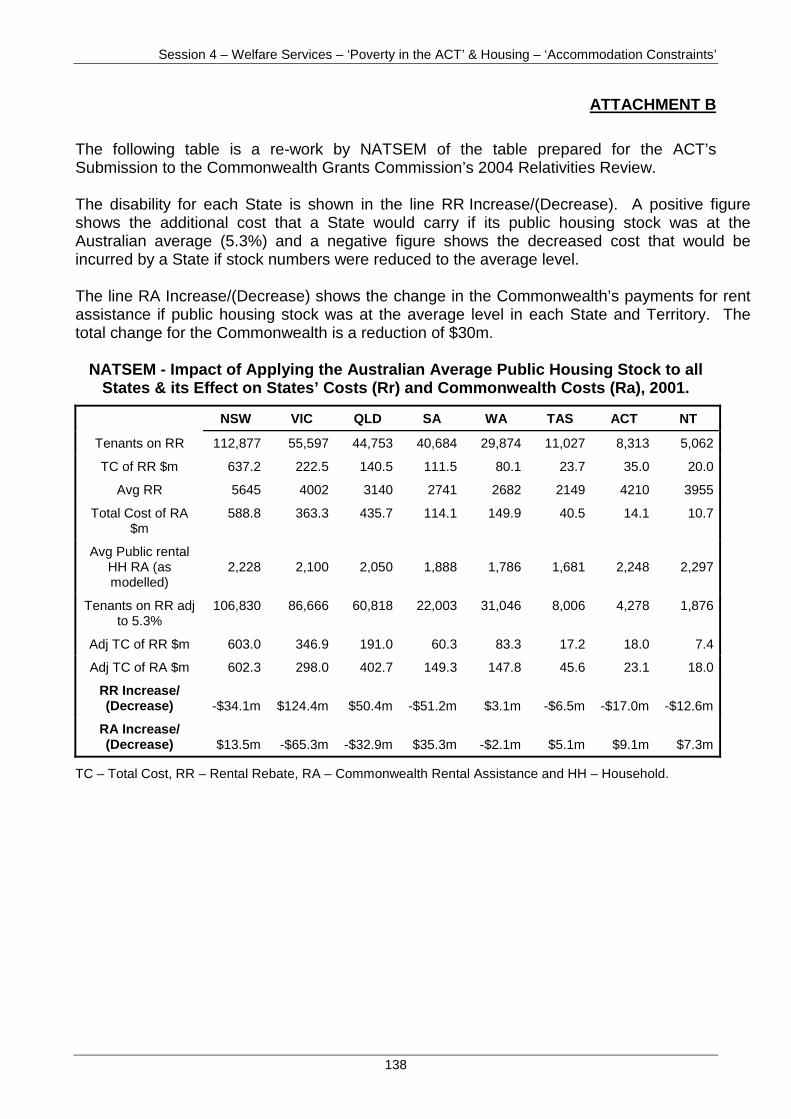
Session 4 – Welfare Services – ‘Poverty in the ACT’ & Housing – ‘Accommodation Constraints’
138
ATTACHMENT B
The following table is a re-work by NATSEM of the table prepared for the ACT’sSubmission to the Commonwealth Grants Commission’s 2004 Relativities Review.
The disability for each State is shown in the line RR Increase/(Decrease). A positive figureshows the additional cost that a State would carry if its public housing stock was at theAustralian average (5.3%) and a negative figure shows the decreased cost that would beincurred by a State if stock numbers were reduced to the average level.
The line RA Increase/(Decrease) shows the change in the Commonwealth’s payments for rentassistance if public housing stock was at the average level in each State and Territory. Thetotal change for the Commonwealth is a reduction of $30m.
NATSEM - Impact of Applying the Australian Average Public Housing Stock to allStates & its Effect on States’ Costs (Rr) and Commonwealth Costs (Ra), 2001.
NSW VIC QLD SA WA TAS ACT NT
Tenants on RR 112,877 55,597 44,753 40,684 29,874 11,027 8,313 5,062
TC of RR $m 637.2 222.5 140.5 111.5 80.1 23.7 35.0 20.0
Avg RR 5645 4002 3140 2741 2682 2149 4210 3955
Total Cost of RA$m
588.8 363.3 435.7 114.1 149.9 40.5 14.1 10.7
Avg Public rentalHH RA (asmodelled)
2,228 2,100 2,050 1,888 1,786 1,681 2,248 2,297
Tenants on RR adjto 5.3%
106,830 86,666 60,818 22,003 31,046 8,006 4,278 1,876
Adj TC of RR $m 603.0 346.9 191.0 60.3 83.3 17.2 18.0 7.4
Adj TC of RA $m 602.3 298.0 402.7 149.3 147.8 45.6 23.1 18.0
RR Increase/(Decrease) -$34.1m $124.4m $50.4m -$51.2m $3.1m -$6.5m -$17.0m -$12.6m
RA Increase/(Decrease) $13.5m -$65.3m -$32.9m $35.3m -$2.1m $5.1m $9.1m $7.3m
TC – Total Cost, RR – Rental Rebate, RA – Commonwealth Rental Assistance and HH – Household.
Session 5 – Non-inpatient Health Services – ‘Service Demand & Supply Restrictions’
139
DAY ONE
WEDNESDAY, 13 NOVEMBER 2002
SESSION 5. – NON-INPATIENT HEALTH SERVICES –‘SERVICE DEMAND AND SUPPLY SIDE RESTRICTIONS’:
(A) Non-Inpatient and Community Health Services.
(B) Population and Preventative Health.
Session 5 – Non-inpatient Health Services – ‘Service Demand & Supply Restrictions’
140
(A) NON-INPATIENT AND COMMUNITY HEALTH SERVICES
Regatta Point - Canberra Business Promotion Centre.
Dr Penny Gregory, Chief Executive, Department of Health and Community Care.
Dr Gregory was appointed acting Chief Executive in July 2000. In June 2002, arestructure abolishing purchaser/provider arrangements led to her becoming bothAdministrator of the health service and Chief Executive, with overall responsibility forpolicy development and health service delivery and leadership of the portfolio.
Dr Gregory is chair of two sub-committees of the Australian Health Ministers’ AdvisoryCouncil - the National Mental Health Working Group and the Medical Indemnity WorkingGroup. Penny is also a member of the Board of the Australian Institute of Health andWelfare.
Dr Marielle Ruigrok, B(Med)Sc. - physiology and pharmacology, MBBS University ofNSW.
Dr Ruigrok is the Director of Emergency at Calvary Hospital and also the main investigatorin a hospital wide multi-centre trial of introducing a Medical Emergency Team to improvepatient care of the critically ill. Dr Ruigrok is also affiliated with the Canberra clinical schooland regularly teaches medical students
Dr Ruigrok has previously worked in numerous Emergency departments of countryhospitals, such as at the Broken Hill Base Hospital which retrieved critically ill medicalpatients and multi-traumas by the Royal Flying Doctor Service.
Other hospitals served include Coffs Harbour Base Hospital, Orange Base Hospital, ShellHarbour Base Hospital, Shoalhaven Base Hospital, Port Macquarie Base Hospital andAlbury Base Hospital.
Presenters
VenueSession Objectives
This session will demonstrate two service delivery disabilities in community services:
• cross border activity impacting upon ACT Emergency Departments, non-inpatientand community health services; and
• the under-supply of GP full time equivalents in the ACT.
Session 5 – Non-inpatient Health Services – ‘Service Demand & Supply Restrictions’
141
Dr Ian Pryor, MB BS., Dip O&G, FRACGP.
Dr Pryor is President, Australian Medical Association, ACT Branch and a full timeCanberra GP. Dr Pryor is also the ACT Division’s Representative Group rep on the ADGP(Australian Divisions of General Practice).
Dr Pryor has many decades of experience in general practice in rural and city practice andexperience in local government.
Dr Glynn Kelly, MB BS Hons, Sydney University 1979; MA in Family Medicine (Monash)FRACGP.
Dr Kelly is President, ACT Division of General Practice; Clinical Senior Lecturer in GeneralPractice at the Canberra Clinical School and full time Canberra GP.
Glynn has had 20 years experience as a GP and as Clinical Senior Lecturer in Medicine(University of Sydney, Canberra Clinical School) is actively involved in undergraduate andpostgraduate medical education
Other Departmental Representatives
Ms Susan Killion, Executive Director, Health Policy Planning and Information,Department of Health and Community Care.
Mr Ian Thompson, Director, Health Policy and Primary Care, Department of Health andCommunity Care.
Mr Richard Bialkowski, Chief Executive, ACT Division of General Practice.
Mr Bialkowski has a Bachelor of Business (Human Resource Management) University ofSouthern Queensland (1991) and Master of Business (General Management) CharlesSturt University (1995).
Prior to entering the private sector in late 1994, Richard had served 24 years as acommissioned officer in the Australian Army with his last appointment being in the rank ofLieutenant Colonel.
Session 5 – Non-inpatient Health Services – ‘Service Demand & Supply Restrictions’
142
5.1. The ACT provides two Emergency Departments (ED) at The Canberra Hospital andCalvary Public Hospital. The TCH ED is central to the ACT trauma retrieval service. Theretrieval service serves a residential population of 750,000 with its primary area ofoperation extending from Wagga Wagga in the west, down to the Victorian border in thesouth and east to the NSW coastline. The retrieval service’s catchment area also extendsnorth, close to Sydney.
5.2. ACT public hospitals also supply substantial specialist Non-admitted patientservices to the ACT population and residents of surrounding NSW. These servicesinclude Medical Oncology, Genetics and Foetal Medicine, Orthopaedics, Cardiology andCardiothoracic clinics.
5.3. ACT Community Health Services provide a broad range of services to the people ofthe ACT and surrounding regions.
5.4. Services provided include alcohol and drug services, post natal and early childhoodservices, home and community care, community mental health services, corrections healthand Indigenous health services. Community health services are provided at and from avariety of sites dispersed across the ACT.
5.5. There is little unit record level data on the use of the community health services bycross border residents.
Key Points from the ACT Main Submission
Cross Border Activity in Community Services
Overview of Service Delivery in the ACT
• The ACT requested the inclusion of a cross border factor for the AHCA relatedEmergency Department and Outpatients components of the Non-inpatient andCommunity Health Services category. This is required because the ACTexperiences substantial imbalances in cross border flows for those services.
• The ACT supported the continued assessment of a cross border factor for theCommunity services component of the Non-inpatient Services Category to reflectthe non-resident use of general community services, albeit using the ACT’sproposed modified general method.
• The ACT requested that the Commission introduce a factor to recognise non-resident use of the ACT’s Queen Elizabeth II Family Centre. Approximately 50 percent of the episodes of the centre are for NSW cross border clients. This crossborder activity is not recognised under any cross border arrangements orassessments.
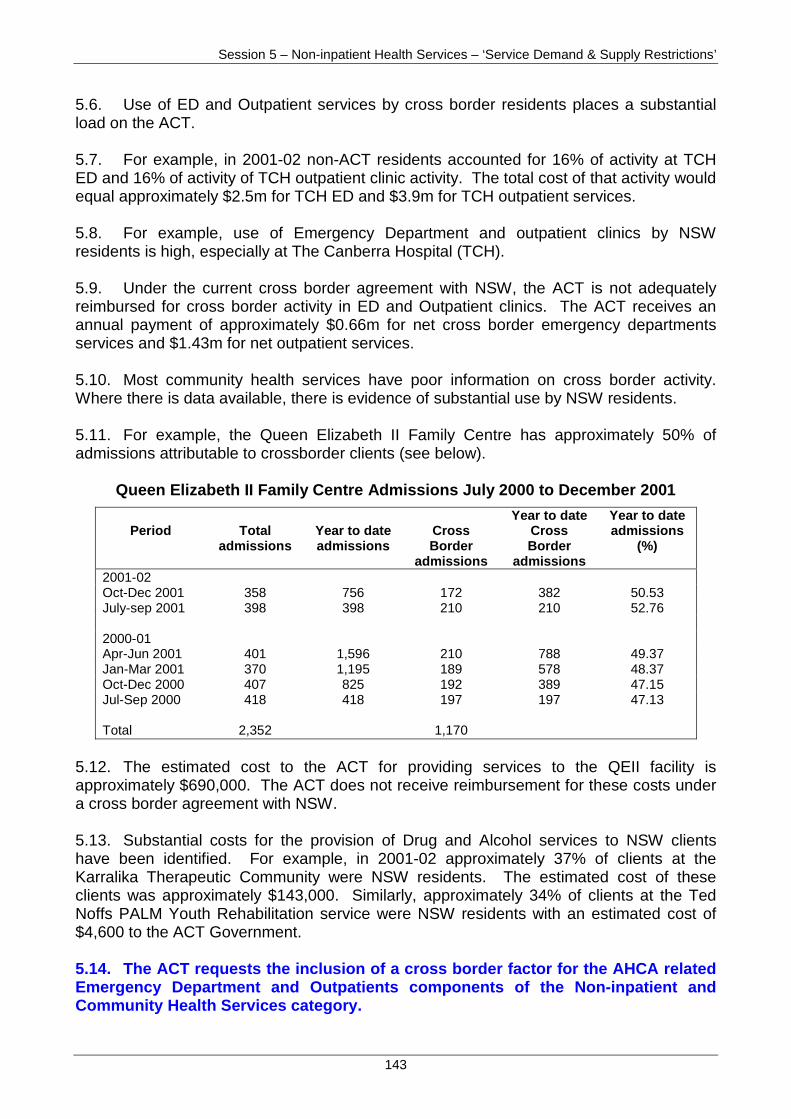
Session 5 – Non-inpatient Health Services – ‘Service Demand & Supply Restrictions’
143
5.6. Use of ED and Outpatient services by cross border residents places a substantialload on the ACT.
5.7. For example, in 2001-02 non-ACT residents accounted for 16% of activity at TCHED and 16% of activity of TCH outpatient clinic activity. The total cost of that activity wouldequal approximately $2.5m for TCH ED and $3.9m for TCH outpatient services.
5.8. For example, use of Emergency Department and outpatient clinics by NSWresidents is high, especially at The Canberra Hospital (TCH).
5.9. Under the current cross border agreement with NSW, the ACT is not adequatelyreimbursed for cross border activity in ED and Outpatient clinics. The ACT receives anannual payment of approximately $0.66m for net cross border emergency departmentsservices and $1.43m for net outpatient services.
5.10. Most community health services have poor information on cross border activity.Where there is data available, there is evidence of substantial use by NSW residents.
5.11. For example, the Queen Elizabeth II Family Centre has approximately 50% ofadmissions attributable to crossborder clients (see below).
Queen Elizabeth II Family Centre Admissions July 2000 to December 2001
Period Totaladmissions
Year to dateadmissions
CrossBorder
admissions
Year to dateCrossBorder
admissions
Year to dateadmissions
(%)
2001-02Oct-Dec 2001 358 756 172 382 50.53July-sep 2001 398 398 210 210 52.76
2000-01Apr-Jun 2001 401 1,596 210 788 49.37Jan-Mar 2001 370 1,195 189 578 48.37Oct-Dec 2000 407 825 192 389 47.15Jul-Sep 2000 418 418 197 197 47.13
Total 2,352 1,170
5.12. The estimated cost to the ACT for providing services to the QEII facility isapproximately $690,000. The ACT does not receive reimbursement for these costs undera cross border agreement with NSW.
5.13. Substantial costs for the provision of Drug and Alcohol services to NSW clientshave been identified. For example, in 2001-02 approximately 37% of clients at theKarralika Therapeutic Community were NSW residents. The estimated cost of theseclients was approximately $143,000. Similarly, approximately 34% of clients at the TedNoffs PALM Youth Rehabilitation service were NSW residents with an estimated cost of$4,600 to the ACT Government.
5.14. The ACT requests the inclusion of a cross border factor for the AHCA relatedEmergency Department and Outpatients components of the Non-inpatient andCommunity Health Services category.
Session 5 – Non-inpatient Health Services – ‘Service Demand & Supply Restrictions’
144
5.15. The ACT supports the continued assessment of a cross border factor for theCommunity services component of the Non-inpatient Services Category to reflectthe non-resident use of general community services, albeit using the ACT’sproposed modified general method.
5.16. The ACT requests that the Commission introduce a factor to recognise non-resident use of the ACT’s Queen Elizabeth II Family Centre.
5.17. During the 1999 Review, the Commission developed an economic environmentfactor to apply to emergency departments, outpatients and community health componentsto account for the greater need for State funded services in regions that had less provisionof private sector alternatives.
5.18. The factor was based on general practitioner numbers by region using the Remote,Rural, Metropolitan Area (RRMA) classification. The Commission believed that the factorbased on GPs was justified, even though GPs are not necessarily a direct substitute forthe range of services provided by non-admitted and community health services providers,they were considered to be a good proxy for the level of private provision of theseservices.
5.19. However, the Commission believed that lack of private services was not a problemfor the Capital, Other Metropolitan, Large Rural Centres and Small Rural Centrescategories and between States. Therefore, these were given a single average weight,calculated by adding these populations and numbers of GPs before the weight wascalculated.
5.20. The ACT believes that this approach is not appropriate because it fails torecognise that there are shortages of GPs in some of the above areas, and that there is asubstantial differences in the supply of GPs between different areas with the same RRMAclassification and between States. In developing this factor, the Commission recognisedthat the supply of GPs influences demand on State funded services as well as being aproxy measure for supply of other private sector services. However, this principle holdsirrespective of RRMA classification. The Commission’s approach is therefore inconsistentwith the principles of equalisation in that it does not take into account the impact ofdifferences in overall supply of GPs between jurisdictions.
5.21. The ACT currently has an under-supply of GPs. As illustrated in the table below, in2000-01 the ACT had 67.7 full time equivalent GPs per 100,000 population compared to anational average of 85 per 100,000.
Lack of GPs in the ACT
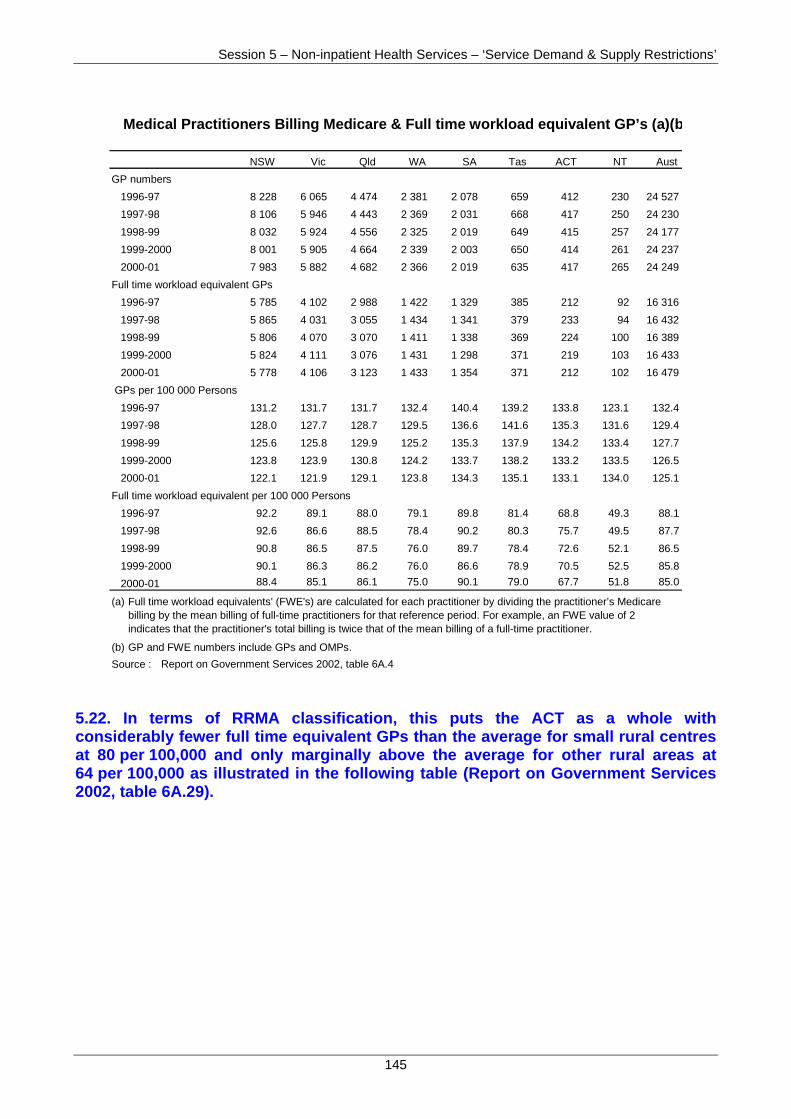
Session 5 – Non-inpatient Health Services – ‘Service Demand & Supply Restrictions’
145
NSW Vic Qld WA SA Tas ACT NT Aust
GP numbers
1996-97 8 228 6 065 4 474 2 381 2 078 659 412 230 24 527
1997-98 8 106 5 946 4 443 2 369 2 031 668 417 250 24 230
1998-99 8 032 5 924 4 556 2 325 2 019 649 415 257 24 177
1999-2000 8 001 5 905 4 664 2 339 2 003 650 414 261 24 237
2000-01 7 983 5 882 4 682 2 366 2 019 635 417 265 24 249
Full time workload equivalent GPs
1996-97 5 785 4 102 2 988 1 422 1 329 385 212 92 16 316
1997-98 5 865 4 031 3 055 1 434 1 341 379 233 94 16 432
1998-99 5 806 4 070 3 070 1 411 1 338 369 224 100 16 389
1999-2000 5 824 4 111 3 076 1 431 1 298 371 219 103 16 433
2000-01 5 778 4 106 3 123 1 433 1 354 371 212 102 16 479
GPs per 100 000 Persons
1996-97 131.2 131.7 131.7 132.4 140.4 139.2 133.8 123.1 132.4
1997-98 128.0 127.7 128.7 129.5 136.6 141.6 135.3 131.6 129.4
1998-99 125.6 125.8 129.9 125.2 135.3 137.9 134.2 133.4 127.7
1999-2000 123.8 123.9 130.8 124.2 133.7 138.2 133.2 133.5 126.5
2000-01 122.1 121.9 129.1 123.8 134.3 135.1 133.1 134.0 125.1
Full time workload equivalent per 100 000 Persons
1996-97 92.2 89.1 88.0 79.1 89.8 81.4 68.8 49.3 88.1
1997-98 92.6 86.6 88.5 78.4 90.2 80.3 75.7 49.5 87.7
1998-99 90.8 86.5 87.5 76.0 89.7 78.4 72.6 52.1 86.5
1999-2000 90.1 86.3 86.2 76.0 86.6 78.9 70.5 52.5 85.8
2000-01 88.4 85.1 86.1 75.0 90.1 79.0 67.7 51.8 85.0
(a)
(b)
Source : Report on Government Services 2002, table 6A.4
Medical Practitioners Billing Medicare & Full time workload equivalent GP’s (a)(b
Full time workload equivalents' (FWE's) are calculated for each practitioner by dividing the practitioner’s Medicarebilling by the mean billing of full-time practitioners for that reference period. For example, an FWE value of 2indicates that the practitioner's total billing is twice that of the mean billing of a full-time practitioner.
GP and FWE numbers include GPs and OMPs.
5.22. In terms of RRMA classification, this puts the ACT as a whole withconsiderably fewer full time equivalent GPs than the average for small rural centresat 80 per 100,000 and only marginally above the average for other rural areas at64 per 100,000 as illustrated in the following table (Report on Government Services2002, table 6A.29).
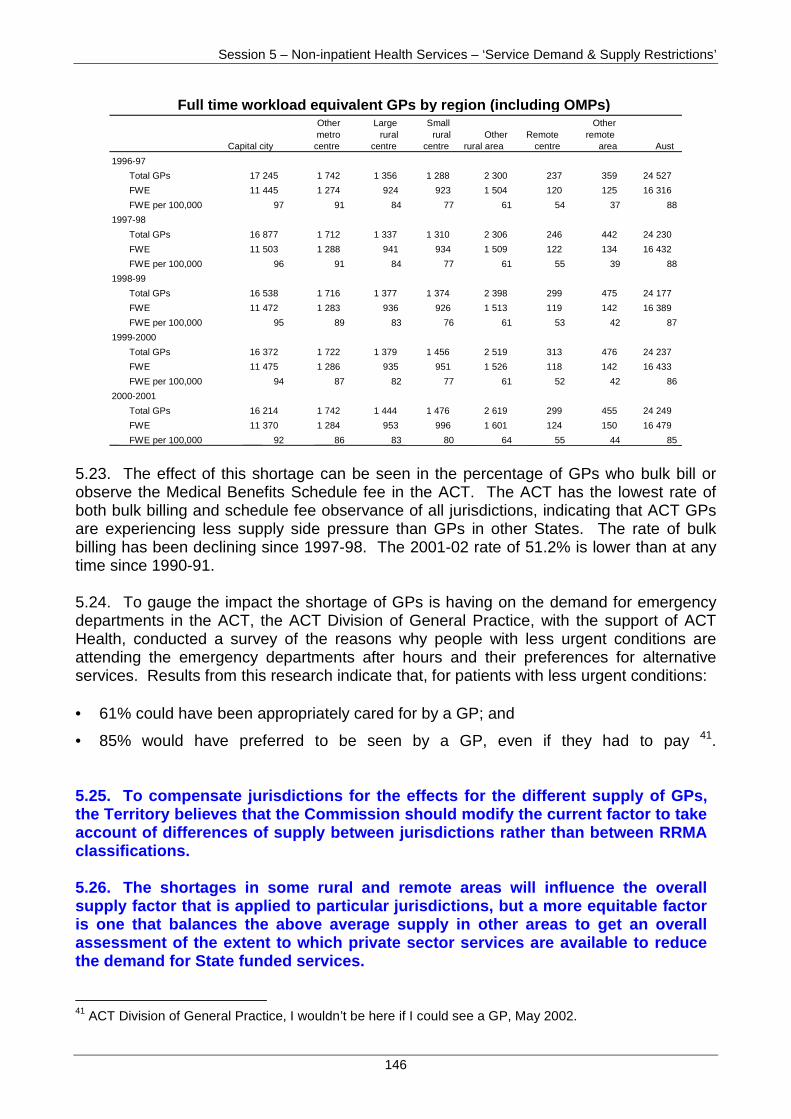
Session 5 – Non-inpatient Health Services – ‘Service Demand & Supply Restrictions’
146
Full time workload equivalent GPs by region (including OMPs)
Capital city
Othermetro
centre
Largerural
centre
Smallrural
centreOther
rural areaRemote
centre
Otherremote
area Aust
1996-97
Total GPs 17 245 1 742 1 356 1 288 2 300 237 359 24 527
FWE 11 445 1 274 924 923 1 504 120 125 16 316
FWE per 100,000 97 91 84 77 61 54 37 88
1997-98
Total GPs 16 877 1 712 1 337 1 310 2 306 246 442 24 230
FWE 11 503 1 288 941 934 1 509 122 134 16 432
FWE per 100,000 96 91 84 77 61 55 39 88
1998-99
Total GPs 16 538 1 716 1 377 1 374 2 398 299 475 24 177
FWE 11 472 1 283 936 926 1 513 119 142 16 389
FWE per 100,000 95 89 83 76 61 53 42 87
1999-2000
Total GPs 16 372 1 722 1 379 1 456 2 519 313 476 24 237
FWE 11 475 1 286 935 951 1 526 118 142 16 433
FWE per 100,000 94 87 82 77 61 52 42 86
2000-2001
Total GPs 16 214 1 742 1 444 1 476 2 619 299 455 24 249
FWE 11 370 1 284 953 996 1 601 124 150 16 479
FWE per 100,000 92 86 83 80 64 55 44 85
5.23. The effect of this shortage can be seen in the percentage of GPs who bulk bill orobserve the Medical Benefits Schedule fee in the ACT. The ACT has the lowest rate ofboth bulk billing and schedule fee observance of all jurisdictions, indicating that ACT GPsare experiencing less supply side pressure than GPs in other States. The rate of bulkbilling has been declining since 1997-98. The 2001-02 rate of 51.2% is lower than at anytime since 1990-91.
5.24. To gauge the impact the shortage of GPs is having on the demand for emergencydepartments in the ACT, the ACT Division of General Practice, with the support of ACTHealth, conducted a survey of the reasons why people with less urgent conditions areattending the emergency departments after hours and their preferences for alternativeservices. Results from this research indicate that, for patients with less urgent conditions:
• 61% could have been appropriately cared for by a GP; and
• 85% would have preferred to be seen by a GP, even if they had to pay 41.
5.25. To compensate jurisdictions for the effects for the different supply of GPs,the Territory believes that the Commission should modify the current factor to takeaccount of differences of supply between jurisdictions rather than between RRMAclassifications.
5.26. The shortages in some rural and remote areas will influence the overallsupply factor that is applied to particular jurisdictions, but a more equitable factoris one that balances the above average supply in other areas to get an overallassessment of the extent to which private sector services are available to reducethe demand for State funded services.
41 ACT Division of General Practice, I wouldn’t be here if I could see a GP, May 2002.
Session 5 – Non-inpatient Health Services – ‘Service Demand & Supply Restrictions’
147
5.27. In conclusion, substantial ACT ED, Non-admitted patient and communityhealth services activity is provided for NSW residents.
5.28. The ACT requests the inclusion of a cross border factor for the AHCArelated Emergency Department and Outpatients components of the Non-inpatientand Community Health Services category.
5.29. The ACT supports the continued assessment of a cross border factor for theCommunity services component of the Non-inpatient Services Category to reflectthe non-resident use of general community services, albeit using the ACT’sproposed modified general method.
5.30. The ACT requests that the Commission introduce a factor to recognise non-resident use of the ACT’s Queen Elizabeth II Family Centre.
5.31. To compensate jurisdictions for the effects of different supply of GPs, theTerritory believes that the Commission should modify the current factor to takeaccount of differences of supply between jurisdictions rather than between RRMAclassifications.
Conclusion
Session 5 – Non-inpatient Health Services – ‘Service Demand & Supply Restrictions’
148
(B) POPULATION AND PREVENTATIVE HEALTH
Regatta Point - Canberra Business Promotion Centre.
Dr Penny Gregory, Chief Executive, Department of Health and Community Care.
Dr Gregory was appointed acting Chief Executive in July 2000. In June 2002, arestructure abolishing purchaser/provider arrangements led to her becoming bothAdministrator of the health service and Chief Executive, with overall responsibility forpolicy development and health service delivery and leadership of the portfolio.
Dr Gregory is chair of two sub-committees of the Australian Health Ministers’ AdvisoryCouncil - the National Mental Health Working Group and the Medical Indemnity WorkingGroup. Penny is also a member of the Board of the Australian Institute of Health andWelfare.
Other Departmental Representatives
Ms Susan Killion, Executive Director, Health Policy Planning and Information,Department of Health and Community Care.
Mr Ian Thompson, Director, Health Policy and Primary Care, Department of Health andCommunity Care.
Mr Richard Bialkowski, Chief Executive, ACT Division of General Practice.
Mr Bialkowski has a Bachelor of Business (Human Resource Management) University ofSouthern Queensland (1991) and Master of Business (General Management) CharlesSturt University (1995).
Prior to entering the private sector in late 1994, Richard had served 24 years as acommissioned officer in the Australian Army with his last appointment being in the rank ofLieutenant Colonel.
Presenters
Venue
Session Objectives
• To demonstrate the need to discontinue the socio-demographic composition factor.
• To demonstrate the cross-border impacts on public health services in the ACT.
Session 5 – Non-inpatient Health Services – ‘Service Demand & Supply Restrictions’
149
5.32. The ACT provides a broad range of Population and Preventative Health services.These include:
• the Health Protection Services which has individual units for Communicable DiseasesControl (including the ACT Immunisation Program), Pharmaceutical Services, andEnvironmental Health;
• public health campaigns such as those undertaken in 2000-01 for meningococcalawareness, Indigenous health, promotion of immunisation, and promotion of organdonation; and
• breast cancer screening and screening for childhood diseases.
5.33. These services are provided at and from a number of sites dispersed throughoutthe ACT.
Key Points from the ACT Main Submission
Overview of Service Delivery in the ACT
Socio-demographic Composition Factor
• The socio-demographic composition factor for the Population and PreventativeHealth category should be discontinued in the 2004 Review.
• Discontinuing the factor would be consistent with the nature of these programs,which provide benefits to the whole State population, rather than to a select group.
• Discontinuing the factor would also overcome anomalies of low needs beingassessed for such expenditures, notwithstanding relative high incidence of relateddiseases and conditions.
Cross Border factor
• No other State has such a large proportion of its health resources used bynon-residents.
• This use goes beyond costs as measured by separations and occasions of serviceas it impacts on the supporting administrative and policy infrastructure associatedwith a health care system.
• This factor should be applied to the population health component of the Populationand Preventative Health category in addition to the cross border factor applied tochildren’s immunisation services.
• The ACT requests that the Territory’s proposed modified general be applied to bothcomponents of this category as it more accurately reflects the population andpreventative health costs faced by the ACT than the current application of broadjudgment.
Session 5 – Non-inpatient Health Services – ‘Service Demand & Supply Restrictions’
150
5.34. The ACT suggests there are grounds for reviewing the socio-demographic factor forthe Preventative Health component.
5.35. The current factor is based on the age-sex structure of State populations, with costweightings for low fluency in English also applied to target populations for majorpreventative health programs. In the 1999 Review, the programs and target populationsselected were:
• cervical cancer screening – women aged 18-70;
• breast cancer screening – women aged 40-70; and
• childhood immunisation – children aged 0-6.
5.36. The ACT considers that there are grounds to review how these needs areassessed. These include:
• for breast cancer screening the need for early detection measures is evident for womenlower than forty years; and
• the factor does not reflect differences between States in the incidence of breast cancer:
− The Breast Screen Australia Achievement Report 1997 and 1998 noted breastcancer incidence data could be used to examine the distribution of diseases byState to determine whether the screening program needs to be tailored to particularlocal circumstances. The Report found that incidence rates for breast cancer forwomen aged 50-69 years in 1998 were highest in the ACT (345.5 per 100,000women) compared to all remaining States.
5.37. Population health programs have the objective of reducing the incidence of, andharm caused by, disease. This includes jurisdictions where the incidence of disease hasreduced as a result of the existence of population health programs, or for other reasons.
5.38. All States also participate in a wide range of programs with a significant populationand preventative health focus. This includes the National Health Priority Areas ofcardiovascular health, cancer control, injury prevention and control, mental health,diabetes and asthma. These programs go well beyond the scope of the socio-demographic composition factor applied in the 19999 Review.
5.39. The socio-demographic composition factor for the Population andPreventative Health category should be discontinued in the 2004 Review. Thiswould be consistent with the nature of related programs that provide benefits to thewhole population of the States. It would also overcome anomalies of low needsbeing assessed for such expenditures, notwithstanding high rates of incidence ofthe associated disease.
Socio-demographic Composition Factor
Session 5 – Non-inpatient Health Services – ‘Service Demand & Supply Restrictions’
151
5.40. The 1999 Review assessed a cross border factor for immunisation expenditure inthe Preventative Health component of the Public Health category to measure costsassociated with immunisation provided to cross border school students, kindergartenstudents and pre-schoolers.
5.41. The ACT’s submission to the 1999 Review suggested that costs for components ofthe category are influenced by demand from the region including services forcommunicable diseases, surveillance, epidemiology, nutrition services andpharmaceuticals provided outside hospitals. The ACT’s role in providing the only tertiaryreferral hospital for the region, and as a major employment and service centre, createscost pressures for in excess of the costs encompassed in the 1999 Review methodology.
5.42. No other State has such a large proportion of its health resources used by non-residents. This goes beyond costs as measured by separations and occasions of care butimpacts on the supporting administrative and policy infrastructure associated with a healthcare system.
5.43. Cross border demand also creates the need to make arrangements for continuity ofcare that cuts across the ACT/NSW border. This includes arrangements for the mostvulnerable including geriatric care, more mature aged mothers, and indigenous healthcare.
5.44. Increased costs also include system wide costs of dealing with adverse events andinsurance claims associated with treatment of non-resident patients and costs ofresponding to complaints. These and other costs are not recognised in other categoriesand reflect the relative significance of cross border patient flows as a proportion of totalthroughput in the ACT.
5.45. A factor for cross border activity should apply to the population healthcategory of the Population and Preventative Health category in addition to the crossborder factor applied to children’s immunisation services.
5.46. The ACT requests that the Territory’s modified general method be applied toboth components of this category as it more accurately reflects the population andpreventative health costs faced by the ACT than the current application of the broadjudgement.
5.47. The socio-demographic factor for the Population and Preventative Healthcategory should be discontinued in the 2004 Review. This would be consistent withthe nature of these programs, which benefit the whole jurisdiction population ratherthan a select group. It would also overcome anomalies of low needs beingassessed as expenditures, notwithstanding relative high incidence of relateddiseases and conditions.
Cross Border
Conclusion
Session 5 – Non-inpatient Health Services – ‘Service Demand & Supply Restrictions’
152
5.48. The ACT is unique in the proportion of its health services used by non-residents. This has effects beyond costs as measured by separations andoccasions of services as it affects the supporting administrative and policyinfrastructure associated with a health system.
5.49. A factor for cross border activity should apply to the population healthcategory of the Population and Preventative Health category in addition to the crossborder factor applied to children’s immunisation services.
5.50. The ACT believes that the Territory’s modified general method be applied toboth components of this category as it more accurately reflects the population andpreventative health costs faced by the ACT than the current application of the broadjudgement.
Session 6 – The ACT – ‘A National Park’
153
DAY TWO
THURSDAY, 14 NOVEMBER 2002
SESSION 6. – ‘THE ACT – 'A NATIONAL PARK'’:
(A) National Parks and Wildlife.
(B) Services to Industry - Forestry.
Session 6 – The ACT – ‘A National Park’
154
(A) NATIONAL PARKS AND WILDLIFE
Session Objectives
• The objectives of this session are to demonstrate how the design anddevelopment of Canberra as the national capital has provided an extensivenetwork of open space areas (including parks and reserves) across the ACT.
• The session will seek to provide an understanding and acknowledgment of theextent and location of the ACT’s protected open spaces, and their impact onmanagement costs, particularly with regard to urbanisation factors and nationalcapital factors.
• The session will also seek to raise awareness of other cost issues such asindigenous involvement in park management.
Use of the IUCN (World Conservation Union) Model
• To outline support of the Commission’s adoption of the National Reserve Systemfor the classification of national parks, based on the IUCN definition model as itrepresents most robust and consistent measure of national parks.
• The Urbanisation and Visitor Impact models represent an important recognition ofthe ACT circumstances given the close interaction between residents, visitorsand the Territory’s national parks.
The Visitor Impact component and Urbanisation factor
• To seek the recognition of the gazetted areas of the ACT’s IUCN defined nationalparks (which includes large components of NCOSS) in the calculation of therelevant disability factors.
• While the ACT supports the retention of the current model used to assess theurbanisation and visitor factors, and the respective component weights, arecalculation of the contiguous population to assess urbanisation impacts (basedon the IUCN National Park definition) is required:
− the Commonwealth Department of Environment and Heritage clearly definescomponents of NCOSS as an IUCN Category II National Park – a re-calculationof the urbanisation factor for the gazetted components on these grounds showsthat the entire population of the ACT and immediate surrounds needs to beincluded in the assessment.
The Physical Environment Factor
• To seek the amendment to the ACT’s biophysical region factor to reflect thediversity of its flora and fauna as part of the NSW Comprehensive ForestAssessment, as the current approach is based on outdated data which does notrecognise the ecological systems operating within the ACT’s environment, nor therelative inputs required to manage these diverse environments.
Session 6 – The ACT – ‘A National Park’
155
Namadgi National Park Visitor Centre
The Namadgi National Park Visitor Centre, located just outside the small village of Tharwa,serves as an orientation and information point for visitors to Namadgi National Park.Namadgi National Park comprises nearly 50% of the ACT, and is one of the AustralianAlps National Parks.
The visitor centre was constructed in 1990 and has recently been refurbished. The visitorcentre also serves as an office and works depot for the Environment ACT staff thatmanage Namadgi National Park and the recreation areas and natures reserves of theMurrumbidgee River Corridor.
The visitor centre houses information and displays, and also contains a theatrette. Therecent refurbishment has seen the construction of a meeting room. This room is used as ameeting place and office for the recently established Interim Namadgi Advisory Board, aninitiative and joint management arrangement of the ACT Government and local Ngunnawalpeople.
Venue
• The ACT, although only relatively small in area, contains a rich diversity of floraand fauna, including a number of threatened species. Whilst IBRA assesses theACT as having only two biophysical regions (Alpine and the SouthEastHighlands), analysis of data from the NSW Comprehensive Forest Assessment,identified 40 ecosystems in the ACT. Of these, 24 are identified as forests, eightas woodlands, five as grasslands and one each of shrubland, sedgeland,heath/bog and rocky outcrops.
National Capital Influences
• To seek recognition of the fact that the Commonwealth’s planning andconstruction of the ‘bush capital’, which has provided present and futuregenerations of Australians with a valuable environmental legacy, has createdadditional planning costs for ACT park managers.
• While all States have planning cost issues, the ACT has inherited a ‘city within anational park’, a unique situation that has resulted in additional cost disabilities forthe Territory.
Aboriginal Involvement in Parks
• To seek changes to the proxy used in assessing aboriginal involvement in parksas it is a very broad-brushed approach which, in many cases, fails to reflect theintricacies involved with service provision involving aboriginals, and therefore theactual costs faced by the ACT.

Session 6 – The ACT – ‘A National Park’
156
Dr Maxine Cooper is Executive Director of Environment ACT.
Dr Cooper has an environmental, urban planning and transport background. She holdsqualifications in Environmental Planning and Urban and Regional Policy and has extensiveexperience in environmental planning and management in various parts of Australia andoverseas.
Maxine was previously, Director, Territory Planning and prior to that she was Director,Environment and Parks, with Brisbane City Council.
Mr Geoff Wells is the Manager of the ACT Parks and Conservation Service, EnvironmentACT.
Mr Wells commenced his career in commercial forestry, working in research andmanagement positions with government and private organisations in Australia andoverseas. During the past 16 years, he has held a variety of policy, planning and landmanagement positions with the ACT Government.
Dr David Shorthouse FEIA, is the Manager, Wildlife Research and Monitoring,Environment ACT.
Dr Shorthouse manages biodiversity survey and monitoring programs in the ACT. He hasextensive experience in environmental planning and management through employmentwith the (former) National Capital Planning Authority, the Commonwealth Department ofEnvironment (World Heritage Unit), and the ACT Parks and Conservation Service.
Dr Shorthouse is responsible for the ACT component of a major collaborative program forbiodiversity survey and conservation planning in the ACT and NSW Southern Tablelands.
Mr Brett McNamara is the Manager of West District (Namadgi National Park,Murrumbidgee River Corridor), ACT Parks and Conservation Service, Environment ACT.
Previously, Brett was the Program Manager of the Australian Alps CooperativeManagement Program and prior to this, a senior ranger in Namadgi National Park. Beforemoving to Environment ACT, Brett spent eight years with the Northern TerritoryConservation Commission, and was involved in park management and indigenous issues.
Mr Terence Uren is the Coordinator of the Interim Namadgi Advisory Board. He also hasresponsibility for Indigenous issues within Environment ACT and is its principal point ofcontact with the Ngunnawal Aboriginal community.
Terence is an architect with a background in land use and development planning. He alsohas post graduate qualifications in environmental management. His work includesprojects with the Gunai-Kurnai Aboriginal communities of East Gippsland and the CentralDesert Aboriginal communities of the Northern Territory.
Presenters
Session 6 – The ACT – ‘A National Park’
157
Key Points from the ACT Main Submission
Urbanisation Factor
• The ACT considers that as part of the urbanisation calculations, based on thecontiguous populations next to national park and wildlife boundaries, theassessment should:
− reflect the adoption of the IUCN (World Conservation Union) National Parksdefinition given that this is the latest industry standard and best measure ofnational parks between States, and would be consistent with the use of IUCNas the basis for calculating a component of the physical environment factor andthe economic environment factor;
− include all National Capital Open Space System (NCOSS) land as the basis ofthe urbanisation factor calculations as these defined areas are subject tosignificant planning and management constraints and large swathes are IUCNdefined National Parks; and
− retain the current urbanisation model (based on 100% of the contiguouspopulation 0-10 kilometres from national park boundaries and 50% of thecontiguous population 10-15 kilometres from national park boundaries).
Physical Environment Factor
• The ACT seeks the removal of the biophysical regions component from thephysical environment factor as it does not reflect cost or demand influencesassociated with the provision of national parks and wildlife services.
Cross Border
• The ACT requests the assessment of a cross border factor to reflect the cost ofcontrolling feral species originating from NSW (using the ACT’s proposed modifiedgeneral method).
Aboriginal Involvement – Socio-demographic Composition Factor
• This factor should be removed as it:
− does not accurately reflect the cost or demand influences associated withaboriginal involvement and the provision of national parks and wildlife services;and
− results in double-counting of the remote Indigenous population.
National Capital Influences
• The ACT does not consider that the current factors assessed within the nationalparks assessment (visitor numbers, contiguous populations and the physicalenvironment factor) fully reflect the costs faced by the ACT, and thus its disabilities.
Session 6 – The ACT – ‘A National Park’
158
Background and context of Commonwealth planning and the National Capital OpenSpace System
6.1. The Commonwealth has overall responsibility for the ACT in regard to planning andland-use. The overall land planning of the ACT is determined by the National Capital Plan(NCP) which is administered on behalf of the Commonwealth by the National CapitalAuthority.
6.2. The NCP sets out to ensure that the Territory is planned and developed inaccordance with their national significance. The ACT has responded by putting in placethe Territory Plan to ensure that the planning and development of the Territory aredelivered in a manner consistent with the NCP:
6.3. The four separate land use categories includes the areas of the National CapitalOpen space System (NCOSS) and are defined in the NCP as:
• Lake Burley Griffin;
• hills, ridges and buffer spaces (including the inner hill nature reserves described asCanberra Nature Park);
• river corridors (including the Murrumbidgee River Corridor and the Molonglo RiverGorge Nature Reserve); and
• mountains and bushlands (including Namadgi National Park and Tidbinbilla NatureReserve).
6.4. Management responsibility for Lake Burley Griffin remains with the Commonwealth,whereas management responsibility for the other three categories has largely been vestedwith the ACT.
6.5. The nature of the city, introduced by the Commonwealth which includes thedispersal of the ACT’s population, and the satellite city plan of the ACT, introduced by theCommonwealth means that there is a close interaction between the urban population andthe open space areas.
6.6. As a result of the Commonwealth’s land planning policies, the ACT has a wellabove average proportion of reserves, parks and open space areas relative to any otherjurisdiction. There are 123,032 hectares of protected area lands in the ACT, representing53% of the land area, well above the proportion of the land area for any other State. Theprotected area status of these lands has been recognised by the Commonwealth’sNational Reserve System (NRS).
6.7. Importantly, another result of Commonwealth planning control has been theretention of many good quality ecological communities and vegetation alliances. As aresult of the Commonwealth leasehold title for land tenure in the ACT, much of the ruralland in the Territory has not been subject to the same level of ‘land clearing improvements’witnessed in States with freehold land title.
Use of the IUCN (World Conservation Union) Model
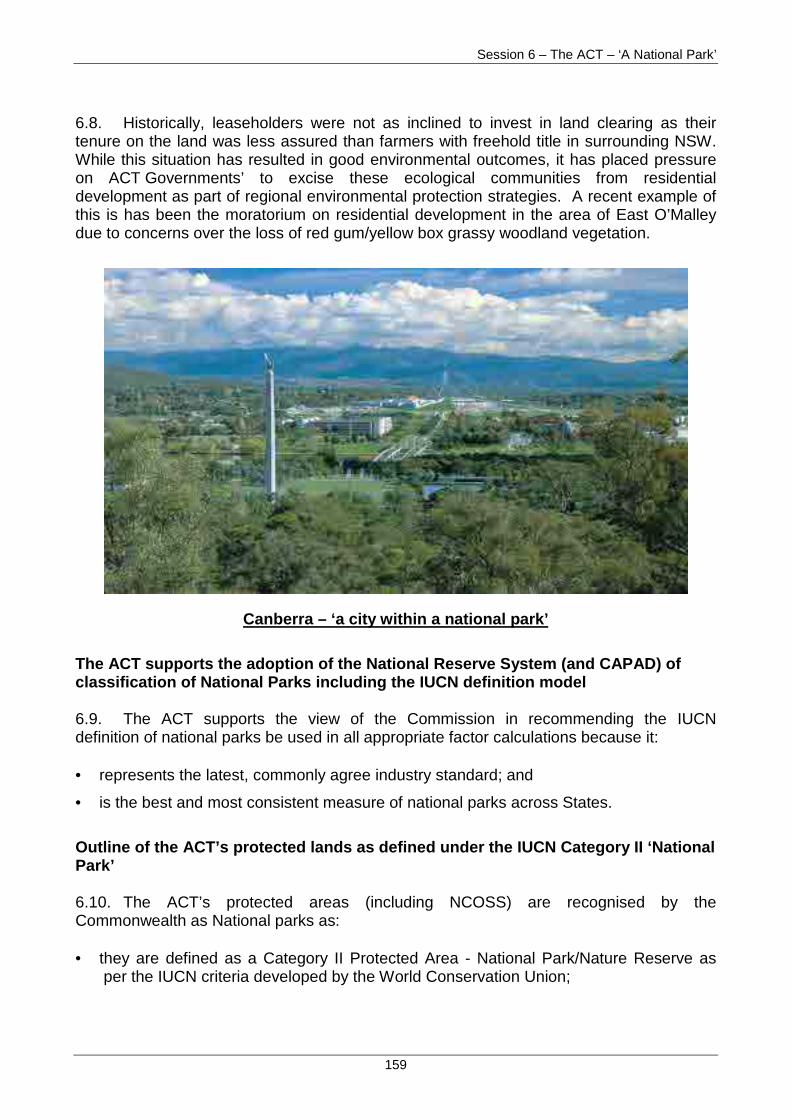
Session 6 – The ACT – ‘A National Park’
159
6.8. Historically, leaseholders were not as inclined to invest in land clearing as theirtenure on the land was less assured than farmers with freehold title in surrounding NSW.While this situation has resulted in good environmental outcomes, it has placed pressureon ACT Governments’ to excise these ecological communities from residentialdevelopment as part of regional environmental protection strategies. A recent example ofthis is has been the moratorium on residential development in the area of East O’Malleydue to concerns over the loss of red gum/yellow box grassy woodland vegetation.
Canberra – ‘a city within a national park’
The ACT supports the adoption of the National Reserve System (and CAPAD) ofclassification of National Parks including the IUCN definition model
6.9. The ACT supports the view of the Commission in recommending the IUCNdefinition of national parks be used in all appropriate factor calculations because it:
• represents the latest, commonly agree industry standard; and
• is the best and most consistent measure of national parks across States.
Outline of the ACT’s protected lands as defined under the IUCN Category II ‘NationalPark’
6.10. The ACT’s protected areas (including NCOSS) are recognised by theCommonwealth as National parks as:
• they are defined as a Category II Protected Area - National Park/Nature Reserve asper the IUCN criteria developed by the World Conservation Union;
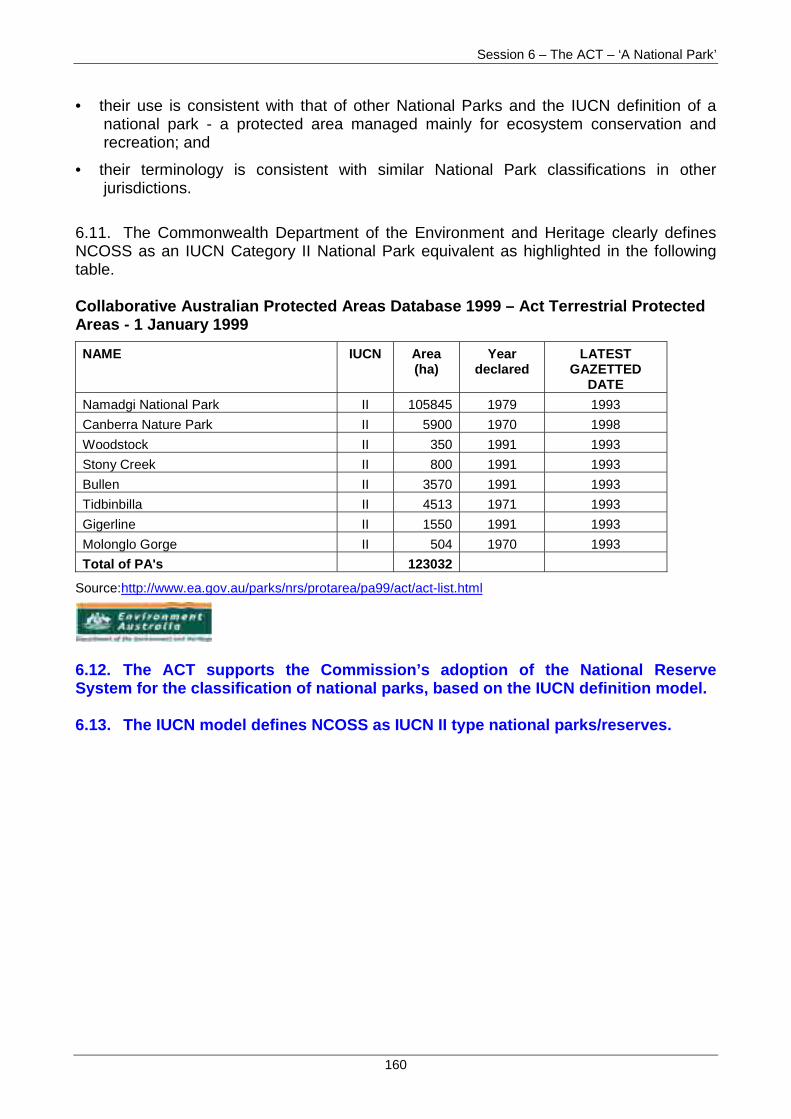
Session 6 – The ACT – ‘A National Park’
160
• their use is consistent with that of other National Parks and the IUCN definition of anational park - a protected area managed mainly for ecosystem conservation andrecreation; and
• their terminology is consistent with similar National Park classifications in otherjurisdictions.
6.11. The Commonwealth Department of the Environment and Heritage clearly definesNCOSS as an IUCN Category II National Park equivalent as highlighted in the followingtable.
Collaborative Australian Protected Areas Database 1999 – Act Terrestrial ProtectedAreas - 1 January 1999
NAME IUCN Area(ha)
Yeardeclared
LATESTGAZETTED
DATE
Namadgi National Park II 105845 1979 1993
Canberra Nature Park II 5900 1970 1998
Woodstock II 350 1991 1993
Stony Creek II 800 1991 1993
Bullen II 3570 1991 1993
Tidbinbilla II 4513 1971 1993
Gigerline II 1550 1991 1993
Molonglo Gorge II 504 1970 1993
Total of PA's 123032
Source:http://www.ea.gov.au/parks/nrs/protarea/pa99/act/act-list.html
6.12. The ACT supports the Commission’s adoption of the National ReserveSystem for the classification of national parks, based on the IUCN definition model.
6.13. The IUCN model defines NCOSS as IUCN II type national parks/reserves.
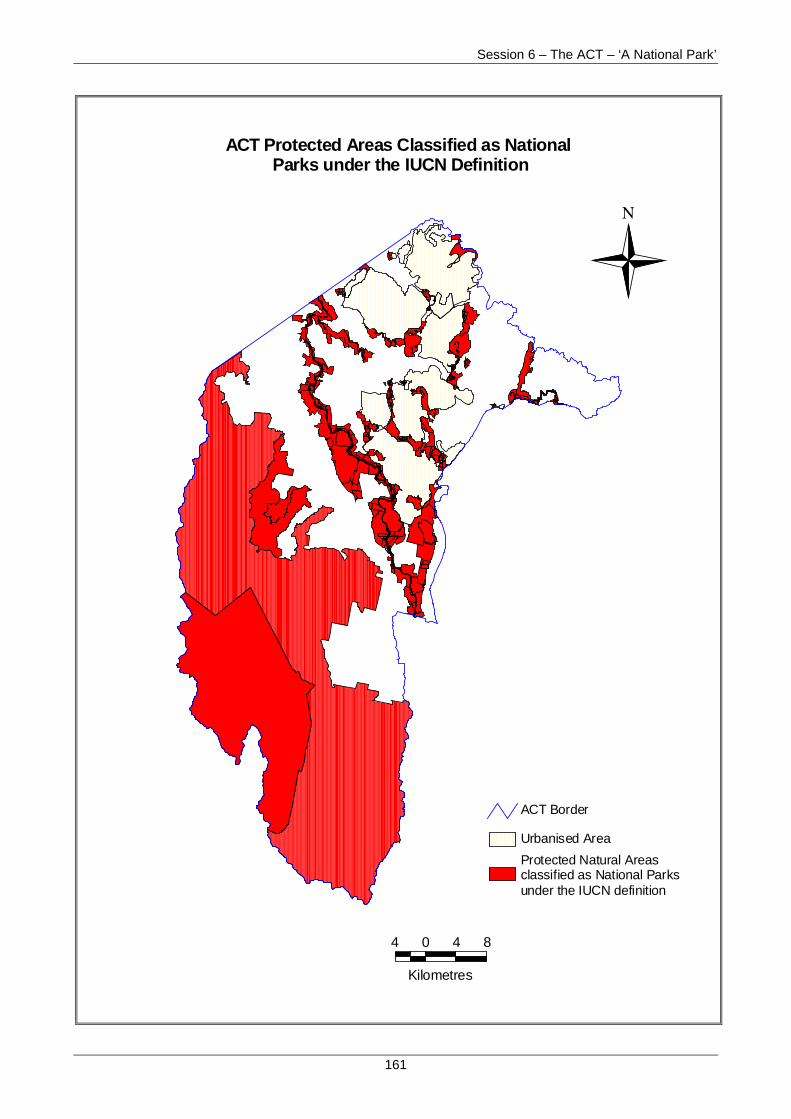
Session 6 – The ACT – ‘A National Park’
161
ACT Protected Areas Classified as National Parks under the IUCN Definition
N
Kilometres
4 0 4 8
Protected Natural Areas classified as National Parks under the IUCN definition
Urbanised Area
ACT Border
Session 6 – The ACT – ‘A National Park’
162
Introduction
6.14. This component of the session covers two assessment methods in its overalldisability calculations:
• visitor numbers and the impact of visitors; and
• conservation management costs resulting from populations contiguous to nationalparks.
6.15. Given Canberra’s unique position as a ‘city in a national park’, it is difficult for thetwo issues to be separated. Therefore, while the ACT is mindful of the distinction betweenthe two issues, both matters are covered in this section of the session.
Why the contiguous population next to all of the ACT’s IUCN II protected lands(including all protected areas) should be used in the calculation of the UrbanisationFactor
6.16. To determine the urbanisation factor, the extent of the contiguous populationeffecting national parks is calculated. This is done via a model based on:
• 100% of the urban population living within 0-10 kms of a national park; and
• 50% of the urban population living within 10-15 kms of a national park.
6.17. The ACT notes that in the National Parks and Wildlife Services Discussion Paper(CGC 2002/42), staff proposed to recommend to the Commission that “..there seems noreason to include NCOSS land data in the calculation of contiguous population.Discussions with the National Capital Authority during the 2001 Update suggested that theACT can determine the status of land where it is not covered under the National CapitalPlan (NCP). Therefore, there is no obvious reason why gazetting the NCOSS land as anational park would be inconsistent with the NCP.”
6.18. In response to this, the ACT notes that prior to ACT self-government, theCommonwealth gazetted most NCOSS lands as ‘national parks’. The ACT is not currentlyproposing to gazette the remaining NCOSS lands as national parks per se. However, inits Main Submission, the ACT was seeking recognition that all NCOSS land managed bythe Territory is subject to significant planning and land use constraints, as prescribed bythe NCP, and this represents a significant disability to the ACT.
6.19. The ACT accepts the Commission’s decision not to recognise the non-gazettedNCOSS lands as a national park in the determination of the urbanisation factor. However,the ACT continues to seek recognition of the constraints and disabilities placed on theTerritory by the NCP and NCOSS, and those areas of NCOSS that are gazetted asnational parks. These issues are covered in greater detail in the General Public Serviceschapter.
The Visitor Impact component and Urbanisation factor
Session 6 – The ACT – ‘A National Park’
163
6.20. It is important that all gazetted national parks within the NCOSS arerecognised for the purpose of calculating the urbanisation factor and theircontiguous populations.
6.21. In applying the urbanisation model, based on the IUCN II classification, the entireACT population, as well as the population of Queanbeyan and Jerrabomberra need to beincluded in the re-assessment.
6.22. With the Commission’s adoption of the IUCN classification and definition of nationalparks, the ACT seeks a re-assessment of its contiguous population to its national parks.Based on the contiguous population model for the urbanisation factor, the estimatedpopulations living within the defined radius of the ACT’s national parks would be:
• 0-10 kms – 354,370 42; and
• 10-15km – negligible.
Our residents are our park neighbours and our visitors - why the UrbanisationFactor is an important recognition for the ACT.
6.23. In the National Parks and Wildlife Services Discussion Paper (CGC 2002/42), staffindicated that they “…are not inclined to recommend to the Commission that theurbanisation factor be discontinued but would like some clearer evidence of the costrelationships.”
6.24. The following information is provided in response to the Commission’s request, andhighlights the extensive urbanisation impacts felt by the ACT and the associated costs thatthey place on the management of the National parks system in the ACT.
6.25. The Territory’s open space areas are readily accessible to visitors – local, regional,interstate and international. Indeed, visitor numbers to the ACT’s national parks in 2000-01 totalled 2,139,483 and in 2001-02 visitor numbers were 2,183,263. 43
6.26. In 2000-01, the ACT had average per capita visitor numbers of 6.97 44, compared toa national average of only 3.92. Only the Northern Territory had a higher average than theACT.
6.27. The reason why the ACT’s national parks have a high visitation rate is directlyrelated to its contiguous population. Many of the ACT’s national parks are located withinor directly bordering the urban area. As noted in the ACT’s Main Submission, thisinteraction results in various impacts including arson, wildlife predation by domestic
42 Source: 2001 ABS Data – figure of 354,370 comprises the ACT population of 321,680 and theQueanbeyan population of 32,690.43 Collecting Visitor Numbers - a combination of methods has been employed to collect visitor data for theACT’s protected national parks. The main method used has been traffic counters (Namadgi National Park,Murrumbidgee River Corridor, Googong Foreshores). Visitor to Tidbinbilla Nature Reserve are counted atthe point of entry (entry fees apply). Visitor numbers to the 27 units of Canberra Nature Park are based on acombination of beam counters and statistical estimations (there are too many access points to monitornumbers successfully).44 Source: Commonwealth Grants Commission Discussion Paper CGC 2002/42.
Session 6 – The ACT – ‘A National Park’
164
animals, illegal dumping of litter, removal of vegetation, erosion, inappropriate recreationalactivities and the spread of invasive weeds.
6.28. The majority of resources allocated to the management of these parks are directedto controlling population and visitor impacts on the park environment. The ease of accessto the ACT’s national parks provide a ‘backyard’ recreational resource for the ACT’sresidents and major challenges for our park managers tasked with protection of theirlandscape, ecological and heritage values.
6.29. The close proximity of bushland areas to Canberra residents also increasesdemand for urban wildlife assistance and adds significant complexity to wildlifemanagement issues - see the following box for further information.
SHARING OUR ENVIRONMENT- THE URBAN WILDLIFE PROGRAM
As a backdrop to the nation’s capital, Canberra Nature Park comprises 27 conservationreserves totalling approximately 6,000 hectares. These reserves provide corridors for themovement of wildlife to other areas of habitat beyond the urban area. Their close proximityto the suburbs results in a high level of interaction between wildlife and the community.
Environment ACT manages an Urban Wildlife Program to respond to urgent wildlife calls andprovide advice on a range of wildlife matters. Some of these issues occur all year roundwhile others are seasonal such as swooping magpies in the spring, snakes in backyardsduring the summer and possums trapped in fireplaces in winter.
During 2001, 3926 calls were received of which 44% were resolved through advice and 56%required a call out. This involved over 100 different species of wildlife and exotic animals,the most common being eastern grey kangaroos, possums, snakes, magpies, bats andfrogs. Some of the more unusual calls have included an emu chick found in a back yard, asugar glider in a letterbox, a bird eating spider in a supermarket fruit box, and feral pigs inbackyards.
Kangaroo issues are the greatest number of calls received and amount to one third of thetotal yearly calls. Kangaroos move freely around the reserves, unleased and agriculturalland. Major arterial roads that connect the major town centres bisect these areas. The callsreceived relate to animals, which have been killed or injured by motor vehicles. In 2001, 269kangaroos were euthanased and another 487 carcasses were removed from the roads. Oneof the strategies employed to reduce the number of road kills has been the installation ofsigns on roadsides, which are considered to be kangaroo ‘hotspots’.
Snakes are the most feared wildlife in Canberra. Lizards are often mistaken for snakes,particularly the eastern blue tongue lizard that is quite common and often takes up residencein gardens. Seven percent of the total annual calls received in 2001 were in relation to snakeissues. The most common snake call is for eastern browns, followed by red-bellied blacksnake and tiger snakes. Rangers will attend a call out if the snake is trapped in a building orinjured. To be able to catch a snake, rangers are required to attend a three-day course inthe handling of venomous snakes.
The magpie-breeding season occurs during the months of August to November. In 2001, 254calls were received resulting in 82% requiring a call out and in some cases a multiple callout. This is a particularly emotional time not only for those who are being swooped but alsofor rangers who have to pacify hysterical complainants. Staff are given training in conflictresolution and dealing with aggressive callers. In most of the cases advice is given,brochures are posted out and warning signs are erected for the duration of the swoopingperiod. Magpies that are striking are translocated.
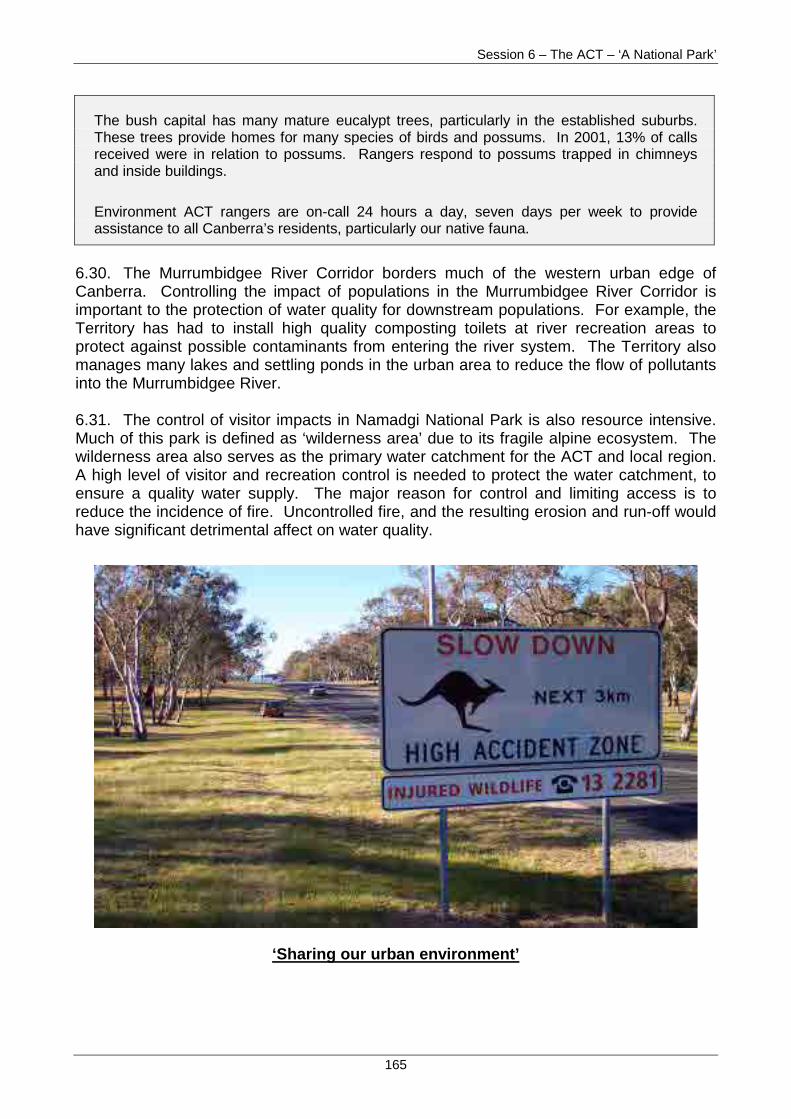
Session 6 – The ACT – ‘A National Park’
165
The bush capital has many mature eucalypt trees, particularly in the established suburbs.These trees provide homes for many species of birds and possums. In 2001, 13% of callsreceived were in relation to possums. Rangers respond to possums trapped in chimneysand inside buildings.
Environment ACT rangers are on-call 24 hours a day, seven days per week to provideassistance to all Canberra’s residents, particularly our native fauna.
6.30. The Murrumbidgee River Corridor borders much of the western urban edge ofCanberra. Controlling the impact of populations in the Murrumbidgee River Corridor isimportant to the protection of water quality for downstream populations. For example, theTerritory has had to install high quality composting toilets at river recreation areas toprotect against possible contaminants from entering the river system. The Territory alsomanages many lakes and settling ponds in the urban area to reduce the flow of pollutantsinto the Murrumbidgee River.
6.31. The control of visitor impacts in Namadgi National Park is also resource intensive.Much of this park is defined as ‘wilderness area’ due to its fragile alpine ecosystem. Thewilderness area also serves as the primary water catchment for the ACT and local region.A high level of visitor and recreation control is needed to protect the water catchment, toensure a quality water supply. The major reason for control and limiting access is toreduce the incidence of fire. Uncontrolled fire, and the resulting erosion and run-off wouldhave significant detrimental affect on water quality.
‘Sharing our urban environment’
Session 6 – The ACT – ‘A National Park’
166
The relationship between populations contiguous to the ACT’s national parks andconservation costs and visitor costs
6.32. Environment ACT does not capture expenditure breakdowns between conservationcosts and visitor costs, particularly as there is often an interrelationship between the twofactors.
6.33. The ACT would consider the component weights between the two factors would bedependent on a number of issues including the distance from populations and theparticular environmental system being managed. As such, the factor percentages wouldvary between national parks.
6.34. In the ACT’s case, it is estimated that the visitor component should be weightedhigher than conservation component given the relatively high visitor numbers and theimpacts of our visitors.
6.35. In this light, the ACT supports the retention of the current Visitor impactComponent weight of 46.28%, and the Conservation component weight of 36.33%.
6.36. The Urbanisation and Visitor Impact models are an important recognition forthe ACT given the close interaction between residents, visitors and its nationalparks. The ACT supports the retention of the current methods used to assess theurbanisation and visitor factors, and component weights.
6.37. However, based on the urbanisation model and the IUCN National Parkdefinition (and the fact that significant areas of NCOSS contain gazetted nationalparks), a re-calculation of the model shows the entire population of the ACT andimmediate surrounds needs to be included in the assessment.
Overview of the ACT’s Physical Environment
6.38. The ACT is only 2360 km2 yet it contains a rich diversity of flora and fauna typical ofthe southern tablelands region, from valley floor grasslands and woodlands, throughextensive montane forests, to treeless sub-alpine wetlands and rocky habitats. For manyplants and animals, the ACT is on the fringe of their natural distribution, whether they aremore commonly found in alpine environments to the south, drier habitats to the west,coastal escarpments to the east or warmer places to the north.
6.39. The pattern and term of rural land leases has resulted in the preservation ofnumerous areas of natural habitat which now offer refuge to a variety of plants andanimals that are threatened or declining in surrounding parts of NSW. The nature of ACTland practices and leasing arrangements means that much of the important regionalecologies communities are now located within the ACT.
6.40. Diversity is particularly high amongst bird species, many of which have adapted toCanberra’s urban areas. The conservation status of bird species in the ACT has been welldocumented, largely due to their ease of observation and significant interest amongst the
The Physical Environment Factor
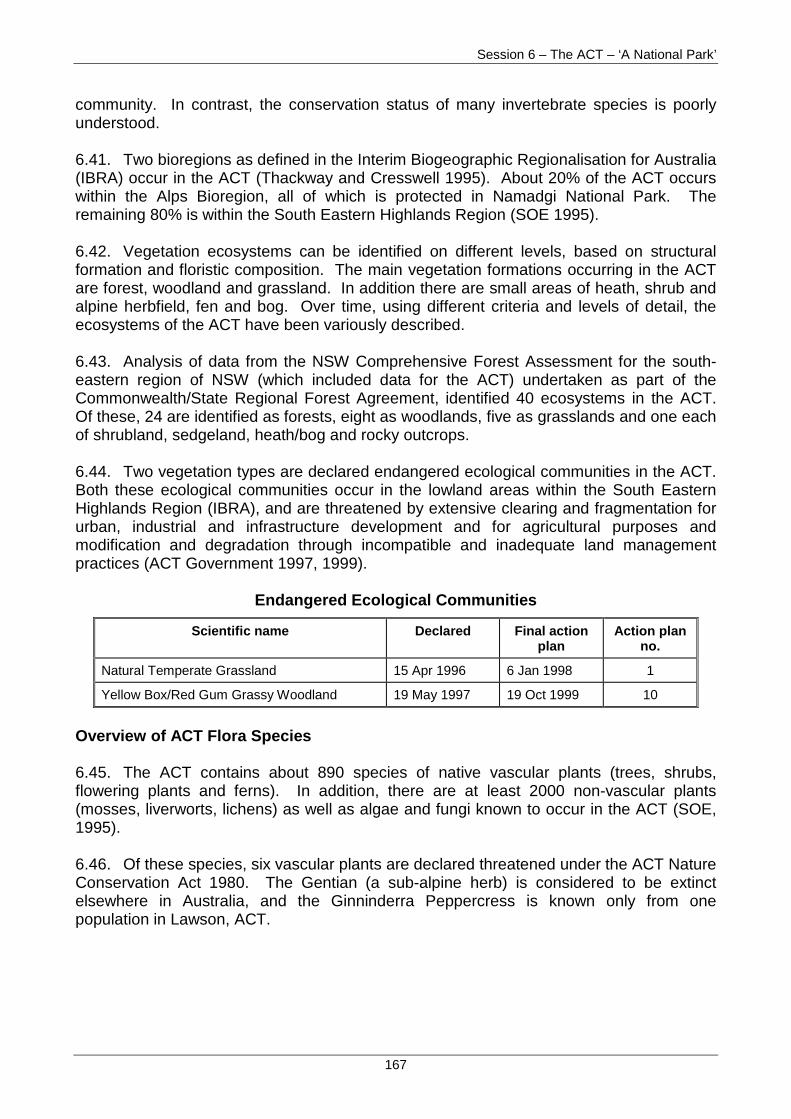
Session 6 – The ACT – ‘A National Park’
167
community. In contrast, the conservation status of many invertebrate species is poorlyunderstood.
6.41. Two bioregions as defined in the Interim Biogeographic Regionalisation for Australia(IBRA) occur in the ACT (Thackway and Cresswell 1995). About 20% of the ACT occurswithin the Alps Bioregion, all of which is protected in Namadgi National Park. Theremaining 80% is within the South Eastern Highlands Region (SOE 1995).
6.42. Vegetation ecosystems can be identified on different levels, based on structuralformation and floristic composition. The main vegetation formations occurring in the ACTare forest, woodland and grassland. In addition there are small areas of heath, shrub andalpine herbfield, fen and bog. Over time, using different criteria and levels of detail, theecosystems of the ACT have been variously described.
6.43. Analysis of data from the NSW Comprehensive Forest Assessment for the south-eastern region of NSW (which included data for the ACT) undertaken as part of theCommonwealth/State Regional Forest Agreement, identified 40 ecosystems in the ACT.Of these, 24 are identified as forests, eight as woodlands, five as grasslands and one eachof shrubland, sedgeland, heath/bog and rocky outcrops.
6.44. Two vegetation types are declared endangered ecological communities in the ACT.Both these ecological communities occur in the lowland areas within the South EasternHighlands Region (IBRA), and are threatened by extensive clearing and fragmentation forurban, industrial and infrastructure development and for agricultural purposes andmodification and degradation through incompatible and inadequate land managementpractices (ACT Government 1997, 1999).
Endangered Ecological Communities
Scientific name Declared Final actionplan
Action planno.
Natural Temperate Grassland 15 Apr 1996 6 Jan 1998 1
Yellow Box/Red Gum Grassy Woodland 19 May 1997 19 Oct 1999 10
Overview of ACT Flora Species
6.45. The ACT contains about 890 species of native vascular plants (trees, shrubs,flowering plants and ferns). In addition, there are at least 2000 non-vascular plants(mosses, liverworts, lichens) as well as algae and fungi known to occur in the ACT (SOE,1995).
6.46. Of these species, six vascular plants are declared threatened under the ACT NatureConservation Act 1980. The Gentian (a sub-alpine herb) is considered to be extinctelsewhere in Australia, and the Ginninderra Peppercress is known only from onepopulation in Lawson, ACT.
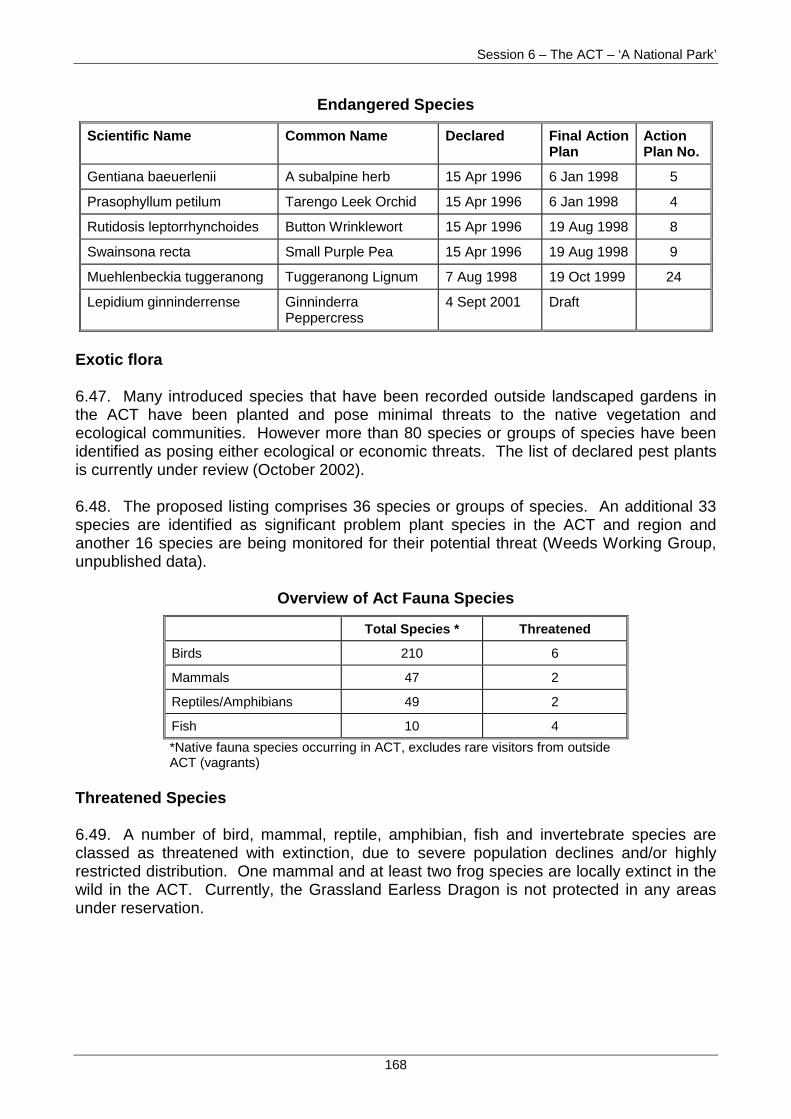
Session 6 – The ACT – ‘A National Park’
168
Endangered Species
Scientific Name Common Name Declared Final ActionPlan
ActionPlan No.
Gentiana baeuerlenii A subalpine herb 15 Apr 1996 6 Jan 1998 5
Prasophyllum petilum Tarengo Leek Orchid 15 Apr 1996 6 Jan 1998 4
Rutidosis leptorrhynchoides Button Wrinklewort 15 Apr 1996 19 Aug 1998 8
Swainsona recta Small Purple Pea 15 Apr 1996 19 Aug 1998 9
Muehlenbeckia tuggeranong Tuggeranong Lignum 7 Aug 1998 19 Oct 1999 24
Lepidium ginninderrense GinninderraPeppercress
4 Sept 2001 Draft
Exotic flora
6.47. Many introduced species that have been recorded outside landscaped gardens inthe ACT have been planted and pose minimal threats to the native vegetation andecological communities. However more than 80 species or groups of species have beenidentified as posing either ecological or economic threats. The list of declared pest plantsis currently under review (October 2002).
6.48. The proposed listing comprises 36 species or groups of species. An additional 33species are identified as significant problem plant species in the ACT and region andanother 16 species are being monitored for their potential threat (Weeds Working Group,unpublished data).
Overview of Act Fauna Species
Total Species * Threatened
Birds 210 6
Mammals 47 2
Reptiles/Amphibians 49 2
Fish 10 4
*Native fauna species occurring in ACT, excludes rare visitors from outsideACT (vagrants)
Threatened Species
6.49. A number of bird, mammal, reptile, amphibian, fish and invertebrate species areclassed as threatened with extinction, due to severe population declines and/or highlyrestricted distribution. One mammal and at least two frog species are locally extinct in thewild in the ACT. Currently, the Grassland Earless Dragon is not protected in any areasunder reservation.
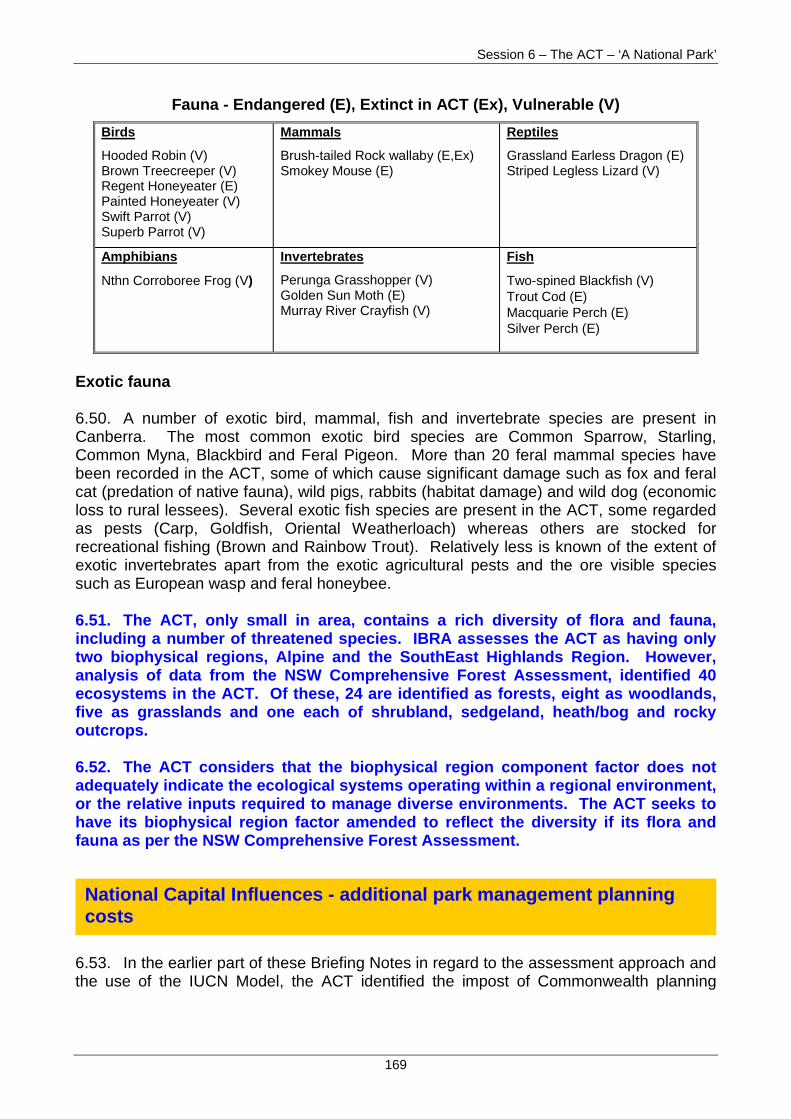
Session 6 – The ACT – ‘A National Park’
169
Fauna - Endangered (E), Extinct in ACT (Ex), Vulnerable (V)
Birds
Hooded Robin (V)Brown Treecreeper (V)Regent Honeyeater (E)Painted Honeyeater (V)Swift Parrot (V)Superb Parrot (V)
Mammals
Brush-tailed Rock wallaby (E,Ex)Smokey Mouse (E)
Reptiles
Grassland Earless Dragon (E)Striped Legless Lizard (V)
Amphibians
Nthn Corroboree Frog (V)
Invertebrates
Perunga Grasshopper (V)Golden Sun Moth (E)Murray River Crayfish (V)
Fish
Two-spined Blackfish (V)Trout Cod (E)Macquarie Perch (E)Silver Perch (E)
Exotic fauna
6.50. A number of exotic bird, mammal, fish and invertebrate species are present inCanberra. The most common exotic bird species are Common Sparrow, Starling,Common Myna, Blackbird and Feral Pigeon. More than 20 feral mammal species havebeen recorded in the ACT, some of which cause significant damage such as fox and feralcat (predation of native fauna), wild pigs, rabbits (habitat damage) and wild dog (economicloss to rural lessees). Several exotic fish species are present in the ACT, some regardedas pests (Carp, Goldfish, Oriental Weatherloach) whereas others are stocked forrecreational fishing (Brown and Rainbow Trout). Relatively less is known of the extent ofexotic invertebrates apart from the exotic agricultural pests and the ore visible speciessuch as European wasp and feral honeybee.
6.51. The ACT, only small in area, contains a rich diversity of flora and fauna,including a number of threatened species. IBRA assesses the ACT as having onlytwo biophysical regions, Alpine and the SouthEast Highlands Region. However,analysis of data from the NSW Comprehensive Forest Assessment, identified 40ecosystems in the ACT. Of these, 24 are identified as forests, eight as woodlands,five as grasslands and one each of shrubland, sedgeland, heath/bog and rockyoutcrops.
6.52. The ACT considers that the biophysical region component factor does notadequately indicate the ecological systems operating within a regional environment,or the relative inputs required to manage diverse environments. The ACT seeks tohave its biophysical region factor amended to reflect the diversity if its flora andfauna as per the NSW Comprehensive Forest Assessment.
6.53. In the earlier part of these Briefing Notes in regard to the assessment approach andthe use of the IUCN Model, the ACT identified the impost of Commonwealth planning
National Capital Influences - additional park management planningcosts
Session 6 – The ACT – ‘A National Park’
170
requirements, articulated through the National Capital Plan, which results in 53% of theACT being defined as a national park.
6.54. In terms of the urbanisation factor and visitor impact component, the ACT identifiedthe unique challenges it faces in managing a ‘city within a national park’. Also identifiedwas a sample of the broader park management issues that the Territory faces when tryingto balance the competing needs of conservation and recreational use.
6.55. The ACT is seeking recognition of the additional park management planning costs itfaces as a result of its special circumstances through which it inherited land from theCommonwealth and continues to be controlled by Commonwealth planning policies.
6.56. In the National Parks and Wildlife Services Discussion Paper (CGC 2002/42), staffpropose to recommend to the Commission that “…a national capital factor be introduced torecognise the cost impact of the NCA and the National Capital Plan on managementscosts of the Canberra Nature Park.”
6.57. The following information provides additional data and information in support of thisclaim.
6.58. The ACT recognises that all States face costs in relation to National Park planningservices. However, the ACT considers it faces greater disabilities in relation to parkmanagement planning than other States due to its special circumstances resulting from:
• its greater than average area of national park land (53% of the ACT) it has inherited asa direct consequence of Commonwealth planning policy;
• the diverse nature of the protected lands that it is required to plan and manageincluding a range of environments including alpine areas, open woodlands and riverineecosystems;
• the continued influence and control of the Commonwealth through the requirements ofthe National Capital Plan and the need to obtain planning and works approvals fromthe National Capital Authority; and
• the impact of a large population neighbouring its national parks.
6.59. The biggest challenge for the ACT Government is to find a balance betweenconservation and recreation which meets the community’s expectations but does notcompromise the conservation values of the park required by the National Capital Plan.
6.60. In planning and constructing the ‘bush capital’, the Commonwealth hasprovided present and future generations of Australians with a valuableenvironmental legacy. However, this legacy, and the continuing control by theCommonwealth does create additional planning costs for ACT park managers.While all States have planning cost issues, the ACT has inherited a ‘city within anational park’, a unique situation that has resulted in additional cost disabilities forthe Territory.
6.61. Some examples of additional planning requirements as a result of National CapitalInfluences include:
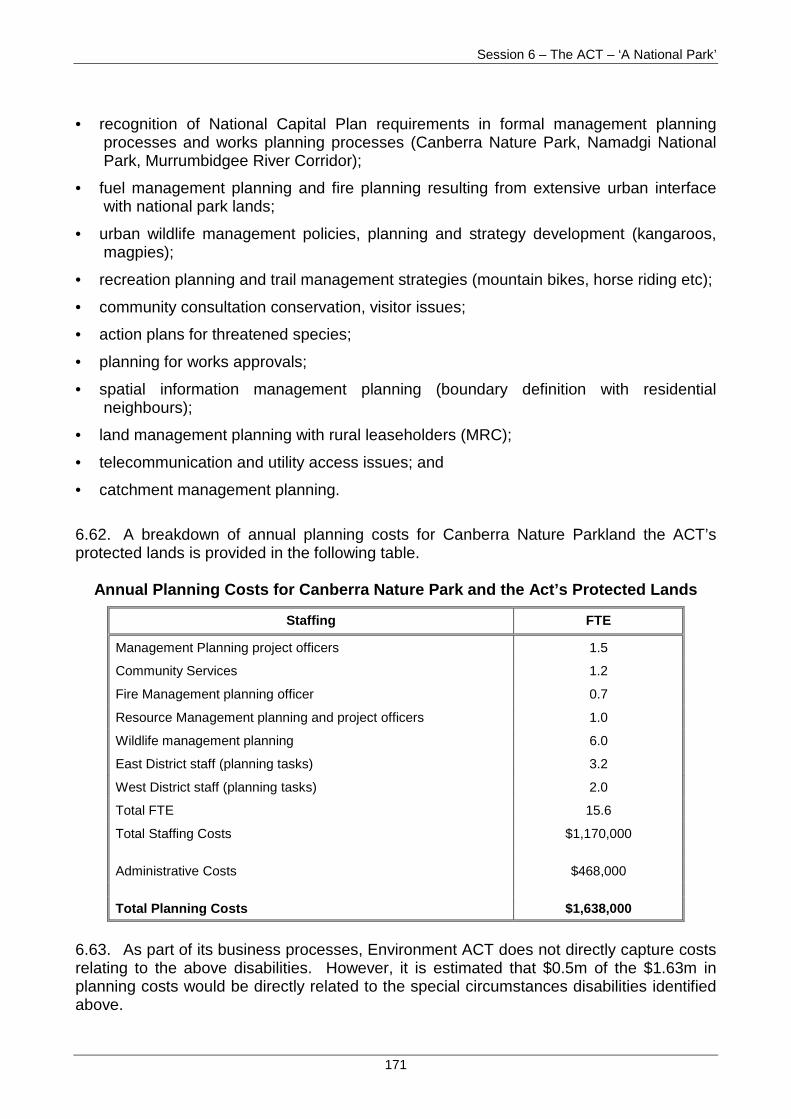
Session 6 – The ACT – ‘A National Park’
171
• recognition of National Capital Plan requirements in formal management planningprocesses and works planning processes (Canberra Nature Park, Namadgi NationalPark, Murrumbidgee River Corridor);
• fuel management planning and fire planning resulting from extensive urban interfacewith national park lands;
• urban wildlife management policies, planning and strategy development (kangaroos,magpies);
• recreation planning and trail management strategies (mountain bikes, horse riding etc);
• community consultation conservation, visitor issues;
• action plans for threatened species;
• planning for works approvals;
• spatial information management planning (boundary definition with residentialneighbours);
• land management planning with rural leaseholders (MRC);
• telecommunication and utility access issues; and
• catchment management planning.
6.62. A breakdown of annual planning costs for Canberra Nature Parkland the ACT’sprotected lands is provided in the following table.
Annual Planning Costs for Canberra Nature Park and the Act’s Protected Lands
Staffing FTE
Management Planning project officers 1.5
Community Services 1.2
Fire Management planning officer 0.7
Resource Management planning and project officers 1.0
Wildlife management planning 6.0
East District staff (planning tasks) 3.2
West District staff (planning tasks) 2.0
Total FTE 15.6
Total Staffing Costs $1,170,000
Administrative Costs $468,000
Total Planning Costs $1,638,000
6.63. As part of its business processes, Environment ACT does not directly capture costsrelating to the above disabilities. However, it is estimated that $0.5m of the $1.63m inplanning costs would be directly related to the special circumstances disabilities identifiedabove.
Session 6 – The ACT – ‘A National Park’
172
6.64. The additional cost to the ACT of meeting these increased planningrequirements is assessed at 30% or $0.5m.
An Overview of Joint Management Arrangements for Namadgi National Park
6.65. Under the April 2001 Agreement between the Territory and ACT Native Title ClaimGroups, the ACT Government has offered to grant a Special Aboriginal Lease to theNamadgi Aboriginal group that will confer the following rights and privileges:
• to participate in the management of Namadgi National Park;
• to be consulted on specific regional cultural issues; and
• to be consulted on the development of amendments to legislation that will impact onNamadgi National Park.
6.66. The terms and conditions of the lease will be the subject of negotiation between theparties to the Agreement upon withdrawal or determination of all native title claims over theTerritory.
6.67. Interim arrangements will apply until the lease is put in place. An Interim NamadgiAdvisory Board has been appointed and is working with Environment ACT on thepreparation of a new Plan of Management for Namadgi National Park as well as on arange of projects aimed at addressing specific issues of concern to the Ngunnawalcommunity.
Demands and costs placed on the ACT by the indigenous population in respect ofaboriginal involvement in parks
6.68. Demands and costs arising from Aboriginal involvement in the joint management ofNamadgi National Park include:
• extended consultation processes because of the preference of the Ngunnawalcommunity to achieve consensus in decision making;
• duplication of effort because of tensions and divisions within the community that resultin a need to meet separately with each recognised Aboriginal organisation;
• protracted briefing processes because of the limited knowledge of many members ofthe Ngunnawal community of the process of management of protected areas;
• less efficient communication practices because of the lack of access by members ofthe Ngunnawal community to e-mail and telephone services;
• travel associated with the need to engage with members of the Ngunnawal communitywho are dispersed through a number of towns outside the ACT, includingQueanbeyan, Yass, Goulburn, Tumut, Brungle and Cowra;
Aboriginal Involvement in Parks – ‘Ngunnawal Country’
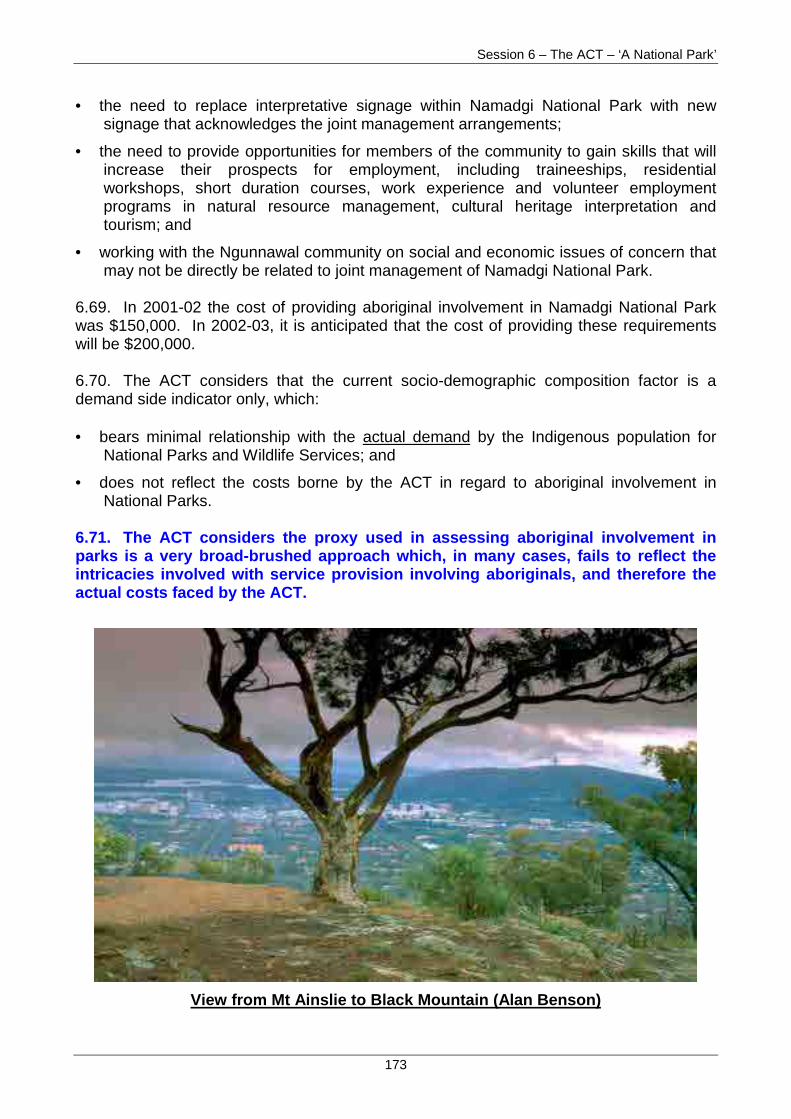
Session 6 – The ACT – ‘A National Park’
173
• the need to replace interpretative signage within Namadgi National Park with newsignage that acknowledges the joint management arrangements;
• the need to provide opportunities for members of the community to gain skills that willincrease their prospects for employment, including traineeships, residentialworkshops, short duration courses, work experience and volunteer employmentprograms in natural resource management, cultural heritage interpretation andtourism; and
• working with the Ngunnawal community on social and economic issues of concern thatmay not be directly be related to joint management of Namadgi National Park.
6.69. In 2001-02 the cost of providing aboriginal involvement in Namadgi National Parkwas $150,000. In 2002-03, it is anticipated that the cost of providing these requirementswill be $200,000.
6.70. The ACT considers that the current socio-demographic composition factor is ademand side indicator only, which:
• bears minimal relationship with the actual demand by the Indigenous population forNational Parks and Wildlife Services; and
• does not reflect the costs borne by the ACT in regard to aboriginal involvement inNational Parks.
6.71. The ACT considers the proxy used in assessing aboriginal involvement inparks is a very broad-brushed approach which, in many cases, fails to reflect theintricacies involved with service provision involving aboriginals, and therefore theactual costs faced by the ACT.
View from Mt Ainslie to Black Mountain (Alan Benson)
Session 6 – The ACT – ‘A National Park’
174
(B) SERVICES TO INDUSTRY – FORESTRY
Deeks Forest
Deeks Forest Park is part of ACT Forests’ managed commercial plantations, with someplantings dating from 1928. It is one of the most heavily visited plantations in the ACT dueto its proximity to the southwestern suburbs of Canberra and the variety of forestrecreational opportunities present.
In 2000-01 the ACT Government provided capital works funding of $110,000 to upgraderecreational facilities in the main recreational site. The facilities are used by a wide rangeof groups and individuals, including picnickers walkers, runners, horse riders, mountainbike riders, sled dogs, car rallies etc.
Tony Bartlett is the Director of ACT Forests.
Mr Bartlett is responsible for oversight of the ACT Government’s commercial forestryoperations as well the management of forest recreation and protection of heritage sites inthe plantations. He is also a Deputy Chief Fire Control Officer in the ACT Bushfire Serviceand ACT Forests plays a major role in bushfire management in the ACT.
Tony previously worked in Department of Natural Resources and Environment in Victoria.He has qualifications in Forestry and a Master in Science from the University of Oxford.
Session Objectives
• This session will demonstrate to the Commission that:
− the planning and development of Canberra prior to self-government led to theintegration of the forest plantation with urban areas and designated parks andreserves;
− ACT forests accommodate a wide range of uses for the benefit of ACT,interstate and international visitors; and
− urban creep on the boundaries of the forests impacts on the viability ofcommercial forest plantations, due to the additional costs from providingcommunity services and operational restrictions.
Venue
Presenters
Session 6 – The ACT – ‘A National Park’
175
Gordon Davidson is Executive Director of City Management.
Mr Davidson’s responsibilities include the management of Canberra’s roads andstormwater, parks and precincts, ACT Forests, waste management and the delivery of themajority of roads, stormwater and public place capital works projects.
Gordon holds qualifications in engineering and he has extensive experience ininfrastructure development, management and maintenance. Mr Davidson has worked inthe Shoalhaven Shire Council, the National Capital Development Commission and theACT Government.
6.72. The ACT has 16,200 hectares of land under commercial forest plantation, primarilyused for pine plantations. This represents 6% of the Territory’s total land area, which is asignificantly higher proportion devoted to forest plantations than in other jurisdictions. TheACT submission also identified that 100% of the ACT population resides within 10km ofnational parks, as classified under the IUCN definition.
6.73. The following figure shows the extent of the integration of the urban areas andcommercial forest areas in the Territory. This is an improved map to the one provided inthe Main Submission. It should be noted that 65% of the Stromlo plantation is designatedland under the National Capital Plan.
6.74. The main issue in the ACT Main Submission was the national capital impacts on theoperations of the ACT’s only forestry operator, ACT Forests. The forestry operations andsystems inherited by the ACT from the Commonwealth means that:
National Capital Influences – Primary Industry Forests
• The interruption of the usual business of the forestry agency results in significanteconomic costs, via higher expenditure and reduced revenues to the ACT, drivenby the:
− special requirements laid down by the Commonwealth on the ACT to managethese areas through the National Capital Plan; and
− extent of the integration of the urban areas and commercial forest areas in theTerritory.
• The ACT requested an assessment of the national capital impacts on the Territory’scommercial forestry operations, totalling $300,000 per annum.
Key Points from the ACT Main Submission
National Capital Influences
Overview of Service Delivery in the ACT
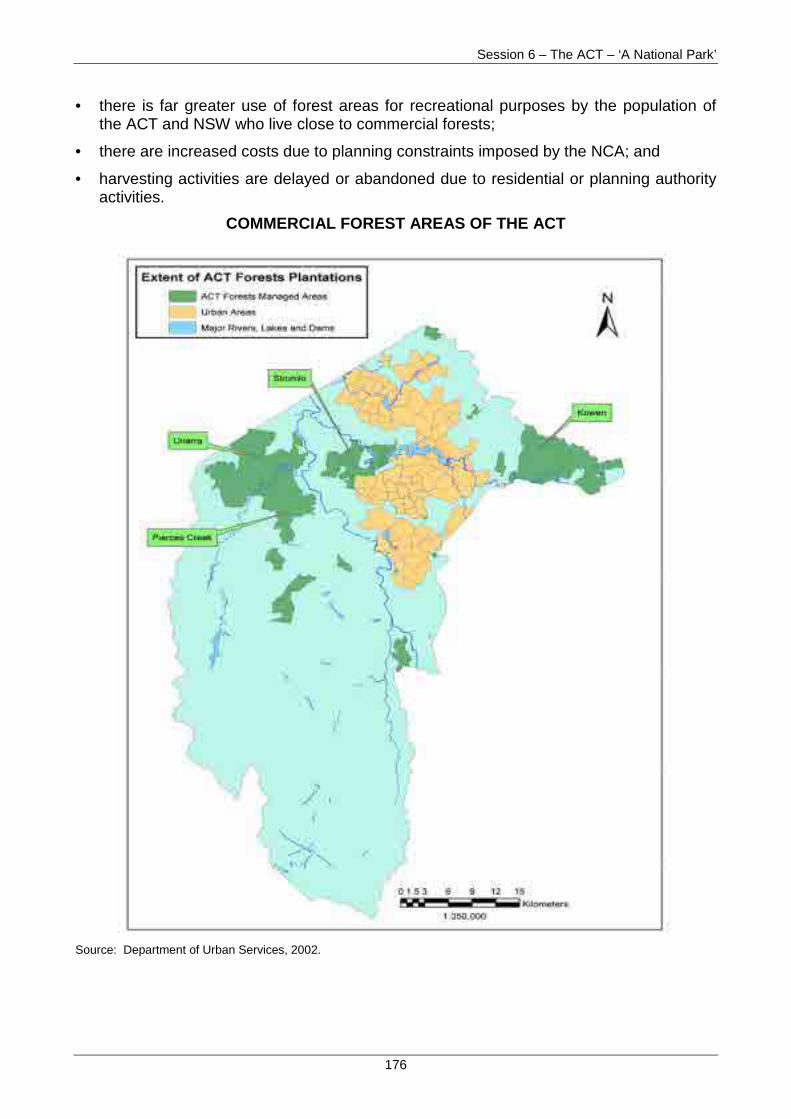
Session 6 – The ACT – ‘A National Park’
176
• there is far greater use of forest areas for recreational purposes by the population ofthe ACT and NSW who live close to commercial forests;
• there are increased costs due to planning constraints imposed by the NCA; and
• harvesting activities are delayed or abandoned due to residential or planning authorityactivities.
COMMERCIAL FOREST AREAS OF THE ACT
Source: Department of Urban Services, 2002.
Session 6 – The ACT – ‘A National Park’
177
6.75. The ACT notes that in the CGC Discussion Paper 2002/38 in principle agreement isprovided for the additional costs imposed on the ACT (and in particular ACT Forests)because of the Commonwealth’s policies (such as proximity of plantations to urbanpopulations and the subsequent high level of recreational use of forest areas) and theNational Capital Plan.
6.76. ACT Forests does face significant urbanisation issues and costs as a result of theCommonwealth policies that created a commercial forest within the urban environment.
Additional Costs
6.77. Although the ACT Government provides funding to ACT Forests for services inrespect of the public’s use of facilities and amenities within land areas they manage, thereremains costs which are not covered by such funding, and which relate directly to thisnational capital influence.
6.78. Some of the costs that ACT Forests incurs, yet does not receive reimbursement forinclude:
• increased expenditure on public safety, in the form of above standard notifications andarrangements to allow tree management, harvesting and land management activities inclose proximity to urban populations and the transport network that runs through theforest areas – the additional costs for these activities is $10,000 per annum; and
• weed and feral animal management, mainly due to the proximity of forests to suburbanareas. Weeds are introduced into the forest area through the high use of forests byCanberrans and interstate visitors and by birds who spread weeds from suburbangardens. Domestic animals (generally pets) access forests and add to the difficulties inmanaging feral animals – the additional costs for these activities are$160,000 per annum.
6.79. Additionally, ACT Forests faces additional costs due to constraints imposed eitherby the National Capital Authority or due to planning issues. However, it is difficult toprecisely measure the additional impost faced by the Territory.
Planning Constraints
6.80. The ACT faces a number of planning constraints imposed by the NCA regarding theclearing of areas of forest that impact on normal timber harvesting operations. Theseconstraints include:
• restrictions where clearing is in clear sight of the national capital landscape;
• special requirements being placed on managing certain areas;
• the inability to either add or remove land used for plantation forestry in the ACT withouta change to the National Capital Plan; and
• the extent of forestry land which is designated land.
Session 6 – The ACT – ‘A National Park’
178
Other Constraints
6.81. Further, the ACT is limited by urban encroachment on the operations of ACTForests. For example harvesting activities are limited due to:
• perception that pine plantations adjacent to suburban areas are an aesthetic andrecreational amenity for the use of the urban population;
• Commonwealth forest user groups, such as the Australian Defence Forces and theAustralian Federal Police claiming priority rights on blocks of forest; and
• tourism operators place political pressure for large urban corridors within forests to beretained or extended, such as at the Corin Forest Recreational area at Mount Gibraltar.
6.82. Some specific examples of constraints that exist, yet are hard to quantify include:
• the limitation of harvesting on the land between Lady Denman Drive and Lake BurleyGriffin – although this has been negated by the fires that destroyed much of that part ofthe estate;
• objections from the local community that caused the rescheduling of harvesting atNarrabundah Hill – with the consequent deferral of $1.0m of log sales;
• revenue losses incurred when delays or limitations cause trees to grow beyond themaximum merchantable diameter.
• the reclamation of parcels of forest area for urban uses, such as the establishment ofthe suburb of Isaacs and a parcel of land in Weston now used for the Orana School,which incidentally is seeking further parcels of forest to enable the school’s expansion.
6.83. Attempts to attain land elsewhere in the ACT are limited partly because of theboundaries of the Territory and partly because of the National Capital Plan and itsimplications for the design and development of Canberra.
6.84. The impacts on ACT Forests include restrictions on silviculture practices in areasrecently harvested to meet aesthetic, fuel management and community use objectives asopposed to commercial objectives – this results in compromises in commercial weedcontrol mechanisms, fuel management systems that are estimated to create an additionalcost of approximately $130,000 each year.
6.85. The constraints on ACT Forests also creates commercial revenue losses throughdelays in or loss of harvesting opportunities. These costs are being examined further andshould they be significant details and calculations will be provided in the course of the2004 Review.
6.86. The ACT considers that the National Capital Plan and the requirementsimposed by the Commonwealth places unavoidable imposts on the Territory’sforestry operations. The Commonwealth’s policies have created a commercialforest within an urban environment.
Conclusion

Session 7 – Education – High Participation & Retention Rates’
179
DAY TWO
THURSDAY, 14 NOVEMBER 2002
SESSION 7. – ‘EDUCATION – 'HIGH PARTICIPATION ANDRETENTION RATES, THE WAY FORWARD'’:
(A) Schools Education.
(B) Planning Issues – National Capital Influences – Gungahlin DrivePresentation
Session 7 – Education – High Participation & Retention Rates’
180
(A) SCHOOLS EDUCATION
Session Objectives
Post-compulsory Participation Rates
• To reinforce the fact that ACT’s high post-compulsory participation rates result fullyfrom social and economic factors, such as the socio-demographic nature of theACT and the nature of its industry and occupational profile, and not from abovestandard service provision or ACT policy influences.
• The quantitative analysis undertaken by NATSEM and presented in the ACT’sMain Submission, highlights empirically that the ACT’s high participation rates inthe post-compulsory years of schooling are driven by a range of non-policy issueswhich results in an above standard demand for education, increasing the cost ofservice provision.
• Many of the arguments that have been presented to date by the Commission andthe States are based on anecdotal evidence only. It is imperative that thisimportant issue is resolved based on the readily available data rather thananecdotal evidence or pre-conceived perceptions given:
− the amount of funding this shifts between jurisdictions each year, based on‘purported’ anecdotal evidence; and
− that other assessments have used regression analysis to support the methodsused and adopted by the Commission.
• Given that the purported policy influences have not been adequatelydemonstrated, and in the ACT’s view are not intuitive in many cases, the extent ofadopting standard participation rates on the distribution of funding between theStates must be questioned as the current approach:
− does not reimburse the ACT for the costs of educating all of its year 11 and 12students (according to Discussion Paper 2001/17, this costs the ACT $16.2mp.a.);
− underfunds the ACT in regard to cross-border students being taught in thenon-compulsory years of schooling – this represents a cost-shift from NSW tothe ACT which is not recognised by the Commission; and
− underfunds the ACT in regard to the grade cost factor which is meant torecognise the higher per student costs associated with teaching year 11 and 12students.
Cross Border
• To show that the current standard age participation rates applied to cross-borderpost-compulsory students is irrational as:
− it is based on the assumption that the ACT’s policies are encouragingcross-border student enrolments; and
− the Commission’s current approach encourages cost-shifting from NSW to theACT.
Session 7 – Education – High Participation & Retention Rates’
181
• The ACT continues to attract significant numbers of students from NSW to itsschools. The cost burden on the ACT is only partly recognised in theCommission’s secondary schools assessment as only a portion of thepost-compulsory NSW students utilising the ACT’s education services are funded:
− the ACT receives funding for only the standard number of cross-borderstudents (based on standard age participation rates), not the actual numbers;
− this underfunding is compounded by the fact that the ACT only receives aportion of the higher per student costs associated with teaching thecross-border year 11 and 12 students (grade cost factor).
• The ACT contends that even if standard age participation rates are retained for the2004 Review, or some modification to this approach is made, there are very stronggrounds for the Commission to provide the ACT with funding commensurate witheducating actual cross-border students as it is NSW policy and othercircumstances, not ACT policy, which encourages the enrolment of these studentsin ACT schools.
Children of non-diplomatic temporary residents
• To demonstrate the need for the ACT’s demand and cost factors associated withabove average numbers of temporary visa holders to be reflected within theCommission’s assessment.
• The ACT, as the national capital, not only educates more children of diplomaticpersonnel than other jurisdictions, but also attracts and educates above averagenumbers of children of non-diplomatic temporary personnel requiring intensiveEnglish training upon arrival.
Students with Disabilities
• To highlight the extent of the demand and costs imposed by disabled children onthe ACT schools system.
• To reiterate the need for the schools assessments to reflect these non-policyinfluences.
Vandalism and Security factor
• To highlight the concerns with the ‘broad judgement’ nature of the currentvandalism and security factor given that the ACT’s vandalism costs of 0.93% ofrecurrent expenditure exceed the 0.5% threshold used to specify that these costsare highest in the largest conurbations.
• To emphasise the effects of a population that is 100% metropolised on vandalismwhich indicates that the existing urban population size model used to estimatestandardised vandalism costs requires amendment.
Scale Affected Expenditure
• To highlight the disproportionately high administrative burdens, and therefore percapita costs, placed on the ACT given its relatively small population.
• The ACT has similar involvement with national bodies such as MCEETYA, theProductivity Commission, the National Education and Training Statistics Unit at theABS that exist for the development or coordination of national service deliverypolicies as larger jurisdictions.

Session 7 – Education – High Participation & Retention Rates’
182
The first school on the Dickson College site opened in 1962 as a high school offeringYears 7 to 12. It became one of Canberra’s first senior secondary colleges in 1976,providing only Years 11 and 12 education since then.
Dickson College has a long association with alternative education programmes and theintensive teaching of English as a second language.
Mr Trevor Wheeler — Acting Chief Executive, Department of Education, Youth andFamily Services.
Other Departmental Representatives
Mr James Coleborne — Executive Director, Schools Education, Department ofEducation, Youth and Family Services.
Mr Craig Curry — Director, School Operations – Southside, Department of EducationYouth and Family Services. Mr Curry also has responsibility for special education andstudent support services.
Ms Wendy Coutts — Principal, Dickson College.
Mr Peter Veenker— Chief Executive, Canberra Institute of Technology.
Mr Christopher Peters — Chief Executive, ACT Chamber of Commerce.
Venue – Dickson College
Presenters
Session 7 – Education – High Participation & Retention Rates’
183
Post-compulsory participation rates
• The Commission developed a discussion paper titled CGC 2001/17, Issues in theSchools Education Assessments as part of the Other Issues of Principle and Method– Group 1 Issues, and sought comments from the States on the various issuescanvassed.
• The ACT faces high participation rates in the post-compulsory years of schoolingrelative to the other States, driven by a range of non-policy issues which results inan above standard demand for education, increasing the cost of service provision.
• On the evidence presented, it must be concluded that States’ differential rates ofpost-compulsory education participation are not driven by policy influences.
• To support its case, the ACT included a range of recent research and researchreviews, and importantly, incorporated a statistical analysis examining therelationship between States’ participation rates and various influences which wascarried out for the Territory by the National Centre for Social and EconomicModelling (NATSEM).
• The ACT has presented irrefutable empirical evidence as a means of determiningthe extent of various relationships to support its position. The data demonstratesthat observed differences in participation rates across the States is due to a range ofnon-policy influences, and not due to policy differences. As such, the conclusionsdo not support the use of notional enrolments for years 11 and 12. The Commissionis urged to develop an assessment which takes account of the range of non-policyfactors.
• The drivers of State differences in post-compulsory school participation are socialand economic factors, which account fully for the higher participation rate in the ACTcompared to other jurisdictions.
• Information on the influence of State policy differences is weak and problematic, andno convincing causal relationships have been established:
− the relationship between above average age of commencement and aboveaverage post-compulsory participation rates cannot be sustained as:
! no consistent pattern exists across the States for these variables;
! the relationship between age of commencement and participation is notstatistically significant;
− the relationship between average age in years 10-12 and participation acrossStates is inconsistent:
! for some States, a younger average age in years 10-12 can lead to higherthan average participation, whilst for others, it leads to below averageparticipation;
! for some States, above average age in years 10-12 leads to below averageparticipation, whilst for others, it results in above average participation.
− any policy influences regarding repeating and advancing are marginal given thesmall proportion of students repeating;
Key Points from the ACT Main Submission
Session 7 – Education – High Participation & Retention Rates’
184
− the presence or absence of a secondary college system (most, if not all, Stateschool systems have introduced ‘college’ like features into years 11 and 12) doesnot have a statistically significant correlation with participation, and therelationship across States is contradictory;
− no conclusion can be reached regarding the effect of location of schools in urbanareas on post-compulsory school retention as there is no statistical or otherinformation on which to determine such a relationship; eg Narrabundah collegehas few college aged students, yet it is one of the ACT’s largest colleges;
− in terms of school curriculum, the States have implemented school-based courseand assessment arrangements and VET in schools is Commonwealth driven;and
− no relationship holds between student/staff teaching ratios and participation inyears 11 and 12 as the relationship is inconsistent between States and is notstatistically significant.
• National and Commonwealth policies reinforce social and economic influences andwork with labour market factors in the ACT to drive its higher participation rate inschools compared to the other States.
• Vocational training reforms have opened up competition for entry level vocationaltraining and are providing a strong economic incentive for young people to stay atschool in order to compete with older people.
• The range of social factors listed below have a statistically significant relationshipwith post-compulsory school participation:
− parents’ occupation and educational background (socio-economic status);
− metropolitan and non-metropolitan location;
− non English speaking background; and
− the proportion of population that is indigenous.
• The ACT’s high post-compulsory school participation is predominantly explained byeconomic factors, including:
− occupational and industry structure is strongly and significantly correlated withschool participation - the ACT labour market is biased towards higher skilledoccupations and with limited availability of low skilled jobs for unqualified youngpeople, the incentive to remain in full time education to increase skill andqualification levels remains paramount;
− occupational and educational background of families - the ACT’s relatively highsocio-economic status is driven by the dominance of higher skilled occupations,which exhibit a strong and statistically significant positive relationship withparticipation; and
− the strong, statistically significant negative relationship between full timeemployment and participation in education is weaker in the ACT than elsewheregiven the Territory’s consistently lower proportion of youth full time employmentcompared to Australia and its consistently higher education participation relativeto all other States.
Session 7 – Education – High Participation & Retention Rates’
185
Socio-demographic composition factor – temporary students
• Large numbers of temporary residents with school age dependents are attracted tothe ACT’s six post secondary educational institutions and to the CommonwealthGovernment and its agencies, for example Defence.
• The ACT has the second highest per capita enrolment of temporary residents whichadds to the costs of education service delivery.
• The ACT requests that the primary and secondary education socio-demographiccomposition factors be adjusted to include a weighting for actual numbers ofnon-diplomatic dependents of temporary residents per capita to reflect the:
− additional demands these dependents place on education services; and
− additional costs associated with the provision of English language courses(primary and secondary school temporary residents should be weighted by afactor of 1.10 and 1.15 respectively).
Socio-demographic composition factor – students with disabilities
• The number of students with disabilities per capita in:
− all ACT schools is 12.7% above the Australian average; and
− special schools is 27.2% above the Australian average.
• The ACT requests that students with disabilities be weighted to reflect theiradditional costs in providing educational services, as the cost of provision in:
− mainstream schools is 140% greater for disabled mainstream students; and
− special schools is 405% greater for disabled students.
Vandalism and security costs factor
• ACT vandalism costs exceed the 0.5% threshold, used to specify that these costsare highest in the largest conurbations. This indicates that the existing urbanpopulation size model used to estimate standardised vandalism costs need to beamended.
• The ACT requests than the urban population model be replaced by an approachwhich reflects the actual vandalism costs faced by States. If data is not available tosupport a more accurate approach, the assessment should either:
− exclude the assessment of the vandalism and security factor; or
− if the factor continues to be assessed, apply the highest weighting of 5 due to theACT in recognition of its high vandalism costs.
National Capital
• The assessment for a national capital allowance for the extra costs associated withteaching English to children of diplomats should be continued at $4.0m per annum.
Scale factor
• The assessment should continue to reflect diseconomies of small scale and inputcosts disabilities.
Session 7 – Education – High Participation & Retention Rates’
186
7.1. The Department of Education, Youth and Family Services (DEYFS) delivers arange of services to children, young people, families, trainees and industry. It provideseducation services in Government schools and preschools; registers non-Governmentschools; administers vocational education and training; licences childcare; and delivers arange support to children, young people and families.
7.2. The February 2002 Census of Schools Enrolments indicated 37,608 studentsattended 95 Government schools. This represented 20,759 primary level students(69 schools); 10,288 high school students (17 schools); 6,296 secondary college students(8 schools) and 285 students attending 4 special schools. It should be noted that there arethree schools that have both primary and high schools students.
7.3. The small size of the student population necessitates creative service provision inorder to provide the scope and standard of education necessary for a population such asthe ACT. Post-compulsory education in senior colleges is an example of this. To providethe range of necessary range of both academic and vocational subjects required forstandard year 11 and 12 it is necessary to create larger concentrations of students.
7.4. The ACT also provides the same level of representation on national educationforums such as MCEETYA and its taskforces, working groups for the ProductivityCommission, and the National Education and Training Statistics at the ABS. There aretwo areas where the small population size of the ACT results in a disproportional financialburden to support these functions:
• attendance at meetings and the requisite briefings; and
• National reporting requirements of these organisations.
Introduction
7.5. The issue of the Commission’s assessment method for participation inpost-compulsory education is an issue that creates great concern for the ACT. Indeed, theACT regards the current government secondary schools assessment to be theassessment most out of touch with reality given the subjectiveness of purported indicators,particularly in the absence of any rigorous data analysis (regression analysis of the variousdata sources), used to ‘show’ that the ACT’s policies affect it participation and retentionrates.
7.6. Given the lack of hard evidence to support the proposition that the ACT influencesits participation/retention rates, it is particularly galling to accept the millions of dollars offunding this shifts away from the ACT each year – approximately $35m (for the crossborder and grade cost factors in additional to the socio-demographic composition factor).
Post-compulsory participation rates
Overview of Service Delivery in the ACT
Session 7 – Education – High Participation & Retention Rates’
187
7.7. In this context, however, the ACT notes that it is difficult for the Commission todetermine what is or isn’t policy influenced and that the changes instituted in the 1999Review were welcomed, although they did not go nearly far enough.
7.8. In the Main Submission to the Commission, the ACT presented considerableevidence that supported the use of actual post-compulsory participation rates. Althoughmuch of the anecdotal evidence touched on had been presented before in the 1999Review, the ACT has commissioned an investigation into the drivers of post-compulsoryeducation using the expertise of the National Centre of Social and Economic Modelling(NATSEM).
7.9. Although the Commonwealth Grants Commission’s latest Discussion Paper titledIssues in the Schools Education Assessments for the 2004 Review (CGC 2001/17)provided a very good summary of the issues at hand, as well as the debate to date, it hadprovided in the main, only anecdotal evidence to support its key findings. There was adistinct lack of quantitative analysis.
7.10. It is imperative that this important issue is resolved based on the readilyavailable data rather than anecdotal evidence or pre-conceived perceptions.
7.11. In this context, the ACT’s aim was to request an independent body to rigorouslyexamine the drivers of post-compulsory education using analytical techniques such asregression analysis given that many of the arguments that have been presented to date bythe Commission and the States were based on anecdotal evidence only. In the ACT’sview, there was a need to examine the drivers of post-compulsory education on statisticalgrounds given:
• that this had not been carried out to date, at least extensively, by the HFE participants;
• that statistical analysis would assist the debate by highlighting the drivers ofpost-compulsory education, and thus the policy and non-policy influences at play;
• the amount of funding that is shifted between jurisdictions each year, based on‘purported’ anecdotal evidence; and
• that other assessments had used regression analysis in support of the stance adoptedby the Commission.
7.12. NATSEM overwhelmingly supported the view of the ACT. That is, that by far themajority of arguments presented on this issue are anecdotal in nature, in contrast to therigorous data-based analysis undertaken by NATSEM. It is imperative that this importantissue is resolved based on the readily available data rather than anecdotal evidence orpre-conceived perceptions.
7.13. Rather than restate the extensive arguments presented in the Main Submission thisbriefing will restate the most salient points. There are two main areas of concern:
• the perceived State influences of State policy on post-compulsory participation; and
• out of all the Commonwealth policy and non-policy reasons presented in theCommission’s Discussion Paper as possible drivers of post compulsory participation

Session 7 – Education – High Participation & Retention Rates’
188
rates, only urbanisation and socio-economic status are included in the modellingprocess.
Perceived State influences on post-compulsory participation of State policy
7.14. The first area of concern is the perceived influences on post-compulsoryparticipation of State policy. These issues along with the conclusion presented in the MainSubmission based on the findings in the NATSEM report are re-iterated here. The ACTwishes to impress on the Commission that the ACT's above standard post-compulsoryparticipation rates are not caused by Territory policy.
7.15. A number of issues were raised by the Commission and have been addressed bythe ACT, including:
• The age of commencement at school (the month by which they turn 6 in year ofenrolment) and the average student age in years 10, 11 and 12:
− NATSEM found that no statistically significant relationship exists between above orbelow average age and educational participation;
• The ability of students to repeat and advance:
− the use of notional enrolments cannot be supported on the ground of a studentsability to repeat and advance because the States have adopted the same policyconcerning repeating and the policy influence is only marginal, given that thenumber of students repeating as a proportion of total enrolments for the post-compulsory years of schooling is minute;
• Secondary College system:
− there is no robust evidence which supports the case that a college system is adriver for above average participation rates and so the absence or presence of acollege system does not provide sufficient ground for adopting the use of notionalenrolments;
− NATSEM found that no statistically significant relationship exists between thepresence or absence of a secondary college system and above or below averageage and educational participation;
• School location:
− location policies, if they exist, are unlikely to consistently drive up participation rates;
• School curriculum:
− the provision of VET in schools is standard policy; the Sates have implementeduniversal course and assessment arrangements; and all States have put in placesimilar curriculum programs designed to specifically engage students who are atrisk of under achievement in education; and
• Student/staff ratio:
− NATSEM found that there is no significant relationship between student/staff ratiosand participation.
Session 7 – Education – High Participation & Retention Rates’
189
7.16. The analysis provided in the NATSEM report and the ACT Main Submissionprovides a robust case that none of the State policies presented by the Commissionhave any significant effect on a State’s level of post-compulsory participationrates. Therefore, the only justifiable assessment methodology is to use actualparticipation rates.
Drivers of post compulsory participation rates used in the modelling process
7.17. The second main area of concern is that in the 1999 Review methodology, out of allthe Commonwealth policy and non-policy reasons presented in the Commission’sDiscussion Paper as possible drivers of post compulsory participation rates, onlyurbanisation and socio-economic status have been included in the modelling process.
7.18. NATSEM found that the ACT’s high post-compulsory school participation ispredominantly explained by economic factors, including:
• occupational and industry structure is strongly and significantly correlated with schoolparticipation - the ACT labour market is biased towards higher skilled occupations andwith limited availability of low skilled jobs for unqualified young people, the incentive toremain in full time education to increase skill and qualification levels remainsparamount;
• occupational and educational background of families - the ACT’s relatively highsocio-economic status is driven by the dominance of higher skilled occupations, whichexhibit a strong and statistically significant positive relationship with participation; and
• the strong, statistically significant negative relationship between full time employmentand participation in education is weaker in the ACT than elsewhere given the Territory’sconsistently lower proportion of youth full time employment compared to Australia andits consistently higher education participation relative to all other States.
7.19. NATSEM also found that the following range of social factors listed also have astatistically significant relationship with post-compulsory school participation:
• the higher a parents’ occupation and educational background (socio-economic status),the higher the post-compulsory participation rate;
• the greater the proportion of the population that is metropolitan (non-metropolitan), thehigher (lower) the post-compulsory participation rate;
• the greater the proportion of the population that is from a non English speakingbackground, the higher the post-compulsory participation rate; and
• the greater the proportion of population that is indigenous, the lower thepost-compulsory participation rate.
7.20. The failure to include a number of these economic and social drivers would appearto explain why the Commission’s ‘standardised’ participation rates only account forapproximately 20% of the difference between standard participation rates and actualparticipation rates. Presumably, the Commission’s view is that the remaining 80% is dueto State policy. A view that is completely at odds with any evidence available to the ACT.
Session 7 – Education – High Participation & Retention Rates’
190
Even if the evidence of NATSEM is rashly discounted or ignored, the Commission’s 1999Review methodology seems to fail a fundamental reality check.
7.21. At the Western Australian (WA) Workplace Discussions, WA attempted to arguethat senior colleges are a significant policy factor influencing participation rates andretention rates. This, they claim, supports the Commission’s current approach of not usingactual enrolments. Their evidence is that the introduction of a senior college in Mandurah‘…has had a positive effect on retention rates with about 90% retention rate from year 10to 11 and improved retention to year 12’ (Workplace Discussion Briefing Notes, p86).They also offer this as evidence that it is a State policy to influence post-compulsoryparticipation rates.
7.22. The interesting thing about these improved retention rates is that while they haveintroduced a senior college they also introduced a wide range of VET type courses andthere also appears to be a number of private schools feeding into this college. Theintroduction of VET in schools is a clear standard policy that is improving retention andparticipation throughout the country, particularly where the traditional school curriculumwas not meeting the needs of the local community. Unfortunately, this example does notclearly demonstrate the effect of senior colleges on post-compulsory participation rates.
7.23. WA also argue that States attempt to influence participation rates. They arecorrect, but only in the extent that it is a standard policy. Improving the standard ofeducation has been a common policy of all States and the Commonwealth for a long time.Indeed this concept was included in the National Goals of Schooling in the AdelaideDeclaration (Goal 3.6):
‘…all students have access to the high quality education necessary to enablethe completion of school education to Year 12 or its vocational equivalentand that provides clear and recognised pathways to employment and furthereducation and training’.
7.24. In conclusion, the ACT considers there is little justification as to why, in spiteof clear evidence to the contrary, the Commission continues to favour standardparticipation rates over actual enrolments.
7.25. The ACT continues to provide education services to a significant number ofpost-compulsory NSW cross-border students. The cost burden on the ACT is only partlyrecognised in the Commission’s secondary schools assessment as only a portion of theNSW post-compulsory students utilising the ACT’s education services are funded:
• the ACT receives funding for only the standard number of cross-border students(based on standard age participation rates), not the actual numbers;
• this underfunding is compounded by the fact that the ACT only receives a portion of thehigher per student costs associated with teaching these cross-border year 11 and 12students (grade cost factor).
Cross-border
Session 7 – Education – High Participation & Retention Rates’
191
7.26. The use of current standard age participation rates applied to cross-borderpost-compulsory students is irrational as:
• it is based on the assumption that the ACT’s policies are encouraging cross-borderstudent enrolments; and
• the Commission’s current approach encourages cost-shifting from NSW to the ACT.
7.27. The ACT does not influence NSW students to enrol in its schools as these studentsare outside its boundaries. There is no evidence whatsoever that this occurs. Indeed, theACT does not communicate with, or try to influence NSW parents’ education decisions byencouraging post-compulsory students into its schools.
7.28. In light of the underfunding provided by the Commission for these cross-borderstudents, it is not in the ACT’s interests to encourage the enrolment of NSW students inACT schools as this places cost burdens on the ACT Budget and taxpayers.
7.29. The Territory considers that this movement to the ACT, in large part, is caused bythe lack of schools on the ACT/NSW border, which can only be caused by NSW policy. Inthe non-Government sector, and in part the Government sector, the ACT acts as aregional centre. Other than a few Catholic diocesan schools, there are nonon-Government schools in the areas of NSW surrounding the ACT. The ACT alsocontends that there are a lack of adequate government schools on the NSW side of theborder.
7.30. Additionally, other non-policy circumstances such as the fact that a large number ofparents choose to have their students educated in the ACT because of convenience, andthe fact that their jobs are located in the ACT, are also outside the influence of the ACT.
7.31. Given the current approach adopted by the Commission, cost-shifting from NSW tothe ACT is encouraged. It is far cheaper for NSW to adopt the policy of doing nothing, andnot add capital school stock, teachers etc, and to encourage NSW students to enrol inACT at the Territory’s cost.
7.32. Any suggestion that the ACT implements policy initiatives to attract NSW studentson the grounds that it provides an above standard service provision is false. The ACTnotes that based on the 2002 Update, the ACT spent 12.4% more in per capita terms thanNSW on government secondary education over a five year period. However, for the lastthree years, this position had reversed, with NSW spending 4% more than the ACT in percapita terms. The ACT considers that evidence based on expenditure patterns does notsuggest that it provides an above standard service provision. Such a conclusion wouldalso fail to recognise the cyclical nature of expenditure, which varies as governments ofthe day focus on different priorities, as well as the data anomalies within the GFS dataframework.
7.33. Notwithstanding this, as recognised by the Commission, each State is free todetermine how much it spends on a service. The fact that the ACT might spend slightlymore on government secondary education than NSW in per capita terms is a reflection of,
Session 7 – Education – High Participation & Retention Rates’
192
amongst other things, the importance of education to the ACT public, the occupational andindustry structure and the relatively high socio-economic status of residents.
7.34. The ACT also notes that the approach to ‘standardise’ the number of cross-borderpost-compulsory students is at odds with the approach adopted by the Commission forevery other cross-border assessment. Standardisation is not applied to any otherassessment, such as, for example, primary schools. For the reasons already outlined,‘standardisation’ should not be applied to the post-compulsory years of education.
7.35. The Commission’s current assessments significantly underfund the ACT inregard to cross-border students being taught in the non-compulsory years ofschooling as actual enrolments are not used. This represents a cost-shift fromNSW to the ACT which the Commission should be wary of encouraging.
7.36. The ACT contends that even if standard age participation rates are retainedfor the 2004 Review, or some modification to this approach is made, there arestrong grounds for the Commission to provide the ACT with funding commensuratewith educating actual post-compulsory cross-border students as it is NSW policyand other circumstances, not ACT policy, which encourages the enrolment of thesestudents in ACT schools.
7.37. In the 1999 Review the Commission allowed a small allowance for the extra costsof providing instruction in English costs in the guise of a national capital factor. TheCommission did not consider a more substantial national capital factor warranted becauseother States also had a large number of temporary visa holders.
7.38. Nevertheless, the ACT is the location of a number of agencies likely to recruit staffor students from overseas with a further likelihood of them having school-aged childrenrequiring intensive English training upon arrival. Data was presented in the submissionthat when the number of temporary visa holders was expressed in per capita terms theACT is considerably above the national average.
7.39. It is clear that the ACT is not the only jurisdiction to face above averagenumbers of temporary visa holders. Therefore, it is appropriate that an adjustmentbe made to the socio-demographic factor to reflect both the increased number of,and the additional cost of these students.
7.40. The current assessment methodology does not take account of the higher costsassociated with educating the ACT's above average proportion of students with adisability. The ACT noted that students with disabilities should be weighted to reflect theseadditional costs which in:
• mainstream schools is 140% greater for disabled mainstream students; and
Educating children of temporary residents
Students with disabilities
Session 7 – Education – High Participation & Retention Rates’
193
• special schools is 405% greater for disabled students.
7.41. The ACT’s Main Submission noted that the number of students with disabilities percapita in:
• all ACT schools is 12.7% above the Australian average; and
• special schools is 27.2% above the Australian average.
7.42. While different States use slightly different definitions of disability, it shouldnot be difficult to standardise the numbers to the Commonwealth definition. Whenthis standard definition is used the ACT clearly has an above standard proportion ofstudents with a disability in mainstream schools as well as special schools.
7.43. The ACT continues to be concerned about the broad judgement nature of thecurrent vandalism and security factor. ACT vandalism costs exceed the 0.5% threshold,used to specify that these costs are highest in the largest conurbations, and indeed, arenearly double this figure at an average of 0.93% of recurrent expenditure (excludingsuperannuation costs).
7.44. The data put forward by the ACT indicating that its vandalism costs are at a higherlevel relative to NSW and Victoria, highlights the effects of a population that is 100%metropolised on vandalism. In this light the existing urban population size model used toestimate standardised vandalism costs needs to be amended.
7.45. The ACT believes that if good comparable data cannot be found to assess thevandalism factor, then it would be preferable to discontinue the factor than continuethe current approach that is based on the judgement of previous Commissioners.
7.46. The ACT considers that the assessment should continue to reflect diseconomies ofsmall scale and input costs disabilities.
7.47. A further example of the small nature of the ACT’s education service delivery is theneed for the secondary college system. In order to provide a similarly diverse curriculumas offered in other metropolitan areas, the ACT needs to congregate its years 11 and 12 inlarger groups.
Vandalism and security
Administrative scale
Session 7 – Education – High Participation & Retention Rates’
194
7.48. The major conclusion that the ACT wishes to draw from this session is thatthe ACT's high post-compulsory participation rates are not caused by any policyinitiative of the ACT. The ACT does not have an above standard service deliveryand simply provides a similar range of education services to the other States in themost efficient manner possible.
7.49. The ACT’s high participation rates in the post-compulsory years of schoolingrelative to the other States, are driven by a range of non-policy issues and results inan above standard demand for education, increasing the cost of service provision.
7.50. As highlighted by the NATSEM quantitative analysis in the ACT’s MainSubmission, and a range of other evidence put forward by the ACT, the drivers ofState differences in post-compulsory school participation are social and economicfactors, which account fully for the higher participation rate in the ACT compared toother jurisdictions.
7.51. It is imperative that this important issue is resolved based on the readilyavailable data rather than anecdotal evidence or pre-conceived perceptions. In thislight, the ACT considers that the Commission should accept the results of theNATSEM analysis, or alternatively, undertake its own quantitative analysis todetermine the drivers of post-compulsory school participation.
7.52. In terms of cross-border, very strong grounds exist for the Commission toprovide the ACT with funding commensurate with educating actualpost-compulsory cross-border students as it is NSW policy and othercircumstances, not ACT policy, which encourages the enrolment of these studentsin ACT schools.
7.53. The current approach encourages cost-shifting from NSW to the ACT and the‘standardisation’ of post-compulsory students is not symmetrical with theCommission’s approach to every other cross-border assessment.
7.54. The ACT contends that even if standard age participation rates are retainedfor the 2004 Review, or some modification to this approach is made,
7.55. The ACT also wishes to re-iterate the need for the Commission to takeaccount of the:
• number of temporary residents whose school aged children require intensiveEnglish training;
• ACT’s above average proportion of students with disabilities and the high costthis places on the ACT relative to other jurisdictions; and
• high vandalism and security costs faced by the Territory in a metropolitansetting.
Conclusion
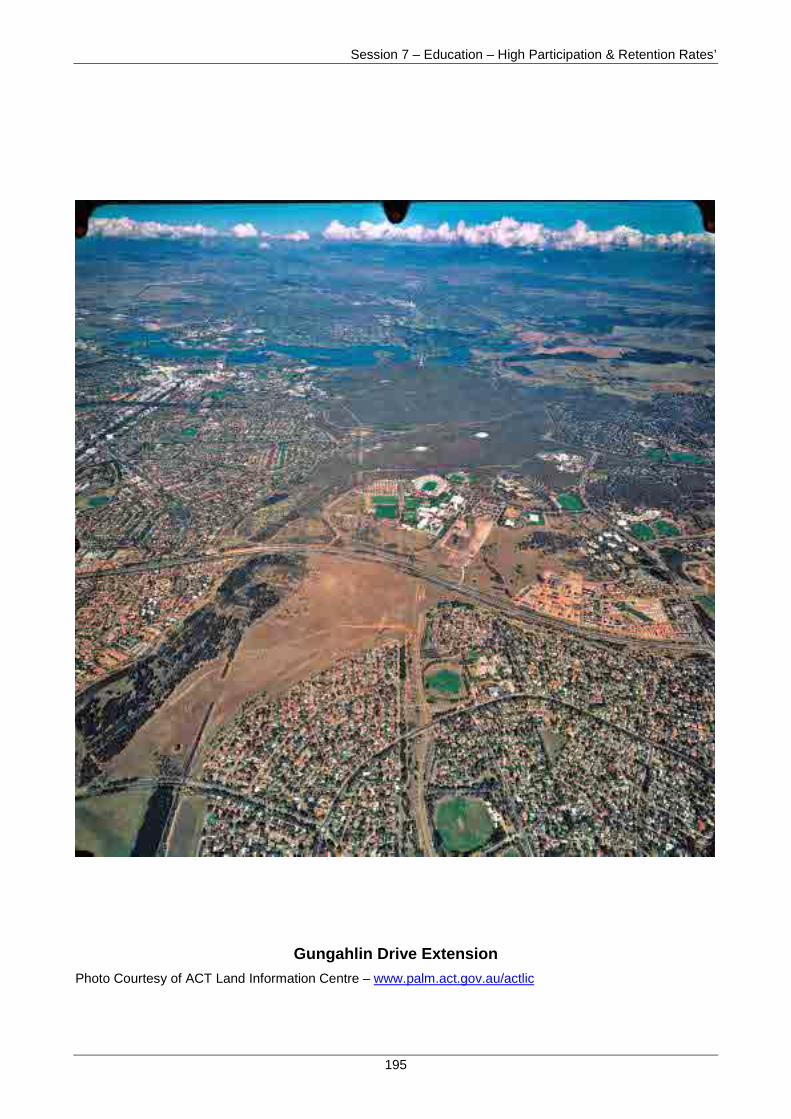
Session 7 – Education – High Participation & Retention Rates’
195
Gungahlin Drive Extension
Photo Courtesy of ACT Land Information Centre – www.palm.act.gov.au/actlic
Session 8 – Law & Order & Public Safety – ‘Uncertain Times’
196
(B) PLANNING ISSUES – NATIONAL CAPITAL INFLUENCES- GUNGAHLIN DRIVE PRESENTATION
7.56. The proposed Gungahlin Drive Extension represents a major link in themetropolitan arterial road network that will substantially improve connectivity between thenorthern and southern parts of Canberra. As part of the original urban arterial roadnetwork outline in the “Y Plan” for Canberra and subsequent National Capital Plan andTerritory Plans, the Gungahlin Drive Extension is responding to identified traffic needsresulting from the growth of Gungahlin, which now has a population of over 23,000.
7.57. The specific objectives of the Gungahlin Drive Extension are to provide a safe,efficient, environmentally sustainable, and cost effective connection between the BartonHighway and Glenloch Interchange as part of the wider transport network for Canberra,relieving congestion on other roads not designed to carry the current amount of traffic.
7.58. Gungahlin Drive Extension has been subject to a series of planning, engineeringand environmental studies and public consultation exercises since 1970. The name of theroad was changed from John Dedman Parkway to Gungahlin Drive Extension in 2000.The key project milestones arising throughout this process are summarised as follows:
• In 1970 the National Capital Development Commission (NCDC) proposed the 'Y-Plan'in its publication, Tomorrow's Canberra. One feature of the Y-Plan was the separationbetween the satellite towns of Canberra and the peripheral parkway (freeway) system,of which the Gungahlin Drive extension is a key component.
• The Metropolitan Canberra Policy Plan and Development Plan released by the NCDCin 1984 reaffirmed John Dedman Parkway as a key element of the Canberra roadnetwork.
• In 1988-89, the Gungahlin External Travel Study (GETS), a major public consultationexercise undertaken by the NCDC, who were abolished by the CommonwealthGovernment prior to the final report being finalised, was later completed for theNational Capital Planning Authority (NCPA). This report supported the earlyconstruction of the John Dedman Parkway as one of several potential parkways orarterial roads serving Gungahlin.
• In May 1991 a Parliamentary Joint Committee (PJC) of the National Capital handeddown its recommendations on the GETS report. This recommended inter alia adetailed environmental assessment of two options for the John Dedman Parkway, oneto the east of the AIS and one to the west, with both connecting to Caswell Drive. ThePJC reported that both the NCPA and the ACT Planning Authority preferred a route forthe John Dedman Parkway east of the AIS, with a connection to Barry Drive, ratherthan the GETS Community preferred option west of the AIS.
• In 1997, a Preliminary Assessment Report (PA) was prepared on behalf of the ACTGovernment by Maunsell Pty Ltd for the John Dedman Parkway between the BartonHighway and Belconnen Way. This PA examined five options including one based onexisting Belconnen roads and one involving a parkway along the Majura Valley. ThePA favoured an option that located the road to the east of the AIS with a connection toBarry Drive.
Session 8 – Law & Order & Public Safety – ‘Uncertain Times’
197
• Following the ACT Government election in 2001, the incoming Labor Government, inkeeping with one of its election promises, reversed the decision of the previousGovernment by proposing that Gungahlin Drive Extension be located to the west of theAIS. Further investigation of design options for the road, as well as the upgrading ofCaswell Drive and Glenloch Interchange, has been based on locating the road with acorridor west of the AIS.
• The Commonwealth Government and AIS have raised their concerns with regard to thewestern alignment of the GDE in the context of potential impact on the performance ofelite athletes. Their main concerns are noise levels and air pollution. They have alsoadvised the ACT Government that this alignment may have impacts with regards anyfuture development of the AIS, and that the ongoing development of athletes may bepotentially harmed if the western alignment was to proceed.
• In October 2002, the National Capital Authority (NCA) announced that it would conducta review of the current PA that was undertaken by Maunsells for the eastern alignment.This review would help form the basis for a decision by the NCA for support of apreferred Gungahlin Drive Extension alignment.
7.59. A PA for the western alignment is currently being prepared and will be lodged bythe end of November 2002. This is the second PA that has been prepared in relation toGungahlin Drive Extension and associated roads. The first PA addressed the options at astrategic level. The current PA extends coverage of the proposed route from the BartonHighway to Glenloch interchange (inclusive) on what is now referred to as the “western”alignment around the Australian Institute of Sport and Canberra Stadium. The decision-making process of the ACT Government has reached the point where:
• the need for the Gungahlin Drive extension is widely accepted;
• the road should be located to the west of the AIS; and
• the road should connect with Caswell Drive, requiring the upgrading of Caswell Driveand Glenloch Interchange.
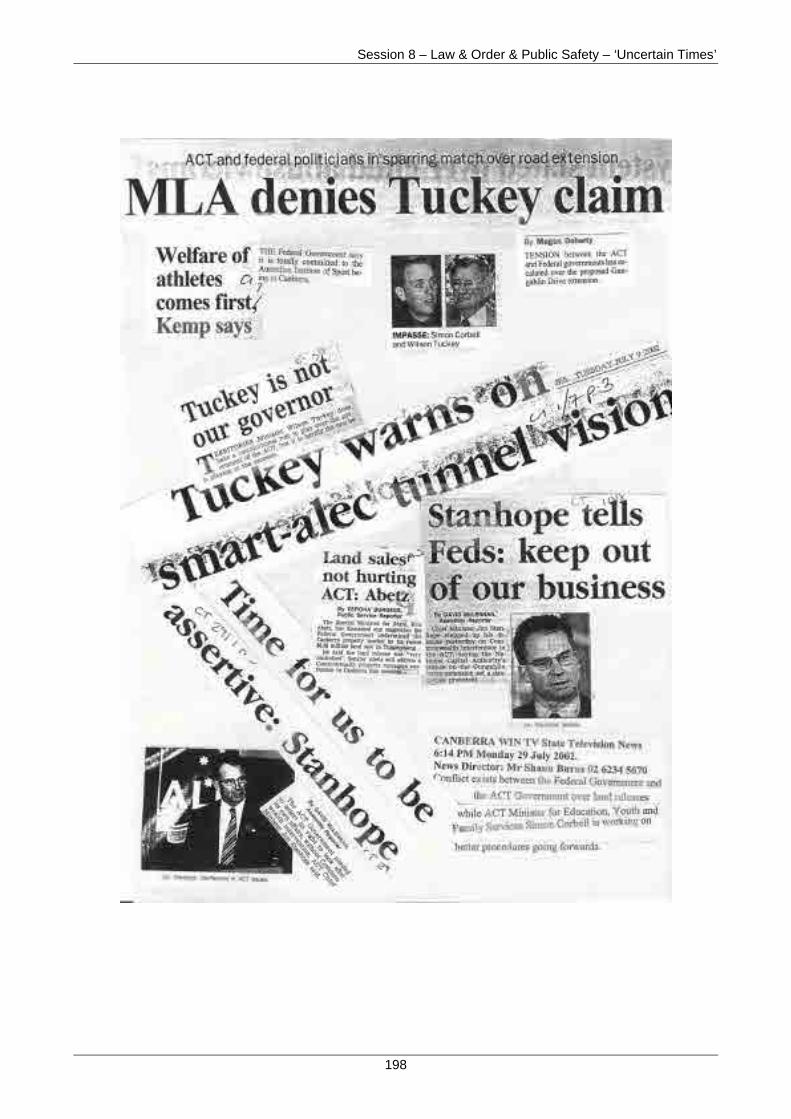
Session 8 – Law & Order & Public Safety – ‘Uncertain Times’
198
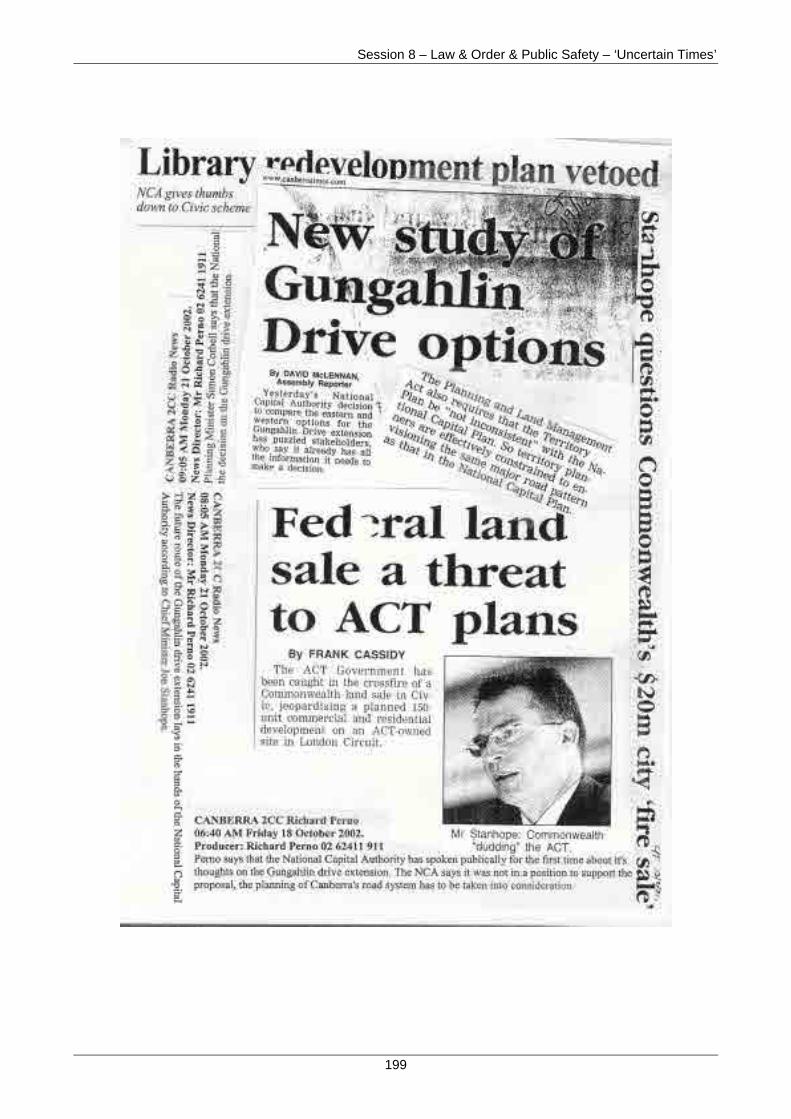
Session 8 – Law & Order & Public Safety – ‘Uncertain Times’
199
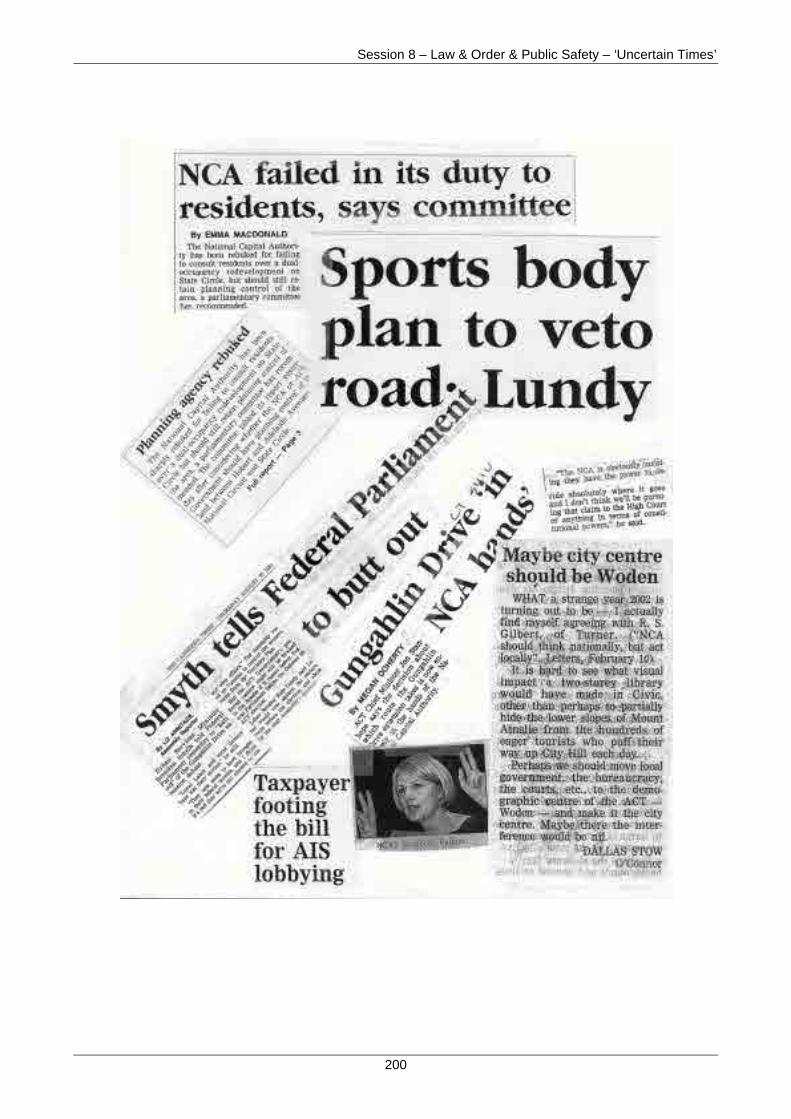
Session 8 – Law & Order & Public Safety – ‘Uncertain Times’
200
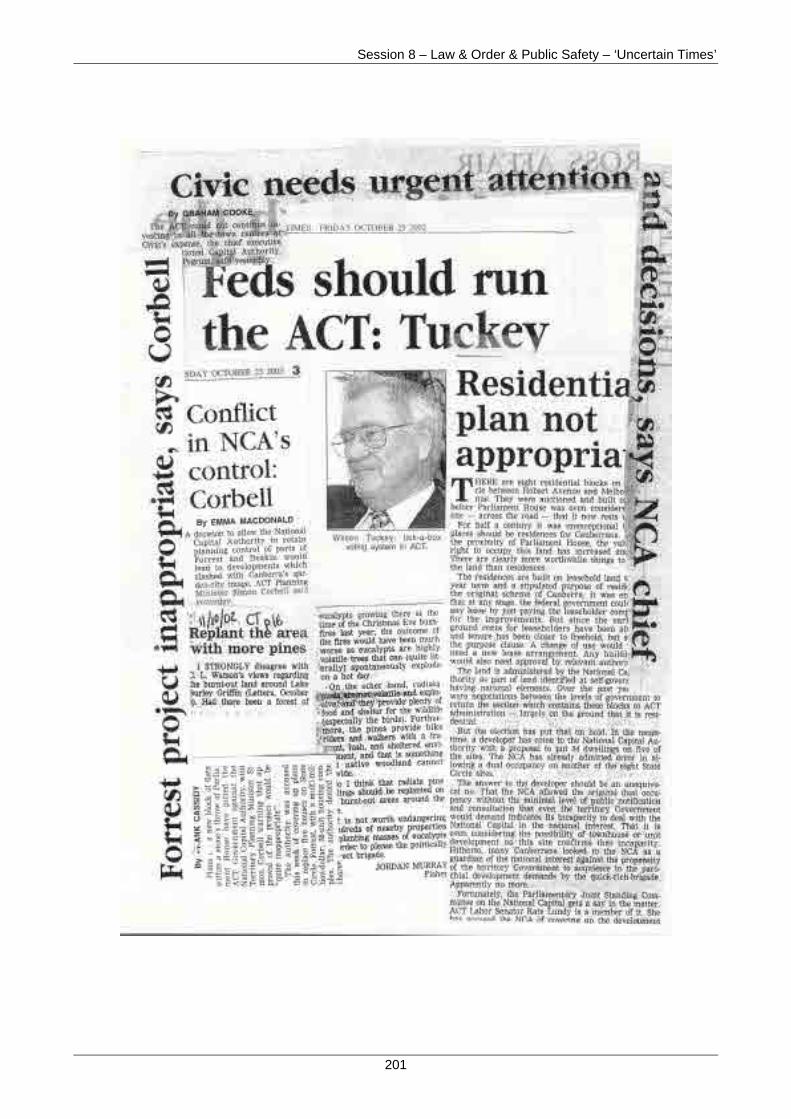
Session 8 – Law & Order & Public Safety – ‘Uncertain Times’
201
Session 8 – Law & Order & Public Safety – ‘Uncertain Times’
202
DAY TWO
THURSDAY, 14 NOVEMBER 2002
SESSION 8. – ‘LAW AND ORDER AND PUBLIC SAFETY –'UNCERTAIN TIMES'’:
(A) Public Safety and Emergency Services.
(B) Law and Order - Police.
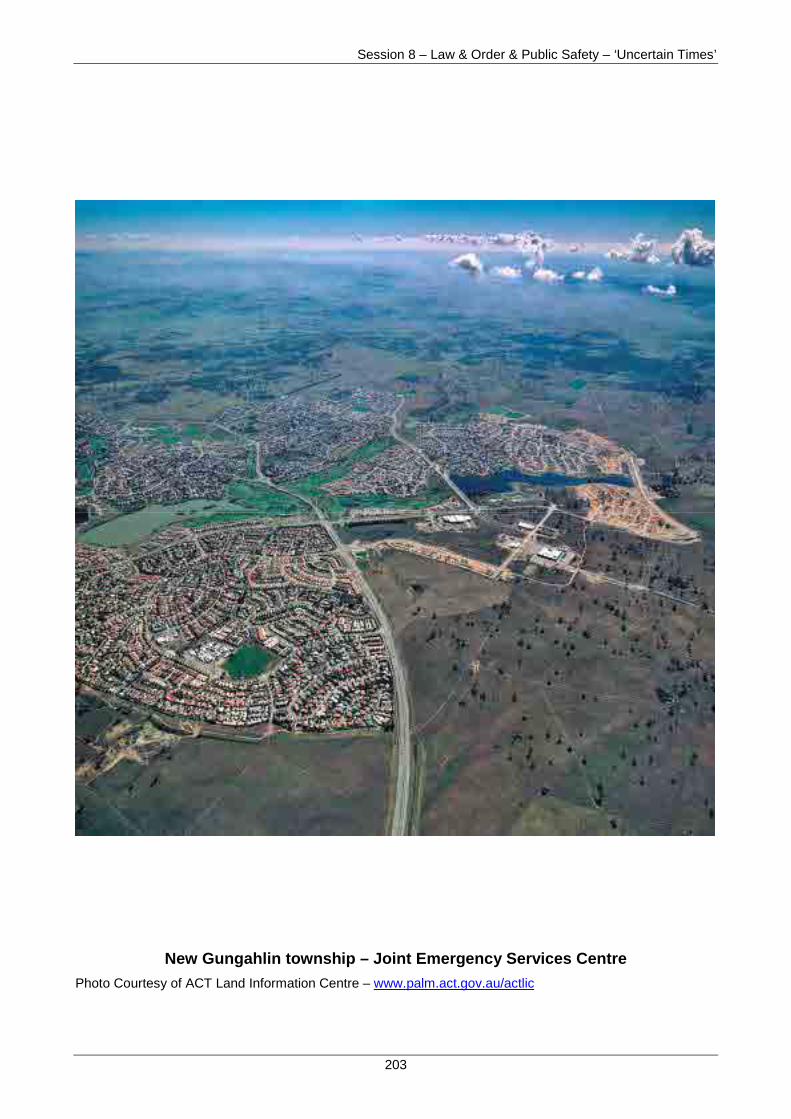
Session 8 – Law & Order & Public Safety – ‘Uncertain Times’
203
New Gungahlin township – Joint Emergency Services Centre
Photo Courtesy of ACT Land Information Centre – www.palm.act.gov.au/actlic
Session 8 – Law & Order & Public Safety – ‘Uncertain Times’
204
(A) PUBLIC SAFETY AND EMERGENCY SERVICES
Joint Emergency Services Centre, Gunghalin
The Development of Joint Emergency Services Centres (JESC) in the ACT has beenadopted as a strategy to provide more cost effective emergency services to the ACTCommunity and at the same time provide the opportunity for professional interactionbetween services outside the normal high stress environment of emergency responses.
While the Gungahlin JESC is unique in that it houses all five emergency responseagencies, there are a number of other joint facilities around Canberra already in place andplanned for the future which will build on the synergy provided in the JESC strategy. Arecent economic analysis undertaken by the Emergency Services Bureau reflects thatbuilding joint facilities, compared to stand alone facilities for the respective servicesproduce savings to the ACT Community.
The intangible benefits of JESCs are the closer liaison between the services, socially andprofessionally and better service delivery from a greater understanding and appreciation ofthe role of respective response agencies.
Mike Castle, Executive Director, ACT Emergency Services Bureau
Presenters
Venue
Session Objectives
• To demonstrate, via the Joint Emergency Services Centre in Gungahlin, how theTerritory is using innovation to partially address diseconomies of small scale.
Economic Environment Factor
• This session will demonstrate that Emergency, and in particular Fire Services, arebased on the capacity to respond to incidents and not on the success or otherwiseof responding to incidents. Further, the session will demonstrate why the proposalfor assessing the Economic Environment sub-component does not reflect ‘whatStates do’.
National Capital Influences
• To show how the National Capital Plan through the urban/bush interface leads toadditional costs for the ACT Fire Brigade.
• To highlight DOFA’s non-payment of its contribution for fire fighting services in theACT.
Session 8 – Law & Order & Public Safety – ‘Uncertain Times’
205
Mike Castle graduated from Duntroon Military Academy in 1969. During his militarycareer, Mike was responsible for support to emergency operations including strategies forfire management in the Bright area and flood mitigation efforts on the Gold Coast.
In January 1990 he was appointed Deputy General Manager of ACTION and TransportServices Coordinator for the ACT Disaster Plan.
In 1994 Mike accepted the position of General Manager, ACT Emergency ManagementGroup, responsible for the ACT Fire Brigade, ACT Bushfire Service and ACT EmergencyService. Mike was promoted to Executive Director of the ACT Emergency ServicesBureau including the ACT Ambulance Service in 1995. He is currently a director ofAustralasian Fire Authorities Council (AFAC), a Director of the ACT and South East NewSouth Wales Aero-Medical Service Ltd and the Secretary/Director of the SouthCareHelicopter Fund.
Other Departmental Representatives
Peter Lucas-Smith, Director ACT Bushfire and Emergency Services
Ian Bennett, ACT Fire Commissioner.
Key Points from the ACT Main Submission
• The ACT considers there is no compelling case for the current assessmentframework to attempt to quantify differences between States in the risk and potentiallosses from fires, particularly in a metropolitan environment.
Fire Brigade Expenditure - Economic Environment
• The ACT seeks the:
− removal of the economic environment sub-component from the assessment, as itdoes not reflect the cost of or demand for a fire protection service; or
− assess the economic environment component without the fire insurance claimssub-component, as fire insurance claims do not reflect the demand for or cost ofproviding a fire protection service.
National Capital Allowances
• The ACT seeks an increase in the current assessment for national capital influencesto $3.3m because of the:
− Territory’s reduced capacity to recruit volunteer bush firefighters;
− Territory’s above average areas of grass and bushland and bush/urban interface;and
− increased demand on, and need for greater response capacity of, the ACT’spublic safety and emergency services since the 11 September 2001 terroristattacks because of the location of Federal Government Departments and theDiplomatic Corps.
Session 8 – Law & Order & Public Safety – ‘Uncertain Times’
206
8.1. The ACT Emergency Services Bureau consists of the following four operationalunits:
• ACT Fire Brigade;
• ACT Ambulance Service;
• ACT Bushfire Service; and
• ACT Emergency Service. 8.2. Snowy Hydro SouthCare provides an aero-medical rescue service for the ACT andSouth Eastern NSW as a joint venture between the ACT and NSW Governments. 8.3. Key targets for the years ahead include developing infrastructure and sites for moremulti-service operational and training centres, based on the model of the JESC inGungahlin. 8.4. The ACT maintains 6 urban/rescue fire brigade stations, 4 ambulance stations,7 co-located bushfire and emergency services stations, and 3 joint (multi service)response facilities. Stations are based in geographic locations based on community risk,response times and the ability to protect high value national assets. 8.5. The staffing demographics of the services in the ACT differ from other States asthere is only scope to engage career, paid urban fire fighters or unpaid volunteer bush firefighters. There is no scope to engage volunteer or retained (part-time) urban fire fighters. 8.6. The ACT Ambulance Service responded to 24,565 cases in 2001-02, whichrepresents a 10.3% increase on the previous year. The increase in demand was eased bythe introduction of two single-officer response units. These units consist of a singleparamedic offering emergency treatment prior to or in place of a stretcher ambulanceresponse. 8.7. During 2001-02, the bushfire service responded to 158 grass fires, and theemergency service responded to 122 calls for assistance. These figures reflect anunusually quiet bushfire season in terms of call outs. However, several of the incidentswere considered serious events including a series of uncontrolled fires which burned for52 hours over the Christmas period, threatening over 70 private homes and requiring theattendance of 615 emergency personnel. 8.8. Since 11 September 2001, there has been a significant increase in the incidence ofpotential terrorist and terrorist related events in the ACT. Since October last year, the ACTFire Brigade has attended over 100 “white powder” incidents, including up to eight eventson one day. Each event requires the use of hazardous material (Hazmat) resources.These incidents have placed unprecedented demand on resources and whichnecessitated the establishment of additional logistics support capability to allow for multipleincident responses.
Overview of Service Delivery in the ACT
Session 8 – Law & Order & Public Safety – ‘Uncertain Times’
207
8.9. The assessment of an economic environment factor reflects the Commission’sacknowledgment that the structure and nature of a State’s economy affects its ability toprovide certain services. In the 1999 Review, the Commission assessed the economicenvironment factor for Public Safety as the average of two factors - one based onresidential and commercial fire insurance claims, and the other based on unimproved landvalue.
8.10. The concept of compensating a State for its inability to provide a standard level ofservice is valid, however, the method of assessment is in the ACT’s view flawed. As thecase put by several States in their main submissions argued, the dollar value of fireinsurance claims is not a suitable proxy for measuring a State’s ability to provide servicesas there is no correlation between a State’s capacity to provide a service and the dollarvalue of fire insurance claims.
8.11. For the 2004 Review, indicators of risk and capacity to measure the economicenvironment factor are proposed. The revised assessment method is unworkable for tworeasons.
8.12. Firstly, risk is difficult to measure, particularly as it is inherently influenced by thepolicies of the States. Jurisdictional risk is policy influenced via risk managementprograms and mitigated by expenditure on community education and prevention activities.The ACT is committed to the strategies of prevention and mitigation of hazards becauseover the longer term, in an environment where demand for resources is becoming morecompetitive, a strategy which involves the community and encourages self-help andhazard awareness is more sustainable than a strategy that relies on response.
8.13. In the 2001-02 financial year, the ACT spent 20% of the Emergency ServicesBureau budget on prevention and mitigation. Programs such as ‘CLASP’ for the aged and‘Fire Ed’ for younger school children have helped to raise awareness of personal safetyissues in vulnerable sectors of the community. At a macro level the Emergency ServicesBureau has a key role in large-scale disaster planning on behalf of the ACT in the areas of:
• flood;
• infrastructure support;
• community recovery; and
• technological failure.
8.14. The second flaw of the proposed method is the use of a risk-driver based on costsof property loss from structural fires. This driver does not address the fundamental issuethat using the value of property destroyed does not measure the cost of or demand for fireprotection services.
8.15. The poor relationship between property loss and the cost or demand for a fireservice is demonstrated through consideration of factors that affect the amount of firedamage, but are not necessarily related to capacity or risk:
Economic Environment Factor
Session 8 – Law & Order & Public Safety – ‘Uncertain Times’
208
• response times to incidents – the slower the response, the greater the potential loss.This may be influenced by decisions on where to place stations or fire crews ratherthan the costs of providing the service;
• location of the fire – in a dormitory suburb or heavy industrial area, the response timeswill differ but again bears no relationship to costs;
• the market value of property – for example Sydney property values compared withHobart property values will have a large impact on the cost of fire damage;
• variation on property valuation within jurisdictions – for example property value withininner city Sydney compared with property value in far western Sydney suburbs; and
• construction material of dwellings – this varies substantially between jurisdictions forexample brick veneer compared with weatherboard.
8.16. It is almost impossible for the economic environment to be assessed in relation tohow fire service provision is affected without policy contamination of data. For example,an alternative measure of risk is the capacity of Fire Services to respond to fires andcontain fires to the room of origin. This measure is used by the CommonwealthProductivity Commission to compare actual performance between jurisdictions. The abilityof a fire service to contain a fire to room of origin reflects the fire services effectivenessand their compliance with national standards. Unfortunately, this measure may be seen tobe policy influenced as each jurisdiction develops their own policies for achievingtargets/standards.
8.17. The economic environment factor should measure a States basic ability to maintaina state of readiness, considering factors such expenditure on training, purchase andmaintenance of equipment, cost of operating a 24 hour call centre, and so on. These arestandard costs that all states bear regardless of the number of incident they attend or thesize, nature or extend of fire damage. An example of this is the Commonwealth armedforces or security services. The majority of costs incurred are attributed to maintaining aready force, not the actual responses. It is the ACT’s contention that any linkage betweenthe overall cost of providing services and measures based solely on outcomes of aresponse are not a true reflection of economic differences.
8.18. Similarly, the cost of road accident rescues is not a suitable measure of economicenvironment. There is difficulty within the industry at present gathering valid comparabledata on road accident rescue. The Australasian Fire Authority Council (AFAC) has beenworking with the Productivity Commission to attempt to collect such incident data.
8.19. The work undertaken with AFAC to date has indicated difficulties making simplecomparisons of road accident rescue data. Different states use different agencies toundertake road accident rescue, for example NSW have five agencies that participate.Simple analysis becomes more difficult when consideration is given to the fact that roadaccident rescue in urban areas will be more likely to be undertaken by paid career officers,whereas in non-urban areas it is more likely to be undertaken by unpaid volunteers.
8.20. The Bureau of Transport and Regional Economics summarised the difficulties incollecting accurate data in the report ‘Road Crash Costs in Australia’, when it stated:

Session 8 – Law & Order & Public Safety – ‘Uncertain Times’
209
“Anecdotal evidence indicates that uninsured vehicles and vehicles inunreported crashed tend to be of below-average value, so insurance claim dataare expected to underestimate the number of vehicles involved in crashed andto overestimate the average cost of vehicles damage. The Federal andState/Territory police forces are the alternative sources of crash data, but policecrash statistics are far from complete. Each State/Territory has varyingminimum requirements for reporting crashes…at fault drivers may often fail toreport a crash even if it meets the reporting criteria. Consequently only afraction of all road crashes are reported to police. “
8.21. As part of its mitigation activities, the ACT is also pro-actively involved in a numberof programs to reduce the incidence of road accident death in specifically targetedpopulation groups (adolescents and the aged). The collection of data on the cost of roadaccident rescue, and death, is a reflection of failure of prevention measures rather thanaddressing the underlying risk suitable for an economic environment factor related to fireservices.
8.22. The ACT does not have information about the cost of industrial accidents in theTerritory or relative workload for fire and emergency services.
8.23. The ACT Emergency Services Bureau does not record responses to incidents bythe categories of urban, rural or remote. There is no information available and thereforethe ACT supports the continued assessment based on dispersion and input costs usingthe general method.
8.24. For the reasons outlined above, the ACT believes that an EconomicEnvironment Factor is not appropriate for the public safety category.
8.25. The ACT raised three points relating to national capital influence in its MainSubmission:
• the inability to recruit volunteers;
• responses by the HAZMAT unit to Commonwealth buildings since 11 September; and
• the effect that the design and layout of the ACT has on fire fighting services.
8.26. The ACT understands that the Commission addressed the first two points in itsDiscussion Paper CGC 2002/34. The third point raised by the ACT relates to the effectthat the Territory’s Open Spaces Plan has on ACT Fire brigade service delivery.
8.27. The National Capital Authority is the Commonwealth agency responsible for lookingafter the National Capital aspects of Canberra. The Authority administers and reviews theNational Capital Plan (NCP), the object of which is to ensure that Canberra and the ACTare planned and developed in accordance with their national significance.
National Capital Influences
Session 8 – Law & Order & Public Safety – ‘Uncertain Times’
210
8.28. The National Capital Open Space System is incorporated into the Territory Planunder four separate land use categories:
• Lake Burley Griffin;
• hills, ridges and buffer spaces;
• river corridors; and
• mountains and bushland.
8.29. The NCP specifies that the inner hills are to remain substantially undevelopedmeaning residential property backs directly onto natural bushland in the suburbs. Theinner hills areas have a naturally high risk of bushfire in summer and their close proximityto residential zones means that the threat to property is substantial.
8.30. In other States, towns are fringed by rural and semi-rural zones. Volunteer firebrigade activity is strongest in rural communities for reasons of property and communityprotection. In the larger jurisdictions, bushfires in outback regions are often left to run theircourse as they pose very little risk to life or property (outback WA, NT, Qld, NSW and SA).
8.31. In other words, a decision is made to defer response until the threat becomes moretangible or not respond at all. The ACT considers this to be a risky approach, as bushfiresin the Territory or NSW border quickly impinge upon urban zones threatening homes andproperty as was the case in last year’s Christmas bushfires. The Canberra Times articlesat Attachment A give an indication of the threat posed to property and infrastructure in theTerritory.
8.32. In addition, due to the fuel availability and prevailing wind direction, bushfires tendto approach the Territory and city from the West. Most of Canberra’s water supplycatchment is located west of the city and is therefore affected by bushfire in the area. Thisfurther increases the requirement to quickly extinguish bushfires.
8.33. The ACT requests an increase to the National Capital Allowance inrecognition of the impact that the National Capital Open Space System has on thethreat of bushfires to the ACT urban environment.
8.34. The ACT has been involved in a long period of negotiation with the Department ofFinance and Administration regarding the Commonwealth contribution for providing fireprotection to Commonwealth assets in the ACT.
8.35. Prior to self-government the Commonwealth contributed one third of the cost of firefighting services to the ACT. However in 2000-01 the Commonwealth substantiallyreduced that contribution in the absence of a formal new agreement with the ACT. TheCommonwealth has made no payment at all this year despite being invoiced.
8.36. The ACT and DOFA are in protracted negotiations for an agreeable outcome.Given these negotiations have not been resolved to the satisfaction of the ACT, the
Commonwealth Contribution for Fire-Fighting Services in the ACT
Session 8 – Law & Order & Public Safety – ‘Uncertain Times’
211
Territory has requested the Commission to consider a claim for special fiscal needs as partof the 2003 Update process. This would include some backcasting to reflect theCommonwealth’s non-payment for services already provided.
8.37. The ACT submits that the an Economic Environment Factor is inappropriatefor the Public Safety category, as it is based on measures of risk that implicitlyinclude the influences of States’ policy choices.
8.38. The ACT notes that the proposed drivers for calculating risk based on costsof property loss from structural fires, and cost of industrial fires, do not address thefundamental issue that using the value of property that has been destroyed is not ameasure of the cost of or demand for fire protection services. 8.39. Use of road accident response costs is not a suitable proxy for measuringrisk due to the difficulties in obtaining accurate data.
8.40. The ACT submits that the National Capital Allowance should includerecognition of the impact of the National Capital Open Spaces System on the ACTFire Brigade.
Conclusion
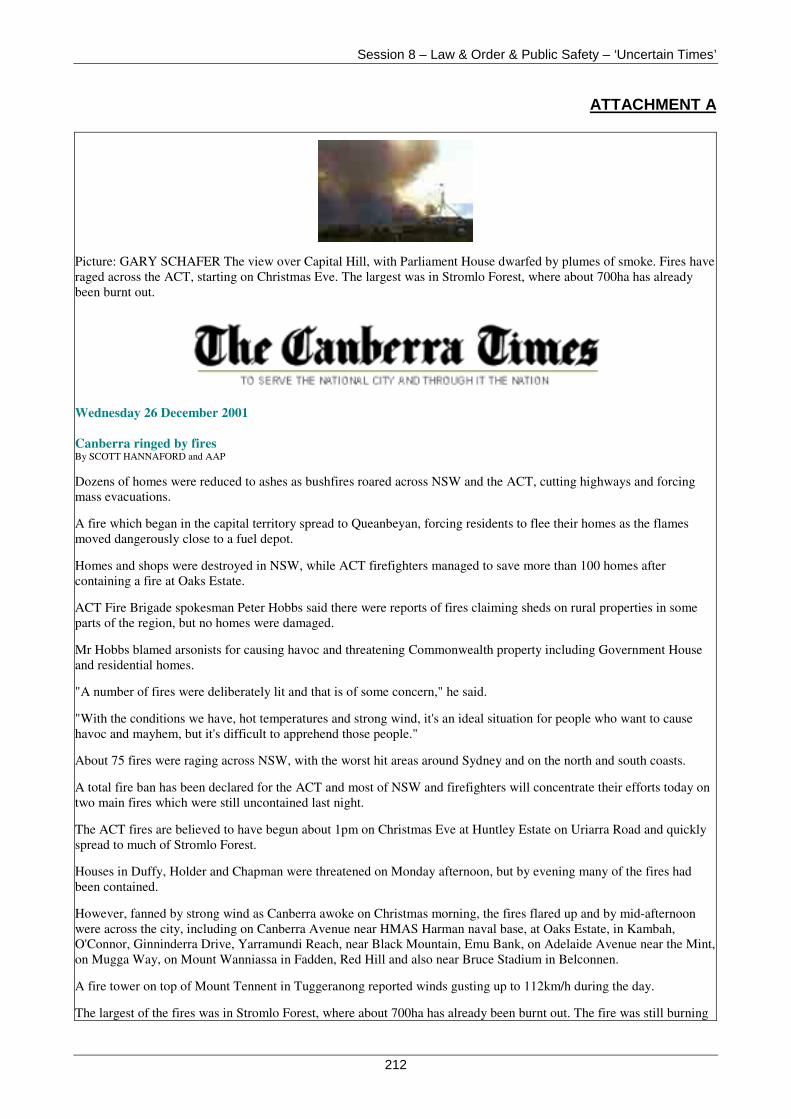
Session 8 – Law & Order & Public Safety – ‘Uncertain Times’
212
ATTACHMENT A
Picture: GARY SCHAFER The view over Capital Hill, with Parliament House dwarfed by plumes of smoke. Fires haveraged across the ACT, starting on Christmas Eve. The largest was in Stromlo Forest, where about 700ha has alreadybeen burnt out.
Wednesday 26 December 2001
Canberra ringed by firesBy SCOTT HANNAFORD and AAP
Dozens of homes were reduced to ashes as bushfires roared across NSW and the ACT, cutting highways and forcingmass evacuations.
A fire which began in the capital territory spread to Queanbeyan, forcing residents to flee their homes as the flamesmoved dangerously close to a fuel depot.
Homes and shops were destroyed in NSW, while ACT firefighters managed to save more than 100 homes aftercontaining a fire at Oaks Estate.
ACT Fire Brigade spokesman Peter Hobbs said there were reports of fires claiming sheds on rural properties in someparts of the region, but no homes were damaged.
Mr Hobbs blamed arsonists for causing havoc and threatening Commonwealth property including Government Houseand residential homes.
"A number of fires were deliberately lit and that is of some concern," he said.
"With the conditions we have, hot temperatures and strong wind, it's an ideal situation for people who want to causehavoc and mayhem, but it's difficult to apprehend those people."
About 75 fires were raging across NSW, with the worst hit areas around Sydney and on the north and south coasts.
A total fire ban has been declared for the ACT and most of NSW and firefighters will concentrate their efforts today ontwo main fires which were still uncontained last night.
The ACT fires are believed to have begun about 1pm on Christmas Eve at Huntley Estate on Uriarra Road and quicklyspread to much of Stromlo Forest.
Houses in Duffy, Holder and Chapman were threatened on Monday afternoon, but by evening many of the fires hadbeen contained.
However, fanned by strong wind as Canberra awoke on Christmas morning, the fires flared up and by mid-afternoonwere across the city, including on Canberra Avenue near HMAS Harman naval base, at Oaks Estate, in Kambah,O'Connor, Ginninderra Drive, Yarramundi Reach, near Black Mountain, Emu Bank, on Adelaide Avenue near the Mint,on Mugga Way, on Mount Wanniassa in Fadden, Red Hill and also near Bruce Stadium in Belconnen.
A fire tower on top of Mount Tennent in Tuggeranong reported winds gusting up to 112km/h during the day.
The largest of the fires was in Stromlo Forest, where about 700ha has already been burnt out. The fire was still burning
Session 8 – Law & Order & Public Safety – ‘Uncertain Times’
213
last night.
More reports and pictures Pages 15, 16 and 17; Editorial, Sharpe's view Page 20
By yesterday afternoon, a 6km-long wall of fire was moving through the Stromlo Forest area.
By last night, several of the fires had been contained and were being monitored for further flare-ups.
On Monday, firefighters were positioned outside Government House as the flames approached, and animals at theNational Aquarium and Wildlife Park had to be moved away from some of the outer enclosures as spot fires startedburning the fences and inside the grounds of the park.
Visitors to the youth hostel in O'Connor and residents of Dryandra Street were evacuated as the first of the firesthreatened to come down through bushland on Monday. The fire burned to the fence line of one property on the bushside of the street. All ACT parks have been closed until January 2.
A police spokesman said there had been no arrests in relation to the fires, although police had spoken to someoneyesterday who had been giving them some information.
The spokesman said it was too early to determine if the fires had been caused by arson and there would be an inquiryinto how they began.
All available fire, police, ambulance and other emergency personnel were called in to help fight the fires, includingworkers from interstate. However, fires throughout NSW limited the amount of support which could be provided to theACT.
Local company Venture Helicopters was called in to help dump water and spot fires from the air, and was joined by theSnowy Scheme SouthCare helicopter. Venture Helicopters is expected to provide a second helicopter today to assist inthe operation.
There had been no loss of property in the ACT as of last night, but many areas of the city remain on high alert asfirefighters brace for another day of fierce winds.
The weather outlook looks set to further hamper efforts to control the fires, with temperatures on Saturday forecast toreach a maximum of 33 degrees Celsius and continuing strong winds.
Canberrans are advised to report all grass and bush fires at 6207 8603.
Session 8 – Law & Order & Public Safety – ‘Uncertain Times’
214
Friday 28 December 2001
ACT's five big fires contained but risks remain extremeIAN WARDEN
After burning 1500ha of the ACT on Christmas Day and Boxing Day, the territory's five major fires were all containedyesterday.
However, an anxious ACT Chief Fire Officer, Peter Lucas-Smith, ruled out sending any ACT firefighters to help inNSW while fire risks in the ACT were still so extreme.
"It's not that we don't want to support them [in NSW]. We would do, and we have in the past, but I think we've got ourown problems here at the moment. We've got to make the ACT community safe.
". . . We've still got three or four months in front of us, because normally these sorts of fire conditions we're facing nowwe [usually] experience in the ACT in March and sometimes in early April," he said yesterday.
He said that with 54km of perimeters around 1500ha of burnt and sometimes still-burning ground to supervise, andmore hot and windy weather forecast, "our levels of standby and readiness are still very high".
He hoped Canberrans would think of the fires as an early summer "wake-up call", especially if they lived close towoodland or parkland. He advised them to minimise fire risks to themselves and their homes by keeping the grassaround their homes mowed and irrigated, their gutters clear of leaves, and making sure there was nothing combustibleabout the place for embers to ignite.
Mr Lucas-Smith said that only determined firefighting had saved the ACT from extensive property damage.
"Our 1500ha [burnt] may not sound very significant when you think of the size of the fires in the Blue Mountains andaround Sydney, but it's the relationship of that 1500ha to the urban environment of the ACT, going right into the city,and the impact it had on the people of Canberra . . . I think it was an extraordinary effort made by all the firefighters.
"We had a number of kilometres of urban edge totally exposed to fire and potential damage, and we abandoned quite afew of the pine plantation areas to sacrifice the pines in favour of property protection."
Late yesterday there was still smoke from fires in the Stromlo area, and the fire at Red Hill was continuing, althoughcontained, and there were some dangerous trees and powerlines near the summit road.
The 40 firefighters from the Country Fire Authority of Victoria worked on the Stromlo fires until yesterday evening, butthen would possible be moved to Sydney to help there.
The Mt Wanniassa fire flared again yesterday but was contained.
The Oaks Estate and O'Connor Ridge fires were either extinguished or contained by late yesterday, and almost all ACTroads closed during the fires, including the Tuggeranong Parkway, were either reopened or scheduled for reopening,although Lady Denman Drive and the road to the Red Hill lookout were still closed last night.
The acting superintendent of the Australian Federal Police, Gary Shute, said yesterday that there had been no arrests yetin connection with the fires, but "we're still making inquiries and we're getting some interesting reports from the public,which will be investigated, of people being seen in the areas that they shouldn't have been in".
He said that because it was so "life-threatening", arson "is probably one of the most careless and malicious acts therecan be", and noted that in some cases convicted arsonists could be given sentences of more than 20 years' jail.
He urged motorists to take extreme care when driving through burnt-out areas not to become distracted by it, and to beaware of desperate and hungry animals on the move looking for roadside grass.
Maxine Cooper, of Environment ACT, said injured wildlife should be reported to rangers on 6207 2127 (south side) or6207 1679 (north side) or 6207 5111 after regular hours. The RSPCA could be contacted on 0413 495 031.
Session 8 – Law & Order & Public Safety – ‘Uncertain Times’
215
A respiratory specialist at Canberra Hospital, Dr Mark Hurwitz, warned yesterday that with so much smoke in the airasthmatics might be facing a crucial time.
"Asthmatics should review their action plans and, if necessary, increase or commence their preventer-puffers andinhaler usage" Dr Hurwitz said.
The ACT's Minister for Urban Services, Ted Quinlan, looked at the devastation from a helicopter on Boxing Day andyesterday gave "a very big thank you" to everyone who had helped with the fighting of the fires.
"The 200 ACT firefighters, the ACT Bushfire Services, the volunteers, the ACT Fire Brigade, ACT EmergencyServices, ACT Forests, Environment ACT, Canberra Urban Parks and Places, and the crews from Victoria and NSW . .. these people abandoned Christmas dinners and family celebrations to protect our city and for that I thank them," hesaid.
He promised an official thank-you ceremony for everyone when the fire season had passed.
Session 8 – Law & Order & Public Safety – ‘Uncertain Times’
216
(B) LAW AND ORDER - POLICE
Joint Emergency Services Centre, Gungahlin
Tim Keady, Chief Executive, Department of Justice & Community Safety.
Mr Keady has been Chief Executive of JACS since March 1996, prior to this he had adistinguished career in a range of NSW justice related departments.
Assistant-Commissioner Andy Hughes, Deputy Chief Police Officer (DCPO) for theACT, is Commander of North and South District Operations, Territory Investigations andOperations Monitoring and Intelligence Support.
DCPO Hughes formally held the position of General Manager International and FederalOperations and has extensive experience in national and international policing. He wasone of the AFP’s Liaison Officers in London between 1994 and 1996 and was a member ofthe Interpol Executive Committee as the Asia Region Delegate.
Presenters
Session Objectives
• To demonstrate the relative disadvantage experienced by the ACT in terms ofcross-border issues, the over-representation of young males within the communityand diseconomies of scale in information technology and forensic service areas.
• The session will also cover the unique responsibilities of the ACT in terms ofpolicing the national capital and the provision of policing services in accordancewith a unique legislative and political framework.
Cross Border
• To demonstrate the impost on the ACT of the large number of inter-state basedoffenders who commit crimes in the Territory and are subject to criminalinvestigations which must, as a result, take account of differences in legislative andoperational requirements.
Over-representation of Young Males
• To demonstrate that young males contribute significantly to the number ofoffenders in the ACT and to show how this rate has increased.
Scale Affected Expenditure
• To illustrate that the ACT suffers from diseconomies of small scale in the areas ofinformation technology, training and forensic support services
Venue
Session 8 – Law & Order & Public Safety – ‘Uncertain Times’
217
Other Departmental Representatives
Dr Tony Murney, Director, Corporate Services. Dr Murney commenced working with theAFP in 1998 following a long-term career with the Commonwealth Parliament. He isresponsible for Human and Financial Resource Management for ACT Policing as well asresearch and policy development.
Description of Services
8.41. ACT Policing is an arm of the Australian Federal Police (AFP) and its goal is to“keep the peace and preserve safety in the ACT”. ACT Policing provides policing servicesto the whole of the ACT community including all minority and special needs groups.
8.42. Policing activities in the ACT are conducted in accordance with the PolicingArrangement between the ACT and Commonwealth Governments and implemented on anannual basis in terms of a Purchase Agreement between the Chief Police Officer for theACT and the ACT Minister for Police.
Key Points from the ACT Main Submission
Overview of Service Delivery in the ACT
Police Services - Socio-demographic Composition
• The cost of policing services in the ACT is influenced by rates of crime. The ACThas a relatively high proportion of its population in the male, 17 to 25-agepopulation cohort (8.15% compared to a national average of 6.56%), which is thegroup with the highest propensity to be engaged in criminal activities.
• The ACT requests that the cost weight for young males be investigated with a viewto increasing it from 2.5 to a cost weight of 4 or 5 to reflect the burden this groupplaces on Police Services nationally.
Police Services - Cross Border
• The AFP and the ACT Courts data indicate that non-residents commit a highproportion of offences in the Territory.
• The ACT requests an increase in the cross border factor from the currentassessment of 16% to 18% to reflect cross border demands.
Scale Affected Expenditure
• The diseconomies of small scale and input costs disabilities should continue to beassessed.
Session 8 – Law & Order & Public Safety – ‘Uncertain Times’
218
8.43. The objectives established under the 2001-2002 Purchase Agreement are set outbelow:
• Provide a 24 hour police service which is highly responsive to the needs of thecommunity;
• Reduce fear of crime;
• Increase public awareness of community safety issues;
• Increase police involvement in community and inter-agency partnerships aimed atcrime reduction;
• Provide 24 hour investigation services to detect and deter crime;
• Reduction in the number of road crash fatalities;
• Reduction in the number of road crash injuries;
• Increased compliance with motor traffic laws and road safety requirements;
• High level preparedness for the effective management of public emergencies/disasters(including search and rescue, maintenance and testing of emergency plans, trainingprograms and simulated exercises);
• Effective discharge of the responsibilities of Territory Controller pursuant torequirements of the Emergency Management Act 1999;
• Enhanced safety at major public events through high quality planning and coordination;
• Provision of effective prosecution, and court services to assist in the efficientadministration of justice;
• Provision of efficient firearms and other regulatory services; and
• Delivery of responsive information services - including provision of information andadvice to the Minister and government agencies.
8.44. A copy of the current organisational structure is contained in Attachment A.
Location of Services
8.45. There are currently six operational police stations in the ACT including theGungahlin and City shop fronts as well as ACT Policing Headquarters at the WinchesterPolice Centre in Belconnen. Stations are currently located in the major town centres ofCity and Belconnen (North District) and Woden and Tuggeranong (South District).
8.46. Traffic Operations in the ACT are undertaken under a centralised modelcoordinated from City Station. A centralised Crash Investigation Team is based atTuggeranong Station and members of this team attend all serious motor vehicle accidentsin the ACT.
Extent of Service Provision
8.47. Since 1 July 2001, ACT Policing has shifted from an input driven model of policingto one reliant on the funding of outcomes and outputs.
Session 8 – Law & Order & Public Safety – ‘Uncertain Times’
219
8.48. There are currently 584 sworn members employed by ACT Policing which isequivalent to 181.5 police per 100,000 population in comparison to a national average of215 police per 100,000 population 45. During the 2001-2002 financial year ACT Policingprovided an average of 79 patrols per day including foot and vehicular patrols. In the sameperiod ACT Policing responded to 70,411 reported incidents and 41,831 reported/identifiedoffences.
8.49. Current crime trends indicate an average of 438 burglary offences per month,198 stolen motor vehicle offences per month, 191 non-sexual assaults and 27 sexualassaults per month.
8.50. ACT Policing is currently reviewing and strengthening its focus on preventativestrategies and improving partnerships with the community in responding to and preventingcrime in association with broader intelligence-led policing tactics.
8.51. Targeted crime prevention programs conducted by ACT Policing include:
• Police Scouts;
• Diversionary Conferencing;
• Multicultural Policing Interface;
• Police Citizens Youth Clubs; and
• The Constable Kenny Koala education campaign.
Differences in Service Provision in the ACT compared to Other Jurisdictions.
8.52. The unique position of the ACT amongst Australian policing jurisdictions has beenhistorically recognised by the inclusion of two adjustments in the funding formula, thesebeing the:
• National Capital Factor which recognises the additional financial burdens arising fromCanberra’s role as the nation’s capital; and
• Policing Factor which makes adjustments for the ACT’s reliance on theCommonwealth for the provision of police services and associated reductions incontrol over cost factors influencing the delivery of police services.
8.53. In addition allowances are made across all jurisdictions for cross-border issues andsocio-demographic factors which have direct impacts on the level and quantity of servicesdelivered by state and territory governments.
8.54. While the first two factors are not subject to contention in this set of briefing notes,the difficulties in obtaining jurisdictionally comparable data in the course of their originalassessment is illustrative of the problems faced by the ACT in obtaining detailedquantitative data on more general factors where disadvantage is due to circumstanceswhich are unique to the Territory or are not of sufficient national profile to becomecollection priorities for other jurisdictions. This is the case for the two issues which are thefocus of these notes, being that:
45 Source: Report on Government Services 2002.
Session 8 – Law & Order & Public Safety – ‘Uncertain Times’
220
• The ACT experiences unique disadvantage by comparison to all other Australianjurisdictions in relation to the cross-border crime and regulatory management issues;and
• Over representation of the demographic group in the population which is responsiblefor the majority of crime disadvantages the Territory by comparison to the Australianaverage.
8.55. Data problems in relation to the first issue arise from the fluid and unregulatednature of cross-border movements within Australia with the effect that administrative datawhich would be generated in more regulated environments is nonexistent and it istherefore difficult to demonstrate disadvantage using comprehensive qualitative data. Thetreatment for this problem will be to substitute police intelligence observation, qualitativepolice intelligence information and proxy measures to scope the degree of disadvantage.
8.56. In respect of the second issue, good demographic information is available.However, jurisdictionally comparable data on the crime profiles for these groups is notavailable, as information on offenders is not comparable across Australian jurisdictionsdue to definitional issues based in legislative variation and the absence of uniformreporting requirements. (Note that the National Crime Statistics Unit is currently seeking toaddress this issue through development of an Offender Based Data Collection). Thetreatment for this problem will be to examine the effects of disproportionate representationof criminal elements in the relevant demographic group within the ACT and examine theconsequences of this phenomenon.
Interaction with Other States
8.57. At a policy level, ACT Policing participates in a wide number of inter-jurisdictionalfora including the Police Commissioners Conference, The Australasian Police Minister’sCouncil and associated Senior Officer’s Group and the Intergovernmental Committee ofthe National Crime Authority, the Council of Australian Governments Review ofCommonwealth State Service Provision, CrimTrac, the Standing Advisory Committee onProtection Against Violence (SAC-PAV) and the National Crime Statistics Unit Board ofManagement. ACT Policing also supports the National Common Police Servicesincluding the Australasian Centre for Policing Research and the National Institute ofForensic Science.
8.58. Cross-border crime and regulatory management issues faced by the ACT areextreme by comparison with other Australian jurisdictions. The ACT’s border environmentdiffers from all other Australian jurisdictions in three key respects from a law enforcementperspective:
• The ACT is a jurisdictional island in NSW and functionally integrated by major arterialtransport links into the state economy of NSW, including Sydney. Consequently,high-level movements of people, goods and services from NSW into the ACT providemechanisms for the infusion of criminal activity from one jurisdiction to the other. This
Cross Border Issues
Session 8 – Law & Order & Public Safety – ‘Uncertain Times’
221
factor is an accepted reality of both national and international crime development but isrecognised as being extremely difficult to quantify due to the covert nature of criminalorganisations. Data on regulatory activity, such as traffic offences, provides insightsinto this area to the extent that breaches are identified.
• The scale of the NSW economy is proportionately so much larger than that of the ACTthat infusion effects are magnified in the ACT. The infusion effect is disproportionateas NSW criminal activity is magnitudes larger than that of the ACT and transference islargely one-way due to the dominance of NSW criminal activity, particularly thatgenerated in Sydney.
• These effects are further exacerbated in the ACT by comparison to all otherjurisdictions as these have larger buffer zones between their major urban centres andadjacent jurisdictions. Western Australia, South Australian, Tasmania and theNorthern Territory all have extremely remote border locations with large distancessegregating major urban centres from the nearest jurisdiction while Queensland, NSWand Victoria have only minor urban overlaps at restricted border locations. Thecombined effects of large and remote buffer zones along with segregation of majorurban centres creates a significant distance decay effect which minimises the scopefor routine crime ‘spill-over’ between these jurisdictions. This protective barrier doesnot exist between NSW (Australia’s most populous jurisdiction) and the ACT asarguably the most vulnerable in the country.
8.59. Police intelligence has identified direct and well-developed links between NSWorganised crime, particularly that based in Sydney, and subsequent attempts by thesegroups to penetrate the ACT. This type of activity is heavily oriented to the manufactureand distribution of illicit drugs through the development of markets in the Territory,especially those for lucrative designer drugs such as ecstasy and other amphetaminederivatives with a counter trade in property stolen in the ACT being laundered in Sydney.
8.60. The Commission has called into doubt the ACT's data on cross-border criminalactivity in its November Discussion Paper Law and Order (CGC 2002/36). The ACT wouldlike the Commission to note that while it is not appropriate to report detailed intelligence ina document of this type, ACT police have mounted numerous operations to interdictinfusion of NSW crime into the Territory by targeting entry points for major transport links.These operations provide an insight into the actual level and severity of criminal activityresulting from cross-border disadvantages. Some case studies are illustrated on thefollowing page.
Session 8 – Law & Order & Public Safety – ‘Uncertain Times’
222
Case Studies
Operation Cablet - murder of Saudi Diplomat Abdullah Al Ghamedi
Three of the four suspects involved in this offence were Sydney residents. A fullinvestigative team comprising detectives from the ACT was established in offices of theEastern Region Headquarters. ACT investigators worked from Sydney for several weeksduring the course of the investigation. The total cost of this investigation was $744,089including approximately $24,000 in travel and related expenses.
Operation Axis
Joint ACT/National investigation into drug related activities of a Canberra based family withlinks to a NSW organised crime syndicate based in Sydney. This investigation involvedextensive investigation of links to Cabramatta based organised crime networks. As at July2000 the Operation had resulted in the arrest of 10 individuals and the laying of 91charges. Over 177 grams of heroin, with an estimated value of over $120,000 was seizedas well as in excess of $21,000 destined for Vietnam.
Most of the individuals charged are members or associates of one family, reportedlyresponsible for distributing up to 60% of heroin consumed in the ACT. The chargesinclude: one individual charged in relation to the possession of almost 170 grams ofheroin; one individual charged with unlawful wounding; and three individuals charged withover 20 counts each of possessing heroin for the purposes of sale or supply.
Operation Tobago
Murder of an ACT resident by a NSW resident involved in the supply of heroin in the ACT.ACT Policing apprehended the offender in Sydney following an extensive investigation incooperation with Bankstown detectives and AFP Eastern Region surveillance teams.NSW Police applied for a warrant on behalf of ACT Police leading to the location andapprehension of the offender who was subsequently extradited to the ACT and convictedof murder. This matter was subsequently overturned on appeal and ACT Policing iscurrently in the process of challenging this decision.
8.61. ACT Policing also has serious concerns in relation to the emergence of organisedcriminal elements in closer proximity to the ACT but outside jurisdictional reach. This isbest demonstrated by the activities of the Rebels Outlaw Motorcycle Gang which hasdeveloped a headquarters in Queanbeyan and subsidiary infrastructure in the south coasttown of Bateman’s Bay with the primary focus for its criminal activities being the ACT. Theprincipal modus operandi of this group is again the manufacture and supply of illicit drugs.However, the range of offences committed in or near the Territory covers alleged murder,assault, illegal possession of weapons, threats against police officers and organised theftwith an increasing potential for violence.
8.62. The common factor with all of these issues is that the organisers and perpetratorsof offences within the Territory are based in NSW and therefore outside of the direct reachof ACT Policing. This increases the likelihood that offenders will not be detected and
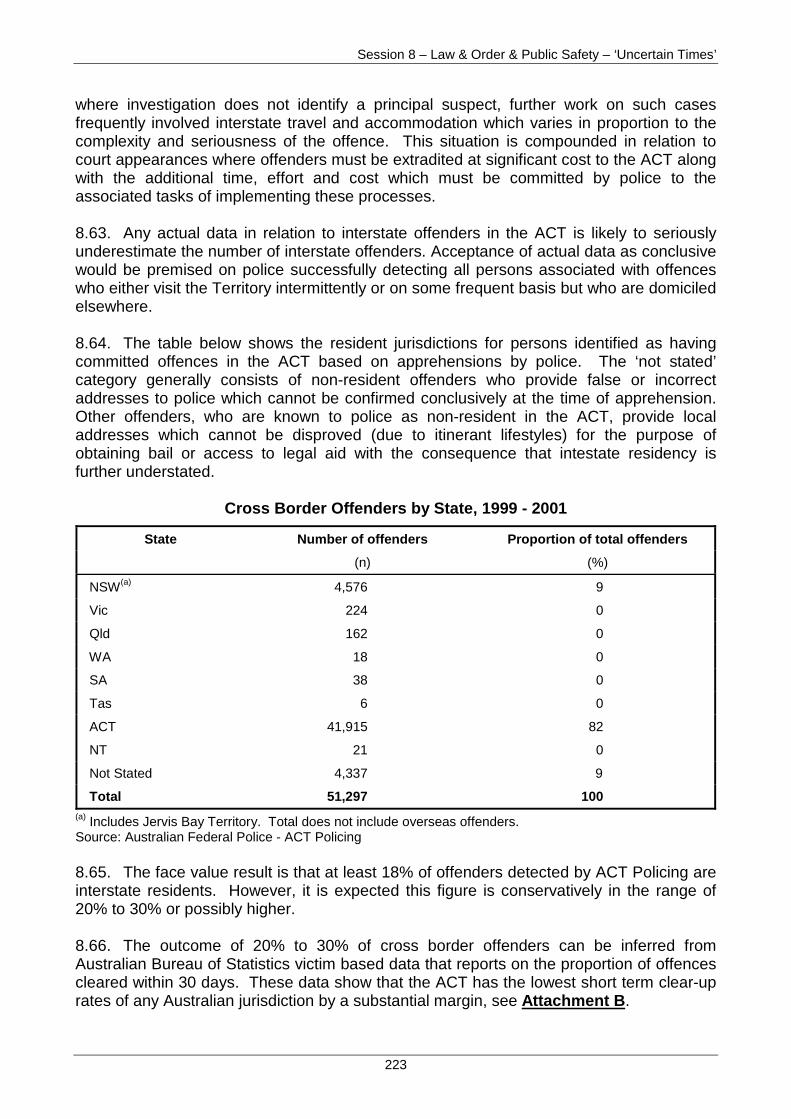
Session 8 – Law & Order & Public Safety – ‘Uncertain Times’
223
where investigation does not identify a principal suspect, further work on such casesfrequently involved interstate travel and accommodation which varies in proportion to thecomplexity and seriousness of the offence. This situation is compounded in relation tocourt appearances where offenders must be extradited at significant cost to the ACT alongwith the additional time, effort and cost which must be committed by police to theassociated tasks of implementing these processes.
8.63. Any actual data in relation to interstate offenders in the ACT is likely to seriouslyunderestimate the number of interstate offenders. Acceptance of actual data as conclusivewould be premised on police successfully detecting all persons associated with offenceswho either visit the Territory intermittently or on some frequent basis but who are domiciledelsewhere.
8.64. The table below shows the resident jurisdictions for persons identified as havingcommitted offences in the ACT based on apprehensions by police. The ‘not stated’category generally consists of non-resident offenders who provide false or incorrectaddresses to police which cannot be confirmed conclusively at the time of apprehension.Other offenders, who are known to police as non-resident in the ACT, provide localaddresses which cannot be disproved (due to itinerant lifestyles) for the purpose ofobtaining bail or access to legal aid with the consequence that intestate residency isfurther understated.
Cross Border Offenders by State, 1999 - 2001
State Number of offenders Proportion of total offenders
(n) (%)
NSW(a) 4,576 9
Vic 224 0
Qld 162 0
WA 18 0
SA 38 0
Tas 6 0
ACT 41,915 82
NT 21 0
Not Stated 4,337 9
Total 51,297 100(a) Includes Jervis Bay Territory. Total does not include overseas offenders.Source: Australian Federal Police - ACT Policing
8.65. The face value result is that at least 18% of offenders detected by ACT Policing areinterstate residents. However, it is expected this figure is conservatively in the range of20% to 30% or possibly higher.
8.66. The outcome of 20% to 30% of cross border offenders can be inferred fromAustralian Bureau of Statistics victim based data that reports on the proportion of offencescleared within 30 days. These data show that the ACT has the lowest short term clear-uprates of any Australian jurisdiction by a substantial margin, see Attachment B.
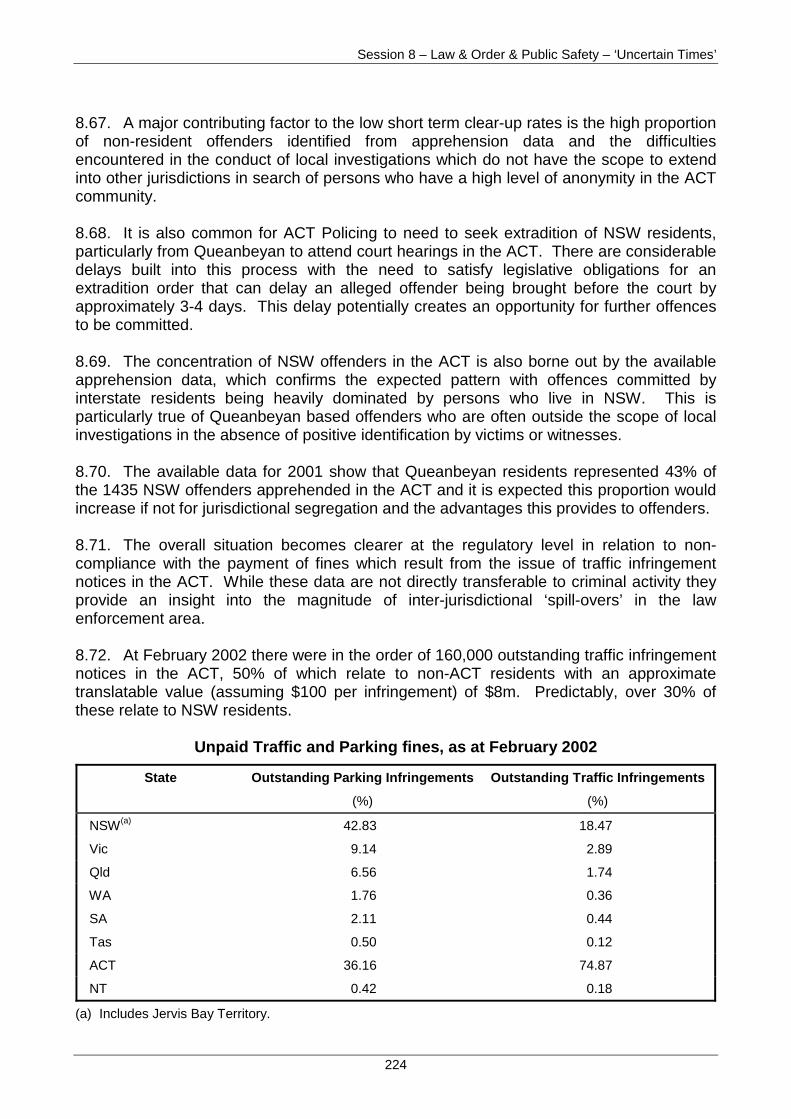
Session 8 – Law & Order & Public Safety – ‘Uncertain Times’
224
8.67. A major contributing factor to the low short term clear-up rates is the high proportionof non-resident offenders identified from apprehension data and the difficultiesencountered in the conduct of local investigations which do not have the scope to extendinto other jurisdictions in search of persons who have a high level of anonymity in the ACTcommunity.
8.68. It is also common for ACT Policing to need to seek extradition of NSW residents,particularly from Queanbeyan to attend court hearings in the ACT. There are considerabledelays built into this process with the need to satisfy legislative obligations for anextradition order that can delay an alleged offender being brought before the court byapproximately 3-4 days. This delay potentially creates an opportunity for further offencesto be committed.
8.69. The concentration of NSW offenders in the ACT is also borne out by the availableapprehension data, which confirms the expected pattern with offences committed byinterstate residents being heavily dominated by persons who live in NSW. This isparticularly true of Queanbeyan based offenders who are often outside the scope of localinvestigations in the absence of positive identification by victims or witnesses.
8.70. The available data for 2001 show that Queanbeyan residents represented 43% ofthe 1435 NSW offenders apprehended in the ACT and it is expected this proportion wouldincrease if not for jurisdictional segregation and the advantages this provides to offenders.
8.71. The overall situation becomes clearer at the regulatory level in relation to non-compliance with the payment of fines which result from the issue of traffic infringementnotices in the ACT. While these data are not directly transferable to criminal activity theyprovide an insight into the magnitude of inter-jurisdictional ‘spill-overs’ in the lawenforcement area.
8.72. At February 2002 there were in the order of 160,000 outstanding traffic infringementnotices in the ACT, 50% of which relate to non-ACT residents with an approximatetranslatable value (assuming $100 per infringement) of $8m. Predictably, over 30% ofthese relate to NSW residents.
Unpaid Traffic and Parking fines, as at February 2002
State Outstanding Parking Infringements Outstanding Traffic Infringements
(%) (%)
NSW(a) 42.83 18.47
Vic 9.14 2.89
Qld 6.56 1.74
WA 1.76 0.36
SA 2.11 0.44
Tas 0.50 0.12
ACT 36.16 74.87
NT 0.42 0.18
(a) Includes Jervis Bay Territory.
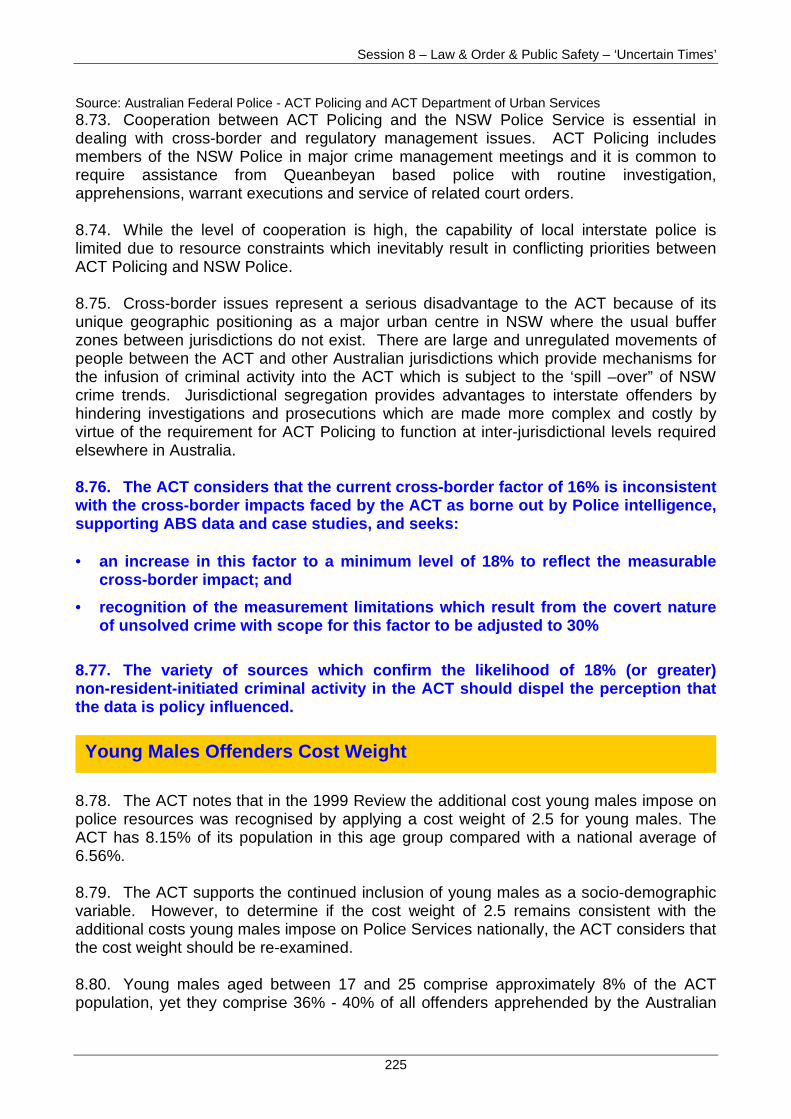
Session 8 – Law & Order & Public Safety – ‘Uncertain Times’
225
Source: Australian Federal Police - ACT Policing and ACT Department of Urban Services8.73. Cooperation between ACT Policing and the NSW Police Service is essential indealing with cross-border and regulatory management issues. ACT Policing includesmembers of the NSW Police in major crime management meetings and it is common torequire assistance from Queanbeyan based police with routine investigation,apprehensions, warrant executions and service of related court orders.
8.74. While the level of cooperation is high, the capability of local interstate police islimited due to resource constraints which inevitably result in conflicting priorities betweenACT Policing and NSW Police.
8.75. Cross-border issues represent a serious disadvantage to the ACT because of itsunique geographic positioning as a major urban centre in NSW where the usual bufferzones between jurisdictions do not exist. There are large and unregulated movements ofpeople between the ACT and other Australian jurisdictions which provide mechanisms forthe infusion of criminal activity into the ACT which is subject to the ‘spill –over” of NSWcrime trends. Jurisdictional segregation provides advantages to interstate offenders byhindering investigations and prosecutions which are made more complex and costly byvirtue of the requirement for ACT Policing to function at inter-jurisdictional levels requiredelsewhere in Australia.
8.76. The ACT considers that the current cross-border factor of 16% is inconsistentwith the cross-border impacts faced by the ACT as borne out by Police intelligence,supporting ABS data and case studies, and seeks:
• an increase in this factor to a minimum level of 18% to reflect the measurablecross-border impact; and
• recognition of the measurement limitations which result from the covert natureof unsolved crime with scope for this factor to be adjusted to 30%
8.77. The variety of sources which confirm the likelihood of 18% (or greater)non-resident-initiated criminal activity in the ACT should dispel the perception thatthe data is policy influenced.
8.78. The ACT notes that in the 1999 Review the additional cost young males impose onpolice resources was recognised by applying a cost weight of 2.5 for young males. TheACT has 8.15% of its population in this age group compared with a national average of6.56%.
8.79. The ACT supports the continued inclusion of young males as a socio-demographicvariable. However, to determine if the cost weight of 2.5 remains consistent with theadditional costs young males impose on Police Services nationally, the ACT considers thatthe cost weight should be re-examined.
8.80. Young males aged between 17 and 25 comprise approximately 8% of the ACTpopulation, yet they comprise 36% - 40% of all offenders apprehended by the Australian
Young Males Offenders Cost Weight
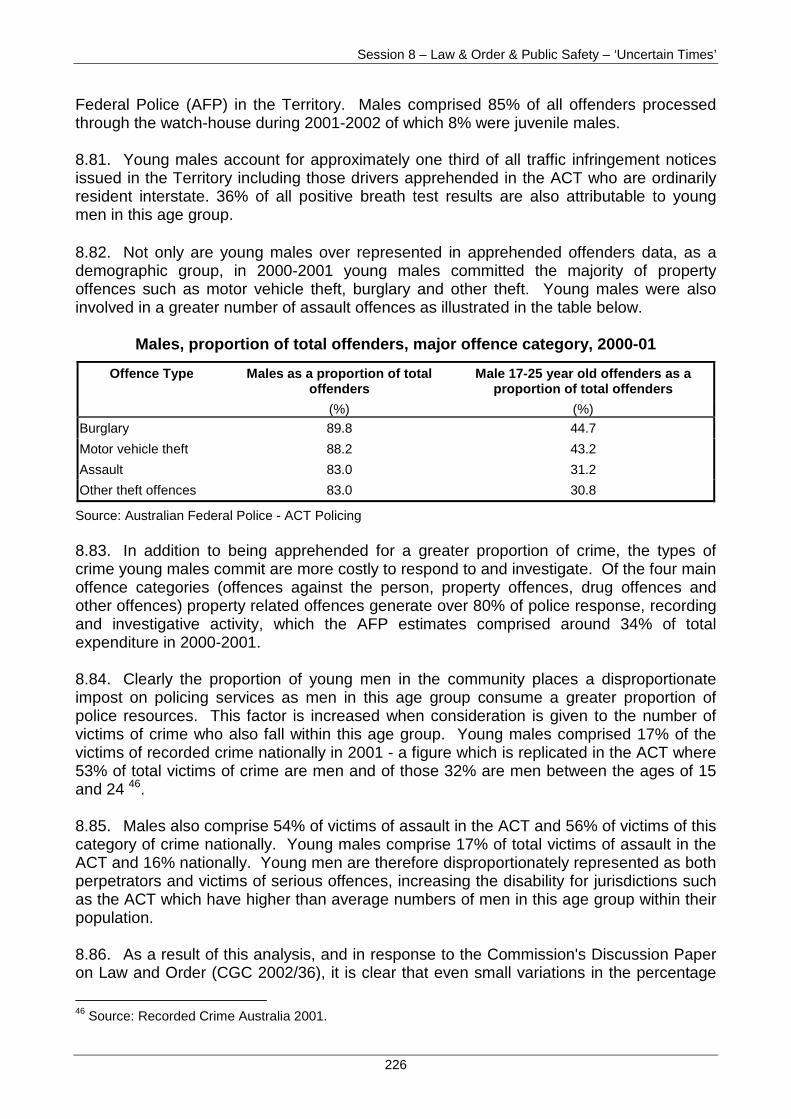
Session 8 – Law & Order & Public Safety – ‘Uncertain Times’
226
Federal Police (AFP) in the Territory. Males comprised 85% of all offenders processedthrough the watch-house during 2001-2002 of which 8% were juvenile males.
8.81. Young males account for approximately one third of all traffic infringement noticesissued in the Territory including those drivers apprehended in the ACT who are ordinarilyresident interstate. 36% of all positive breath test results are also attributable to youngmen in this age group.
8.82. Not only are young males over represented in apprehended offenders data, as ademographic group, in 2000-2001 young males committed the majority of propertyoffences such as motor vehicle theft, burglary and other theft. Young males were alsoinvolved in a greater number of assault offences as illustrated in the table below.
Males, proportion of total offenders, major offence category, 2000-01
Offence Type Males as a proportion of totaloffenders
Male 17-25 year old offenders as aproportion of total offenders
(%) (%)Burglary 89.8 44.7
Motor vehicle theft 88.2 43.2
Assault 83.0 31.2
Other theft offences 83.0 30.8
Source: Australian Federal Police - ACT Policing
8.83. In addition to being apprehended for a greater proportion of crime, the types ofcrime young males commit are more costly to respond to and investigate. Of the four mainoffence categories (offences against the person, property offences, drug offences andother offences) property related offences generate over 80% of police response, recordingand investigative activity, which the AFP estimates comprised around 34% of totalexpenditure in 2000-2001.
8.84. Clearly the proportion of young men in the community places a disproportionateimpost on policing services as men in this age group consume a greater proportion ofpolice resources. This factor is increased when consideration is given to the number ofvictims of crime who also fall within this age group. Young males comprised 17% of thevictims of recorded crime nationally in 2001 - a figure which is replicated in the ACT where53% of total victims of crime are men and of those 32% are men between the ages of 15and 24 46.
8.85. Males also comprise 54% of victims of assault in the ACT and 56% of victims of thiscategory of crime nationally. Young males comprise 17% of total victims of assault in theACT and 16% nationally. Young men are therefore disproportionately represented as bothperpetrators and victims of serious offences, increasing the disability for jurisdictions suchas the ACT which have higher than average numbers of men in this age group within theirpopulation.
8.86. As a result of this analysis, and in response to the Commission's Discussion Paperon Law and Order (CGC 2002/36), it is clear that even small variations in the percentage
46 Source: Recorded Crime Australia 2001.

Session 8 – Law & Order & Public Safety – ‘Uncertain Times’
227
of the population in this group translate into significant down stream effects for policewhich are entirely disproportionate to the scale of variation at the whole of population level.
8.87. The ACT requests the existing cost weight of 2.5 for young males beinvestigated, with a view to increasing it to 4 or 5 based on the experience of theAustralian Federal Police in the ACT.
8.88. As noted in the Main Submission, the ACT, and in particular the ACT Policing armof the AFP is affected by diseconomies of small scale. These diseconomies are affectedby the increasingly complex nature of police services and technological improvements.
8.89. The ACT community imposes the same standards and expectations on itsgovernment as that of any other jurisdiction. ACT Policing is expected to have thecapacity to fully utilise DNA technology, to keep pace with corporate and Internet basedcrime, to respond to emergent threats and to appropriately investigate major crimeinvolving citizens of the ACT. In order to meet these expectations, ACT Policing mustprovide a diverse, flexible and responsive police service capable of keeping pace withchanges in technology, modus operandi and investigative techniques.
8.90. Recent changes in the nature and complexity of crime across the nation, includingthe emergence of electronic fraud, Internet based child pornography networks, chemicaland biological threats and drug-induced sexual assault (drink spiking) have imposedadditional demands on police services across the country.
8.91. The capacity of jurisdictions to absorb these additional demands is greatlyinfluenced by existing economies of scale. Jurisdictions which already have large, multi-skilled fraud teams, for example, are more readily able to adjust to changes in the modusoperandi of offenders than small jurisdictions, such as the ACT, that is reliant on two orthree specialist investigators. This is due to the relative impact of the fixed costsassociated with the introduction of new information technology, forensic or analytical tools.
8.92. As with all enabling services, there is a basic cost impost that accrues regardless ofthe extent to which applications are subsequently utilised. For example, a softwaredesigner will levy similar fees to design and implement a Traffic Accident or Stolen MotorVehicle Management package to be used by ten investigators in the ACT as would becharged for such development work in a larger jurisdiction where several hundredinvestigators might work with it.
8.93. It is important to note that the emergence of new types of crime commonly adds tothe total volume of crime rather than replacing pre-existing types of crime. Internet basedtheft, for example, cannot be effectively policed by moving resources previously allocatedto shop theft or robbery offences as these continue to occur at similar levels. Wheresignificant new trends emerge there is a need for jurisdictions to reprioritise resourcestoward addressing the problem. Again larger jurisdictions have an advantage compared tothe ACT as larger jurisdictions will have access to a relatively greater pool of expertise andexperience which can be more easily sub-divided and re-arranged to address emerging
Scale Affected Expenditure
Session 8 – Law & Order & Public Safety – ‘Uncertain Times’
228
priorities, whereas the ACT is constrained by comparatively smaller pools of availableexpertise.
8.94. For example, major investigations in the ACT such as the recent murder of a youngCanberra woman resulted in the diversion of a number of experienced investigators fromwithin the Territory Investigations Group (TIG) to a dedicated Operational team tasked withinvestigating the murder. This had the consequent effect of reducing resources availablewithin the TIG to undertake ongoing investigations into serious crime in the ACT.
8.95. Several months later, with the murder investigation still progressing, a secondapparently unrelated murder took place in the ACT. This has had the unavoidable effect offurther depleting resources within the central investigations group. Such crimes areunpredictable and comparatively rare in the ACT. It has not, therefore, been economicallyor operationally viable to have full time resources dedicated to murder investigations yearround. Unfortunately when such events occur in succession or when investigations areprotracted, the ACT has much reduced flexibility to respond effectively whilst maintainingexisting patrol and investigative strengths than would be the case in a larger jurisdiction.
8.96. The continued disadvantage suffered due to diseconomies of scale in the ACT dueto the comparatively high establishment and maintenance costs, undermines the shift to amore appropriate resource mix and impairs the ability of police to manage high volumeoffences on a par with the remainder of Australia. This situation has seen a persistentdeterioration in the crime profile of the ACT over the past five years, to a point where it hasbeen the highest ranked jurisdiction in the nation for certain property-related offences.
8.97. While a degree of balance has been achieved in these areas over the past twelvemonths, crime remains at historically high levels (Recorded Crime Australia). This offencecategory generates over 80% of police response, recording and investigative activity.
8.98. ACT Policing’s response to volume crime, as has been the case in otherjurisdictions, is increasingly dependent on the availability of high quality and timely forensicevidence and analysis services. This is another area in which the ACT faces higher costson a per capita basis and an area which has been greatly impacted on by advances intechnology, the need to keep pace with developments in analysis techniques and the needto attract and retain appropriately qualified specialist staff.
8.99. There is currently a requirement for all jurisdictions to embrace CrimTrac and toparticipate in the national DNA database and associated arrangements for the sharing offorensic evidence. Failure of the ACT to participate in this program would undermine theintegrity and operational viability of the national model.
8.100. In order to meet its obligations in this regard, the ACT has similar fixedestablishment and maintenance costs as those experienced in other jurisdictions.Forensic equipment, expertise and associated administrative procedures had to bedeveloped and implemented at significant cost to the ACT Government. A DNAIntelligence Team was implemented to assist in developing associated policy, proceduresand guidelines to assist ACT Policing in complying with the provisions of the Crimes(Forensic Procedure) Act 2000 and related obligations to CrimTrac and the Nationaldatabase. Again, these costs are absorbed by a much smaller funding base in the ACTthan in the larger jurisdictions and while the ACT has choices about implementation
Session 8 – Law & Order & Public Safety – ‘Uncertain Times’
229
strategies the choice to refrain from participating in the national scheme is not a viablechoice.
8.101. ACT Policing has been able to demonstrate a case for increasing theweighting placed on both cross border and young males with non-policy-influencedevidence from a variety of sources that illustrates the increased disadvantagesuffered by the ACT in these areas. In summary:
• 18% of offenders apprehended in the ACT are ordinarily resident interstate;
• non-resident offenders impose additional demands on police services throughadditional investigative costs, cost of extradition and reliance on inter-jurisdictional liaison and intelligence sharing;
• NSW residents account for 34% of all unpaid traffic fines in the ACT;
• The cost of recovery of unpaid traffic fines is estimated at $50,000 per annum.
• Young males between 17 and 25 comprise approximately 8% of the ACTpopulation but make up between 36% and 40% of all offenders apprehended byACT Policing in the Territory;.
• Young males account for approximately one third of all Traffic InfringementNotices issued in the Territory and 36% of positive breath test results;
• Young males are over-represented in the number of apprehended offendersinvolved in high volume property crimes and assaults with between 30% to 40%of identified offenders responsible for these crimes falling into this age group;
• Young males comprise approximately 17% of all victims of recorded crime in theAustralian Capital Territory and Nationally; and
• The ACT is disproportionately disadvantaged by diseconomies of small scaleand input related costs.
Conclusion
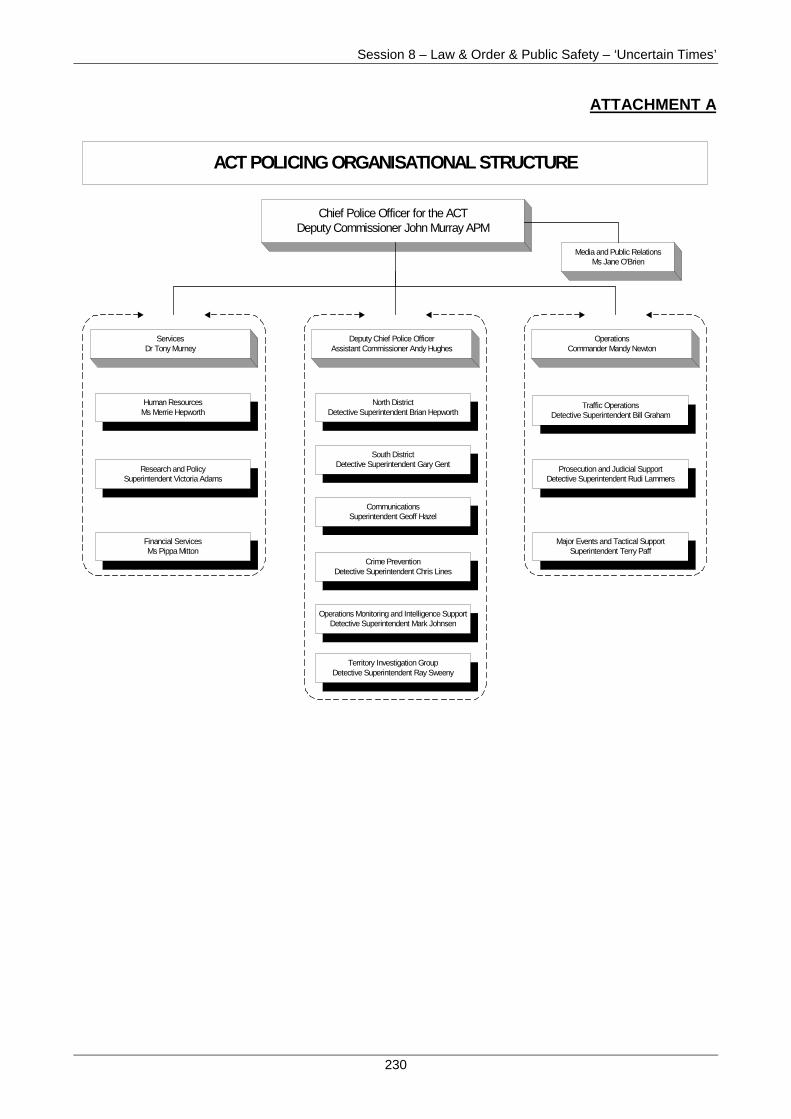
Session 8 – Law & Order & Public Safety – ‘Uncertain Times’
230
ATTACHMENT A
Chief Police Officer for the ACTDeputy Commissioner John Murray APM
Media and Public RelationsMs Jane O'Brien
ServicesDr Tony Murney
Human ResourcesMs Merrie Hepworth
Research and PolicySuperintendent Victoria Adams
Financial ServicesMs Pippa Mitton
Deputy Chief Police OfficerAssistant Commissioner Andy Hughes
North DistrictDetective Superintendent Brian Hepworth
South DistrictDetective Superintendent Gary Gent
CommunicationsSuperintendent Geoff Hazel
Crime PreventionDetective Superintendent Chris Lines
OperationsCommander Mandy Newton
Traffic OperationsDetective Superintendent Bill Graham
Prosecution and Judicial SupportDetective Superintendent Rudi Lammers
Major Events and Tactical SupportSuperintendent Terry Paff
Operations Monitoring and Intelligence SupportDetective Superintendent Mark Johnsen
ACT POLICING ORGANISATIONAL STRUCTURE
Territory Investigation GroupDetective Superintendent Ray Sweeny

Session 8 – Law & Order & Public Safety – ‘Uncertain Times’
231
ATTACHMENT B
Number of victims for not finalised investigation after 30 days
Not finalised as proportion (%) of all reported
Offence type ACT Australia
Homicide and related offences n.a. 40.7
Murder n.a. 34.0
Attempted murder n.a. 40.8
Manslaughter n.a. 47.1
Driving causing death n.a. 47.8
Assault 45.0 42.6
Sexual assault 64.5 63.8
Kidnapping/abduction 66.7 61.6
Robbery 78.3 79.6
Blackmail/extortion 100.0 64.2
Unlawful entry with intent 94.4 93.0
Involving the taking of property 94.5 93.5
Other 93.8 91.5
Motor vehicle theft 93.4 90.4
Other theft 89.2 87.6
Source: Recorded Crime Australia 2001, Australian Bureau of Statistics (Cat. No. 4510.0)
Session 8 – Law & Order & Public Safety – ‘Uncertain Times’
232
Session 9 – The ACT – ‘Pursuing a Health Community for the Region’
233
DAY THREE
FRIDAY, 15 NOVEMBER 2002
SESSION 9. – ‘THE ACT – 'PURSUING A HEALTHYCOMMUNITY FOR THE REGION'’:
• Inpatient Services.

Session 9 – The ACT – ‘Pursuing a Health Community for the Region’
234
Session 9 – The ACT – ‘Pursuing a Health Community for the Region’
235
INPATIENT SERVICES
The Canberra Hospital
The Canberra Hospital (TCH) was established in November 1991 through theamalgamation of the former Royal Canberra and Woden Valley hospitals. It is situated atthe site of the former Woden Valley Hospital.
Dr Penny Gregory Chief Executive, Department of Health and Community Care.
Dr Gregory was appointed acting Chief Executive in July 2000. In June 2002, arestructure abolishing purchaser/provider arrangements led to her becoming bothAdministrator of the health service and Chief Executive, with overall responsibility forpolicy development and health service delivery and leadership of the portfolio.
Dr Gregory is chair of two sub-committees of the Australian Health Ministers’ AdvisoryCouncil - the National Mental Health Working Group and the Medical Indemnity Working
Presenters
Venue
Session Objectives
Service Delivery Scale affected expenditure
• To demonstrate the impact of service delivery scale on the ACT's costs ofdelivering inpatient services.
• To highlight the need for changes to the private patient adjustment given theincreased need for public hospital services arising from low private sectorprovision:
− the ACT’s relative cost burden is understated as the current assessment doesnot take into account the actual proportions of public and private patientsutilising public and private hospital services.
Cross-Border
• To reiterate that ACT health services are heavily accessed by non-residentpopulations, for which the Territory receives minimal reimbursement.
• To highlight the significantly different socio-demographic composition of thepopulations involved in the cross-border usage of ACT services.
Professional Isolation
• To demonstrate the difficulties faced by the ACT in attracting qualified medical staffand the additional costs imposed on the Territory in doing so.
Session 9 – The ACT – ‘Pursuing a Health Community for the Region’
236
Group. Penny is also a member of the Board of the Australian Institute of Health andWelfare.
Professor David Ellwood, Associate Dean, Canberra Clinical School.
Professor Ellwood’s clinical specialty is obstetrics and gynaecology.
Associate Professor Mark Bassett, MB ChB (Otago 1972), MD (Qld 1983), FRACP(1979), Canberra Clinical School.
Dr Bassett’s clinical specialty is gastroenterology and he is the Director of theGastroenterology Department at The Canberra Clinical School.
Dr Bassett is also Director of the ACT Region Hepatitis Service; Senior Staff Specialist,Medical SMT, TCH and Associate Professor, Canberra Clinical School, University ofSydney.
Mark has more than 20 years experience in specialist clinical practice in both public andprivate sectors.
Associate Professor Graham Reynolds, Canberra Clinical School.
Dr Reynolds clinical specialty is paediatrics and he is the Director of the Neonatology,Paediatrics and Child Health Department at The Canberra Hospital.
Other Departmental Representatives
Ms Susan Killion, Executive Director, Health Policy Planning and Information,Department of Health and Community Care.
Mr Ian Thompson, Director, Health Policy and Primary Care, Department of Health andCommunity Care.
Mr Gordon Lee Koo, Deputy Chief Executive, The Canberra Hospital.
Dr Wayne Ramsey, Clinical Deputy Chief Executive Officer, The Canberra Hospital.
Mr Robert Cusack, Chief Executive, Calvary Public Hospital.
Dr Robert Griffin, Director of Medical Administration, Calvary Public Hospital.
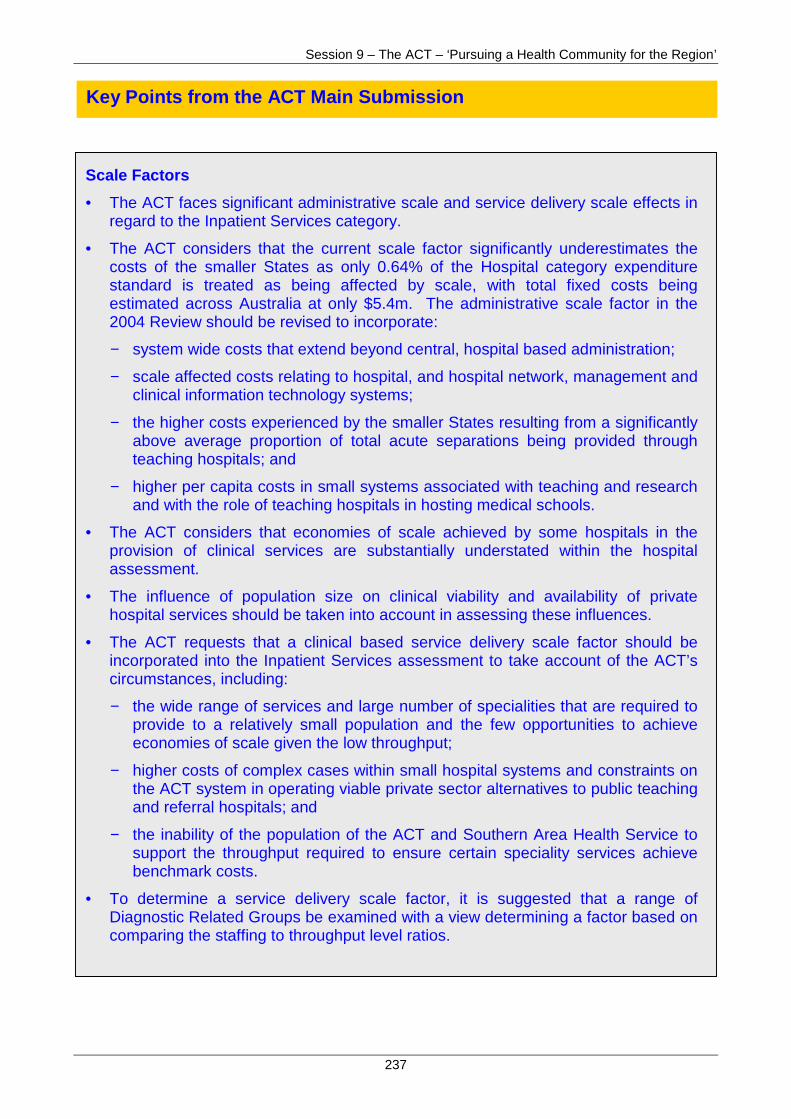
Session 9 – The ACT – ‘Pursuing a Health Community for the Region’
237
Key Points from the ACT Main Submission
Scale Factors
• The ACT faces significant administrative scale and service delivery scale effects inregard to the Inpatient Services category.
• The ACT considers that the current scale factor significantly underestimates thecosts of the smaller States as only 0.64% of the Hospital category expenditurestandard is treated as being affected by scale, with total fixed costs beingestimated across Australia at only $5.4m. The administrative scale factor in the2004 Review should be revised to incorporate:
− system wide costs that extend beyond central, hospital based administration;
− scale affected costs relating to hospital, and hospital network, management andclinical information technology systems;
− the higher costs experienced by the smaller States resulting from a significantlyabove average proportion of total acute separations being provided throughteaching hospitals; and
− higher per capita costs in small systems associated with teaching and researchand with the role of teaching hospitals in hosting medical schools.
• The ACT considers that economies of scale achieved by some hospitals in theprovision of clinical services are substantially understated within the hospitalassessment.
• The influence of population size on clinical viability and availability of privatehospital services should be taken into account in assessing these influences.
• The ACT requests that a clinical based service delivery scale factor should beincorporated into the Inpatient Services assessment to take account of the ACT’scircumstances, including:
− the wide range of services and large number of specialities that are required toprovide to a relatively small population and the few opportunities to achieveeconomies of scale given the low throughput;
− higher costs of complex cases within small hospital systems and constraints onthe ACT system in operating viable private sector alternatives to public teachingand referral hospitals; and
− the inability of the population of the ACT and Southern Area Health Service tosupport the throughput required to ensure certain speciality services achievebenchmark costs.
• To determine a service delivery scale factor, it is suggested that a range ofDiagnostic Related Groups be examined with a view determining a factor based oncomparing the staffing to throughput level ratios.
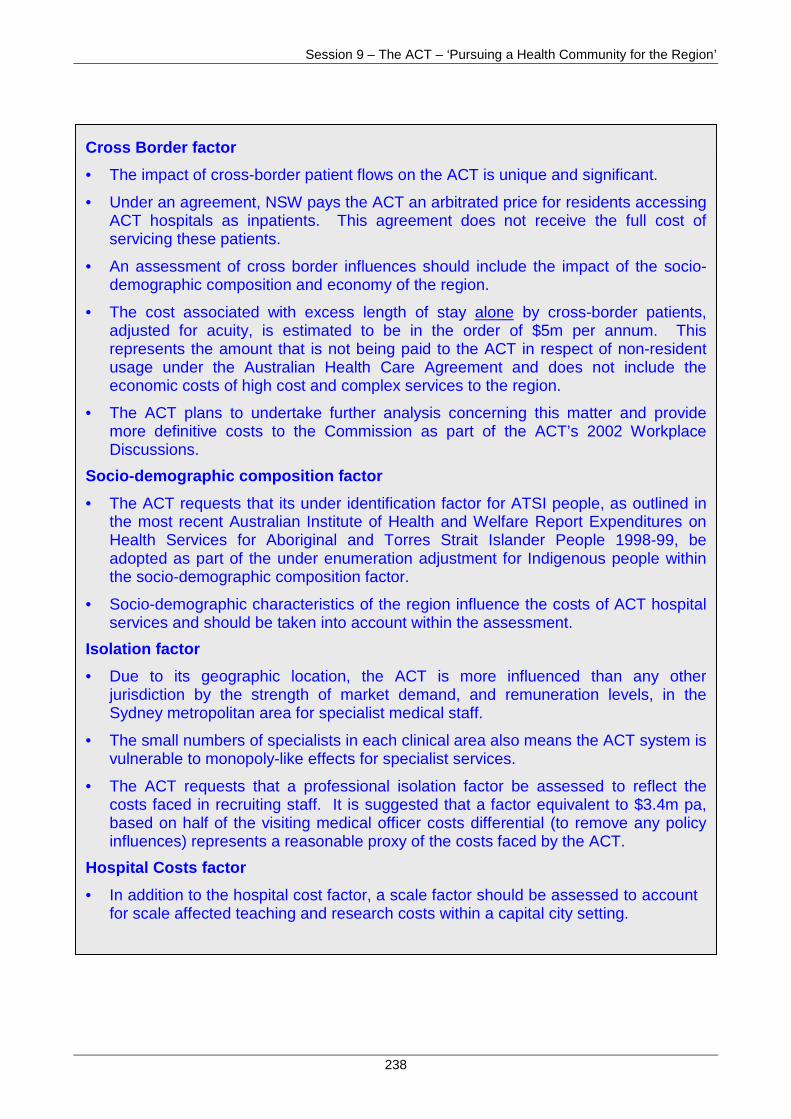
Session 9 – The ACT – ‘Pursuing a Health Community for the Region’
238
Scale Factors
• The ACT faces significant administrative scale and service delivery scale effectsin regard to the Inpatient Services category.
• The ACT considers that the current scale factor significantly underestimates thecosts of the smaller States as only 0.64% of the Hospital category expenditurestandard is treated as being affected by scale, with total fixed costs beingestimated across Australia at only $5.4m. The administrative scale factor in the2004 Review should be revised to incorporate:
− system wide costs that extend beyond central, hospital basedadministration;
− scale affected costs relating to hospital, and hospital network, managementand clinical information technology systems;
− the higher costs experienced by the smaller States resulting from asignificantly above average proportion of total acute separations beingprovided through teaching hospitals; and
− higher per capita costs in small systems associated with teaching andresearch and with the role of teaching hospitals in hosting medical schools.
• The ACT considers that economies of scale achieved by some hospitals in theprovision of clinical services are substantially understated within the hospitalassessment.
• The influence of population size on clinical viability and availability of privatehospital services should be taken into account in assessing these influences.
• The ACT requests that a clinical based service delivery scale factor should beincorporated into the Inpatient Services assessment to take account of the ACT’scircumstances, including:
− the wide range of services and large number of specialities that are requiredto provide to a relatively small population and the few opportunities toachieve economies of scale given the low throughput;
− higher costs of complex cases within small hospital systems and constraintson the ACT system in operating viable private sector alternatives to publicteaching and referral hospitals; and
− the inability of the population of the ACT and Southern Area Health Serviceto support the throughput required to ensure certain speciality servicesachieve benchmark costs.
• To determine a service delivery scale factor, it is suggested that a range ofDiagnostic Related Groups be examined with a view determining a factor based
i h ffi h h l l i
Cross Border factor
• The impact of cross-border patient flows on the ACT is unique and significant.
• Under an agreement, NSW pays the ACT an arbitrated price for residents accessingACT hospitals as inpatients. This agreement does not receive the full cost ofservicing these patients.
• An assessment of cross border influences should include the impact of the socio-demographic composition and economy of the region.
• The cost associated with excess length of stay alone by cross-border patients,adjusted for acuity, is estimated to be in the order of $5m per annum. Thisrepresents the amount that is not being paid to the ACT in respect of non-residentusage under the Australian Health Care Agreement and does not include theeconomic costs of high cost and complex services to the region.
• The ACT plans to undertake further analysis concerning this matter and providemore definitive costs to the Commission as part of the ACT’s 2002 WorkplaceDiscussions.
Socio-demographic composition factor
• The ACT requests that its under identification factor for ATSI people, as outlined inthe most recent Australian Institute of Health and Welfare Report Expenditures onHealth Services for Aboriginal and Torres Strait Islander People 1998-99, beadopted as part of the under enumeration adjustment for Indigenous people withinthe socio-demographic composition factor.
• Socio-demographic characteristics of the region influence the costs of ACT hospitalservices and should be taken into account within the assessment.
Isolation factor
• Due to its geographic location, the ACT is more influenced than any otherjurisdiction by the strength of market demand, and remuneration levels, in theSydney metropolitan area for specialist medical staff.
• The small numbers of specialists in each clinical area also means the ACT system isvulnerable to monopoly-like effects for specialist services.
• The ACT requests that a professional isolation factor be assessed to reflect thecosts faced in recruiting staff. It is suggested that a factor equivalent to $3.4m pa,based on half of the visiting medical officer costs differential (to remove any policyinfluences) represents a reasonable proxy of the costs faced by the ACT.
Hospital Costs factor
• In addition to the hospital cost factor, a scale factor should be assessed to accountfor scale affected teaching and research costs within a capital city setting.
Session 9 – The ACT – ‘Pursuing a Health Community for the Region’
239
9.1. The ACT has two public hospitals, The Canberra Hospital and Calvary PublicHospital. These facilities provide services to the ACT and surrounding regions of NSW, apopulation of almost 500,000 people.
9.2. Services provided include:
• Medical, Surgical, Women’s and Children’s Health and Mental Health acute careservices. The ACT public hospitals provide a broad range of specialties within thesecategories, and the ACT is very nearly self sufficient in terms of acute hospital care;and
• non-acute inpatient care such as rehabilitation, palliative care and the servicesprovided;
9.3. A unique aspect of the ACT hospital system is that activity is dominated by oneprinciple referral hospital (TCH). This facility has more than 500 beds and treats the greatmajority of inpatients. For example, in 19999/00, ACT public hospitals provided forapproximately 63,500 separations. TCH treated 50,300 of the separations (or 83 pent ofseparations).
9.4. In addition the ACT is unique among jurisdictions in the substantial proportion ofACT public hospital activity arises from cross-border residents (in particular from theSouthern Area Health Service of New South Wales). For example, in 1999-00, 23.5% ofACT public hospital separations were for NSW residents.
Scale effects and clinical specialities
9.5. Measuring scale affects in public hospitals is complex and there are few, if any,readily available direct or proxy measures. The workplace presentations will provide theopportunity for Hospital representatives to discuss case studies of clinical areas thatdemonstrate substantial diseconomies of scale.
9.6. ACT Health is undertaking analysis to support the workplace presentations onservice delivery scale. The analysis will be focused on comparison of cost by relativevolume of separations in DRGs.
9.7. ACT Health is also undertaking further analysis of fixed and variable costs forselected services and cost implications of increased or reduced throughput.
Overview of Service Delivery in the ACT
Service Delivery Scale Expenditure
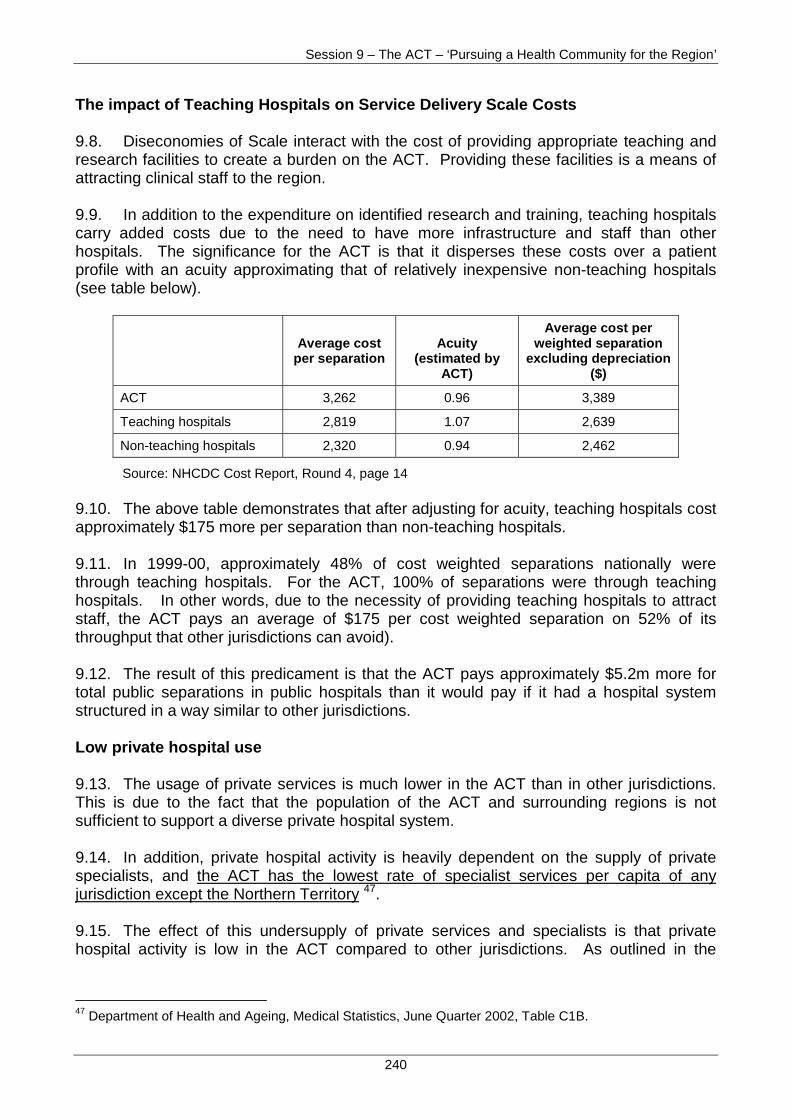
Session 9 – The ACT – ‘Pursuing a Health Community for the Region’
240
The impact of Teaching Hospitals on Service Delivery Scale Costs
9.8. Diseconomies of Scale interact with the cost of providing appropriate teaching andresearch facilities to create a burden on the ACT. Providing these facilities is a means ofattracting clinical staff to the region.
9.9. In addition to the expenditure on identified research and training, teaching hospitalscarry added costs due to the need to have more infrastructure and staff than otherhospitals. The significance for the ACT is that it disperses these costs over a patientprofile with an acuity approximating that of relatively inexpensive non-teaching hospitals(see table below).
Average costper separation
Acuity(estimated by
ACT)
Average cost perweighted separation
excluding depreciation($)
ACT 3,262 0.96 3,389
Teaching hospitals 2,819 1.07 2,639
Non-teaching hospitals 2,320 0.94 2,462
Source: NHCDC Cost Report, Round 4, page 14
9.10. The above table demonstrates that after adjusting for acuity, teaching hospitals costapproximately $175 more per separation than non-teaching hospitals.
9.11. In 1999-00, approximately 48% of cost weighted separations nationally werethrough teaching hospitals. For the ACT, 100% of separations were through teachinghospitals. In other words, due to the necessity of providing teaching hospitals to attractstaff, the ACT pays an average of $175 per cost weighted separation on 52% of itsthroughput that other jurisdictions can avoid).
9.12. The result of this predicament is that the ACT pays approximately $5.2m more fortotal public separations in public hospitals than it would pay if it had a hospital systemstructured in a way similar to other jurisdictions.
Low private hospital use
9.13. The usage of private services is much lower in the ACT than in other jurisdictions.This is due to the fact that the population of the ACT and surrounding regions is notsufficient to support a diverse private hospital system.
9.14. In addition, private hospital activity is heavily dependent on the supply of privatespecialists, and the ACT has the lowest rate of specialist services per capita of anyjurisdiction except the Northern Territory 47.
9.15. The effect of this undersupply of private services and specialists is that privatehospital activity is low in the ACT compared to other jurisdictions. As outlined in the
47 Department of Health and Ageing, Medical Statistics, June Quarter 2002, Table C1B.
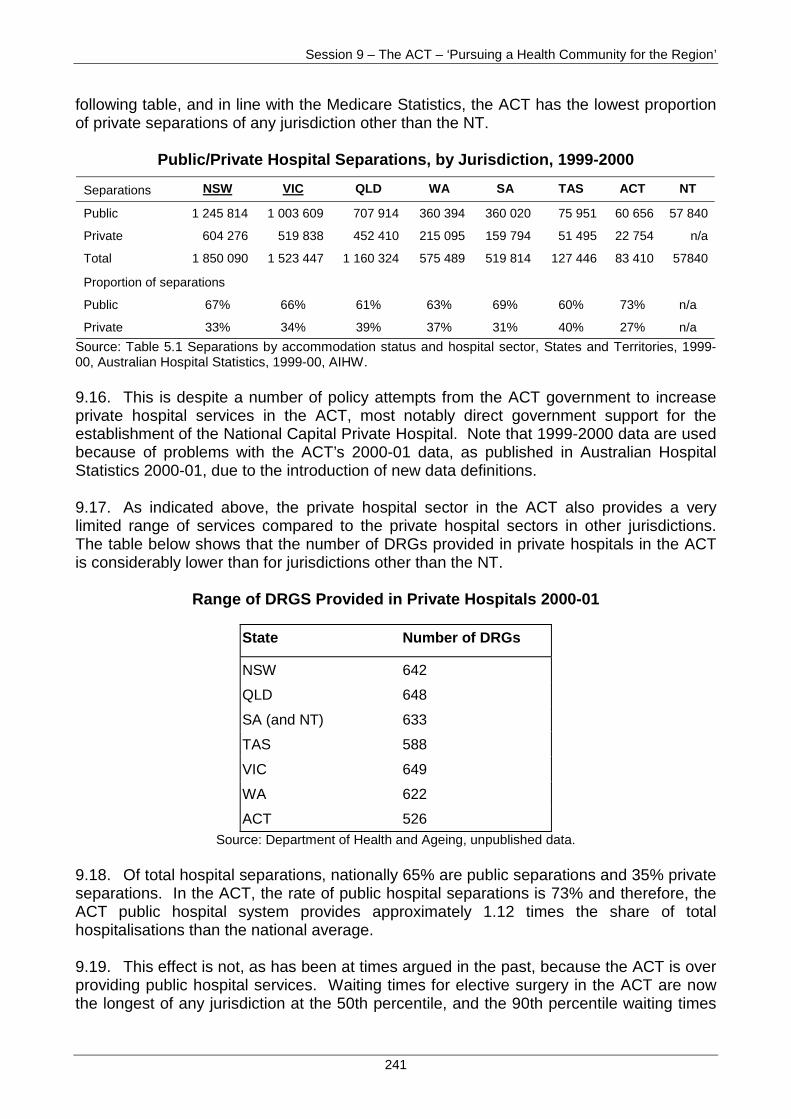
Session 9 – The ACT – ‘Pursuing a Health Community for the Region’
241
following table, and in line with the Medicare Statistics, the ACT has the lowest proportionof private separations of any jurisdiction other than the NT.
Public/Private Hospital Separations, by Jurisdiction, 1999-2000
Separations NSW VIC QLD WA SA TAS ACT NT
Public 1 245 814 1 003 609 707 914 360 394 360 020 75 951 60 656 57 840
Private 604 276 519 838 452 410 215 095 159 794 51 495 22 754 n/a
Total 1 850 090 1 523 447 1 160 324 575 489 519 814 127 446 83 410 57840
Proportion of separations
Public 67% 66% 61% 63% 69% 60% 73% n/a
Private 33% 34% 39% 37% 31% 40% 27% n/a
Source: Table 5.1 Separations by accommodation status and hospital sector, States and Territories, 1999-00, Australian Hospital Statistics, 1999-00, AIHW.
9.16. This is despite a number of policy attempts from the ACT government to increaseprivate hospital services in the ACT, most notably direct government support for theestablishment of the National Capital Private Hospital. Note that 1999-2000 data are usedbecause of problems with the ACT’s 2000-01 data, as published in Australian HospitalStatistics 2000-01, due to the introduction of new data definitions.
9.17. As indicated above, the private hospital sector in the ACT also provides a verylimited range of services compared to the private hospital sectors in other jurisdictions.The table below shows that the number of DRGs provided in private hospitals in the ACTis considerably lower than for jurisdictions other than the NT.
Range of DRGS Provided in Private Hospitals 2000-01
State Number of DRGs
NSW 642
QLD 648
SA (and NT) 633
TAS 588
VIC 649
WA 622
ACT 526Source: Department of Health and Ageing, unpublished data.
9.18. Of total hospital separations, nationally 65% are public separations and 35% privateseparations. In the ACT, the rate of public hospital separations is 73% and therefore, theACT public hospital system provides approximately 1.12 times the share of totalhospitalisations than the national average.
9.19. This effect is not, as has been at times argued in the past, because the ACT is overproviding public hospital services. Waiting times for elective surgery in the ACT are nowthe longest of any jurisdiction at the 50th percentile, and the 90th percentile waiting times
Session 9 – The ACT – ‘Pursuing a Health Community for the Region’
242
and the percentage of people who wait more than 365 days is higher than in any stateother than Tasmania (AIHW, Australian Hospital Statistics 2000-01, table 5.1, page 76).
9.20. Despite these long waiting times and the high percentage of the ACT populationwhich has private health insurance, ACT residents are either choosing not to use theirprivate health insurance or are unable to access private sector services in the ACT. Underthe Australian Health Care Agreements, all patients may elect to be treated as publicpatients, and the ACT cannot compel people to use private health insurance.
9.21. As noted above, as a proportion of total hospitalisations, demand for public hospitalservices in 1.12 times the demand for public hospital services in other jurisdictions. TheACT believes therefore, that the current factor of 0.77 related to the assessed negativeneeds for inpatient services primarily due to its age structure and income levels comparedto the States should be multiplied by a factor of 1.12 to take account of the increased needfor public hospital services arising from low private sector provision.
Service Delivery Scale
9.22. The ACT requests that a clinical based service delivery scale factor should beincorporated into the new Inpatient Services assessment to take account of theACT’s circumstances, including:
• the wide range of services and large number of specialties that are required toprovide to a relatively small population and the few opportunities to achieveeconomies of scale given the low throughput;
• the higher costs associated with having 100% of hospital activity in teachinghospitals. It is suggested that a factor equivalent to $2.6m per annum, based onhalf of the teaching versus non-teaching hospital costs differential (to removeany policy influences), represents a reasonable proxy of the costs faced by theACT;
• higher costs of complex cases within the small hospital systems and constraintson the ACT system in operating viable private sector alternatives to publicteaching and referral hospitals; and
• the inability of the ACT and SAHS to support the throughput required to ensurecertain specialty services achieve benchmark costs.
9.23. To determine a service delivery scale factor it is suggested that a range ofDRGs be examined with a view to determining a factor based on comparing thestaffing to throughput ratios.
Private Patients Adjustment
9.24. The ACT suggests that the current factor of 0.77 related to the assessednegative needs for inpatient services primarily due to its age structure and incomelevels compared to the States should be multiplied by a factor of 1.12 to takeaccount of the increased need for public hospital services arising from low privatesector provision.
Session 9 – The ACT – ‘Pursuing a Health Community for the Region’
243
9.25. The ACT’s relative cost burden is understated as the current assessmentdoes not take into account the actual proportions of public and private patientsutilising public and private hospital services.
9.26. The presentations will focus on the resource implications of providing services toNSW residents who stay substantially longer than the average for their DRG. Presenterswill discuss reasons for these extended lengths of stay.
9.27. ACT Health is currently undertaking analysis to support these arguments, and toquantify their cost implications. Once this process has been finalised, information will beprovided to the Commission by way of the ACT’s Rejoinder Submission.
9.28. The ACT provides considerable funding to public hospitals for identified teachingand research activities. These activities are of considerable importance to maintainingappropriate quality of services in hospitals not least because they promote recruitment andretention of suitably qualified staff.
9.29. The considerable numbers of NSW patients in ACT public hospitals benefit fromthese activities, but there is no provision in the cross border arrangement to compensatethe ACT for teaching and research costs. In 2001-02, the ACT provided $12m in fundingfor identified teaching and research activities at TCH and Calvary Public Hospital.
9.30. The ACT requests that the Commission give consideration to the additionalcosts it incurs due to:
• longer length of stay NSW residents, for which it does not receive compensationin the current cross border agreement; and
• identified teaching and research activities that benefit NSW residents, for whichthe ACT does not receive compensation in the current cross borderarrangement.
9.31. Presenters will discuss difficulties they experience in recruiting appropriatelyqualified staff and the cost implications of recruitment difficulties.
9.32. For example, Calvary Hospital’s attempts to recruit staff have had a poor response.A recent national advertisement campaign for medical officers conducted had the followingresponse:
• one three-month temporary contract for a staff specialist in ED on $120 per hour(instead of $60 per hour);
• one casual CMO; and
• one part-time CMO.
Cross Border
Professional isolation
Session 9 – The ACT – ‘Pursuing a Health Community for the Region’
244
9.33. The cost implications for the ACT are substantial. For example, Calvary Publichospital estimates that it spends an additional $336,000 per annum due to the inability torecruit permanent staff specialists and CMOs to fill its emergency department roster. Theextra costs are due to payment of airfares and rental assistance, and a 10% agency fee.
9.34. The ACT has had to resort to flying in VMOs from New Zealand and paying all ofthe associated on-costs in order to put in place minimum rosters.
9.35. The shortage of specialists willing to work in the ACT has provided the professionwith disproportionate bargaining power. The ACT faces major constraints in relation topay and conditions including changes to engage more full-time salaried staff an reducereliance on VMO positions.
9.36. The ACT requests that a professional isolation factor be assessed to reflectthe costs faced by the Territory in recruiting staff. It is suggested that a factorequivalent to $3.4m per annum, based on half of the VMO costs differential (toremove any policy influences) represents a reasonable proxy of the costs faced bythe ACT.
9.37. For each discussion item, the concluding paragraph(s) should clearly identifythe purpose of the discussion. For example, the major differences, or similarities,between service delivery in the ACT and the other States may be drawn out. Howthe discussion item corresponds or interacts with the Commission’s methodologieswould be useful.
9.38. In conclusion, at a high level:
• ACT hospitals encounter substantial diseconomies of scale in service delivery;
• population size limits the ACT’s ability to reduce reliance on the public hospitalsystem. The low use of private insurance and hospitals is not due to the ACTproviding a better than average public hospital service;
• the ACT is not adequately reimbursed through cross border agreements forsubstantial services supplied to NSW residents - there are particular shortfalls infunding due for long stay cross border patients and for teaching and researchcosts; and
• Professional isolation causes increases in costs for the ACT.
9.39. The ACT requests that a clinical based service delivery scale factor should beincorporated into the new Inpatient Services assessment to take account of theACT’s circumstances, including:
• the wide range of services and large number of specialties that are required toprovide to a relatively small population and the few opportunities to achieveeconomies of scale given the low throughput;
Conclusion
Session 9 – The ACT – ‘Pursuing a Health Community for the Region’
245
• the higher costs associated with having 100% of hospital activity in teachinghospitals. It is suggested that a factor equivalent to $2.6m per annum, based onhalf of the teaching versus non-teaching hospital costs differential (to removeany policy influences), represents a reasonable proxy of the costs faced by theACT;
• higher costs of complex cases within the small hospital systems and constraintson the ACT system in operating viable private sector alternatives to publicteaching and referral hospitals; and
• the inability of the ACT and SAHS to support the throughput required to ensurecertain specialty services achieve benchmark costs.
9.40. To determine a service delivery scale factor it is suggested that a range ofDRGs be examined with a view to determining a factor based on comparing thestaffing to throughput ratios.
9.41. The ACT requests that the commission give consideration to the additionalcosts it incurs due to longer length of stay NSW residents, for which it does notreceive compensation in the current cross border agreement.
9.42. The ACT requests that a professional isolation factor be assessed to reflectthe costs faced by the Territory in recruiting staff. It is suggested that a factorequivalent to $3.4m per annum (based on half of the VMO costs differential (toremove any policy influences) represents a reasonable proxy of the costs faced bythe ACT.
Session 10 – ‘The State of Origin of ACT Prisoners’ & ‘A Collaborative Regional Approach’
246
DAY THREE
FRIDAY, 15 NOVEMBER 2002
SESSION 10. – ‘'THE STATE OF ORIGIN OF ACT PRISONERS'AND 'A COLLABORATIVE REGIONAL APPROACH'’:
• Corrective Services.
Session 10 – ‘The State of Origin of ACT Prisoners’ & ‘A Collaborative Regional Approach’
247
CORRECTIVE SERVICES
Supreme Court
The ACT Law Courts Building was designed in 1961 and constructed in 1962/63. TheSupreme Court transferred to the Territory in 1992. The building originally housed theMagistrates Court, the Supreme Court, Deputy Crown Solicitor, Registrar of Titles, Births,Deaths and Marriages, Companies Office, Conciliation and Arbitration and elements of theCourt Reporting Service.
The building was originally designed not to take future extensions, but to relocate thenon-Court functions to an adjacent building as the need arose. Over time, accommodating
Venue
Session Objectives
• To demonstrate the disadvantage the ACT is experiencing in comparison withother jurisdictions in terms of high risk prisoner cost weight, cross border issues,and to outline the reasons why persons on Community Based Orders should beincluded in the assessment.
• This session will draw attention to the unique position of the ACT as a jurisdictionalisland in NSW, the diseconomies of scale and how it impacts on the correctiveservice provision in the ACT.
High risk Prisoner Cost Weight
• To demonstrate that the ‘gang effect’ on which the cost weight of 2.5 for high riskprisoners in NSW and Victoria is based applies equally to ACT prisoners in NSWand that therefore the high risk prisoner cost weight should be extended to the ACThigh risk prisoners.
Community Based Orders
• To demonstrate that Community Based Orders (CBOs) constitute a significantcomponent of the demand for corrective services, and that consequently personson CBOs should be included in the assessment of the socio-demographic factor ofthe Prisons Component.
Cross Border
• To demonstrate the impact of the large number of inter-state based offenders whoare sentenced in the Territory on the ACT, in terms of costs and service provision,and the need to increase the cross border factor for the ACT based on actual crossborder data.
Diseconomies of Small Scale
• To demonstrate via the ACT Prison Project as a case study to demonstratediseconomies of scale faced by the ACT in the provision of corrective services
Session 10 – ‘The State of Origin of ACT Prisoners’ & ‘A Collaborative Regional Approach’
248
the functions has proved beyond the capacity of the existing building. The pressure onaccommodation within the building has been reduced in part by the relocation of allfunctions, except that of the Supreme Court, to other buildings. The recent establishmentof the ACT Appellate Court has added to the accommodation shortfalls of the building.
There are significant OH&S concerns in relation to the building including leaks in the roof,which cause considerable deterioration of the building fabric, deterioration in the buildingshard landscaping and the building’s air conditioning system is erratic and outside OH&Sstandards as well as emitting excessive background noise.
During 1999, the ACT Discrimination Commissioner undertook a review of the Court “onher own motion”. The report of the review stated that the Commissioner was “…extremelyconcerned that there are a number of serious deficiencies in access to the building…”.The main access deficiency is as a result of the building not having a lift, and only stairwayaccess is provided to the Registry and Library on the first floor. The need for a buildingwith wheelchair access cannot be overstated. The report concluded “…that there arelimited options available to rectify the access problems for the Supreme Court.’
Also of concern is the safety of persons utilising the Court with the lack of a separate andsecure circulation system for prisoner, witnesses and jury members creating problems.
Tim Keady, Chief Executive, Department of Justice & Community Safety.
Mr Keady has been Chief Executive of JACS since March 1996, prior to this he had adistinguished career in a range of NSW justice related departments.
Mr James Ryan, AM, Director of Corrective Services
Mr Ryan took up the appointment of Director of ACT Corrective Services in January 1997,prior to which he was an Assistant Commissioner in NSW Corrective services and theManaging Director of a private correctional company. Mr Ryan’s earlier career was in theAustralian Defence Force, where he served in a number of senior appointments in theareas of operations, logistics and training, in Australia and overseas.
Dr David Hughes, Manager, Major Projects, Department of Treasury.
Before joining ACT Treasury early in 2002, Dr Hughes was an academic consultant, andaudit manager at the ACT Auditor-General’s Office.
Other Departmental Representatives
Ms Ronia McDade, Manager Community Corrections.
Ms McDade currently manages Community Based Corrections, which comprises the non-custodial correctional areas of corrective services. She has worked in policy andoperational areas of ACT Corrective Services since 1991.
Presenters
Session 10 – ‘The State of Origin of ACT Prisoners’ & ‘A Collaborative Regional Approach’
249
Mr Eddie Issa, Manager Business, Policy and Co-ordination.
Mr Issa joined ACT Corrective Services in 1998. He is currently the Manager of theBusiness, Policy and Coordination Unit. Prior to this Mr Issa worked as a Barrister andSolicitor in Victoria.
Key Points from the ACT Main Submission
The ACT has all the standard components of a corrective services system, except for asecure prison facility for sentenced prisoners. These prisoners are held in NSW prisonson a fee per prisoner per day basis.
Non-ACT residents comprise a significant proportion of people managed by theTerritory’s corrective services system.
Prisons Component – Socio-demographic factor
High-risk Prisoners
• The ACT requests the cost weight, received by NSW, for high-risk prisoners beapplied to the ACT, as:
− ACT high-risk prisoners are accommodated in the same facilities asNSW high-risk prisoners;
− NSW prison fees are determined according to the risk level of the prisoner beingdetained; and
− The ‘gang-effect’ also applies to ACT high risk prisoners.
Community Based Orders
• The ACT requests the inclusion of persons on Community Based Orders (CBOs) inthe assessment of the socio-demographic factor of the Prisons component, as:
− CBOs are a standard Corrective Services policy nationally;
− the CBO population is a significant component of the demand for correctiveservices;
− persons on CBOs are likely to have received a custodial sentence had the CBOsentencing option not been available; and
− including the CBO population in the Prisons component retains the simplicity ofthe current Corrective Services assessment.
Prisons Component – Cross border factor
• The ACT requests an increase in the cross border factor to 28.7% based on actualcross border data.
• Should CBOs not be included in the Prisons component, the ACT requests a crossborder factor of 40% based on actual cross border data.
Scale Affected Expenditure
• The assessment should be continued to reflect diseconomies of small scale andinput cost disabilities.
Session 10 – ‘The State of Origin of ACT Prisoners’ & ‘A Collaborative Regional Approach’
250
10.1. The ACT has all the standard components of a corrective services system, exceptfor a secure prison facility for sentenced prisoners. These prisoners are held in NSWprisons on a fee for service basis.
10.2. Services are provided through the following operational units:
• Belconnen Remand Centre,
• Symonston Temporary Remand Centre;
• Periodic Detention Centre;
• Community Based Corrections Unit; and
• Court Transport Unit.
10.3. The Belconnen Remand Centre (BRC) houses unsentenced persons who havebeen remanded into custody (remandees). The maximum capacity of the BRC is 69,although the safe operating capacity is only 58. Over the years the ACT has continued toexperience a significant increase in the daily average number of persons remanded intocustody. The average daily number of remandees rose from 42.6 in FY 1998-99 to 63.8 inFY 2001-02, and on many days the number of remandees has exceeded capacity.Average remandee numbers peaked at 81 in November 2001 and were 58 in June 2002,the ACT Court cell have been used to accommodate remandee, and on occasionremandees have been sent to NSW correctional centres.
10.4. The increased number of remandees and the inadequacies of the BelconnenRemand Centre have made construction of the Symonston Temporary Remand Centre(STRC) necessary. The STRC is due to open in October 2002 and will have a capacity of30 remandees.
10.5. The Periodic Detention Centre (PDC) provides an effective alternative toimprisonment for offenders in the ACT. Detainees make a positive contribution to thecommunity by performing unpaid community work, while serving their period of detentionon weekends, and are expected to participate in programs to address their offendingbehaviour. There were 66 offenders, on an daily average basis, under a periodic detentionorder during 2001-02, and detainees performed a total of 17,535 hours of community work.
10.6. The Community Based Corrections (CBC) unit comprises Probation, Parole andCompliance (Supervision orders), Reparations (Community Service orders), OffenderIntervention Programs, Home Detention and Supported Accommodation.
10.7. Community Based Corrections has continued to experience an increase in thenumber of offenders under supervision orders. In 2001-02 the daily average number ofoffenders under supervision orders was 1289, while the corresponding number ofoffenders on Community Service Orders was 162. Home detention became available asan alternative sentencing option in September 2001. It provides a high tariff punishmentwhile diverting offenders from the prison system. Compliance is ensured through intensivecase management and electronic monitoring.
Overview of Service Delivery in the ACT
Session 10 – ‘The State of Origin of ACT Prisoners’ & ‘A Collaborative Regional Approach’
251
10.8. The Court Transport unit is responsible for the transport of remandees between theBRC and the Magistrates Court, as well as the transport of sentenced offenders andoccasionally remandees to and from NSW correctional facilities. In 2001-02 the CourtTransport unit carried out a total of 2,512 escort tasks.
10.9. As the ACT currently has no secure facility for sentenced prisoners, they areaccommodated in NSW correctional facilities under a fee for service agreement. The dailyrate per prisoner is based on security classification, which is determined by the NSWcorrectional system. In 2001-02 the average cost per prisoner per day was $174.00. Theaverage daily number of ACT prisoners in NSW gaols was 138. As of 30 June 2001, 59out of 132 ACT prisoners were housed in maximum security prisons in NSW.
10.10. In its Main Submission to the 2004 Review the ACT argued that the cost weightapplied to NSW high-risk prisoners should be extended to ACT high-risk prisoners.
10.11. Commonwealth Grants Commission staff argue that the high-risk prisoner weight isapplied to reflect the ‘gang effect’ in NSW, rather than high-risk prisoners per se. Theyalso argue that the decision to accommodate ACT prisoners in NSW correctional facilitiesis a policy decision of the ACT Government. For these reasons, Commission staff do notthink that the cost weight should be extended to ACT high-risk prisoners.
10.12. As the ACT has no secure prison facility for sentenced prisoners, all ACT prisonersare accommodated in NSW correctional facilities under a fee for service agreement withNSW. The daily rate per prisoner is based on security classification, which is determinedby the NSW correctional system. The ACT has no influence on either the classification ofACT prisoners or the choice of correctional facility in which they are detained.
10.13. High-security prisoners present a higher level of risk, which translates to a higherlevel of cost. These higher costs are passed on to the ACT. As at 30 June 2001, almosthalf of the ACT prisoners were held in NSW maximum-security prisons.
10.14. The cost weight applied to NSW high risk prisoners is applied to all NSW high riskprisoners, not only to those cases where the ‘gang effect’ is an issue. The rate the ACThas to pay for its high-security prisoners reflects the higher cost of high-risk prisoners inNSW, for which NSW is compensated. The same compensation measure, the higher costweight, should be extended to reflect the costs faced by the ACT.
10.15. In the Commission’s Discussion Paper on Law and Order (CGC 2002/36),Commission Staff recommended the high risk cost weight be extended to Victoria.Paragraph 188 of the discussion paper noted that:
“as at 30 June 2001, 0.6 % of New South Wales inmates and 0.7% of Victorianinmates were born in South East Asia – cultural groups linked to drug sourcecountries. … Staff are therefore inclined to recommend that the assessment ofsuch inmates for Victoria match that of New South Wales, so that a weight of2.5 would be applied to high-risk (secure) prisoners in Victoria as well”.
Socio-demographic Composition–High-risk Prisoners
Session 10 – ‘The State of Origin of ACT Prisoners’ & ‘A Collaborative Regional Approach’
252
10.16. It now appears that the criterion for receiving the ‘gang effect’ high-risk cost weightis the proportion of prisoners from a South East Asian background. On this basis, the ACThas a very strong case for the additional weight as the ACT has a markedly higherproportion of prisoners from this gang related background than either Victoria or NSW.The number of ACT prisoners who come from Cabramatta, an area with well-establisheddrug and gang related activities, is 11.5%, a much higher proportion than for either NSWor Victoria.
10.17. Additionally, a considerable number of the 45% of ACT sentenced prisoners whoare NSW residents are from certain Postcode areas in NSW, which have a reputation forgang-related activities. These gang postcodes are noted in the listing of prisoners of ACTCorrective Services by Postcode at Attachment A. Direct and well-developed linksbetween NSW organised crime, particularly that based in Sydney, and subsequentattempts by these groups to penetrate the ACT are supported by Police intelligence.
Policy Choice
10.18. The Commission staff dismissed the ACT claim partially on the basis that it is apolicy decision of the ACT Government to accommodate its sentenced prisoners in NSWcorrectional facilities on a fee for service basis. The ACT contends that this decision is nottotally based on policy, but rather dictated by constraints of a historic, legislative,geographic and financial nature. These constraints have precluded, to date, theconstruction and operation of a secure prison facility for sentenced prisoners. However,should these constraints be overcome the socio-demographic composition of the ACTprisoner population would require the Territory to have higher levels of security andsupervision because of prisoner gangs.
10.19. The correctional system inherited by the ACT at self-government did not have anyprovision for a prison as it had not been included in the Territory’s design or planning.Since self-government significant improvements have been made to the delivery ofcorrectional services, and several reviews have been held to establish the case for aprison.
10.20. For the purposes of rehabilitation and reintegration it is important that prisonersmaintain close contact with families and friends. Only NSW correctional facilities are closeenough to the ACT to allow reasonable contact with families and friends. Further,accommodating ACT prisoners in NSW provides access to the ACT courts that may berequired for the appeals process. In addition, accommodating ACT prisoners in lower costjurisdictions, such as Victoria, Queensland or South Australia, would not automaticallyreduce costs. These States may not charge the ACT the lower unit cost they face and thehigher cost of transporting ACT prisoners to other jurisdictions is likely to outweigh any unitcost advantage.
10.21. Due to significant diseconomies of scale, the ACT would face major financialconstraints if it chose to operate its own prison. A separate section on diseconomies ofscale is presented later in these notes.
10.22. The ACT believes that the composition of ACT sentenced prisonersnecessitates the additional cost-weight of 2.5 for high-risk prisoners in NSWprisons.
Session 10 – ‘The State of Origin of ACT Prisoners’ & ‘A Collaborative Regional Approach’
253
10.23. In its Main Submission to the 2004 Review, the ACT sought the inclusion of personson Community Based Orders (CBOs) in the Corrective Services assessment on the basisthat all jurisdictions use CBOs as an integral part of corrective services systems. TheCBO population represents a significant demand for services and imposes costs oncorrective services systems nationally.
10.24. The ACT considers that CBOs provide a useful and integral part of the system,allowing greater control and influence over offenders as it provides a sentencing optionthat incorporates both reparation and rehabilitation measures, as well as allowingoffenders to stay close to their support networks, which enhances the chances ofsuccessful reintegration.
10.25. The number of offenders under Community Corrections supervision has beenincreasing over time from 1000 in 1999-2000 to 1289 in 2001-02 with this trend likely tocontinue.
10.26. CBOs are a cost-effective way to manage offenders, in the 2002-03 ACT CorrectiveServices budget 17.9% of the total budget, or $4,588,350, was allocated for themanagement of approximately 1200 offenders on CBOs. This compares with the 33.6%($8,596,440) of the total budget for accommodating around 150 ACT prisoners in NSW forthe same period.
10.27. The ACT notes that the Commission in its Discussion Paper on Law and Order(CGC 2002/36) has acknowledged the importance of CBOs for corrective serviceproviders. The ACT believes that CBOs should be included in the Corrective ServicesAssessment and pursuing further analysis of the available data to determine if there maybe socio-demographic differences between the prison and the CBO populations.Anecdotal evidence suggests that the differences may be superficial rather thansubstantive.
10.28. In its Main Submission to the 2004 Review the ACT requested an increase in thecross border factor to 28.7%, based on actual cross border data. In case of CBOs notbeing included in the Prisons component, the ACT requested a cross border factor of 40%,based on actual cross border data.
10.29. The ACT is a jurisdictional island in NSW yet functionally integrated by majorarterial transport links into the economy of NSW. Consequently, high frequencymovements of people, goods and services provide the opportunity for criminal activity tooccur across the border. The size of NSW means that proportion of criminal activity in theACT that NSW residents are responsible for is likely to be much higher than the criminalactivities of ACT residents in NSW.
Socio-demographic Composition –Community Based Orders (CBOs)
Cross Border
Session 10 – ‘The State of Origin of ACT Prisoners’ & ‘A Collaborative Regional Approach’
254
10.30. While in the early stages of the criminal justice system, police and courts it isdifficult to measure the incidence of cross border costs borne by the Territory, the taskbecomes easier Corrective Services and is particularly accurate when examining offendersserving a custodial sentence.
10.31. As noted in the ACT Main Submission, not all persons responsible for crimes in theACT are apprehended and the prospects of apprehending non-residents, compared toACT residents, are substantially less, reducing the empirical evidence available tosubstantiate a cross border claim in the police category. Those persons who areapprehended have incentives to not provide the correct State of residence, includingimproving the likelihood of obtaining bail and/or legal aid. These incentives are known tohave an adverse impact on the accuracy of the data used to substantiate the ACT’s crossborder claim, they cause the proportion of cross border usage to be understated.
10.32. The incentives of bail and legal aid also influence the cross border data at theBelconnen Remand Centre and this is demonstrated by the consensus with the AFPapprehension data that shows about 9% of those apprehended and held at the RemandCentre identify themselves as NSW residents. The ACT does not consider that this is anaccurate reflection of the actual cross border usage of police services nor the RemandCentre.
10.33. From July 1995 to date, 7.2% of all offenders managed by the CommunityCorrections Unit were residents of NSW. The majority of these people must live in veryclose proximity to the ACT, to fulfil their community obligations. As noted by theCommission, community corrections tend to have lower costs and thus the smallerproportion of cross border usage does not impact to a large extent on the overall costimposed on ACT Corrective Services by NSW residents.
10.34. The cost of all the units of ACT Corrective Services attributable to NSW residents,as outlined in the main Submission to the 2004 Review, is $4.6m per annum (or 28.7% ofthe total Corrective Service budget).
10.35. The largest factor in the high proportion of the ACT Corrective Services budgetbeing used to service NSW residents is those serving ACT sentences in NSW prisons.From 1997-98 to 2000-01, NSW residents comprised approximately 45% of all ACTprisoners in NSW prisons.
10.36. Practical reasons for the high proportion of NSW residents among ACT prisonersinclude the practicalities of not receiving community based sentences due to complianceissues, and limited opportunities for corrections supervision. The ACT considers thatmany cross border offenders whose usual place of residence, that is NSW, presents themwith difficulties in the early stages of the ACT criminal justice system are able to identifythemselves as being NSW residents without jeopardising access to services they maydesire or require.
10.37. The ACT believes that a cross border factor should be assessed in theCorrective Services category to reflect the impost NSW residents have on theprovision of corrective services in the Territory.
Session 10 – ‘The State of Origin of ACT Prisoners’ & ‘A Collaborative Regional Approach’
255
10.38. The ACT suffers from significant diseconomies of scale in the provision of correctiveservices.
10.39. The number of sentenced and remanded prisoners in the ACT is small and unlikelyto increase significantly for many years. This means that the ACT cannot operate largercorrective services facilities with lower average costs per prisoner. This is shown by thehigh cost per prisoner per day of the Belconnen Remand Centre and the PeriodicDetention Centre ($308 for each centre). An ACT prison would suffer from the sameproblem and greatly increase the average cost of housing sentenced prisoners above thecurrent average payment to New South Wales of $174 per prisoner per day.
10.40. The total cost of providing corrective services in the ACT would increase by about$5m (from $26.7m to $31.6m) if a comprehensive prison facility were to be built. An ACTprison would suffer from the further problem of not being able to provide specialist facilitiesfor some prisoners, such as extremely violent offenders and those under protective orders.The ACT would continue to rely on New South Wales to house some ACT prisoners.
10.41. Diseconomies of scale also arise from the relatively high corporate overheads in asmall jurisdiction that nevertheless must provide most of the policy and administrativefunctions of larger jurisdictions. Significant fluctuations in prisoner numbers are also aparticular problem in a jurisdiction with such a small number of prisoners. Building a prisonwould exacerbate these problems. For example, a new prison would require thedevelopment and implementation of a wide range of guidelines and programs for healthand education services. These services will be delivered to a small number of prisonerscompared with similar services in other jurisdictions. Some services for specific categoriesof prisoners would be delivered to very small numbers. For example, women’s healthservices would be provided to, at present, 9 female sentenced and remanded prisoners.
10.42. Details on the financial costs of current arrangements and the prison project are inAttachment B.
10.43. The ACT faces the same additional costs because of ‘prisoner gangs’ andnotes that:
• the ACT has a higher proportion of prisoners from known gang and drug relatedareas – as evidenced by the postcode data supplied in the Main Submission;
• a considerable proportion of ACT prisoners are actually NSW residents, the‘gang-effect’ would therefore apply equally to ACT high risk prisoners; and
• the additional costs related to the ‘gang effect’ would apply in an ACT prisonbecause of the composition of ACT sentenced prisoners.
Conclusion
Diseconomies of Small Scale – The ACT Prison Project
Session 10 – ‘The State of Origin of ACT Prisoners’ & ‘A Collaborative Regional Approach’
256
10.44. The ACT notes that:
• CBOs are a standard corrective services practice nationally;
• the CBO population represents a significant proportion of the demand oncorrective services;
• persons on CBOs are likely to have received a prison sentence if the option ofCBOs was not available; and
• the costs associated with offenders under CBOs should be investigated further.
10.45. The ACT submits that NSW residents create a large impost on the Territory’sCorrective Services budget and that this impost should be recognised. Further, theACT has actual data on the proportion of cross border sentenced prisoners and thecosts they imposed on the Territory. The ACT supports the use of actual data incross border assessments where it exists and is an accurate reflection of the costsincurred.
10.46. The ACT requests that the assessment should continue to reflectdiseconomies of small scale and input costs disabilities.
10.47. The ACT prison case study shows that the Territory faces and would face,greater scale disabilities should it operate its own prison facility.
Session 10 – ‘The State of Origin of ACT Prisoners’ & ‘A Collaborative Regional Approach’
257
Diseconomies of Small Scale
A Case Study - The ACT Prison Project
ACT Corrective Services – Current Arrangements
The ACT operates its own remand and periodic detention centres and transfers sentencedprisoners to NSW under arrangements developed in 1971 between the Commonwealthand NSW, and between the ACT and NSW in 1993. The main cost components of currentcorrective services arrangements are discussed below and summarised in the table below.
ACT prisoners in NSW prisons
ACT sentenced prisoners are sent to NSW. NSW Corrective Services is responsible forthe management of these prisoners.
NSW Corrective Services charges the ACT on a per prisoner per day basis for ACTprisoners detained in NSW prisons. In 2001-02 the ACT paid NSW $8.84m for an averageof 138 prisoners. This fee was based on a daily cost of $164.08 per minimum securityprisoner, $178.96 per medium security prisoner and $199.82 per maximum securityprisoner. On average, the ACT paid NSW $174 per prisoner per day in 2001-02.
Belconnen Remand Centre
The Belconnen Remand Centre (BRC) has a capacity for 69 remandees, the average dailypopulation in 2001-02 was 64. The total cost of operating the BRC in 2001-02 was$7.17m or $308 per remandee per day.
Symonston Temporary Remand Centre (formerly Periodic Detention Centre)
The ACT Government operates a Periodic Detention Centre (PDC) at Symonston. In2001-02 2,505 periodic detention days were served at a cost of $0.77m. The cost perdetainee was $308 per day.
The PDC has recently been upgraded to serve as a Temporary Remand Centre (TRC) ata cost of $3.1m. The TRC will accommodate 30 remandees and an average of 66 periodicdetainees serving weekend detention. It is estimated the facility will have an annualoperating cost of $1.74m. The TRC is expected to be operational in November 2002.
Other Costs
The ACT also provides corrective services through other operational units such as theCommunity Based Corrections Unit and the Court Transport Unit. In 2001-02, these otherservices cost $6.64m. These services would continue to operate if an ACT prison were tobe built.
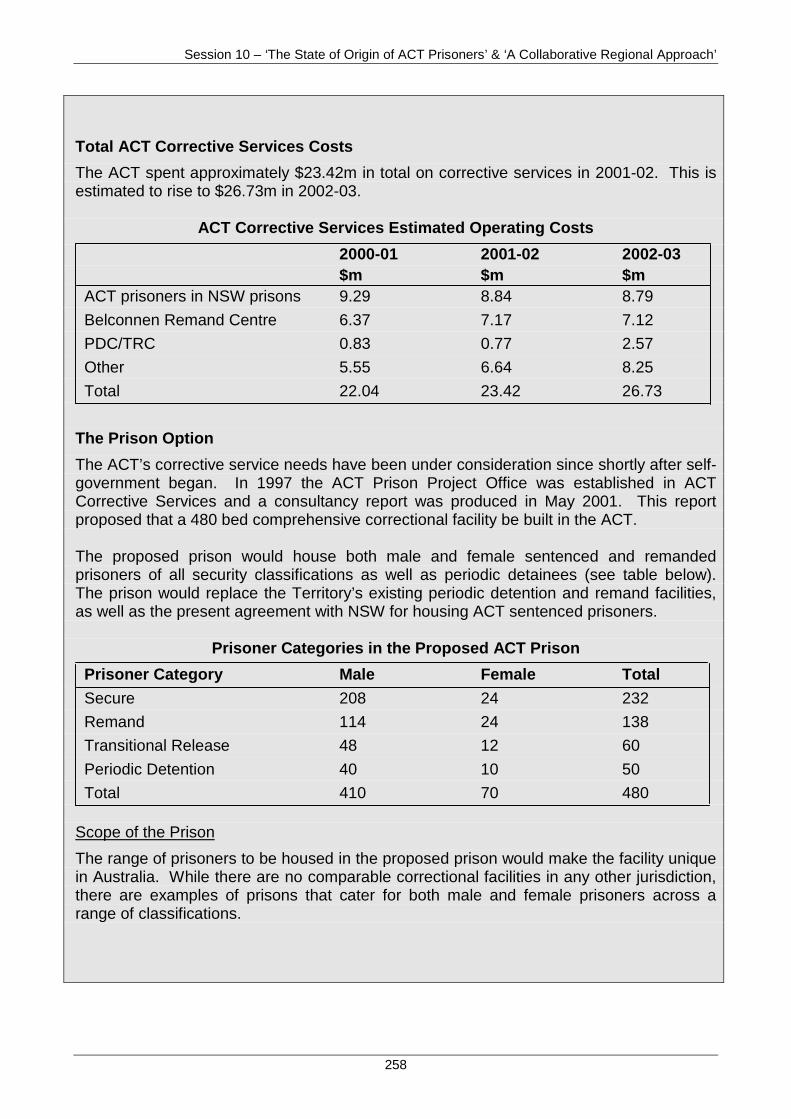
Session 10 – ‘The State of Origin of ACT Prisoners’ & ‘A Collaborative Regional Approach’
258
Total ACT Corrective Services Costs
The ACT spent approximately $23.42m in total on corrective services in 2001-02. This isestimated to rise to $26.73m in 2002-03.
ACT Corrective Services Estimated Operating Costs
2000-01 2001-02 2002-03$m $m $m
ACT prisoners in NSW prisons 9.29 8.84 8.79
Belconnen Remand Centre 6.37 7.17 7.12
PDC/TRC 0.83 0.77 2.57
Other 5.55 6.64 8.25
Total 22.04 23.42 26.73
The Prison Option
The ACT’s corrective service needs have been under consideration since shortly after self-government began. In 1997 the ACT Prison Project Office was established in ACTCorrective Services and a consultancy report was produced in May 2001. This reportproposed that a 480 bed comprehensive correctional facility be built in the ACT.
The proposed prison would house both male and female sentenced and remandedprisoners of all security classifications as well as periodic detainees (see table below).The prison would replace the Territory’s existing periodic detention and remand facilities,as well as the present agreement with NSW for housing ACT sentenced prisoners.
Prisoner Categories in the Proposed ACT Prison
Prisoner Category Male Female Total
Secure 208 24 232
Remand 114 24 138
Transitional Release 48 12 60
Periodic Detention 40 10 50
Total 410 70 480
Scope of the Prison
The range of prisoners to be housed in the proposed prison would make the facility uniquein Australia. While there are no comparable correctional facilities in any other jurisdiction,there are examples of prisons that cater for both male and female prisoners across arange of classifications.
Session 10 – ‘The State of Origin of ACT Prisoners’ & ‘A Collaborative Regional Approach’
259
Examples in New South Wales include:
• Kempsey Prison, which is currently under construction and expected to be operationalby February 2004. It will house 300 male and 50 female prisoners of all securityclassifications. The prison is being built on an 80-hectare site at a cost of $81.6m.
• Mannus Prison, which can accommodate 164 minimum security male prisoners and 24male and 6 female periodic detention detainees.
• Grafton Prison, which can accommodate a total of 274 male and female prisonersunder minimum and medium security.
An example in South Australia is:
• Port Augusta Prison, which can house up to 280 prisoners, both male and female, of allsecurity classifications
The size of the proposed ACT prison is driven by the need to accommodate a wide rangeof sentenced prisoners, remandees and detainees. It is also necessary to allow forpossible future growth in prisoner numbers and for short term fluctuations in numbers,which are significant in a small jurisdiction like the ACT. Prison Costs
The construction cost of a new comprehensive prison, based on similar facilities in otherjurisdictions and having regard to recent building costs, was calculated at $110m in 2001.This cost was based on an assumption that the prison would be built in Symonston. TheACT Government is currently considering a site at Majura. It is estimated this site wouldgive rise to an additional $4.8m in infrastructure costs. In addition, the estimated cost isbased on a 2001 start. The cost would have escalated by about 2.5% since the estimatewas made. This adds an extra $2.7m to the construction cost.
Other significant start-up costs may need to be added to the construction costs. Inparticular, building a prison in the ACT will require developing a policy and administrativeframework for managing the prison. This cost has not yet been estimated, but it can beassumed that the guidelines and protocols will cover the same range of matters that arecovered in a large jurisdiction such as New South Wales.
The operating cost, excluding depreciation, has been estimated at $18.1m per annum for apublicly operated facility. To this cost must also be added the costs of existing operationalunits such as the Court Transportation Unit and the Community Based Corrections Unit,which will continue to operate if a prison is built. These costs are estimated to be $8.25min 2002-03.
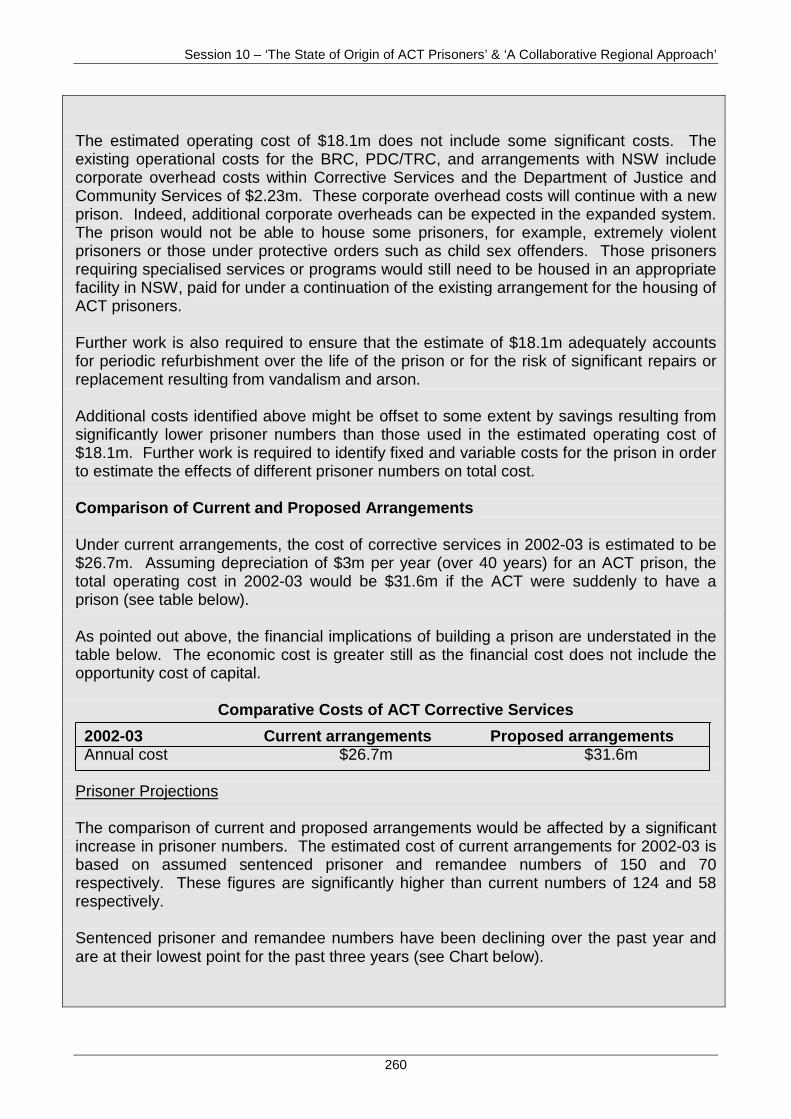
Session 10 – ‘The State of Origin of ACT Prisoners’ & ‘A Collaborative Regional Approach’
260
The estimated operating cost of $18.1m does not include some significant costs. Theexisting operational costs for the BRC, PDC/TRC, and arrangements with NSW includecorporate overhead costs within Corrective Services and the Department of Justice andCommunity Services of $2.23m. These corporate overhead costs will continue with a newprison. Indeed, additional corporate overheads can be expected in the expanded system.The prison would not be able to house some prisoners, for example, extremely violentprisoners or those under protective orders such as child sex offenders. Those prisonersrequiring specialised services or programs would still need to be housed in an appropriatefacility in NSW, paid for under a continuation of the existing arrangement for the housing ofACT prisoners.
Further work is also required to ensure that the estimate of $18.1m adequately accountsfor periodic refurbishment over the life of the prison or for the risk of significant repairs orreplacement resulting from vandalism and arson.
Additional costs identified above might be offset to some extent by savings resulting fromsignificantly lower prisoner numbers than those used in the estimated operating cost of$18.1m. Further work is required to identify fixed and variable costs for the prison in orderto estimate the effects of different prisoner numbers on total cost.
Comparison of Current and Proposed Arrangements
Under current arrangements, the cost of corrective services in 2002-03 is estimated to be$26.7m. Assuming depreciation of $3m per year (over 40 years) for an ACT prison, thetotal operating cost in 2002-03 would be $31.6m if the ACT were suddenly to have aprison (see table below).
As pointed out above, the financial implications of building a prison are understated in thetable below. The economic cost is greater still as the financial cost does not include theopportunity cost of capital.
Comparative Costs of ACT Corrective Services
2002-03 Current arrangements Proposed arrangements Annual cost $26.7m $31.6m
Prisoner Projections
The comparison of current and proposed arrangements would be affected by a significantincrease in prisoner numbers. The estimated cost of current arrangements for 2002-03 isbased on assumed sentenced prisoner and remandee numbers of 150 and 70respectively. These figures are significantly higher than current numbers of 124 and 58respectively.
Sentenced prisoner and remandee numbers have been declining over the past year andare at their lowest point for the past three years (see Chart below).
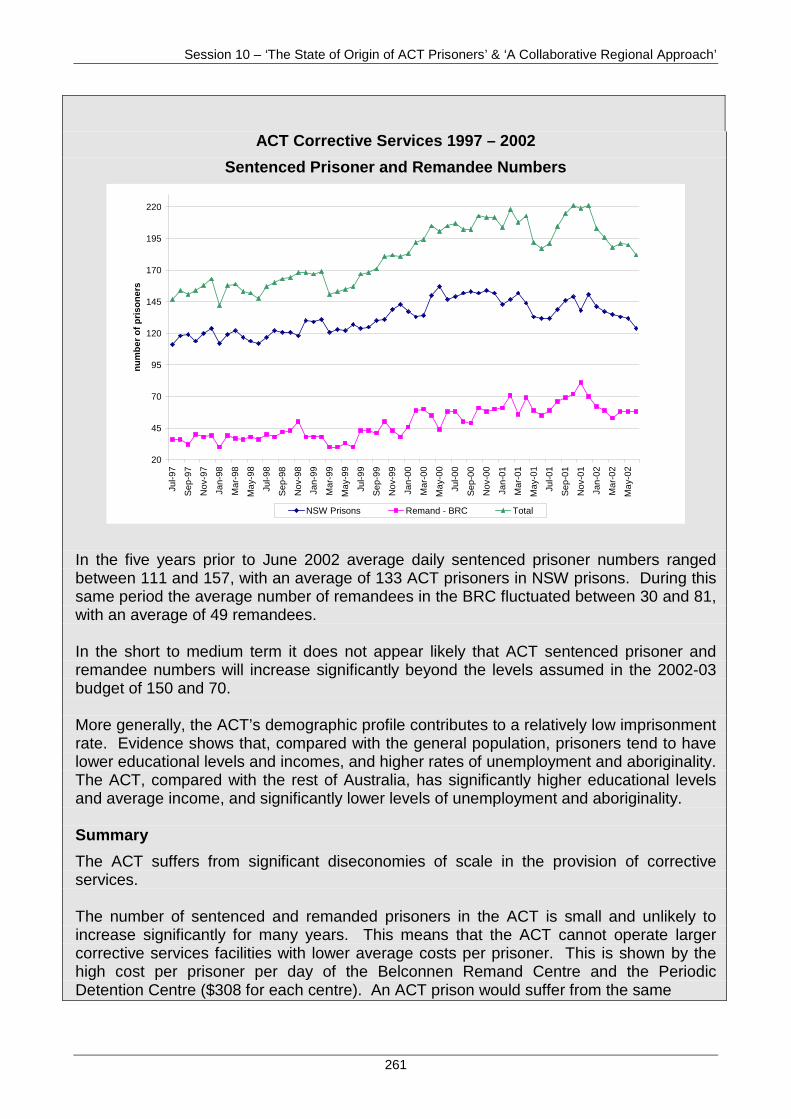
Session 10 – ‘The State of Origin of ACT Prisoners’ & ‘A Collaborative Regional Approach’
261
ACT Corrective Services 1997 – 2002
Sentenced Prisoner and Remandee Numbers
20
45
70
95
120
145
170
195
220
Jul-9
7
Sep
-97
Nov
-97
Jan-
98
Mar
-98
May
-98
Jul-9
8
Sep
-98
Nov
-98
Jan-
99
Mar
-99
May
-99
Jul-9
9
Sep
-99
Nov
-99
Jan-
00
Mar
-00
May
-00
Jul-0
0
Sep
-00
Nov
-00
Jan-
01
Mar
-01
May
-01
Jul-0
1
Sep
-01
Nov
-01
Jan-
02
Mar
-02
May
-02
nu
mb
er o
f p
riso
ner
s
NSW Prisons Remand - BRC Total
In the five years prior to June 2002 average daily sentenced prisoner numbers rangedbetween 111 and 157, with an average of 133 ACT prisoners in NSW prisons. During thissame period the average number of remandees in the BRC fluctuated between 30 and 81,with an average of 49 remandees.
In the short to medium term it does not appear likely that ACT sentenced prisoner andremandee numbers will increase significantly beyond the levels assumed in the 2002-03budget of 150 and 70.
More generally, the ACT’s demographic profile contributes to a relatively low imprisonmentrate. Evidence shows that, compared with the general population, prisoners tend to havelower educational levels and incomes, and higher rates of unemployment and aboriginality.The ACT, compared with the rest of Australia, has significantly higher educational levelsand average income, and significantly lower levels of unemployment and aboriginality.
Summary
The ACT suffers from significant diseconomies of scale in the provision of correctiveservices.
The number of sentenced and remanded prisoners in the ACT is small and unlikely toincrease significantly for many years. This means that the ACT cannot operate largercorrective services facilities with lower average costs per prisoner. This is shown by thehigh cost per prisoner per day of the Belconnen Remand Centre and the PeriodicDetention Centre ($308 for each centre). An ACT prison would suffer from the same
Session 10 – ‘The State of Origin of ACT Prisoners’ & ‘A Collaborative Regional Approach’
262
problem and greatly increase the average cost of housing sentenced prisoners above thecurrent average payment to New South Wales of $174 per prisoner per day.
The total cost of providing corrective services in the ACT would increase by about $5m(from $26.7m to $31.6m) if a comprehensive prison facility were to be built. An ACT prisonwould suffer from the further problem of not being able to provide specialist facilities forsome prisoners, such as extremely violent offenders and those under protective orders.The ACT would continue to rely on New South Wales to house some ACT prisoners.
Diseconomies of scale also arise from the relatively high corporate overheads in a smalljurisdiction that nevertheless must provide most of the policy and administrative functionsof larger jurisdictions. Significant fluctuations in prisoner numbers are also a particularproblem in a jurisdiction with such a small number of prisoners. Building a prison wouldexacerbate these problems. For example, a new prison would require the developmentand implementation of a wide range of guidelines and programs for health and educationservices. These services will be delivered to a small number of prisoners compared withsimilar services in other jurisdictions. Some services for specific categories of prisonerswould be delivered to very small numbers. For example, women’s health services wouldbe provided to, at present, 9 female sentenced and remanded prisoners.
Session 11 – Gambling - ‘HDI’ & Revenue Raising – Now & for Future Income Support’
263
DAY THREE
FRIDAY, 15 NOVEMBER 2002
SESSION 11. – ‘GAMBLING – 'HOUSEHOLD DISPOSABLEINCOME' AND REVENUE RAISING AND FUTURE SECURITY –
'NOW AND FOR FUTURE INCOME SUPPORT'’:
(A) Gambling.
(B) Revenue Raising Capacity.
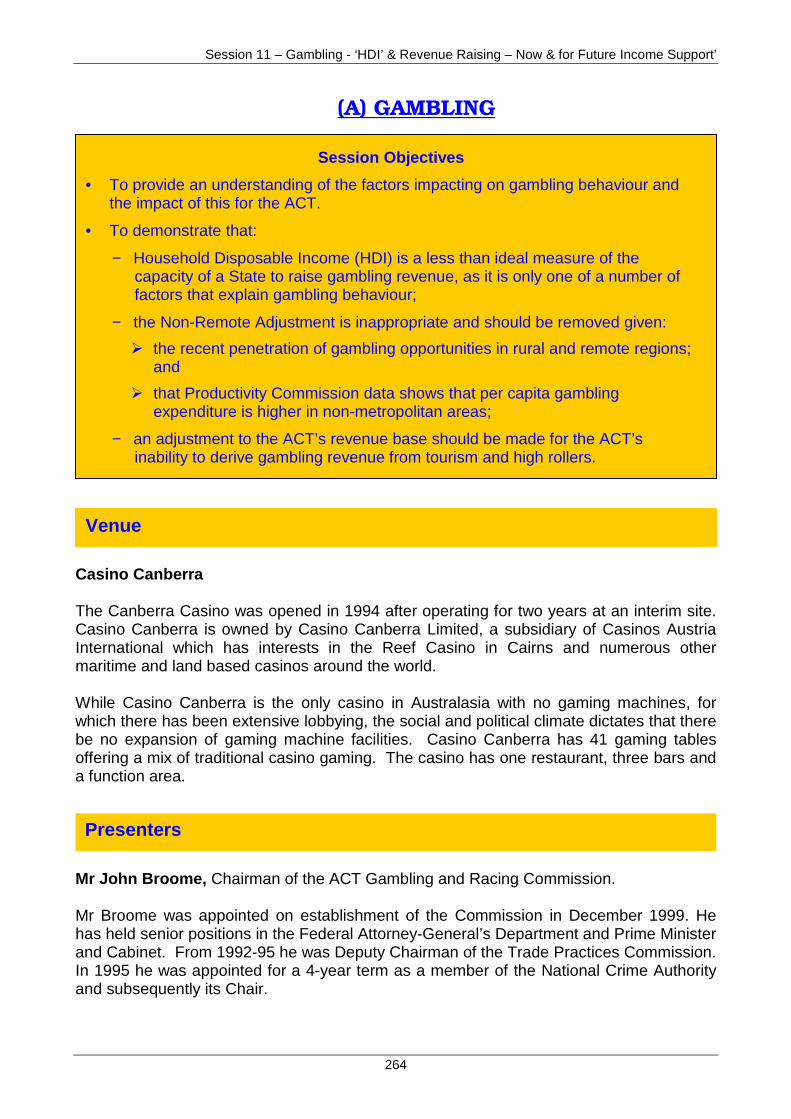
Session 11 – Gambling - ‘HDI’ & Revenue Raising – Now & for Future Income Support’
264
(A) GAMBLING
Casino Canberra
The Canberra Casino was opened in 1994 after operating for two years at an interim site.Casino Canberra is owned by Casino Canberra Limited, a subsidiary of Casinos AustriaInternational which has interests in the Reef Casino in Cairns and numerous othermaritime and land based casinos around the world.
While Casino Canberra is the only casino in Australasia with no gaming machines, forwhich there has been extensive lobbying, the social and political climate dictates that therebe no expansion of gaming machine facilities. Casino Canberra has 41 gaming tablesoffering a mix of traditional casino gaming. The casino has one restaurant, three bars anda function area.
Mr John Broome, Chairman of the ACT Gambling and Racing Commission.
Mr Broome was appointed on establishment of the Commission in December 1999. Hehas held senior positions in the Federal Attorney-General’s Department and Prime Ministerand Cabinet. From 1992-95 he was Deputy Chairman of the Trade Practices Commission.In 1995 he was appointed for a 4-year term as a member of the National Crime Authorityand subsequently its Chair.
Presenters
Venue
Session Objectives
• To provide an understanding of the factors impacting on gambling behaviour andthe impact of this for the ACT.
• To demonstrate that:
− Household Disposable Income (HDI) is a less than ideal measure of thecapacity of a State to raise gambling revenue, as it is only one of a number offactors that explain gambling behaviour;
− the Non-Remote Adjustment is inappropriate and should be removed given:
! the recent penetration of gambling opportunities in rural and remote regions;and
! that Productivity Commission data shows that per capita gamblingexpenditure is higher in non-metropolitan areas;
− an adjustment to the ACT’s revenue base should be made for the ACT’sinability to derive gambling revenue from tourism and high rollers.
Session 11 – Gambling - ‘HDI’ & Revenue Raising – Now & for Future Income Support’
265
Mr Broome’s other national and international appointments include:
• Chair, Commonwealth Law Enforcement Board;
• Co-Chair, Asia-Pacific Group on Money Laundering; and
• Australia’s Representative, Financial Action Task Force on Money Laundering.
Tony Curtis, Chief Executive Officer & Commission Member.
Mr Curtis was appointed as the Commission’s first Chief Executive Officer on 31 January2000. Prior to his appointment as CEO, he served with the Australian Federal Police andformer Australian Capital Territory Police for over 25 years. Within the AFP, he served in avariety of management positions including officer commanding the Civic, Belconnen andTuggeranong police patrols in the ACT.
For a period of time Tony was seconded to the Australian Parliament as its firstnon-civilian Security Controller. He has led Australia’s first police detachment to EastTimor in 1999. At the time of his resignation Mr Curtis held the position of Co-ordinator,External Policing, National Operations. Mr Curtis holds a Graduate Certificate inManagement and has extensive experience in investigations, management, liaison withstakeholders, community consultation and the operations of law enforcement.
Key Points from the ACT Main Submission
• The current assessment uses Household Disposable Income (HDI) as a broadmeasure of States’ capacities to raise revenue from gambling activities. A greatdeal of research has failed to establish a strong link between income andgambling expenditure. In fact, gambling expenditure tends to be a largerproportion of income for lower income groups.
• The current assessment deems the ACT to have the highest capacity to raiserevenue from gambling due to its high average HDI. Despite providing all of themajor forms of gambling, including the highest penetration of gaming machinesper capita, ACT expenditure per capita is below the national average and 25%below the highest State, NSW.
• HDI is a less than ideal measure of the capacity of a state or territory to raisegambling revenue, as it is only one of a number of factors that explain gamblingbehaviour.
• In the absence of an improved measure of revenue raising capacity, the ACTsuggests an EPC assessment.
• If HDI continues to be used to assess jurisdictions’ capacities to raise revenue, itshould be adjusted to reflect the observed pattern that households on lowerincomes tend to contribute a greater proportion of their income to gamblingrevenues.
Session 11 – Gambling - ‘HDI’ & Revenue Raising – Now & for Future Income Support’
266
11.1. In the 1999 Review, the Gambling Category was assessed by reference to theGross Household Disposable Income (HDI) per capita adjusted for non-remotepopulations, and discounted by 50%.
11.2. A further adjustment was made to recognise that Tasmania, the ACT and theNorthern Territory were unable to achieve the scale of prize money necessary to attract acomparable level of investment. As a result these jurisdictions had to enter into lotteriessharing arrangements which were less advantageous.
11.3. The Commission decided that HDI explains some of the differences in levels ofgambling between States and it has the advantage of being policy neutral. However, inthe light of the evidence on propensities, and the mobility of some forms of betting, it wasdecided to moderate the differential capacities implied by HDI per capita by discountingthem by 50% as a matter of judgment. This introduced an element of EPC capacity intothe assessment.
11.4. The Commission included a population access adjustment in the assessment.
11.5. The implied assumption is that more remote populations have limited access toforms of gambling and therefore the relationship between HDI and gambling expenditure iseven more tenuous.
11.6. Based on the 1999 Review methodology, the ACT is assessed by the Commissionas having very large negative needs in the gambling category.
11.7. The current assessment implies that the ACT is making a revenue raising effort ofonly 66% of the national average. However, this outcome is the result of an inappropriateassessment method.
• The existing adjustment for access is not supported by the evidence and, in fact,the evidence suggests that a higher proportion of the non-metropolitanpopulation are regular gamblers.
• The existing discounting of HDI should continue as HDI is only a partialexplanation of differences in the revenue raising capacities of jurisdictions. TheACT proposes that the discount factor should be increased.
• A further adjustment should be made to take account of the inability of the ACTto attract international tourists and high rollers.
• The existing adjustment for the scale impact in respect of prize amounts forlotteries should be maintained for the ACT, Tasmania and the NT for those yearsaffected.
Background and context of Gambling Taxation
Session 11 – Gambling - ‘HDI’ & Revenue Raising – Now & for Future Income Support’
267
11.8. The ACT provides access to all major forms of gambling, including:
• electronic gaming machines;
• casino - licence fee and revenue taxation;
• racing - on and off-course (including ACTTAB);
• sports bookmaking;
• major lotteries;
• minor lotteries and promotions; and
• Keno and bingo/housie.
11.9. ACT Gambling taxes and fees are consistent with other States. Indeed, the ACThas the:
• highest number of gaming machines per 1,000 people in Australia; and
• fourth highest per capita gambling expenditure in Australia.
11.10. The use of Household Disposable Income should be adjusted to reflect theobserved pattern that households on lower incomes tend to contribute a greaterproportion of their income to gambling revenues
11.11. The ACT, as a matter of principle, is opposed to global and sub-global revenuebase measures. Such measures are insensitive to key influences, which can differmarkedly between jurisdictions. Gambling revenue is no exception.
11.12. HDI does not provide for different propensities for various groups to engage ingambling activities of various types. It also fails to identify cross-border flows in respect oftechnologically advanced forms of gambling ranging from phone betting to internet betting.Additionally, HDI of the resident population does not capture the different capacity ofjurisdictions to draw on tourism as a source of gambling activity.
11.13. The ACT is concerned that, notwithstanding extensive research that points to alarge and complex set of influences impacting gambling behaviour, the currentassessment uses a measure that has severe limitations.
11.14. The ACT considers that equity, transparency and simplicity would be all best servedby a conclusion that there is no basis for assuming that there is any difference injurisdictions relative capacities to raise revenue from gambling activities. The ACT offersthis progenitive solution, notwithstanding it has significant disadvantages in raisingrevenue from Casino gambling due to a lack of overseas tourism.
Comparison of Gambling Revenue Raising Efforts
ACT’s Position on Household Disposable Income (HDI)
Session 11 – Gambling - ‘HDI’ & Revenue Raising – Now & for Future Income Support’
268
11.15. The ACT, accordingly, strongly supports the adoption of an equal per capitaassessment.
Report on ACT Gambling and Revenue
11.16. In February 2002, the ACT Gambling and Racing Commission, on behalf of theACT Treasury, sponsored a report into Gambling and Revenue by ProfessorPeter Grabosky from the Australian National University (ANU), Regulatory InstitutionsNetwork.
11.17. Professor Grabosky has since been appointed as Director, Centre for GamblingResearch at the ANU. This Centre has been jointly established and funded by the ACTGambling and Racing Commission and the ANU.
11.18. Professor Grabosky cites a number of reports and studies to demonstrate:
• the propensity to gamble is influenced by a number of socio-economic and behaviouralfactors;
• HDI is a less than ideal measure of propensity to gamble and thus revenue raisingcapacity;
• households with higher income tend to spend a lower proportion of their income ongambling;
• relatively disadvantaged individuals contribute disproportionately to gambling revenues;and
• gambling taxes are regressive.
11.19. In a comprehensive research project sponsored by the Commission, “Survey of theNature and Extent of Gambling and Problem Gambling in the ACT”, July 2001, it wasdemonstrated that ACT regular gamblers have lower average income levels than thesurveyed ACT population, namely:
• 54% of regular ACT gamblers earn less than $35,000; and
• 34.9% of non-gamblers earn more than $50,000 per year, compared to the nationalfigure of 18.5%.
11.20. Professor Grabosky further observed:
• the ACT would appear to be at some disadvantage to other Australian jurisdictions interms of its capacity to raise gambling revenues;
• with relatively high educational levels and virtually its entire population in a metropolitansetting, one may expect there to be less gambling in the Territory; and
• for a region of its size, its population has arguably a wider range of recreationalpreferences than elsewhere in Australia. Alternative sources of entertainment areavailable to meet these preferences.
Session 11 – Gambling - ‘HDI’ & Revenue Raising – Now & for Future Income Support’
269
11.21. In view of this evidence, the use of HDI as a broad measure of gambling propensityand therefore, revenue raising capacity cannot be justified. The Commission has, at leastin part, acknowledged the limitations of HDI by discounting its effect by 50%.
11.22. The ACT notes the Commission's inclination to continue to use HDI in the gamblingassessment based on the research evidence it presented in its Discussion Paper onGambling (CGC 2002/16). The ACT remains unconvinced that HDI is an appropriatenon-policy influenced measure.
11.23. As it stands, the ACT considers that at the very least, this discount isinsufficient. The ACT’s preference is that HDI not be used at all, but if the discountcontinues to be used it should be raised to at least 75%.
11.24. The Australian Productivity Commission found that:
• metropolitan areas have a higher than expected percentage of non-gamblers;
• conversely non-metropolitan areas have a higher than expected proportion of regulargamblers; and
• regular gamblers profile includes the criterion - “living in metropolitan areas”.
11.25. The Productivity Commission findings provide evidence that there is no basis for theexisting adjustment for non-remote population, which weights populations in metropolitanand urban areas in remote regions. These findings actually suggest the opposite, that is,regular gamblers are more likely to be found in non-metropolitan populations.
11.26. The ACT notes the Commission's inclination to reduce or even discontinuethe existing access adjustment factor and supports the removal of this factor.
11.27. In his report, Professor Grabosky stressed that the capacity to raise gamblingrevenue depends on more than the inclinations of the resident population. Interstate andinternational tourists contribute a significant amount to total gambling turnover in Australia.
11.28. In 2000-2001 the casino industry generated $3.1b in income. Net takings fromoverseas players contributed 19.47% of this total, or $611.0m (ABS 2001). In itssubmission to the Productivity Commission, Burswood Casino estimated that 50% of itsgambling revenue is from ‘high rollers’.
11.29. The National Institute of Economic and Industry Research (2000, 70) estimated thatin 1998, the interstate and international share of casino expenditures in Melbourne was48%, and that tourists in Melbourne account for 10% of expenditure on gaming machines.
11.30. Some examples of other casinos high roller/international business for 2000-01:
Tourism, Canberra Casino and High Rollers
Non-Remote Adjustment
Session 11 – Gambling - ‘HDI’ & Revenue Raising – Now & for Future Income Support’
270
• Crown Casino - $22.5m;
• Jupiters Casino - $10m; and
• Burswood Casino - $54.5m.
11.31. In contrast, Canberra Casino derives negligible revenue from internationalgamblers. Its 'junket' or 'high-rollers' program (targeting groups of known overseaswealthy/heavy gamblers) was discontinued in 1997 due to lack of turnover. It cannotcompete with the larger and more easily accessible casinos in other States.
11.32. Canberra Casino has also been unable to establish a viable premier-playerprogram, which target individual international or interstate wealthy players. CanberraCasino has a lack of competitive advantage in this significant market.
11.33. The Commission’s latest Discussion Paper on gambling concedes that “…someadjustment for high roller activity may be justified”. This is an acknowledgment of theabsence of such activity in the ACT.
11.34. As a result, the ACT considers that, if a differential assessment is to be made,then an adjustment to the ACT’s revenue base should be made for the ACT’sinability to derive revenue from tourism and high rollers.
11.35. An indicative adjustment would be to reduce the ACT’s per capita revenuebase by 50% of the national net expenditure per capita on casino gambling.
11.36. The ACT has used research-based evidence and argument to discuss three keyissues associated with gambling taxation in the Territory, namely:
• the use of HDI as a broad measure of States’ capacities to raise revenue fromgambling activities;
• the non-remote adjustment; and
• Tourism and ‘high-roller’ revenue.
11.37. Based on the evidence presented the ACT considers that:
• HDI not be used at all, but if it continues to be used it should be discounted by75% at the very least;
• the Non-Remote Population Adjustment be removed; and
• if a differential assessment is to be made, then an adjustment to the ACT’srevenue base should be made for the ACT’s inability to derive revenue fromtourism and high rollers. An indicative adjustment would be to reduce the ACT’sper capita revenue base by 50% of the national net expenditure per capita oncasino gambling.
Conclusion
Session 11 – Gambling - ‘HDI’ & Revenue Raising – Now & for Future Income Support’
271
(B) REVENUE RAISING CAPACITY
Casino Canberra.
Dr Mark Mullins, Commissioner of Revenue (Acting)
Mark has extensive experience in risk management and taxation consulting and hasworked for a number of large accounting and law firms. Mark has also worked as aneconomist at the North Africa and Middle East desk of the World Bank and has recentlycompleted a Doctor of Philosophy in Law and Economics.
Presenters
Session Objectives
• This presentation will deal with the key impediments to raising revenue in the ACT.
ACT’s Restricted Revenue Base
• To display the disadvantage that the ACT faces in its ability to raise revenuecompared to other larger States, primarily because the Territory has no resourcewealth, little business activity and no locational advantages that result in highwealth bases.
The Commonwealth Presence
• To reinforce the ACT’s inability to raise revenue from the Commonwealth, and theeffect that this has on the capacity to raise payroll tax, land tax and stamp dutyrevenue.
Taxation Leakage
• To demonstrate the tax leakage that occurs in both the payroll tax and financialtransaction tax bases as a result of the Territory's small geographic size andunique location.
Venue
Session 11 – Gambling - ‘HDI’ & Revenue Raising – Now & for Future Income Support’
272
11.38. The ACT Revenue Office is the major revenue collection agency for the ACT, and isresponsible for collecting taxation revenue, undertaking associated compliance activities,developing taxation policy and legislation, and providing assistance and advice to clients tomeet their obligations. The Office has 70 staff in four sections as follows:
• Compliance;
• Policy, Legislation and Projects;
• Rates and Land Tax; and
• Taxation Services.
11.39. Unlike other jurisdictions, the ACT Revenue Office is responsible for collectingmunicipal taxes. This is a significant function and accounts for over 20% of own sourcerevenue. In 2001-02 general rates revenue amounted to $110.5m.
11.40. The ACT has two other main sources of revenue - payroll tax and stamp duty onconveyancing. Together these three items accounted for over 75% of own source revenuein 2001-02.
11.41. The Revenue Office also participates in a variety of Inter-Jurisdictional forumsincluding, GST Administration, GST Policy Group, Revenue Office Compliance Managers
Key Points from the ACT Main Submission
Overview of Service Delivery in the ACT
Duty on Conveyancing
• The ACT requests the removal of the “classes of transaction” adjustment of 4% forthe Territory. The ACT has broadened the definition of dutiable property in the ACTDuties Act 1999 and now has a revenue base similar to the majority of jurisdictions.
Financial Transactions Tax (FTT)
• The ACT requests that Bank Account Debits (BAD) tax collected be used as thebasis for calculating the revenue base for the FTT assessment. The ACT believesthat this is the most suitable measure as it is applied uniformly across alljurisdictions, is the largest single tax type collected in the FTT category and reflectsthe impact of tax leakage and mobility. If the current method remains, the ACT’srevenue base should be reduced by 2% to reflect tax leakage.
Insurance Taxation
• The ACT supports the current Insurance Taxation assessment methodology basedon actual revenue collections using independent Australian Prudential RegulationAuthority (APRA) industry data. This accurately reflects the ACT’s low revenueraising capacity driven by its inability to levy stamp duties on the Commonwealth.
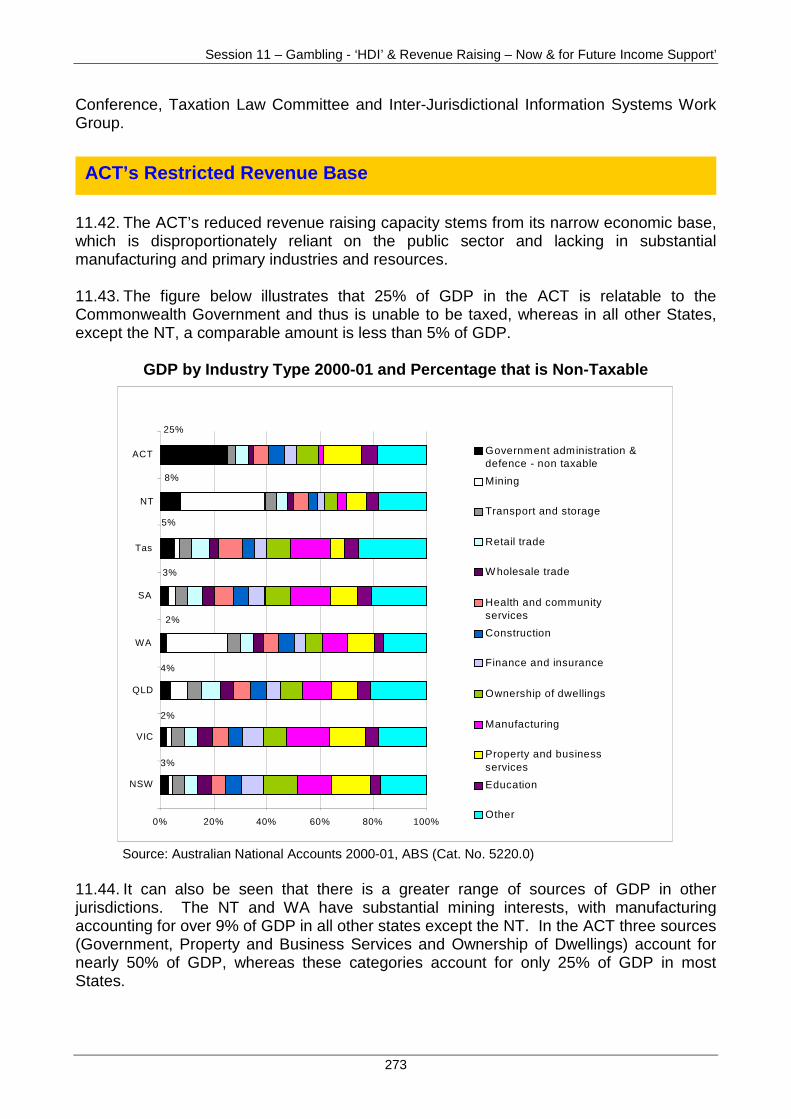
Session 11 – Gambling - ‘HDI’ & Revenue Raising – Now & for Future Income Support’
273
Conference, Taxation Law Committee and Inter-Jurisdictional Information Systems WorkGroup.
11.42. The ACT’s reduced revenue raising capacity stems from its narrow economic base,which is disproportionately reliant on the public sector and lacking in substantialmanufacturing and primary industries and resources.
11.43. The figure below illustrates that 25% of GDP in the ACT is relatable to theCommonwealth Government and thus is unable to be taxed, whereas in all other States,except the NT, a comparable amount is less than 5% of GDP.
GDP by Industry Type 2000-01 and Percentage that is Non-Taxable
25%
8%
5%
3%
2%
4%
2%
3%
0% 20% 40% 60% 80% 100%
NSW
VIC
QLD
WA
SA
Tas
NT
ACT Government administration &defence - non taxable
Mining
Transport and storage
Retail trade
W holesale trade
Health and communityservices
Construction
Finance and insurance
Ownership of dwellings
Manufacturing
Property and businessservices
Education
Other
Source: Australian National Accounts 2000-01, ABS (Cat. No. 5220.0)
11.44. It can also be seen that there is a greater range of sources of GDP in otherjurisdictions. The NT and WA have substantial mining interests, with manufacturingaccounting for over 9% of GDP in all other states except the NT. In the ACT three sources(Government, Property and Business Services and Ownership of Dwellings) account fornearly 50% of GDP, whereas these categories account for only 25% of GDP in mostStates.
ACT’s Restricted Revenue Base
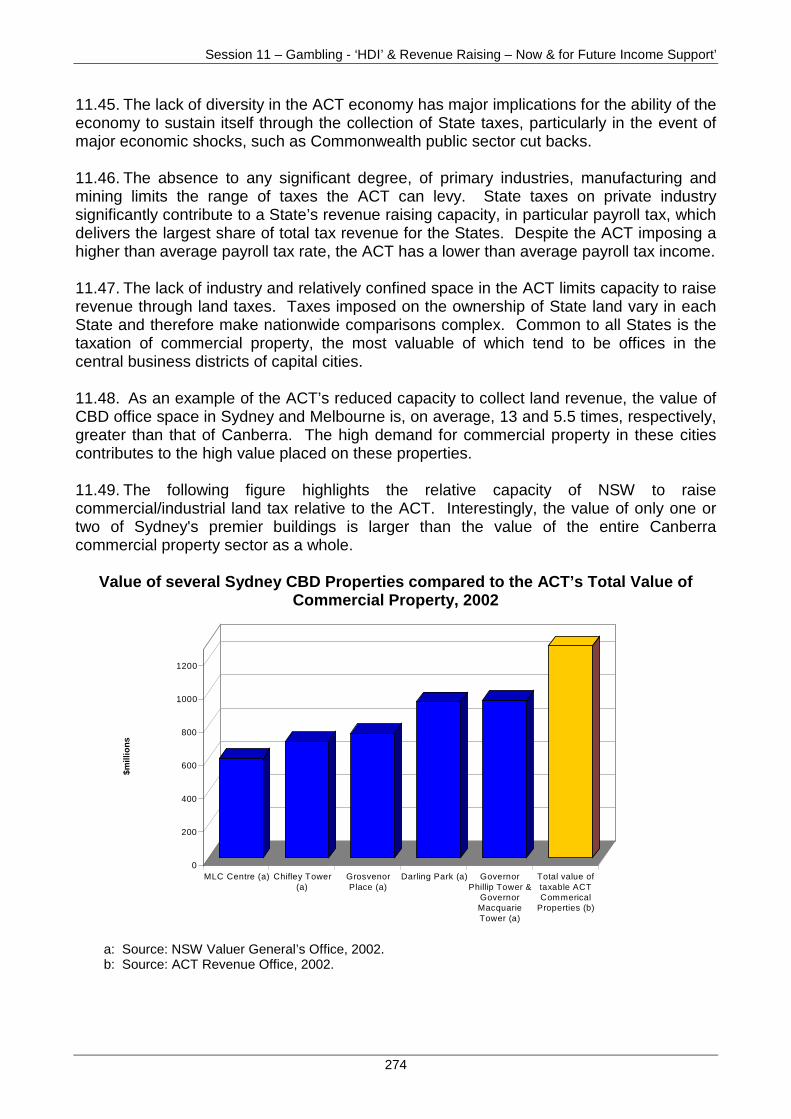
Session 11 – Gambling - ‘HDI’ & Revenue Raising – Now & for Future Income Support’
274
11.45. The lack of diversity in the ACT economy has major implications for the ability of theeconomy to sustain itself through the collection of State taxes, particularly in the event ofmajor economic shocks, such as Commonwealth public sector cut backs.
11.46. The absence to any significant degree, of primary industries, manufacturing andmining limits the range of taxes the ACT can levy. State taxes on private industrysignificantly contribute to a State’s revenue raising capacity, in particular payroll tax, whichdelivers the largest share of total tax revenue for the States. Despite the ACT imposing ahigher than average payroll tax rate, the ACT has a lower than average payroll tax income.
11.47. The lack of industry and relatively confined space in the ACT limits capacity to raiserevenue through land taxes. Taxes imposed on the ownership of State land vary in eachState and therefore make nationwide comparisons complex. Common to all States is thetaxation of commercial property, the most valuable of which tend to be offices in thecentral business districts of capital cities.
11.48. As an example of the ACT’s reduced capacity to collect land revenue, the value ofCBD office space in Sydney and Melbourne is, on average, 13 and 5.5 times, respectively,greater than that of Canberra. The high demand for commercial property in these citiescontributes to the high value placed on these properties.
11.49. The following figure highlights the relative capacity of NSW to raisecommercial/industrial land tax relative to the ACT. Interestingly, the value of only one ortwo of Sydney's premier buildings is larger than the value of the entire Canberracommercial property sector as a whole.
Value of several Sydney CBD Properties compared to the ACT’s Total Value ofCommercial Property, 2002
0
200
400
600
800
1000
1200
$mill
ion
s
MLC Centre (a) Chifley Tower(a)
GrosvenorPlace (a)
Darling Park (a) GovernorPhillip Tower &
GovernorMacquarieTower (a)
Total value oftaxable ACTCommerical
Properties (b)
a: Source: NSW Valuer General’s Office, 2002.b: Source: ACT Revenue Office, 2002.
Session 11 – Gambling - ‘HDI’ & Revenue Raising – Now & for Future Income Support’
275
11.50. The Constitutional exemption available to the Commonwealth for the non-paymentof State taxes excludes a substantial proportion of the ACT’s economic base from itstaxable capacity.
11.51. The Commonwealth Government employs approximately 50% of all employees inthe ACT and furthermore, owns a substantial proportion of non-residential property. Bothof which the ACT is unable to tax.
11.52. The ACT is also disadvantaged in its ability to collect duty on insurance revenuefrom commercial properties. This is because of the high proportion of commercialbuildings where the Commonwealth is the insurer.
11.53. The ACT’s unique geographical position makes it more vulnerable to tax leakagethan other States. In the case of payroll tax, this is reflected by the fact that more than halfof all payroll tax inspections undertaken by the ACT uncover businesses paying payroll taxto NSW, rather than to the ACT where their actual liability rests.
11.54. There are several interrelated reasons why businesses choose to pay payroll tax inNSW rather than in the ACT. Companies with a head office in NSW and a branch in theACT are less likely to undertake a separate payroll tax return for the ACT due to:
• the additional cost and complexity of lodging two payroll tax returns;
• the insufficient levels of penalties imposed; and
• the minimal efforts made by NSW in assisting the ACT with compliance activity.
11.55. The ACT undertakes client education seminars and courses, including the provisionof material to taxpayers and potential taxpayers. Additionally, the Territory also providespresentations to professionals who advise taxpayers.
11.56. However, the only way to enforce ACT payroll tax legislation is to undertakeconsiderable compliance activity in the form of inspections. Given that there areapproximately 1,900 taxpayers registered in the ACT for payroll tax, as well as those whoare not registered but are liable, the probability of detection is small. The table below isbased on findings from inspections, and estimates the extent of payroll tax beingincorrectly paid to NSW.
Taxation Leakage
The Commonwealth Presence

Session 11 – Gambling - ‘HDI’ & Revenue Raising – Now & for Future Income Support’
276
ACT Payroll Tax Revenue Incorrectly Paid to Nsw
No ofcompanies
whereleakagedetected
A
Total no ofcompaniesinspected
B
% of totalcompanies inspected
C=A/B*100
Primarytax
revenuedetected($’000)
D
Estimatedtotal
leakage($’000)
E=D/C
Total ACT payroll tax
revenue($’000)
F
% leakage
G=E/F*100
1998-99 21 92 23% 627 2,726 125,543 2.2%
1999-00 6 74 8% 229 2,862 135,960 2.1%
2000-01 12 106 11% 375 3,409 155,186 2.2%
3 yr total 39 272 14% 1,231 8,793 416,689 2.1%
Source: Revenue Management Branch Records, ACT Department of Treasury, 2002.
11.57. The ACT requests the adjustment of its payroll tax revenue base downwards by2% (and upwards by the same absolute amount for NSW) to reflect the leakage of ACTpayroll tax revenue to NSW. Unfortunately, although actual revenue losses are unknown,compliance activity has indicated some areas of tax leakage.
11.58. Similarly, the ACT also loses Bank Account Debit (BAD) tax revenue to otherjurisdictions because a number of Credit Unions based in Canberra have their main bankaccount in Melbourne. The ACT estimates that in 1999-2000, at least $0.1m in BAD taxwas lost to Victoria through Credit Unions.
11.59. Overall, the ACT conservatively estimates that an extra 2% in BAD tax revenuecould be raised if there was no leakage to other jurisdictions.
11.60. The ACT believes that the use of BAD tax as the basis for calculating the revenuebase for the Financial Transactions Tax (FTT) would adequately reflect the impact whichmobility has on tax leakage from one jurisdiction to another.
11.61. If the Commission is not disposed to use BAD tax as the basis for calculating therevenue base for the FTT assessment, the ACT’s revenue base should be reduced by 2%to reflect tax leakage.
11.62. The ACT considers that it is reasonable for the Commission to assess theeffects of cross border impacts on the revenue side similar to the assessment of theeffects on the expenditure side. It is important that the symmetrical assessmentapproach to the revenue and expenditure categories be retained to ensure theveracity of the assessments.
Session 11 – Gambling - ‘HDI’ & Revenue Raising – Now & for Future Income Support’
277
11.63. The ACT is severely restricted in raising revenue compared to other jurisdictionsbecause of its lack of natural resources, small and unique geographic location and thepresence of the Commonwealth.
11.64. In the main, the Commission’s current assessment methods adequately reflect theACT’s disadvantages, except for two key issues:
• payroll tax leakage to NSW; and
• leakage of BAD tax to NSW and Victoria.
11.65. In order to rectify these disadvantages, the ACT has proposed the followingadjustments:
• decrease the ACT’s payroll tax revenue base by 2% (and upwards by the sameabsolute amount for NSW) to reflect the leakage of ACT payroll tax revenue toNSW; and
• use Bank Accounts Debits tax as the basis for calculating the revenue base forFinancial Transactions Taxes, or alternatively, decrease the FTT tax revenuebase by 2%.
Conclusion
Session 12 – Wrap up of Week’
278
DAY THREE
FRIDAY, 15 NOVEMBER 2002
SESSION 12. – ‘WRAP UP OF DISCUSSIONS’:
• Wrap Up of ACT Workplace Discussions.(No papers will be presented in this session)