bridging the discontinuity in adolescent literacy? mixed...
TRANSCRIPT

0
Bridging the Discontinuity In Adolescent Literacy?
Mixed Evidence from a Middle Grades Intervention
Shaun M. Dougherty
Doctoral Fellow
Center for Education Policy Research at Harvard University
490 Eliot Mail Center
Cambridge, MA 02138
DRAFT: DO NOT CITE WITHOUT AUTHOR PERMISSION
Acknowledgements: I would like to thank Marty West, Larry Katz, Stephen Lipscomb, Matthew
Kraft and John Willet, for the insights and feedback on this draft. I would also like to thank the
feedback and suggestions of my anonymous reviewers who helped advance the analysis and
findings of this paper. All mistakes or omissions are my own. I would also like to thank the
Dean’s Summer Research Fellowship at the Harvard Graduate School of Education for material
support of this research.
1
Bridging the Discontinuity In Adolescent Literacy?
Mixed Evidence from a Middle Grades Intervention
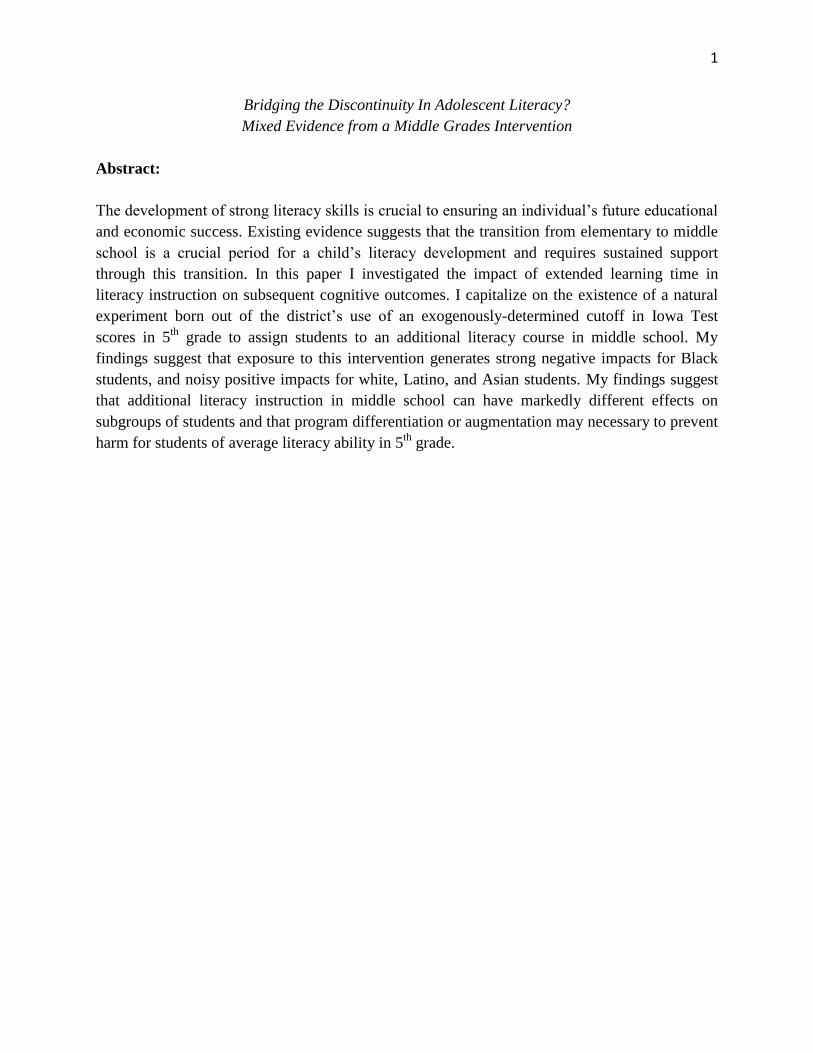
Abstract:
The development of strong literacy skills is crucial to ensuring an individual’s future educational
and economic success. Existing evidence suggests that the transition from elementary to middle
school is a crucial period for a child’s literacy development and requires sustained support
through this transition. In this paper I investigated the impact of extended learning time in
literacy instruction on subsequent cognitive outcomes. I capitalize on the existence of a natural
experiment born out of the district’s use of an exogenously-determined cutoff in Iowa Test
scores in 5th
grade to assign students to an additional literacy course in middle school. My
findings suggest that exposure to this intervention generates strong negative impacts for Black
students, and noisy positive impacts for white, Latino, and Asian students. My findings suggest
that additional literacy instruction in middle school can have markedly different effects on
subgroups of students and that program differentiation or augmentation may necessary to prevent
harm for students of average literacy ability in 5th
grade.

2
Bridging the Discontinuity In Adolescent Literacy?
Mixed Evidence from a Middle Grades Intervention
The capacity of school districts to support the ongoing development of their students’
literacy skills plays a critical role in enhancing their academic and labor-market outcomes.
Though the average fourth graders’ reading scores on the National Assessment of Educational
Progress have been trending higher, Snow and Moje (2010) point out that score trends are flat
among average 8th
and 12th
graders, (Lee, Grigg, & Donohue, 2007, p.3). These trends
underscore the need for literacy support at the critical transition between elementary and
secondary schooling (Chall & Jacobs, 2003), not only for the most struggling readers, but for
students across the performance distribution. The transition from elementary to middle school is
particularly crucial for boys and students of color (Porche, Ross, & Snow, 2004; Tatum, 2008),
and so extra care and attention is warranted in supporting both of these groups of students.
Schools and districts seeking to improve their adolescent literacy outcomes face resource
constraints. Recent budget crises and mounting pressure from the requirements of No Child Left
Behind (NCLB) necessitate that schools find ways to leverage existing resources and generate
results in short time frames. One widely used though under-evaluated method for improving
student outcomes is increased learning time, especially in the tested areas of English-language
arts and mathematics. To date there is mixed evidence as to whether increasing learning time
overall or in specific subject areas can produce favorable impacts on student outcomes. For
instance, Lavy (2010) finds a positive association between increased learning time and
internationally benchmarked exam scores. In related work, several papers have used random
variation in the length of a student school year to show that more time in school results in higher

3
test score outcomes (Goodman, unpublished; Hansen, 2008; Marcotte & Helmet, 2008;
Fitzpatrick, Grismmer & Hastedt, 2011; Sims, 2008).
Other evidence has focused on evaluating the provision of a “double dose” of instruction
in subject areas tested for the purposes of NCLB, most notably, reading and mathematics. Recent
evidence from Chicago suggests that increased exposure to algebra instruction and favorable
ability groupings can have positive short-term impacts on student’s academic performance, as
well as positive longer-run impacts on high-school graduation and post-secondary enrollment.
(Nomi & Allensworth, 2009; Cortes, Goodman, & Nomi, 2012). Other recent work examining
the effects of double dose strategies in mathematics have also found positive effects of extending
the learning time in mathematics (Taylor, 2012). However, little is known about the effectiveness
of expanded learning time in literacy skills as a way to boost literacy outcomes despite evidence
that such strategies have been and are used throughout the country (Cavanagh, 2006; Mazzolini
& Morley, 2006; Paglin, 2003; Wanzek & Vaughn, 2008; Durham Public Schools, n.d). The
paucity of good evidence on the effectiveness of literacy interventions at the crucial transition
from elementary to middle grades is particularly notable in that the little evidence that exists is
not causal.
I fill this gap in the literature by providing causal evidence for the effectiveness of
extended learning time in English-language arts instruction in middle school. I focus on an
intervention where the additional course in literacy instruction uses research-based instructional
strategies as a supplement to a typical English course. This program is designed for students who
score near the national average on a 5th
-grade measure of literacy and is taken in place of an
introductory world-language course in middle school. I show that this additional instruction leads
to systematic improvement in adolescent reading comprehension for many students, while

4
having a negative effect on the literacy performance of Black students. Using a rich set of data
from Hampton County Public Schools – one of the nation’s forty largest school districts located
in the southeast U.S., I estimate the impact of a district-developed, classroom-based literacy
intervention in middle school on both immediate and medium-term student test scores.1
Specifically, I investigated whether — and by how much — participation in a supplementary
reading class in middle school improved student test scores in reading and mathematics for Black
students as well as their white, Latino, and Asian counterparts.
Hampton County provided a desirable setting to evaluate the impact of a research-based
and district-designed literacy intervention. In the district, student eligibility for the supplemental
reading class was made using a cutoff rule based on a student’s 5th
grade test score, allowing me
to use a regression-discontinuity design to obtain an unbiased estimate of the causal impact of
the intervention on student outcomes for those students near the cutoff that determined
eligibility. The student’s position relative to this cutoff provided an indicator of eligibility for the
literacy intervention. Because not all students who were eligible to receive the intervention
actually participate, I use a fuzzy regression discontinuity design where I used the indicator of
eligibility to instrument for their “take-up” of the supplementary reading intervention. Thus,
using a two-stage least squares estimation strategy with instrumental variables, I was able to
identify the causal impact of eligibility for and enrollment in the program for students near, but
on opposite sides of the cutoff.
I find that aggregate effects of the program for students on the margin of eligibility
appear to produce zero impact on test-score performance, but that there are distinct and opposite
impacts by race. Specifically, Black students on the margin of eligibility experience a large
negative impact on test scores by participating in the supplemental reading program, while
1 Note that I use a pseudonym for the district to reduce potential negative impacts associated with my mixed results.

5
students in other racial groups (mostly white) experience smaller positive impacts. The effects of
the additional literacy instruction on reading test scores in 6th
grade are smaller and not
statistically significant, while the impact on reading scores in 7th
and 8th
grade is large and
significant. For Black students these effects are negative, while for white, Latino, and Asian
students the effects are positive though with similar magnitude. The harm and benefit
experienced by these students on the state assessments of literacy appear to extend to the ITBS in
8th
grade as well, indicating that the measured learning impacts suggest generalizable impact and
not artifacts of potential teaching to the test.
I have laid out the rest of the paper in four sections. In the next section, I consider the
district’s theory of action with respect to the extant literature on effective instructional strategies
that promote adolescent literacy, and describe the school district setting and their implementation
of the supplementary reading program itself. In section three, I present my research design,
including a description of my data collection and data-analytic strategy, followed by my results
in section four. In the final section of the paper, I discuss potential threats to both the internal and
external validity of my findings and review the implications of my findings for practice and
future research.
2. Background and Context
2.1 Background on the Intervention:
For the last twenty years, the Hampton County Public School (HCPS) district has adapted
its approach to meeting the instructional needs of its students in literacy, as the policy
environment has shifted around it.2 Initially, the district employed the use of a supplementary
reading program as a means to improve the literacy skills of its students as they transition from
2 Per my agreement with the district I have replaced the actual district and program names with pseudonyms when
referring to them in print.

6
primary to secondary schooling. The district-maintained reading lab was designed to provide
instructional support in literacy for students in the late elementary and early secondary grades.
This lab supported students outside of their regular course of instruction, but in the 1990s the
district moved to embed literacy support within an established course of instruction. Some of
this change was motivated by standards-based reforms that changed the way that instructional
targets, or standards, were defined (Darling-Hammond, 2004; McLaughlin & Shepard, 1995).
The importance of the course was further underscored when the policy landscape was modified
again in 2001 by the passage of the federal No Child Left Behind (NCLB) act and the
implementation of high-stakes, standards-based testing that began in the 2002-2003 school year.
In response to these changes, HCPS has revised its instructional strategy to meet the needs of its
students and to ensure that its schools satisfy, among other things, the adequate yearly progress
(AYP) provision of NCLB.
Each of the district’s nineteen middle schools serves students in grades 6 through 8. In all
district middle schools, students must earn a passing grade in a language-arts course to fulfill
their annual English requirement. Language-arts courses address all of the state standards’
domains: reading, writing, literary conventions, listening, speaking, and viewing. To address
these domains, the language-arts classes use a literature anthology, a grammar text, and selected
novels assigned specifically by grade level. The supplementary reading course was designed to
complement a student’s language arts curriculum, and to improve the development student’s
literacy skills to levels that are consistent with grade-level expectations by focusing only on the
reading standards, and the standards for writing in response to reading. Teachers address the
reading standards in the supplementary reading classes using grade-level-appropriate non-fiction
texts and novels. Though similar instructional strategies are pursued in both classes, the literacy

7
course takes a more narrow focus on reading strategies, while the language-arts course takes a
broader focus.
2.2 Theory of Change and Recent Literature
The theory of change employed by HCPS is that enrolling students who have
demonstrated a need for additional literacy support in a course that was designed to employ
research-proven strategies is likely to improve literacy outcomes for those students. Specifically,
this district drew on research such as Dole, Duffy, Roehler, and Pearson (1991), and designed the
supplementary reading class to explicitly dwell on seven “basic” reading strategies: activating
background knowledge, questioning the text, drawing inferences, determining importance,
creating mental images, repairing understanding when meaning breaks down, and synthesizing
information. In addition, the district also encouraged the use of writing activities to support each
of these seven reading strategies.
Though the research from Dole and colleagues is more than twenty years old, more
recent research continues to substantiate the use of these strategies, particularly with adolescents.
A meta-analysis on the effectiveness of reading interventions for struggling readers in grades six
through twelve revealed that many of the same strategies suggested by Dole and colleagues were
used across the thirteen studies that could be included in that meta-analysis (Edmonds, Vaughn,
Wexler, Reutebuch, Cable, Klinger Tackett, Schnakenberg, 2009). This meta-analysis found a
large effect size of 0.89 SD for reading comprehension outcomes. Evidence from another recent
meta-analysis on writing to read, further supports the strategies employed by HCPS. Graham &
Hebert (2012) found that writing to read strategies improve student reading comprehension by
about 0.37 SD. In yet another teacher-delivered intervention, Vaughn, Klingner, Swanson,
Boardman, Roberts, Mohammed, & Stillman-Spisak (2011) performed an experimental

8
evaluation of collaborative strategic reading (CSR) with middle school students, where English-
language arts teachers provided a multicomponent reading comprehension instruction twice a
week for 18 weeks, and found modest positive effects on reading comprehension. All of this
more recent evidence suggests that the research used to design the supplementary reading class
continues to be valid and relevant.
Though Hampton employs instructional strategies to improve the performance of all
struggling readers, the supplementary reading intervention that I evaluate here is not a remedial
intervention as it focuses on students who performed at the 60th
percentile nationally in 5th
grade
on the ITBS. Despite the fact that these students achieve average performance on a national
scale, the students who are the target of the intervention in Hampton are well below the mean
performance in the district (see Figure 1). The purpose of the intervention is to ensure progress at
grade level, and is part of a district effort to ensure that students are equipped with the literacy
skills that will allow them to complete at least their high school education. The supplementary
reading course in Hampton is taken in place of a world language course. So, rather than
beginning an exploratory language program in grade 6 a student who participates in the literacy
intervention is likely to delay study of a world language until they exit the supplementary
reading program. This substitution away from world language participation is simply a delay in
the start of exposure. Though earlier exposure to other language has been shown to make for
better language acquisition, waiting until as late as high school to begin studying a language does
not preclude a student from taking four years of high-school level language study, which is a
common requirement to be admitted to more competitive colleges. For this reason the
substitution enforced by this literacy intervention poses little risk of negative longer-term
consequences, while carrying the upside risk of improved reading skills in English.

9
Though Hampton does offer a remedial intervention, it is limited to those students who
score in the lowest NCLB-defined performance category on the reading assessment in grade 5.
The assignment mechanism for this intervention also lends itself to being evaluated using an RD
design, however there are so few students in this end of the distribution that any potential effects
cannot be identified with sufficient statistical power to make it feasible. Though many schools
and district would like to know what interventions can be effective in serving their neediest
students, it is similarly important to understand what can be done to keep students on track
toward graduating from high school and being prepared to enroll in post-secondary education.
Students on the margin of the 60th
percentile on the ITBS nationally are certainly not guaranteed
to graduate from high school, nor are they certain to be college bound, particularly in light of the
fact that only 30 percent of the U.S. population holds a bachelor’s degree. It stands to reason that
falling further behind during middle school may have a strong negative impact on student’s
longer-term outcomes, and so understanding the impact of this intervention remains policy
relevant.
2.3 Assignment to the Supplementary Reading Program
Students in Hampton were assigned to receive supplementary reading instruction in
middle school based on how they scored on the Iowa Test of Basic Skills (ITBS) in reading
during their 5th
grade year. Students who scored at or below the nationally-defined 60th
percentile
on ITBS in reading were assigned, by rule, to complete the supplementary reading program in
middle school. The HCPS policy was designed to enroll students in the supplementary reading
course for all three (grades 6, 7, and 8) years of middle school, with the goal of preparing
students to meet proficiency requirements on the criterion-referenced 8th
grade state test in
reading (used in making decisions about grade promotion), and on the norm-referenced 8th
grade

10
administration of the ITBS in reading. Students not identified to participate in the reading
intervention could elect to take a reading course or enroll in an exploratory foreign-language
course.
3. Research Design:
3.1 Site, Dataset, and Sample:
HCPS is a large suburban school district in the southeastern United States. My data are
drawn from a comprehensive administrative data set covering all students enrolled in the district
during the school years of 1999-2000 through 2009-2010. This dataset contains test scores and
enrollment data for students in middle school and follows them longitudinally within the district.
The data include course enrollment data, mandated state accountability test scores in reading,
literature and mathematics, and ITBS scores from grades five and eight. Hampton County
resembles the changing demographic structure of many suburban settings, with substantial racial
and socioeconomic variation. The student population is 33% white, 42% African American, 13%
Latino/a, 9% Asian, and 4% identify as either Native American or multiracial. Forty-four percent
of students receive free- or reduced-price lunch, 8% are English-Language Learners, and 18%
have an Individualized Education Program.
The district is comprised of schools classified as traditional, charter, converted charter,
and alternative schools. Only traditional and conversion charter schools are subject to district
policies while alternative and other charters are exempt. I restrict my analysis to students who go
through one of the 19 traditional or conversion charter middle schools that serve Hampton
students in grades 6 through 8 and were subject to the policy. My sample includes all students

11
from the five cohorts who took the 5th
grade ITBS reading test in the school years 2002-2003
through 2006-2007.
3.2 Measures
My academic outcomes of interest are state test scores in reading and mathematics in
grades six through eight (READ6, READ7, READ8, MATH6, MATH7, MATH8). For each of
these outcomes I wish to estimate the effect of participating in the supplementary reading
intervention which I measure as the ratio of total semesters that a student is enrolled in
supplementary reading, to the total number of semesters that a student has been in middle school
(SUPREAD). This variable has a minimum at zero for students who enroll in no semesters of the
supplementary reading course, and a maximum of one for those who participate for all possible
semesters to that particular grade in middle school (see Angrist & Imbens, 1995 for a discussion
about the benefits of using a continuous measure for first-stage exposure). For instance, 7th
-grade
students have experienced a maximum of four semesters (assuming they were not retained in
grade) and could have enrolled in the supplementary reading program for between zero and four
semesters. . Because student eligibility for the reading intervention is conditional on their 5th
grade ITBS percentile score, I also include this measure (ITBS5) as the forcing variable, as well
as a binary indicator (ELIG) equal to one if a student scored at or below the 60th
percentile on the
5th
grade ITBS, and is therefore eligible to receive the supplementary reading instruction. To
improve the precision of my estimates I include a vector of student covariates, . This vector
includes indicators for sex, race, free and reduced lunch status, special education status, and
English Language Learner status. Despite designing the literacy intervention as a district-level
policy, the application of the policy may vary based on the individual behavior of school
administrators. For instance, individual schools may be more or less stringent in their

12
requirement that students who are eligible for supplementary reading take-up the treatment.
Likewise, adherence to a long-standing policy may experience drift over time. To control for
potential differences in the implementation of the literacy intervention across schools and cohorts
of students, I additionally include school-by-year fixed effects ( .
3.3 Statistical Model:
Within my regression-discontinuity research design, I employ a two-stage least squares
(2SLS) approach to estimate the causal effect of participating in supplementary reading while in
middle school. Because take up of the supplementary reading instruction is potentially
endogenous, I use the random offer of eligibility in the program, generated by a student’s
position relative to the 60th
-percentile cutoff, to isolate the exogenous variation in participation.
In my first stage, I fit the following statistical model:
(1)
I model the proportion of their total semesters of middle school that a student is enrolled
in the supplementary reading course ( ), for student i in school j and cohort s. I
estimate this participation variable as a function of students’ 5th
-grade ITBS score re-centered at
the 60th
percentile cutoff score , the exogenous instrument, , the vector of
student-level covariates ( ), and fixed effects for school and cohort. As is typical in the RDD
literature, to allow the relationship between supplementary reading participation and 5th
grade
ITBS score to vary on either side of the exogenous cutoff, I also include the interaction term
(Murnane & Willett, 2011). To model potential heterogeneity of the effect of

13
the program by race, I fit separate models by whether a student is African American or not.3
Following the suggestion of Card and Lee (2008) I model the error structure to account for the
clustering of students by values of the discrete forcing variables.
In the second stage of my estimation, I use the following statistical model:
(2)
In this model I estimate , a generic placeholder for my several outcomes of interest, as a
function of the re-centered 5th
-grade ITBS score, student exposure to the supplementary reading
course, as well as a vector of student covariates and fixed effects for school and cohort. As in my
first stage, I also allow the slope of relationship between ITBS score and the outcome to vary on
either side of the cutoff. Importantly, because the take-up of supplementary reading is
endogenous, I use the fitted values of from my first-stage model to isolate that the
variation in this treatment that is exogenous, to estimate the causal effect of an additional
semester of supplemental reading on the student outcome, . As in the first stage, I also
cluster standard errors at levels of the forcing variable.
The coefficient that answers my research question is , which represents the causal
effect of experiencing an additional semester of the literacy intervention for a student who fell
just shy of the required passing score on the 5th
-grade ITBS compared to students who scored
just above this score threshold on the 5th
grade test.
3 To achieve greater statistical power I create a second instrumental variable, BLACKxELIG, and a variable that
allows take-up of the supplemental reading program to vary by race, BLACKxSUPREAD. Using these two
additional variables I can then use my 2SLS approach to fit two first-stage models (one each for the outcomes
SUPREAD, and BLACKxSUPREAD) with my two instruments ELIG and BLACKxELIG. My IV results are not
sensitive to the approach that I employ.

14
Following the model of Imbens & Kalyaramanan (2009), I model the relationship
between 5th
grade ITBS score and the outcome in each stage as “locally linear”. I chose an
optimal bandwidth using the IK method and fit models across analytic windows of varying
width. The results of this process yield different optimal bandwidths for each outcome. To verify
the robustness of my results, I fit my models using the IK and additional choices of bandwidth.
Using wider bandwidths allow me to increase my statistical power and precision. In the threats to
validity section below, and throughout my analyses, I perform a number of tests to verify that my
results are not sensitive to my choice of bandwidth or the functional form of my forcing
(running) variable, ITBS5.
3.4 Verifying Assumptions for Regression-Discontinuity
All regression discontinuities have the potential to be undermined by failures of
important assumptions, most notably discontinuities in other variables, or discontinuities in the
forcing variables at unexpected locations. It is crucial to establish that my findings are not driven
by discontinuities in control variables, that the instrument is working the way that it was
intended, and that the only discontinuity in student exposure to the treatment is at the point of the
cutoff designated by the school district.
To verify the soundness of my regression discontinuity design, I employ several checks
on my model. Following the example of McCrary (2008), I first investigated whether any
evidence existed to suggest manipulation of the forcing variable.1 Manipulation of student’s
position relative to the district-defined cutoff is highly implausible. For instance, students cannot
manipulate their position relative to the cutoff since the percentile rank is generated from a
nationally-normed sample. And district administrators may likewise not manipulate the
eligibility of students with respect to the exogenously-chosen cutoff, which lessens the potential

15
threat to the RD design. Despite absence of a real threat to the validity of my forcing variable, in
Figure 1 I present the empirical distribution of the forcing variable, 5th
-grade ITBS score, to
illustrate that it is smooth across the whole distribution, and in particular around the discontinuity
used for assigning students to the supplementary reading (denoted by the vertical red line). The
empirical distribution that I present in Figure 1 does not show evidence of particularly high
densities of individuals on either side of the cutoff which might suggest evidence of
manipulation.
To further attest to the validity of the RD approach, I display in Figure 2 evidence of a
discontinuity in exposure to treatment at the exogenously-determined cutoff in ITBS score. Each
of the three panels depicts evidence of a modest discontinuity in the number of semesters of the
reading support that students on either side of the eligibility cutoff received by the specified
grade in middle school. For instance, the gap shown between the trends at the cutoff score in
Panel (A) suggests that exposure to treatment by the end of 6th
grade differed by about 20
percentage points, or about ½ of a semester. Though the discontinuity is not large, it is
pronounced enough to warrant the use of a fuzzy regression-discontinuity design. I demonstrate
in my first-stage analysis that, despite this small discontinuity, the instrument is quite strong by
conventional measures of instrument strength (Stock, Wright, & Yogo, 2002) in both the 7th
and
8th
-grades.
As a final check on the appropriateness of my RD approach, I examined the distributions
of covariates that I used as control variables to ensure that no other discontinuities existed which
might have generated my results. To examine potential discontinuities, I fit the model:
. I fit this model across multiple
bandwidths to confirm that, near the cutoff, there are no discontinuities in the covariates and that

16
students who are eligible for assignment to supplementary reading are equal in expectation to
those who are not eligible based on their 5th
grade ITBS score. Evidence that this assumption is
upheld is demonstrated by my failing to reject the null hypothesis that is equal 0 for each of
the covariates. I display the results of this specification check in Table 1. These results suggest
that, except for the IK bandwidth which is just two percentile points on either side of the cutoff,
there are just three tests that reject the null hypothesis of no difference in the covariates in the
treatment or control groups. The difference in the share of Latino students on either side of the
cutoff appears that it is likely aberrant, however there is some evidence that the share of students
with disabilities (SWD) may differ slightly on either side of the cutoff. In my preferred models,
below, I include controls for these student covariates as a way to adjust for these small
differences in student characteristics.
4. Results:
I find evidence that the reading intervention positively impacts the performance of white,
Latino, and Asian students on state tests of reading and mathematics performance as well as the
8th
-grade ITBS. However, I find larger and negative impacts on literacy measures for Black
students. The effects I estimate are noisy in 6th
grade, but quite precise in both 7th
and 8th
grades.
4.1 Patterns of Participation
Despite the rule-based determination of eligibility for the supplemental reading program,
the ability of students and families to select in and out of the program makes for patterns of
participation that require closer examination. In Table 2 I present the patterns of participation by
grade and race for students who were within ten percentile points on either side of the cutoff
used to determine eligibility. Two features of this table are particularly noteworthy. First, black

17
and white students participate in the supplemental reading program at similar rates, regardless of
their formal eligibility. Second, students who are by rule not eligible for the reading program are
more likely to elect to take the reading class in 6th
grade than they are in grades 7 or 8. For
instance, 75 percent of all students spend both of their semesters in 6th
grade (100% of their
enrollment) in supplemental reading if they are eligible and within ten points of the cutoff, while
nearly 50 percent of those who are above the cutoff and within ten percentile points also choose
to participate for the whole of their 6th
-grade year. By 7th
grade only about half of those initially
eligible for the reading course still participate fully (which is 2/3 of the 6th
-grade participants),
while those technically ineligible for the program participate at much lower rates. The same
pattern holds in 8th
grade suggesting that the supplementary reading course is widely used in 6th
grade, but used more selectively and more in line with the policy in the subsequent years. As I
detail below, the result of these patterns of participation is that there is not much difference in the
overall rates of participation in 6th
grade as a function of formal eligibility.
Patterns of participation in the supplemental reading program were jointly determined by
families as well as district officials. Students and families had flexibility to override the policy
and enroll or not enroll in supplemental reading as they saw fit. Likewise, the district
intentionally reevaluated the need for students to persist in the supplemental reading class based
on their middle school performance, though there was not formulaic way in which this was
operationalized. To understand whether attrition from the treatment from 6th
to 7th
grade was
related to a student’s end-of-year reading test results I fit a model that used treatment exposure in
7th
and 8th
grade, respectively, as the outcomes, as a function of prior participation in
supplemental reading, end-of-year reading test scores, demographic characteristics, and fixed
effects for school and cohort. I find that a positive one standard deviation difference on the 6th

18
grade state reading examination is associated with a five percentage point reduction in the total
amount of time that a student spends in supplemental reading in 7th
grade, with a slightly larger
reduction in the probability for Black students. Analogously, I find that a positive one standard
deviation difference in 7th
-grade reading test performance is associated with a one percentage
point difference in the total participation in supplemental reading in 8th
grade. I interpret these
findings to suggesting that attrition from the treatment was to some degree a function of test
performance, but that other factors must account for this selective attrition from treatment,
particularly in the first year. Though this selection out of treatment is potentially endogenous,
using a continuous measure, rather than a binary measure, of treatment exposure is gives a better
estimate of policy impact and may be less susceptible to violations of the exclusion restriction
(Angrist & Imbens, 1995).4
4.2 Reduced-form results
In Table 3 I present my reduced-form estimates of the effect of supplementary reading
exposure on subsequent student test scores fit using my entire sample of students. To fit the
reduced-form models, I regressed the outcome on the forcing variable, 5th
-grade ITBS scores, the
measure of exposure to supplementary reading and fixed-effects for cohort and school. I include
the reduced-form estimates for my outcomes of interest, standardized reading and mathematics
scores in 6th
through 8th
grades, as well as the scaled score on the 8th
-grade ITBS. In the rows of
Table 3 I report my reduced-form estimates across several choices of bandwidth. Most
specifications do not include demographic control variables, though I add them for the
bandwidth of 10 which is my preferred specification. My reduced-form estimates suggest that
there are small positive effects of being just eligible to participate in supplemental reading in
4 I find similar results in terms of sign and statistical significance when using a binary measure of exposure to
treatment, however I do not present those results here given that they are less policy relevant.

19
mathematics test scores compared to those who just miss being eligible. Specifically, students
who are just eligible score, on average about five-hundredths of a standard deviation higher on
subsequent tests of their mathematics skills.
The demographic makeup of Hampton County schools is such that Black and white
students constitute similarly large portions (44 and 33 percent respectively) of the total student
population. To explore the possible differences in the impact of eligibility for the reading course
by race I introduce Table 4. In Table 4 I display my estimates of the impact of eligibility on two
groups of students; white, Latino, and Asian students, and then separately for Black students. I
also go one step further to estimate whether the effects on Black students differ based on whether
they are in schools with more than 50 percent enrollment of Black students (a coarse measure of
racial segregation). Exploring these disaggregated results exposes important and policy-relevant
heterogeneity in the impact of this literacy intervention.
In Table 4 each row corresponds to one of the subgroups for which I have estimated the
reduced-form effects. My estimates suggest that scoring just below the cutoff for eligibility for
the supplementary reading program has a negative impact on all measures of subsequent reading
performance for Black students relative to students who just missed being eligible. For instance,
I interpret the statistically-significant coefficient of -0.143 in row four of column (2) to mean
that, on average, Black students who are just eligible to participate in supplemental reading score
about 0.14 SD lower on the 7th
-grade reading assessment than similar students who just missed
being eligible. This negative effect is comparable to moving from the 60th
percentile of the
national distribution of reading performance to the 54th
percentile. The ITT impact on the 8th
-
grade ITBS score is equivalent to moving only from the 60th
to the 58th
percentile. Conversely,
on average, white, Latino, and Asian students who were just eligible for supplemental reading

20
appear to perform better relative to those who just missed being eligible on subsequent measures
of reading and mathematics, though not all estimates are statistically different than zero.
Interestingly, the negative impact that I estimate for Black students who are just eligible for
supplemental reading suggests that these students are negatively affected whether they are in
majority Black or majority white schools, though the negative impacts appear to be larger and
more precisely estimated for students in schools that enroll a majority of white students.
Importantly, in schools that enroll a majority of black students there are not many students who
score above the 60th
percentile on the ITBS. As a result, these estimates are particularly
imprecise for Black students in schools that are majority Black since there is less variation in the
eligibility indicator, despite the larger sample size relative to majority white schools.
My reduced-form estimates constitute the intent-to-treat (ITT) estimates of the offer of
eligibility for supplementary reading. If take up of the supplementary reading program was
perfectly predicted by eligibility for the program these estimates would be the estimates of
greatest policy interest, since they apply to the whole distribution of reading ability. However,
because take-up of the treatment, conditional on eligibility, is not perfect I contrast my ITT
estimates with the instrumental-variable estimates from my regression-discontinuity analysis
below, and emphasize in the discussion the implications this has for research and practice. These
IV estimates constitute the treatment-on-the-treated (TOT) effects of supplementary reading, for
students who are just eligible for supplemental reading and who participate, relative to those who
just miss being eligible and who do not participate. These TOT effects are of arguably larger
importance in answering the question of whether those who experienced the treatment actually
benefited from it.
4.3 First-stage Results

21
Both theory and the results of my reduced-form analyses suggest that the impact of this
literacy intervention likely differ by student race, particularly given the large white and Black
enrollments in Hampton County. In estimating my first-stage results I model the effect of the
eligibility for supplemental reading on take-up for all students as well as the same racial and
enrollment subgroups that I articulate above. In Figure 2 I show the impact of eligibility on take
up for all students in each of their three years of enrollment in middle schools. In Panel (A) I
illustrate differences in take up for all students in 6th
grade, while in Panels (B) and (C) I
illustrate the discontinuity in take up as a function of eligibility in grades 7 and 8 respectively. In
all three grades the difference in take up as a function of the offer of eligibility for students on
the margin of receiving that offer is not very large.
I corroborate this graphical evidence with fitted models (following equation (1), above)
in Table 5. The columns in Table 5 represent the three years of middle-school enrollment while
the rows include estimates of the effect of eligibility on enrollment for different choices of
bandwidth. Except where noted explicitly, these estimates are from models specified without
control variables. My results suggest that my instrument is weak in 6th
grade, but relatively
strong in both 7th
and 8th
grades. In my preferred specification of a bandwidth of 10 percentile
points the F statistic on my instrument in 6th
grade is just less than three, compared to a value of
10 which is commonly regarded as the minimum threshold for a single instrument to be
sufficiently strong (Stock, Wright, & Yogo, 2002). However, in 7th
and 8th
grades my instrument
is quite strong with F statistics that exceed the threshold of ten. In fact, in 7th
and 8th
grades
students who are just eligible to participate in supplemental reading in middle school spend
between 10 and 15% more of their total semesters of middle school in supplemental reading than
their peers who just miss being eligible. These results are robust to choice of bandwidth.

22
To explore heterogeneity in take up by race I first turn to Figure 3 where I illustrate
differences in take up in 7th
grade only. In Panel (A) of Figure 3, I show the first-stage
graphically for white, Latino, and Asian students, Panel (B) demonstrates take up for Black
students regardless of school enrollment, and Panels (C) and (D) examine take up by Black
students in majority white and majority Black schools, respectively. These four panels illustrate
that take up of the intervention is stronger for white students than for Black students, but that this
is largely an artifact of differences between take up among Black students enrolled in majority
Black versus majority-white schools. In fact, Black students on the margin of eligibility in
majority-white schools actually take up treatment at higher rates than their peers who just miss
being eligible.
As with my aggregate first-stage analysis, I also fit equation (1) for my racial subgroups.
In Table 6 I present my estimates of the impact of being just eligible for supplemental reading on
subsequent take up by grade in middle school. As is the case in my aggregate analyses my first-
stage instrument is weak in 6th
grade but considerably stronger in grades 7 and 8. Importantly,
my first-stage estimates for Black students are weaker in part because the instrument appears to
function differently in schools with different racial composition. Specifically, schools with a
majority of black students are generally less responsive to the instrument, regardless of grade,
whereas Black students enrolled in schools that have a majority of white students are much more
sensitive. Consequently, in my estimates of the treatment on the treated, I focus on the effects of
participating in supplemental reading by race, but do not continue to subdivide the analyses by
racial composition of the school.
4.4 TOT Estimates of Supplementary Reading

23
I find that spending a greater percentage of middle-school in supplemental reading has
differential effects by grade and by racial subgroup. Specifically, though I find no overall effect
on students, I find persistently negative effects of exposure to reading for Black students, and
only imprecise and suggestive evidence of positive effects for white, Latino, and Asian students.
As expected, the weak instrument in 6th
grade yields only very noisy estimates of the effect of
participating in supplementary reading on 6th
-grade test scores however the strength of the
instrument in 7th
and 8th
grades does allow for much better precision. .
In column (2) of Table 7 the coefficient of -2.277 in the fourth row of column (2)
suggests that for Black 7th
graders, participating in supplemental reading for 100 percent of their
semesters (or 4 by the end of 7th
grade) decreases student’s 7th
-grade state reading test scores by
over two standard deviations. The magnitude of this IV estimate may be deceptively large for
two reasons. First, though I have a strong instrument the discontinuity in participation in
supplementary reading for students on the margin of eligibility in 7th
grade is only about 10
percentage points. This means that the students who are just eligible to participate in
supplemental reading only spend about 10 percentage points more time in the course by the end
of 7th
grade than their peers who just missed being eligible. Thinking about this in reference to
Table 2 this means that while those who are not technically eligible spent about 50 percent of
their time enrolled in supplemental reading, while those who were just eligible spent about 60
percent of their enrolled time in the class. The second reason my IV estimates are so large is a
function of how I defined treatment. The IV estimate represents the effect of a one-unit change in
enrollment on subsequent test scores, but my enrollment variable is measured as a percentage
from zero to one. As a result, to estimate the effect of a difference in participation of 10
percentage points I have to sale my IV estimate down by dividing by ten. The results are still

24
impressive. A Black student who spends 10 percentage points more time in supplemental reading
is likely to score 0.23 standard deviations lower on their 7th
grade reading test than a similar
student who just missed being eligible and did not participate.
My estimates of the negative impact of participating in supplemental reading for Black
students extend to 8th
-grade reading test outcomes as well, though they appear not to impact
mathematics outcomes. The negative effect of participating in supplemental reading on the 8th
-
grade state reading test is similar to that in 7th
grade, while the ITBS reading score for Black
students is marginally significant (p=0.105) and suggests that students who participate fully in
the intervention through 8th
grade score 3/5 of a standard deviation lower on the ITBS in 8th
grade than similar students who do not participate at all. This is tantamount to moving from the
60th
national percentile to the 37th
. My estimates for white, Latino, and Asian students (as a
single group) are suggestive and border on marginal significance. Like my estimates of the
effects of participation on Black students my point estimates are consistently signed and of large
enough magnitude to be noteworthy if I could achieve better statistical precision.
5. Discussion:
5.1 Threats to Validity
There are several potential threats to the validity of my findings, some of which are
methodological, and others that are related to program implementation. The chief
methodological threats to the validity of my findings are that they may be sensitive to my choice
of bandwidth, and that a linear specification of the relationship between the forcing variable and
my outcomes may not be appropriate. My analyses could also be threatened by attrition from the
treatment group over time. I consider each of these threats below, beginning with the
methodological threats.

25
In Table 8, I display the results of fitting reduced-form models in my preferred bandwidth
of 10 percentile points using several non-linear specifications of the forcing variable. The rows
are organized according to the maximum degree of the polynomial specification of the forcing
variable, while the columns are organized by outcome by racial subgroup. For instance, the first
three columns pertain to the multiple specifications for three outcomes for Black students, while
columns four through six contain the analogous estimates for white, Latino, and Asian students.
My point estimates suggest that my results are robust to non-linear specification regardless of
racial group or outcome. Though my point estimates fluctuate somewhat, the sign and
significance of the estimates is generally preserved.
A substantive threat to the validity of my findings concerns the attrition of students from
the pool of students initially tested in 5th
grade across the effective treatment and control groups.
Among the 6,219 students who fall within my analytic window, and who were tested on the
ITBS in 5th
grade, 4,758 remain in my final analytic sample of students who are tested in each of
their 6th
, 7th
, and 8th
-grade years in middle school. Of the roughly 1,500 students who leave the
sample, these represent 25 percent of those not eligible for supplementary reading and 21 percent
of those who were eligible based on their 5th
-grade test score. In this instance, the rate of attrition
is somewhat higher among the control group. While differential attrition may be a potential
source of bias, the fact that the covariate balance on either side of the eligibility cutoff is strong
suggests that this differential attrition is likely not having a meaningful impact on my analyses.
I analyze my sample attrition in a manner consistent with the evidence standards for
regression-discontinuity designs established by the What Works Clearninghouse (WWC)
(Schochet, Cook, Deke, Imbens, Lockwood, Porter, & Smith, 2010). My analyses focus on both
analytical samples; those cohorts of students who are observed between 5th
and 8th
grade and

26
those observed in 5th
and 6th
grade. For the purposes of analyzing attrition, I define the students
who scored within ten points of the cutoff score on the ITBS-Reading in 5th
grade as the focal
group.
5.2 Interpreting Findings
My findings have several implications, both clear and suggestive, for how Hampton
County and other districts could consider using their supplementary reading programs in the
future. The clearest finding in my study is that the impact of the program is strongly negative for
Black students, while suggestively positive for white, Latino, and Asian students. Of particular
interest is that the reduced-form effects suggest that the mere labeling of students as falling
below a normative level of performance can impact their subsequent cognitive outcomes. I
consider possible interpretations and policy implications for my findings below.
For Black students the negative effect of eligibility and participation appears to get larger
(but is certainly at least stable) over time, whereas the positive effects for white students appear
to fade out from 7th
to 8th
grades (my points estimates are roughly half the size and no longer
significant). Though some of this fadeout may be a statistical artifact of increasing variance in
knowledge across years (Cascio and Staiger, 2012), there are likely substantive reasons that this
fadeout seems apparent. On plausible hypothesis is that, since state reading and mathematics test
scores are used for grade promotion in 8th
grade, but not 6th
or 7th
, students in the treatment group
may work harder to generate higher scores under these high-stakes conditions. The incentives
should not differ for Black students and all others, and I explore other hypotheses for why these
differences may persist in 8th
grade below. One important message from my results is that the
divergence between Black students and their white, Latino, and Asian counterparts is consistent
across the three years of assessments. The recent work by Cascio and Staiger (2012) suggests

27
that even if the magnitude of differences in achievement by race appear identical these
differences are likely larger at higher grade levels.
One reason that I might observe negative policy impacts of a literacy intervention is
related to receiving a negative label as the result of falling below the specified cutpoint. The
potential negative effect of receiving a negative label or signal from a test score is certainly
consistent with work by Papay, Murnane, and Willett (2011), who found that just failing a low-
stakes state standardized test in 8th
grade was associated with a lower probability of investing in
post-secondary education relative to students who had just passed that test. In this case all
students who score below the ITBS cutoff in 5th
grade receive this negative label, but only Black
students appear to be negatively affected. This fact is also consistent with Papay, Murnane, and
Willett’s (2011) findings in that they found that the receipt of the negative label affected lower-
income students to a larger degree than higher-income students. These findings are consistent
with earlier work that student’s perceptions of their own ability can impact their later academic
performance (Shen & Pedulla, 2000).
The negative shock to student’s self-perception by being just eligible may not be
sufficient to explain the differential effects of supplemental reading eligibility and participation
by racial groups. In fact, the differential and negative impact on Black students may be the result
of stereotype threat (Aronson & Steele, 2005). Many studies have established and replicated that
being primed negatively with information that is consistent with negative group stereotypes can
lead to lower performance. In this setting, it may be that scoring below the 60th
percentile in 5th
grade leads to the invitation to participate in supplemental reading in middle school which may
itself be a form of negative priming.

28
Another plausible hypothesis for my observed effects is that racial-homogenous
groupings in supplementary reading classes could also produce differential impact by race. We
might expect that if supplemental reading classes are grouped homogenously by race, or if Black
students are overrepresented among the students in these classes the same sort of negative
priming may be possible. Using the data available to me (I am not able to look at specific
classroom characteristics), within a school the racial composition of students who enroll in
supplemental reading appear to be consistent with the overall racial composition of that school.
This fact, coupled with the knowledge from Table 2 that Black students participate in
supplemental reading at rates similar to those among white, Latino, and Asian students, suggests
that it is unlikely that the negative impact of the supplemental reading course is coming through
racially segregated classes.
The negative impact on Black students is of potential concern, not only related to the
immediate outcomes, but also with respect to longer-term outcomes. Work related to creating
early-warning indicator systems to reduce school dropout have found that poor performance on
middle-grades test scores may not increase the risk of school dropout (Balfanz & Boccanfuso,
2007; Balfanz, Herzog, & MacIver, 2007). However, this same work has found that failing a
mathematics or ELA course in 6th
grade is a strong predictor of failing to complete high school
within five years of starting. I argue that the negative signal received by being just eligible for
supplementary reading in Hampton County may be comparable to the negative signal that
students receive by failing a course. This assertion is consistent with the findings of Papay,
Murnane, and Willett (2011), and it seems reasonable that students could interpret a negative
signal that relays a particular message - falling below some established bar of performance - in a
way that would not be conveyed through a continuous test score. The strong negative impact of

29
supplemental reading eligibility and participation for Black students on their 8th
-grade ITBS
reading scores, coupled with the fact that the 8th
-grade state reading test is linked to grade
retention, suggests that there could be additional negative impacts for Black students.
Any concern that these apparent effects might raise with regard to whether they are
limited only to the state-required accountability tests is allayed by the impacts evident on the
ITBS reading test in 8th
grade. While the possibility of coaching to tests, or “score inflation” is a
phenomenon noted in other scholarly work (Hamilton & Koretz, 2002; Jennings & Bearak, 2010;
Koretz, 2003, 2005), the consistency of my findings (both positive and negative effects) across
test types is evidence against a hypothesis that the results are not indicative of learning (or
learning loss) in general. In addition, the fact that the positive impact for white, Latino, and
Asian students extend to mathematics appears to be consistent with the findings of Goodman and
Cortes (2012), who find that the effects of additional mathematics instruction are larger for
stronger readers. In this case, I hypothesize that the supplemental reading program improved
reading skills in a manner that generalized to performance on the state test in mathematics,
perhaps through improved skills with respect to open-ended or constructed-response questions.
As with all studies that utilize a regression-discontinuity design, a limitation on the
interpretability of my findings is posed by their external validity. By construction, the effects I
estimated in my study apply only to those students who were just below the cutoff and eligible
for the treatment, in comparison to those who were just above and not eligible. This is a
limitation of all studies that employ a regression-discontinuity design, but is noteworthy
particularly since many policymakers would like to know how literacy interventions can impact
the performance of students who are very low performing. In this instance, the margin of
analysis is the 60th
percentile nationally, however this corresponds to the 40th
percentile of

30
performance in the Hampton County school district. While these students may not be the lowest
performers, they are on a margin whose proficiency on tests used for NCLB accountability may
be affected and who may be in danger of not graduating from high school. This is particularly
true since Georgia uses the state tests in reading and mathematics in 8th
grade to make grade
promotion decisions. Not being able to generalize away from the cutoff is less concerning given
this margin of interest since the district has other programs for addressing the needs of lower
performers and has arguably less need to intervene with higher performers.
5.3 Policy Considerations and Alternatives
The results of my study do not make it clear whether alternatives to teaching
supplementary reading courses are likely to yield more favorable results. For instance, if the
labeling or stereotype threat hypothesis for the differential effects by race is true, it is not clear
that using another proven program would yield better results. In addition, a review of the
evidence provided through the What Works Clearinghouse (WWC) revealed that of the ten
experimental or quasi-experimental programs reviewed that promote effective adolescent literacy
interventions, six of them are copyrighted or registered trademarks, and one other is available
through a major educational publishing company (WWC, 2012, see also Rouse & Krueger,
2004). The availability of off-the-shelf, proven products may be enticing, particularly for schools
operating within a tier of the school-improvement cycle, however it is not clear whether the net
cost of changing approaches is likely to yield different results. One area worth pursuing further
(though it was not possible in my data), is to explore whether students are grouped in
supplemental coursework by ability, and whether groups of lower ability are staffed with
teachers who have achieved lower value-added in the past. Though exploring such mechanisms
cannot provide causal evidence, it may provide effective insights for local policymakers and is

31
certainly prudent to explore before undertaking expensive (in resources, time, and political
capital) curricular or programmatic reforms.
Student self-perception and feelings of efficacy are quite malleable in middle school
(Gillet, Vallerand, & Lafreniere, 2012) and it is imperative that schools work to ensure that their
students don’t suffer serious setbacks in this area based on school policies. One option that
Hampton County and other districts might consider is making supplemental reading a required
course for all students in 6th
grade. If this transition from elementary to middle school is
particularly crucial (as research suggests) delaying the onset of this reading intervention might
diminish the harm of being labeled concurrent with making this transition. Though my
hypothesis is speculative, the assertion is testable, and may prove a reasonable experiment on the
way to reforming current practice. Sufficient evidence exists to suggest that student’s perceptions
and experiences with their school characteristics and environment impact their subsequent
engagement and academic performance (Wang & Holcombe, 2010). As a result it would be
optimal to provide supports for their feelings of efficacy during middle school, particularly if any
performance-related identification could negatively impact these feelings.
Districts considering policies similar to the one employed in Hampton County should
take seriously the limitations on performing an impact evaluation on a discontinuity-based policy
that allows for such agency among students and families. While it may be good political and
educational practice to allow for exceptions from the rule, permitting unrestrained exceptions
may create asymmetries in the profiles of the compliers. For instance, I find that the instrument
for participation in supplemental reading – being eligible – is a strong instrument for Black
students in majority-white schools, but not so in majority-Black schools. Though strong
inferences cannot be made from this observation, it is worth exploring (and certainly considering

32
for future policies) whether populations of students or families that may already feel
marginalized may be more or less likely to exercise agency in response to school-based policy.
5.4 Conclusion
In an era of high-stakes testing and school accountability, schools care as much now as at
any time in the past about improving the literacy skills of their students. For the students, there is
nothing more important to their long-term success than their ability to participate in their lives,
and the economy, as fully-literate individuals and as high-school graduates. My findings suggest
that a research-based supplementary reading course in middle school can have differential effects
by race on short-term measures of student’s reading comprehension, and measures of
mathematics knowledge. These findings are concerning in that it appears that Black students and
their white, Latino, and Asian counterparts received access to similar interventions and yet, even
controlling for school of enrollment and graduation cohort these disparities persisted. Even if the
impact of the course is limited to those students who were just below the cutoff used for
assigning students to the course, there is still reason to be concerned and to pursue additional
understanding of what experiences and processes might be driving these differential results.
My work with Hampton County also underscores the potential value of adopting
assignment rules when deciding who to assign to support courses, however it also highlights
some associated challenges, particularly around rule compliance (Schlotter, Schwerdt,
&Woessmann, 2011). Such rules allow for the estimation of causal estimates and can reduce the
continuation of ineffective programs, and help districts, modify, develop or switch to
interventions that have been proven to be effective.
Choosing cutoff scores to assign students to academic interventions is not without risk,
however, and the determination of whether and where to apply these rules warrants careful

33
consideration. Though there are clear merits to the ability to assess the effectiveness of
interventions that are deployed in a way that allows quasi-experimental evaluation, the potential
for rationing of inputs could have deleterious effects. Cutoff scores must be chosen, and
interventions designed, in such a way as to be consistent with the needs of the population it is
intended to impact. In HCPS, all students scoring below the 60th
percentile were eligible for
supplementary reading, however this evaluation only addresses the impact of those who were
eligible but near the cutoff. Other means of evaluation, and perhaps interventions tailored to
learners who scored in lower percentiles, is necessary if we are to achieve equitable outcomes in
education. It bears further note that simply because a program is impactful on one margin, it need
not necessarily maintain its impact when extended to students on other margins and of different
abilities.
School and district officials may find it valuable to use my results to impact their own
decisions about policy and practice. As schools and districts make decisions about how to
allocate funding for literacy programs, they may find it advantageous to develop and deploy
extended instruction time in literacy in ways that resembles the structure used in HCPS with
careful attention paid to how to avoid the adverse impacts experienced by Black students in
HCPS. This delivery method is appealing for several reasons, though my results underscore
some potential caveats. First, there is a well-defined literature about what practices are effective
in literacy instruction, and the HCPS example provides a concrete example of how this may be
done. Second, deploying the intervention using district employees allows for flexibility in
scheduling teachers and classes within and across schools and school years. Third, the extended
learning time approach is likely to have strong face validity among stakeholders in the
community. Most groups will find it hard to argue with the idea of using research-proven

34
instruction to supplement traditional curricula, as a way to bolster literacy skills. However, such
policies are all subject to the potential for unintended harm. If students feel stigmatized by being
identified as a weak reader, or if they receive systematically different services or experiences,
this approach to improving educational outcomes can be extremely flawed and, at a minimum,
would require additional features. It is difficult to make an ultimate determination of whether the
costs to some outweigh the benefits to others when deciding whether to adopt or eliminate a
program like the one in Hampton County. District officials will do well to understand the
particular needs of their students and continuously monitor and adjust to the impacts of a
program on their students as those impacts become evident.
Further research into literacy interventions like the one in HCPS is certainly warranted.
Since our ultimate concern is with long-term outcomes that we believe are associated with
measures of adolescent literacy, future research should collect data across more years so that we
may learn whether there are longer-term impacts on SAT scores, high school graduation, or
decisions to apply to or attend college. Establishing the effectiveness of similar supplementary
literacy coursework should be pursued in other research contexts as well. While the HCPS
context is representative of many large changing suburban districts, there may be factors
associated with HCPS that could limit the generalizability of my findings.

35
References
Abdulkadiroglu, A., Angrist, J., Dynarski,S., Kane, T., & Pathak, P. (2009). Accountability and
Flexibility in Public Schools: Evidence from Boston’s Charters and Pilots. NBER Working
Paper 15549, http://www.nber.org.ezp-prod1.hul.harvard.edu/papers/w15549
Angrist, J. & Imbens, G. (1995). Two-stage least squares estimation of average causal effects in
models with variable treatment intensity. Journal of the American Statistical Association,
90(430), 431-442
Aronson, J. and Steele, C. (2005). “Stereotypes and the fragility of academic competence,
motivation, and self-concept.” In A.J. Elliot and C.S. Dweck, eds., Handbook of
competence and motivation. New York: Guilford Press.
Card, D., & Lee, D.S. (2008). Regression discontinuity inference with specification error.
Journal of Econometrics, 142(2), 655-674.
Cavanagh, S. (2006). Students Double-Dosing on Reading and Math. Education Week, 25(40), 1.
Chall, J. S., & Jacobs, V. A. (2003). Poor Children's Fourth-Grade Slump. American Educator,
27(1), 14-15,44. Retrieved from EBSCOhost.
Chamberlain, A., Daniels, C., Madden, N. A., & Slavin, R. E. (2007). A Randomized Evaluation
of the Success for All Middle School Reading Program. Middle Grades Research Journal,
2(1), 1-21. Retrieved from EBSCOhost.
Christie, K. (2007). Mission possible: States take on adolescent literacy. Phi Delta Kappan,
88(6), 421-422.
Darling-Hammond, L. (2004). Standards, accountability, and school reform. Teachers College
Record, 106, 1047–1085.
Dee, T. (2004). Are there civic returns to education? Journal of Public Economics, 88(9-10),
1697-1720.
Dole, J. A., Duffy, G. G., & Roehler, L. (1991). Moving from the old to the new: research on
reading comprehension instruction. Review of Educational Research, 61239-264. Retrieved
from EBSCOhost
Durham Public Schools (n.d). Key education improvement efforts underway: Double dose
literacy. Retrieved from http://www.dpsnc.net/about-dps/key-education-improvement-
efforts-under-way-in-dps/double-dose-literacy
Edmonds, M., Vaughn, S., Wexler, J., Reutebuch, C., Cable, Klinger Tackett, K., & Schnakenberg, J. (2009). A Synthesis of reading interventions and effects on reading comprehension outcomes for older struggling readers. Review of Educational Research,
79(1), 262-300.

36
Gamse, B.C., Bloom, H.S., Kemple, J.J., Jacob, R.T., (2008). Reading
First Impact Study: Interim Report (NCEE 2008-4016). Washington, DC: National Center
for Education Evaluation and Regional Assistance, Institute of Education Sciences, U.S.
Department of Education.
Gillet, N., Vallerand, R. J., & Lafreniere, M. K. (2012). Intrinsic and extrinsic school motivation
as a function of age: The mediating role of autonomy support. Social Psychology of
Education: An International Journal, 15(1), 77-95.
Goodman (unpublished). Flaking Out: Snowfall, Disruptions of Instructional Time, and Student
Achievement
Graham, S., & Hebert, M. (2012). A Meta-Analysis of the Impact of Writing and Writing
Instruction on Reading. Harvard Educational Review, 81(4), 710-744.
Hamilton, L. S., and Koretz, D. (2002). About tests and their use in test-based accountability
systems. In L. S. Hamilton, B. M. Stecher, and S. P. Klein (Eds.), Making Sense of Test-
Based Accountability in Education. Santa Monica: RAND (MR-1554-EDU).
Hong, G., & Raudenbush, S. W. (2007). Evaluating kindergarten retention policy: A
case study of causal inference for multilevel observational data. Journal of the American
Statistical Association, 101(475), 901–910.
Imbens, G. & Kalyanaraman, K. (2012). Optimal bandwidth choice for the regression
discontinuity estimator. Review of Economic Studies, 79(3), 933-959.
Imbens, G., & Lemieux, T. (2008). Regression discontinuity designs: A guide to practice.
Journal of Econometrics, 142(2), 615–635.
Imbens, G., & Rubin, D. (1997). Estimating Outcome Distributions for Compliers in
Instrumental Variables Models. Review of Economic Studies, 64, 555-574.
Jacob, B. & Lefgren, L. (2004). “Remedial Education and Student Achievement: A Regression-
Discontinuity Analysis." Review of Economics and Statistics, 86(1), 226-244.
Jennings, J., & Bearak, J. (2010). “State Test Predictability and Teaching to the Test: Evidence
from Three States,” Delivered at the Annual Conference of the American Sociological
Association.
Kemple, J., Herlihy, C., Smith, T. (2005). Making Progress Toward Graduation: Evidence from
the Talent Development High School Model. Manpower Demonstration Research Corp.,
N. Y.
Koretz, D. (2003). Using multiple measures to address perverse incentives and score inflation.
Educational Measurement: Issues and Practice 22(2), 18-26.

37
Koretz, D. (2005). Alignment, high stakes, and the inflation of test scores. In J. Herman and E.
Haertel (Eds.), Uses and misuses of data in accountability testing. Yearbook of the National
Society for the Study of Education, vol. 104, Part 2, 99-118. Malden, MA: Blackwell
Publishing.
Lee, D., & Lemieux, T. (2009). Regression Discontinuity Designs in Economics. NBER Working
Paper 14723, http://www.nber.org/papers/w14723
Lee, J. J., Grigg, W. W., Donahue, P. P., & National Center for Education Statistics (ED), W. C.
(2007).The Nation's Report Card[TM]: Reading 2007. National Assessment of
Educational Progress at Grades 4 and 8. NCES 2007-496. National Center for Education
Statistics, Retrieved from EBSCOhost.
Machin, S., & McNally, S. (2008). The literacy hour. Journal of Public Economics, 92(5/6),
1441-1462. doi:10.1016/j.jpubeco.2007.11.008
Mazzolini, B., & Morley, S. (2006). A Double-Dose of Reading Class at the Middle and High
School Levels. Illinois Reading Council Journal, 34(3), 9-25.
McCrary, J. (2008). Manipulation of the running variable in the regression discontinuity design:
A density test. Journal of Econometrics, 142(2), 698-714.
McLaughlin, M. W., Shepard, L. A., (1995). Improving Education through Standards-Based
Reform. A Report by the National Academy of Education Panel on Standards-Based
Education Reform.
Moje, E. B. (2008). Foregrounding the disciplines in secondary literacy teaching and learning: A
call for change. Journal of Adolescent & Adult Literacy, 52(2), 96-107.
Murnane, R. & Willett, J. (2011). Methods Matter. New York, NY: Oxford University Press.
National Institute of Child Health and Human Development. (2000). Report of the National
Reading Panel. Teaching children to read: An evidence-based assessment of the scientific
research literature on reading and its implications for reading instruction (NIH Publication
No 00-4769 and 00-4754). Washington, DC: U.S. Government Printing Office.
Neal, D., Schanzenbach, D., & Urban, I. (2009). Left behind by Design: Proficiency Counts and
Test-Based Accountability. Working Paper. Urban Institute, Retrieved from ERIC database.
Nomi, T., & Allensworth, E. (2009). "Double-Dose" Algebra as an Alternative Strategy to
Remediation: Effects on Students' Academic Outcomes. Journal of Research on
Educational Effectiveness, 2(2), 111-148. Retrieved from EBSCOhost.
No Child Left Behind Act of 2001.

38
Paglin, C. (2003). Double Dose: Bethel School District's Intensive Reading Program Adds
Beefed-Up Instruction for At-Risk Readers from Day One. Northwest Education, 8(3), 30-
35.
Porche, M. V., Ross, S. J., & Snow, C. E. (2004). From preschool to middle school: The role of
masculinity in low-income urban adolescent boys' literacy skills and academic achievement.
In N. Way, J. Y. Chu, N. Way & J. Y. Chu (Eds.), Adolescent boys: Exploring diverse
cultures of boyhood. (pp. 338-360). New York, NY US: New York University Press.
Rouse, C. E., & Krueger, A. B. (2004). Putting computerized instruction to the test: A
randomized evaluation of a “scientifically based” reading program. Economics of Education
Review, 23(4), 323–338.
Schochet, P., Cook, T., Deke, J., Imbens, G., Lockwood, J.R., Porter, J., Smith, J. (2010).
Standards for Regression Discontinuity Designs. Retrieved from What Works Clearinghouse
website: http://ies.ed.gov/ncee/wwc/pdf/wwc_rd.pdf.
Schlotter, M., Schwerdt, G., & Woessmann, L. (2011). Econometric methods for causal
evaluation of education policies and practices: a non-technical guide. Education Economics,
19(2), 109-137. doi:10.1080/09645292.2010.511821
Shen, C. & Pedulla, J.J. (2000). The relationship between students’ achievement and their
selfperception of competence and rigour of mathematics and science: a cross-national
analysis. Assessment in Education, 7(2), 237-253.
Sims, D. (2008). Strategic Responses to School Accountability Measures: It's All in the
Timing. Economics of Education Review,27(1), 58-68. Retrieved from ERIC database.
Snow, C. E., Porche, M. V., Tabors, P. O., & Harris, S. R. (2007). Is literacy enough? pathways
to academic success for adolescents. Baltimore, MD US: Paul H Brookes Publishing.
Stock, J., Wright, J., & Yogo, M. (2002). A survey of weak instruments and weak identification
in generalized method of moments. Journal of Business and Economic Statistics, 20(4),
518-529.
Tatum, A. W. (2008). Toward a More Anatomically Complete Model of Literacy Instruction: A
Focus on African American Male Adolescents and Texts. Harvard Educational Review,
78(1), 155-180. Retrieved from EBSCOhost
Vaughn, S., Klingner, J., Swanson, E., Boardman, A., Roberts, G., Mohammed, S., Stillman-
Spisak, S. (2011). Efficacy of collaborative strategic reading with middle school students.
American Education Research Journal, 48(4), 938-964.
Wang, M., & Holcombe, R. (2010). Adolescents' perceptions of school environment,

39
engagement, and academic achievement in middle school. American Educational
Research Journal, 47(3), 633-662.
Wanzek, J., & Vaughn, S. (2008). Response to Varying Amounts of Time in Reading
Intervention for Students With Low Response to Intervention. Journal Of Learning
Disabilities, 41(2), 126-142.
What Works Clearninghouse, (n.d.)
http://ies.ed.gov/ncee/wwc/FindWhatWorks.aspx?o=6&n=Reading%2fWriting&r=1

40
Tables & Figures
Table 1. Estimated differences in covariate balance at the cutoff for eligibility for supplementary reading.
(1) (2) (3) (4) (5) (6) (7) (8) (9) (10)
Female Black Asian Latino
Other
race ELL FRPL SWD
5th grade
math
5th grade
reading
IK bandwidth -0.101 0.046 0.129*** -0.123*** 0.053*** 0.090*** 0.153** 0.018** -0.102 0
(0.094) (0.055) (0.024) (0.000) (0.007) (0.000) (0.053) (0.006) (0.083) (0.001)
N 804 804 804 804 804 440 804 804 867 802
Bandwidth = 5 -0.022 0.088 0.026 -0.043** 0.014 0.016 0.073 -0.023 -0.092 -0.035
(0.077) (0.059) (0.027) (0.017) (0.013) (0.020) (0.056) (0.022) (0.071) (0.020)
N 1,160 1,160 1,160 1,160 1,160 1,160 1,160 1,160 1,160 1,158
Bandwidth = 10 -0.011 0.029 0 -0.013 -0.002 0.006 0.02 -0.055** -0.042 -0.016
(0.029) (0.039) (0.024) (0.021) (0.010) (0.013) (0.035) (0.021) (0.042) (0.011)
N 2,576 2,576 2,576 2,576 2,576 2,576 2,576 2,576 2,576 2,574
Bandwidth = 20 -0.001 0.015 -0.003 -0.004 -0.006 -0.003 0.012 -0.041** -0.014 0.017
(0.024) (0.028) (0.020) (0.018) (0.007) (0.011) (0.035) (0.019) (0.034) (0.019)
N 5,399 5,399 5,399 5,399 5,399 5,399 5,399 5,399 5,399 5,396
Mean at Threshold 0.584 0.403 0.013 0.143 0.013 0.104 0.416 0.143 -0.052 -0.056
Notes: Heteroskedasticity robust standard errors clustered by ITBS score are in parentheses (* p<.05 ** p<.01 *** p<.001). Each row shows
estimates for the difference in the group characteristic listed for students just below the cutoff for supplemental reading eligiblity when compared
to those just above the cutoff. The coefficients shown are generated by local linear regression using an edge kernel with the specified bandwidth.

41
Table 2. Share of total enrolled semesters spent in supplemental reading, separate by race, across grades in middle school for those
eligible and not eligible as defined by the cutoff rule.
Panel A: White, Latino, and Asian students
Panel B: Black students
6th grade 7th grade 8th grade
6th grade 7th grade 8th grade
Enrollment
Share Eligible Not Eligible Not Eligible Not
Eligible Not Eligible Not Eligible Not
0% 24.0% 43.4% 22.2% 42.1% 20.3% 40.6%
19.5% 32.4% 16.7% 30.2% 15.3% 28.8%
17% - - - - 0.7% 1.0%
- - - - 2.5% 3.7%
25% - - 0.8% 0.8% - -
- - 2.7% 3.4% - -
33% - - - - 23.5% 31.7%
- - - - 22.5% 27.3%
50% 1.5% 0.8% 26.2% 37.5% 1.7% 1.6%
4.2% 5.4% 29.5% 33.9% 3.2% 3.9%
67% - - - - 5.7% 7.0%
- - - - 8.1% 8.3%
75% - - 3.4% 1.7% - -
- - 5.3% 8.5% - -
83% - - - - 3.0% 1.5%
- - - - 4.7% 7.1%
100% 74.5% 55.8% 47.4% 17.9% 45.0% 16.6%
76.3% 62.2% 45.8% 23.9% 43.6% 21.0%
Total 757 881 757 881 757 881
528 410 528 410 528 410 Notes: Descriptive statistics are for students in the analytic sample and within nine percentile points of the 60
th percentile on the 5
th-grade ITBS
used to determine eligibility for supplementary reading in middle school. All percentages are total semesters enrolled in the intervention as
compared to total semesters enrolled in middle school by the end of the stated grade.

42
Table 3. Reduced Form Estimates
(1) (2) (3) (4) (5) (6) (7)
ELA Score
grade 6
ELA Score
grade 7
ELA Score
grade 8
ITBS Score
grade 8
Math Score
grade 6
Math Score
grade 7
Math Score
grade 8
IK Bandwidth -0.075 -0.029 -0.231*** -0.607 -0.093 -0.177*** -0.062***
(0.080) (0.083) (0.038) (0.690) (0.058) (0.007) (0.006)
N 804 867 804 1,979 867 867 867
Bandwidth = 5 0.069 0.099 -0.160*** -0.137 -0.004 -0.04 -0.009
(0.069) (0.072) (0.040) (1.200) (0.056) (0.031) (0.024)
N 1,160 1,160 1,160 1,160 1,160 1,160 1,160
Bandwidth = 10 0.011 0.028 -0.062 -0.289 0.006 0.015 -0.005
(0.045) (0.044) (0.039) (0.671) (0.032) (0.042) (0.022)
N 2,576 2,576 2,576 2,576 2,576 2,576 2,576
Bandwidth = 10, controls 0.037 0.047 -0.042 -0.003 0.054** 0.057 0.051*
(0.047) (0.056) (0.037) (1.092) (0.021) (0.038) (0.029)
N 2,576 2,576 2,576 2,576 2,576 2,576 2,576
Bandwidth = 20 0.039 0.035 -0.018 0.054 0.017 0.034 0.006
(0.033) (0.030) (0.042) (0.439) (0.024) (0.032) (0.020)
N 5,399 5,399 5,399 5,399 5,399 5,399 5,399
Notes: Heteroskedasticity robust standard errors clustered by ITBS score are in parentheses (* p<.05 ** p<.01 *** p<.001). Each row shows
reduced-form estimates of the impact of eligibility for supplementary reading on the outcome listed in a particular column. The coefficients shown
are generated by local linear regression using an edge kernel with the listed bandwidth. No additional controls are included except as indicated.
The models with controls condition on gender, race, LEP and disability status, prior mathscores, cohort and middle school fixed effects.

43
Table 4. Reduced Form Heterogeneity by Race and School Racial Composition
(1) (2) (3) (4) (5) (6) (7)
ELA Score
grade 6
ELA Score
grade 7
ELA Score
grade 8
ITBS Score
grade 8
Math Score
grade 6
Math Score
grade 7
Math Score
grade 8
All Students 0.037 0.047 -0.042 -0.003 0.054** 0.057 0.051*
(0.047) (0.056) (0.037) (1.092) (0.021) (0.038) (0.029)
N 2,576 2,576 2,576 2,576 2,576 2,576 2,576
Black students -0.058 -0.143** -0.204*** -2.729*** -0.068 -0.031 -0.048
(0.043) (0.065) (0.031) (0.726) (0.048) (0.030) (0.077)
N 938 938 938 938 938 938 938
White, Latino & Asian Students 0.100* 0.154** 0.06 1.675 0.114*** 0.115** 0.102***
(0.055) (0.071) (0.041) (1.308) (0.033) (0.048) (0.030)
N 1,638 1,638 1,638 1,638 1,638 1,638 1,638
Black students, Majority white -0.14 -0.214** -0.179** -3.100* 0.014 0.052 0.185**
(0.111) (0.100) (0.064) (1.530) (0.062) (0.094) (0.064)
N 283 283 283 283 283 283 283
Black students, Majority Black -0.013 -0.1 -0.185*** -2.427* -0.117* -0.052 -0.14
(0.042) (0.060) (0.030) (1.159) (0.055) (0.031) (0.088)
N 655 655 655 655 655 655 655
Notes: Heteroskedasticity robust standard errors clustered by ITBS score are in parentheses (* p<.05 ** p<.01 *** p<.001). Each row shows
reduced-form estimates of the impact of eligibility for supplementary reading on the outcome listed in a particular column. The coefficients shown
are generated by local linear regression using an edge kernel and a bandwidth of 10. All models include controls for gender, race, LEP and
disability status, prior mathscores, cohort and middle school fixed effects.

44
Table 5. First Stage Estimates by Grade of Enrollment
(1) (2) (3)
Grade 6 Grade 7 Grade 8
IK Bandwidth 0.005 0.190*** 0.183***
(0.043) (0.031) (0.033)
F 0.013 36.404 30.53
N 804 804 804
Bandwidth = 5 0.101 0.174*** 0.179***
(0.064) (0.034) (0.036)
F 2.549 25.575 24.187
N 1160 1160 1160
Bandwidth = 10 0.046 0.101*** 0.116***
(0.034) (0.032) (0.030)
F 1.838 10.133 14.88
N 2576 2576 2576
Bandwidth = 10, controls 0.044 0.101*** 0.116***
(0.026) (0.023) (0.020)
F 2.927 19.651 32.791
N 2576 2576 2576
Bandwidth = 20 0.058** 0.105*** 0.117***
(0.026) (0.023) (0.022)
F 4.974 20.929 29.338
N 5399 5399 5399
Notes: Heteroskedasticity robust standard errors clustered by ITBS score are in parentheses (* p<.05
** p<.01 *** p<.001). Each row shows first stage estimates of the impact of eligibility for
supplementary reading on the probability of enrollment in the reading course. The coefficients
shown are generated by local linear regression using an edge kernel with the listed bandwidth. No
additional controls are included except in the final row, which conditions on gender, race, LEP and
disability status, prior math scores, cohort and middle school fixed effects. Below each coefficient is
the F-statistic associated with the excluded instrument.

45
Table 6. First Stage Estimates by Grade, including Heterogeneity by Race and Racial Composition
(1) (2) (3)
Grade 6 Grade 7 Grade 8
All Students 0.044 0.101*** 0.116***
(0.026) (0.023) (0.020)
F 2.927 19.651 32.791
N 2576 2576 2576
White, Latino, & Asian students 0.057 0.122*** 0.132***
(0.040) (0.035) (0.033)
F 2.099 12.158 15.964
N 1638 1638 1638
Black students 0.018 0.063* 0.088*
(0.030) (0.034) (0.042)
F 0.362 3.5 4.443
N 938 938 938
Black students, Majority white 0.216*** 0.237*** 0.238***
(0.069) (0.041) (0.037)
F 9.735 33.208 41.1
N 283 283 283
Black students, Majority Black -0.041 -0.001 0.035
(0.038) (0.040) (0.051)
F 1.141 0 0.478
N 655 655 655
Notes: Heteroskedasticity robust standard errors clustered by ITBS score are in parentheses (* p<.05
** p<.01 *** p<.001). Each row shows first stage estimates of the impact of eligibility for
supplementary reading on the probability of enrollment in the reading course. The coefficients
shown are generated by local linear regression using an edge kernel with the listed bandwidth.
Additional controls are included and condition on gender, race, ELL and disability status, prior math
scores, cohort and middle school fixed effects. Below each coefficient is the F-statistic associated
with the excluded instrument.

46
Table 7. Instrumental Variables Heterogeneity by Race and Gender
(1) (2) (3) (4) (5) (6) (7)
ELA Score
grade 6
ELA Score
grade 7
ELA Score
grade 8
ITBS Score
grade 8
Math Score
grade 6
Math Score
grade 7
Math Score
grade 8
All Students 0.833 0.471 -0.365 -0.024 1.234 0.567 0.44
(1.444) (0.598) (0.254) (9.071) (0.997) (0.473) (0.282)
N 2,576 2,576 2,576 2,576 2,576 2,576 2,576
Black students -3.183 -2.277* -2.331** -31.164 -3.731 -0.491 -0.553
(5.282) (1.227) (1.090) (19.271) (7.399) (0.520) (1.056)
N 938 938 938 938 938 938 938
White, Latino, Asian students 1.736 1.265 0.451 12.679 1.988 0.947 0.776**
(2.019) (0.796) (0.365) (12.125) (1.291) (0.623) (0.332)
N 1,638 1,638 1,638 1,638 1,638 1,638 1,638
Notes: Heteroskedasticity robust standard errors clustered by ITBS score are in parentheses (* p<.05 ** p<.01 *** p<.001). Each row
shows instrumental variables estimates of the impact of advanced coursework on end of grade math scores. The coefficients shown are
generated by local linear regression using an edge kernel and a bandwidth of 10. All models include controls for gender, race, LEP
and disability status, prior math scores, cohort and middle school fixed effects.
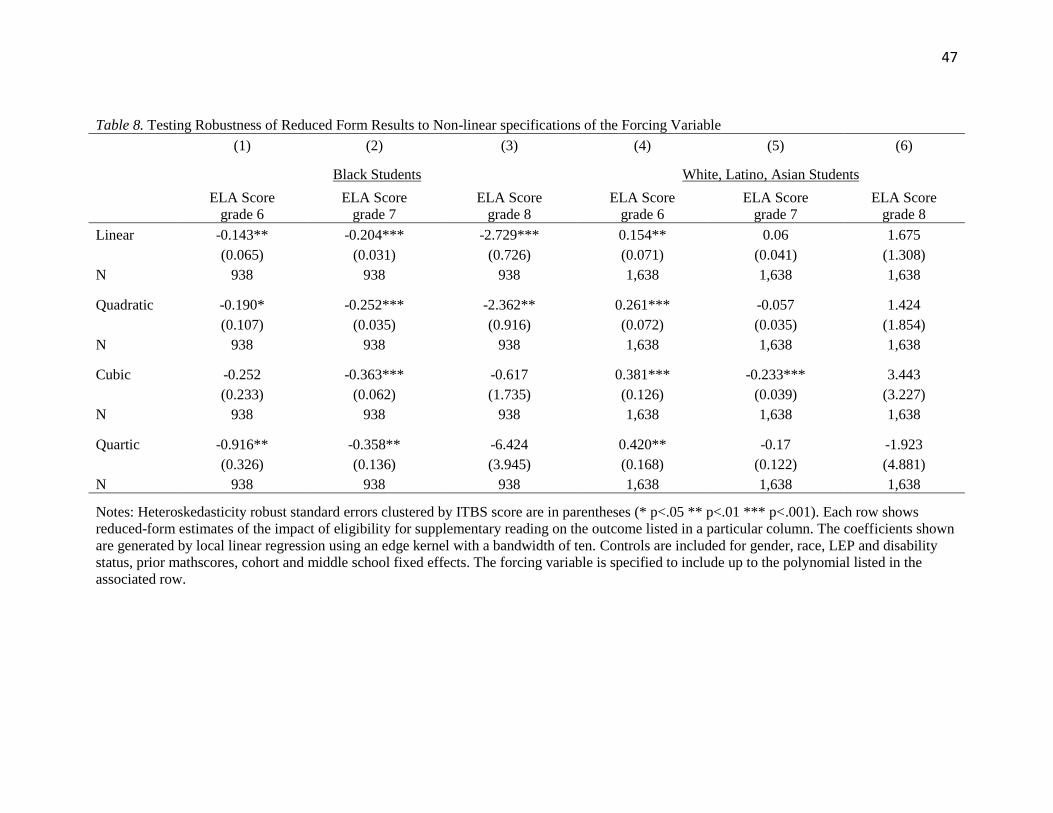
47
Table 8. Testing Robustness of Reduced Form Results to Non-linear specifications of the Forcing Variable
(1) (2) (3) (4) (5) (6)
Black Students White, Latino, Asian Students
ELA Score
grade 6
ELA Score
grade 7
ELA Score
grade 8
ELA Score
grade 6
ELA Score
grade 7
ELA Score
grade 8
Linear -0.143** -0.204*** -2.729*** 0.154** 0.06 1.675
(0.065) (0.031) (0.726) (0.071) (0.041) (1.308)
N 938 938 938 1,638 1,638 1,638
Quadratic -0.190* -0.252*** -2.362** 0.261*** -0.057 1.424
(0.107) (0.035) (0.916) (0.072) (0.035) (1.854)
N 938 938 938 1,638 1,638 1,638
Cubic -0.252 -0.363*** -0.617 0.381*** -0.233*** 3.443
(0.233) (0.062) (1.735) (0.126) (0.039) (3.227)
N 938 938 938 1,638 1,638 1,638
Quartic -0.916** -0.358** -6.424 0.420** -0.17 -1.923
(0.326) (0.136) (3.945) (0.168) (0.122) (4.881)
N 938 938 938 1,638 1,638 1,638
Notes: Heteroskedasticity robust standard errors clustered by ITBS score are in parentheses (* p<.05 ** p<.01 *** p<.001). Each row shows
reduced-form estimates of the impact of eligibility for supplementary reading on the outcome listed in a particular column. The coefficients shown
are generated by local linear regression using an edge kernel with a bandwidth of ten. Controls are included for gender, race, LEP and disability
status, prior mathscores, cohort and middle school fixed effects. The forcing variable is specified to include up to the polynomial listed in the
associated row.

48
Figure 1: Kernel density plot of the recentered ITBS score in 5th
grade.
0
.00
5.0
1.0
15
.02
Den
sity
-60 -50 -40 -30 -20 -10 0 10 20 30 40Recentered ITBS
kernel = epanechnikov, bandwidth = 3.2445

49
Figure 2: Evidence of discontinuity in treatment exposure in all three grades for all students.
0.2
.4.6
.81
Supple
menta
ry R
eadin
g %
-40 -30 -20 -10 0 10 20 30 40ITBS
(A) 6th grade
0.2
.4.6
.81
Supple
menta
ry R
eadin
g %
-40 -30 -20 -10 0 10 20 30 40ITBS
(B) 7th grade
0.2
.4.6
.81
Supple
menta
ry R
eadin
g %
-40 -30 -20 -10 0 10 20 30 40ITBS
(C) 8th grade

50
Figure 3. Evidence of heterogeneity in the first stage exposure to the treatment in 7th
grade, by
race and racial make-up of middle school.
0.2
.4.6
.81
Supple
menta
ry R
eadin
g %
-40 -30 -20 -10 0 10 20 30 40ITBS
(A) White, Latino, Asian students
0.2
.4.6
.81
Supple
menta
ry R
eadin
g %
-40 -30 -20 -10 0 10 20 30 40ITBS
(B) Black students, all
0.2
.4.6
.81
Supple
menta
ry R
eadin
g %
-40 -30 -20 -10 0 10 20 30 40ITBS
(C) Black students, majority white
0.2
.4.6
.81
Supple
menta
ry R
eadin
g %
-40 -30 -20 -10 0 10 20 30 40ITBS
(D) Black students, majority Black

51
Figure 4. Evidence of reduced-form impact of eligibility on four selected outcomes.
-1-.
50
.51
1.5
Readin
g s
core
-40 -30 -20 -10 0 10 20 30 40ITBS
(A) 6th grade Reading
-1-.
50
.51
1.5
Readin
g s
core
-40 -30 -20 -10 0 10 20 30 40ITBS
(B) 8th grade Reading
20
40
60
80
100
ITB
S 8
th g
rade s
core
-40 -30 -20 -10 0 10 20 30 40ITBS
(C) 8th grade ITBS
-1-.
50
.51
1.5
Math
em
atics s
core
-40 -30 -20 -10 0 10 20 30 40ITBS
(D) 6th grade math
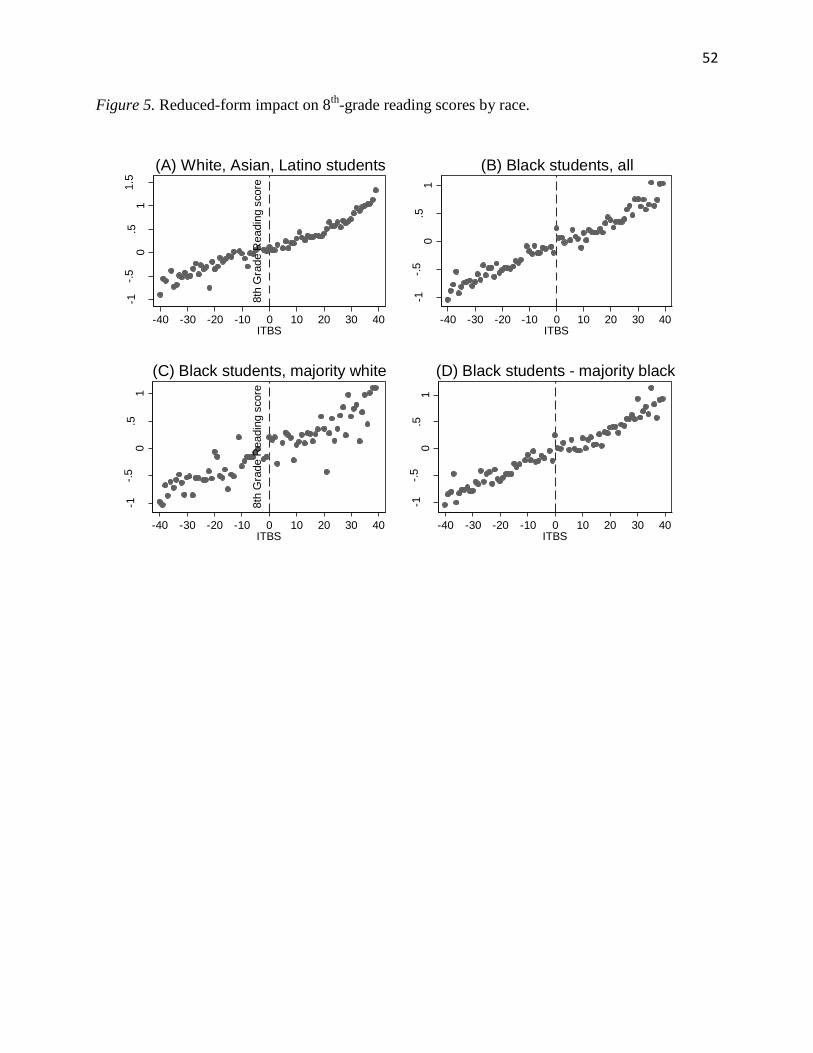
52
Figure 5. Reduced-form impact on 8th
-grade reading scores by race.
-1-.
50
.51
1.5
8th
Gra
de R
eadin
g s
core
-40 -30 -20 -10 0 10 20 30 40ITBS
(A) White, Asian, Latino students
-1-.
50
.51
8th
Gra
de R
eadin
g s
core
-40 -30 -20 -10 0 10 20 30 40ITBS
(B) Black students, all
-1-.
50
.51
8th
Gra
de R
eadin
g s
core
-40 -30 -20 -10 0 10 20 30 40ITBS
(C) Black students, majority white
-1-.
50
.51
8th
Gra
de R
eadin
g s
core
-40 -30 -20 -10 0 10 20 30 40ITBS
(D) Black students - majority black