breeding for reduced environmental footprint in beef cattle€¦ · is being achieved in holistic...
TRANSCRIPT
126
BREEDING FOR REDUCED ENVIRONMENTAL FOOTPRINT IN BEEF CATTLE
Donagh P. Berry1
11Animal & Grassland Research and Innovation Cen-tre
Teagasc, Moorepark, IrelandIntroduction
the demand for animal-derived protein (i.e., milk and meat) is increasing. Global production of meat from
1999/2001 (229 million tonnes) to 2050 (465 million
that, all else being equal, the environmental footprint per unit meat produced will need to be halved if the total environmental footprint of livestock production is not to increase. Most commentary on livestock environmental footprint, however, tends to focus on greenhouse gas emissions. O’Mara (2011) stated that animal agriculture is responsible for 8.0 to 10.8% of global greenhouse gas emissions. If, however, complete lifecycle analysis (i.e., accounting for the production of inputs to animal agriculture as well as change in land
can be up to 18%. Cattle are the largest contributors to global greenhouse gas emissions (O’Mara, 2011).
Livestock production systems are, nonetheless, also implicated for pollution of freshwater supplies (e.g., ni-trogen and phosphorus) as well as depleting water re-serves. Livestock is implicated for 32-33% of Nitrogen and Phosphorus contamination of freshwater supplies (Steinfeld et al., 2006). Moreover, 64% of the world’s population is expected to reside within water-stressed areas by the year 2025 (Steinfeld et al., 2006). Livestock production accounts for 8% of the water used by the
potential of water supplies, is also a crucial characteris-tic of animals for environmental footprint.
127
among individuals in greenhouse gas emissions. Here I discuss other, often easier and more holistic approach-es to potentially reduce the environmental footprint of modern day cattle production systems while simulta-neously improving profitability. This article should be viewed more for provoking discussion than a definitive solution to how best to reduce the environmental foot-print of modern-day production systems.
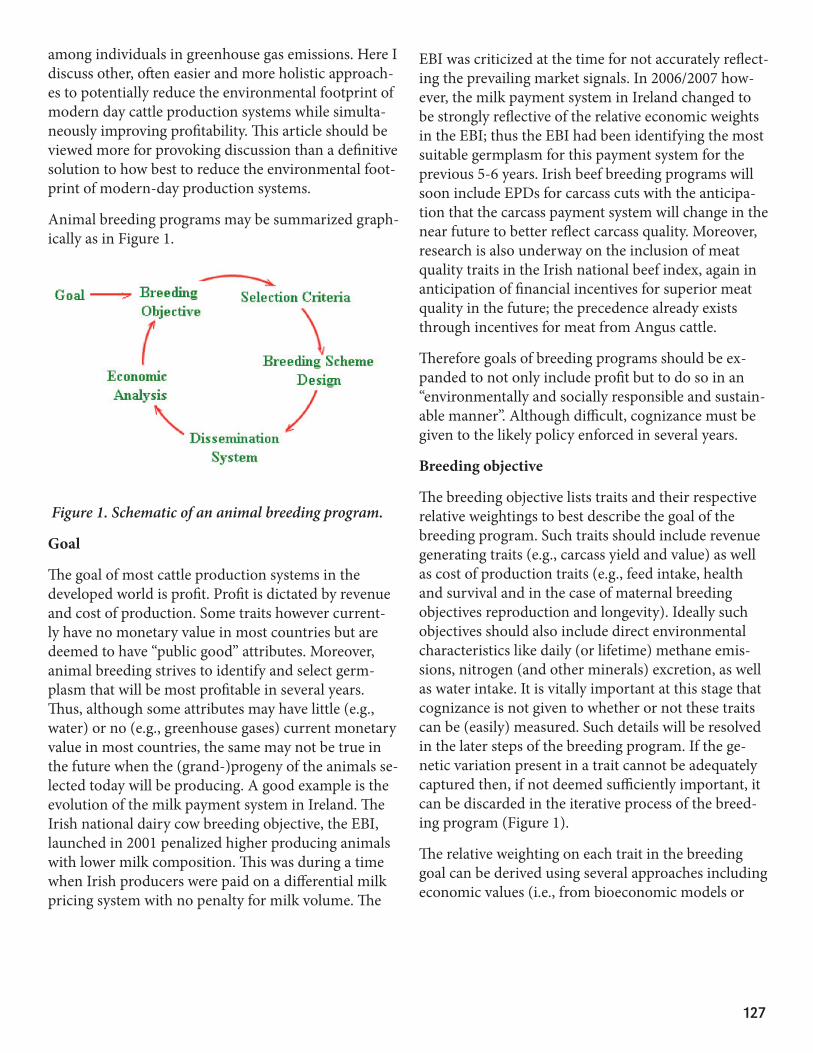
Animal breeding programs may be summarized graph-ically as in Figure 1.
Figure 1. Schematic of an animal breeding program.
Goal
The goal of most cattle production systems in the developed world is profit. Profit is dictated by revenue and cost of production. Some traits however current-ly have no monetary value in most countries but are deemed to have “public good” attributes. Moreover, animal breeding strives to identify and select germ-plasm that will be most profitable in several years. Thus, although some attributes may have little (e.g., water) or no (e.g., greenhouse gases) current monetary value in most countries, the same may not be true in the future when the (grand-)progeny of the animals se-lected today will be producing. A good example is the evolution of the milk payment system in Ireland. The Irish national dairy cow breeding objective, the EBI, launched in 2001 penalized higher producing animals with lower milk composition. This was during a time when Irish producers were paid on a differential milk pricing system with no penalty for milk volume. The
EBI was criticized at the time for not accurately reflect-ing the prevailing market signals. In 2006/2007 how-ever, the milk payment system in Ireland changed to be strongly reflective of the relative economic weights in the EBI; thus the EBI had been identifying the most suitable germplasm for this payment system for the previous 5-6 years. Irish beef breeding programs will soon include EPDs for carcass cuts with the anticipa-tion that the carcass payment system will change in the near future to better reflect carcass quality. Moreover, research is also underway on the inclusion of meat quality traits in the Irish national beef index, again in anticipation of financial incentives for superior meat quality in the future; the precedence already exists through incentives for meat from Angus cattle.
Therefore goals of breeding programs should be ex-panded to not only include profit but to do so in an “environmentally and socially responsible and sustain-able manner”. Although difficult, cognizance must be given to the likely policy enforced in several years.
Breeding objective
The breeding objective lists traits and their respective relative weightings to best describe the goal of the breeding program. Such traits should include revenue generating traits (e.g., carcass yield and value) as well as cost of production traits (e.g., feed intake, health and survival and in the case of maternal breeding objectives reproduction and longevity). Ideally such objectives should also include direct environmental characteristics like daily (or lifetime) methane emis-sions, nitrogen (and other minerals) excretion, as well as water intake. It is vitally important at this stage that cognizance is not given to whether or not these traits can be (easily) measured. Such details will be resolved in the later steps of the breeding program. If the ge-netic variation present in a trait cannot be adequately captured then, if not deemed sufficiently important, it can be discarded in the iterative process of the breed-ing program (Figure 1).
The relative weighting on each trait in the breeding goal can be derived using several approaches including economic values (i.e., from bioeconomic models or
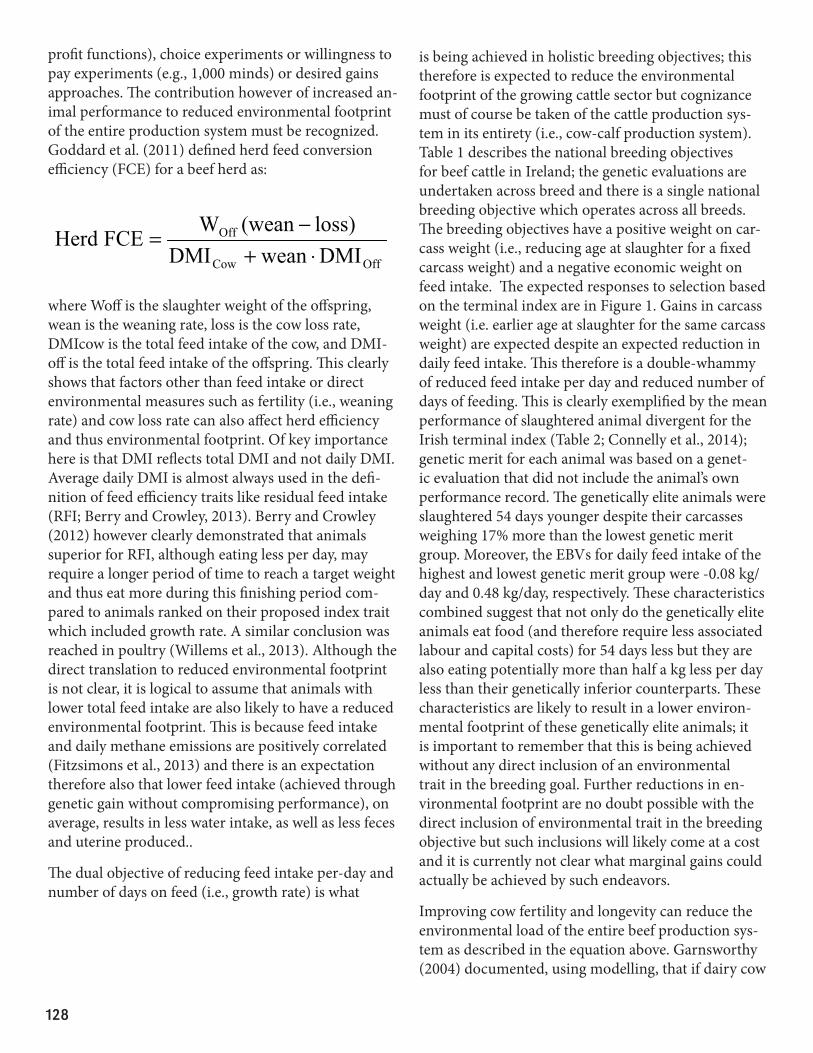
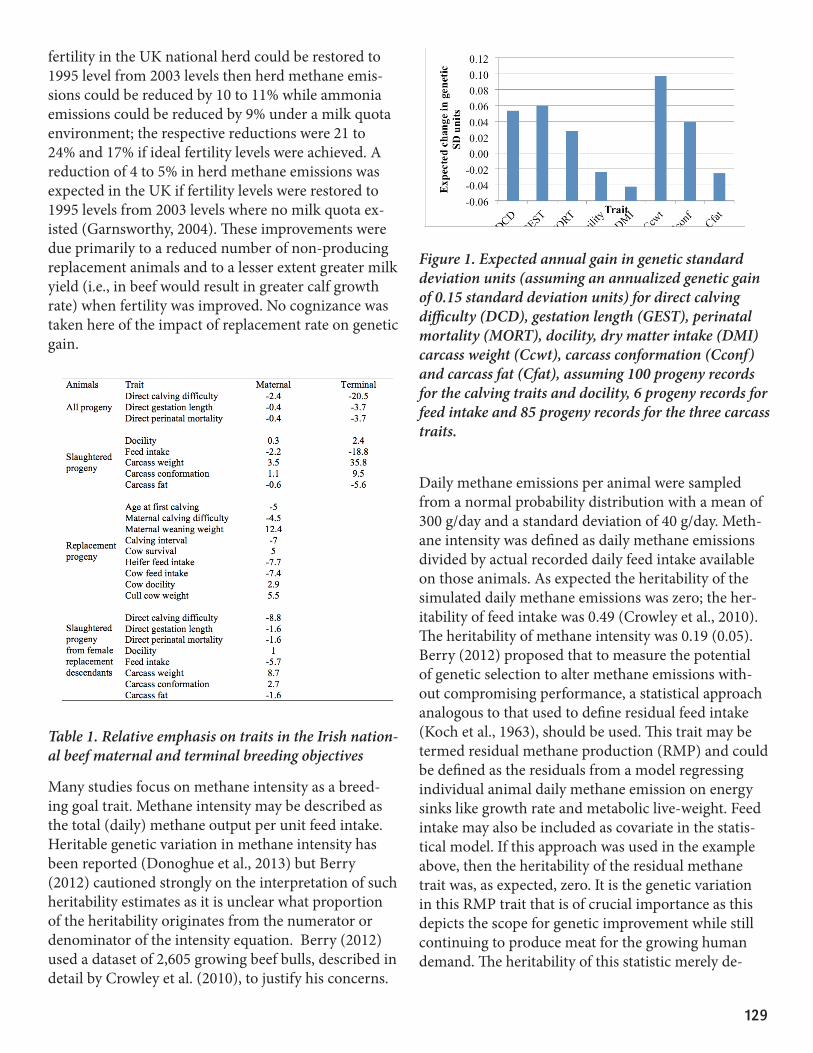
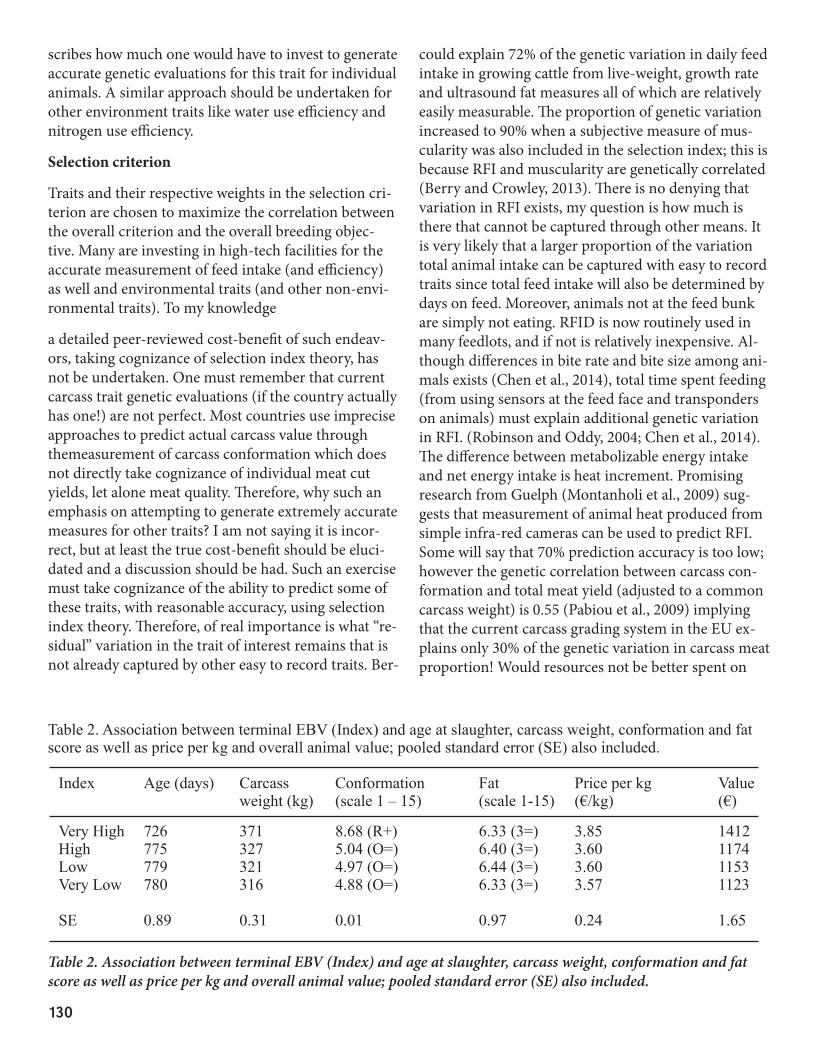
is being achieved in holistic breeding objectives; this therefore is expected to reduce the environmental footprint of the growing cattle sector but cognizance must of course be taken of the cattle production sys-tem in its entirety (i.e., cow-calf production system). Table 1 describes the national breeding objectives for beef cattle in Ireland; the genetic evaluations are undertaken across breed and there is a single national breeding objective which operates across all breeds. The breeding objectives have a positive weight on car-cass weight (i.e., reducing age at slaughter for a fixed carcass weight) and a negative economic weight on feed intake. The expected responses to selection based on the terminal index are in Figure 1. Gains in carcass weight (i.e. earlier age at slaughter for the same carcass weight) are expected despite an expected reduction in daily feed intake. This therefore is a double-whammy of reduced feed intake per day and reduced number of days of feeding. This is clearly exemplified by the mean performance of slaughtered animal divergent for the Irish terminal index (Table 2; Connelly et al., 2014); genetic merit for each animal was based on a genet-ic evaluation that did not include the animal’s own performance record. The genetically elite animals were slaughtered 54 days younger despite their carcasses weighing 17% more than the lowest genetic merit group. Moreover, the EBVs for daily feed intake of the highest and lowest genetic merit group were -0.08 kg/day and 0.48 kg/day, respectively. These characteristics combined suggest that not only do the genetically elite animals eat food (and therefore require less associated labour and capital costs) for 54 days less but they are also eating potentially more than half a kg less per day less than their genetically inferior counterparts. These characteristics are likely to result in a lower environ-mental footprint of these genetically elite animals; it is important to remember that this is being achieved without any direct inclusion of an environmental trait in the breeding goal. Further reductions in en-vironmental footprint are no doubt possible with the direct inclusion of environmental trait in the breeding objective but such inclusions will likely come at a cost and it is currently not clear what marginal gains could actually be achieved by such endeavors.
Improving cow fertility and longevity can reduce the environmental load of the entire beef production sys-tem as described in the equation above. Garnsworthy (2004) documented, using modelling, that if dairy cow
profit functions), choice experiments or willingness to pay experiments (e.g., 1,000 minds) or desired gains approaches. The contribution however of increased an-imal performance to reduced environmental footprint of the entire production system must be recognized. Goddard et al. (2011) defined herd feed conversion efficiency (FCE) for a beef herd as:
OffCow
Off
DMIweanDMI
loss)(weanWFCEHerd
⋅+−
=
where Woff is the slaughter weight of the offspring, wean is the weaning rate, loss is the cow loss rate, DMIcow is the total feed intake of the cow, and DMI-off is the total feed intake of the offspring. This clearly shows that factors other than feed intake or direct environmental measures such as fertility (i.e., weaning rate) and cow loss rate can also affect herd efficiency and thus environmental footprint. Of key importance here is that DMI reflects total DMI and not daily DMI. Average daily DMI is almost always used in the defi-nition of feed efficiency traits like residual feed intake (RFI; Berry and Crowley, 2013). Berry and Crowley (2012) however clearly demonstrated that animals superior for RFI, although eating less per day, may require a longer period of time to reach a target weight and thus eat more during this finishing period com-pared to animals ranked on their proposed index trait which included growth rate. A similar conclusion was reached in poultry (Willems et al., 2013). Although the direct translation to reduced environmental footprint is not clear, it is logical to assume that animals with lower total feed intake are also likely to have a reduced environmental footprint. This is because feed intake and daily methane emissions are positively correlated (Fitzsimons et al., 2013) and there is an expectation therefore also that lower feed intake (achieved through genetic gain without compromising performance), on average, results in less water intake, as well as less feces and uterine produced..
The dual objective of reducing feed intake per-day and number of days on feed (i.e., growth rate) is what
128
fertility in the UK national herd could be restored to 1995 level from 2003 levels then herd methane emis-sions could be reduced by 10 to 11% while ammonia emissions could be reduced by 9% under a milk quota environment; the respective reductions were 21 to 24% and 17% if ideal fertility levels were achieved. A reduction of 4 to 5% in herd methane emissions was expected in the UK if fertility levels were restored to 1995 levels from 2003 levels where no milk quota ex-isted (Garnsworthy, 2004). These improvements were due primarily to a reduced number of non-producing replacement animals and to a lesser extent greater milk yield (i.e., in beef would result in greater calf growth rate) when fertility was improved. No cognizance was taken here of the impact of replacement rate on genetic gain.
Table 1. Relative emphasis on traits in the Irish nation-al beef maternal and terminal breeding objectives
Many studies focus on methane intensity as a breed-ing goal trait. Methane intensity may be described as the total (daily) methane output per unit feed intake. Heritable genetic variation in methane intensity has been reported (Donoghue et al., 2013) but Berry (2012) cautioned strongly on the interpretation of such heritability estimates as it is unclear what proportion of the heritability originates from the numerator or denominator of the intensity equation. Berry (2012) used a dataset of 2,605 growing beef bulls, described in detail by Crowley et al. (2010), to justify his concerns.
Daily methane emissions per animal were sampled from a normal probability distribution with a mean of 300 g/day and a standard deviation of 40 g/day. Meth-ane intensity was defined as daily methane emissions divided by actual recorded daily feed intake available on those animals. As expected the heritability of the simulated daily methane emissions was zero; the her-itability of feed intake was 0.49 (Crowley et al., 2010). The heritability of methane intensity was 0.19 (0.05). Berry (2012) proposed that to measure the potential of genetic selection to alter methane emissions with-out compromising performance, a statistical approach analogous to that used to define residual feed intake (Koch et al., 1963), should be used. This trait may be termed residual methane production (RMP) and could be defined as the residuals from a model regressing individual animal daily methane emission on energy sinks like growth rate and metabolic live-weight. Feed intake may also be included as covariate in the statis-tical model. If this approach was used in the example above, then the heritability of the residual methane trait was, as expected, zero. It is the genetic variation in this RMP trait that is of crucial importance as this depicts the scope for genetic improvement while still continuing to produce meat for the growing human demand. The heritability of this statistic merely de-
Figure 1. Expected annual gain in genetic standard deviation units (assuming an annualized genetic gain of 0.15 standard deviation units) for direct calving difficulty (DCD), gestation length (GEST), perinatal mortality (MORT), docility, dry matter intake (DMI) carcass weight (Ccwt), carcass conformation (Cconf) and carcass fat (Cfat), assuming 100 progeny records for the calving traits and docility, 6 progeny records for feed intake and 85 progeny records for the three carcass traits.
129
scribes how much one would have to invest to generate accurate genetic evaluations for this trait for individual animals. A similar approach should be undertaken for other environment traits like water use efficiency and nitrogen use efficiency.
Selection criterion
Traits and their respective weights in the selection cri-terion are chosen to maximize the correlation between the overall criterion and the overall breeding objec-tive. Many are investing in high-tech facilities for the accurate measurement of feed intake (and efficiency) as well and environmental traits (and other non-envi-ronmental traits). To my knowledge
a detailed peer-reviewed cost-benefit of such endeav-ors, taking cognizance of selection index theory, has not be undertaken. One must remember that current carcass trait genetic evaluations (if the country actually has one!) are not perfect. Most countries use imprecise approaches to predict actual carcass value through themeasurement of carcass conformation which does not directly take cognizance of individual meat cut yields, let alone meat quality. Therefore, why such an emphasis on attempting to generate extremely accurate measures for other traits? I am not saying it is incor-rect, but at least the true cost-benefit should be eluci-dated and a discussion should be had. Such an exercise must take cognizance of the ability to predict some of these traits, with reasonable accuracy, using selection index theory. Therefore, of real importance is what “re-sidual” variation in the trait of interest remains that is not already captured by other easy to record traits. Ber-
Table 2. Association between terminal EBV (Index) and age at slaughter, carcass weight, conformation and fat score as well as price per kg and overall animal value; pooled standard error (SE) also included.
could explain 72% of the genetic variation in daily feed intake in growing cattle from live-weight, growth rate and ultrasound fat measures all of which are relatively easily measurable. The proportion of genetic variation increased to 90% when a subjective measure of mus-cularity was also included in the selection index; this is because RFI and muscularity are genetically correlated (Berry and Crowley, 2013). There is no denying that variation in RFI exists, my question is how much is there that cannot be captured through other means. It is very likely that a larger proportion of the variation total animal intake can be captured with easy to record traits since total feed intake will also be determined by days on feed. Moreover, animals not at the feed bunk are simply not eating. RFID is now routinely used in many feedlots, and if not is relatively inexpensive. Al-though differences in bite rate and bite size among ani-mals exists (Chen et al., 2014), total time spent feeding (from using sensors at the feed face and transponders on animals) must explain additional genetic variation in RFI. (Robinson and Oddy, 2004; Chen et al., 2014). The difference between metabolizable energy intake and net energy intake is heat increment. Promising research from Guelph (Montanholi et al., 2009) sug-gests that measurement of animal heat produced from simple infra-red cameras can be used to predict RFI. Some will say that 70% prediction accuracy is too low; however the genetic correlation between carcass con-formation and total meat yield (adjusted to a common carcass weight) is 0.55 (Pabiou et al., 2009) implying that the current carcass grading system in the EU ex-plains only 30% of the genetic variation in carcass meat proportion! Would resources not be better spent on
Table 2. Association between terminal EBV (Index) and age at slaughter, carcass weight, conformation and fat score as well as price per kg and overall animal value; pooled standard error (SE) also included.
Index Age (days) Carcass Conformation Fat Price per kg Value weight (kg) (scale 1 – 15) (scale 1-15) (€/kg) (€)
Very High 726 371 8.68 (R+) 6.33 (3=) 3.85 1412High 775 327 5.04 (O=) 6.40 (3=) 3.60 1174Low 779 321 4.97 (O=) 6.44 (3=) 3.60 1153Very Low 780 316 4.88 (O=) 6.33 (3=) 3.57 1123 SE 0.89 0.31 0.01 0.97 0.24 1.65
130
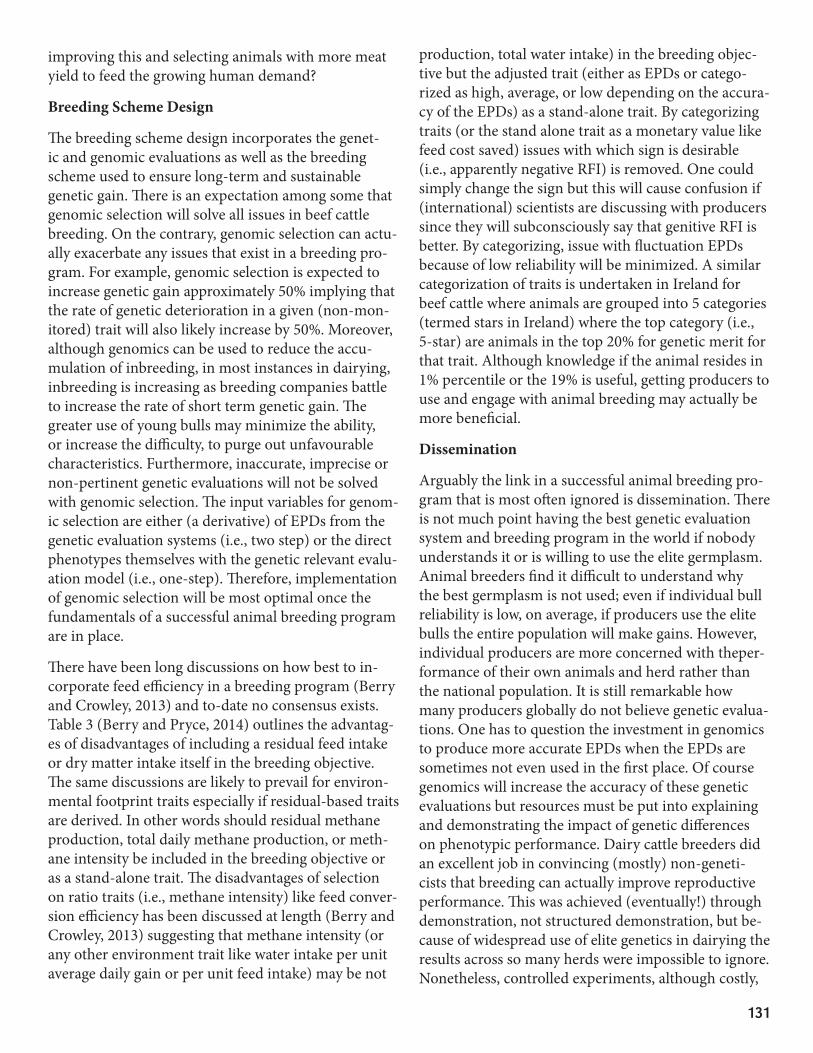
improving this and selecting animals with more meat yield to feed the growing human demand?
Breeding Scheme Design
The breeding scheme design incorporates the genet-ic and genomic evaluations as well as the breeding scheme used to ensure long-term and sustainable genetic gain. There is an expectation among some that genomic selection will solve all issues in beef cattle breeding. On the contrary, genomic selection can actu-ally exacerbate any issues that exist in a breeding pro-gram. For example, genomic selection is expected to increase genetic gain approximately 50% implying that the rate of genetic deterioration in a given (non-mon-itored) trait will also likely increase by 50%. Moreover, although genomics can be used to reduce the accu-mulation of inbreeding, in most instances in dairying, inbreeding is increasing as breeding companies battle to increase the rate of short term genetic gain. The greater use of young bulls may minimize the ability, or increase the difficulty, to purge out unfavourable characteristics. Furthermore, inaccurate, imprecise or non-pertinent genetic evaluations will not be solved with genomic selection. The input variables for genom-ic selection are either (a derivative) of EPDs from the genetic evaluation systems (i.e., two step) or the direct phenotypes themselves with the genetic relevant evalu-ation model (i.e., one-step). Therefore, implementation of genomic selection will be most optimal once the fundamentals of a successful animal breeding program are in place.
There have been long discussions on how best to in-corporate feed efficiency in a breeding program (Berry and Crowley, 2013) and to-date no consensus exists. Table 3 (Berry and Pryce, 2014) outlines the advantag-es of disadvantages of including a residual feed intake or dry matter intake itself in the breeding objective. The same discussions are likely to prevail for environ-mental footprint traits especially if residual-based traits are derived. In other words should residual methane production, total daily methane production, or meth-ane intensity be included in the breeding objective or as a stand-alone trait. The disadvantages of selection on ratio traits (i.e., methane intensity) like feed conver-sion efficiency has been discussed at length (Berry and Crowley, 2013) suggesting that methane intensity (or any other environment trait like water intake per unit average daily gain or per unit feed intake) may be not
production, total water intake) in the breeding objec-tive but the adjusted trait (either as EPDs or catego-rized as high, average, or low depending on the accura-cy of the EPDs) as a stand-alone trait. By categorizing traits (or the stand alone trait as a monetary value like feed cost saved) issues with which sign is desirable (i.e., apparently negative RFI) is removed. One could simply change the sign but this will cause confusion if (international) scientists are discussing with producers since they will subconsciously say that genitive RFI is better. By categorizing, issue with fluctuation EPDs because of low reliability will be minimized. A similar categorization of traits is undertaken in Ireland for beef cattle where animals are grouped into 5 categories (termed stars in Ireland) where the top category (i.e., 5-star) are animals in the top 20% for genetic merit for that trait. Although knowledge if the animal resides in 1% percentile or the 19% is useful, getting producers to use and engage with animal breeding may actually be more beneficial.
Dissemination
Arguably the link in a successful animal breeding pro-gram that is most often ignored is dissemination. There is not much point having the best genetic evaluation system and breeding program in the world if nobody understands it or is willing to use the elite germplasm. Animal breeders find it difficult to understand why the best germplasm is not used; even if individual bull reliability is low, on average, if producers use the elite bulls the entire population will make gains. However, individual producers are more concerned with theper-formance of their own animals and herd rather than the national population. It is still remarkable how many producers globally do not believe genetic evalua-tions. One has to question the investment in genomics to produce more accurate EPDs when the EPDs are sometimes not even used in the first place. Of course genomics will increase the accuracy of these genetic evaluations but resources must be put into explaining and demonstrating the impact of genetic differences on phenotypic performance. Dairy cattle breeders did an excellent job in convincing (mostly) non-geneti-cists that breeding can actually improve reproductive performance. This was achieved (eventually!) through demonstration, not structured demonstration, but be-cause of widespread use of elite genetics in dairying the results across so many herds were impossible to ignore. Nonetheless, controlled experiments, although costly,
131
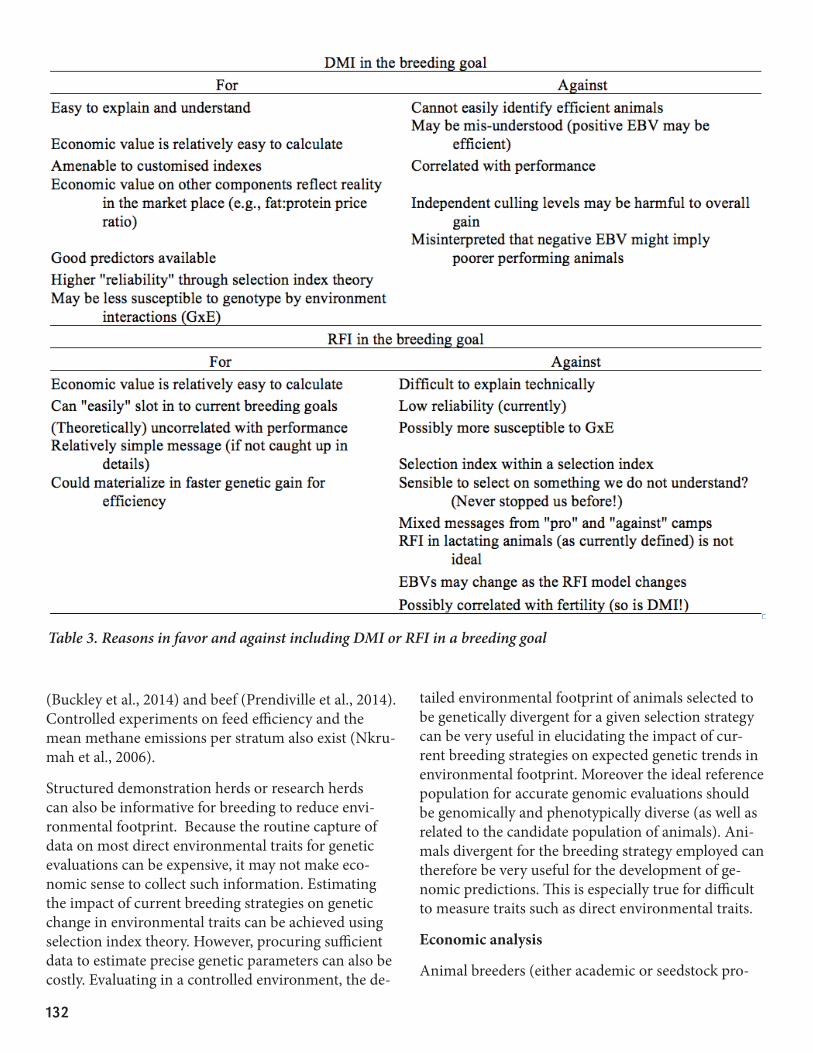
Table 3. Reasons in favor and against including DMI or RFI in a breeding goal
(Buckley et al., 2014) and beef (Prendiville et al., 2014). Controlled experiments on feed efficiency and the mean methane emissions per stratum also exist (Nkru-mah et al., 2006).
Structured demonstration herds or research herds can also be informative for breeding to reduce envi-ronmental footprint. Because the routine capture of data on most direct environmental traits for genetic evaluations can be expensive, it may not make eco-nomic sense to collect such information. Estimating the impact of current breeding strategies on genetic change in environmental traits can be achieved using selection index theory. However, procuring sufficient data to estimate precise genetic parameters can also be costly. Evaluating in a controlled environment, the de-
tailed environmental footprint of animals selected to be genetically divergent for a given selection strategy can be very useful in elucidating the impact of cur-rent breeding strategies on expected genetic trends in environmental footprint. Moreover the ideal reference population for accurate genomic evaluations should be genomically and phenotypically diverse (as well as related to the candidate population of animals). Ani-mals divergent for the breeding strategy employed can therefore be very useful for the development of ge-nomic predictions. This is especially true for difficult to measure traits such as direct environmental traits.
Economic analysis
Animal breeders (either academic or seedstock pro-
132
ducers) must not be afraid to discontinue certain paths if it is not economically advantageous or if more economic gain can be realized with a different strat-egy. Such economic analyses however must include long-term impact, discounted to current day equiva-lents. Economic analyses of breeding programs can be undertaken at the producer level, the breeding com-pany level, or at the national/global level. Moreover, as previously alluded to, the economic cost of most environmental traits can be difficult to quantify unless there is some financial incentive (e.g., carbon trading) or penalty (e.g., nitrates directive) for same. Many of the benefits of reduced environmental footprint of cat-tle production systems will be realized at the national or even global level. Research in this area is on-going (Wall et al., 2010)
Conclusions
Environmental footprint of modern-day production systems will undoubtedly become more important in the near future as global food production increase and the ramifications of such are contemplated. Many approaches exist to possibly reduce the environmental footprint of animal production systems. Animal breed-ing has the advantage of being cumulative and per-manent; the main disadvantage of the long generation interval in breeding is being ameliorated with the ad-vent of genomic selection. Nonetheless, the alternative strategies in the animal breeder’s toolbox to achieve the objective of reduced environmental footprint of animal production without compromising animal perfor-mance must be thoroughly investigated taking cogni-zance of the cost of each strategy.
Literature Cited
Berry, D.P., and Crowley, J.J. 2012. Residual intake and gain; a new measure of efficiency in growing cattle. J. Anim. Sci. 90:109-115
Berry, D.P. and Crowley, J.J. 2013 Genetics of feed effi-ciency in dairy and beef cattle. J. Anim. Sci. 91:1594-1613
Berry, DP and Pryce J.E. 2014. Feed Efficiency in Growing and Mature Animals. Proc. World Cong. Gen. Appl. Livest. Prod.
Buckley, F., McParland S. and Brennan A. 2014. The Next Generation Herd –Year 1 results. Moorepark Open Day Booklet. 9th April 2014. Moorepark, Ire-land.
Campion, B., Keane M.G., Kenny D.A., and Berry D.P. 2009. Evaluation of estimated genetic merit for car-cass weight in beef cattle: Live weights, feed intake, body measurements, skeletal and muscular scores, and carcass characteristics. Livest. Sci. 126: 87-99
Chen L, Mao F., Crews D.H., Jr., Vinsky M., and Li, C. 2014. Phenotypic and genetic relationships of feed-ing behavior with feed intake, growth performance, feed efficiency, and carcass merit traits in Angus and Charolais steers. J. Anim. Sci. 92:974-983;
Clarke, A.M., Drennan M.J., McGee M., Kenny D.A., Evans R.D., and Berry D.P.. 2009. Intake, growth and carcass traits in male progeny of sires differing in genetic merit for beef production. Animal 3:791-801
Coleman, J., Berry D.P., Pierce K.M., Brennan A., and Horan, B. 2010. Dry matter intake and feed effi-ciency profiles of 3 genotypes of Holstein-Friesian within pasture-based systems of milk production. J. Dairy Sci. 93:4318-4331
Connolly, S.M., Cromie A.R., and Berry D.P. 2014. Genetic differences in beef terminal traits and Index is reflected in phenotypic performance difference in commercial beef herds. Proc. World Cong. Gen. Appl. Lives. Prod.. Vancouver.
Crowley, J.J., McGee M., Kenny D.A., Crews D.H. Jr, Evans R.D., and Berry D.P. 2010. Phenotypic and genetic parameters for different measures of feed efficiency in different breeds of Irish performance tested beef bulls. J. Anim. Sci. 88:885-894
Donoghue K.A., Herd R.M., Bird S.H., Arthur P.F. and Hegarty R.G. 2013. Preliminary genetic parameters for methane production in Australian beef cattle. Proc. Assoc. Advancement Anim. Breed. Gen. 20:290-293
Goddard, M.E., Bolormaa S., and Savin K. 2011. Selec-tion for feed conversion efficiency in beef cattle. In; recent advances in Animal Nutrition 18, Australia. Ed. P. Cronje. University of New England. Australia
Fitzsimons, C., Kenny D.A., Deighton M.H., Fahey A.G. and McGee M. 2013. Methane emissions, body composition, and rumen fermentation traits of beef heifers differing in residual feed intake. Journal of Animal Science. 91: 5789-5800
Koch, R.M., Swiger, L.A., Chambers, D. and Grego-ry, K.E. 1963. Efficiency of feed use in beef cattle. J. Anim. Sci. 22: 486-494
133
Montanholi Y.R., Swanson K.C., Schenkel F.S., McBride B.W., Caldwell T.R., Miller S.P.. 2009. On the deter-mination of residual feed intake and associations
sound traits in beef bulls. Livest. Sci. 125: 22–30Nkrumah, J.D., Okine E.K., Mathison G.W., Schmid K.,
Li C., Basarab J.A., Price M.A., Wang Z. and Moore
performance, and feeding behavior with metabolic rate, methane production, and energy partitioning in beef cattle. J. Anim. Sci. 84: 145-153
contributor to global greenhouse gas emissions today and the near future. Anim. Feed Sci. Tech. 166-167: 7-15.
Robinson, D.L. and Oddy V.H. 2004. Genetic param-
Livest. Prod. Sci. 90: 255–270.
Pabiou, T., Fikse, W.F., Nasholm, A., Cromie, A.R., Drennan, M.J., Keane, M.G. and Berry, D.P. 2009. Ge-netic parameters for carcass cut weight in Irish beef cattle. J. Anim. Sci. 87: 3865-3876
Steinfeld, H, Gerber P, Wassenaar T., Castel V., Rosales M., and de Haan C.. 2006.Livestock’s Long Shad-
Initiative (LEAD). Rome: FAO. http://www.fao.org/docrep/010/a0701e/a0701e00.HTM
Wall E., Simm G. and Moran D. 2010. Developing breeding schemes to assist mitigation of greenhouse gas emissions. Animal 4: 366-376.
Willems O.W., Miller S.P. and B.J. Wood. 2013. Assess-ment of residual body weight gain and residual intake
turkey (Meleagris gallopavo). Gen. Sel. Evol. 2013: 45: 26.
1
134