breakthrough in nanoparticle tracking analysis (nta) · breakthrough in nanoparticle tracking...
TRANSCRIPT

Breakthrough in Nanoparticle Tracking Analysis (NTA)
April 2017
Rick Cooper, CEO
858.449.5801
Outline
Background
Technology overview
Validation results
Product details
Established Technologies
• Dynamic Light Scattering (DLS)
• Nanoparticle Tracking Analysis (NTA)
• Transmission Electron Microscopy (TEM)
• Flow Cytometry (FC)
Unmet Needs
• Visualization of polydisperse particles
• Accurate & reproducible measurement of:
Particle number concentration
Particle size distribution
Particle kinetic processes

Technology

Light Scattering 101
In Brownian motion, particle movements are related to their size:
& movements are measured by tracking scattered light in videos
LASER
CCD
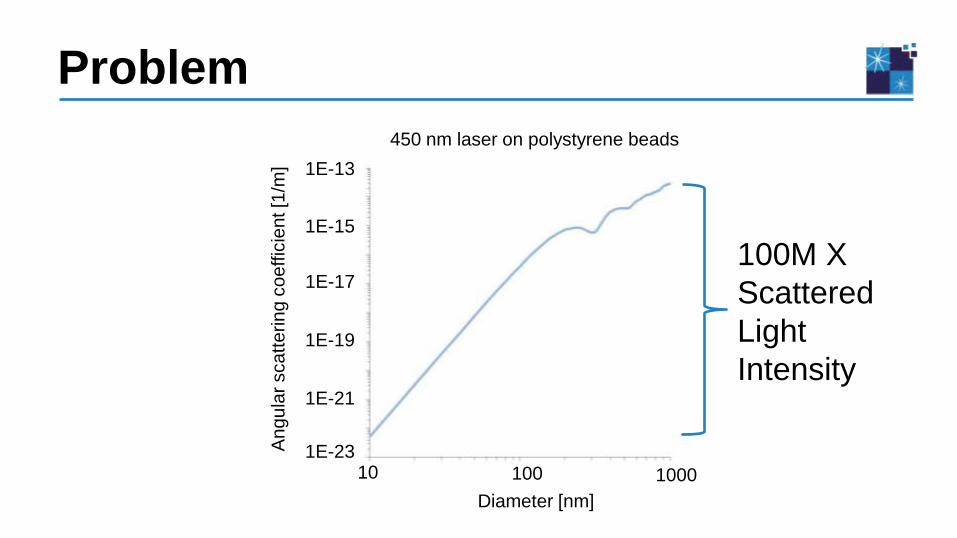
Problem
100M X
Scattered
Light
Intensity
450 nm laser on polystyrene beads
Diameter [nm]
An
gu
lar
sca
tte
rin
g c
oe
ffic
ient [1
/m]
10 100 1000
1E-19
1E-17
1E-15
1E-13
1E-21
1E-23

100M X Scattered Light Intensity
Problem & Effects
• DLS – large particles skew results
• NTA – different sized particles co-existing can’t be seen
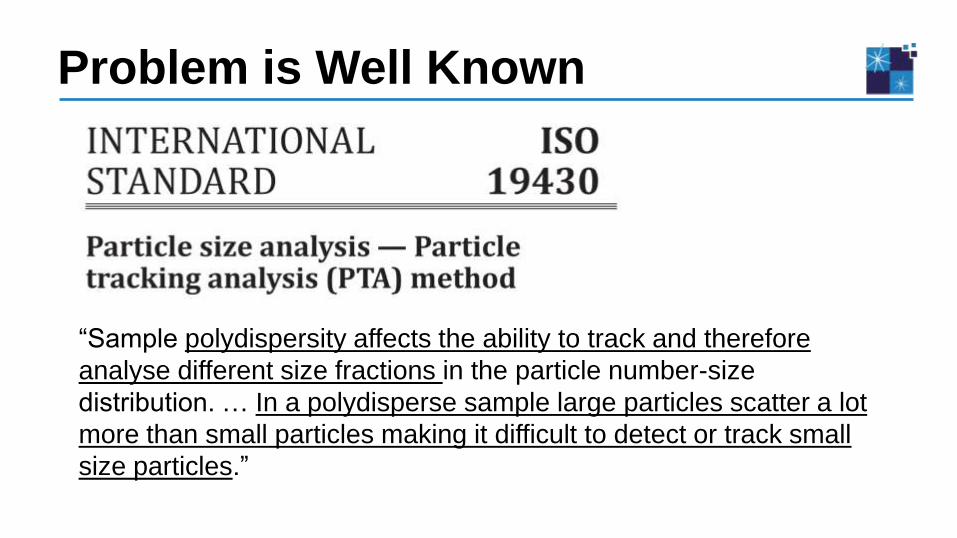
Problem is Well Known
“Sample polydispersity affects the ability to track and therefore
analyse different size fractions in the particle number-size
distribution. … In a polydisperse sample large particles scatter a lot
more than small particles making it difficult to detect or track small
size particles.”

Reference Customer
“In our tests leading up to the purchase of our ViewSizer™ 3000, we confirmed
this easy to use bench top instrument meets all our needs for visualizing,
sizing and counting nanoparticles such as live viruses, exosomes, silver,
RNA, and YAG”
“The ViewSizer™ 3000 is the first product we’ve found that can effectively
characterize particles in polydisperse samples and its unmatched
visualization of all particles, even in complex samples, removes elements of
mystery associated with other methods.”
Dr. Sadik Eisner,
Director, OHSU’s Center for Early Cancer Detection Research

Break the problem into manageable segments
The Solution
100 1000
1E-19
1E-17
1E-15
1E-13
10
1E-21
1E-23
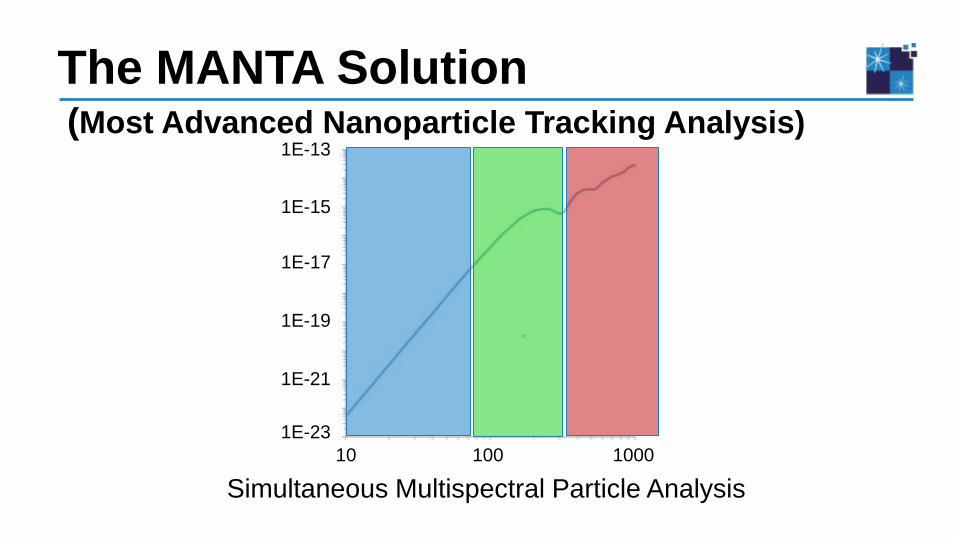
Simultaneous Multispectral Particle Analysis
The MANTA Solution
100 1000
1E-19
1E-17
1E-15
1E-13
10
1E-21
1E-23
(Most Advanced Nanoparticle Tracking Analysis)

80 nm
240 nm
700 nm
MANTA can measure a wide range of nanoparticle sizes simultaneously
Customer Comments
“Wow, I can see all my particles!”
“Amazing, I didn’t think this was possible!”
“Oh my god, I love this!”
“I can’t do my research without MANTA.”
“Our other instruments can’t do this.”
“Are you sure that’s the right price?”

Validation
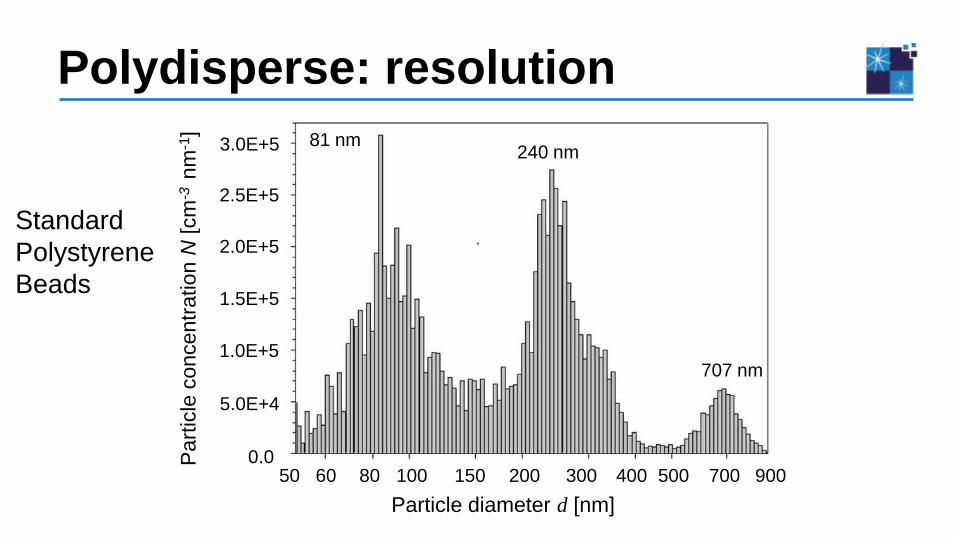
Standard
Polystyrene
Beads
81 nm 240 nm
707 nm
Particle diameter d [nm]
Part
icle
concentr
atio
n N
[cm
-3 n
m-1
]
Polydisperse: resolution
50 60 80 100 150 200 300 400 500 700 900
3.0E+5
2.5E+5
2.0E+5
1.5E+5
1.0E+5
5.0E+4
0.0
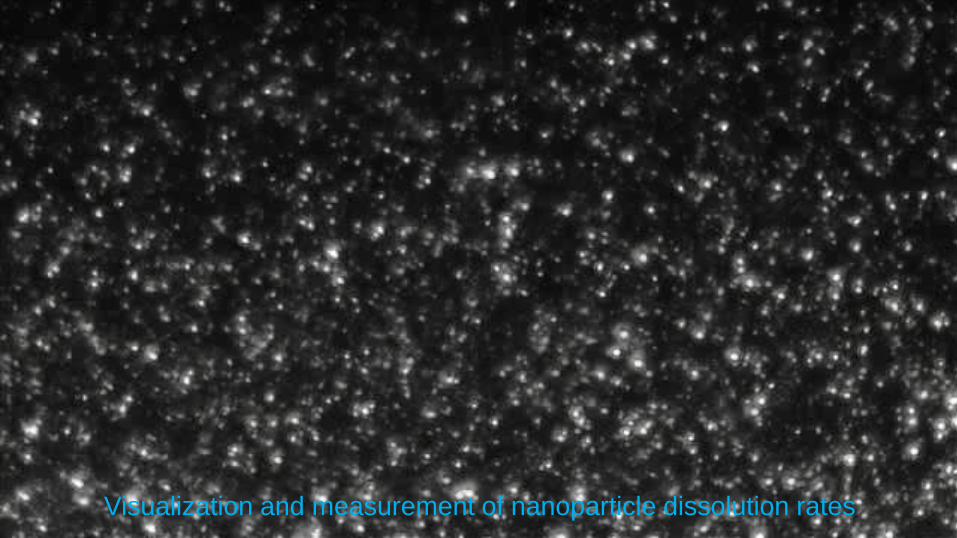
Visualization and measurement of nanoparticle dissolution rates
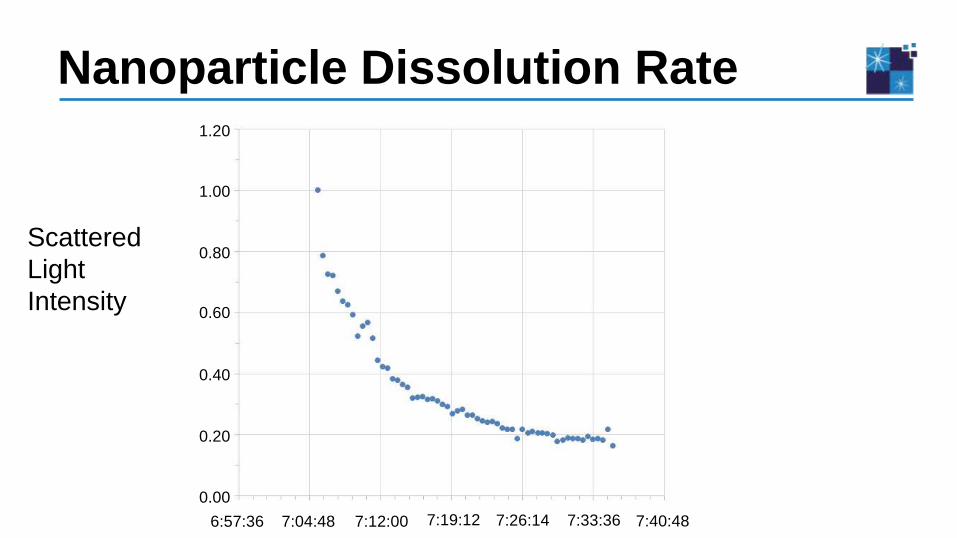
Nanoparticle Dissolution Rate
ViewSizer 3000 visualizes and measures particle dissolution rates
Scattered
Light
Intensity
0.00
0.20
0.40
0.60
0.80
1.00
1.20
6:57:36 7:04:48 7:12:00 7:19:12 7:26:14 7:33:36 7:40:48

Crystallization & Dissolution Rates
ViewSizer 3000 visualizes and measures particle dissolution rates
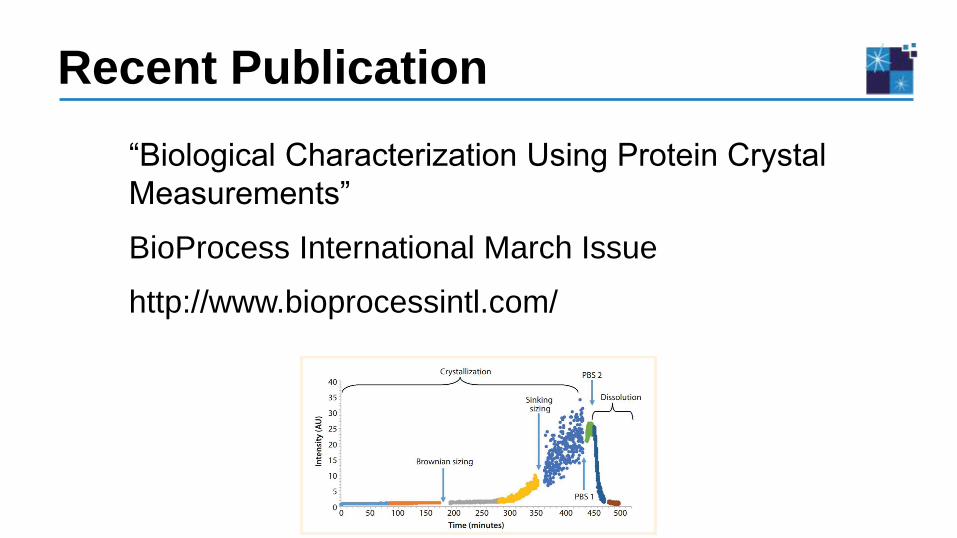
“Biological Characterization Using Protein Crystal
Measurements”
BioProcess International March Issue
http://www.bioprocessintl.com/
Recent Publication
ViewSizer 3000 visualizes and measures particle dissolution rates

Visualization and measurement of micron sized particles by settling rates
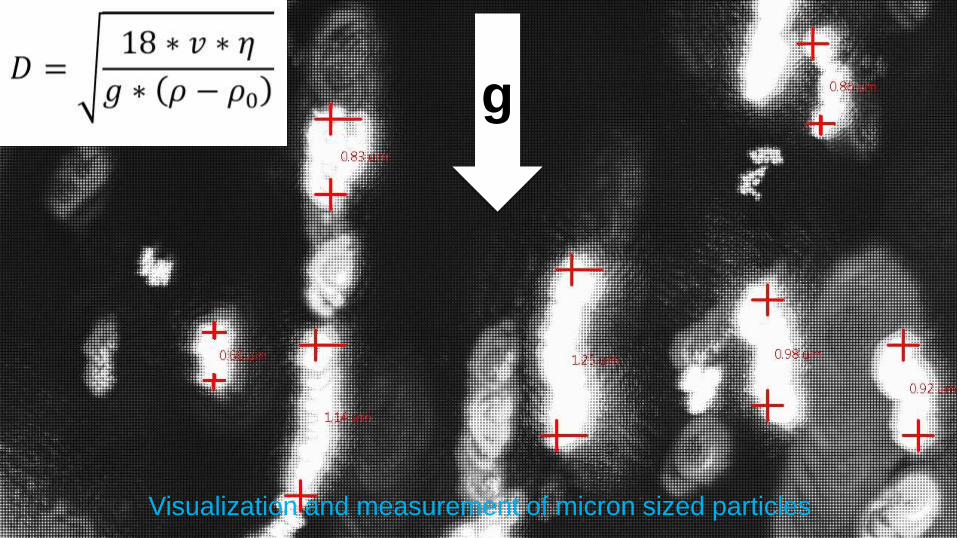
Visualization and measurement of micron sized particles
g g
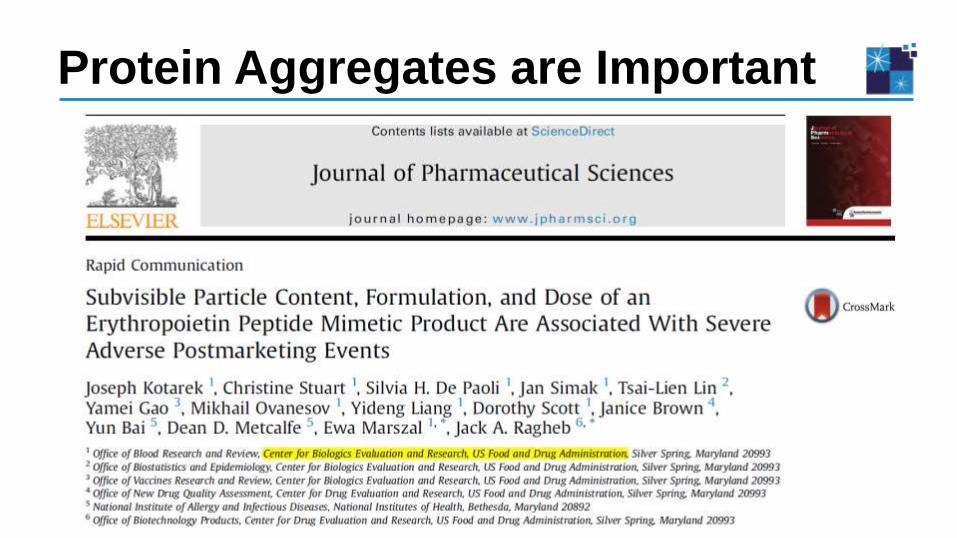
Protein Aggregates are Important
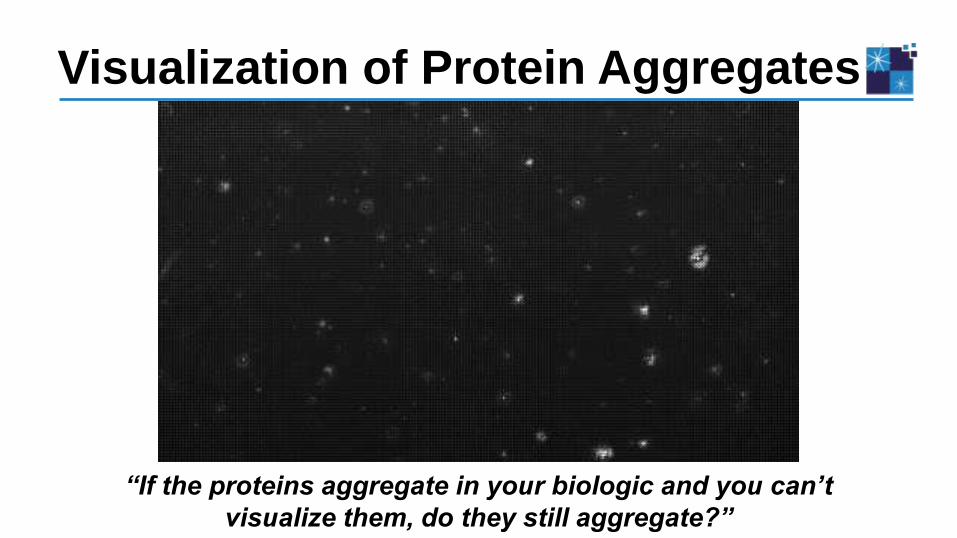
“If the proteins aggregate in your biologic and you can’t
visualize them, do they still aggregate?”
Visualization of Protein Aggregates
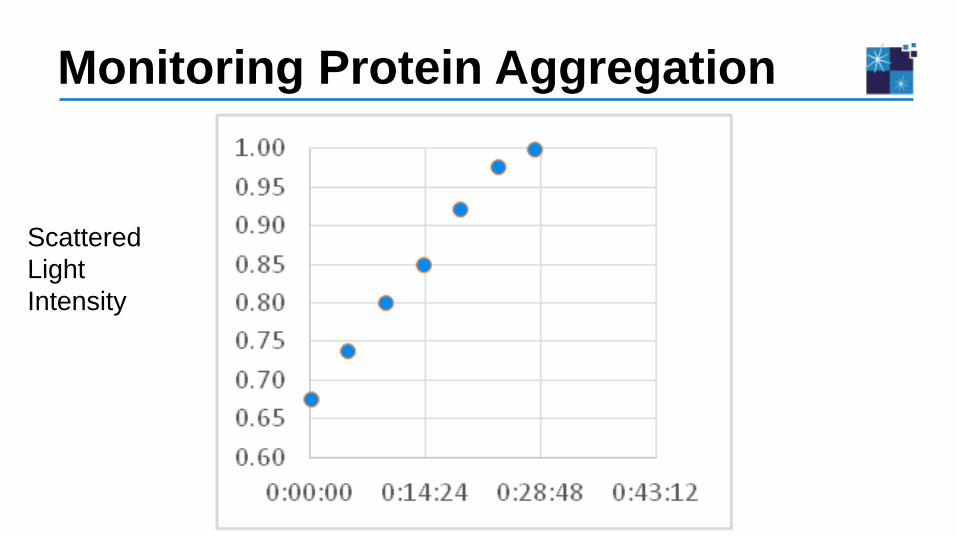
Monitoring Protein Aggregation
Scattered
Light
Intensity

polystyrene w/ and w/o PEG coating, silica, silver, 316L stainless, gold,
sand, CaO, YAG, SiO2, carbon, PMMA
sea water, rain water, tap water, wine, urine, blood plasma, milk,
ammonia
small molecule APIs, protein aggregates, silicon oil, protein crystals,
liposomes, exosomes, vesicles, micelles, lactalbumin, RNA, rolled DNA,
viruses, emulsions, polymeric API carriers, bacteriophages, self-
adjuvanted protein
Ʃ = 36 as of March 2017
Successfully Tested Samples
Product
ViewSizer™ 3000
Introducing
ViewSizer™ 3000
• Elegant technology
Only 3 inputs needed
Sample (in a cuvette)
Temperature (controlled to customer’s set point)
Viscosity (from literature, or measured by ViewSizer™)
• Absolute method, no calibration standards req’d

* Sample dependent
Specifications
Range of Particle Sizes Measured * 10 nm to 15 µm
Minimum Sample Volume 0.4 mL
Typical Sample Concentration 5 x 10⁶ to 2 x 10⁸ particles/mL
Sample Temperature Range (Controlled) 5 °C to 50 °C, +/- 0.1 °C (-15 °C to 110 °C available)
Dimensions 55 cm W x 66 cm D x 35 cm H
Weight 27 kg
Operational Environment 15 °C to 30 °C with < 85% RH

DLS Customer Requirements NTA
Particle Concentration
Particle Size Distribution
Particle Kinetic Processes
Particle Visualization
Competition

Summary
Breakthrough technology
New & better particle characterization
Happy customers & partners

Stronger Together
