breakthrough in clinker grinding - concrete · pdf filebreakthrough in clinker grinding by:...
TRANSCRIPT

Breakthrough in Clinker Grinding
Richard P. Bohan
John P. Kline
This paper was reviewed by and based in part on research by the MIT CSHub. It was published at the 2013 Cement Industry Technical Conference sponsored by the IEEE Industry Applications Society and the Portland Cement Association.
cshub.mit.edu

BREAKTHROUGH IN CLINKER GRINDING
By: Richard P. Bohan, Director of Manufacturing Technology, Portland Cement Association,
[email protected], and John P. Kline, Principal, John Kline Consulting, [email protected]
ABSTRACT
Particle size reduction is one of the most energy intensive and inefficient processes in use today. Traditional means for calculating energy requirements used for sizing equipment rely on empirically derived formulas and indices. The standard work indices of Kick, Bond and Von Rittinger each work within specific particle size ranges based on empirically derived factors. To date the true energy required for size reduction alone is still unknown. Because of this the true efficiency of size reduction processes are also unknown. Fundamental research at the Massachusetts Institute of Technology’s (MIT) Concrete Sustainability Hub (CSH) is taking a closer look at the theoretical power required for particle size reduction on the micro scale. This work has the potential to greatly reduce the power required for cement manufacture. This paper reviews the MIT research and discusses the possible implications and next steps for that work. INTRODUCTION
A tremendous amount of energy is consumed during crushing and grinding, much of this energy is wasted as heat and sound. That makes particle size reduction perhaps the most inefficient process in modern society. The amount of energy used for size reduction is evident across industries. Notable examples include: agricultural (flour, grain mill products, rice milling, wet corn milling, etc.), mineral (cement, coal, stone, copper, iron ore, phosphate, sand and gravel, clay, titanium, etc.), and active pharmaceutical ingredients requiring micronization. The cement industry is particularly reliant upon particle size reduction. Raw materials crushing and grinding seeks to reduce materials from roughly one meter cubes of blasted stone to a size where at least 80 percent of the raw material is less than 75 microns. Finish grinding of clinker and other cement ingredients reduces 25 mm clinker balls to particle sizes optimally ranging from 3 to 30 microns. The European Cement Research Academy (ECRA) estimates that up to 70% of the power consumed in cement production is for material size reduction. Increasing the efficiency of particle size reduction could have a large impact on energy consumption in the cement industry. Current estimates of grinding power requirements used for equipment sizing are indirect indications often based on industrial experience or scaled up from laboratory tests. Work indices (Bond, Hardgrove, Kick, Von Rittinger, Hukki, et. al.) are also indirect and empirical equations that calculate the energy needed to reduce materials from one particle size to a second, smaller size. For example, cement fineness when expressed as Blaine is reported as a specific surface area expressed as cm2/g or M2/kg. However, it is calculated from the air permeability of a fixed bed of ground cement. This again is an indirect and empirical indication of mean particle size. Grinding energy calculations starting from first principles would optimally consider the fundamental properties of the material and only the energy required for size reduction. MIT Researchers have begun to do just that, starting with individual clinker phases.
Page 1 of 10
978-1-4673-5553-7/12/$31.00 © 2013 IEEE
2013-CIC-022

PREVIOUS RESEARCH
Early research considered the energy required for particle size reduction either as a function of increased surface area (Von Rittinger 1867) or as a function of the increased number of size reduction stages (Kick 1885). Later work by Bond yielded an equation relating the energy needed to reduce a material from one characteristic size to a smaller size (each size expressed as the state where 80 percent of the particles are smaller than the characteristic size). Bond’s work is notable because of its widespread adoption in the design of most modern industrial grinding circuits. Bond developed a work index function that he suggested was a measure of the crack length needed to break a specific particle size. The theory is that since the surface area function is proportional to the volume of material then the crack length must be proportional to the square root of that same volume. Once the Bond Work Index is known for a specific material the equation can be used to calculate the energy requirements for various ranges of input and output sizes. Bond’s work index is given below:
The indices derived by Kick, Bond and Von Rittinger all assume a constant energy requirement per unit of size reduction regardless of the particle size range. Industrial and laboratory results indicate that the energy required for size reduction increases as the product particle size decreases. Each of these indices is considered valid for a specific particle size range as follows:
� Kick for particles greater than 50 mm in diameter � Bond for particles smaller than 50 mm but larger than 0.05 mm in diameter � Von Rittinger for particles smaller than 0.05 mm in diameter
Hukki (1962) attempted to balance the work of Von Rittinger, Kick, and Bond by combining the individual equations into one general form. Other research considered the energy consumed in size reduction as a single numerical value discovered through standardized laboratory size reduction techniques. Hardgrove’s work (1932) on the grindability of coal in the 1930s is the classic example. All of these researchers considered materials from a brittle fracture standpoint as opposed to considering plastic deformation of the materials. Rehbinder and Kalinkovaskaya (1932) were the first researchers to consider the physico-chemical aspects of grinding. Their work and the discovery of the Rehbinder effect contributed to the discovery and use of grinding aids. The Rehbinder effect looks at the influence of surface-active media and residual stresses arising in the near-surface layers of solids after the ‘loading-unloading’ cycle of the real material structure, including distributions of linear and point lattice defects in the soft and hard structural material components. Rehbinder's work has prompted many investigators to examine the effect of additives on the mechanical destruction of rocks.
Page 2 of 10
978-1-4673-5553-7/12/$31.00 © 2013 IEEE
2013-CIC-022
CRACK LENGTH, ENERGY, AND BRITTLE FRACTURE
Research investigating the relationships between energy, crack length and brittle fracture derive from Griffith (1921). He discovered that the actual toughness of a material was much lower than the theoretical toughness of the pure material. (Material toughness is defined as the resistance to failure under load.) He also discovered that smaller sample sizes were proportionately tougher than larger sample sizes. In addition very small sample sizes approached the theoretical material toughness values. This led Griffith to the conclusion that brittle fracture was determined by flaws in the material.
He also discovered that if a crack was sufficient enough to fracture a material, then the gain in the surface energy of the material was equivalent to the loss of the material’s strain energy. According to Griffith’s energy balance, a crack will grow, when the energy release rate equals the crack’s resistance force.
The propagation of a crack in an elastic solid must encompass three separate energies: external energy consumed in increasing the crack size, surface energy of the crack in resisting that increase, and the elastic energy of the material itself. The material’s elastic energy can either contribute to or restrict cracking, depending upon the characteristics of the material, the loading process, and other factors. Knowing the impact of each of these energies is a key to understanding the energy required to fracture materials. Griffith’s Law also requires a characteristic length scale to define a fracture process zone. That process zone is, in effect, the depth of the plane of weakness. Scaling theory for quasibrittle structural failure suggests the length of that zone ranges from 5-50 times the dominant material inhomogeneity size. (In the case of fine-grained ceramics, the zone might be 10 µm to 1 mm, while the zone may be 10 nm in a silicon wafer and nearly 20 km when considering the ice cover of the Arctic Ocean.) Research at MIT suggests that the length of the fracture process zone for concrete is the interlamellar distance between tobermoritic layers within the C-S-H matrix. The fracture process zone can be accurately observed and measured using XRD. FRACTURE TOUGHNESS
Fracture toughness is a measure of a material’s resistance to fracture. Griffith demonstrated that most fractures for brittle materials start at a flaw, or a plane of weakness in the material. The ease of propagating that plane of weakness will depend on the material’s properties. Propagating a plane of weakness or a crack or any deformation within a solid requires some specific combination of stress and strain. In terms of comminution, generating a plane of weakness within a material is easier than sawing through the full depth of a material. (Common examples include the scoring of glass, ceramics, and other brittle materials.) This is just as true for materials at a macro scale as it is for materials at a micro or nano or even atomic scale. Conversely, the energy needed to create a plane of weakness is also an indication of the energy present in the newly created surfaces. This is the very definition of surface energy.
Fracture toughness is expressed as KC and the measurement procedure is defined by ASTM. The ASTM test is used to determine the fracture toughness of metallic materials. KC represents “the resistance of a material to fracture in a neutral environment in the presence of a sharp crack under essentially linear-elastic stress and severe tensile constraint, such that (1) the state of stress near the crack front approaches tritensile plane strain, and (2) the crack-tip plastic zone is small compared to the crack size, specimen thickness, and ligament ahead of the crack.” (ASTM 2009).
Fracture toughness (KC) is defined as the square root of Young’s modulus for the material in one direction multiplied by the surface energy in a perpendicular direction. Material thickness has a critical role in the observed fracture toughness of a material. Once a material thickness exceeds a critical dimension, the
Page 3 of 10
978-1-4673-5553-7/12/$31.00 © 2013 IEEE
2013-CIC-022

observed fracture toughness will become a constant value known as the plane-strain fracture toughness and denoted as KIC. Figure 1 demonstrates this relationship.
Figure 1: The relationship between material thickness and fracture toughness
This is why Griffith’s fracture toughness relies upon Young’s modulus. Provided that the material’s elasticity is known, Griffith’s Law then ultimately depends on the cohesive energy density and the characteristic length scale. More importantly, theoretical values obtained using Griffith’s Law can be validated against experimental results. The question now becomes a choice of validation method. The fracture toughness will vary depending on the loading mode. Three loading modes are commonly used as seen in Figure 2. The most common loading mode, known as mode I, is putting the crack in tension or pulling it apart. Mode II is a sliding mode and mode III is a tearing mode. KIC refers to the fracture toughness for mode I loading.
Figure 2: The three standard loading modes of a crack
THE IMPORTANCE OF COHESIVE ENERGY DENSITY Researchers at MIT questioned the well known observation that the theoretical values obtained using Griffith’s Law, do not accurately predict the experimental values observed. By considering an energy density rather than just surface energy, researchers observed theoretical results closely approaching the results of their experiments. The cohesive energy density is the amount of energy needed to completely
Page 4 of 10
978-1-4673-5553-7/12/$31.00 © 2013 IEEE
2013-CIC-022

separate a unit volume of molecules from adjacent molecules. It can just as easily be considered as the energy required to break apart all the atoms of a solid. What MIT researchers considered was that the surface energy in Griffith’s Law does not address the energy required to destroy all the bonds between the surfaces. Hence they relied upon the cohesive energy density which is the amount of energy required to vaporize the solid. The choice of cohesive energy density as opposed to surface energy is a critical consideration. It isn’t enough just to sever the chemical bonds on either face of the fracture within the material; the fracture process must also account for the surface reconstruction and modification that takes place after the fracture. That reconstruction and modification requires the use of the cohesive energy density. In the case of a solid, MIT researchers suggest that the cohesive energy density provides an upper bound for the value of Griffith’s fracture toughness KC. CHOICE OF EXPERIMENTAL VALIDATION METHOD Fracture toughness (KC), or the resistance to fracture, is traditionally measured by creating a known flaw or crack into a material by first cutting into the material and then measuring the energy required to extend the cut. Figure 3 demonstrates a traditional fracture toughness test. The test sample is the horizontal bar with a vertical cut on the bottom center of the bar. The bar is supported underneath by the two cylindrical rolls. Pressure is applied vertically downward and directly above the cut through the round cylinder located just above the sample bar. The force (stress) and resultant deflection of the bar (strain) are measured while the force is gradually increased over time. These values are used to calculate the material’s fracture toughness.
Figure 3: A traditional fracture toughness test mechanism MIT researchers found that KC can be calculated directly by scratching a sample of the material. What they discovered is that scratching is a combination of plastic deformation and brittle fracture. Plastic deformation tends to take place along the sides of the scratch while fracture tends to occur in the center of the scratch. By adjusting the scratch test mechanism, they could minimize the plastic deformation and directly calculate the fracture toughness. The scratch test uses a stylus under specific loading conditions to scratch the surface of a solid at a specified depth. The force required to move the stylus laterally across the sample is recorded. Variations in the normal loading profile, variations in the lateral displacement pattern, and combinations of the two can be used to determine deformation and fracture modes of the sample material. MIT used precision
Page 5 of 10
978-1-4673-5553-7/12/$31.00 © 2013 IEEE
2013-CIC-022

tests on paraffin wax as a starting point for a dimensional analysis to identify the mechanical components involved. A picture of the paraffin test arrangement is shown in figure 4. The stylus dimensions are width (w) and depth (d), the horizontal force is FT, and the paraffin fracture toughness KC. Figure 5 indicates the results for the paraffin testing using 55 different stylus dimensions (w and d) and transformed to a common scale. Here w varies between 2.5 and 25 mm while d varies between 2.5 and 12.5 mm. The test results indicate that as w / d increases the scratch test approaches the square root of 2 as a constant (horizontal line).
Figure 4: Paraffin test rig at MIT CSH
Figure 5: Fracture scaling of the scratch tests on paraffin wax
MIT then developed a theoretical framework for a predictive model. The predictive model became the starting point for their fracture toughness determinations. Once the model was developed, it was scaled and validated against known materials with smaller styluses. By understanding the fundamentals of the scratch test, MIT can apply it at the meso and micro levels. They have found the microscratch testing to be a repeatable and reproducible quantitative method.
Page 6 of 10
978-1-4673-5553-7/12/$31.00 © 2013 IEEE
2013-CIC-022

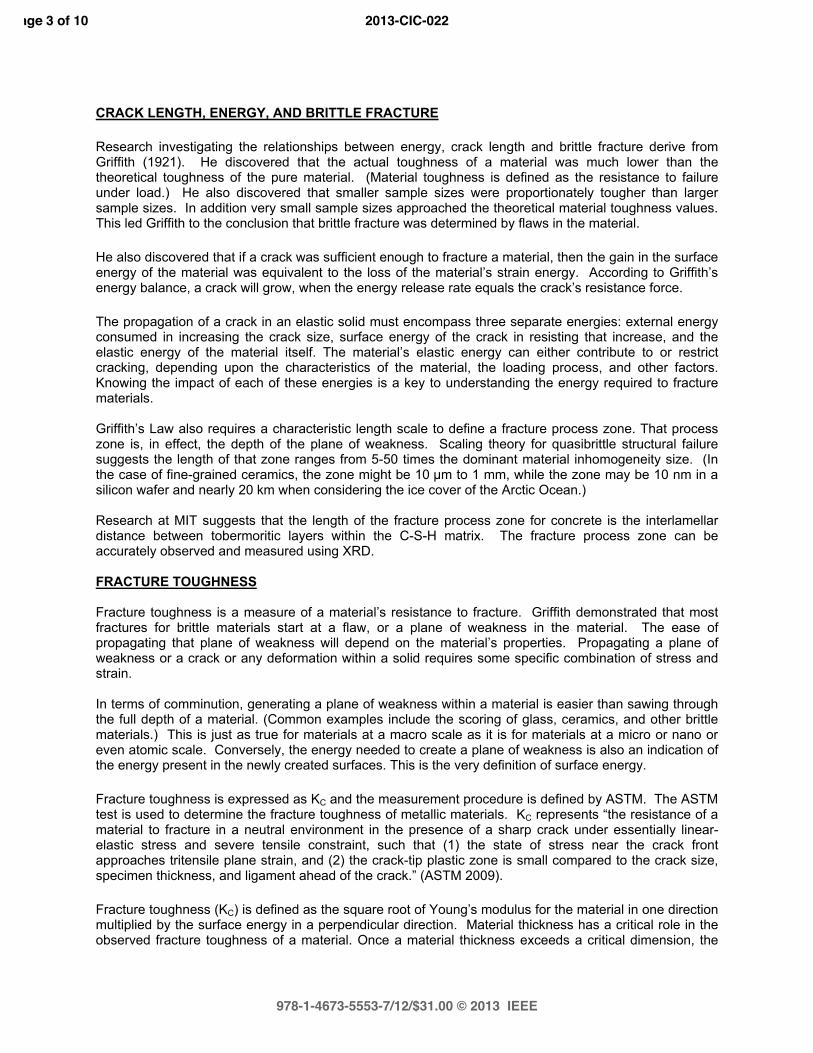
RESEARCH PROGRAM AND RESULTS Atomistic simulations were then used to determine the cohesive energy of all clinker phases. The simulations were validated by microscratching a variety of industrial clinker phases. The consideration of grinding as a fracture process is used to “determine the theoretical energy required to break clinker surfaces by grinding, and to link the fineness (specific surface) to the corresponding power consumption (grinding energy) based on atomistic simulations.” Given the validation of the theoretical predictions against experimental observations, MIT researchers have proven that the microscratch test can be used to develop fracture toughness values. The use of these fracture toughness values, in turn, can be used to determine the relative fracture strength of individual clinker phases. This is accomplished by using microscratch technology combined with pin point XRD analysis. Using these processes, MIT researchers determined that the fracture toughness values for belite are two to three times greater than the fracture toughness values for alite. Using Griffith’s Law, this difference in fracture toughness values between alite and belite corresponds to an increase in grinding energy of 4 to 9 times. Based on the use of cohesive energy density, the actual grinding energy is nearly twice the theoretical grinding energy. The scratch test data for an alite (tricalcium silicate) crystal is shown in figure 6. Note that the predicted fracture toughness KC is on the order of 4 MPa m-.5. The scratch test data for a belite (dicalcium silicate) crystal is shown in figure 7. Note that the predicted fracture toughness KC is on the order of 10 MPa m-.5.
Figure 6: Scratch test data for alite (C3S)
Page 7 of 10
978-1-4673-5553-7/12/$31.00 © 2013 IEEE
2013-CIC-022
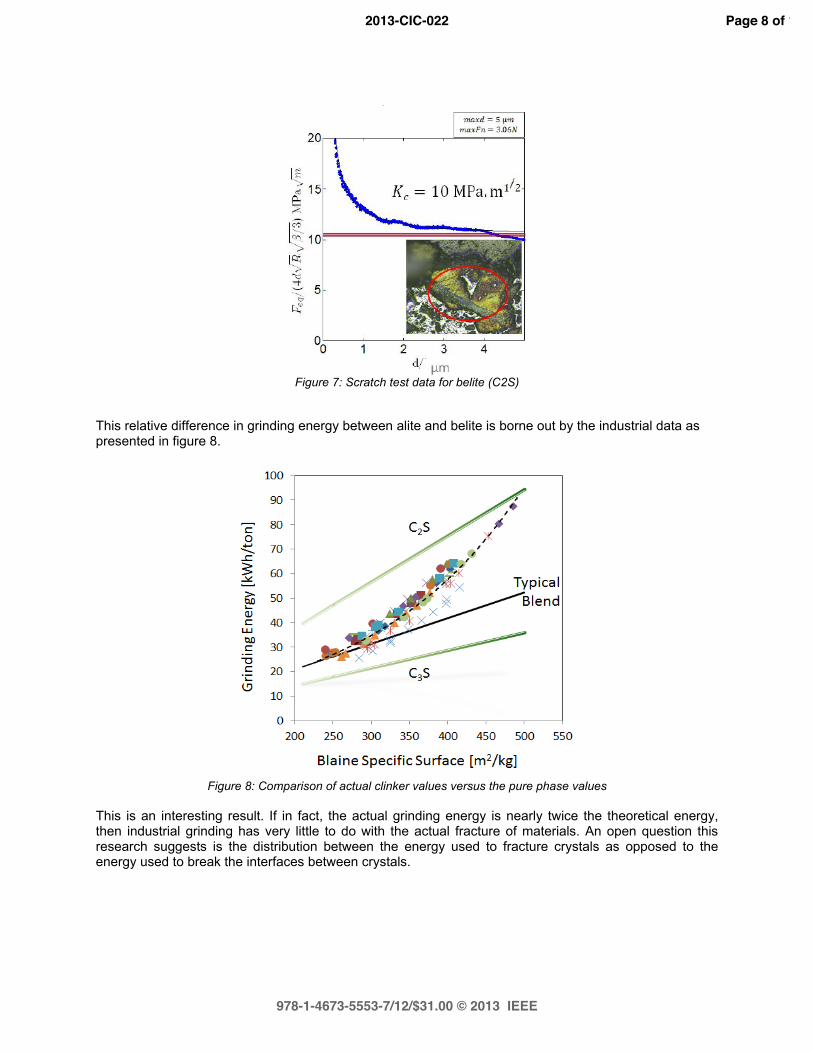
Figure 7: Scratch test data for belite (C2S)
This relative difference in grinding energy between alite and belite is borne out by the industrial data as presented in figure 8.
Figure 8: Comparison of actual clinker values versus the pure phase values
This is an interesting result. If in fact, the actual grinding energy is nearly twice the theoretical energy, then industrial grinding has very little to do with the actual fracture of materials. An open question this research suggests is the distribution between the energy used to fracture crystals as opposed to the energy used to break the interfaces between crystals.
Page 8 of 10
978-1-4673-5553-7/12/$31.00 © 2013 IEEE
2013-CIC-022

IMPACT AND APPLICATION OF RESULTS The results of this research have significant implications. A first order approach using linear elastic fracture mechanics allows us to equate fracture energy with the energy per unit of fracture surface. This in turn allows us to determine the theoretical specific energy required for grinding to a particular fineness. These theoretical values can be scaled up to assess existing and future grinding technologies. The ability to test individual phases in the lab should speed up the development of easier to grind cement clinkers. The reduction in pyroprocessing energy required to shift from a predominately alite composition to a predominately belite composition is approximately 15 to 20 percent. The savings in fuel energy must then be weighed against the net increase in grinding energy in determining the optimum levels of alite and belite in cement clinkers. Since grinding energy accounts for a significant percent of the overall energy usage for a cement plant, there are opportunities for real energy savings. Additionally, it’s clear that fracturing crystals is a losing proposition in terms of energy and efficiency. This suggests that modifying the interstitial clinker phases (C3A and C4AF) may be one approach to making clinker more friable or easier to grind. In effect, properly modified interstitial phases may act as perforations allowing significant reductions in grinding energy. CONCLUSIONS
This research should put a renewed emphasis on clinker phase crystal sizes (alite and belite) produced during pyroprocessing. Producing smaller crystals sizes could be a proactive approach to reduced energy consumption during the clinker grinding process, as fewer crystals would have to be broken. The most important crystal size to control would be the belite, however controlling alite sizes could also be beneficial. These saving could be further enhanced if combined with the easier to grind interstitial phases mentioned above. Another approach could be to increase the reactivity of the alite and belite, thus allowing the achievement of similar cement strengths with coarser particles, therefore requiring less grinding. It is expected that this work at MIT combined with the basic research they are doing on cement and clinker will open several avenues to improved cement performance with a lower energy requirement. This would allow the combined achievement of a better Portland cement with a smaller environmental footprint. REFERENCES
Akono, A. T., Reis, P.M. and Ulm, F.J., Scratching as a Fracture Process: From Butter to Steel, Physical Review Letters, Volume 106, pp. 204302-1-204302-4 2011. ASTM International, ASTM E399 - 09e2 Standard Test Method for Linear-Elastic Plane-Strain Fracture Toughness Ic of Metallic Materials, 2009. Bazant, Z.P., Scaling Theory for Quasibrittle Structural Failure, PNAS, Volume 101, No. 37, pp. 13400-13407. Bond, F.C., British Chemical Engineering, Vol. 6, 1961, p.378. Bond, F.C. and Wang, T.J. Transactions AIME, Vol. 87, 1950, p. 87. Bond, F.C. Transactions AIME, Volume 193, 1952, p. 484.
Page 9 of 10
978-1-4673-5553-7/12/$31.00 © 2013 IEEE
2013-CIC-022

Clinker Grinding at Breaking Point Concrete Sustainability Hub@MIT – Research Profile Letter – May 2011 ECRA European Cement Research Academy. Power consumption – an essential KPI for cement plants: Challenges in the reduction of the electrical energy consumption of cement plants. p. 3-4. Newsletter 1/2010. Griffith, A.A., The Phenomena of Rupture and Flow in Solids, Philosophical Transactions of the Royal Society of London, Vol. 221 (1921), 163-198. Hardgrove, R.M., Grindability of Coal. Trans. ASME, Fuels and Steam Power, 54 (1932), p 37–46. Hukki, R.T. Proposal for a solomonic settlement between the theories of von Rittinger, Kick, and Bond. Trans. AIME, 223, 1962. pp. 403–408. Kick, F. Das Gesetz der proportionalen Widerstande und seine anwendung felix. Leipzig, Germany. 1885. National Materials Advisory Board, Comminution and Energy Consumption, May 1981. NDT Resource Center. Fracture Toughness. http://www.ndt-ed.org/EducationResources/CommunityCollege/Materials/Mechanical/FractureToughness.htm accessed November 8, 2012. Rehbinder, P.A. and Kalinkovaskaya, N.A., Journal of Technical Physics (USSR), Vol. 2, 1932, pp. 726-755 (English translation). Von Rittinger, P., Lehrbuch der Aufbereitungskunde, Berlin, 1867.
Page 10 of 10
978-1-4673-5553-7/12/$31.00 © 2013 IEEE
2013-CIC-022