brazil green freight transport report world bank nlta...
TRANSCRIPT
1
Brazil Green Freight Transport Report World Bank NLTA: “Mainstreaming Green Trucks in Brazil”
1. Introduction
1. The World Bank initiated in FY11 a Non-Lending Technical Assistance (NLTA) with the Brazilian Government and key partners in the road freight sector entitled “Mainstreaming Green Trucks in Brazil”. This NLTA report was conceived as Phase 1 of a multi-phase effort with the ultimate goal of supporting the systematic promotion of energy-efficiency and emissions reduction from freight transport. This will be accomplished in part by assessing technologies and practices to enhance the performance of trucks. As such, this report builds on the findings and recommendations of the World Bank’s 2010 Logistics Report for Brazil1 and 2010 Low Carbon Study for Brazil2
2. The present work serves as a progress report on Phase 1 of the NLTA and as a concept note for Phase 2, which is being funded for FY12. Specifically, the focus of this report is to:
.
• Provide an update on the design and implementation of strategic pilot tests that are underway;
• Assess the range of initiatives active in Brazil aimed at reducing the energy intensity and environmental impact of freight transport;
• Identify building blocks towards a comprehensive Green Freight strategy in Brazil; and
• Identify an operational strategy for the Bank in this sector by leveraging existing activities.
1.1 Freight Transport: Fast Growth and High Emissions
3. The freight sector is a critical and large part of the Brazilian economy. Freight is not only an essential and integral element of a modern industrialized economy, it is also an important source of employment, entrepreneurship and innovation. Data suggest that freight accounted for about 6.5 percent of Brazil’s GDP in 2006. The Annual IBGE (Brazilian Institute of Geography and Statistics) Survey of Service Sector estimated that the transport industry generated US$100 billion in net operating revenue in 2008. Data from the National Surface Transport Regulatory Agency (ANTT) estimates that trucking comprises more than 574,000 businesses, among them nearly half million independent owner-operators, 87 thousand companies and 256 cooperatives.
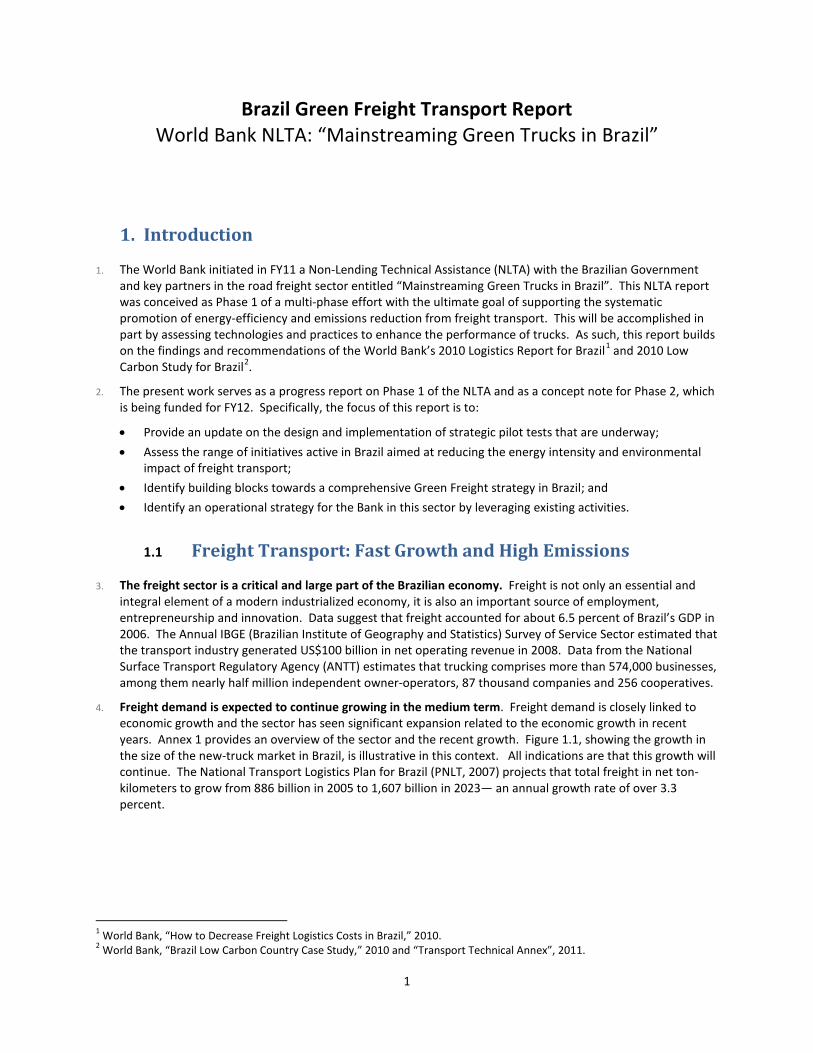
4. Freight demand is expected to continue growing in the medium term. Freight demand is closely linked to economic growth and the sector has seen significant expansion related to the economic growth in recent years. Annex 1 provides an overview of the sector and the recent growth. Figure 1.1, showing the growth in the size of the new-truck market in Brazil, is illustrative in this context. All indications are that this growth will continue. The National Transport Logistics Plan for Brazil (PNLT, 2007) projects that total freight in net ton-kilometers to grow from 886 billion in 2005 to 1,607 billion in 2023— an annual growth rate of over 3.3 percent.
1 World Bank, “How to Decrease Freight Logistics Costs in Brazil,” 2010. 2 World Bank, “Brazil Low Carbon Country Case Study,” 2010 and “Transport Technical Annex”, 2011.
2
Figure 1.1 Production and Sales of New Trucks in Brazil
Source: Anfavea, 2008
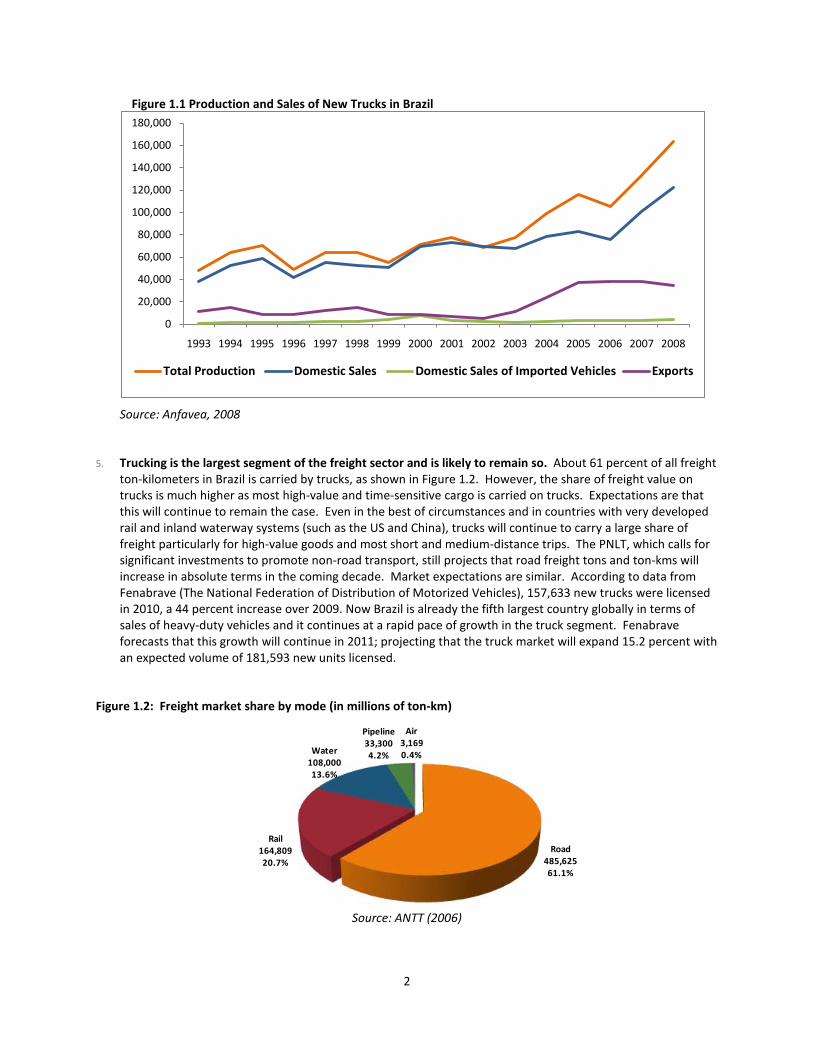
5. Trucking is the largest segment of the freight sector and is likely to remain so. About 61 percent of all freight ton-kilometers in Brazil is carried by trucks, as shown in Figure 1.2. However, the share of freight value on trucks is much higher as most high-value and time-sensitive cargo is carried on trucks. Expectations are that this will continue to remain the case. Even in the best of circumstances and in countries with very developed rail and inland waterway systems (such as the US and China), trucks will continue to carry a large share of freight particularly for high-value goods and most short and medium-distance trips. The PNLT, which calls for significant investments to promote non-road transport, still projects that road freight tons and ton-kms will increase in absolute terms in the coming decade. Market expectations are similar. According to data from Fenabrave (The National Federation of Distribution of Motorized Vehicles), 157,633 new trucks were licensed in 2010, a 44 percent increase over 2009. Now Brazil is already the fifth largest country globally in terms of sales of heavy-duty vehicles and it continues at a rapid pace of growth in the truck segment. Fenabrave forecasts that this growth will continue in 2011; projecting that the truck market will expand 15.2 percent with an expected volume of 181,593 new units licensed.
Figure 1.2: Freight market share by mode (in millions of ton-km)
Source: ANTT (2006)
0
20,000
40,000
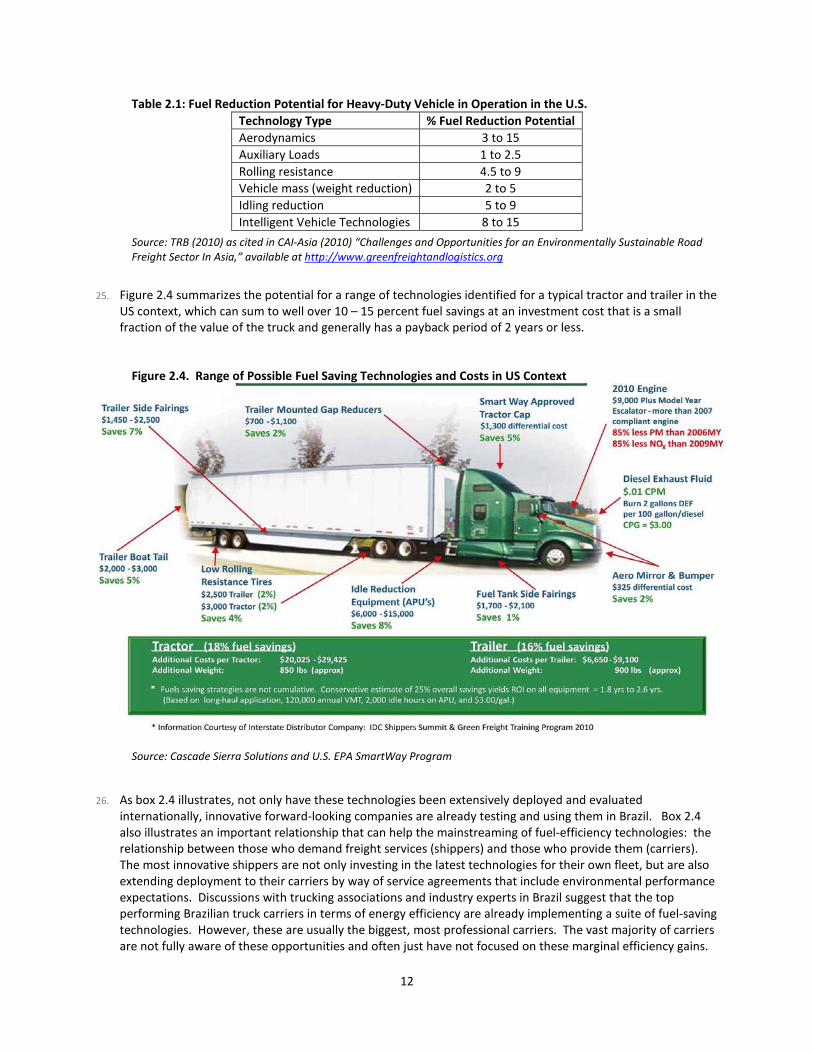
60,000
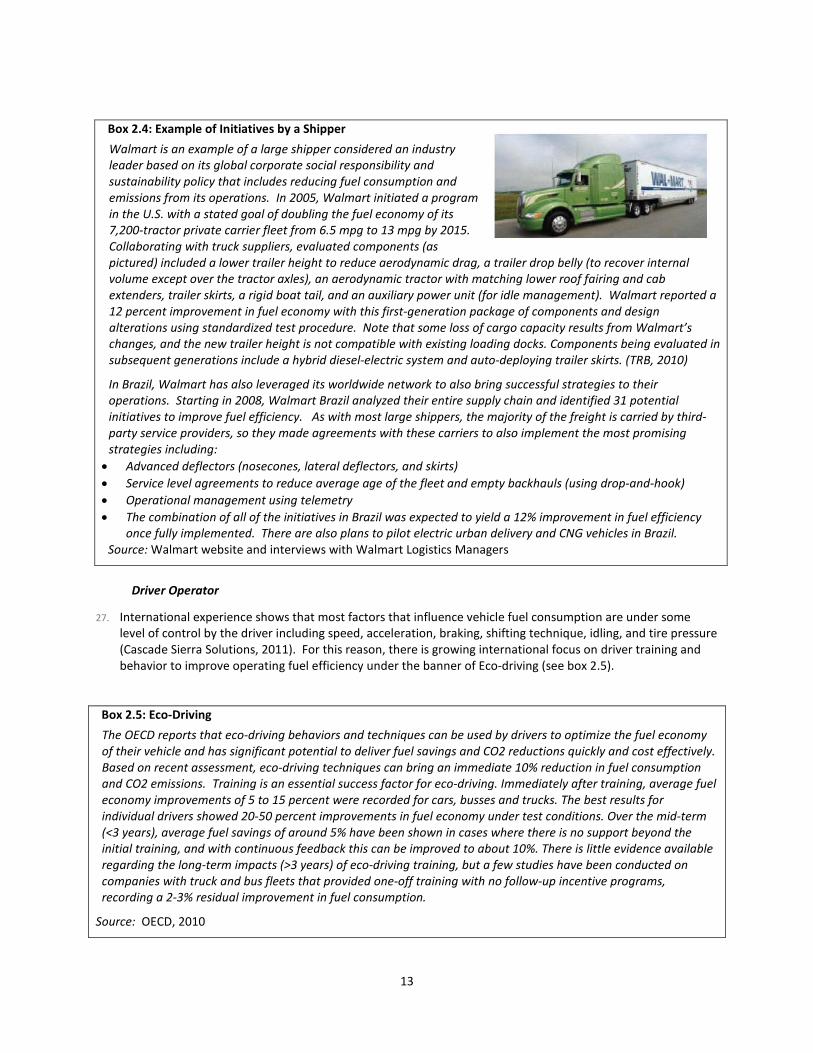
80,000
100,000
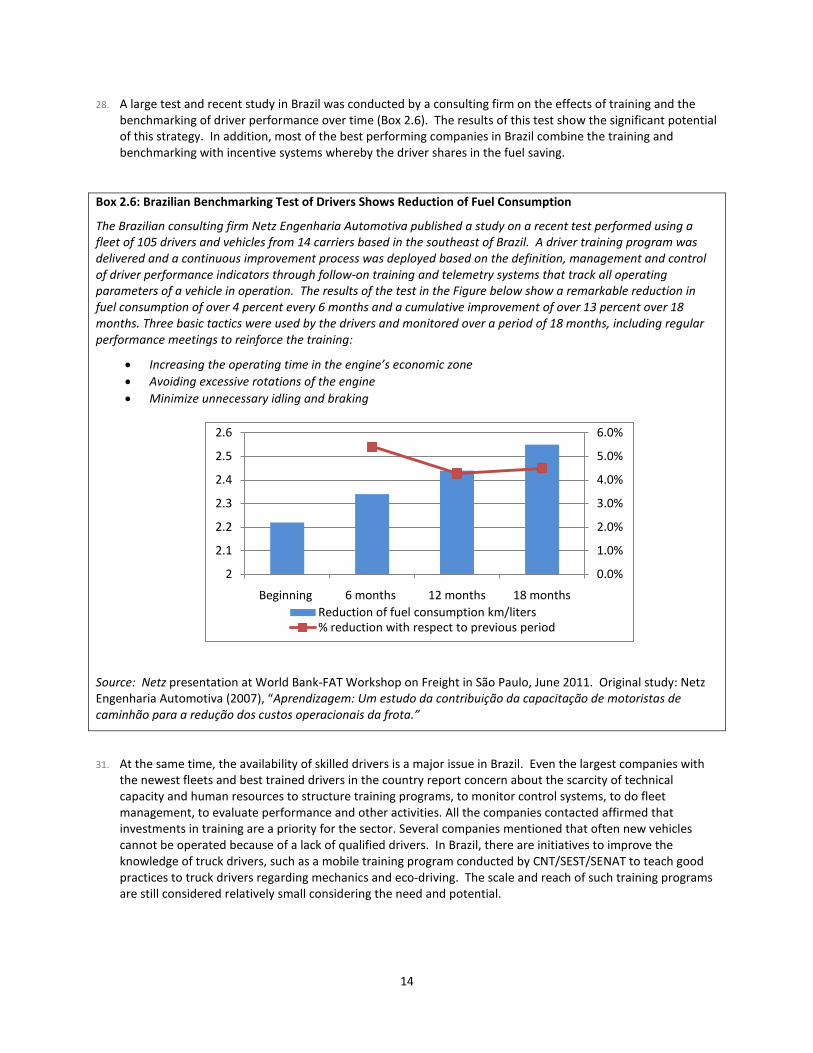
120,000
140,000
160,000
180,000
1993 1994 1995 1996 1997 1998 1999 2000 2001 2002 2003 2004 2005 2006 2007 2008
Total Production Domestic Sales Domestic Sales of Imported Vehicles Exports
Road485,62561.1%
Rail164,80920.7%
Water108,00013.6%
Pipeline33,3004.2%
Air3,1690.4%
3
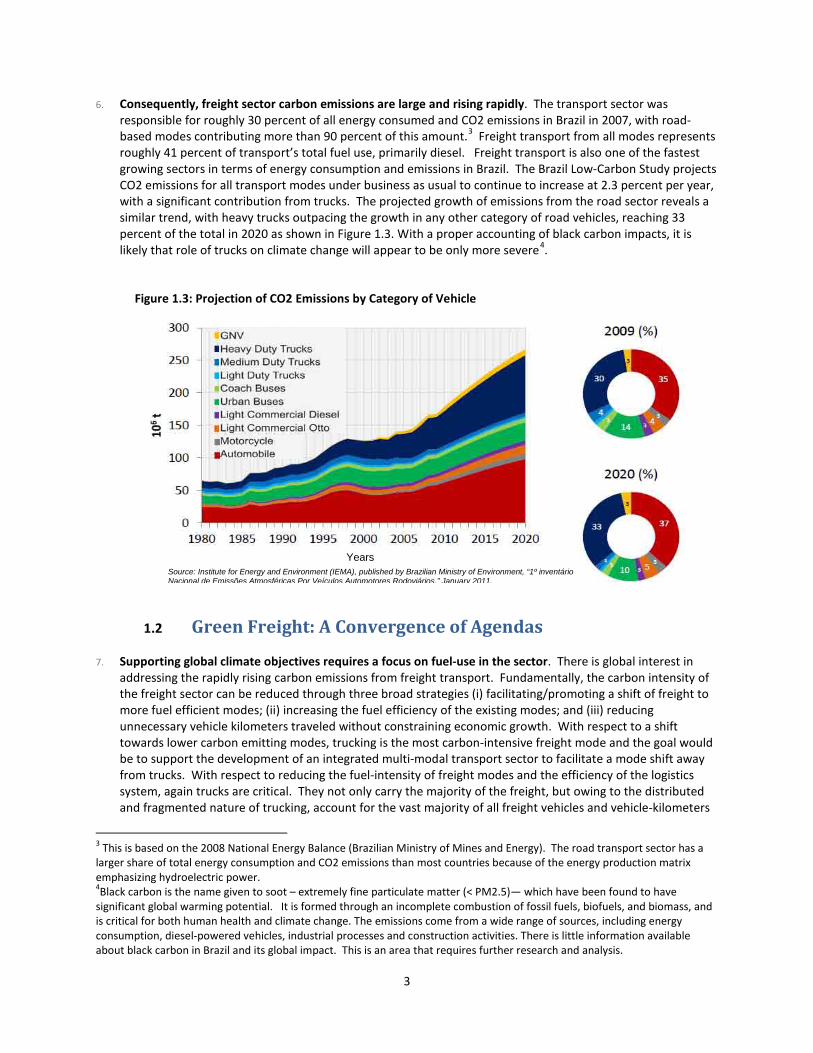
6. Consequently, freight sector carbon emissions are large and rising rapidly. The transport sector was responsible for roughly 30 percent of all energy consumed and CO2 emissions in Brazil in 2007, with road-based modes contributing more than 90 percent of this amount.3 Freight transport from all modes represents roughly 41 percent of transport’s total fuel use, primarily diesel. Freight transport is also one of the fastest growing sectors in terms of energy consumption and emissions in Brazil. The Brazil Low-Carbon Study projects CO2 emissions for all transport modes under business as usual to continue to increase at 2.3 percent per year, with a significant contribution from trucks. The projected growth of emissions from the road sector reveals a similar trend, with heavy trucks outpacing the growth in any other category of road vehicles, reaching 33 percent of the total in 2020 as shown in Figure 1.3. With a proper accounting of black carbon impacts, it is likely that role of trucks on climate change will appear to be only more severe4
.
Figure 1.3: Projection of CO2 Emissions by Category of Vehicle
1.2 Green Freight: A Convergence of Agendas
7. Supporting global climate objectives requires a focus on fuel-use in the sector. There is global interest in addressing the rapidly rising carbon emissions from freight transport. Fundamentally, the carbon intensity of the freight sector can be reduced through three broad strategies (i) facilitating/promoting a shift of freight to more fuel efficient modes; (ii) increasing the fuel efficiency of the existing modes; and (iii) reducing unnecessary vehicle kilometers traveled without constraining economic growth. With respect to a shift towards lower carbon emitting modes, trucking is the most carbon-intensive freight mode and the goal would be to support the development of an integrated multi-modal transport sector to facilitate a mode shift away from trucks. With respect to reducing the fuel-intensity of freight modes and the efficiency of the logistics system, again trucks are critical. They not only carry the majority of the freight, but owing to the distributed and fragmented nature of trucking, account for the vast majority of all freight vehicles and vehicle-kilometers
3 This is based on the 2008 National Energy Balance (Brazilian Ministry of Mines and Energy). The road transport sector has a larger share of total energy consumption and CO2 emissions than most countries because of the energy production matrix emphasizing hydroelectric power. 4Black carbon is the name given to soot – extremely fine particulate matter (< PM2.5)— which have been found to have significant global warming potential. It is formed through an incomplete combustion of fossil fuels, biofuels, and biomass, and is critical for both human health and climate change. The emissions come from a wide range of sources, including energy consumption, diesel-powered vehicles, industrial processes and construction activities. There is little information available about black carbon in Brazil and its global impact. This is an area that requires further research and analysis.
Source: Institute for Energy and Environment (IEMA), published by Brazilian Ministry of Environment, “1º inventário Nacional de Emissões Atmosféricas Por Veículos Automotores Rodoviários,” January 2011.
Years
4
(with the exception of air transport). In this context, the challenge is to identify and deploy strategies that reduce fuel-use in the trucking sector.
8. For freight, there is a strong convergence between the low-carbon, environmental and cost-efficiency agendas. The imperative to reduce the carbon footprint of Brazil’s freight sector is important in itself. However, the objectives highlighted above are closely related to business, local, and national economic and environmental exigencies. In particular:
a. An integrated multi-modal transport system which facilitates a shift from trucking is also an important objective for efficiency and road safety. When available and competitive, modes such as rail and waterway can often be significantly more cost-effective than trucking. In certain contexts, trucks can also account for a disproportionate share of serious road accidents that cause injuries, fatalities and congestion. For these reasons and independent of carbon concerns, there is considerable pressure in Brazil to develop a multi-modal system in order to reduce logistics costs and improve competitiveness. Consequently, the PNLT calls for massive investments in the road, rail, waterway, pipeline and air networks and services to improve cost efficiency while promoting a shift away from road-based modes.
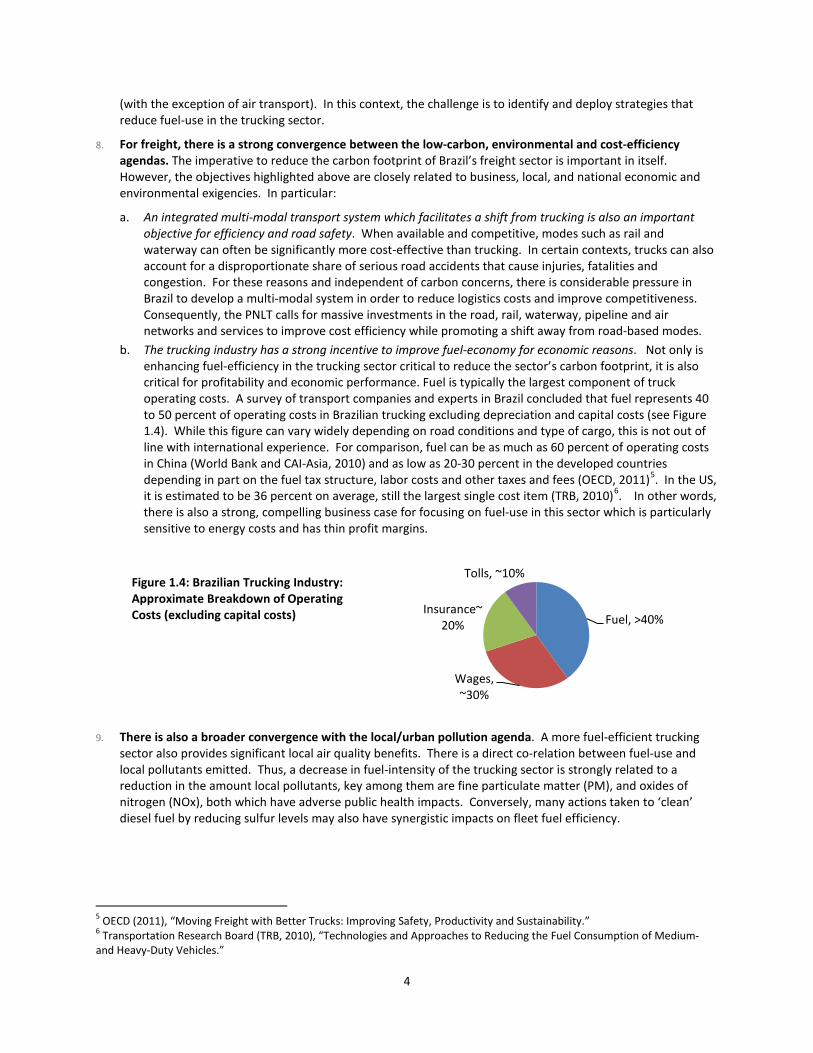
b. The trucking industry has a strong incentive to improve fuel-economy for economic reasons. Not only is enhancing fuel-efficiency in the trucking sector critical to reduce the sector’s carbon footprint, it is also critical for profitability and economic performance. Fuel is typically the largest component of truck operating costs. A survey of transport companies and experts in Brazil concluded that fuel represents 40 to 50 percent of operating costs in Brazilian trucking excluding depreciation and capital costs (see Figure 1.4). While this figure can vary widely depending on road conditions and type of cargo, this is not out of line with international experience. For comparison, fuel can be as much as 60 percent of operating costs in China (World Bank and CAI-Asia, 2010) and as low as 20-30 percent in the developed countries depending in part on the fuel tax structure, labor costs and other taxes and fees (OECD, 2011)5. In the US, it is estimated to be 36 percent on average, still the largest single cost item (TRB, 2010)6
. In other words, there is also a strong, compelling business case for focusing on fuel-use in this sector which is particularly sensitive to energy costs and has thin profit margins.
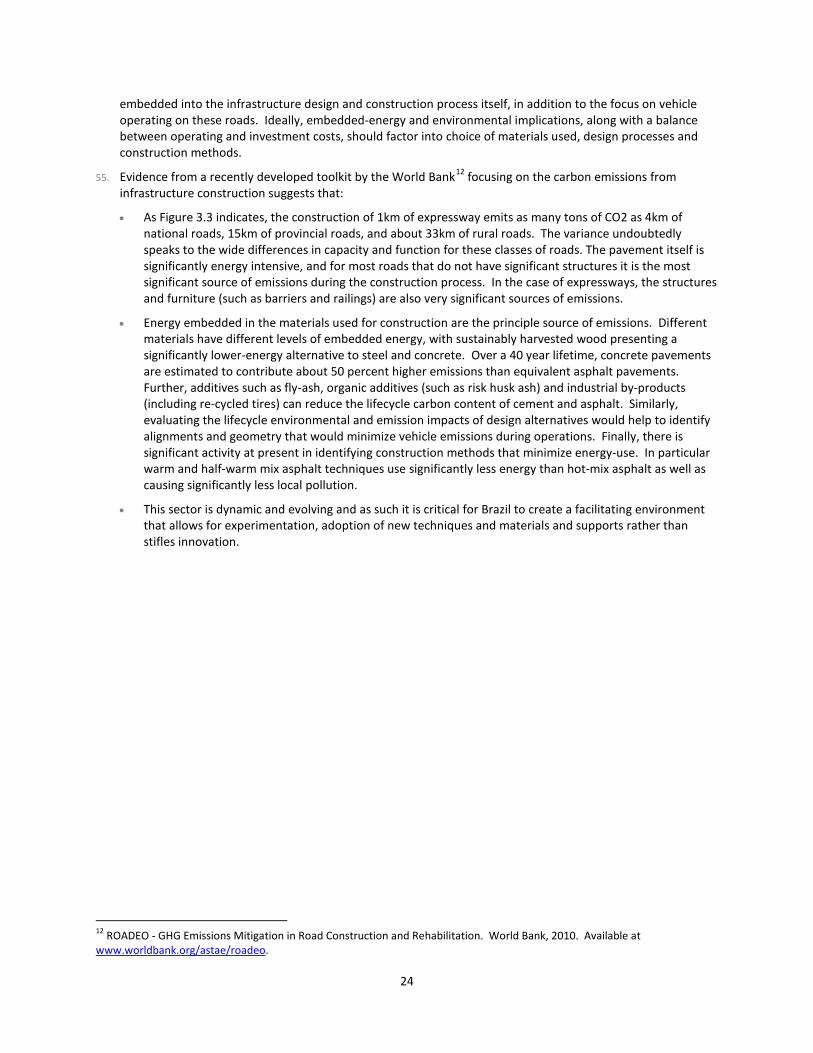
Figure 1.4: Brazilian Trucking Industry: Approximate Breakdown of Operating Costs (excluding capital costs)
9. There is also a broader convergence with the local/urban pollution agenda. A more fuel-efficient trucking sector also provides significant local air quality benefits. There is a direct co-relation between fuel-use and local pollutants emitted. Thus, a decrease in fuel-intensity of the trucking sector is strongly related to a reduction in the amount local pollutants, key among them are fine particulate matter (PM), and oxides of nitrogen (NOx), both which have adverse public health impacts. Conversely, many actions taken to ‘clean’ diesel fuel by reducing sulfur levels may also have synergistic impacts on fleet fuel efficiency.
5 OECD (2011), “Moving Freight with Better Trucks: Improving Safety, Productivity and Sustainability.” 6 Transportation Research Board (TRB, 2010), “Technologies and Approaches to Reducing the Fuel Consumption of Medium- and Heavy-Duty Vehicles.”
Fuel, >40%
Wages, ~30%
Insurance~20%
Tolls, ~10%
5
1.3 Role of This Report
10. This report focuses on near-term opportunities to green Brazil’s freight system. The primary focus of this work is on opportunities to reduce the carbon-intensity of the sector, though as noted there are significant concomitant benefits relating to local environmental performance, efficiency and safety of the logistics system, and profitability in the trucking sector. Given the convergence between global and local agendas discussed above, it is not unexpected that many initiatives that have the potential to reduce the carbon intensity of Brazil’s trucking sector are being considered for a different reason, including by various levels of government to enhance efficiency, safety, local pollution abatement, and by truckers to enhance profitability.
11. A comprehensive review of initiatives with the potential to improve the carbon profile is undertaken with a specific focus on the possibilities to improve the fuel-efficiency of the in-use fleet. To that end, the report reviews the range of technological and management opportunities to enhance the performance of the existing fleet and identifies opportunities to increase visibility and awareness of particularly promising solutions. As part of this work, two separate pilot tests of options that have the potential to improve the fuel-efficiency of in-use fleets have been initiated in Brazil.
12. The structure of this report. The remainder of this report is organized into four sections. Section 2 is an assessment of the current state and trends for the Brazilian truck fleet and the near-term opportunities for improvement with a focus on three key strategies: vehicle technologies, drivers, and management and maintenance. This assessment is used to design strategic pilot tests as a key element of a mainstreaming strategy for “Green Trucks” in Brazil. Section 3 is a broader assessment of freight and logistics strategies and existing initiatives in Brazil used to suggest the building blocks for a more comprehensive “Green Freight” strategy in Section 4. Finally, Section 5 suggests an operational agenda for the World Bank going forward to capitalize on the potential to accelerate the "greening" of the road freight sector in Brazil.
13. The following annexes provide more detailed technical information on the following key topics and activities:
• Annex 1. Sector Overview • Annex 2. Assessment of Green Truck Technologies • Annex 3. Summary of Private Sector Initiatives in Brazil • Annex 4. Pilot Test Design Protocol • Annex 5. Partnerships and Acknowledgements
6
2. Assessment of Green Truck Initiatives
14. One of the objectives of the first phase of the NLTA was to identify promising vehicle technologies and good practices for the road freight sector that could be verified or tested. The approach included an extensive set of interviews, meetings, and workshops with experts and industry representatives and a review of literature about the state-of-practice and state-of-the-art in Brazil. The approach also included an analysis of the market structure in Brazil to highlight opportunities to accelerate the modernization of the fleet and sector.
15. This review found that roughly half of the current fleet constitutes trucks that would benefit from technologies and management practices to enhance fuel efficiency. The review also identified the state-of-the-art with respect to technologies, behaviors and management practices with the potential to improve fuel efficiency of in-use fleets. Examples of high-performing firms in Brazil – shippers and carriers – that are already acting on these opportunities to save fuel costs, increase productivity, and reduce their carbon footprint were also identified. Still, the evidence suggests that despite paying for themselves in fuel savings, certain technologies and practices are not commonly used in Brazil today. Barriers relate to awareness, credibility, inadequate managerial focus, and in some cases financing. In response, the strategy was to raise awareness of ‘low-hanging fruit’ (i.e. the most promising, cost-effective and credible fuel-saving options) using two pilot tests that have been commissioned as part of this NLTA to test the efficacy in real-world settings.
• Section 2.1 characterizes the Brazilian truck fleet and identifies key issues with each segment.
• Section 2.2 describes the universe of possibilities to enhance the fuel efficiency of in-use trucking fleets and provides examples of their successful application in Brazil.
• Section 2.3 describes the pilot tests undertaken as part of this study.
2.1 Brazilian Fleet Characteristics
16. The Brazilian National Registry of Road Freight Transporters (RNTRC) recorded a population of nearly 1.5 million trucks in 2010. All companies and persons (registered as a pessoa jurídica) that operate heavy-duty vehicles commercially for road freight transport by law must register with the RNTRC. The RNTRC also shows a very diverse sector in terms of the following characteristics (see Annex 1 for a more detailed overview of the Brazilian trucking sector):
• Ownership structure: Carriers range in size from individual owner-operators, to medium-sized cooperatives, to large professional trucking companies. The average trucking company has about 9 vehicles; the average cooperative has over 40 vehicles; and the vast majority of independent owner-operators own only one vehicle. In 2008, about 20 percent of the truck fleet is owned by large firms (with more than 100 vehicles).
• Operational model. There are operators that focus exclusively on urban markets and others that focus on long-distance markets. Organizationally, some shippers use in-house fleets, while most contract freight to outside carriers. There are more than 87,000 private companies actively operating trucks either as shippers or carriers in Brazil.
• Fleet age: The average age of the registered truck fleet in 2010 is over 13 years with the oldest trucks belonging to owner-operators. The average fleet age is about 8, 14 and 19 years for companies, cooperative and owner-operators, respectively. The age of the vehicle has an important implication on the type of engine and emissions control technology installed (see box 2.1).
• Type of vehicles: The fleet includes tractor-trailers, fixed bed, bulk goods, and special goods vehicles such as tankers. The tare weight of a simple fixed-bed truck can range from 8 to 29 tons and as high as 74 tons for specially-authorized tractor-trailer combinations.
• Geographical distribution: The vast majority of trucks are registered in the south and southeastern areas of the country where a majority of the economic activity is based, but may circulate throughout the country on urban and interurban roads of varying quality.

7
Box 2.1. Regulations controlling Engine and emissions control technologies
Engine and emissions control technology in Brazil are regulated, as in most countries, with a focus on local air pollution impacts. The Brazilian standard is known as Proconve (National Program for Vehicle Air Pollution Control). The implementation schedule for Proconve is summarized in the table below. The phases of Proconve from P1 to P7 correspond to European heavy-duty vehicle standards from EURO 0 to 5 with a 3 to 5 year lag in the implementation schedule.
Table. Implementation of Proconve for Heavy-Duty Vehicles in Brazil Implementation
Comments on Technology improvements Phase Years Proconve Phase 1 1987 – Urban buses
1989 – 100%
Proconve Phase 2 (EURO 0) 1994 – 80% 1996 – 100%
Proconve Phase 3 (EURO 1) 1994 – Urban buses 1996 – 80% 2000 – 100%
Improvements in fuel injection systems and combustion chambers
Proconve Phase 4 (EURO 2) 1998 – Urban buses 2000 – 80% 2002 – 100%
Turbocharged engines with intercooler. Mechanical injection pump with injection pressure up to 1000bar
Proconve Phase 5 (EURO 3) 2004 – Urban buses 2005 – 40% 2006 – 100%
Engines with fuel injection and injection pressure up to 1500bar
Proconve Phase 6 (EURO 4) 2009 – 100% Advanced exhaust treatment systems Proconve Phase 7 (EURO 5) 2012 – 100% Requires low-sulfur diesel
Source: Author’s compilation from ANFAVEA and Proconve (Ministry of Environment) websites
17. The distribution of trucks in operation by engine/emissions technology and type of ownership according to the 2009 RNTRC is shown in Figure 2.1. As illustrated, the Brazilian truck fleet can be characterized into three basic segments for the purpose of analyzing strategies to accelerate modernization as describe below.
Figure 2.1: Number of Trucks by Proconve Phase and Type of Ownership
Source: Compiled from RNTRC, 2009 available from ANTT
0
100,000
200,000
300,000
400,000
500,000
600,000
700,000
800,000
P1 and Older P2 (Euro 0) P3 (EURO 1) P4 (EURO 2) P5 (EURO 3) P6 (EURO 4)
597,219
48,755 71,668 98,18924,478
150,000
125,834
30,31663,171
186,592
108,075
2,159
392524
1,182
606
Cooperatives
Companies
Owner-Operators
2. Typical Trucks in Operation 3. Newlicensed trucks
1. Oldest Trucks
8
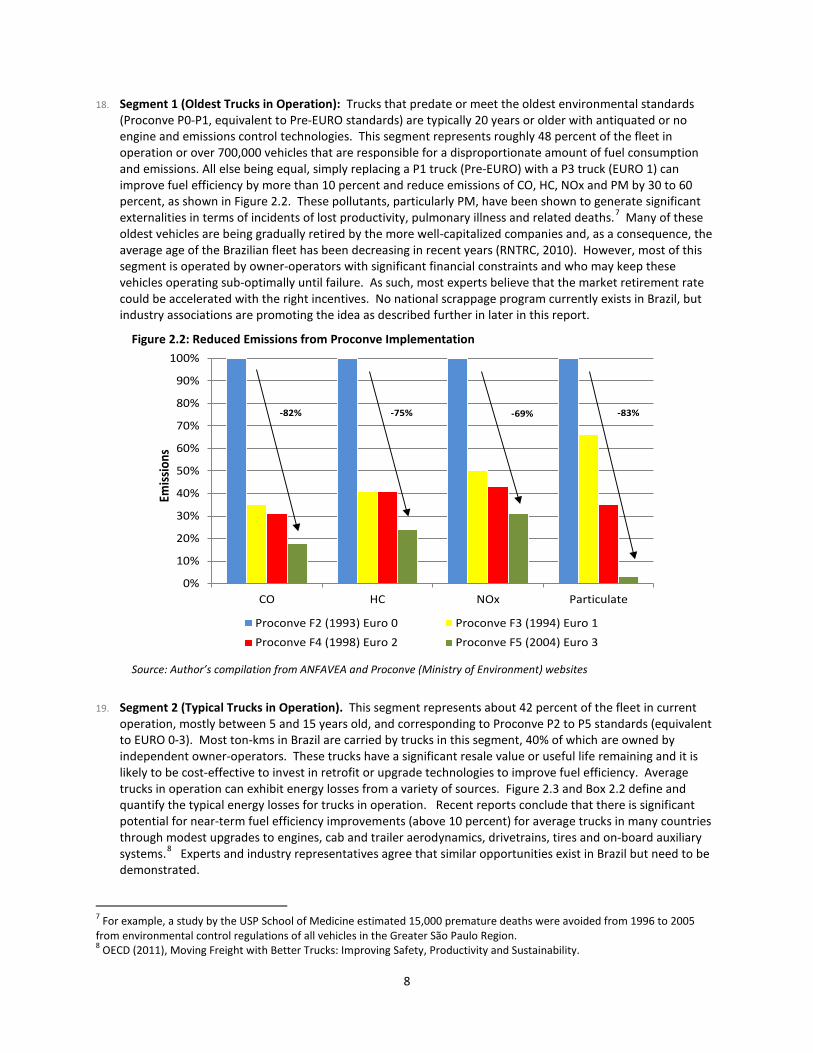
18. Segment 1 (Oldest Trucks in Operation): Trucks that predate or meet the oldest environmental standards (Proconve P0-P1, equivalent to Pre-EURO standards) are typically 20 years or older with antiquated or no engine and emissions control technologies. This segment represents roughly 48 percent of the fleet in operation or over 700,000 vehicles that are responsible for a disproportionate amount of fuel consumption and emissions. All else being equal, simply replacing a P1 truck (Pre-EURO) with a P3 truck (EURO 1) can improve fuel efficiency by more than 10 percent and reduce emissions of CO, HC, NOx and PM by 30 to 60 percent, as shown in Figure 2.2. These pollutants, particularly PM, have been shown to generate significant externalities in terms of incidents of lost productivity, pulmonary illness and related deaths.7
Figure 2.2: Reduced Emissions from Proconve Implementation
Many of these oldest vehicles are being gradually retired by the more well-capitalized companies and, as a consequence, the average age of the Brazilian fleet has been decreasing in recent years (RNTRC, 2010). However, most of this segment is operated by owner-operators with significant financial constraints and who may keep these vehicles operating sub-optimally until failure. As such, most experts believe that the market retirement rate could be accelerated with the right incentives. No national scrappage program currently exists in Brazil, but industry associations are promoting the idea as described further in later in this report.
Source: Author’s compilation from ANFAVEA and Proconve (Ministry of Environment) websites
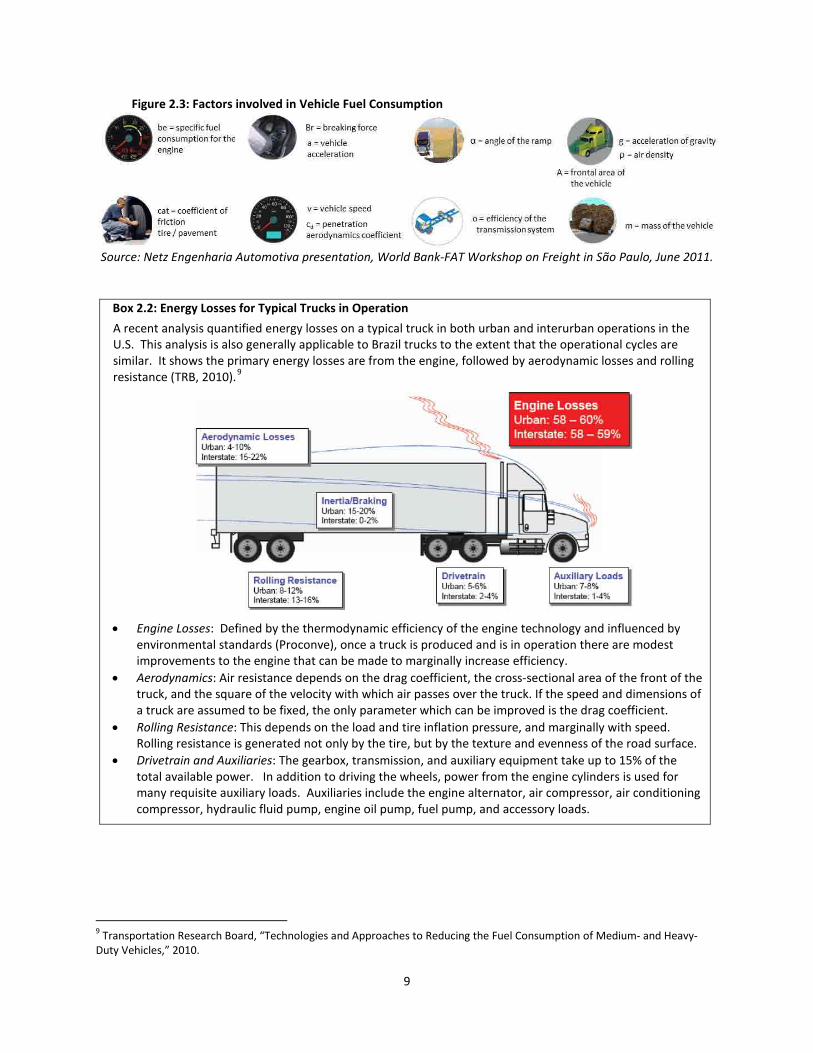
19. Segment 2 (Typical Trucks in Operation). This segment represents about 42 percent of the fleet in current operation, mostly between 5 and 15 years old, and corresponding to Proconve P2 to P5 standards (equivalent to EURO 0-3). Most ton-kms in Brazil are carried by trucks in this segment, 40% of which are owned by independent owner-operators. These trucks have a significant resale value or useful life remaining and it is likely to be cost-effective to invest in retrofit or upgrade technologies to improve fuel efficiency. Average trucks in operation can exhibit energy losses from a variety of sources. Figure 2.3 and Box 2.2 define and quantify the typical energy losses for trucks in operation. Recent reports conclude that there is significant potential for near-term fuel efficiency improvements (above 10 percent) for average trucks in many countries through modest upgrades to engines, cab and trailer aerodynamics, drivetrains, tires and on-board auxiliary systems.8
7 For example, a study by the USP School of Medicine estimated 15,000 premature deaths were avoided from 1996 to 2005 from environmental control regulations of all vehicles in the Greater São Paulo Region.
Experts and industry representatives agree that similar opportunities exist in Brazil but need to be demonstrated.
8 OECD (2011), Moving Freight with Better Trucks: Improving Safety, Productivity and Sustainability.
0%
10%
20%
30%
40%
50%
60%
70%
80%
90%
100%
CO HC NOx Particulate
Emis
sion
s
Proconve F2 (1993) Euro 0 Proconve F3 (1994) Euro 1
Proconve F4 (1998) Euro 2 Proconve F5 (2004) Euro 3
-82% -75% -69% -83%
9
Figure 2.3: Factors involved in Vehicle Fuel Consumption
Source: Netz Engenharia Automotiva presentation, World Bank-FAT Workshop on Freight in São Paulo, June 2011.
Box 2.2: Energy Losses for Typical Trucks in Operation
A recent analysis quantified energy losses on a typical truck in both urban and interurban operations in the U.S. This analysis is also generally applicable to Brazil trucks to the extent that the operational cycles are similar. It shows the primary energy losses are from the engine, followed by aerodynamic losses and rolling resistance (TRB, 2010).9
• Engine Losses: Defined by the thermodynamic efficiency of the engine technology and influenced by environmental standards (Proconve), once a truck is produced and is in operation there are modest improvements to the engine that can be made to marginally increase efficiency.
• Aerodynamics: Air resistance depends on the drag coefficient, the cross-sectional area of the front of the truck, and the square of the velocity with which air passes over the truck. If the speed and dimensions of a truck are assumed to be fixed, the only parameter which can be improved is the drag coefficient.
• Rolling Resistance: This depends on the load and tire inflation pressure, and marginally with speed. Rolling resistance is generated not only by the tire, but by the texture and evenness of the road surface.
• Drivetrain and Auxiliaries: The gearbox, transmission, and auxiliary equipment take up to 15% of the total available power. In addition to driving the wheels, power from the engine cylinders is used for many requisite auxiliary loads. Auxiliaries include the engine alternator, air compressor, air conditioning compressor, hydraulic fluid pump, engine oil pump, fuel pump, and accessory loads.
9 Transportation Research Board, “Technologies and Approaches to Reducing the Fuel Consumption of Medium- and Heavy-Duty Vehicles,” 2010.
10
20. Segment 3 (New Trucks). Fuel efficiency for new heavy-duty vehicles has historically improved at a rate of around 1 percent per year in OECD countries.10
21. Therefore, accelerating the turnover of the Brazilian fleet with newer trucks can itself improve the average fleet fuel efficiency and emissions performance of the sector by virtue of the engine and related technologies. The key issue is how to accelerate this process in a fleet that is owned by a mix of companies, cooperatives, and owner-operators with widely varying capacity in terms of capital, performance and operational know-how. The average prices of the best selling new trucks in Brazil are presented in Annex 1.
Fuel consumption for new trucks in Europe and North America has decreased over the past 30 years from about 50 liters/100 km to 30-35 liters/100 km, while the engine power has doubled from about 180 kW to 360 kW (OECD, 2011). Although Proconve 5 is the environmental standard still in effect currently, most new truck sold in Brazil since 2009 meet Proconve 6 (EURO 4 equivalent). Proconve 7 (EURO 5 equivalent) is to be implemented in 2012 and will require low-sulfur diesel (below 50 parts per million). Considering the significant lag in implementation of Proconve in relation to equivalent standards in developed countries, this turnover improvement has not yet been fully realized in Brazil.
22. Another key question is how to accelerate the penetration of the latest technologies in new vehicle purchases. The engines of modern trucks sold in Brazil have relatively high thermodynamic efficiency, but it may be possible to decrease fuel consumption further by incentivizing the latest technologies, reducing aerodynamic drag, reducing rolling resistance, and improving the efficiency of auxiliary systems. Therefore, after-treatment modifications or upgrades may still be cost effective to improve fuel efficiency of new trucks. The United States has successfully used a partnership with manufacturers and technology vendors to move the fuel efficiency frontier of new trucks as described in box 2.3. Another important consideration is the proper maintenance and operational management of the fleet to maximize the potential of newer trucks, which is further described in the following sections.
10 This trend is likely continue though there has been a temporary drop-off in response to mandated NOx and PM emission controls involving technologies that increase fuel consumption slightly.

11
Box 2.3. U.S. 21st Century Truck Partnership In the late 1990s, the U.S. government defined ambitious goals for new trucks in five critical areas to reduce fuel usage and emissions while increasing heavy vehicle safety. The Partnership supported millions of dollars in research, development and demonstration that enabled the achievement of most of the following goals by 2012 with commercially-viable products and systems for new trucks: • Engine Systems: combination of prototype fuel, engine, and emissions after-treatment equipment to improve
energy efficiency by 20% and displace petroleum fuels by 5% by 2010. • Heavy-Duty Hybrid-electric propulsion: demonstrate a vehicle that achieves a 60% improvement in fuel economy
on a representative urban driving cycle while meeting regulated emissions levels and durability parameters. • Reducing parasitic losses (which account for 40% of the total fuel energy used to move a heavy-duty vehicle) by
up to 50% by focusing on aerodynamic drag resistance, rolling resistance, drivetrain losses, lightweight material and manufacturing processes, and auxiliary load losses. The following targets were established: 20% reduction in aerodynamic drag by designing and deploying boat tailings, collapsible roof lines, side and
underbody skirts, tractor-trailer interfaces, and deflectors resulting in theoretical fuel savings of about 10%. 40% reduction in rolling resistance or approximately a 15% improvement in fuel efficiency by introducing
breakthroughs in material dissipation properties, tire construction, and wear and traction optimization are needed to improve rolling resistance. Lightweight wheels can give additional payload benefits.
30% reduction in the remaining driveline losses, which would yield 1.5% fuel savings. Automated manual transmissions with 12-16 gears are standard today and replacing former unsynchronized transmissions.
50% reduction in the energy required by auxiliaries to yield fuel savings of 1-2%. Electrification of most components would reduce consumption by eliminating the energy losses from mechanical power (belts), and could be powered from energy recovery systems, solar cells or other zero emission sources.
• Idle Reduction: reduce fuel usage and emissions from idling heavy vehicles by more than 85% by demonstrating auxiliary power unit (APU) technologies, onboard and truck-stop (stationary) electrification technologies.
• Safety: Contribute to reducing truck related fatalities by 50% and truck related injuries by 20% through the development and implementation of technologies in crash/rollover protection, braking, visibility enhancement and safety of tires.
Source: Author’s compilation from U.S. Department of Energy website
2.2 Assessment of Technologies and Practices
23. A primary focus of this work was to identify near-term opportunities to enhance the fuel-efficiency of Brazil’s in-use truck fleet. Towards that end, an extensive review of potential technologies, behaviors and management practices was undertaken. To ensure relevance to the Brazilian context, technologies and good practices already successfully in use within Brazil were prioritized. The assessment covers three key areas: (1) Vehicle Technologies, (2) Driver and Operations, and (3) Management and Maintenance.
Vehicle Technologies
24. A wide array of energy-efficiency technologies have been tested and proven internationally. Table 2.1 summarizes the fuel reduction potential by type of technology. Annex 2 provides details such as specifications and performance of each. The technologies include engine standards, aerodynamic fairings, low rolling resistance tires and auxiliary power units to reduce engine idling. Intelligent vehicle technologies refer to logistics and management practices described in the following sections.
12
Table 2.1: Fuel Reduction Potential for Heavy-Duty Vehicle in Operation in the U.S. Technology Type % Fuel Reduction Potential Aerodynamics 3 to 15 Auxiliary Loads 1 to 2.5 Rolling resistance 4.5 to 9 Vehicle mass (weight reduction) 2 to 5 Idling reduction 5 to 9 Intelligent Vehicle Technologies 8 to 15
Source: TRB (2010) as cited in CAI-Asia (2010) “Challenges and Opportunities for an Environmentally Sustainable Road Freight Sector In Asia,” available at http://www.greenfreightandlogistics.org
25. Figure 2.4 summarizes the potential for a range of technologies identified for a typical tractor and trailer in the US context, which can sum to well over 10 – 15 percent fuel savings at an investment cost that is a small fraction of the value of the truck and generally has a payback period of 2 years or less.
Figure 2.4. Range of Possible Fuel Saving Technologies and Costs in US Context
Source: Cascade Sierra Solutions and U.S. EPA SmartWay Program
26. As box 2.4 illustrates, not only have these technologies been extensively deployed and evaluated internationally, innovative forward-looking companies are already testing and using them in Brazil. Box 2.4 also illustrates an important relationship that can help the mainstreaming of fuel-efficiency technologies: the relationship between those who demand freight services (shippers) and those who provide them (carriers). The most innovative shippers are not only investing in the latest technologies for their own fleet, but are also extending deployment to their carriers by way of service agreements that include environmental performance expectations. Discussions with trucking associations and industry experts in Brazil suggest that the top performing Brazilian truck carriers in terms of energy efficiency are already implementing a suite of fuel-saving technologies. However, these are usually the biggest, most professional carriers. The vast majority of carriers are not fully aware of these opportunities and often just have not focused on these marginal efficiency gains.
13
Box 2.4: Example of Initiatives by a Shipper
Walmart is an example of a large shipper considered an industry leader based on its global corporate social responsibility and sustainability policy that includes reducing fuel consumption and emissions from its operations. In 2005, Walmart initiated a program in the U.S. with a stated goal of doubling the fuel economy of its 7,200-tractor private carrier fleet from 6.5 mpg to 13 mpg by 2015. Collaborating with truck suppliers, evaluated components (as pictured) included a lower trailer height to reduce aerodynamic drag, a trailer drop belly (to recover internal volume except over the tractor axles), an aerodynamic tractor with matching lower roof fairing and cab extenders, trailer skirts, a rigid boat tail, and an auxiliary power unit (for idle management). Walmart reported a 12 percent improvement in fuel economy with this first-generation package of components and design alterations using standardized test procedure. Note that some loss of cargo capacity results from Walmart’s changes, and the new trailer height is not compatible with existing loading docks. Components being evaluated in subsequent generations include a hybrid diesel-electric system and auto-deploying trailer skirts. (TRB, 2010)
In Brazil, Walmart has also leveraged its worldwide network to also bring successful strategies to their operations. Starting in 2008, Walmart Brazil analyzed their entire supply chain and identified 31 potential initiatives to improve fuel efficiency. As with most large shippers, the majority of the freight is carried by third-party service providers, so they made agreements with these carriers to also implement the most promising strategies including: • Advanced deflectors (nosecones, lateral deflectors, and skirts) • Service level agreements to reduce average age of the fleet and empty backhauls (using drop-and-hook) • Operational management using telemetry • The combination of all of the initiatives in Brazil was expected to yield a 12% improvement in fuel efficiency
once fully implemented. There are also plans to pilot electric urban delivery and CNG vehicles in Brazil. Source: Walmart website and interviews with Walmart Logistics Managers
Driver Operator
27. International experience shows that most factors that influence vehicle fuel consumption are under some level of control by the driver including speed, acceleration, braking, shifting technique, idling, and tire pressure (Cascade Sierra Solutions, 2011). For this reason, there is growing international focus on driver training and behavior to improve operating fuel efficiency under the banner of Eco-driving (see box 2.5).
Box 2.5: Eco-Driving
The OECD reports that eco-driving behaviors and techniques can be used by drivers to optimize the fuel economy of their vehicle and has significant potential to deliver fuel savings and CO2 reductions quickly and cost effectively. Based on recent assessment, eco-driving techniques can bring an immediate 10% reduction in fuel consumption and CO2 emissions. Training is an essential success factor for eco-driving. Immediately after training, average fuel economy improvements of 5 to 15 percent were recorded for cars, busses and trucks. The best results for individual drivers showed 20-50 percent improvements in fuel economy under test conditions. Over the mid-term (<3 years), average fuel savings of around 5% have been shown in cases where there is no support beyond the initial training, and with continuous feedback this can be improved to about 10%. There is little evidence available regarding the long-term impacts (>3 years) of eco-driving training, but a few studies have been conducted on companies with truck and bus fleets that provided one-off training with no follow-up incentive programs, recording a 2-3% residual improvement in fuel consumption.
Source: OECD, 2010
14
28. A large test and recent study in Brazil was conducted by a consulting firm on the effects of training and the benchmarking of driver performance over time (Box 2.6). The results of this test show the significant potential of this strategy. In addition, most of the best performing companies in Brazil combine the training and benchmarking with incentive systems whereby the driver shares in the fuel saving.
Box 2.6: Brazilian Benchmarking Test of Drivers Shows Reduction of Fuel Consumption
The Brazilian consulting firm Netz Engenharia Automotiva published a study on a recent test performed using a fleet of 105 drivers and vehicles from 14 carriers based in the southeast of Brazil. A driver training program was delivered and a continuous improvement process was deployed based on the definition, management and control of driver performance indicators through follow-on training and telemetry systems that track all operating parameters of a vehicle in operation. The results of the test in the Figure below show a remarkable reduction in fuel consumption of over 4 percent every 6 months and a cumulative improvement of over 13 percent over 18 months. Three basic tactics were used by the drivers and monitored over a period of 18 months, including regular performance meetings to reinforce the training:
• Increasing the operating time in the engine’s economic zone • Avoiding excessive rotations of the engine • Minimize unnecessary idling and braking
Source: Netz presentation at World Bank-FAT Workshop on Freight in São Paulo, June 2011. Original study: Netz Engenharia Automotiva (2007), “Aprendizagem: Um estudo da contribuição da capacitação de motoristas de caminhão para a redução dos custos operacionais da frota.”
31. At the same time, the availability of skilled drivers is a major issue in Brazil. Even the largest companies with the newest fleets and best trained drivers in the country report concern about the scarcity of technical capacity and human resources to structure training programs, to monitor control systems, to do fleet management, to evaluate performance and other activities. All the companies contacted affirmed that investments in training are a priority for the sector. Several companies mentioned that often new vehicles cannot be operated because of a lack of qualified drivers. In Brazil, there are initiatives to improve the knowledge of truck drivers, such as a mobile training program conducted by CNT/SEST/SENAT to teach good practices to truck drivers regarding mechanics and eco-driving. The scale and reach of such training programs are still considered relatively small considering the need and potential.
0.0%
1.0%
2.0%
3.0%
4.0%
5.0%
6.0%
2
2.1
2.2
2.3
2.4
2.5
2.6
Beginning 6 months 12 months 18 monthsReduction of fuel consumption km/liters% reduction with respect to previous period
15
Management and Maintenance
32. The fuel consumption of trucks is not only determined by the technical efficiency of the vehicle and the skill of the driver, but also to maintenance practices, operational patterns and flow conditions on the transport network. Each stop increases the fuel consumption of heavy vehicles, and five stops on a trip of 10 km is enough to double the fuel consumption of a forty-ton articulated truck compared to travelling the same distance at a constant speed (OECD, 2011). Similarly, the performance of a poorly maintained truck, however new, can vary greatly. It is estimated that insufficient tire pressure increases fuel consumption in Brazil by an average 5-7%.11
33. Other ways for enhancing fuel efficiency through better management includes: improved logistics and routing through advanced software systems, revised truck specifications for operators that choose to order lower horsepower vehicles (downsizing for fuel economy benefits); and in some cases imposing speed controls. Annex 3 provides an overview of private sector initiatives in Brazil to reduce fuel consumption.
This is more an issue of maintenance and tire management than of technologies as roughly 30 percent of the Brazilian fleet utilizes an automatic tire pressure monitoring and inflation system known as “Rodo-Ar”. However, air leakage and poor calibration of such mechanical systems can significantly limit their benefit.
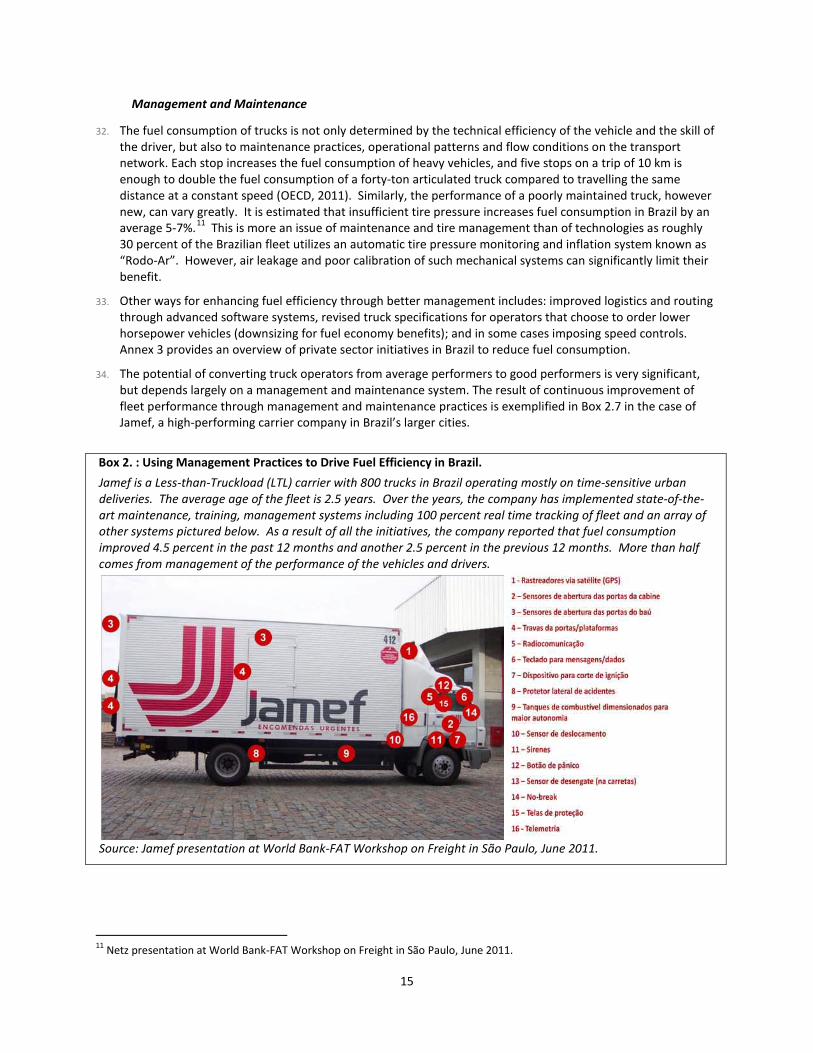
34. The potential of converting truck operators from average performers to good performers is very significant, but depends largely on a management and maintenance system. The result of continuous improvement of fleet performance through management and maintenance practices is exemplified in Box 2.7 in the case of Jamef, a high-performing carrier company in Brazil’s larger cities.
11 Netz presentation at World Bank-FAT Workshop on Freight in São Paulo, June 2011.
Box 2. : Using Management Practices to Drive Fuel Efficiency in Brazil.
Jamef is a Less-than-Truckload (LTL) carrier with 800 trucks in Brazil operating mostly on time-sensitive urban deliveries. The average age of the fleet is 2.5 years. Over the years, the company has implemented state-of-the-art maintenance, training, management systems including 100 percent real time tracking of fleet and an array of other systems pictured below. As a result of all the initiatives, the company reported that fuel consumption improved 4.5 percent in the past 12 months and another 2.5 percent in the previous 12 months. More than half comes from management of the performance of the vehicles and drivers.
Source: Jamef presentation at World Bank-FAT Workshop on Freight in São Paulo, June 2011.
16
2.3 Pilot Tests
35. A key question for this analysis was to understand and address barriers to widespread deployment of fuel saving technologies and practices that had proved to work in practical contexts, particularly those that were already in use (albeit limited use) in Brazil. Discussions with trucking associations and industry experts suggested that the key barriers were a combination of awareness, credibility, adequate managerial attention, and in some cases financing. In this context, industry associations such as NTC have offered to partner with the World Bank to disseminate and promote any technologies they could certify to enhance fuel efficiency in a cost effective manner.
36. To that end, one focus of this work was to identify the potential of independently-evaluated pilot tests to provide credibility and mainstream the deployment of innovative fuel-efficiency retrofit technologies and good practices in a “learning-by-doing” mode. Another focus of this work was to build a constituency and partnerships to implement pilot tests in Brazil. Potential near-term technologies and practices for the test were identified using the following criteria:
• Certified or in common use internationally, but not yet in common use in Brazil;
• Easily and credibly tested using predefined protocols;
• Already available in Brazil or not needing significant changes in the industrial supply chain.
37. The goal of this unusual operational element to the NLTA was two-fold:
• Operationally, to provide evidence of the efficacy of the tested technologies;
• Strategically, to explore the value to the sector in Brazil of credible performance information on such technologies whose deployment has external societal benefits.
Designing the Tests
38. Table 2.2 provides an overview of the technologies and practices assessed for the pilot test. The approach was to identify the key knowledge gaps and work with partners to design strategic tests to address some of these gaps. State-of-practice reflects technologies and practices that are already appropriately used by a significant share of the fleet, typically more than 20%. Many of these strategies are beginning to be implemented by the average performing operators and have certainly been exploited by the top performers were appropriate. On the other hand, state-of-the-art refers to recent technologies or practices that are being introduced in new vehicles and by some of the most advanced operators. Annex 2 provides details, specifications and photographs of the technologies assessed.
39. The criteria for selecting the technologies and practices for the tests in Brazil included:
• Robustness: proven elsewhere and possible to measure with a credible test
• Cost: low-cost solutions with available partners
• Applicability: low penetration but wide applicability
40. While the World Bank does not and will not endorse any specific technologies or solutions, we have agreements with partners and suppliers of certain types of technologies which are being pilot tested to demonstrate their potential in the Brazilian context. Independent partners and consultants of the World Bank will be evaluating and validating the results and lessons of these tests for the purpose of disseminating the information publicly.
17
Table 2.2 Overview of Technologies and Practices in Brazil Strategy State-of-practice State-of-the-art Potential
Fuel Savings Likely barriers to state-of-the-art strategy
Aero-dynamics
• Roof fairing (over-the-cabin deflectors)
• Side extenders (lateral deflectors)
• Chassis fairing
Medium to High
Low familiarity, applicability limited to highway operations
Rolling Resistance
• Black tires (conventional)
• Green tires (low rolling resistance)
Medium Low familiarity and only recently available in Brazil
Rolling Resistance
• Regular width tires • Wide-base tire (super single)
Low to Medium
Limited applicability (adequate pavement is needed)
Rolling Resistance
• Mechanical tire inflation system (Rodo-Ar)
• Electronic tire inflation system
• Tire balancing spheres
Medium High investment cost, Low familiarity
Weight Reduction
• Steel materials such as wheels
• Open bed truck where appropriate
• Light-weight materials such as aluminum wheels
Low to Medium
Investment cost and questions of durability
Auxiliary Load and Idling Reduction
• Climatizer • Air conditioning with Auxiliary Power Unit (APU)
Low Lack of availability; Auxiliary loads are minimal because heat and AC not common
Drivetrain and Propulsion
• Manual transmission
• Synchronized automatic transmission
• Hybrid diesel-electric, CNG/Diesel, all electric (small trucks)
Medium High investment cost; Only available for new vehicles
Exhaust After-Treatment
• Standard catalytic systems (Proconve)
• Diesel particulate filters • On-board diagnostic
systems
Low (but reduces pollution)
High investment cost; Fuel quality requirements
Driver • Basic operator training
• Eco-driving training • Driver incentive
schemes
Medium to High
Low familiarity or lack of availability
Maintenance • Corrective maintenance programs
• Preventative maintenance supported by On-board Diagnostic System
Medium to High
High investment cost
Operational Management
• Analog or digital tachograph
• Speed control
• Telemetry and performance benchmarking
Medium to High
High investment cost; difficult to test
Source: Authors’ compilation from survey of experts and industry representatives
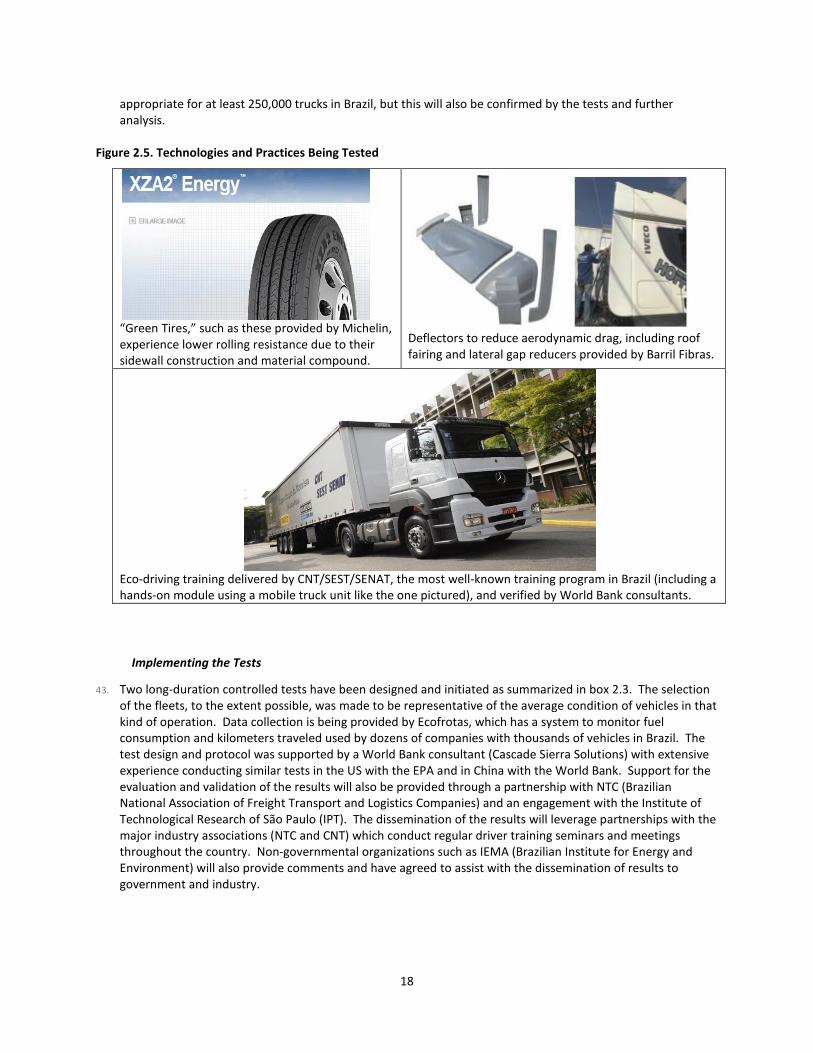
41. The selected technologies and practices for the tests were “green tire” (low-rolling resistance), aerodynamic deflectors for the tractor including roof fairing and gap reducers, and “eco-driving” training, as described and picture in Figure 2.5. These technologies and practices represent strategies with low penetration because of a lack of familiarity but with high applicability and partners available to support the pilot. Details of the test design and protocol are provided in Annex 4.
42. The technologies and practices being tested represent a near-term fuel-efficiency package that can be
implemented on an average truck for less than US$4,000. It is estimated that this “basic package” could be
18
appropriate for at least 250,000 trucks in Brazil, but this will also be confirmed by the tests and further analysis.
Figure 2.5. Technologies and Practices Being Tested
“Green Tires,” such as these provided by Michelin, experience lower rolling resistance due to their sidewall construction and material compound.
Deflectors to reduce aerodynamic drag, including roof fairing and lateral gap reducers provided by Barril Fibras.
Eco-driving training delivered by CNT/SEST/SENAT, the most well-known training program in Brazil (including a hands-on module using a mobile truck unit like the one pictured), and verified by World Bank consultants.
Implementing the Tests
43. Two long-duration controlled tests have been designed and initiated as summarized in box 2.3. The selection of the fleets, to the extent possible, was made to be representative of the average condition of vehicles in that kind of operation. Data collection is being provided by Ecofrotas, which has a system to monitor fuel consumption and kilometers traveled used by dozens of companies with thousands of vehicles in Brazil. The test design and protocol was supported by a World Bank consultant (Cascade Sierra Solutions) with extensive experience conducting similar tests in the US with the EPA and in China with the World Bank. Support for the evaluation and validation of the results will also be provided through a partnership with NTC (Brazilian National Association of Freight Transport and Logistics Companies) and an engagement with the Institute of Technological Research of São Paulo (IPT). The dissemination of the results will leverage partnerships with the major industry associations (NTC and CNT) which conduct regular driver training seminars and meetings throughout the country. Non-governmental organizations such as IEMA (Brazilian Institute for Energy and Environment) will also provide comments and have agreed to assist with the dissemination of results to government and industry.
19
Box 2.3: Green Truck Pilot Tests in Brazil Test 1: Rio Vermelho Fleet in Anapolis, GO
• Interurban trucking company, which is representative of the market segment • Installation of new green tires and aerodynamic deflectors on 2 vehicles; and new conventional tires on 2
vehicles on August 1, 2011 • Controlled and monitored 3-month test of 4 vehicles initiated on August 4, 2011:
Vehicle models, age, servicing, loads Same drivers with same vehicles
Test 2: VIC Fleet in Contagem, MG • Urban delivery trucks which are representative (age and performance) of the market segment • 2-days of eco-driving training with a focus on the driver’s role in efficient and safe operations and
supplemented by materials from international experience • Controlled 3-month test of 2 test vehicles and 2 control vehicles:
Vehicle models, age, servicing, routes Same drivers with same vehicles, same basic experience
• Training was delivered on July 12-13, 2011 and test initiated on July 25, 2011 • Analysis includes 9 months of pre-test operational data and 3 months of monitored test data
Source: Authors; as detailed in Annex 4: Pilot Test Design and Protocol.
Preliminary Cost-Benefit Analysis
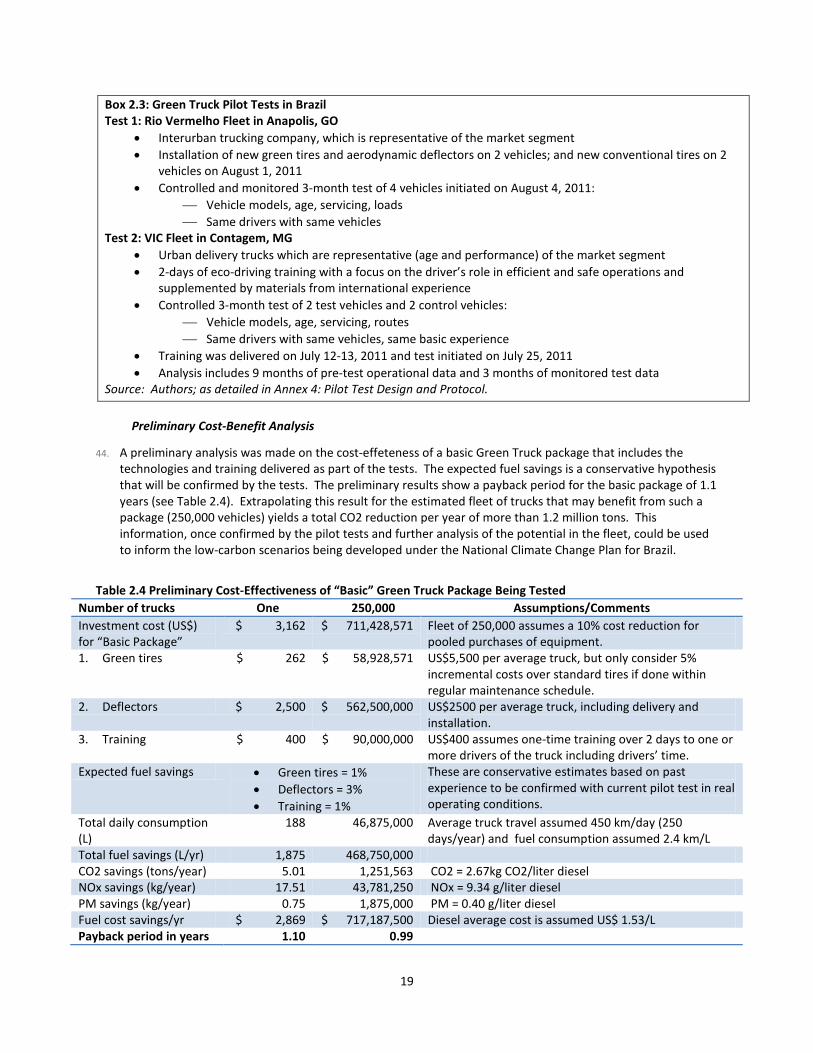
44. A preliminary analysis was made on the cost-effeteness of a basic Green Truck package that includes the technologies and training delivered as part of the tests. The expected fuel savings is a conservative hypothesis that will be confirmed by the tests. The preliminary results show a payback period for the basic package of 1.1 years (see Table 2.4). Extrapolating this result for the estimated fleet of trucks that may benefit from such a package (250,000 vehicles) yields a total CO2 reduction per year of more than 1.2 million tons. This information, once confirmed by the pilot tests and further analysis of the potential in the fleet, could be used to inform the low-carbon scenarios being developed under the National Climate Change Plan for Brazil.
Table 2.4 Preliminary Cost-Effectiveness of “Basic” Green Truck Package Being Tested Number of trucks One 250,000 Assumptions/Comments Investment cost (US$) for “Basic Package”
$ 3,162 $ 711,428,571 Fleet of 250,000 assumes a 10% cost reduction for pooled purchases of equipment.
1. Green tires $ 262 $ 58,928,571 US$5,500 per average truck, but only consider 5% incremental costs over standard tires if done within regular maintenance schedule.
2. Deflectors $ 2,500 $ 562,500,000 US$2500 per average truck, including delivery and installation.
3. Training $ 400 $ 90,000,000 US$400 assumes one-time training over 2 days to one or more drivers of the truck including drivers’ time.
Expected fuel savings • Green tires = 1% • Deflectors = 3% • Training = 1%
These are conservative estimates based on past experience to be confirmed with current pilot test in real operating conditions.
Total daily consumption (L)
188 46,875,000 Average truck travel assumed 450 km/day (250 days/year) and fuel consumption assumed 2.4 km/L
Total fuel savings (L/yr) 1,875 468,750,000 CO2 savings (tons/year) 5.01 1,251,563 CO2 = 2.67kg CO2/liter diesel NOx savings (kg/year) 17.51 43,781,250 NOx = 9.34 g/liter diesel PM savings (kg/year) 0.75 1,875,000 PM = 0.40 g/liter diesel Fuel cost savings/yr $ 2,869 $ 717,187,500 Diesel average cost is assumed US$ 1.53/L Payback period in years 1.10 0.99
20
3. Assessment of Other Green Freight Initiatives
45. In Brazil there are a number of limited initiatives with a focus on improving the environmental performance or fuel efficiency of the freight sector. These initiatives involve different levels of government and private sector, have a variety of goals ranging from economic development to addressing local concerns related to noise, congestion and pollution and global pollution, and have differing scopes and impact. Overall, these initiatives create an excellent set of building blocks for a comprehensive green freight strategy. They include:
• A number of areas primarily driven by government including development and maintenance of a multi-modal infrastructure; road system regulation and vehicle taxation regimes; and initiatives taken by local government.
• Technological innovation in the development of new kinds of truck technologies and fuels;
• Issues related to the management of trucking operations including logistics; and a cooperative measures taken by industry associations to improve management and maintenance practices; and
• Truck financing programs.
3.1 Infrastructure
46. Infrastructure influences the environmental performance of the freight system in at least three important dimensions. First, the availability of cost-effective and convenient alternatives can help to divert traffic off trucks onto more energy efficient modes such as rail and inland waterways. Second, the quality of road infrastructure has important implications on truck speeds and consequently on energy efficiency. Finally, construction of infrastructure is in itself an energy intensive activity and the appropriate use of materials and construction methods can have a significant impact on energy use during infrastructure development. All of these three dimensions of the infrastructure – green freight relationship are examined below.
47. Availability of cost-effective and practical alternatives. An integrated multi-modal transport system is the cornerstone of any green freight strategy. On one hand, trucks offer a remarkable amount of flexibility, door-to-door speed, and transparency for shippers. Thus for many kinds of cargo, particularly high-value or time-sensitive cargo, trucks may always play an important role. However, much can be done to support the development of alternatives modes – rail, pipelines, inland and coastal shipping – in the context of freight movements in Brazil. In a market environment, these alternatives modes will be most competitive in the case of long-haul trips and for lower-value bulk products such as agricultural and mining commodities. There is also a strong alignment between economic and environmental performance since these modes are more economical than trucking and, in general, market-driven shifts from road to alternative modes also reflect a reduction of overall logistics cost in the economy. For example, beyond a certain trip distance (typically 1000 km), long haul will be more cost efficient on rail than on trucks. The World Bank is currently supporting or scoping studies to better understand such characteristics in Brazil, including the life cycle cost and fuel efficiency of freight modes while controlling for such variables as the nature of the cargo, length and pattern of haul, propulsion technology (diesel versus electric), and energy production matrix (hydro power versus others).
48. Given this convergence of interest, development of multi-modal infrastructure has increasingly become a national priority. Box 3.1 summarizes some notable international experience in this regard.
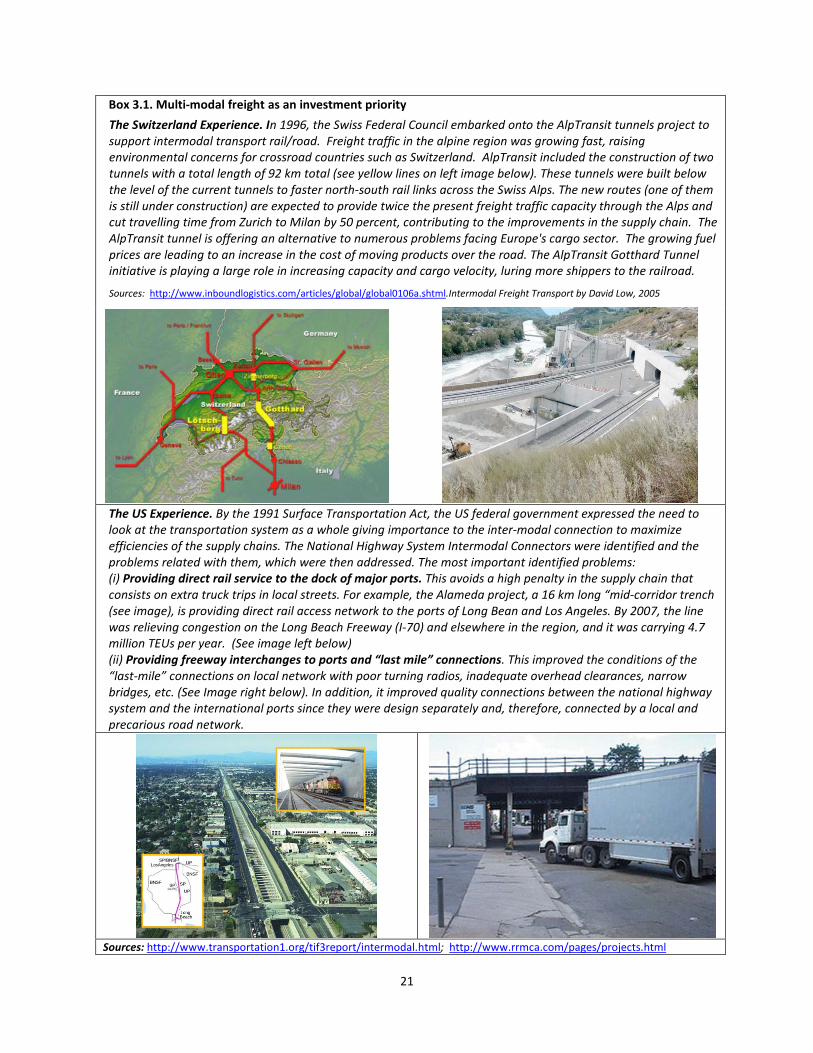
21
Box 3.1. Multi-modal freight as an investment priority
The Switzerland Experience. In 1996, the Swiss Federal Council embarked onto the AlpTransit tunnels project to support intermodal transport rail/road. Freight traffic in the alpine region was growing fast, raising environmental concerns for crossroad countries such as Switzerland. AlpTransit included the construction of two tunnels with a total length of 92 km total (see yellow lines on left image below). These tunnels were built below the level of the current tunnels to faster north-south rail links across the Swiss Alps. The new routes (one of them is still under construction) are expected to provide twice the present freight traffic capacity through the Alps and cut travelling time from Zurich to Milan by 50 percent, contributing to the improvements in the supply chain. The AlpTransit tunnel is offering an alternative to numerous problems facing Europe's cargo sector. The growing fuel prices are leading to an increase in the cost of moving products over the road. The AlpTransit Gotthard Tunnel initiative is playing a large role in increasing capacity and cargo velocity, luring more shippers to the railroad.
Sources: http://www.inboundlogistics.com/articles/global/global0106a.shtml.Intermodal Freight Transport by David Low, 2005
The US Experience. By the 1991 Surface Transportation Act, the US federal government expressed the need to look at the transportation system as a whole giving importance to the inter-modal connection to maximize efficiencies of the supply chains. The National Highway System Intermodal Connectors were identified and the problems related with them, which were then addressed. The most important identified problems: (i) Providing direct rail service to the dock of major ports. This avoids a high penalty in the supply chain that consists on extra truck trips in local streets. For example, the Alameda project, a 16 km long “mid-corridor trench (see image), is providing direct rail access network to the ports of Long Bean and Los Angeles. By 2007, the line was relieving congestion on the Long Beach Freeway (I-70) and elsewhere in the region, and it was carrying 4.7 million TEUs per year. (See image left below) (ii) Providing freeway interchanges to ports and “last mile” connections. This improved the conditions of the “last-mile” connections on local network with poor turning radios, inadequate overhead clearances, narrow bridges, etc. (See Image right below). In addition, it improved quality connections between the national highway system and the international ports since they were design separately and, therefore, connected by a local and precarious road network.
Sources: http://www.transportation1.org/tif3report/intermodal.html; http://www.rrmca.com/pages/projects.html

22
49. In Brazil both the National Transport Logistics Plan (PNLT) as well as the National Plan on Climate Change (PNMC) emphasize the benefits of changing the freight modal shift in the favor of rail, pipelines and shipping. The national logistics plan outlines a set of prioritized multi-modal investments needed to provide Brazil with a comprehensive modern multi-modal transport infrastructure at the national level. This plan was adopted in 2007 and is periodically updated by the National Ministry of Transport as the blueprint for federal investments in the next 15 years. Several states are also developing similar state-level logistics plans.
50. The recently completed Brazil Low-Carbon Study (World Bank, 2010) estimates the benefits of a low-carbon scenario that reflects a series of investments towards a multi-modal system based on the PNLT. This study found that such a low-carbon scenario could reduce freight sector carbon emissions by 8 percent in 2030 and generate aggregate savings of 51 Mt CO2 over the 2010 – 2030 period, and generate fuel savings on the order of US$2.8 billion. However, achieving these benefits would require close to US$10 billion of investments (see Table 3.1) in developing a multi-modal transport system.
Table 3.1 Incremental investments in infrastructure needed to generate 8 % savings in freight sector carbon emissions 2010-2030
Reference scenario Low-carbon scenario Transport mode US $ (billions) % of total US $ (billions) % of total Road 15.1 77 13.1 45 Rail+waterway+pipeline 4.5 23 16.0 55 Total 19.6 100 29.3 100
Source: Data from World Bank Brazil Low-Carbon Case Study (2010); Table 5.5
51. Quality of road infrastructure. The quality of highway road infrastructure has a strong relationship to fuel efficiency. First there is a small but positive relationship between the smoothness of the ride (measured in engineering terms as a roughness index) and fuel efficiency. However, this is swamped by the strong relationship between speeds and fuel-efficiency (and carbon emissions). When poor road quality affects speeds, fuel consumption and carbon emissions increase correspondingly. Figure 3.1 illustrates the relationship between travel speed and carbon emissions for heavy trucks and shows that truck carbon emissions per kilometer traveled (which are directly linked to fuel economy) are lowest when the vehicle is traveling at about 70kmph and generally lowest in the range of speeds between 50 and 75 kmph. Emissions per kilometer at a speed of 25kmph can be 40 percent higher than those at a speed of 75kmph. Thus, fuel efficiency generally suffers whenever the average truck must travel below 70kmph because of the poor condition of the pavement, high level of congestion, or some other reason.
Figure 3.1 Truck Emissions at Different Speeds Relative to Emissions at 50 kmph.
Source : M. Barth and K. Boriboonsomsin. 2008. Real-World CO2 Impacts of Traffic Congestion. Transportation Research Record. Volume 2058. http://trb.metapress.com/content/n622635366032635/. Available at cleanairinitiative.org/portal/node/6941
60
80
100
120
140
160
180
0 10 20 30 40 50 60 70 80 90 100Perc
enta
ge (%
)
Speed (kmph)CO2 PM NOx
23
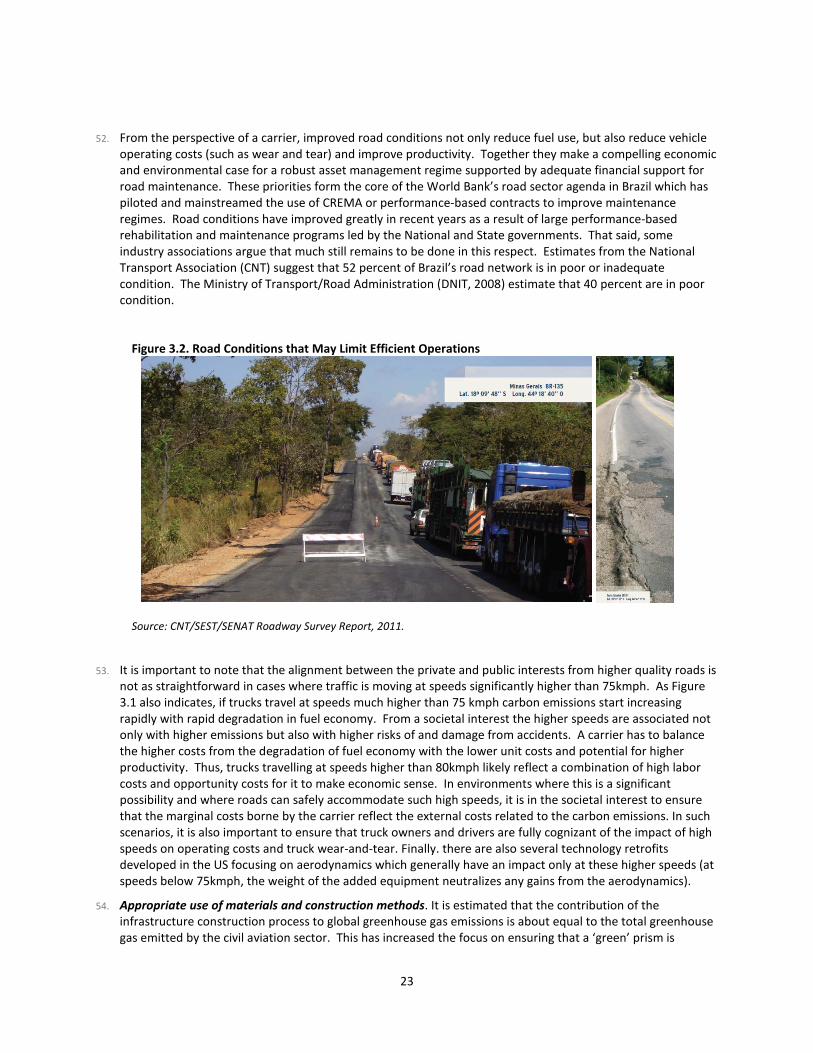
52. From the perspective of a carrier, improved road conditions not only reduce fuel use, but also reduce vehicle operating costs (such as wear and tear) and improve productivity. Together they make a compelling economic and environmental case for a robust asset management regime supported by adequate financial support for road maintenance. These priorities form the core of the World Bank’s road sector agenda in Brazil which has piloted and mainstreamed the use of CREMA or performance-based contracts to improve maintenance regimes. Road conditions have improved greatly in recent years as a result of large performance-based rehabilitation and maintenance programs led by the National and State governments. That said, some industry associations argue that much still remains to be done in this respect. Estimates from the National Transport Association (CNT) suggest that 52 percent of Brazil’s road network is in poor or inadequate condition. The Ministry of Transport/Road Administration (DNIT, 2008) estimate that 40 percent are in poor condition.
Figure 3.2. Road Conditions that May Limit Efficient Operations
Source: CNT/SEST/SENAT Roadway Survey Report, 2011.
53. It is important to note that the alignment between the private and public interests from higher quality roads is not as straightforward in cases where traffic is moving at speeds significantly higher than 75kmph. As Figure 3.1 also indicates, if trucks travel at speeds much higher than 75 kmph carbon emissions start increasing rapidly with rapid degradation in fuel economy. From a societal interest the higher speeds are associated not only with higher emissions but also with higher risks of and damage from accidents. A carrier has to balance the higher costs from the degradation of fuel economy with the lower unit costs and potential for higher productivity. Thus, trucks travelling at speeds higher than 80kmph likely reflect a combination of high labor costs and opportunity costs for it to make economic sense. In environments where this is a significant possibility and where roads can safely accommodate such high speeds, it is in the societal interest to ensure that the marginal costs borne by the carrier reflect the external costs related to the carbon emissions. In such scenarios, it is also important to ensure that truck owners and drivers are fully cognizant of the impact of high speeds on operating costs and truck wear-and-tear. Finally. there are also several technology retrofits developed in the US focusing on aerodynamics which generally have an impact only at these higher speeds (at speeds below 75kmph, the weight of the added equipment neutralizes any gains from the aerodynamics).
54. Appropriate use of materials and construction methods. It is estimated that the contribution of the infrastructure construction process to global greenhouse gas emissions is about equal to the total greenhouse gas emitted by the civil aviation sector. This has increased the focus on ensuring that a ‘green’ prism is
24
embedded into the infrastructure design and construction process itself, in addition to the focus on vehicle operating on these roads. Ideally, embedded-energy and environmental implications, along with a balance between operating and investment costs, should factor into choice of materials used, design processes and construction methods.
55. Evidence from a recently developed toolkit by the World Bank12
• As Figure 3.3 indicates, the construction of 1km of expressway emits as many tons of CO2 as 4km of national roads, 15km of provincial roads, and about 33km of rural roads. The variance undoubtedly speaks to the wide differences in capacity and function for these classes of roads. The pavement itself is significantly energy intensive, and for most roads that do not have significant structures it is the most significant source of emissions during the construction process. In the case of expressways, the structures and furniture (such as barriers and railings) are also very significant sources of emissions.
focusing on the carbon emissions from infrastructure construction suggests that:
• Energy embedded in the materials used for construction are the principle source of emissions. Different materials have different levels of embedded energy, with sustainably harvested wood presenting a significantly lower-energy alternative to steel and concrete. Over a 40 year lifetime, concrete pavements are estimated to contribute about 50 percent higher emissions than equivalent asphalt pavements. Further, additives such as fly-ash, organic additives (such as risk husk ash) and industrial by-products (including re-cycled tires) can reduce the lifecycle carbon content of cement and asphalt. Similarly, evaluating the lifecycle environmental and emission impacts of design alternatives would help to identify alignments and geometry that would minimize vehicle emissions during operations. Finally, there is significant activity at present in identifying construction methods that minimize energy-use. In particular warm and half-warm mix asphalt techniques use significantly less energy than hot-mix asphalt as well as causing significantly less local pollution.
• This sector is dynamic and evolving and as such it is critical for Brazil to create a facilitating environment that allows for experimentation, adoption of new techniques and materials and supports rather than stifles innovation.
12 ROADEO - GHG Emissions Mitigation in Road Construction and Rehabilitation. World Bank, 2010. Available at www.worldbank.org/astae/roadeo.
25
Figure 3.3 Emissions by work component for different classes of roads
Source: World Bank (2010),” Greenhouse Gas Emissions Mitigation in Road Construction and Rehabilitation. A Toolkit for Developing Countries. Introduction to Greenhouse Gas Emissions in Road Construction and Rehabilitation”. Executive Summary, Figure 2.
3.2 Regulatory initiatives
56. Appropriate use of high-capacity vehicles - longer and heavier trucks may be an accessible option to improve the environmental performance of trucking assuming optimized operations and no additional damage to the infrastructure. In Brazil, truck weight and loads are regulated by a combination of the National Traffic Council (CONTRAN), the road agency (DNIT, responsible for enforcement on the Federal non-concessioned network), and the regulatory agency (ANTT, responsible for enforcing norms on the concessioned network). Similar state road agencies are generally in charge of enforcing norms, which are in line with the Federal norms.
57. The challenge for the regulators is to balance consideration of environmental performance and truck economics (which also improve significantly when longer and heavier trucks are allowed on the road) with considerations of safety and infrastructure capacity. Higher capacity trucks need high quality infrastructure and need to be carefully designed in order to minimize the risks they pose for highway safety.
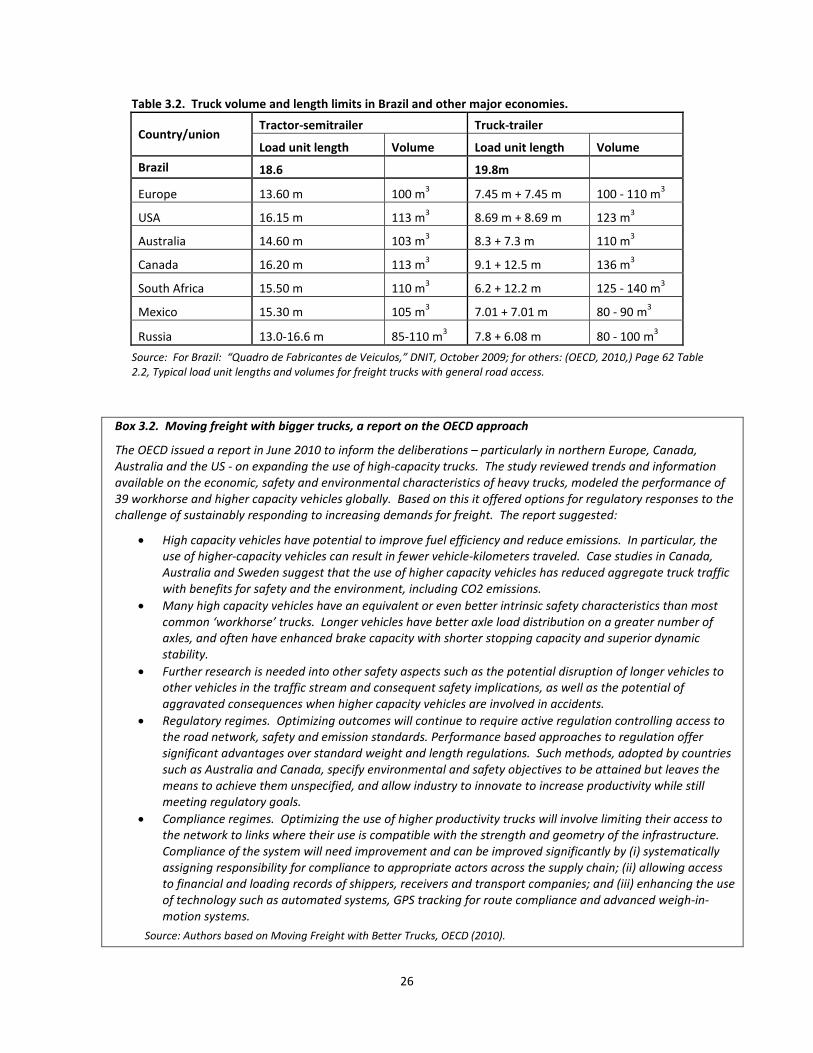
58. In this context, Brazil is already a global leader in testing and allowing higher-capacity vehicles. As Table 3.2 illustrates, length limits for general access vehicles in Brazil are already amongst the highest globally. Moreover, regulations allow vehicles to get special authorizations for vehicles of length between 25 and 30 meters (multiple trailer vehicles know as rodotrem, bitrem, tritrem, and treminhão). That said, weight limits per axel in Brazil (10t) are low relative to European standards (13.5t). Countries such as Canada, Australia, US and some northern European countries are testing and considering testing and permitting even higher capacity vehicles of length up to 40 meters (see box 3.2 on a recent OECD study conducted to inform this debate) and it would be appropriate for Brazil to stay informed and current with developments in this respect.
26
Table 3.2. Truck volume and length limits in Brazil and other major economies.
Country/union Tractor-semitrailer Truck-trailer
Load unit length Volume Load unit length Volume
Brazil 18.6
19.8m
Europe 13.60 m 100 m3 7.45 m + 7.45 m 100 - 110 m3
USA 16.15 m 113 m3 8.69 m + 8.69 m 123 m3
Australia 14.60 m 103 m3 8.3 + 7.3 m 110 m3
Canada 16.20 m 113 m3 9.1 + 12.5 m 136 m3
South Africa 15.50 m 110 m3 6.2 + 12.2 m 125 - 140 m3
Mexico 15.30 m 105 m3 7.01 + 7.01 m 80 - 90 m3
Russia 13.0-16.6 m 85-110 m3 7.8 + 6.08 m 80 - 100 m3
Source: For Brazil: “Quadro de Fabricantes de Veiculos,” DNIT, October 2009; for others: (OECD, 2010,) Page 62 Table 2.2, Typical load unit lengths and volumes for freight trucks with general road access.
Box 3.2. Moving freight with bigger trucks, a report on the OECD approach
The OECD issued a report in June 2010 to inform the deliberations – particularly in northern Europe, Canada, Australia and the US - on expanding the use of high-capacity trucks. The study reviewed trends and information available on the economic, safety and environmental characteristics of heavy trucks, modeled the performance of 39 workhorse and higher capacity vehicles globally. Based on this it offered options for regulatory responses to the challenge of sustainably responding to increasing demands for freight. The report suggested:
• High capacity vehicles have potential to improve fuel efficiency and reduce emissions. In particular, the use of higher-capacity vehicles can result in fewer vehicle-kilometers traveled. Case studies in Canada, Australia and Sweden suggest that the use of higher capacity vehicles has reduced aggregate truck traffic with benefits for safety and the environment, including CO2 emissions.
• Many high capacity vehicles have an equivalent or even better intrinsic safety characteristics than most common ‘workhorse’ trucks. Longer vehicles have better axle load distribution on a greater number of axles, and often have enhanced brake capacity with shorter stopping capacity and superior dynamic stability.
• Further research is needed into other safety aspects such as the potential disruption of longer vehicles to other vehicles in the traffic stream and consequent safety implications, as well as the potential of aggravated consequences when higher capacity vehicles are involved in accidents.
• Regulatory regimes. Optimizing outcomes will continue to require active regulation controlling access to the road network, safety and emission standards. Performance based approaches to regulation offer significant advantages over standard weight and length regulations. Such methods, adopted by countries such as Australia and Canada, specify environmental and safety objectives to be attained but leaves the means to achieve them unspecified, and allow industry to innovate to increase productivity while still meeting regulatory goals.
• Compliance regimes. Optimizing the use of higher productivity trucks will involve limiting their access to the network to links where their use is compatible with the strength and geometry of the infrastructure. Compliance of the system will need improvement and can be improved significantly by (i) systematically assigning responsibility for compliance to appropriate actors across the supply chain; (ii) allowing access to financial and loading records of shippers, receivers and transport companies; and (iii) enhancing the use of technology such as automated systems, GPS tracking for route compliance and advanced weigh-in-motion systems.
Source: Authors based on Moving Freight with Better Trucks, OECD (2010).

27
59. Registration fees and taxes are another lever for government to influence the environmental performance of the fleet. State of the art in this respect would be a fee system based – among other factors – on the carbon emissions of the truck. As an example, tolls for trucks on Germany’s highway system vary based on the environmental performance of the vehicle. Currently in Brazil, annual registration fees are based on the depreciated cost of the vehicle. As such they may discourage fleet turnover.
60. Local Government initiatives. Cities often take regulatory actions – driven by a combination of congestion, air pollution, noise and safety concerns – to regulate trucking activity within city boundaries. There are initiatives of interest taken by the cities of São Paulo and Rio:
• City of São Paulo. In recent years, the City has implemented measures to tackle congestion and pollution generated by vehicles including trucks. First, São Paulo implemented a restriction for the circulation of trucks and light commercial vehicles in part of the expanded city center during most of the day in order to reduce congestion in the city. This restriction was implemented in two stages. By 2008, a small restriction area was defined and limited to heavy trucks. The results of the first stage included a decrease of around 20,000 trucks in circulation, but an increase in the fleet of small trucks or light commercial vehicles (Source). In response to these results, the municipality modified the restriction enlarging the restricted area and including the prohibition of smaller trucks. The World Bank, through a GEF grant, is supporting the City’s efforts to conduct the first freight origin-destination survey as the basis for a transport model to test potential strategies in additional to truck restrictions, such locating, such as sizing and financing logistics platforms or distribution hubs on the periphery of the city.
• Second, in response to the pollution caused by the trucks in the city, São Paulo implemented a mandatory the vehicle inspection and maintenance program for diesel vehicles since 2008. By 2011, nearly 55% of vehicles have passed the inspection. Vehicle owners receive fines when the mandatory inspection is not carried out.
• Agreement with Transportation Operators in Rio de Janeiro. In addition to the programs with national reach, Petrobras and the Ministry of Mining and Energy have specific agreements with local organizations. In November 2009, they signed an agreement with the Freight Transportation Federation of Rio de Janeiro State, an entity representing 9,800 companies and 30,000 trucks, to establish a technical cooperation. Technicians trained by Petrobras will gauge the diesel quality and the smoke opacity of the trucks periodically, beginning in 2010. Part of the program consists of informing and educating the companies about diesel use management techniques to save fuel consumption and reduce CO2 and particulate matter emissions. The high number of volunteers participating in these programs shows that there is interest of the private sector in learning more about better procedures of fuel use as well as disposition to adopt environmentally friendly behaviors. The success of these different activities suggests that there would be demand for a broader program involving a unified green certificate.
3.3 Technological Innovation in Vehicles and Fuels
61. Alternative fuels. The prospect for innovation in fuels remains critical to a low-carbon freight agenda and Brazil is a world leader in this respect. As the World Bank’s Low Carbon Study shows, the proliferation of bio-fuels has had a positive impact on Brazil’s carbon footprint based on the unique features of the production process and availability of resources. In terms of engines and power source, bio-diesels probably represent the most promising technological innovation from a carbon intensity perspective for long-distance trucking. Such technologies are particularly relevant in Brazil given the rich history of developing ethanol and flex-fuel engines as bio-fuel substitutes for conventional gasoline. Current national policy already requires 5 percent bio-diesel content, a number that is scheduled to increase to 7 percent in 2011. However, there remain a range of concerns related to the use and expansion of first-generation bio-fuels such as ethanol13
13 The World Bank 2010 Brazil Low Carbon Study highlights in particular issues related to food security and land-use.
and consequently there is significant activity and innovation in the bio-fuel space. Brazil is at the forefront of much

28
of the developments in this sector and a wide variety of pilots and experimentation is underway including pilots related to:
• The development of flex-fuel technologies for trucks14
• Development of sustainable second generation bio-fuels from sources such as algae and agricultural and organic waste.
;
62. There is a need for development of a policy framework that supports innovation in this area and provides incentives for successful pilots that meet sustainability concerns to be scaled up to commercial scale. Additionally, the Proconve schedule (see box 2.1) specifies the manner in which truck engines and fuel quality will change so as to lower emissions of fine particulate matter and sulfates. The introduction of Proconve 7 in 2012 in particular, will facilitate the use of diesel particulate filters that can dramatically lower particulate matter emissions. While the focus of this regulatory regime is primarily on local pollutants, there are also significant fuel-efficiency co-benefits. All else being equal, EURO 3 (Proconve 5) trucks can be about 10 percent more efficient than a EURO 1 (Proconve 3) truck. A EURO 5 truck (Proconve 7) is about 5 percent more fuel efficient than a EURO 3 truck.
63. New truck technologies. A variety of new truck technologies are being tested and in initial deployment across the world. Diesel-hybrids and electric trucks are increasingly common in the US and in European markets. Other advanced technologies are also being tested (see Annex 2). Ultimate deployment of such technologies in Brazil will depend on a combination of economics and a regulatory environment that accommodates and encourages innovation.
3.4 Challenges related to Logistics and Operations
64. Reducing the share of truck kilometers driven empty can significantly increase system fuel (and energy) intensity. Though sometimes unavoidable due to fundamental imbalances in the directions of freight flows, a high share of ‘empties’ or a low truck utilization rate often reflects information and collaboration failures –fragmented markets without good information exchange, or proprietary fleets running inefficient empty backhauls. Estimates from São Paulo State in 2005 suggest that about 36 percent of truck kilometers and 46 percent of truck trips in the state are ‘empty’ or unproductive backhaul. This is high and compares to a similar 23 percent of all distance travelled in the European Union or 40 percent of the trips made in 2003. In this context, the US has probably the highest system utilization of any major economy – with 2008 data suggesting that less than 14 percent of the miles travelled system-wide were on empties. This reflects both a strong culture of 3rd party logistics brokers such as CH Robinson that consolidate information and provide shippers with consolidated logistics services, as well as a number of collaborative mechanisms to facilitate fleet sharing arrangements between proprietary fleets (see box 3.3).
65. A preliminary assessment suggests that many factors may be responsible for the relatively low utilization of Brazil’s trucking fleet. A large share of manufacturing in Brazil is concentrated in São Paulo, structurally limiting the possibilities for productive back-hauls to the São Paulo region. Road connections between destinations in the north, the north east and southwest are limited, and a truck with a destination in these regions has limited opportunities to cross-over to other cities to pick up back-haul loads. Though modern ‘drop and hook’ technologies (that allow trucks to unload trailers and pick up new trailers) exist, they are not widely used. Similarly, though modern international logistics carriers are present, they are still building their presence in what has traditionally been a relationship based business. While cost and efficiency are important, security, reliability and client service may still trump costs for shippers.
14 http://www.transportabrasil.com.br/2011/05/iveco-apresenta-prototipo-de-caminhao-bi-combustivel/
29
Box 3.3 Fleet sharing in the US
The Voluntary Inter-industry Commerce Solutions (VICS), established in 1986, is a not-for-profit association that aims to take a global leadership role in the development of business guidelines, practices and specifications that result in the improvement of the retail supply chain efficiency and effectiveness. VICS solutions include amongst other a web-based service to match carrier availability, Empty Miles, with transportation demand (loads) delivered through a members only internet portal.
The Empty Miles program has helped companies to increase retail revenues, while eliminating CO2
Currently, Schneider and Macy’s realize both financial and environmental gains by filling empty trailers with the help of the Empty Miles Service. While Schneider has reduced its operating costs by eliminating 11 percent of its empty miles and moving 22 percent more backhaul freight with member shippers, Macy’s has experienced an increase of 30 backhaul loads per week. Macy’s / Schneider average an annual US$25,000 savings and over 150 tons of CO
emissions. Two progressive companies — Macy’s Inc., the nation’s premier retailer, and Schneider National, a leading provider of transportation and logistics — joined forces with a renewed sense of urgency to solve this age-old, yet contemporary issue.
2 reductions per origin/destination location pair.
Source: VICS, Empty Miles, Driving Savings. Curbing Emissions.
66. That said, international experience suggests that significant improvement in truck utilization rates should be possible with the proliferation of 3rd
3.5 Initiatives by the private sector and industry associations
party logistics services and modern drop and hook type technologies. As a first step towards developing an approach towards addressing this high share of empties, under the Federal Road Transport Project, the Bank is supporting the ANTT to finance the development of a country-wide Origin Destination database for Brazil as a technical assistance. This information base can serve as a platform to develop a strategy that would identify and address barriers to higher utilization levels for the industry. ANTT has also launched a number of other such initiatives aimed at better understanding the trucking industry in the country, including a study characterizing of the national demand of freight transport, a carrier satisfactory study, and specific trucking and freight evaluations as part of an examination of a proposed rail ring in São Paulo State.
67. There are a number of freight sector initiatives encouraged by government and managed by industry already underway in Brazil that are motivated by improving the environmental performance of the sector. These initiatives are providing impressive results and indicate an existing culture of partnership between government and industry to take on the challenge to mitigate the environmental impact of the trucking sector. As such they are important potential building blocks to any scaled up initiative to reduce the carbon emissions from the sector. A brief summary of the key programs is presented below.
68. Despoluir Program. The Brazilian National Transport Confederation (CNT) launched an environmental program in 2007 called Despoluir with the objective of involving transport companies, autonomous truck drivers, taxi drivers and society in promoting emissions control and sustainable development. With the Despoluir program, CNT intends to develop and implement technologies and management models for the rational use of natural resources. Ongoing projects under this the program include the reduction in the emission of pollutants by vehicles, encouraging the use of clean energy by the transportation sector, and improvement of environmental management in companies, garages and transportation terminals. According
30
to CNT, 72 emission control units around the country have measured emissions from 310,000 vehicles including trucks. This program could feasibly be extended to also focus on reducing fuel consumption.
69. Project “EconomizAr” 15
• The program operation: The project has 48 mobile units driven by technicians trained by Petrobras and equipped with instruments to measure the opacity of the smoke emitted by the vehicles and a mini laboratory to test diesel quality. The technicians visit companies affiliated to the program evaluating diesel use management, quality and storage conditions, besides the maintenance of the fleet. They work in cooperation with the companies’ employees, identifying and promoting successful practices and experiences to improve diesel use efficiency and offering qualification for drivers and mechanics.
. Provides free technical support to the highway transportation sector of both passengers and freight, aiming at rationalizing diesel consumption and improving the quality of air by reducing the emissions of the highly pollutant black smoke – an effluent of low quality diesel – from buses and trucks. The project was formally created through a Technical Cooperation agreement among Petrobras, Ministry of Mining and Energy, Ministry of Transportation and CNT and is the product of intense cooperation between the public and the private sectors. The program‘s core idea is that the private transportation sector ought to be informed about the environmental and economic gains of using fuel efficiently in order for it to adopt greener actions.
• Results: Since it was created in 1996 until 2005, the program has realized more than 120,000 evaluations in 98,000 vehicles from 5,000 companies. It has implemented partnerships with 33 transport organizations and has operated in 21 of the 27
• Project limitations: There is a lack of incentives for the companies to do regular inspections. The companies do not have any obligation or formal agreement to follow the technicians' recommendations and have inspections regularly. If the project was combined with the development of a ‘green’ certification that would require the fleet to go through evaluations annually, companies would have more incentives to follow the instructions and have periodic inspections. This way, the program would be more effective by compelling the participants to actually adopt the prescribed measures. Although some states developed certificates called Selo Verde (green label), this is not a deliberate action of the program.
state-level units. The project is estimated to have saved 252 million liters of diesel per year, causing a reduction of 700,000 tons of CO2 emissions and 19,000 tons of particulate matter emissions per year. Some states created a green certificate for the companies that participated in the project.
70. Project “TransportAr”. Originated from a partnership between the Ministry of Mining and Energy and Petrobras, this is a project developed to inspect the quality of the diesel used by tanker trucks and inform the drivers about routine procedures to use the fuel more efficiently. The objective is to prevent the trucks form emitting black smoke and to generate fuel savings. Both outcomes generate cuts in greenhouse gas emissions.
• The program operation: The project has posts located at two of Petrobras' filling stations, at Henrique Lage Refinery (known as Revap) and at Paulina Refinery (named as Replan), both in São Paulo state. In these posts, technicians trained by Petrobras inspect with no charge the tank trucks, evaluating the diesel quality, the maintenance conditions of the vehicle and the smoke's opacity. Everything is done while the drivers are waiting in line to have the trucks filled up, with no additional delay for them. The participation in the program is absolutely voluntary. After the inspection, technicians hand in to drivers a report with information on a methodology to monitor the fuel consumption and instructions about simple procedures to save fuel consumption and consequently lower transportation costs.
• Results: After five years, the program has realized more than 7,000 evaluations in about 3,200 vehicles from 400 companies. The project impact in CO2 emissions is estimated as a reduction of 45,500 tons of CO2 per year.
• Project limitations: The program is restricted in scope to tanker trucks that work with Petrobras, which is a very small share of the total truck fleet in the country. The truck drivers also lack incentives to do regular inspections. Like the EconomizAr project, this program would benefit from the development of a certificate that would give further incentives to drivers to apply the technical recommendations.
15 Projects under a national program to reduce the use of fossil fuel use, http://www.conpet.gov.br
31
3.6 Financing programs
71. Procaminhoneiro Truck Financing Program16
72. Although Procaminhoneiro is generally considered as a success, there are opportunities to improve the accessibility of credit from independent owners-operators. Independent owner-operators have difficulty proving their incomes since they do not have regular wages or their credit history are not approved by the registered financial institutions. Another potential barrier is financial guarantees required by BNDES. Usually the guarantee is the right of property of the truck until the end of the financing contract. BNDES does not accept financial applications as guarantee. Therefore, many independent owner-operators perceive this as a risk because the truck is their main personal asset.
. BNDES has a credit line named Procaminhoneiro to finance jointly with registered financial institutions the purchase of new and used trucks and truck equipments. The equipments that might be financed are: trucks, chassis, tractors, carts, pump jacks, towages, semi-towages (including the trailer type), tankers and similar equipment registered at the competent traffic entity, and truck bodies registered by the BNDES. Used equipment are required to be at most 15 years old in the year of the financing request from the date of fabrication. The credit line might also be used to finance new tracking systems registered by the BNDES when they are purchased at the same time as the financeable equipments and insurances purchased simultaneously with the financeable new or used goods. Under this credit line, truck owners – whether it is a natural person or a company – will pay 7 percent of fixed interest rate annually (includes remuneration of 3 percent per year for partner financing institution) or a variable tax rate based on the financing cost, on BNDES’s remuneration (1 percent per year) and on the partner financing institution’s remuneration (maximum of 6 percent per year). In 2009, the Federal Government reduced annual interest rate of Procaminhoneiro from 13.5 to 4.5 percent and, according to BNDES, the number of credit approvals for this program increased more than 300 percent when compared to 2008. In 2009, there were 6,728 credit approvals for Procaminhoneiro, while in 2008 there were 2,073 approvals. The low interest rate and a long payment period (96 months) were identified as the main reasons for this substantial growth.
73. The financial capacity of the independent owner-operators should improve in the near future. A recent regulation by ANTT (Ground Transportation Regulation Agency) - nº 3.658/2011 – prohibited the use of carta-frete (freight-letter), a traditional way used by transport companies to pay the independent owners who do not use bank accounts. According to the regulation, after October 2011 all the transport companies and the cargo owners must pay the truckers though one of two methods, either deposit in a bank account or through an ANTT registered company. ANTT will certify companies that can provide electronic freight payment and itemize the expenses (fuel, tolls, food, freight). With this new form of payment, the independent owner-operators will be able to prove their income and improve their credit history.
74. The Procaminhoneiro program does not currently provide direct incentives for selecting more energy-efficient technologies other than the age limitation for the equipment. Aligning the criteria and application of such a financing program with energy-efficiency and environmental objectives may be a useful instrument to scale-up a green freight program.
16http://www.bndes.gov.br/SiteBNDES/bndes/bndes_pt/Areas_de_Atuacao/Comercio_Servicos_e_Turismo/procaminhoneiro.html
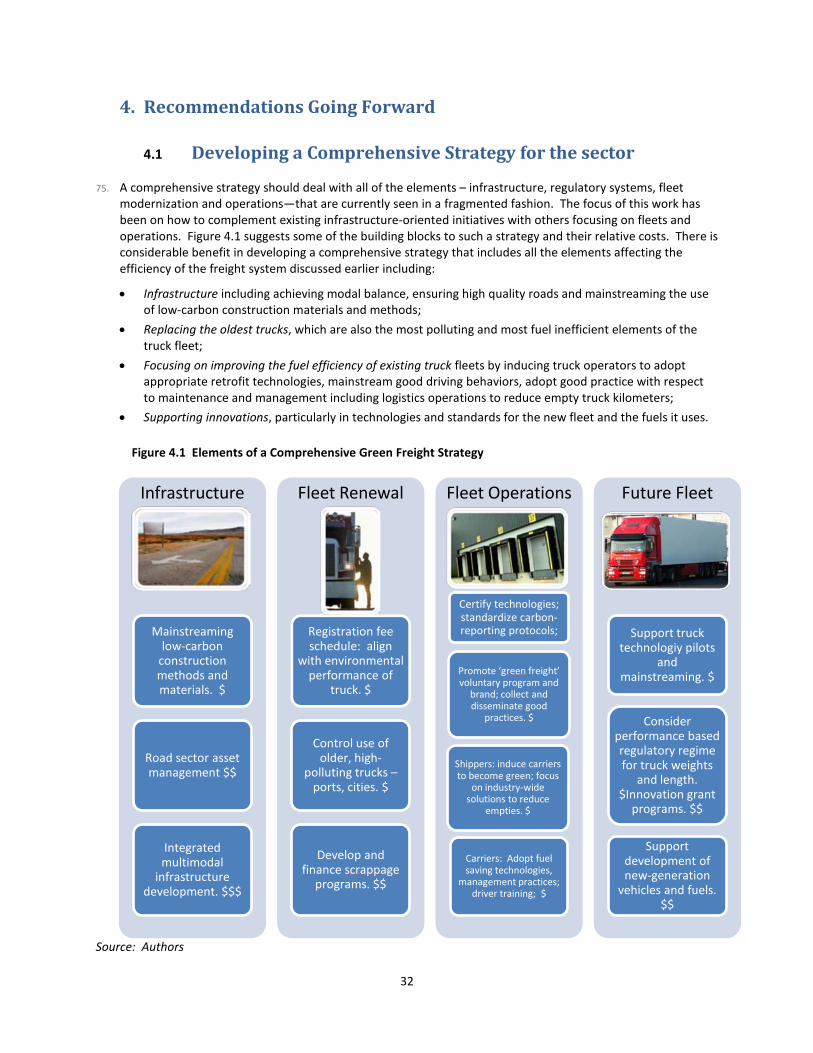
32
4. Recommendations Going Forward
4.1 Developing a Comprehensive Strategy for the sector
75. A comprehensive strategy should deal with all of the elements – infrastructure, regulatory systems, fleet modernization and operations—that are currently seen in a fragmented fashion. The focus of this work has been on how to complement existing infrastructure-oriented initiatives with others focusing on fleets and operations. Figure 4.1 suggests some of the building blocks to such a strategy and their relative costs. There is considerable benefit in developing a comprehensive strategy that includes all the elements affecting the efficiency of the freight system discussed earlier including:
• Infrastructure including achieving modal balance, ensuring high quality roads and mainstreaming the use of low-carbon construction materials and methods;
• Replacing the oldest trucks, which are also the most polluting and most fuel inefficient elements of the truck fleet;
• Focusing on improving the fuel efficiency of existing truck fleets by inducing truck operators to adopt appropriate retrofit technologies, mainstream good driving behaviors, adopt good practice with respect to maintenance and management including logistics operations to reduce empty truck kilometers;
• Supporting innovations, particularly in technologies and standards for the new fleet and the fuels it uses.
Figure 4.1 Elements of a Comprehensive Green Freight Strategy
Source: Authors
Infrastructure
Mainstreaming low-carbon
construction methods and materials. $
Road sector asset management $$
Integrated multimodal
infrastructure development. $$$
Fleet Renewal
Registration fee schedule: align
with environmental performance of
truck. $
Control use of older, high-
polluting trucks –ports, cities. $
Develop and finance scrappage
programs. $$
Fleet Operations
Certify technologies; standardize carbon-reporting protocols;
Promote ‘green freight’ voluntary program and
brand; collect and disseminate good
practices. $
Shippers: induce carriers to become green; focus
on industry-wide solutions to reduce
empties. $
Carriers: Adopt fuel saving technologies,
management practices; driver training; $
Future Fleet
Support truck technologiy pilots
and mainstreaming. $
Consider performance based regulatory regime for truck weights
and length. $Innovation grant
programs. $$
Support development of new-generation
vehicles and fuels. $$
33
76. The appropriate role for government is obviously not the same across the elements of Figure 4.1. In some
cases, such as infrastructure development, government will have to take a lead role, setting priorities, providing strategic direction and in many cases providing the financing. In other cases, the role of government will need to be much more limited, and at best government can play a facilitative role. In general, as illustrated in Figure 4.1, it is suggested that:
a. In the case of infrastructure – government continue to take the strategic lead role in developing and maintaining a environmentally sound multi-modal integrated infrastructure system;
b. In order to accelerate turn-over of the oldest fleet – government should consider a combination of regulatory approaches and financial incentives to accelerate turn-over of the oldest fleet;
c. To mainstream good practice in fleet operations and management, government consider facilitating a partnership approach that focuses on encouraging and recognizing voluntary efforts by private sector shippers and operators and supports such efforts by facilitating access to financing and capacity-building;
d. To create and support a culture of innovation in the trucking sector, government may re-examine the regulatory structure for the sector to supporting market-led innovation by sharing risks or reducing hurdles.
4.2 Infrastructure and Logistics
77. The environmental imperative just reinforces the economic case for additional support for infrastructure investments that support the development of an integrated multi-modal system. The PNLT provides a foundation for such an investment plan and implementing the projects in the PNLT should remain a priority. Further there is a need to:
• In the near term, focus on creating a culture of innovation in materials and methods and processes to mainstream low-carbon materials and construction methods into the infrastructure construction process;
• Ensure that evaluation of infrastructure projects incorporates green impacts in the analysis and consider options for road infrastructure design, construction and maintenance to improve efficiency and reduce emissions
• In the near and medium term, further expand the asset management strategies in the road sector which the World Bank is actively supporting; and
• In the long term, continue to scale-up investments on integrated multi-modal logistics systems that encourage intermodality, efficient logistics in and around cities and ports, and a balance of modes.
4.3 Accelerating Turn-Over in the Oldest Fleet: A combination of regulatory and financial incentives
78. For the Pre-EURO Fleet: Scrap and Upgrade. With respect to the oldest fleet, the recommended strategy is to look for a combination of regulatory and financial initiatives to induce scrappage and upgrades, where feasible. With respect to this fleet, the strongest public interest is related to local air pollution. These trucks are significantly more polluting than newer alternatives controlled under the ‘EURO’ environmental regime. Even EURO 1 trucks emit only 50 percent of the particulate matter – the local pollutant of most interest – that pre-EURO trucks do; and EURO 3 trucks (all trucks in Brazil since 2003 have been at least EURO 3) emit less than 20 percent of the PM. EURO 3 trucks also have technological features that make their fuel efficiency behavior more robust17
17 Trucks that are EURO 3 or newer have electronic diesel engines which allow owner to set parameters and maintenance information.
.
34
79. It should be noted that industry associations such as NTC and CNT are also advocating fleet modernization and renovation as key strategies for the sector. The CNT initiative known as RenovAr estimates that more than 50,000 vehicles per year need to be scrapped to eliminate the fleet of vehicles older than 30 years by 2022.The design and implementation of such a scrappage and replacement program for the oldest trucks requires careful policy analysis of prices and the useful life of trucks as evident from international experience in this area (see box 4.1 for the Mexican experience).
80. The tax and fee regime for trucks, including registration fees can play an important role in accelerating fleet turnover. The critical element in this respect is to ensure that registration tax and fee regimes are related in some manner to the environmental performance of trucks so that truckers have incentives to turn-over, rather than extend the life of the oldest, most inefficient and most polluting trucks.
Box 4.1: Mexican Heavy-Duty Vehicle Scrappage Program
The Mexican government created in 2003 the Programa de Chatarrización, a scrappage program developed with the objective of taking out of the streets old trucks and buses through the provision of financial incentives. The program provides owners of vehicles older than 10 years and verifiably in operation for the last 3 years a 15% credit towards the purchase of a newer vehicle when they scrap the older vehicle. Differently from a similar program in the US, this credit might be used to buy either new or used vehicles, as long as the truck purchased is newer than the one that would be destroyed. The program has been successful, with 13,000 vehicles destroyed in 2010 and a total of 45,000 scrapped vehicles since 2004. There are about 11 scrappage centers in the country. These centers are private or public entities certificated by the government and any entity interested in providing this service might request authorization through the program’s website. Even as the lessons of the program and the total costs and benefits of such an approach are still being evaluated, there is agreement that the program has made a measurable contribution to modernizing the fleet which was the primary objective.
Source: CAI-LAC
81. In some cases, cities such as São Paulo have already mandated minimum standards for the fleet of trucks circulating in and entering the municipality (see section 3.6). The benefits from scaling up initiatives targeting these oldest vehicles are considerable and mixed strategies that combined both regulatory ‘sticks’ and financing ‘incentives’ maybe appropriate (see Box 4.2 for a successful combination of a regulatory and financing program targeting such vehicles in the US state of Washington). It would be logical for such initiatives to be conceived in locations which have a combination of vulnerability to air pollution (i.e. significant pollution and significant human populations that have exposure) and an ability to enforce directives relating to the quality of vehicles permitted. As such facilities such as ports (that carefully control access) and cities are ideal locations to develop such initiatives. Such an initiative would combine:
a. Clearly defined performance standards for permitted vehicles – that are based on commonly accepted standards – such as EURO 3 minimums emission standards;
b. Scrappage plus financing schemes for drivers and vehicles that don’t meet those standards. Designing effective scrappage schemes is not easy – requiring detailed and carefully maintained databases and an ability to track vehicles and data over time.
c. Such a control regime could be complemented by a financing scheme that supports owners of scrapped vehicles obtain financing for updated ‘permitted’ trucks. The key to designing an effective scheme would be to find ways to sustainably finance small under-capitalized owner-operators, many of whom operate on the edges of the formal economy. This would not only benefit the trucker, but also society at large with benefits to environment, safety and the financial sustainability of the sector. A significant feature of the State of Washington program described in Box 4.2 was the high level of success in addressing this particular market segment in a US setting.
35
d. One option would be to explore the possible expansion of the BNDES Procaminhoneiro program in the context of providing incentives for fuel efficient vehicles and technologies.
Box 4.2 – Seaport Truck Scrappage and Retrofits for Air in Puget Sound (ScRAPS)
This is a multi-million dollar scrappage a retrofit program developed initially for the Port of Seattle, (and to be extended to the Ports of Tacoma and Vancouver) that will: offer incentives to owners of container-hauling trucks that have pre-1994 engines to scrap them; and offer pollution-reducing exhaust retrofits on the replacement trucks of those who scrap their trucks. Since December 2010, the older trucks – which are estimated to cause a 100 times more local pollution than the newer alternatives – are no longer allowed into the Port system. Cascade Sierra Solutions, an Oregon-based non-profit organization, was contracted to operate this program and is charged with providing low-interest loans to support truckers upgrade their fleet. The program is financed initially by about US$2.3 million in grants from state agencies.
The program is structured so that the owner goes to CSS’s Seattle Green Truck Center to apply to scrap truck. CSS will verify that (a) Pre-1994 engine in truck; (b) the truck operating for last 12 months & used at least 50% serving the Port of Seattle; (iii) the truck is licensed & insured; and (iv) there is an affidavit from motor carrier. After verification, the owner gets the truck scrapped and provides scrappage receipt to CSS. CSS then provides the owner with a grant for scrappage and low-interest financing for a newer truck. By the end of 2010 288 had been successfully scrapped.
Source: CSS Presentation titled “Seaport Truck Scrappage and Retrofits for Air in Puget Sound (ScRAPS)” made to visiting delegation from China in June 2010.
4.4 Enhancing fuel efficiency of on-road fleet: Voluntary programs and partnership approaches
82. For the rest of the existing fleet the imperative is to turn the average into good operators by inducing a culture of continuous improvements. The evidence suggests that there is a great deal of diversity in the awareness and adoption of technologies and practices that maximize fuel efficiency in the fleet. On one hand there already exist a variety of examples of good practice across Brazil. The best fleets have already adopted much of the state of the art in technologies, management practices and training to maximize on fuel efficiency. There is also evidence that in some cases shippers can drive a process inducing carriers they contract to similarly increase their focus on fuel efficiency. Programs such as Despoluir, EconomizAr and TransportAr reflect organized efforts to mainstream good maintenance and environmental practice. That said the challenge is to institutionalize the still-fragmented set of initiatives and achievements to achieve fleet-wide improvements in a sector where the government has a relatively minor role.
83. The particular nature of the trucking industry offers both barriers and opportunities that frame the possibilities for an effective initiative. On one hand any successful effort in this context needs to recognize that:
a. Trucking is principally a private sector activity. Truckers are private sector actors operating in market environments. Moreover, a number of them are entrepreneurs and individual owner-operators operating small businesses that capital investment, and managerial focus carefully. Light-touch initiatives consistent with market principles will be more likely to gain traction and be successful in this sector.
b. Awareness and credibility of fuel saving measures remains a barrier. Advanced fuel-saving technologies and practices, despite their economic benefits through fuel saving, have not been widely adopted in Brazil. The limited evidence in Brazil, as well as the experience internationally suggests that at least two factors contribute to this. First, the market does not have awareness and reliable knowledge of performance, cost and availability of fuel efficiency technologies. Additionally, in a fragmented generally under-capitalized industry where access to finance is limited, fuel efficiency, despite the possibilities for
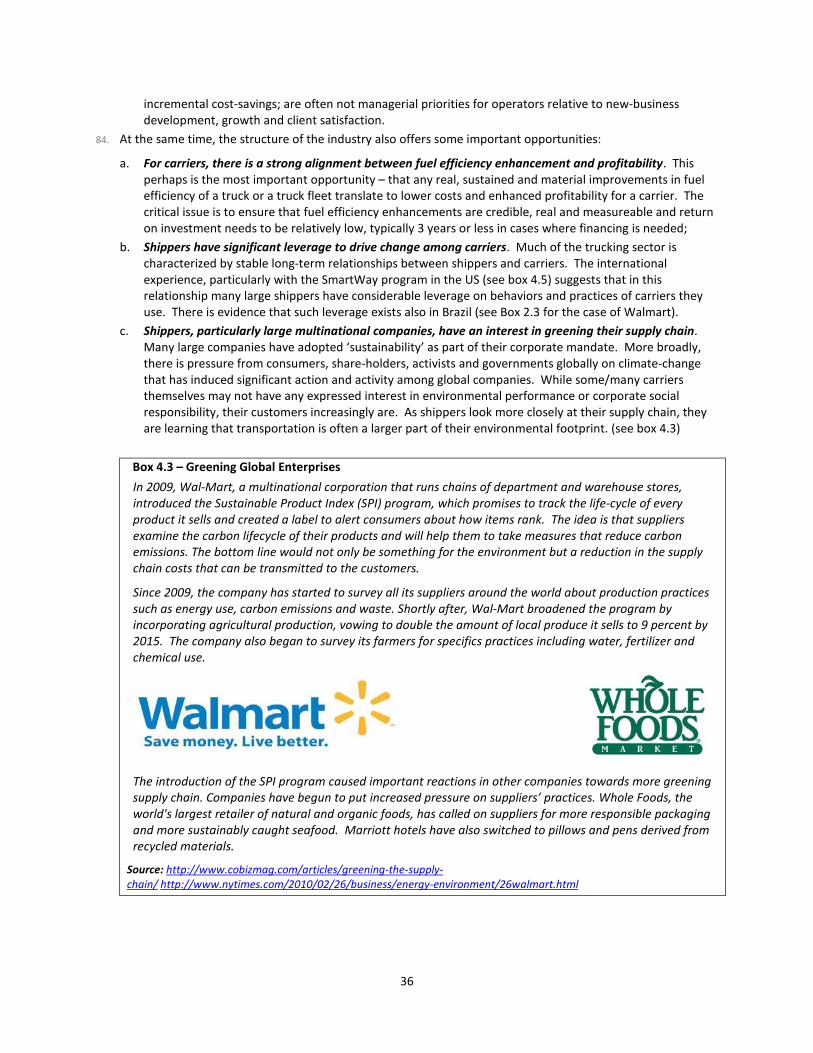
36
incremental cost-savings; are often not managerial priorities for operators relative to new-business development, growth and client satisfaction.
84. At the same time, the structure of the industry also offers some important opportunities:
a. For carriers, there is a strong alignment between fuel efficiency enhancement and profitability. This perhaps is the most important opportunity – that any real, sustained and material improvements in fuel efficiency of a truck or a truck fleet translate to lower costs and enhanced profitability for a carrier. The critical issue is to ensure that fuel efficiency enhancements are credible, real and measureable and return on investment needs to be relatively low, typically 3 years or less in cases where financing is needed;
b. Shippers have significant leverage to drive change among carriers. Much of the trucking sector is characterized by stable long-term relationships between shippers and carriers. The international experience, particularly with the SmartWay program in the US (see box 4.5) suggests that in this relationship many large shippers have considerable leverage on behaviors and practices of carriers they use. There is evidence that such leverage exists also in Brazil (see Box 2.3 for the case of Walmart).
c. Shippers, particularly large multinational companies, have an interest in greening their supply chain. Many large companies have adopted ‘sustainability’ as part of their corporate mandate. More broadly, there is pressure from consumers, share-holders, activists and governments globally on climate-change that has induced significant action and activity among global companies. While some/many carriers themselves may not have any expressed interest in environmental performance or corporate social responsibility, their customers increasingly are. As shippers look more closely at their supply chain, they are learning that transportation is often a larger part of their environmental footprint. (see box 4.3)
Box 4.3 – Greening Global Enterprises
In 2009, Wal-Mart, a multinational corporation that runs chains of department and warehouse stores, introduced the Sustainable Product Index (SPI) program, which promises to track the life-cycle of every product it sells and created a label to alert consumers about how items rank. The idea is that suppliers examine the carbon lifecycle of their products and will help them to take measures that reduce carbon emissions. The bottom line would not only be something for the environment but a reduction in the supply chain costs that can be transmitted to the customers.
Since 2009, the company has started to survey all its suppliers around the world about production practices such as energy use, carbon emissions and waste. Shortly after, Wal-Mart broadened the program by incorporating agricultural production, vowing to double the amount of local produce it sells to 9 percent by 2015. The company also began to survey its farmers for specifics practices including water, fertilizer and chemical use.
The introduction of the SPI program caused important reactions in other companies towards more greening supply chain. Companies have begun to put increased pressure on suppliers’ practices. Whole Foods, the world's largest retailer of natural and organic foods, has called on suppliers for more responsible packaging and more sustainably caught seafood. Marriott hotels have also switched to pillows and pens derived from recycled materials.
Source: http://www.cobizmag.com/articles/greening-the-supply-chain/ http://www.nytimes.com/2010/02/26/business/energy-environment/26walmart.html
37
d. There is a gap on both standardization and credibility in companies’ efforts to ‘green’ their supply chain. Consistent and uniform carbon accounting is a particular challenge. There are a number of different modal and international initiatives currently underway to standardize the manner in which carbon in the supply chain is accounted for and reported. (see box 4.4). Additionally, there are concerns about ‘greenwashing’ and a demand for third party monitoring of greening claims.
Box 4.4: Standardized Carbon Reporting in the Freight Industry.
There is a lot of interest at present in the freight industry to develop consistent and uniform carbon reporting tools. Many shippers already report their carbon footprint and are under pressure to extend this reporting to so-called ‘Scope 3’ operations18
. Consequently carriers, from ocean shippers like Maersk to integrated carriers such as DHL are under pressure to report a carbon footprint of freight movement as part of their offering. Consequently, a host of efforts are ongoing to develop and harmonize protocols for calculating carbon accounting in the supply chain. Some of these measures are led by Government, such as SmartWay’s development of standardized measurement tools for trucking and current EU regulations under finalization for freight. Others are led by consortia of NGO’s companies and government such completely by the private sector such as ‘SmartWay Europe’ and the shipping community. All of them are driven by demand, most of it from shippers for transparency of the carbon use in their supply chain. The World Bank is a participant in many of these efforts.
85. The opportunity – create a voluntary partnership based program. Both Brazilian and international experience suggests that market structure and relationships between key stakeholders in the trucking industry offer important opportunities for collaborative and voluntary programs to reduce the environment impact of the industry. The SmartWaySM
a. Test and certify the effectiveness of new fuel efficiency technologies. Such certification can play a role in reducing uncertainty and providing the carrier industry confidence on valid technologies and practices
program in the US (see box 4.5) may be a particularly good example on how a range of fragmented bottom-up initiatives can be scaled up and institutionalized. In the case of Brazil, there is value to consider a voluntary program where an credible independent entity can systematically:
19
b. Standardize protocols for compiling and reporting carbon-use data in the supply chain. As already discussed, there are several international efforts already underway to develop standardized protocols to this effect. The key would be to ensure consistency with these efforts and address regulatory and proprietary concerns related to data sharing from private companies. The World Bank has an active dialog with organizations leading these efforts internationally.
. The effort as part of this study indicated clearly: (i) the value such a certification process can have to address concerns and information gaps in the industry; and (ii) the need to develop standardized test protocols, methods and agencies to effectively carry out such tests. In Brazil, there are several laboratories and government agencies capable of assuming a role in testing and certification. The Ministry of Technology and Standards could have a role in defining this process.
c. Provide shippers an incentive to lower the carbon footprint of their supply chain by quantifying, reporting and certifying related activities by a shipper. Shippers can induce the carriers that serve them to focus on enhancing fuel efficiency by adopting good practice and validated technologies. They may commit to ship freight only with green carriers, thus providing market incentives to green the supply chain. They can be induced to do so by monitoring and as appropriate certifying their efforts in this regard. Shippers can be recognized based on measurable outcomes (such as self-reported or third-party certified reductions in energy use in the supply chain) and outputs (use of carriers that report data on fuel efficiency using the standardized protocols and have adopted a minimal level of certified fuel efficiency
18 Scope 3 is defined in UNFCC parlance to include subcontractors. 19 See http://www.epa.gov/SmartWaylogistics/transport/what-SmartWay/verified-technologies.htm for an example of valid technology list from US EPA; which have been compiled in book form by Cascade Sierra Solutions.
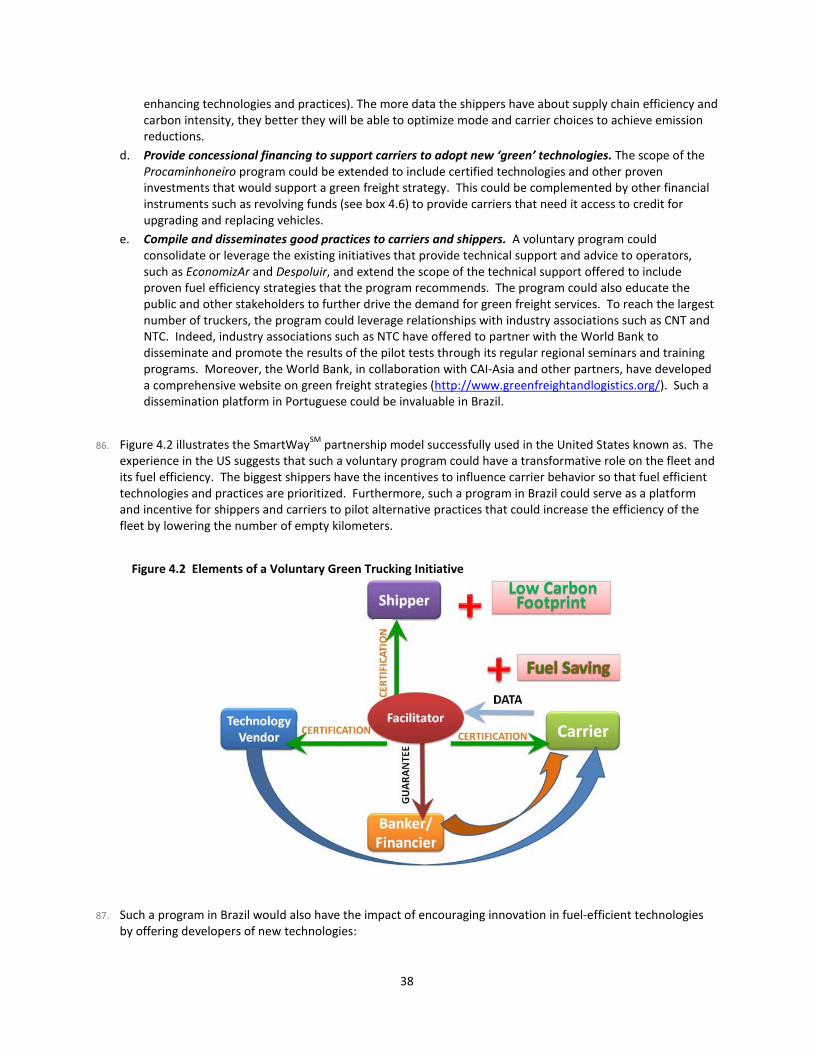
38
enhancing technologies and practices). The more data the shippers have about supply chain efficiency and carbon intensity, they better they will be able to optimize mode and carrier choices to achieve emission reductions.
d. Provide concessional financing to support carriers to adopt new ‘green’ technologies. The scope of the Procaminhoneiro program could be extended to include certified technologies and other proven investments that would support a green freight strategy. This could be complemented by other financial instruments such as revolving funds (see box 4.6) to provide carriers that need it access to credit for upgrading and replacing vehicles.
e. Compile and disseminates good practices to carriers and shippers. A voluntary program could consolidate or leverage the existing initiatives that provide technical support and advice to operators, such as EconomizAr and Despoluir, and extend the scope of the technical support offered to include proven fuel efficiency strategies that the program recommends. The program could also educate the public and other stakeholders to further drive the demand for green freight services. To reach the largest number of truckers, the program could leverage relationships with industry associations such as CNT and NTC. Indeed, industry associations such as NTC have offered to partner with the World Bank to disseminate and promote the results of the pilot tests through its regular regional seminars and training programs. Moreover, the World Bank, in collaboration with CAI-Asia and other partners, have developed a comprehensive website on green freight strategies (http://www.greenfreightandlogistics.org/). Such a dissemination platform in Portuguese could be invaluable in Brazil.
86. Figure 4.2 illustrates the SmartWaySM
partnership model successfully used in the United States known as. The experience in the US suggests that such a voluntary program could have a transformative role on the fleet and its fuel efficiency. The biggest shippers have the incentives to influence carrier behavior so that fuel efficient technologies and practices are prioritized. Furthermore, such a program in Brazil could serve as a platform and incentive for shippers and carriers to pilot alternative practices that could increase the efficiency of the fleet by lowering the number of empty kilometers.
Figure 4.2 Elements of a Voluntary Green Trucking Initiative
87. Such a program in Brazil would also have the impact of encouraging innovation in fuel-efficient technologies
by offering developers of new technologies:
39
• A standardized process for certification. The public interest is in the testing protocol and the process itself could be the responsibility of specialized labs or research units.
• A platform in the form of the voluntary program described above to mainstream the deployment of such technologies.
Box 4.5 US EPA’s SmartWaySM
A program should build on existing successful programs for freight and logistics. The most relevant programs are the US SmartWay
– A Voluntary Freight program
SM Program (www.epa.gov/SmartWay), ObjectifCO2 in France and Freight Best Practice in the UK. The SmartWaySM
SmartWay
program launched by US EPA in 2004 identifies products and services that reduce transportation-related emissions. The program is a partnership among government, business and consumers to protect the environment, reduce fuel consumption, and improve air quality. The program is managed by a staff of about a dozen with a budget of about US$1.5 million a year.
SM partners include carriers and shippers who agree to provide energy use data in a standardized format as the condition of joining. Carriers and shippers are recognized for measurable improvements in fuel efficiency based both on reported outcomes as well as on other measurable actions – such as carriers prioritizing the use of SmartWaySM partner carriers, and carriers who adopt SmartWaySM certified technologies. The best performing partners are also allowed to use the SmartWaySM
The SmartWay
logo and brand – see figure – as part of their marketing efforts.
SM
SmartWay
program also verifies potential fuel saving technologies and has supported the marketing of such technologies by offering manufacturers the right to market its logo that identifies operators which meet established fuel efficiency and emissions standards.
SM spends a considerable element of its program budget promoting its brand. The 2900+ SmartWaySM partners included over a 1000 carriers including the 100 largest carriers, all major logistics firms and large shippers including Fortune 50 firms from every sector. Since 2004 SmartWaySM
The World Bank and SmartWay
estimates that the program has been responsible for a savings of 50 million barrels of oil, equivalent to16.5 million metric tonnes of CO2. The program also estimates that it has contributed to reduction on 9,000 tonnes of PM and 235,000 tonnes of NOx emissions.
SM have collaborated on a green freight partnership effort in China. Additionally, SmartWaySM
and the World Bank (specifically the authors of this report) provided a joint training on green freight efforts at an international UN workshop in New York in May 2011.
Source: SmartWaySM website (http://www.epa.gov/SmartWay/index.htm) and May 2011 Presentation
88. If there is an agreement within the Government on proceeding with such a program, there would be a need for detailed program design to establish roles responsibilities for various stakeholders. Important issues would relate to:
a. Government involvement – Should the government have a role in the program? What are the alternatives to government for such a credible facilitation role. Could some element of government play a role, such as the EPA in the US, as the facilitator in Figure 4.2 - certifying technologies, recruiting shippers and carriers, monitoring and reporting their behavior, facilitating access to financing, and disseminating successful experiences with fuel efficiency enhancements? Potentially, a working group or entity staffed with experts from various government agencies including the Ministries of Transport, Environment, and ANTT could be charged with leading such a program and acting as the facilitator.
40
b. Harmonization with existing efforts. There would be a need to decide whether Brazil can rely on the certification processes already in place and how to complement these existing certification efforts. The operational tests underway as part of this exercise are being conducted in part to inform this question and to understand the issues related to harmonizing with international certification of fuel efficiency enhancing technologies.
c. There would be similar issues related to the adoption of carbon reporting tools. Again, on one hand there are significant advantages to creating protocols consistent with tested and commonly used international protocols. However, there would be a need to ensure that these protocols are consistent with the data availability and interests of Brazilian carriers and shippers.
d. Financing. An appropriately designed program may not need much funding – technology vendors could pay for the certification process, carriers and shippers should be able to pay for any required third-party certification of their carbon reports. However, some financing maybe needed for program management and administration as well as to develop and promote the value of the program brand. There would be a need to explore sources for such financing and the operational challenges to implementing them.
e. Public Sector Fleets. In the case of fleets that are either operated or contracted by the Public Sector, there is a public interest in prioritizing green freight strategies. Public Fleets, whether operating at federal, state or municipal levels, should use state-of-the-practice good practices relating to truck technologies in use, driver training and management practices. Standard clauses on environmental performance could be developed and incorporated into all public sector contracts – ranging from garbage trucks to long haul freight carriers. The opportunity in this context could be significant: a pilot conducted by the World Bank in Guangzhou, China generated 18 percent fuel savings when the tires and driver practices in the publicly operated garbage fleet were upgraded.
Box 4.6 The Cascade Sierra Solutions (CSS) Revolving Loan Fund (RLF) – Going from US$50K to US$50m
CSS has been building the RLF since May 2008 as a source of capital to leverage further private investments that can support loans and leases to trucking companies. CSS raises capital from grants, the first was $50,000.00 from Spirit Mountain Community Fund (Confederated Tribes of Grand Ronde). In September 2008, they received $1.13 million from the USEPA.
CSS uses capital contributed to the loan fund as security to raise further private investment. In most cases, this takes place at a 9:1 ratio. For example, for every $1 million in RLF capital raised by CSS; lenders such as commercial banks lend another $9 million, for total of $10 million in capital. Loans are made in a similar manner; if CSS makes a $100,000 loan for a truck, $10,000 of that is from the RLF and $90,000 is from a lender. The lender has greater confidence as the CSS $10,000 is at risk first and CSS will protect the lender’s investment in protecting their own.
In the last 3 years, this fund has raised $12M in RLF contributions and has used that to leverage $50M more and used all of the funds to finance cleaner diesel truck solutions. The Port of Long Beach program was one example. Over 250 truck replacements were financed. Owners of trucks that were for the most part pre 1996 models (tier 1 model engines) were lease financed newer 2004 model trucks (tier 3 model engines) equipped with DPF to meet California compliance. 28 trucks were Kenworth T600 alternative fuel LNG engines. Each new truck has a GPS installed with the direct tracking provided to CSS from the GPS provider Webtech Wireless.
Source: Authors compiled from information provided by Cascade Sierra Solutions
4.5 Future fleets: market led but complemented by a supportive regulatory regime
89. Accelerating innovation in the trucking sector. The focused strategies on the existing fleet described above can be complemented by a series of steps that can be used to accelerate innovation in practice and in new vehicles in the fleet. Initiatives most relevant to the Brazilian context could include:

41
a. A systematic review of taxation policies on trucks to ensure that the incentives for truckers are consistent with Brazil’s national interests with respect to efficiency and environmental performance.
b. Fuel – a dynamic policy that continues Brazil’s tradition of innovation with bio-fuels in the context of the development of sustainable second-generation biofuels, improvements in diesel quality with low sulfur fuels and other possible alternatives.
c. Liaison with private sector for encouraging pilots, supporting with regulatory initiatives, and training/awareness campaigns.
d. Consider transitioning to a performance-based regulatory approach to truck weights and lengths. As discussed in Section 3, adoption of a performance based regime can induce innovation of longer and heavier trucks that are able to lower fuel use without compromising system safety.
e. Innovation funds to promote and create a culture for smart practice puts the onus on other stakeholders to suggest solutions that reduce system fuel efficiency. In the US such grants have financed activities as diverse as revolving funds for truck upgrading and electrification of rest stops (see box 4.7 for examples of two grant programs in the State of California).20
Box 4.7 Supporting a culture of Innovation: Grant Programs
The Innovative Clean Air Technologies grant program (ICAT) is a California Air Resources Board program that co-funds the demonstration of innovative technologies that can reduce air pollution. Its purpose is to advance such technologies toward commercial application, thereby reducing emissions and helping the economy of California. It funds projects to develop technologies that have passed the laboratory stage of development into the prototype or demonstration stages. Fundable projects must meet certain criteria. Grants can be obtained by businesses, not-for-profits, municipalities and universities and can be up to $250,000. Briefly, the most important criteria for the proposed technology or solution are:
• Promote emission reductions in California by: (i) introducing a new prevention or control technology; (ii) increasing the degree of control provided by an existing technology, or (iii) reducing the cost or other practical impediment to a control technology, or (iv) increasing the scope of application of a control technology.
• Potential for commercialization, preferably by the applicant or its business partners. The commercialization should have a potential for adding to the California economy.
• Appropriate stage of development. ICAT funding is limited to pilot projects (preferably located in the field), prototype creation and deployment, and field demonstrations of near market-ready systems. Marketing work is not supported.
• Definitive goals, specific tasks to achieve them, a schedule and a reasonable cost for the work proposed.
• Applicant must arrange at least 50 percent of the funding for the project, of which at least 10 percent must be the applicant's own cash.
• Applicant must be financially stable and competent to commercialize the innovation The California Energy Commission's Energy Innovations Small Grant (EISG) Transportation Program provides up to $95,000 for hardware projects and $50,000 for modeling projects to small businesses, non-profits, individuals, and academic institutions to conduct research that establishes the feasibility of new, innovative energy concepts. Research projects must target a Public Interest Energy Research transportation subject area, address a California energy problem, and provide a potential benefit to California electric ratepayers.
Source: Compiled by authors based on information on http://www.arb.ca.gov/research/icat/icat.htm and http://www.energy.ca.gov/research/innovations/transportation.html
20 Truck drivers in the US often sleep in their trucks during long distance trips and it is not unusual to run on idle for long periods of time so that truckers could make use of air conditioning, on-board computers and electronics at rest-stops. Electrification units at truck rest-stop are estimated to have saved significant amounts of CO2 and diesel in the US. Though the application would be quite different in the Brazilian context, this is the kind of innovation that could be encouraged by such a fund.

42
5. Agenda for World Bank Support
90. This section presents preliminary ideas for an operational strategy to support greening the freight sector in Brazil. It summarizes the key gaps and issues which would be appropriate for the Bank to support and identifies possible operational instruments with the potential to be used for this purpose.
5.1 Near-term opportunity: Providing input to National Climate Change Plan
91. The Ministry of Transport and Ministry of Environment expect to complete the transport section of the National Climate Change Plan by December 2011 with input from other agencies and partners. Part of the work in the Phase 2 of the current NLTA would support development of key input into that plan drawing on the findings and recommendations of this study. The focus of this near-term input is expected to be:
• What is the cumulative potential for a fleet modernization strategy for freight transport in Brazil? This could be addressed by leveraging the information being collected for the pilot tests and extend the methodology and scenario analysis used under the World Bank’s Low Carbon Study for Brazil.
• What should be prioritized in the short-term and with limited resources? Estimating the time and resource requirements for the strategies described previously would help inform decisions about priorities within such plans as the PNLT.
• What can be done about barriers such as lack of financing and information for specific segments of the market? The World Bank might encourage a dialog between government agencies and industry to identify the opportunities that would allow the potential to accelerate the “greening” of the truck fleet and sector as a whole to be realized.
5.2 An Operational Agenda
92. The immediate operational priority for Phase 2 of this NLTA includes the following activities:
• Completion, evaluation, and dissemination of ongoing pilot tests of key retrofit technologies and practices with the potential to improve energy efficiency of road-based freight transport;
• Support for the development of the transport section of the National Climate Change Plan through technical input and a stakeholder workshop;
• Policy dialog with government and other stakeholders to identify a national level program to institutionalize freight sector energy-efficiency incentives and investments.
93. Additionally, the World Bank is well placed to support Brazil to develop and implement a comprehensive green freight strategy as identified in Section 4. The potential elements of this support are described below.
94. Technical assistance to support strategic and regulatory analysis.
• Green freight strategy and scenario analysis as input into the National Climate Change Strategy
There are a number of technical assistance studies identified in Section 4 that can be implemented as technical assistance in Bank-financed transport loans. The key recommended studies which to be discussed with government and partners are:
• Incorporating climate considerations and opportunities into PNLT investment strategy – developing a strategic model to evaluate carbon benefits of investment options
• Trucking industry study and database – conducting a study of industry structure, estimating carbon intensity of industry and developing monitorable strategies towards a fleet with lower carbon-intensity
• Regulatory framework for trucking – an operational framework to position trucking within a green growth context examining in particular performance-based regulation, fees, taxes, and financing programs.
43
• Development of recommendations for a vehicle scrappage policy and replacement program
• Development of multi-modal and internationally harmonized carbon-reporting protocols and comparative evaluation of emissions and life cycle costs for different modes considering the characteristics of the Brazilian sector
• Support for a private sector engagement strategy - including design of a voluntary program and other firms of engagement, supporting capacity building and dissemination through a ‘green freight’ web site, meetings, and technical visits.
• A strategy to support 2nd
• Logistics modernization study - detailed study of the current logistics brokerage industry in Brazil with identification of regulatory, capital and related market barriers; piloting a modern, web-based brokerage platform
generation fuels and advanced technologies
95. Technical assistance to support operational measures
• Support for the development of a voluntary partnership program for the freight industry (based on SmartWay
. Additionally, technical assistance studies can be used to support the development of key programs identified in Section 4. These include:
SM
• Support for feasibility and detailed planning support for low-carbon infrastructure investments (priority road improvements, strategic rail and inland waterway assessments);
and other comparable programs) including setting up: (i) a shipper liaison and energy-use assessment program; (ii) a carrier liaison and energy-use assessment program; and (iii) a supplier management and technology certification program;
• Recommendations for an innovation program that includes: (i) liaison with private sector entities to support innovative pilots; (ii) support for development and deployment of innovative construction methods and materials; and (iii) grant programs that promote innovative solutions focused on the environmental performance of the freight sector.
96.
• Supporting the evaluation and dissemination of additional technology demonstrations, including vehicle retrofit technologies, next generation fuels and propulsion systems, advanced management practices.
Pilots and small-scale financial support.
• Support for revolving funds and other financial instruments to support deployment of proven low-carbon technologies in the marketplace. Such a program would support the development of effective, market-based mechanisms to support financing of the equipment, as well as the development of the market for the supply of green technologies. Such a incentive program could be structured in different forms including: developing a risk-sharing facility, where-bye participating banks can mitigate their exposure when lending to higher-risk SMEs and transaction costs of lending to high-risk (usually small undercapitalized) truckers can minimized with streamlined processes; (ii) rebate schemes to lower the up-front cost of procurement (with the expectation that as technologies become more widely available, prices will fall, and rebates would only be needed in the short-term); and (iii) provision of performance-based payments that will provide trucking companies an incentive to adhere to the operating and maintenance principals associated with maximizing the benefits of such technologies, and reward them for participating in reporting and monitoring schemes.
• Support for the design and implementation of a pilot scrappage fund and technology innovation fund.
97. All of these forms of assistance can be mobilized as components in existing transport sector lending operations or packaged together as a Global Environmental Facility grant project (see box 5.1 for description of a similar project approved by the GEF in China). Furthermore, various non-lending technical assistance can also be financed separately by other programs and related knowledge products.
44
Box 5.1 The GEF GUANGDONG GREEN FREIGHT DEMONSTRATION PROJECT
This project was approved by the World Bank and GEF in April 2011. The GEF-financed project (see Table below for financing structure) has the objective of (a) demonstrating the global and local environmental benefits of the application of energy efficiency vehicle technologies and operating techniques, and (b) support development of sustainable measures for improving energy efficiency and reducing greenhouse gas emissions in the road freight transport sector in Guangdong province in China.
The project is being executed by the Department of Transport (DoT) in the Province as the leading agency for the preparation and implementation of the Project.
Key activities of the project include:
• Component 1: Green Truck Technology Demonstration. Facilitating communication and cooperation among energy efficient vehicle technology suppliers, freight carriers, freight shippers, and other key stakeholders, and enabling Project participants access to government and commercial financing, including the provision of financing of Green Freight Technology Rebates and Performance-Based Payments.
• Component 2: Green Freight Logistics Demonstration. Carrying out of market studies for drop and hook logistics methods and a proposed provincial logistics brokerage platform, and assisting in demonstration exercises of such methods and platform, through the provision of financing of Green Freight Technology Rebates and Performance-Based Payments.
• Component 3: Capacity Building. Provision of technical advisory services for the preparation of green freight policy research papers, delivery of training for government officials and enterprise managers, and promotion of the Project and green freight development, including support to the Guangdong green freight websites.
• Component 4: Project Implementation Support.
Project Components Cost (USD) GEF (USD) GEF (%)
1) Green Truck Technology Demonstration 9,805,000 2,400,000 24
2) Green Freight Logistics Demonstration 1,900,000 900,000 47
3) Capacity Building 1,645,000 550,000 33
4) Project Implementation Support 560,000 290,000 52
Total 13,910,000 4,140,000 30
Contingencies 60,000 60,000 100
Total Project Cost 13,970,000 4,200,000 30 Key outcome indicators for measuring the achievement of development objectives are: (a) improvement in the fuel economy (km per unit of fuel combusted) of participating trucks; (b) reduction in the operating cost of truck fleets managed by participating companies (per ton-km travelled); and (c) total amount of CO2e emission reduction directly generated from fuel savings through the duration of the demonstration.