braving the european cartastrophe · pricing matters: along with lower sales volumes in europe,...
TRANSCRIPT
THIS REPORT WAS PREPARED BY “T IM OTTO”, A MASTERS IN FINANCE STUDENT OF THE NOVA SCHOOL OF BUSINESS AND ECONOMICS, EXCLUSIVELY FOR ACADEMIC PURPOSES . THIS REPORT WAS SUPERVISED BY ROSÁRIO ANDRÉ WHO REVIEWED THE
VALUATION METHODOLOGY AND THE FINANCIAL MODEL . (SEE DISCLOSURES AND DISCLAIMERS AT END OF DOCUMENT ) See more information at WWW.NOVASBE.PT Page 1/31
MASTERS IN FINANCE
EQUITY RESEARCH
� Attractive valuation: We value BMW through a Sum of
the parts DCF/FCFE method with a target price of €87 per share
implying an upside potential of more than 15%.
� Offsetting the worsening European car market: The
tightening conditions in Europe will start to hurt premium
manufacturers like BMW. Nevertheless, the company appears to
be well prepared to weather some headwinds.
� Pricing matters: Along with lower sales volumes in
Europe, pricing seems to be still a problem. Especially BMW
started to offer significant discounts.
� Model portfolio at its sweet spot: BMW has currently its
youngest model ever which should further support the
achievement of high sales volumes.
� Technology will pay off in the future: 2013 is the year of
the “i3”, the company’s first full electronic vehicle. Though sales
figures could fall short in the beginning, it should be starting point
of the new mobility age.
Company description
Bavarian based BMW Group is the world’s leading manufacturer of premium light vehicles. In addition, it produces motorcycles and offers financial services to customers and dealers. Premium light vehicle brands include BMW, Mini and Rolls Royce whereas the motorcycle brands consist of BMW Motorcycle and Husqvarna. The BMW Group operates worldwide and has currently 17 production facilities in six countries.
BAYERISCHE MOTOREN WERKE COMPANY REPORT
“AUTOMOBILES” 07.01.2013
STUDENT: TIM OTTO [email protected]
Braving the European Cartastrophe
Recommendation: BUY
Price Target FY13: 87.00 €
Price (as of 7-Jan-13) 75.56 €
Reuters: BMWG, Bloomberg: BMW GR
52-week range (€) 48,52-75,72
Market Cap (€m) 48,327.48
Outstanding Shares (m) 655
Source:Bloomberg
Source: Bloomberg
(Values in € millions) 2011 2012E 2013F
Revenues 68.821 75.387 79.898
EBITDA 15.442 16.010 16.932
EBIT 8.018 8.033 8.393
EBIT Margin 11,7% 10,6% 10,50%
Net Income 4.907 5.113 5.455
EPS 7,49 7,81 8,33
Source:Company Data; Analysts Estimates
“B AYERISCHE MOTOREN WERKE” C OMPANY REPORT
PAGE 2/31
Table of Contents
Company Overview 3
Company Description 3
Shareholder Structure 4
Automobile Sector 5
Sector Decription 5
Macroeconomic Outlook 6
Sales Development 8
Germany 8
Rest of Europe 10
USA 11
China / JV Brilliance Automotive 13
Pricing Trends 15
Model Mix 17
R&D and E-Mobility 20
Financial Services 23
Valuation 25
Scenarios 25
Valuation Summary 26
Financials 29
Disclaimer 31
“B AYERISCHE MOTOREN WERKE” C OMPANY REPORT
PAGE 3/31
Company overview
Company description
Bayerische Motoren Werke Aktiengesellschaft (BMW) is a premium automobile
manufacturer based in Munich. The product portfolio of the company comprises
premium cars and bikes. BMW offers them under international premium brands,
namely, BMW, Rolls-Royce and Mini in more than 150 countries across the
world. It also offers general financial services to its dealers and customers. In
2011, the BMW Group reported revenues of €68,821 billion and is expected to
report an increase in revenues by some 10% for 2012.
The company operates through three different business segments, namely,
Automotive, Motorcycles and Financial Services.
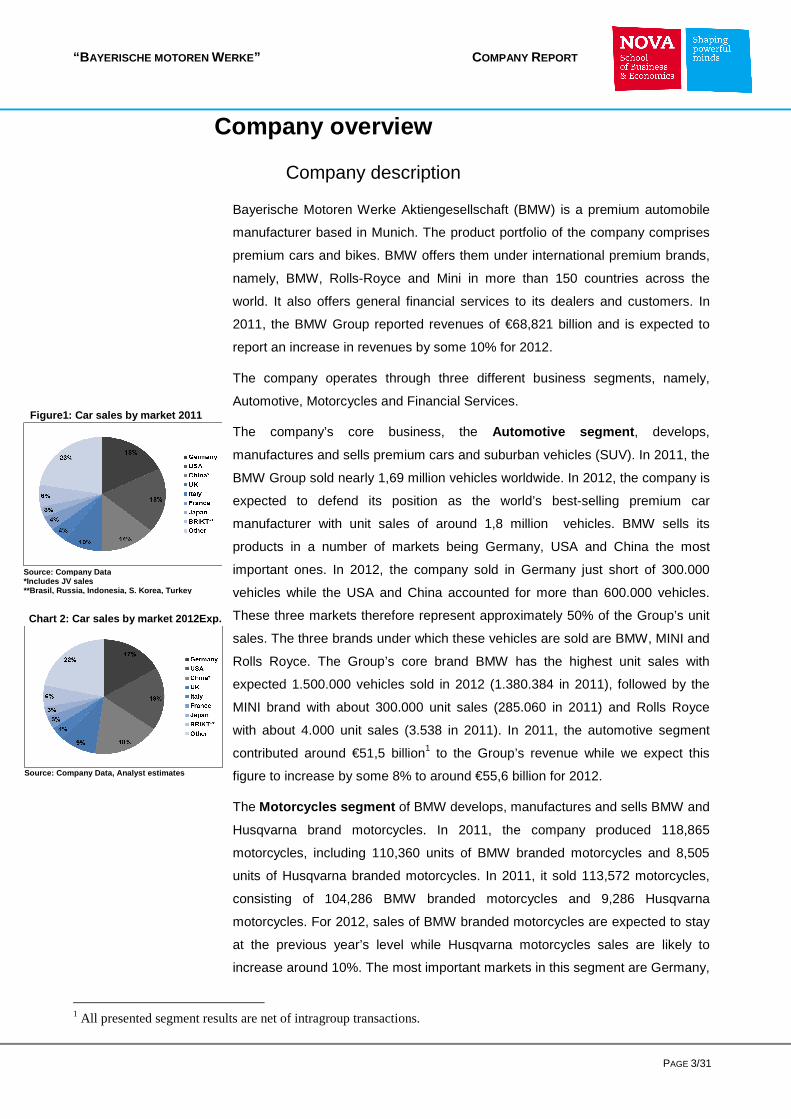
The company’s core business, the Automotive segment , develops,
manufactures and sells premium cars and suburban vehicles (SUV). In 2011, the
BMW Group sold nearly 1,69 million vehicles worldwide. In 2012, the company is
expected to defend its position as the world’s best-selling premium car
manufacturer with unit sales of around 1,8 million vehicles. BMW sells its
products in a number of markets being Germany, USA and China the most
important ones. In 2012, the company sold in Germany just short of 300.000
vehicles while the USA and China accounted for more than 600.000 vehicles.
These three markets therefore represent approximately 50% of the Group’s unit
sales. The three brands under which these vehicles are sold are BMW, MINI and
Rolls Royce. The Group’s core brand BMW has the highest unit sales with
expected 1.500.000 vehicles sold in 2012 (1.380.384 in 2011), followed by the
MINI brand with about 300.000 unit sales (285.060 in 2011) and Rolls Royce
with about 4.000 unit sales (3.538 in 2011). In 2011, the automotive segment
contributed around €51,5 billion1 to the Group’s revenue while we expect this
figure to increase by some 8% to around €55,6 billion for 2012.
The Motorcycles segment of BMW develops, manufactures and sells BMW and
Husqvarna brand motorcycles. In 2011, the company produced 118,865
motorcycles, including 110,360 units of BMW branded motorcycles and 8,505
units of Husqvarna branded motorcycles. In 2011, it sold 113,572 motorcycles,
consisting of 104,286 BMW branded motorcycles and 9,286 Husqvarna
motorcycles. For 2012, sales of BMW branded motorcycles are expected to stay
at the previous year’s level while Husqvarna motorcycles sales are likely to
increase around 10%. The most important markets in this segment are Germany,
1 All presented segment results are net of intragroup transactions.
Figure1: Car sales by market 2011
Chart 2: Car sales by market 2012Exp.
Source: Company Data *Includes JV sales **Brasil, Russia, Indonesia, S. Korea, Turkey
Source: Company Data, Analyst estimates
“B AYERISCHE MOTOREN WERKE” C OMPANY REPORT
PAGE 4/31
Italy and USA, accounting for more than 42% of the unit sales. The segment’s
revenue contribution in 2011 amounted to €1,427 billion and is assumed to
increase to €1,490 billion for 2012.
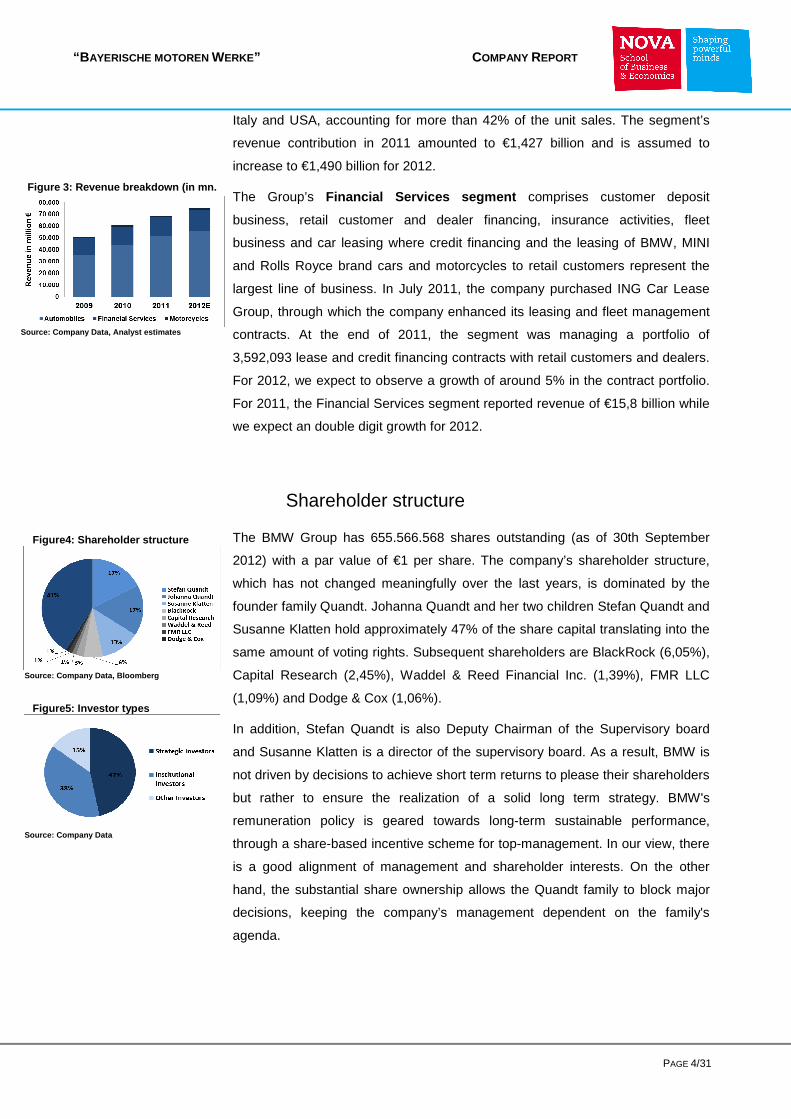
The Group’s Financial Services segment comprises customer deposit
business, retail customer and dealer financing, insurance activities, fleet
business and car leasing where credit financing and the leasing of BMW, MINI
and Rolls Royce brand cars and motorcycles to retail customers represent the
largest line of business. In July 2011, the company purchased ING Car Lease
Group, through which the company enhanced its leasing and fleet management
contracts. At the end of 2011, the segment was managing a portfolio of
3,592,093 lease and credit financing contracts with retail customers and dealers.
For 2012, we expect to observe a growth of around 5% in the contract portfolio.
For 2011, the Financial Services segment reported revenue of €15,8 billion while
we expect an double digit growth for 2012.
Shareholder structure
The BMW Group has 655.566.568 shares outstanding (as of 30th September
2012) with a par value of €1 per share. The company’s shareholder structure,
which has not changed meaningfully over the last years, is dominated by the
founder family Quandt. Johanna Quandt and her two children Stefan Quandt and
Susanne Klatten hold approximately 47% of the share capital translating into the
same amount of voting rights. Subsequent shareholders are BlackRock (6,05%),
Capital Research (2,45%), Waddel & Reed Financial Inc. (1,39%), FMR LLC
(1,09%) and Dodge & Cox (1,06%).
In addition, Stefan Quandt is also Deputy Chairman of the Supervisory board
and Susanne Klatten is a director of the supervisory board. As a result, BMW is
not driven by decisions to achieve short term returns to please their shareholders
but rather to ensure the realization of a solid long term strategy. BMW's
remuneration policy is geared towards long-term sustainable performance,
through a share-based incentive scheme for top-management. In our view, there
is a good alignment of management and shareholder interests. On the other
hand, the substantial share ownership allows the Quandt family to block major
decisions, keeping the company’s management dependent on the family's
agenda.
Figure5: Investor types
Source: Company Data
Figure4: Shareholder structure
Source: Company Data, Bloomberg
Figure 3 : Revenue breakdown (in mn. €)
Source: Company Data, Analyst estimates
“B AYERISCHE MOTOREN WERKE” C OMPANY REPORT
PAGE 5/31
Automobile Sector
Sector Description
The Automobile industry is an important driver of global growth, employment and
innovation. Especially the European car sector is of high importance as it is the
world’s largest vehicle producer, accounting for approximately one quarter of
global vehicle production. Furthermore, the industry it is an important employer
as about 12 million employments in Europe are directly linked to the automobile
sector.2
The automobile sector, leaving the suppliers a part, can be roughly divided into
two different segments, the volume manufacturers and premium car
manufactures. Volume manufacturers like Fiat, PSA, Renault, Volkswagen and
Toyota rely on high production of smaller and low-priced cars and therefore
achieving usually smaller margins. These companies derive their profits through
economies of scale and high capacity utilization. Nevertheless, European volume
market manufactures are more exposed to cyclicality than premium car makers
and are facing more pressure from pricing and declining capacity utilization as
almost all of their revenue streams come from Europe. Premium OEMs, in turn,
operate in the more profitable mid and large-sized segments and hence achieve
higher margins. Their main challenge is to comply with the strict CO2 regulations
which make high R&D investments in lower emission engines necessary.
Premium car makers are either subsidiaries of volume manufacturers like Audi,
Porsche, Lamborghini, Bentley (all Volkswagen), Ferrari, Maserati (Fiat), Lexus
(Toyota), Jaguar, Landrover (Tata Motors) or individual companies like BMW and
Mercedes-Benz3.
One of the main earnings drivers in this industry is the volume of unit sales.
Consecutively, car production and sales are fairly linked to macroeconomic
developments such as GDP growth, consumer confidence, unemployment. The
second important driver is pricing. The price of the cars is dependent on several
factors. First of all, it depends on the current demand in the market. If the sales
volume is lower than expected, car manufacturers launch purchase incentives
and rebates to meet their sales targets. Another component of the price is the
lifecycle of a certain model. A model which will be replaced in the near term by
its next generation model will be offered at a discount to ensure a smooth
2 According to ACEA (2012). 3 Mercedes-Benz’s parent company Daimler AG is not considered as mass manufacturer.
“B AYERISCHE MOTOREN WERKE” C OMPANY REPORT
PAGE 6/31
changeover. This fact already indicates the importance of another factor which is
the model mix and model age as new models typically achieve higher unit sales
and better prices.
Foreign exchange rates and raw material prices are two other important factors
affecting the automotive industry. Most of the car manufacturers are operating
globally and are therefore exposed to currency risks. Nevertheless, most of the
currency exposure is usually hedged through derivatives or through natural
hedging, meaning the local production of vehicles rather than to import all of the
cars to certain markets.
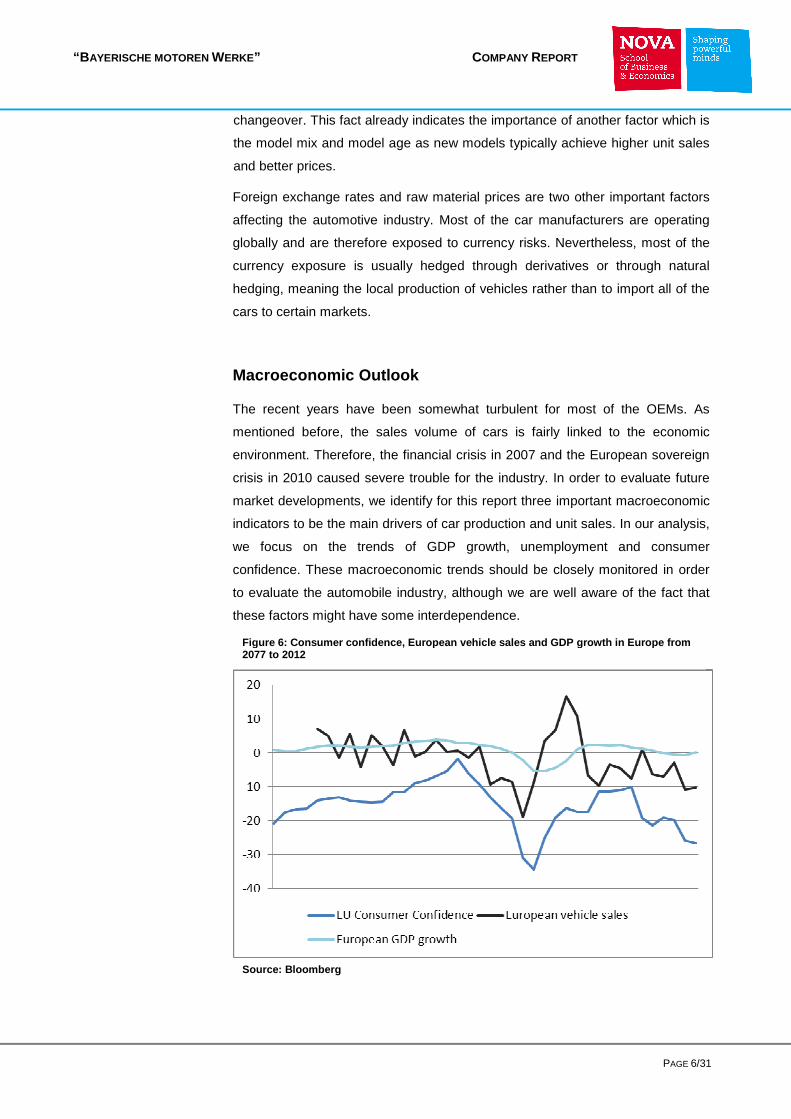
Macroeconomic Outlook
The recent years have been somewhat turbulent for most of the OEMs. As
mentioned before, the sales volume of cars is fairly linked to the economic
environment. Therefore, the financial crisis in 2007 and the European sovereign
crisis in 2010 caused severe trouble for the industry. In order to evaluate future
market developments, we identify for this report three important macroeconomic
indicators to be the main drivers of car production and unit sales. In our analysis,
we focus on the trends of GDP growth, unemployment and consumer
confidence. These macroeconomic trends should be closely monitored in order
to evaluate the automobile industry, although we are well aware of the fact that
these factors might have some interdependence.
Figure 6 : Consumer confidence , European vehicle sales and GDP growth in Europe f rom 2077 to 2012
Source: Bloomberg
“B AYERISCHE MOTOREN WERKE” C OMPANY REPORT
PAGE 7/31
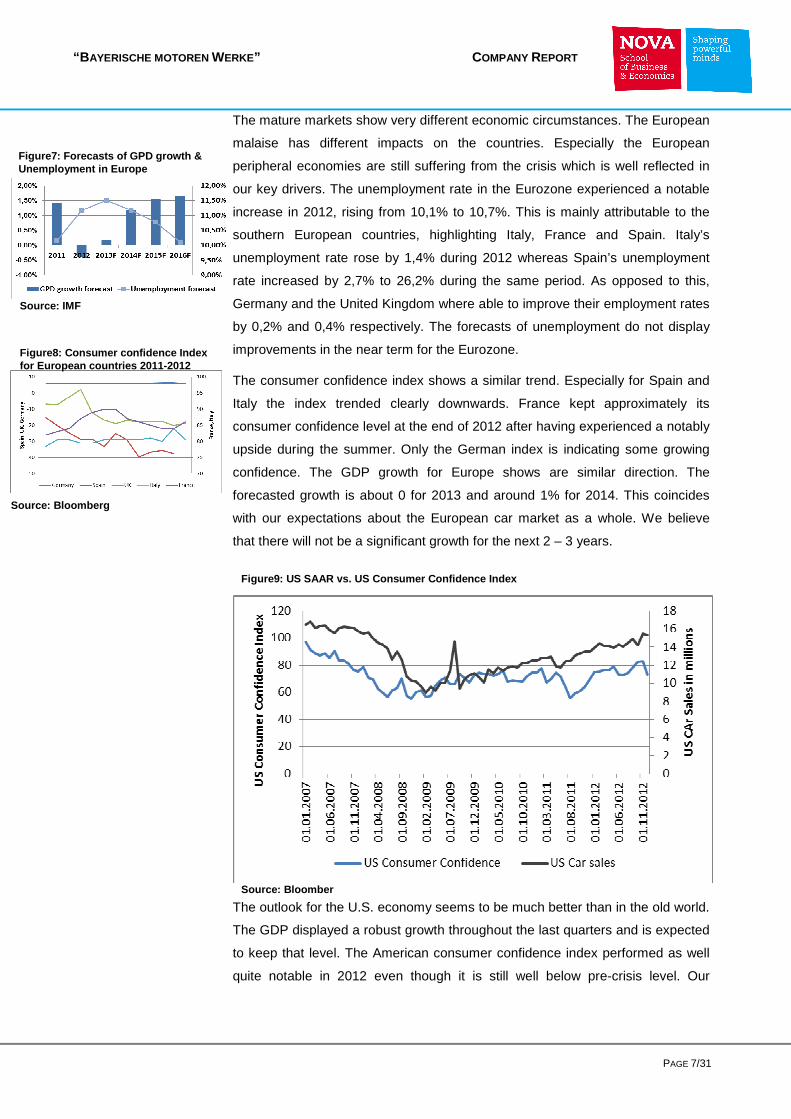
The mature markets show very different economic circumstances. The European
malaise has different impacts on the countries. Especially the European
peripheral economies are still suffering from the crisis which is well reflected in
our key drivers. The unemployment rate in the Eurozone experienced a notable
increase in 2012, rising from 10,1% to 10,7%. This is mainly attributable to the
southern European countries, highlighting Italy, France and Spain. Italy’s
unemployment rate rose by 1,4% during 2012 whereas Spain’s unemployment
rate increased by 2,7% to 26,2% during the same period. As opposed to this,
Germany and the United Kingdom where able to improve their employment rates
by 0,2% and 0,4% respectively. The forecasts of unemployment do not display
improvements in the near term for the Eurozone.
The consumer confidence index shows a similar trend. Especially for Spain and
Italy the index trended clearly downwards. France kept approximately its
consumer confidence level at the end of 2012 after having experienced a notably
upside during the summer. Only the German index is indicating some growing
confidence. The GDP growth for Europe shows are similar direction. The
forecasted growth is about 0 for 2013 and around 1% for 2014. This coincides
with our expectations about the European car market as a whole. We believe
that there will not be a significant growth for the next 2 – 3 years.
The outlook for the U.S. economy seems to be much better than in the old world.
The GDP displayed a robust growth throughout the last quarters and is expected
to keep that level. The American consumer confidence index performed as well
quite notable in 2012 even though it is still well below pre-crisis level. Our
Figure7 : Forecasts of GPD growth & Unemployment in Europe
Source: IMF
Figure8: Consumer confidence Index for European countries 2011-2012
Source: Bloomberg
Figure9: US SAAR vs. US Consumer Confidence Index
Source: Bloomber
“B AYERISCHE MOTOREN WERKE” C OMPANY REPORT
PAGE 8/31
expectations for this market are therefore very modest in terms of possible car
sales in the next periods.
Sales Development
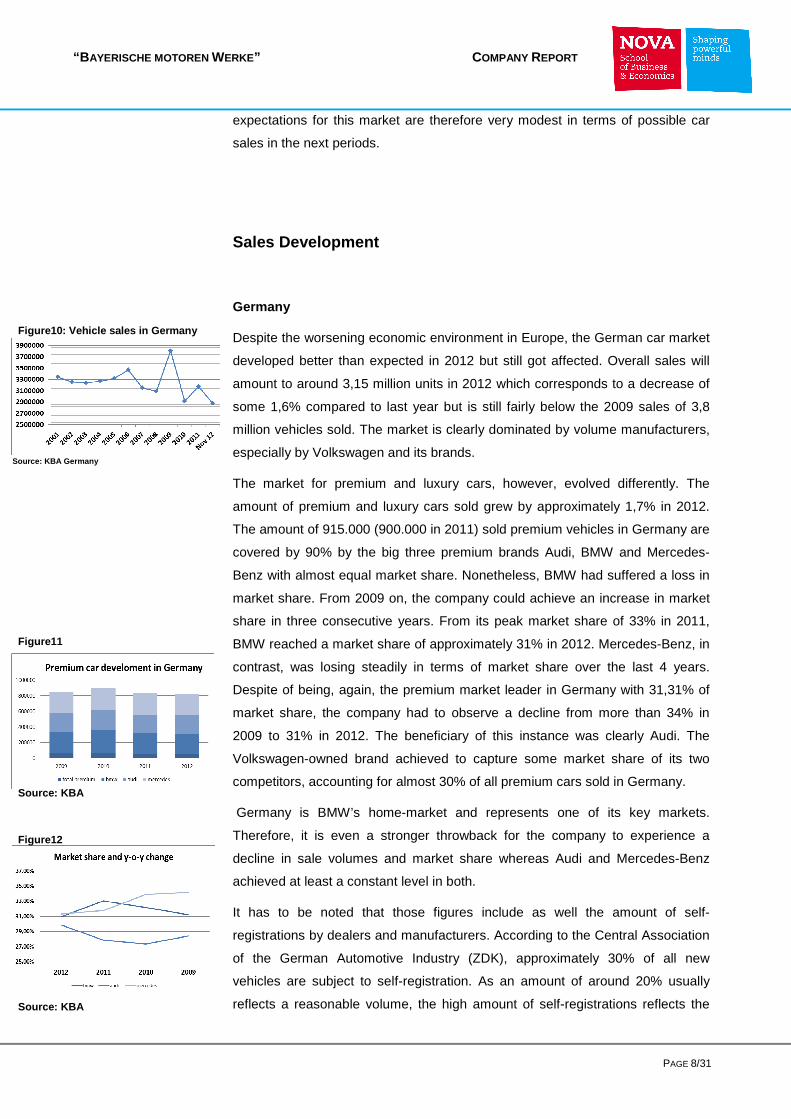
Germany
Despite the worsening economic environment in Europe, the German car market
developed better than expected in 2012 but still got affected. Overall sales will
amount to around 3,15 million units in 2012 which corresponds to a decrease of
some 1,6% compared to last year but is still fairly below the 2009 sales of 3,8
million vehicles sold. The market is clearly dominated by volume manufacturers,
especially by Volkswagen and its brands.
The market for premium and luxury cars, however, evolved differently. The
amount of premium and luxury cars sold grew by approximately 1,7% in 2012.
The amount of 915.000 (900.000 in 2011) sold premium vehicles in Germany are
covered by 90% by the big three premium brands Audi, BMW and Mercedes-
Benz with almost equal market share. Nonetheless, BMW had suffered a loss in
market share. From 2009 on, the company could achieve an increase in market
share in three consecutive years. From its peak market share of 33% in 2011,
BMW reached a market share of approximately 31% in 2012. Mercedes-Benz, in
contrast, was losing steadily in terms of market share over the last 4 years.
Despite of being, again, the premium market leader in Germany with 31,31% of
market share, the company had to observe a decline from more than 34% in
2009 to 31% in 2012. The beneficiary of this instance was clearly Audi. The
Volkswagen-owned brand achieved to capture some market share of its two
competitors, accounting for almost 30% of all premium cars sold in Germany.
Germany is BMW’s home-market and represents one of its key markets.
Therefore, it is even a stronger throwback for the company to experience a
decline in sale volumes and market share whereas Audi and Mercedes-Benz
achieved at least a constant level in both.
It has to be noted that those figures include as well the amount of self-
registrations by dealers and manufacturers. According to the Central Association
of the German Automotive Industry (ZDK), approximately 30% of all new
vehicles are subject to self-registration. As an amount of around 20% usually
reflects a reasonable volume, the high amount of self-registrations reflects the
Figure10: Vehicle sales in Germany
Source: KBA Germany
Figure11
Source: KBA
Figure12
Source: KBA
“B AYERISCHE MOTOREN WERKE” C OMPANY REPORT
PAGE 9/31
competitiveness of the current market environment which will probably continue
in 2013.
One way to push the sales is the self-registration, either through the dealer or the
manufacturer self. The reasoning behind this is that on the one hand, this
controversial sales practice inflates official statistics and suggests a more
pleasurable demand. On the other hand, a car which was previously registrated
by a dealer or manufacturer are considered as used cars and can therefore be
sold at a lower price, without penalizing the official pricing levels, set by the
manufacturers. The following part just focusses on the self-registrations by
BMW, Audi and Mercedes-Benz, as other premium brands in Germany have
very little market shares, so that the amount of self-registered vehicles is rather
small.
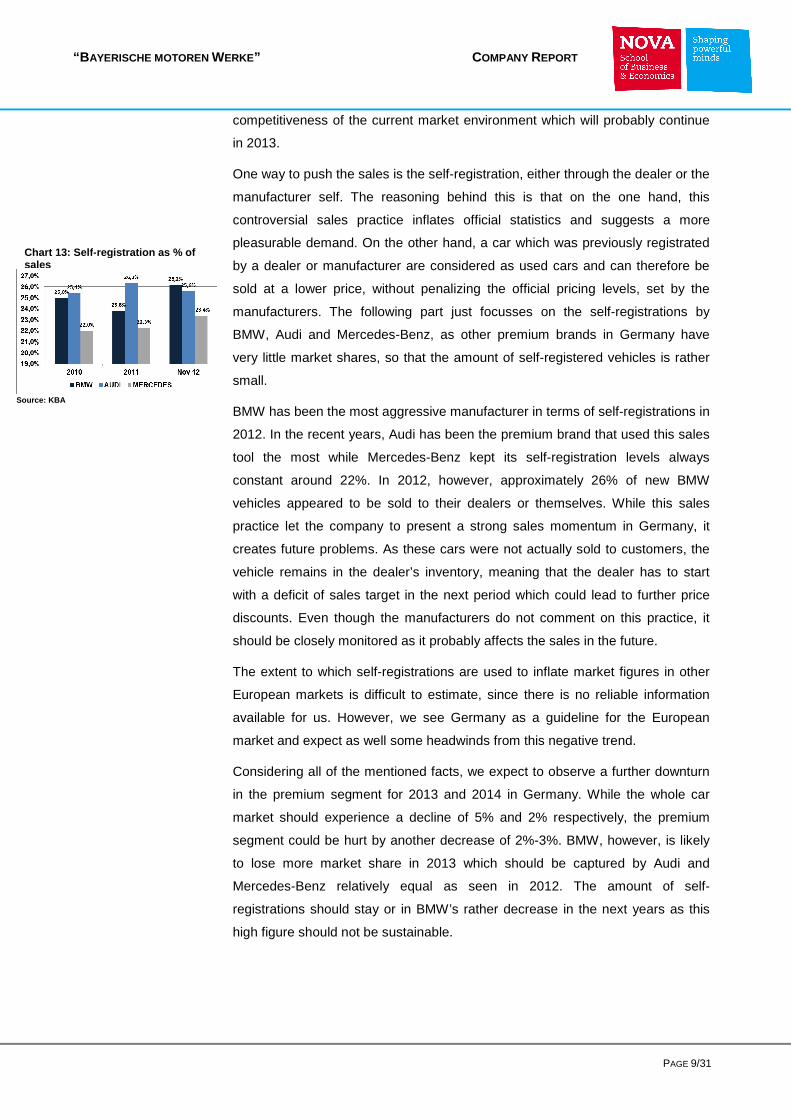
BMW has been the most aggressive manufacturer in terms of self-registrations in
2012. In the recent years, Audi has been the premium brand that used this sales
tool the most while Mercedes-Benz kept its self-registration levels always
constant around 22%. In 2012, however, approximately 26% of new BMW
vehicles appeared to be sold to their dealers or themselves. While this sales
practice let the company to present a strong sales momentum in Germany, it
creates future problems. As these cars were not actually sold to customers, the
vehicle remains in the dealer’s inventory, meaning that the dealer has to start
with a deficit of sales target in the next period which could lead to further price
discounts. Even though the manufacturers do not comment on this practice, it
should be closely monitored as it probably affects the sales in the future.
The extent to which self-registrations are used to inflate market figures in other
European markets is difficult to estimate, since there is no reliable information
available for us. However, we see Germany as a guideline for the European
market and expect as well some headwinds from this negative trend.
Considering all of the mentioned facts, we expect to observe a further downturn
in the premium segment for 2013 and 2014 in Germany. While the whole car
market should experience a decline of 5% and 2% respectively, the premium
segment could be hurt by another decrease of 2%-3%. BMW, however, is likely
to lose more market share in 2013 which should be captured by Audi and
Mercedes-Benz relatively equal as seen in 2012. The amount of self-
registrations should stay or in BMW’s rather decrease in the next years as this
high figure should not be sustainable.
Chart 13 : Self -registration as % of sales
Source: KBA
“B AYERISCHE MOTOREN WERKE” C OMPANY REPORT
PAGE 10/31
Base case 2011 2012E 2013F 2014F 2015F 2016F
German Vehicle Market 3.200.000 3.150.000 2.990.000 2.930.000 3.010.000 3.230.000
y-o-y change % -1,6% -5,1% -2,0% 2,7% 7,3%
Premium Brands 900.000 915.000 890.000 880.000 900.000 920.000
y-o-y change % 1,7% -2,7% -1,1% 2,3% 2,2%
BMW Brand 257.094 245.000 240.000 236.000 250.000 265.000
y-o-y change % -4,7% -2,0% -1,7% 5,9% 6,0%
MINI Brand 40.345 37.000 35.000 35.000 39.000 42.000
y-o-y change % -8,3% -5,4% 0,0% 11,4% 7,7%
Group Market Share Total 9,3% 9,0% 9,2% 9,2% 9,6% 9,5%
y-o-y change % -3,7% 2,7% 0,6% 3,8% -1,0%
Group Market Share Premium 33,0% 30,8% 30,9% 30,8% 32,1% 33,4%
y-o-y change % -6,7% 0,3% -0,3% 4,3% 3,9%
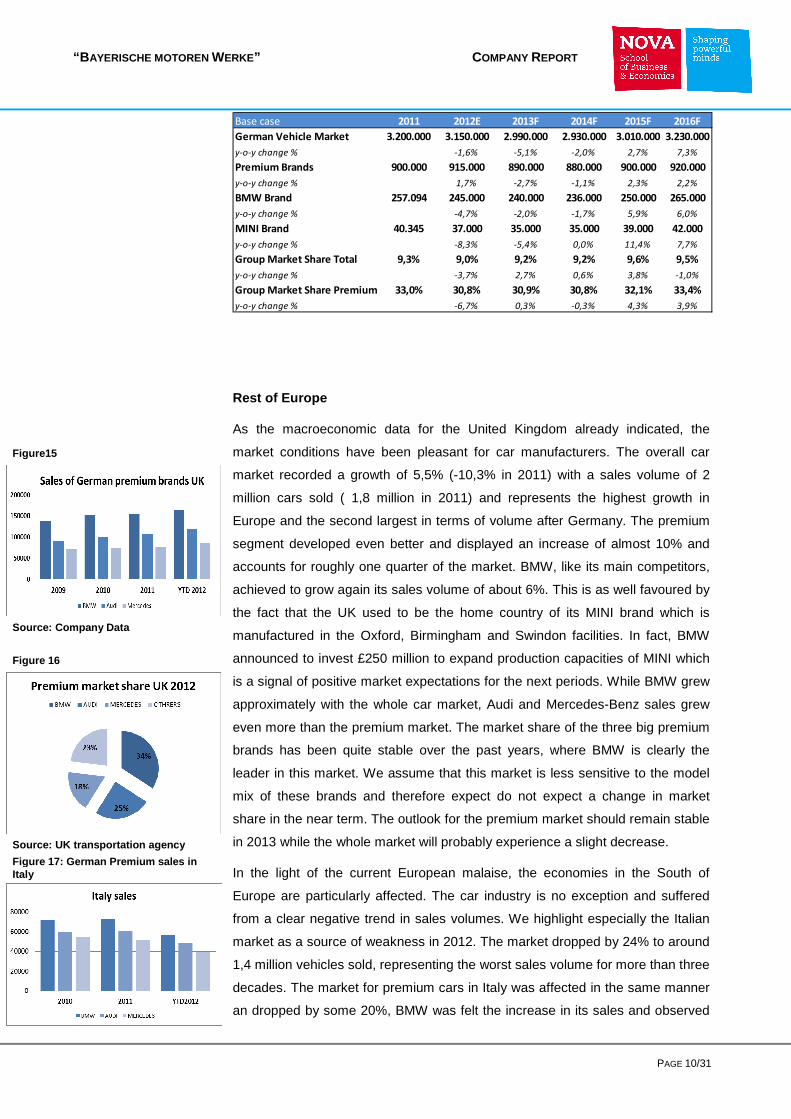
Rest of Europe
As the macroeconomic data for the United Kingdom already indicated, the
market conditions have been pleasant for car manufacturers. The overall car
market recorded a growth of 5,5% (-10,3% in 2011) with a sales volume of 2
million cars sold ( 1,8 million in 2011) and represents the highest growth in
Europe and the second largest in terms of volume after Germany. The premium
segment developed even better and displayed an increase of almost 10% and
accounts for roughly one quarter of the market. BMW, like its main competitors,
achieved to grow again its sales volume of about 6%. This is as well favoured by
the fact that the UK used to be the home country of its MINI brand which is
manufactured in the Oxford, Birmingham and Swindon facilities. In fact, BMW
announced to invest £250 million to expand production capacities of MINI which
is a signal of positive market expectations for the next periods. While BMW grew
approximately with the whole car market, Audi and Mercedes-Benz sales grew
even more than the premium market. The market share of the three big premium
brands has been quite stable over the past years, where BMW is clearly the
leader in this market. We assume that this market is less sensitive to the model
mix of these brands and therefore expect do not expect a change in market
share in the near term. The outlook for the premium market should remain stable
in 2013 while the whole market will probably experience a slight decrease.
In the light of the current European malaise, the economies in the South of
Europe are particularly affected. The car industry is no exception and suffered
from a clear negative trend in sales volumes. We highlight especially the Italian
market as a source of weakness in 2012. The market dropped by 24% to around
1,4 million vehicles sold, representing the worst sales volume for more than three
decades. The market for premium cars in Italy was affected in the same manner
an dropped by some 20%, BMW was felt the increase in its sales and observed
Figure15
Source: Company Data
Figure 16
Source: UK transportation agency
Figure 17: German Premium sales in Italy
“B AYERISCHE MOTOREN WERKE” C OMPANY REPORT
PAGE 11/31
its sales declining linear to the premium market. We estimate 1.400.000 vehicles
will be sold locally in 2013 (-2%).
The Spanish market has taken a further downturn in sales momentum most
recently with the selling rate dropping to some 650.000 on average in the last
3month period. We understand that the increase in the Spanish VAT led to a
further market weakening and the high unemployment rate continues to weigh on
new car sales. For next year, we forecast another 4% decline to 700.000 units.
When considering the whole Euro area, we forecast a notably downturn in
volumes, especially from the usually strong market Germany. We believe that
there is no huge downside potential for the southern European countries as
sales were already facing new record lows. Having said this, we believe that the
German market is as well the one which is most likely to recover the fastest after
t
h
e
d
o
w
n
t
u
r
n
USA
Automobile sales in the United States have developed favourably. The US car
market recovered and grew faster than the overall economy in 2012.
Nevertheless, there is still a lot of upside potential as the sales figure are still
fairly below pre-crisis level. The overall car market increased by some 14% last
year which should be mainly attributable to the moderate growth of the economy
and a fair backlog of vehicle demand, created by the strong decline in car
purchases during the last 4 years.
The American car market is dominated by the three local manufacturers General
Motors, Ford and the Chrysler Group, as well as the two Japanese
manufacturers Toyota and Nissan. Those five companies together accounted in
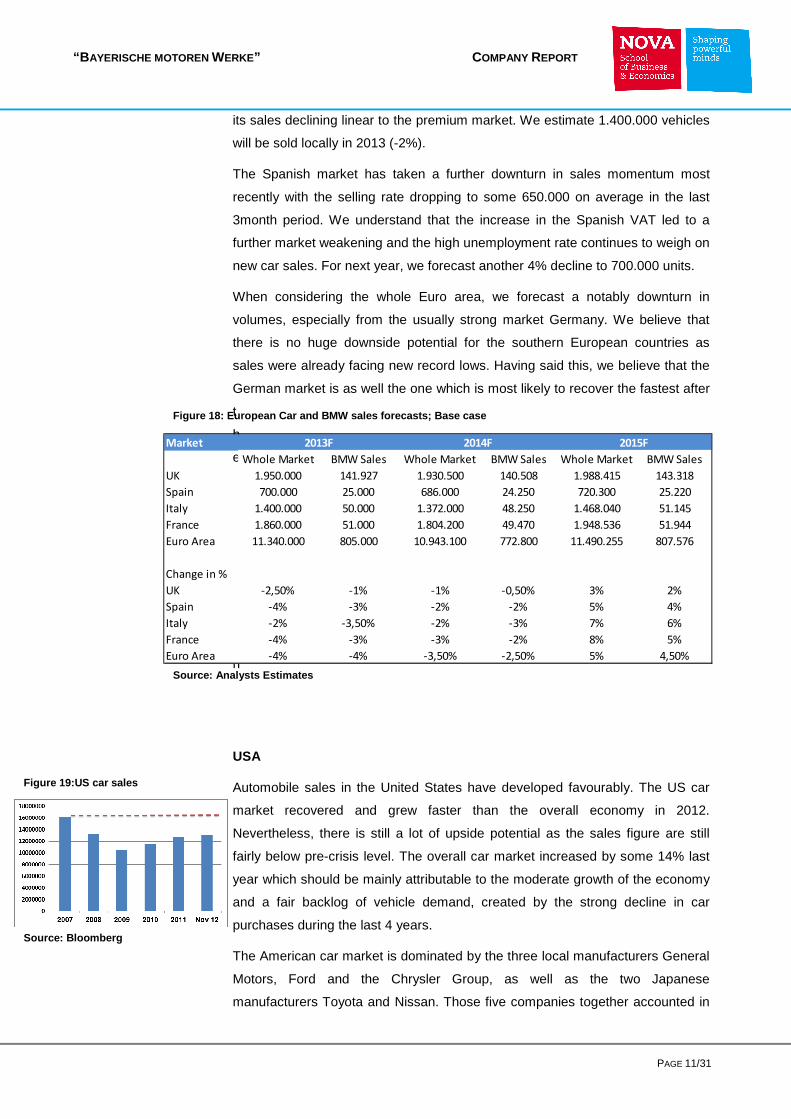
Market
Whole Market BMW Sales Whole Market BMW Sales Whole Market BMW Sales
UK 1.950.000 141.927 1.930.500 140.508 1.988.415 143.318
Spain 700.000 25.000 686.000 24.250 720.300 25.220
Italy 1.400.000 50.000 1.372.000 48.250 1.468.040 51.145
France 1.860.000 51.000 1.804.200 49.470 1.948.536 51.944
Euro Area 11.340.000 805.000 10.943.100 772.800 11.490.255 807.576
Change in %
UK -2,50% -1% -1% -0,50% 3% 2%
Spain -4% -3% -2% -2% 5% 4%
Italy -2% -3,50% -2% -3% 7% 6%
France -4% -3% -3% -2% 8% 5%
Euro Area -4% -4% -3,50% -2,50% 5% 4,50%
2013F 2014F 2015F
Figure 18: European Car and BMW sales forecasts; Ba se case
Source: Analysts Estimates
Figure 19:US car sales
Source: Bloomberg
“B AYERISCHE MOTOREN WERKE” C OMPANY REPORT
PAGE 12/31
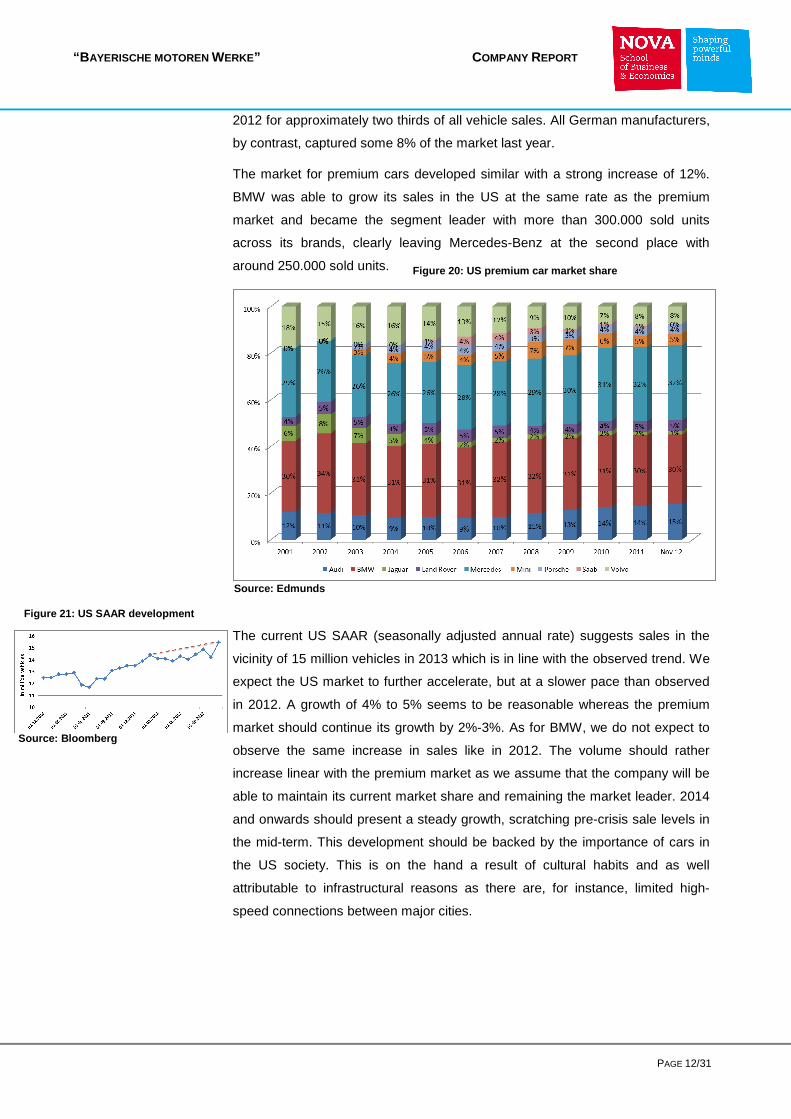
2012 for approximately two thirds of all vehicle sales. All German manufacturers,
by contrast, captured some 8% of the market last year.
The market for premium cars developed similar with a strong increase of 12%.
BMW was able to grow its sales in the US at the same rate as the premium
market and became the segment leader with more than 300.000 sold units
across its brands, clearly leaving Mercedes-Benz at the second place with
around 250.000 sold units.
The current US SAAR (seasonally adjusted annual rate) suggests sales in the
vicinity of 15 million vehicles in 2013 which is in line with the observed trend. We
expect the US market to further accelerate, but at a slower pace than observed
in 2012. A growth of 4% to 5% seems to be reasonable whereas the premium
market should continue its growth by 2%-3%. As for BMW, we do not expect to
observe the same increase in sales like in 2012. The volume should rather
increase linear with the premium market as we assume that the company will be
able to maintain its current market share and remaining the market leader. 2014
and onwards should present a steady growth, scratching pre-crisis sale levels in
the mid-term. This development should be backed by the importance of cars in
the US society. This is on the hand a result of cultural habits and as well
attributable to infrastructural reasons as there are, for instance, limited high-
speed connections between major cities.
Figure 20: US premium car market share
Source: Edmunds
Figure 21: US SAAR development
Source: Bloomberg
“B AYERISCHE MOTOREN WERKE” C OMPANY REPORT
PAGE 13/31
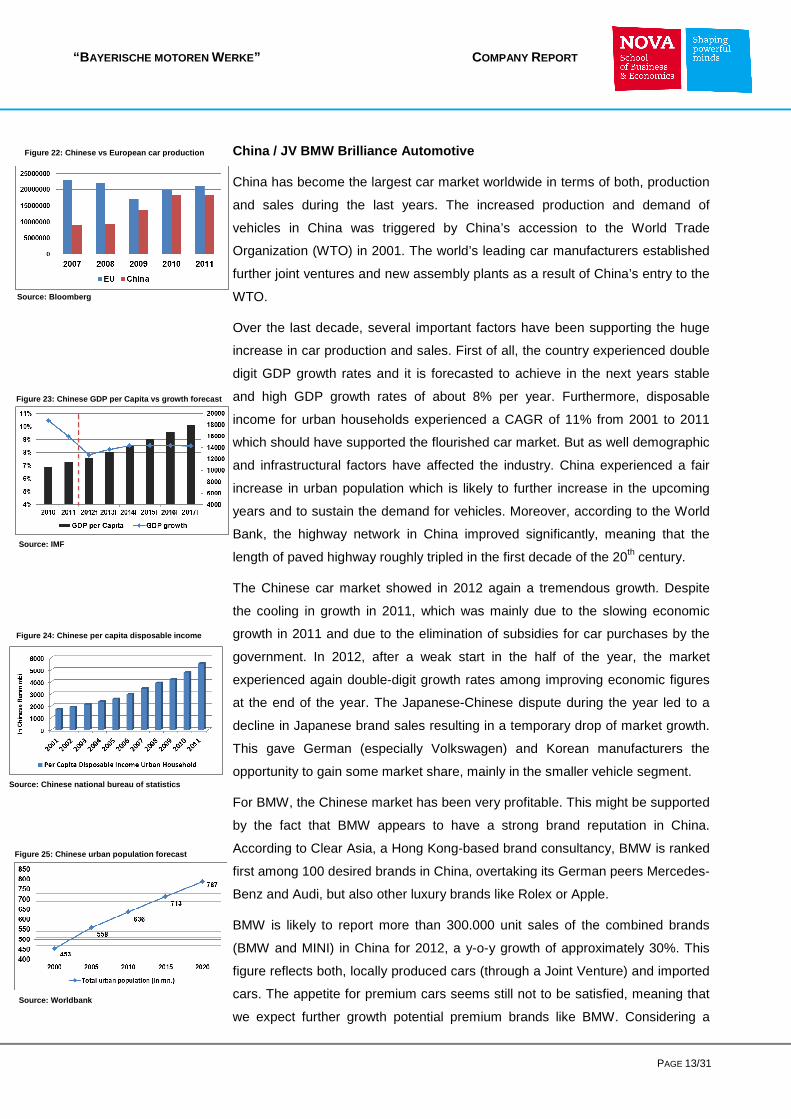
China / JV BMW Brilliance Automotive
China has become the largest car market worldwide in terms of both, production
and sales during the last years. The increased production and demand of
vehicles in China was triggered by China’s accession to the World Trade
Organization (WTO) in 2001. The world’s leading car manufacturers established
further joint ventures and new assembly plants as a result of China’s entry to the
WTO.
Over the last decade, several important factors have been supporting the huge
increase in car production and sales. First of all, the country experienced double
digit GDP growth rates and it is forecasted to achieve in the next years stable
and high GDP growth rates of about 8% per year. Furthermore, disposable
income for urban households experienced a CAGR of 11% from 2001 to 2011
which should have supported the flourished car market. But as well demographic
and infrastructural factors have affected the industry. China experienced a fair
increase in urban population which is likely to further increase in the upcoming
years and to sustain the demand for vehicles. Moreover, according to the World
Bank, the highway network in China improved significantly, meaning that the
length of paved highway roughly tripled in the first decade of the 20th century.
The Chinese car market showed in 2012 again a tremendous growth. Despite
the cooling in growth in 2011, which was mainly due to the slowing economic
growth in 2011 and due to the elimination of subsidies for car purchases by the
government. In 2012, after a weak start in the half of the year, the market
experienced again double-digit growth rates among improving economic figures
at the end of the year. The Japanese-Chinese dispute during the year led to a
decline in Japanese brand sales resulting in a temporary drop of market growth.
This gave German (especially Volkswagen) and Korean manufacturers the
opportunity to gain some market share, mainly in the smaller vehicle segment.
For BMW, the Chinese market has been very profitable. This might be supported
by the fact that BMW appears to have a strong brand reputation in China.
According to Clear Asia, a Hong Kong-based brand consultancy, BMW is ranked
first among 100 desired brands in China, overtaking its German peers Mercedes-
Benz and Audi, but also other luxury brands like Rolex or Apple.
BMW is likely to report more than 300.000 unit sales of the combined brands
(BMW and MINI) in China for 2012, a y-o-y growth of approximately 30%. This
figure reflects both, locally produced cars (through a Joint Venture) and imported
cars. The appetite for premium cars seems still not to be satisfied, meaning that
we expect further growth potential premium brands like BMW. Considering a
Figure 22: Chinese vs European car production
Source: Bloomberg
Figure 23: Chinese GDP per Capita vs growth forecas t
Source: IMF
Figure 24: Chinese per capita disposable income
Source: Chinese national bureau of statistics
Figure 25: Chinese urban population forecast
Source: Worldbank
“B AYERISCHE MOTOREN WERKE” C OMPANY REPORT
PAGE 14/31
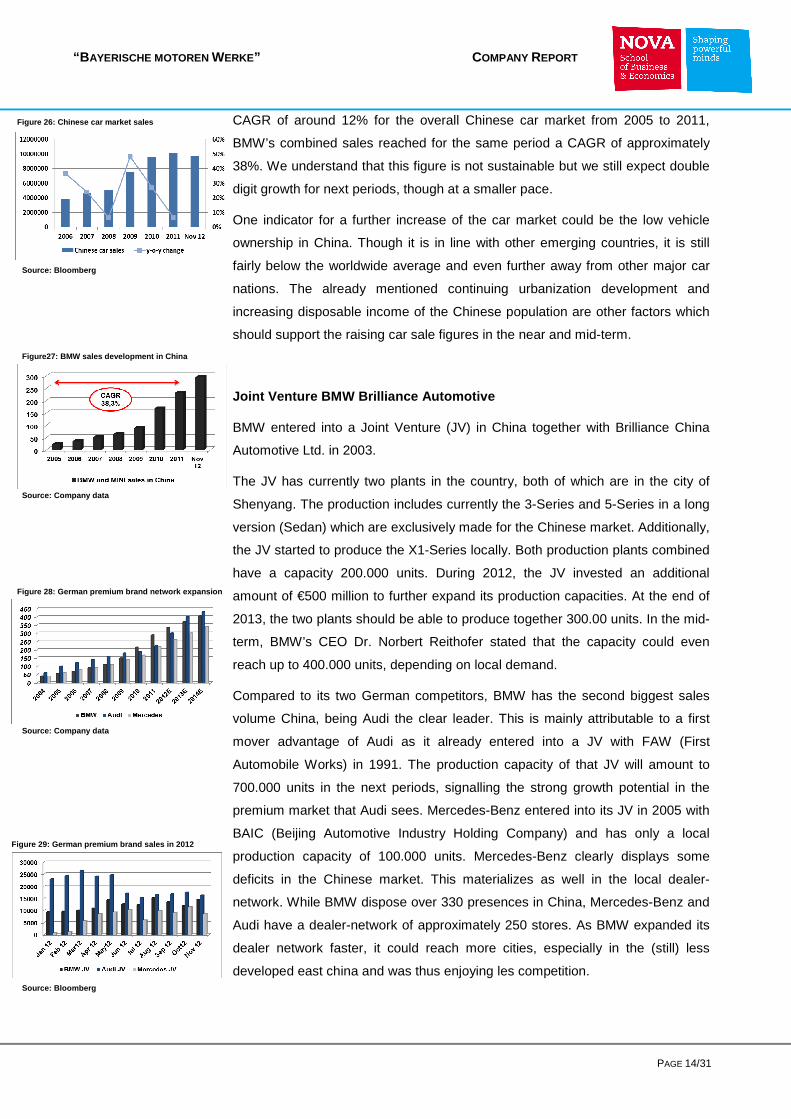
CAGR of around 12% for the overall Chinese car market from 2005 to 2011,
BMW’s combined sales reached for the same period a CAGR of approximately
38%. We understand that this figure is not sustainable but we still expect double
digit growth for next periods, though at a smaller pace.
One indicator for a further increase of the car market could be the low vehicle
ownership in China. Though it is in line with other emerging countries, it is still
fairly below the worldwide average and even further away from other major car
nations. The already mentioned continuing urbanization development and
increasing disposable income of the Chinese population are other factors which
should support the raising car sale figures in the near and mid-term.
Joint Venture BMW Brilliance Automotive
BMW entered into a Joint Venture (JV) in China together with Brilliance China
Automotive Ltd. in 2003.
The JV has currently two plants in the country, both of which are in the city of
Shenyang. The production includes currently the 3-Series and 5-Series in a long
version (Sedan) which are exclusively made for the Chinese market. Additionally,
the JV started to produce the X1-Series locally. Both production plants combined
have a capacity 200.000 units. During 2012, the JV invested an additional
amount of €500 million to further expand its production capacities. At the end of
2013, the two plants should be able to produce together 300.00 units. In the mid-
term, BMW’s CEO Dr. Norbert Reithofer stated that the capacity could even
reach up to 400.000 units, depending on local demand.
Compared to its two German competitors, BMW has the second biggest sales
volume China, being Audi the clear leader. This is mainly attributable to a first
mover advantage of Audi as it already entered into a JV with FAW (First
Automobile Works) in 1991. The production capacity of that JV will amount to
700.000 units in the next periods, signalling the strong growth potential in the
premium market that Audi sees. Mercedes-Benz entered into its JV in 2005 with
BAIC (Beijing Automotive Industry Holding Company) and has only a local
production capacity of 100.000 units. Mercedes-Benz clearly displays some
deficits in the Chinese market. This materializes as well in the local dealer-
network. While BMW dispose over 330 presences in China, Mercedes-Benz and
Audi have a dealer-network of approximately 250 stores. As BMW expanded its
dealer network faster, it could reach more cities, especially in the (still) less
developed east china and was thus enjoying les competition.
Figure 26: Chinese car market sales
Source: Bloomberg
Figure27: BMW sales development in China
Source: Company data
Figure 28: German premium brand network expansion
Source: Company data
Figure 29: German premium brand sales in 2012
Source: Bloomberg
“B AYERISCHE MOTOREN WERKE” C OMPANY REPORT
PAGE 15/31
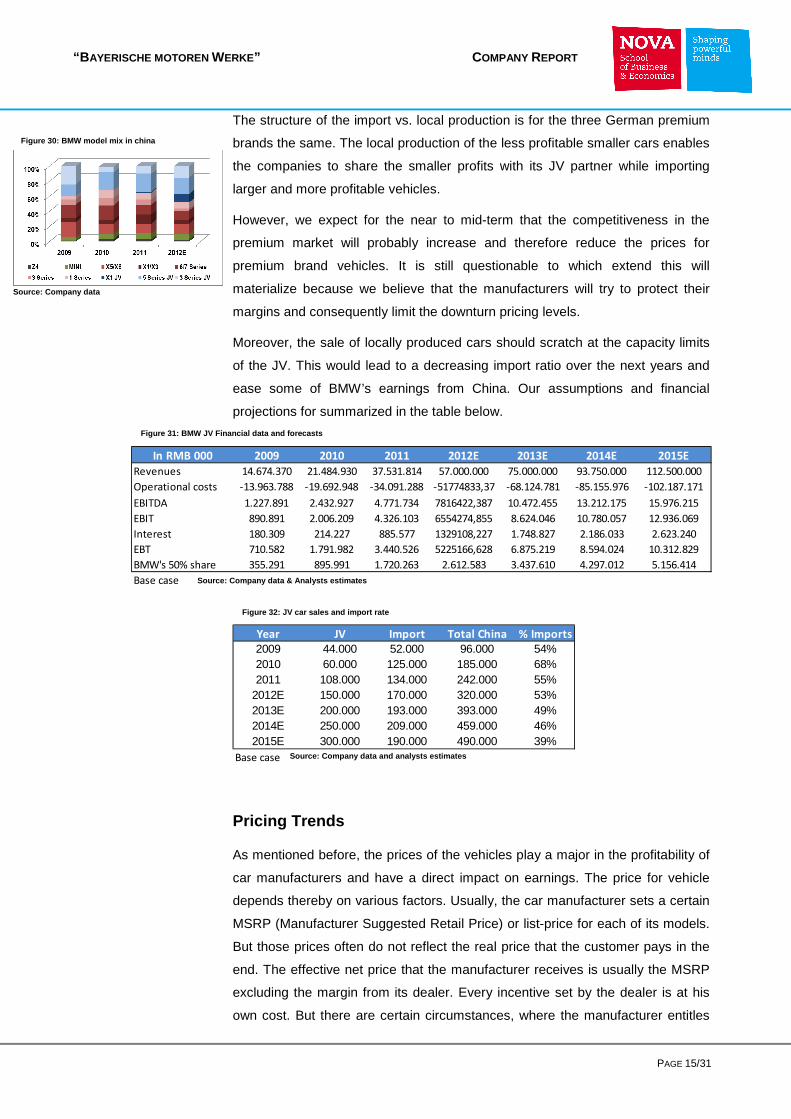
The structure of the import vs. local production is for the three German premium
brands the same. The local production of the less profitable smaller cars enables
the companies to share the smaller profits with its JV partner while importing
larger and more profitable vehicles.
However, we expect for the near to mid-term that the competitiveness in the
premium market will probably increase and therefore reduce the prices for
premium brand vehicles. It is still questionable to which extend this will
materialize because we believe that the manufacturers will try to protect their
margins and consequently limit the downturn pricing levels.
Moreover, the sale of locally produced cars should scratch at the capacity limits
of the JV. This would lead to a decreasing import ratio over the next years and
ease some of BMW’s earnings from China. Our assumptions and financial
projections for summarized in the table below.
Year JV Import Total China % Imports
2009 44.000 52.000 96.000 54%2010 60.000 125.000 185.000 68%2011 108.000 134.000 242.000 55%
2012E 150.000 170.000 320.000 53%2013E 200.000 193.000 393.000 49%2014E 250.000 209.000 459.000 46%2015E 300.000 190.000 490.000 39%
Base case
Pricing Trends
As mentioned before, the prices of the vehicles play a major in the profitability of
car manufacturers and have a direct impact on earnings. The price for vehicle
depends thereby on various factors. Usually, the car manufacturer sets a certain
MSRP (Manufacturer Suggested Retail Price) or list-price for each of its models.
But those prices often do not reflect the real price that the customer pays in the
end. The effective net price that the manufacturer receives is usually the MSRP
excluding the margin from its dealer. Every incentive set by the dealer is at his
own cost. But there are certain circumstances, where the manufacturer entitles
In RMB 000 2009 2010 2011 2012E 2013E 2014E 2015E
Revenues 14.674.370 21.484.930 37.531.814 57.000.000 75.000.000 93.750.000 112.500.000
Operational costs -13.963.788 -19.692.948 -34.091.288 -51774833,37 -68.124.781 -85.155.976 -102.187.171
EBITDA 1.227.891 2.432.927 4.771.734 7816422,387 10.472.455 13.212.175 15.976.215
EBIT 890.891 2.006.209 4.326.103 6554274,855 8.624.046 10.780.057 12.936.069
Interest 180.309 214.227 885.577 1329108,227 1.748.827 2.186.033 2.623.240
EBT 710.582 1.791.982 3.440.526 5225166,628 6.875.219 8.594.024 10.312.829
BMW's 50% share 355.291 895.991 1.720.263 2.612.583 3.437.610 4.297.012 5.156.414
Base case
Figure 30: BMW model mix in china
Source: Company data
Figure 31: BMW JV Financial data and forecasts
Source: Company data & Analysts estimates
Figure 32: JV car sales and import rate
Source: Company data and analysts estimates
“B AYERISCHE MOTOREN WERKE” C OMPANY REPORT
PAGE 16/31
the dealer to set price incentives. This could be either due to a model turnover,
meaning that a new version of a model will be launched soon or because sales
are evolving worse than expected and the manufacturer has to struggle with
overcapacity. Nonetheless, it is difficult to estimate the real price impact for the
manufacturers as these do not disclose nor quantify the dealer’s margins and
incentives that are supported by the company. But, we can assume that in
certain volume downturns like currently in Europe, most incentives are to some
extent backed up by the respective manufacturer.
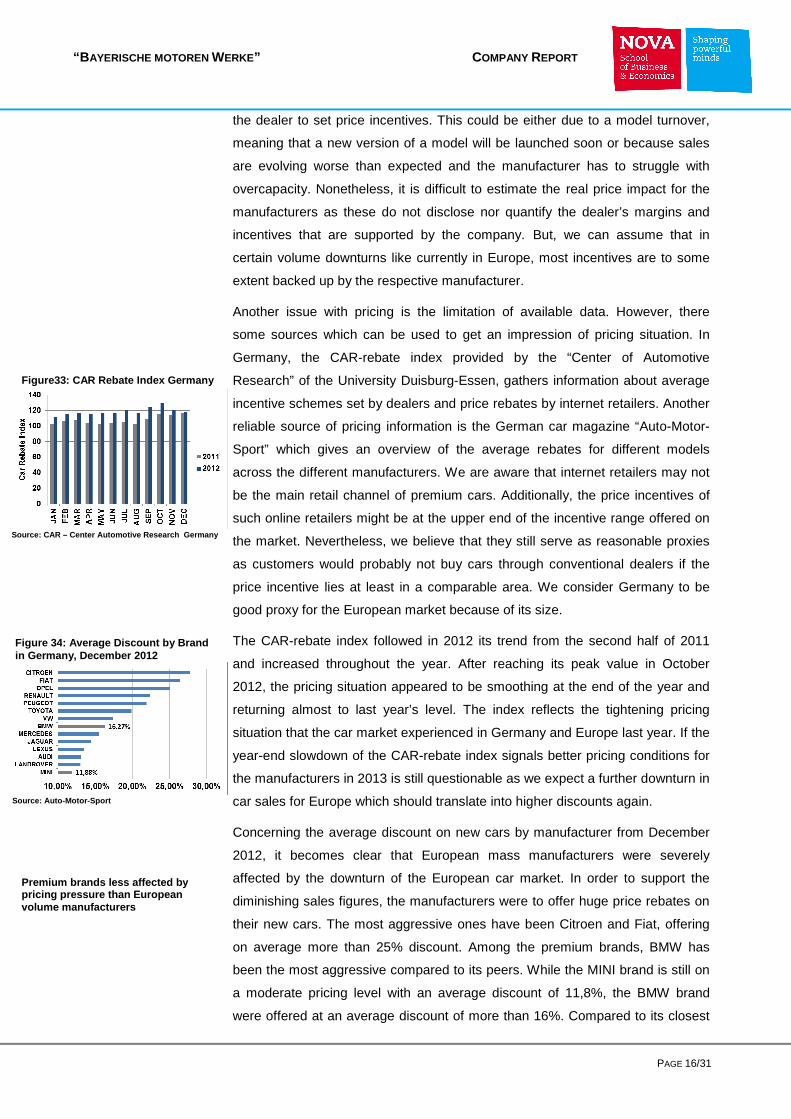
Another issue with pricing is the limitation of available data. However, there
some sources which can be used to get an impression of pricing situation. In
Germany, the CAR-rebate index provided by the “Center of Automotive
Research” of the University Duisburg-Essen, gathers information about average
incentive schemes set by dealers and price rebates by internet retailers. Another
reliable source of pricing information is the German car magazine “Auto-Motor-
Sport” which gives an overview of the average rebates for different models
across the different manufacturers. We are aware that internet retailers may not
be the main retail channel of premium cars. Additionally, the price incentives of
such online retailers might be at the upper end of the incentive range offered on
the market. Nevertheless, we believe that they still serve as reasonable proxies
as customers would probably not buy cars through conventional dealers if the
price incentive lies at least in a comparable area. We consider Germany to be
good proxy for the European market because of its size.
The CAR-rebate index followed in 2012 its trend from the second half of 2011
and increased throughout the year. After reaching its peak value in October
2012, the pricing situation appeared to be smoothing at the end of the year and
returning almost to last year’s level. The index reflects the tightening pricing
situation that the car market experienced in Germany and Europe last year. If the
year-end slowdown of the CAR-rebate index signals better pricing conditions for
the manufacturers in 2013 is still questionable as we expect a further downturn in
car sales for Europe which should translate into higher discounts again.
Concerning the average discount on new cars by manufacturer from December
2012, it becomes clear that European mass manufacturers were severely
affected by the downturn of the European car market. In order to support the
diminishing sales figures, the manufacturers were to offer huge price rebates on
their new cars. The most aggressive ones have been Citroen and Fiat, offering
on average more than 25% discount. Among the premium brands, BMW has
been the most aggressive compared to its peers. While the MINI brand is still on
a moderate pricing level with an average discount of 11,8%, the BMW brand
were offered at an average discount of more than 16%. Compared to its closest
Figure33: CAR Rebate Index Germany
Source: CAR – Center Automotive Research Germany
Figure 34 : Average Discount by Brand in Germany, December 2012
Source: Auto-Motor-Sport
Premium brands less affected by pricing pressure than European volume manufacturers
“B AYERISCHE MOTOREN WERKE” C OMPANY REPORT
PAGE 17/31
peers Audi and Mercedes-Benz, which were offered on average with a discount
of 13% and 15,5% respectively, the pricing situation seems to reflect the sales
development in the German market, as BMW had to suffer a loss in market
share.
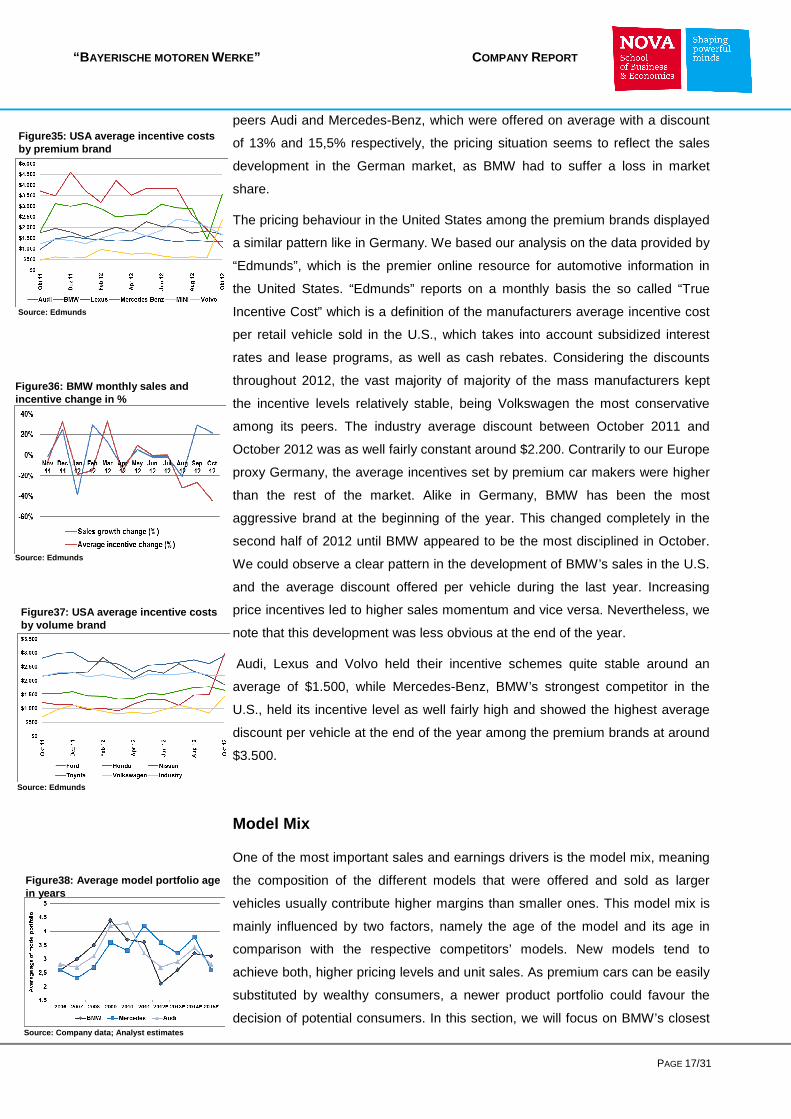
The pricing behaviour in the United States among the premium brands displayed
a similar pattern like in Germany. We based our analysis on the data provided by
“Edmunds”, which is the premier online resource for automotive information in
the United States. “Edmunds” reports on a monthly basis the so called “True
Incentive Cost” which is a definition of the manufacturers average incentive cost
per retail vehicle sold in the U.S., which takes into account subsidized interest
rates and lease programs, as well as cash rebates. Considering the discounts
throughout 2012, the vast majority of majority of the mass manufacturers kept
the incentive levels relatively stable, being Volkswagen the most conservative
among its peers. The industry average discount between October 2011 and
October 2012 was as well fairly constant around $2.200. Contrarily to our Europe
proxy Germany, the average incentives set by premium car makers were higher
than the rest of the market. Alike in Germany, BMW has been the most
aggressive brand at the beginning of the year. This changed completely in the
second half of 2012 until BMW appeared to be the most disciplined in October.
We could observe a clear pattern in the development of BMW’s sales in the U.S.
and the average discount offered per vehicle during the last year. Increasing
price incentives led to higher sales momentum and vice versa. Nevertheless, we
note that this development was less obvious at the end of the year.
Audi, Lexus and Volvo held their incentive schemes quite stable around an
average of $1.500, while Mercedes-Benz, BMW’s strongest competitor in the
U.S., held its incentive level as well fairly high and showed the highest average
discount per vehicle at the end of the year among the premium brands at around
$3.500.
Model Mix
One of the most important sales and earnings drivers is the model mix, meaning
the composition of the different models that were offered and sold as larger
vehicles usually contribute higher margins than smaller ones. This model mix is
mainly influenced by two factors, namely the age of the model and its age in
comparison with the respective competitors’ models. New models tend to
achieve both, higher pricing levels and unit sales. As premium cars can be easily
substituted by wealthy consumers, a newer product portfolio could favour the
decision of potential consumers. In this section, we will focus on BMW’s closest
Figure35 : USA average incentive costs by premium brand
Source: Edmunds
Figure36 : BMW monthly sales and incentive change in %
Source: Edmunds
Figure37 : USA average incentive costs by volume brand
Source: Edmunds
Source: Company data; Analyst estimates
Figure38 : Average model portfolio age in years
“B AYERISCHE MOTOREN WERKE” C OMPANY REPORT
PAGE 18/31
competitors, Audi and Mercedes-Benz, since the following analysed premium
segments remain dominated by the German brands.
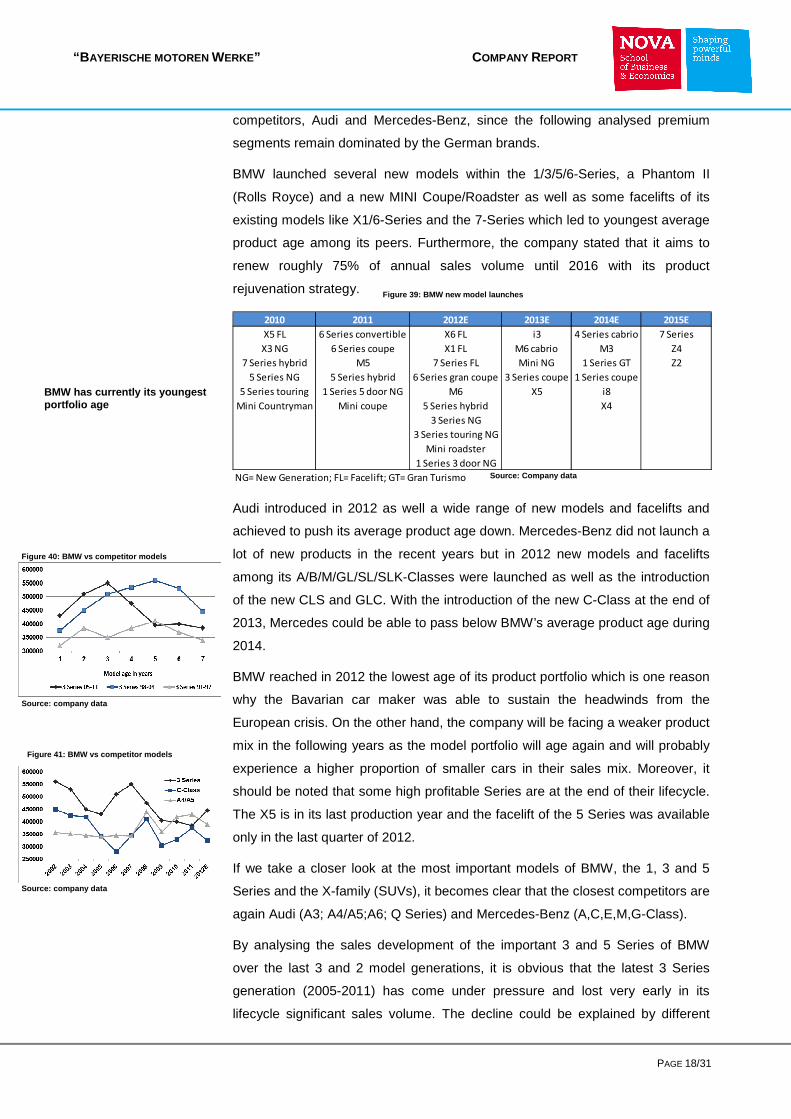
BMW launched several new models within the 1/3/5/6-Series, a Phantom II
(Rolls Royce) and a new MINI Coupe/Roadster as well as some facelifts of its
existing models like X1/6-Series and the 7-Series which led to youngest average
product age among its peers. Furthermore, the company stated that it aims to
renew roughly 75% of annual sales volume until 2016 with its product
rejuvenation strategy.
2010 2011 2012E 2013E 2014E 2015E
X5 FL 6 Series convertible X6 FL i3 4 Series cabrio 7 Series
X3 NG 6 Series coupe X1 FL M6 cabrio M3 Z4
7 Series hybrid M5 7 Series FL Mini NG 1 Series GT Z2
5 Series NG 5 Series hybrid 6 Series gran coupe 3 Series coupe 1 Series coupe
5 Series touring 1 Series 5 door NG M6 X5 i8
Mini Countryman Mini coupe 5 Series hybrid X4
3 Series NG
3 Series touring NG
Mini roadster
1 Series 3 door NG
NG= New Generation; FL= Facelift; GT= Gran Turismo
Audi introduced in 2012 as well a wide range of new models and facelifts and
achieved to push its average product age down. Mercedes-Benz did not launch a
lot of new products in the recent years but in 2012 new models and facelifts
among its A/B/M/GL/SL/SLK-Classes were launched as well as the introduction
of the new CLS and GLC. With the introduction of the new C-Class at the end of
2013, Mercedes could be able to pass below BMW’s average product age during
2014.
BMW reached in 2012 the lowest age of its product portfolio which is one reason
why the Bavarian car maker was able to sustain the headwinds from the
European crisis. On the other hand, the company will be facing a weaker product
mix in the following years as the model portfolio will age again and will probably
experience a higher proportion of smaller cars in their sales mix. Moreover, it
should be noted that some high profitable Series are at the end of their lifecycle.
The X5 is in its last production year and the facelift of the 5 Series was available
only in the last quarter of 2012.
If we take a closer look at the most important models of BMW, the 1, 3 and 5
Series and the X-family (SUVs), it becomes clear that the closest competitors are
again Audi (A3; A4/A5;A6; Q Series) and Mercedes-Benz (A,C,E,M,G-Class).
By analysing the sales development of the important 3 and 5 Series of BMW
over the last 3 and 2 model generations, it is obvious that the latest 3 Series
generation (2005-2011) has come under pressure and lost very early in its
lifecycle significant sales volume. The decline could be explained by different
BMW has currently its youngest portfolio age
Figure 39: BMW new model launches
Source: Company data
Figure 40: BMW vs competitor models
Source: company data
Figure 41: BMW vs competitor models
Source: company data
“B AYERISCHE MOTOREN WERKE” C OMPANY REPORT
PAGE 19/31
factors. On the one hand, BMW introduced its first small premium SUV, the X3,
in 2004 which could have captures some potential 3 Series buyers since the X3
was more successful than expected. On the other hand, the 3 Series
experienced great headwinds from competitors through the emergence of the
Audi A5 coupe. Audi had not offered a coupe in this segment for roughly ten
years. However, it should be noted that the huge decline took place during the
crisis in 2008 and 2009. For the next periods, we believe that the renewal of the
3 Series in 2012 and the new 3 Series coupe prior to the expected replacement
of the new Audi A4 (2014E) and C-Class (2014E), would allow BMW to regain a
lot of lost sales volume as well supported by the introduction of the complete new
4 Series in 2014E. Having said this, one should be aware of the fact that these
models will be the oldest in the segment for the major time of their life cycles
after the launch of the new A4 and C-Class.
The less volatile sales trend of the 5 Series compared to the 3 Series can be
attributed to the 5 Series' very strong competitive position and the favourable
competitive environment that it operates in, as it basically competes with just two
other models, the Mercedes E-Class and Audi A6.
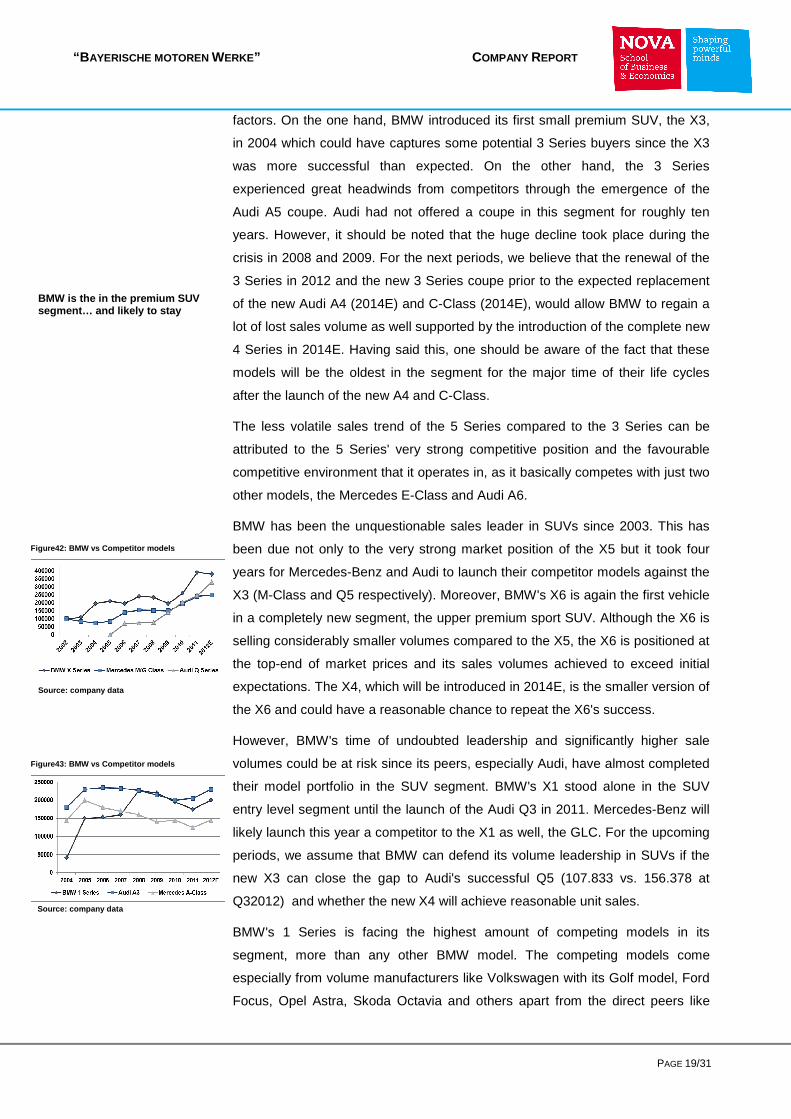
BMW has been the unquestionable sales leader in SUVs since 2003. This has
been due not only to the very strong market position of the X5 but it took four
years for Mercedes-Benz and Audi to launch their competitor models against the
X3 (M-Class and Q5 respectively). Moreover, BMW's X6 is again the first vehicle
in a completely new segment, the upper premium sport SUV. Although the X6 is
selling considerably smaller volumes compared to the X5, the X6 is positioned at
the top-end of market prices and its sales volumes achieved to exceed initial
expectations. The X4, which will be introduced in 2014E, is the smaller version of
the X6 and could have a reasonable chance to repeat the X6's success.
However, BMW's time of undoubted leadership and significantly higher sale
volumes could be at risk since its peers, especially Audi, have almost completed
their model portfolio in the SUV segment. BMW's X1 stood alone in the SUV
entry level segment until the launch of the Audi Q3 in 2011. Mercedes-Benz will
likely launch this year a competitor to the X1 as well, the GLC. For the upcoming
periods, we assume that BMW can defend its volume leadership in SUVs if the
new X3 can close the gap to Audi's successful Q5 (107.833 vs. 156.378 at
Q32012) and whether the new X4 will achieve reasonable unit sales.
BMW's 1 Series is facing the highest amount of competing models in its
segment, more than any other BMW model. The competing models come
especially from volume manufacturers like Volkswagen with its Golf model, Ford
Focus, Opel Astra, Skoda Octavia and others apart from the direct peers like
BMW is the in the premium SUV segment… and likely to stay
Source: company data
Source: company data
Figure42: BMW vs Competitor models
Figure43: BMW vs Competitor models
“B AYERISCHE MOTOREN WERKE” C OMPANY REPORT
PAGE 20/31
Audi A3 and the Mercedes A/B-Class. Nevertheless, regarding the growth from
the launch in 2005 until 2011, the 1 Series has been BMW's strongest growing
product line in BMW’s model portfolio. This is even more surprising since this
model is not selling high volumes in China and the U.S..
Base case 2010 2011 2012E 2013E 2014E 2015E
BMW 1.224.280 1.380.384 1.503.674 1.609.454 1.713.507 1.822.665
1 Series 196.004 176.418 198.089 192.288 225.192 239.538
3 Series 399.009 384.464 457.405 461.492 481.092 500.852
4 Series 131.718 153.540 160.055
5 Series 238.454 332.501 360.162 314.392 283.537 290.712
6 Series 5.848 9.396 27.012 28.843 30.708 32.664
7 Series 65.814 68.774 90.040 96.144 92.124 108.881
X1 99.990 126.429 126.057 124.987 102.360 152.433
X3 46.004 117.944 127.857 144.216 122.832 108.881
X4 42.991 43.552
X5 102.178 104.827 68.431 57.687 112.596 119.769
X6 46.404 40.822 30.614 28.843 40.944 43.552
Z4 24.575 18.809 18.008 28.843 25.590 21.776
MINI 234.175 285.060 297.133 317.276 337.788 359.307
Rolls Royce 2.711 3.538 3.750 3.975 4.174 4.383
Total 1.461.166 1.668.982 1.804.558 1.930.706 2.055.470 2.186.355
R&D and E-mobility
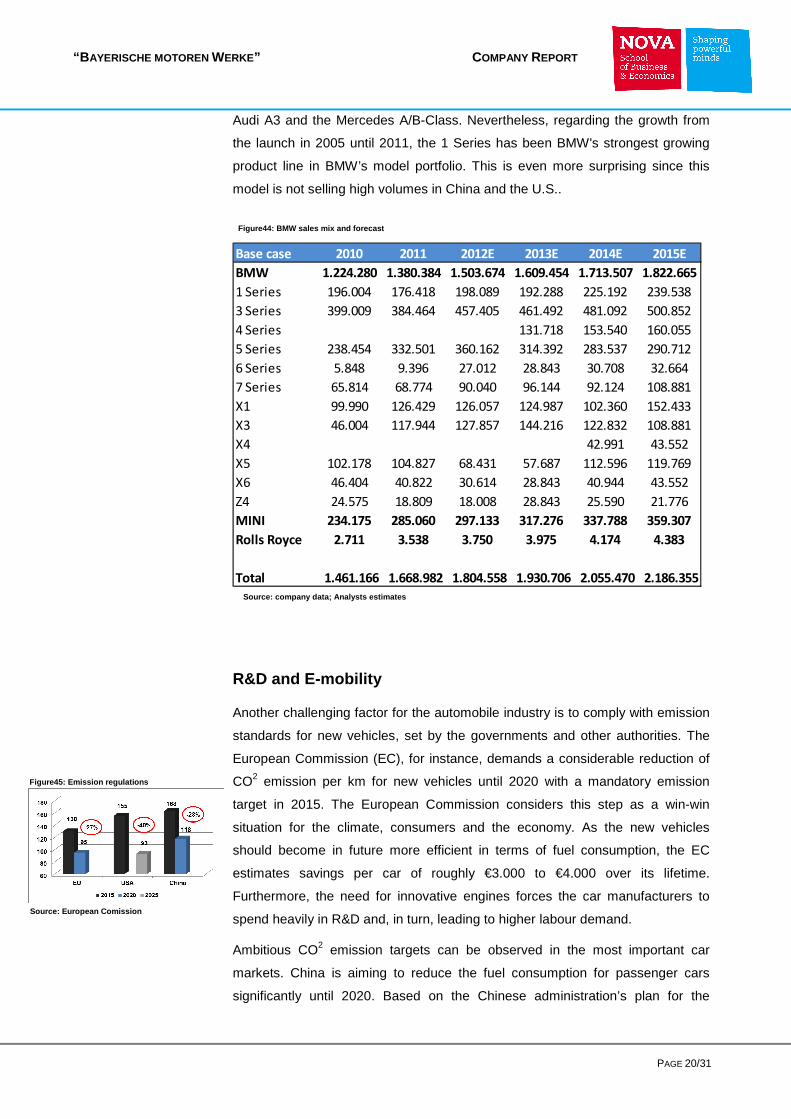
Another challenging factor for the automobile industry is to comply with emission
standards for new vehicles, set by the governments and other authorities. The
European Commission (EC), for instance, demands a considerable reduction of
CO2 emission per km for new vehicles until 2020 with a mandatory emission
target in 2015. The European Commission considers this step as a win-win
situation for the climate, consumers and the economy. As the new vehicles
should become in future more efficient in terms of fuel consumption, the EC
estimates savings per car of roughly €3.000 to €4.000 over its lifetime.
Furthermore, the need for innovative engines forces the car manufacturers to
spend heavily in R&D and, in turn, leading to higher labour demand.
Ambitious CO2 emission targets can be observed in the most important car
markets. China is aiming to reduce the fuel consumption for passenger cars
significantly until 2020. Based on the Chinese administration’s plan for the
Figure44: BMW sales mix and forecast
Source: company data; Analysts estimates
Figure45: Emission regulations
Source: European Comission
“B AYERISCHE MOTOREN WERKE” C OMPANY REPORT
PAGE 21/31
automotive industry and its impact on the environment, both imported and
domestically produced must meet at least 6.9l/100km (163g/km CO2) by 2015,
with energy efficient vehicles having to achieve 5.9l/100km (140g/km CO2). By
2020 this will fall to 5.0l (118g/km CO2) and 4.5l/100km (107g/km CO2)
respectively.4
Even though the Chinese government sets very demanding emission targets, the
penalties for car manufacturers which cannot comply with these standards are
still not defined. However, it does not seem unlike that they will be given a longer
buffer period to meet the targets.5
The European Union demands for the same period a target emission of 130
g/km CO2 until 2015 and 95 g/km CO2 until 2020. The U.S., in turn, demands a
target of 155 g/km CO2 until 2015 and until 2025 a target of 93g/km CO2.
Obviously, premium car maker are more exposed to these regulations than the
manufacturers of smaller vehicles. As a result, BMW and its peers invested
heavily in the development of alternative engines. At the moment, BMW is in
comfortable position due to past investments which will pay off soon. The
company is currently better prepared to meet the emission standards than
Mercedes-Benz, implying that the latter will need to increase its R&D efforts in
the following years.
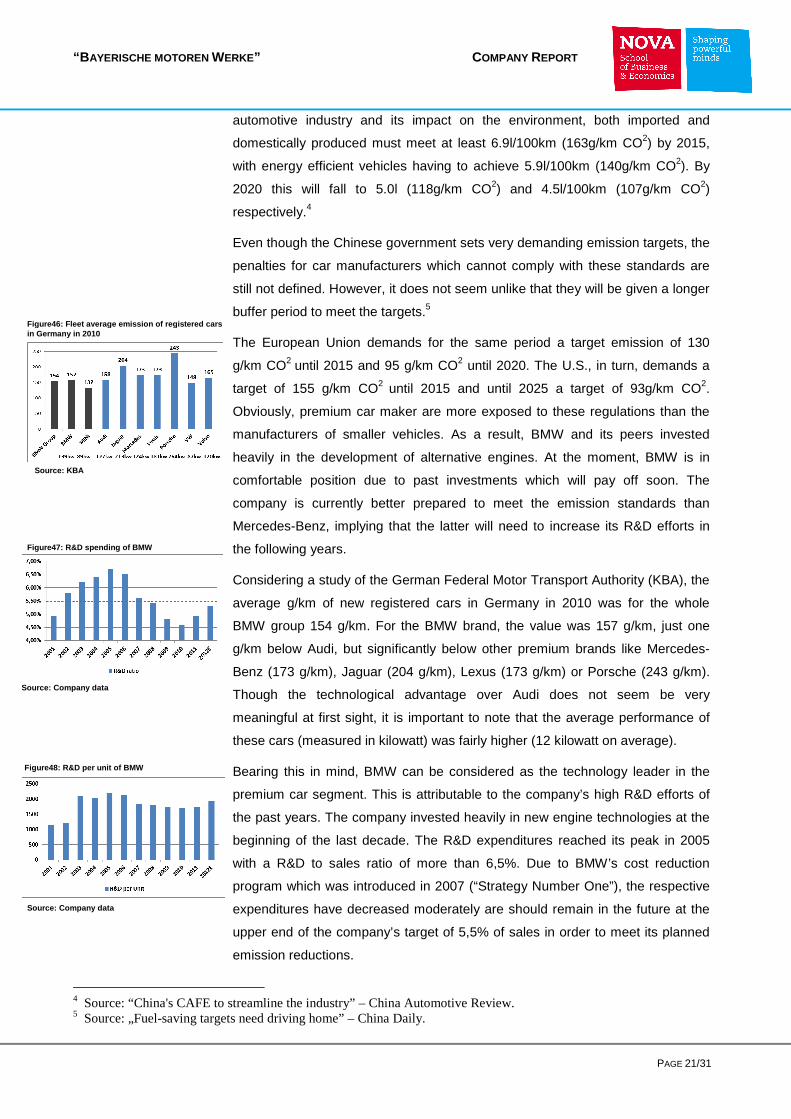
Considering a study of the German Federal Motor Transport Authority (KBA), the
average g/km of new registered cars in Germany in 2010 was for the whole
BMW group 154 g/km. For the BMW brand, the value was 157 g/km, just one
g/km below Audi, but significantly below other premium brands like Mercedes-
Benz (173 g/km), Jaguar (204 g/km), Lexus (173 g/km) or Porsche (243 g/km).
Though the technological advantage over Audi does not seem be very
meaningful at first sight, it is important to note that the average performance of
these cars (measured in kilowatt) was fairly higher (12 kilowatt on average).
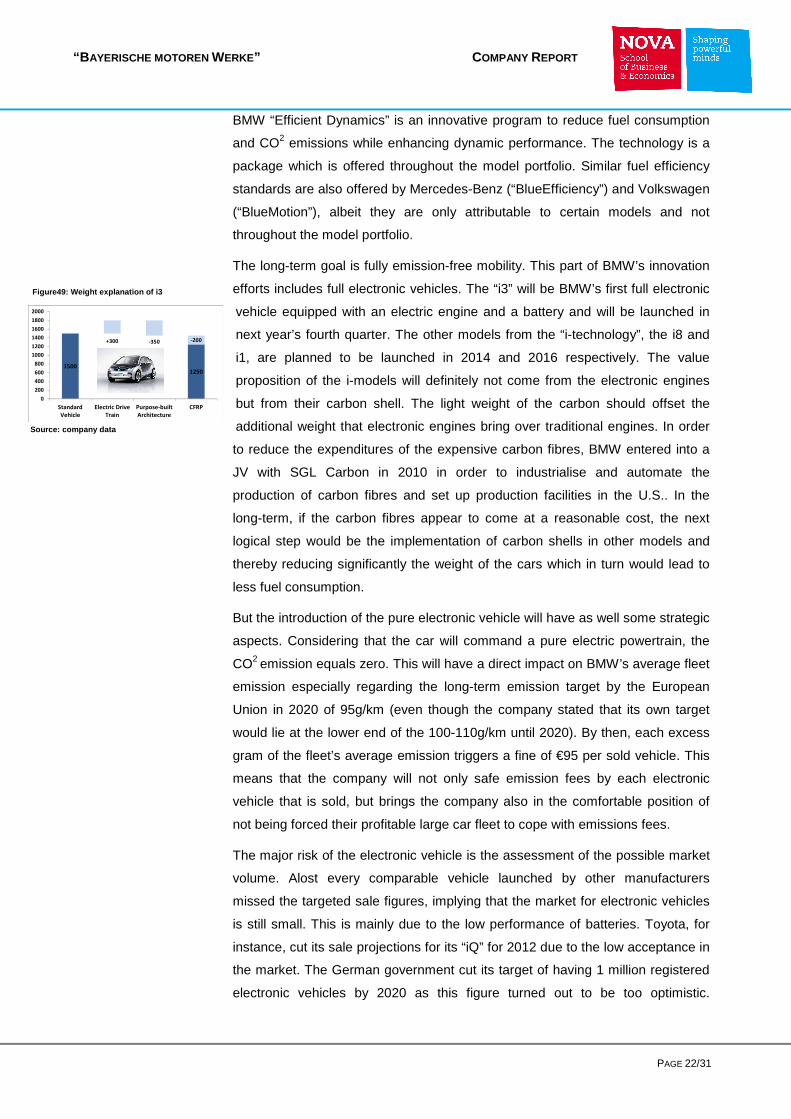
Bearing this in mind, BMW can be considered as the technology leader in the
premium car segment. This is attributable to the company’s high R&D efforts of
the past years. The company invested heavily in new engine technologies at the
beginning of the last decade. The R&D expenditures reached its peak in 2005
with a R&D to sales ratio of more than 6,5%. Due to BMW’s cost reduction
program which was introduced in 2007 (“Strategy Number One”), the respective
expenditures have decreased moderately are should remain in the future at the
upper end of the company’s target of 5,5% of sales in order to meet its planned
emission reductions.
4 Source: “China's CAFE to streamline the industry” – China Automotive Review. 5 Source: „Fuel-saving targets need driving home” – China Daily.
Figure46: Fleet average emission of registered cars in Germany in 2010
Source: KBA
Figure47: R&D spending of BMW
Source: Company data
Figure48: R&D per unit of BMW
Source: Company data
“B AYERISCHE MOTOREN WERKE” C OMPANY REPORT
PAGE 22/31
BMW “Efficient Dynamics” is an innovative program to reduce fuel consumption
and CO2 emissions while enhancing dynamic performance. The technology is a
package which is offered throughout the model portfolio. Similar fuel efficiency
standards are also offered by Mercedes-Benz (“BlueEfficiency”) and Volkswagen
(“BlueMotion”), albeit they are only attributable to certain models and not
throughout the model portfolio.
The long-term goal is fully emission-free mobility. This part of BMW’s innovation
efforts includes full electronic vehicles. The “i3” will be BMW’s first full electronic
vehicle equipped with an electric engine and a battery and will be launched in
next year’s fourth quarter. The other models from the “i-technology”, the i8 and
i1, are planned to be launched in 2014 and 2016 respectively. The value
proposition of the i-models will definitely not come from the electronic engines
but from their carbon shell. The light weight of the carbon should offset the
additional weight that electronic engines bring over traditional engines. In order
to reduce the expenditures of the expensive carbon fibres, BMW entered into a
JV with SGL Carbon in 2010 in order to industrialise and automate the
production of carbon fibres and set up production facilities in the U.S.. In the
long-term, if the carbon fibres appear to come at a reasonable cost, the next
logical step would be the implementation of carbon shells in other models and
thereby reducing significantly the weight of the cars which in turn would lead to
less fuel consumption.
But the introduction of the pure electronic vehicle will have as well some strategic
aspects. Considering that the car will command a pure electric powertrain, the
CO2 emission equals zero. This will have a direct impact on BMW’s average fleet
emission especially regarding the long-term emission target by the European
Union in 2020 of 95g/km (even though the company stated that its own target
would lie at the lower end of the 100-110g/km until 2020). By then, each excess
gram of the fleet’s average emission triggers a fine of €95 per sold vehicle. This
means that the company will not only safe emission fees by each electronic
vehicle that is sold, but brings the company also in the comfortable position of
not being forced their profitable large car fleet to cope with emissions fees.
The major risk of the electronic vehicle is the assessment of the possible market
volume. Alost every comparable vehicle launched by other manufacturers
missed the targeted sale figures, implying that the market for electronic vehicles
is still small. This is mainly due to the low performance of batteries. Toyota, for
instance, cut its sale projections for its “iQ” for 2012 due to the low acceptance in
the market. The German government cut its target of having 1 million registered
electronic vehicles by 2020 as this figure turned out to be too optimistic.
15001250
+300 -350 -200
0
200
400
600
800
1000
1200
1400
1600
1800
2000
Standard
Vehicle
Electric Drive
Train
Purpose-built
Architecture
CFRP
Figure49: Weight explanation of i3
Source: company data
“B AYERISCHE MOTOREN WERKE” C OMPANY REPORT
PAGE 23/31
Nevertheless, most governments are supporting the sale of electronic vehicles
through vehicle tax exemptions or R&D subsidies for the manufacturers.
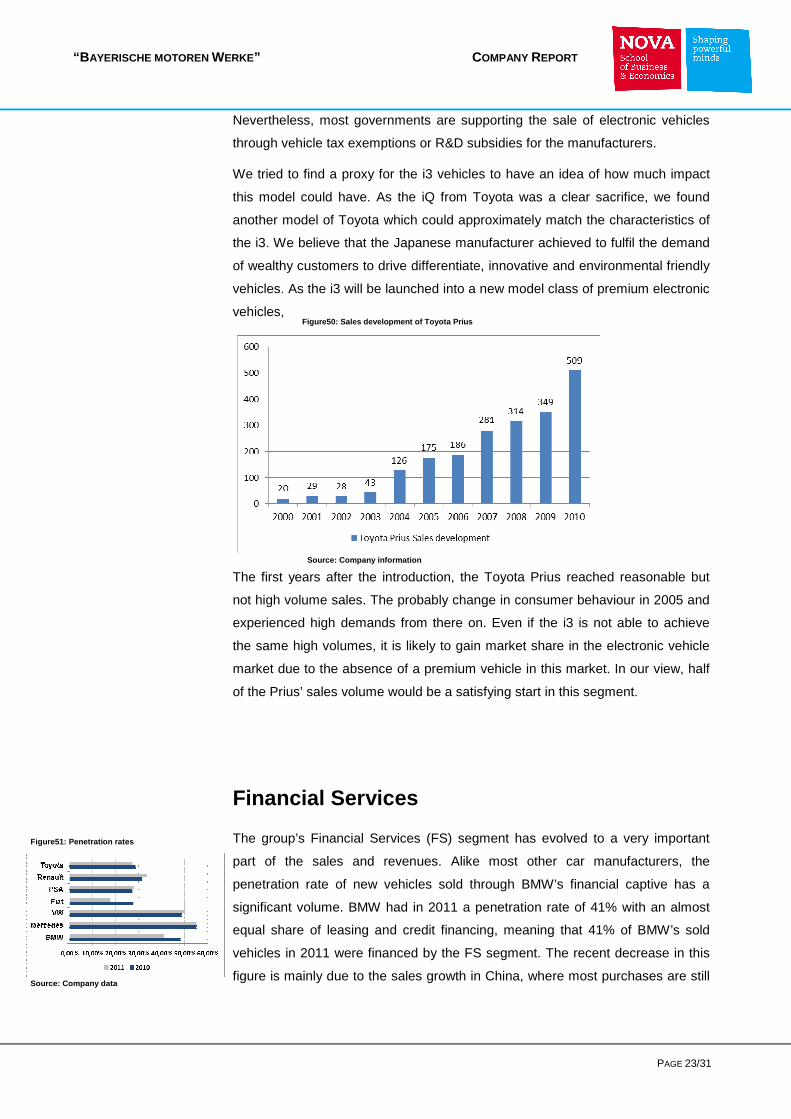
We tried to find a proxy for the i3 vehicles to have an idea of how much impact
this model could have. As the iQ from Toyota was a clear sacrifice, we found
another model of Toyota which could approximately match the characteristics of
the i3. We believe that the Japanese manufacturer achieved to fulfil the demand
of wealthy customers to drive differentiate, innovative and environmental friendly
vehicles. As the i3 will be launched into a new model class of premium electronic
vehicles,
The first years after the introduction, the Toyota Prius reached reasonable but
not high volume sales. The probably change in consumer behaviour in 2005 and
experienced high demands from there on. Even if the i3 is not able to achieve
the same high volumes, it is likely to gain market share in the electronic vehicle
market due to the absence of a premium vehicle in this market. In our view, half
of the Prius’ sales volume would be a satisfying start in this segment.
Financial Services
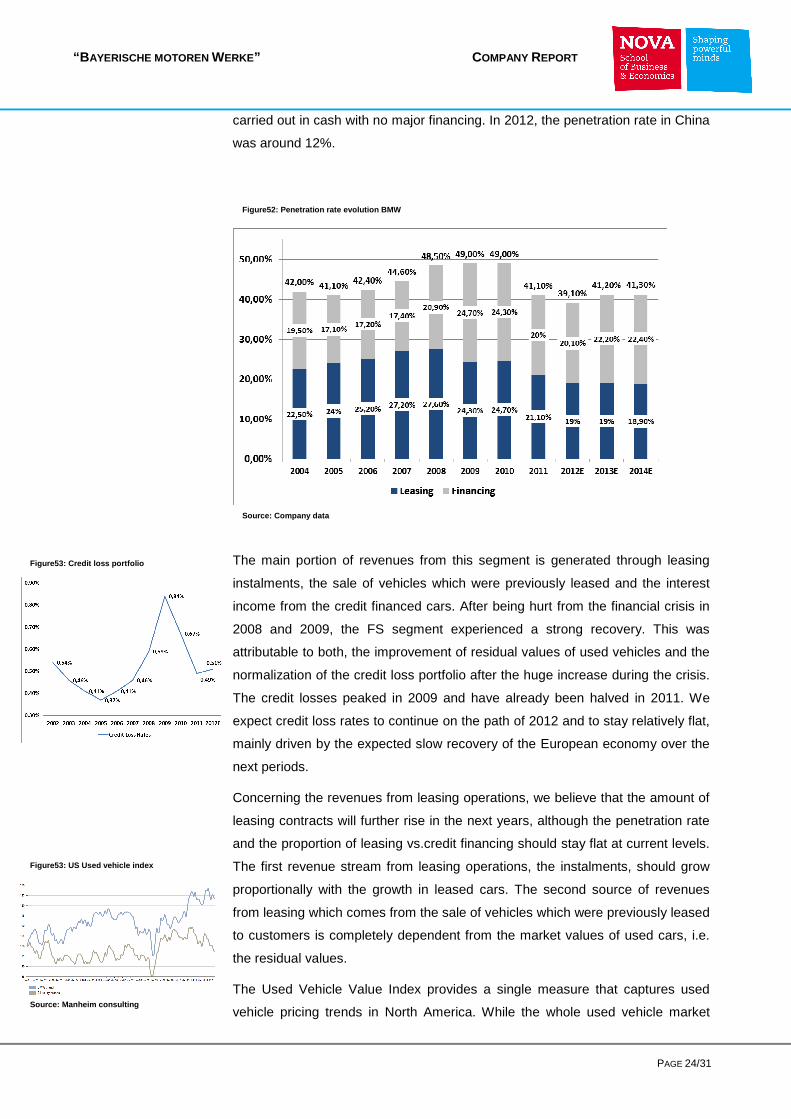
The group’s Financial Services (FS) segment has evolved to a very important
part of the sales and revenues. Alike most other car manufacturers, the
penetration rate of new vehicles sold through BMW’s financial captive has a
significant volume. BMW had in 2011 a penetration rate of 41% with an almost
equal share of leasing and credit financing, meaning that 41% of BMW’s sold
vehicles in 2011 were financed by the FS segment. The recent decrease in this
figure is mainly due to the sales growth in China, where most purchases are still
Figure50: Sales development of Toyota Prius
Source: Company information
Figure51: Penetration rates
Source: Company data
“B AYERISCHE MOTOREN WERKE” C OMPANY REPORT
PAGE 24/31
carried out in cash with no major financing. In 2012, the penetration rate in China
was around 12%.
The main portion of revenues from this segment is generated through leasing
instalments, the sale of vehicles which were previously leased and the interest
income from the credit financed cars. After being hurt from the financial crisis in
2008 and 2009, the FS segment experienced a strong recovery. This was
attributable to both, the improvement of residual values of used vehicles and the
normalization of the credit loss portfolio after the huge increase during the crisis.
The credit losses peaked in 2009 and have already been halved in 2011. We
expect credit loss rates to continue on the path of 2012 and to stay relatively flat,
mainly driven by the expected slow recovery of the European economy over the
next periods.
Concerning the revenues from leasing operations, we believe that the amount of
leasing contracts will further rise in the next years, although the penetration rate
and the proportion of leasing vs.credit financing should stay flat at current levels.
The first revenue stream from leasing operations, the instalments, should grow
proportionally with the growth in leased cars. The second source of revenues
from leasing which comes from the sale of vehicles which were previously leased
to customers is completely dependent from the market values of used cars, i.e.
the residual values.
The Used Vehicle Value Index provides a single measure that captures used
vehicle pricing trends in North America. While the whole used vehicle market
Figure52: Penetration rate evolution BMW
Source: Company data
Figure53: Credit loss portfolio
Figure53: US Used vehicle index
Source: Manheim consulting
“B AYERISCHE MOTOREN WERKE” C OMPANY REPORT
PAGE 25/31
experienced a downturn during the last year, BMW branded used vehicles have
clearly outperformed both, the overall used vehicle market and the average of
luxury brands. This instance, in combination with an expected further upturn in
the U.S. car market let us believe that the prices for used BMW’s should stay
around its current level.
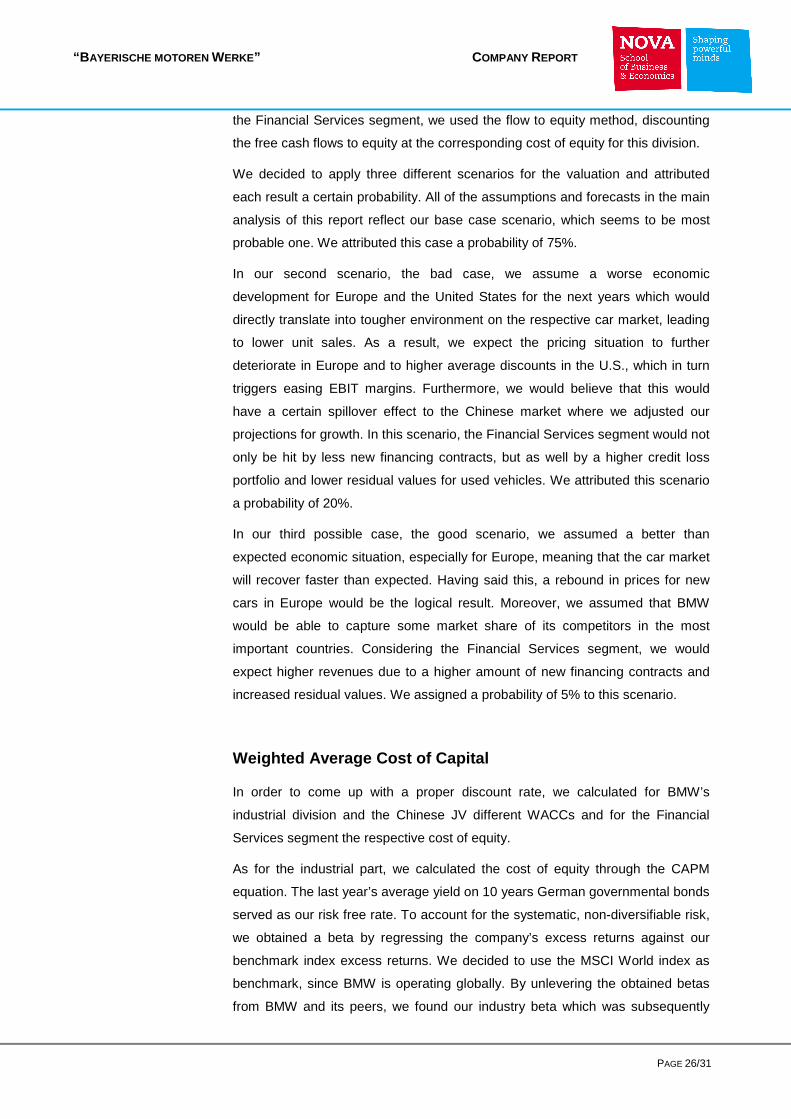
Base case
Revenues Operational Lease 2011 2012F 2013F 2014F 2015F 2 016F
Income from Lease installments 5.628 6.467 6.915 7.325 7.705 8.066
Income from sale of prev. Leased cars 6.226 6.746 7.321 7.827 8.291 8.721
Total Revenues 11.854 13.214 14.235 15.151 15.996 16.787
The other main source of revenues of the FS segment arises from the interest
income of vehicles which are financed through credits, financial lease as well as
dealer financing. Most of the FS segment’s credit financing and lease business is
refinanced on capital markets. The BMW Group has good access to financial
markets thanks to its strong creditworthiness (Moody`s A2, S&P A-) and is able
to raise money at competitive conditions. Furthermore, BMW operates a retail
bank with deposits of more than €11 billion which represents another attractive
source of liquidity for the FS segment.
Base case
Revenues Credit financing 2011 2012F 2013F 2014F 2015F 20 16F
Interest Income 2.774 3.018 3.237 3.466 3.717 3.916Interest expense on loan financing -1.914 -2.267 -2.432 -2.604 -2.792 -2.941
Net interest income 860 751 806 863 925 974
Valuation
Scenarios
We valued BMW using a SOTP approach, valuing BMW’s industrial and financial
operations separately as well as the JV in China. The industrial operations
include the automotive segment and the motorcycles segment. As the
motorcycles division has very little impact on the whole group’s financial results,
to pass on a deeper analysis for this segment. The assumptions behind the
evolvement of the motorcycles segment follow the pattern as for the automotive
part anyway.
For BMW’s industrial operations and the Chinese JV, we used a DFC model,
discounting the future free cash flows to the firm (FCF) at a proper WACC. As for
Figure54: Revenue forecast Leasing
Source: company data; Analysts estimates
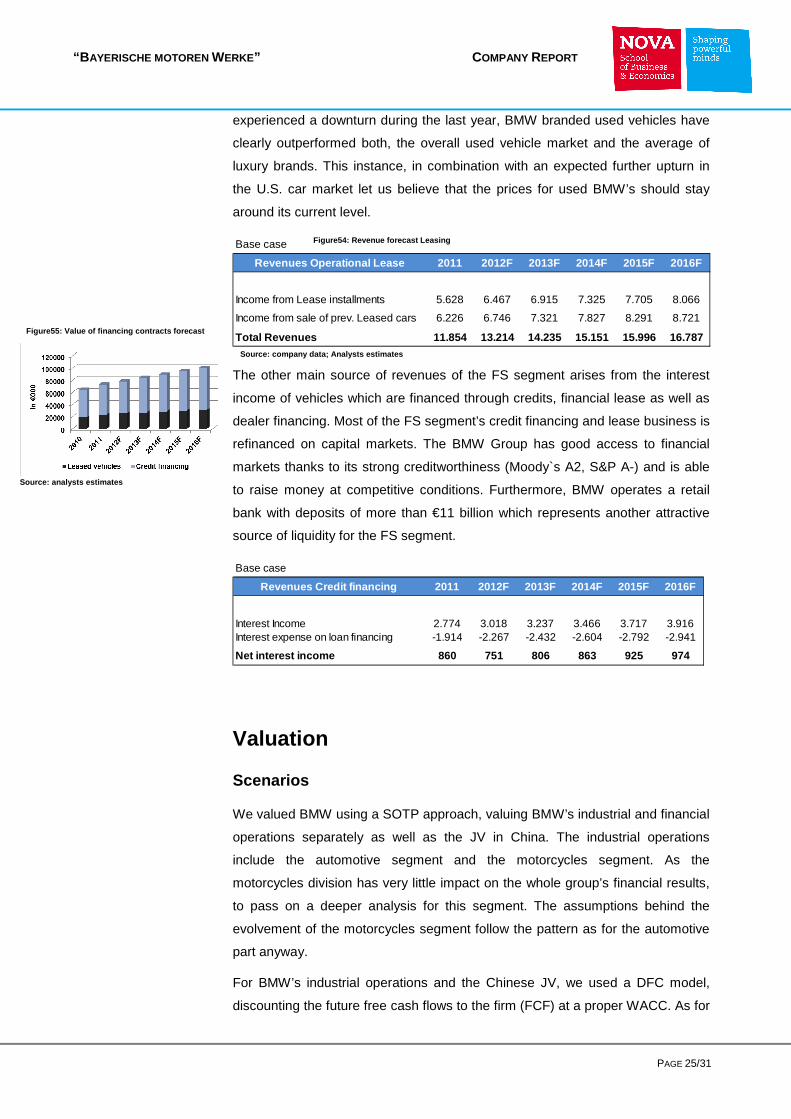
Figure55: Value of financing contracts forecast
Source: analysts estimates
“B AYERISCHE MOTOREN WERKE” C OMPANY REPORT
PAGE 26/31
the Financial Services segment, we used the flow to equity method, discounting
the free cash flows to equity at the corresponding cost of equity for this division.
We decided to apply three different scenarios for the valuation and attributed
each result a certain probability. All of the assumptions and forecasts in the main
analysis of this report reflect our base case scenario, which seems to be most
probable one. We attributed this case a probability of 75%.
In our second scenario, the bad case, we assume a worse economic
development for Europe and the United States for the next years which would
directly translate into tougher environment on the respective car market, leading
to lower unit sales. As a result, we expect the pricing situation to further
deteriorate in Europe and to higher average discounts in the U.S., which in turn
triggers easing EBIT margins. Furthermore, we would believe that this would
have a certain spillover effect to the Chinese market where we adjusted our
projections for growth. In this scenario, the Financial Services segment would not
only be hit by less new financing contracts, but as well by a higher credit loss
portfolio and lower residual values for used vehicles. We attributed this scenario
a probability of 20%.
In our third possible case, the good scenario, we assumed a better than
expected economic situation, especially for Europe, meaning that the car market
will recover faster than expected. Having said this, a rebound in prices for new
cars in Europe would be the logical result. Moreover, we assumed that BMW
would be able to capture some market share of its competitors in the most
important countries. Considering the Financial Services segment, we would
expect higher revenues due to a higher amount of new financing contracts and
increased residual values. We assigned a probability of 5% to this scenario.
Weighted Average Cost of Capital
In order to come up with a proper discount rate, we calculated for BMW’s
industrial division and the Chinese JV different WACCs and for the Financial
Services segment the respective cost of equity.
As for the industrial part, we calculated the cost of equity through the CAPM
equation. The last year’s average yield on 10 years German governmental bonds
served as our risk free rate. To account for the systematic, non-diversifiable risk,
we obtained a beta by regressing the company’s excess returns against our
benchmark index excess returns. We decided to use the MSCI World index as
benchmark, since BMW is operating globally. By unlevering the obtained betas
from BMW and its peers, we found our industry beta which was subsequently
“B AYERISCHE MOTOREN WERKE” C OMPANY REPORT
PAGE 27/31
relevered by BMW’s capital structure. To complete the CAPM equation, we
choose a market risk premium of 5,5%. The respective cost of equity amounted
to 7,15%.
The next step was to calculate the cost of debt. For that, we used the following
formula: (1 – Probability of default) x Market yield – (1 – Recovery rate) x Probability of default.
We calculated the market yield by adding a default spread on our risk free rate.
As proxy for the default spread, we used the last years average 10 year CDS
spread for BMW. Given its good creditworthiness (Moody`s A2, S&P A-), we
decided to neglect the second part of the cost of debt equation. Our obtained
cost of debt is 2,94%.
We followed the same approach for WACC of the JV. The main difference is that
we decided to include a country risk premium for China in our cost of equity
equation. As for the cost of debt, we used an average of BMW’s previously
calculated cost of debt, and the one of its JV partner, Brilliance China
Automotive.
The cost of equity of the Financial Services segment was calculated as well
through the CAPM equation. But in this case, we used a different beta than for
the automotive part. This seems to be reasonable since this segment not only
depended on the sale of cars, the company’s main business, but as well to its
credit loss portfolio and the residual values of the used vehicles. Therefore, we
used similar consumer finance companies as comparables to estimate the beta.
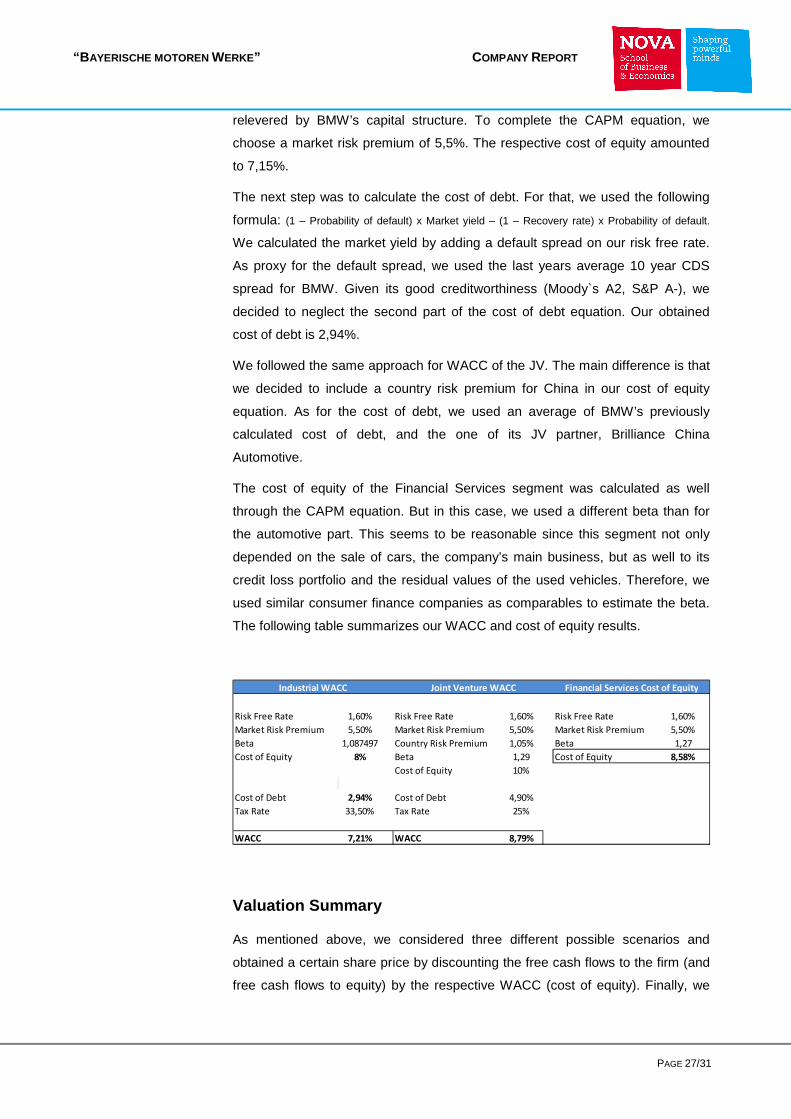
The following table summarizes our WACC and cost of equity results.
Risk Free Rate 1,60% Risk Free Rate 1,60% Risk Free Rate 1,60%
Market Risk Premium 5,50% Market Risk Premium 5,50% Market Risk Premium 5,50%
Beta 1,087497 Country Risk Premium 1,05% Beta 1,27
Cost of Equity 8% Beta 1,29 Cost of Equity 8,58%
Cost of Equity 10%
Cost of Debt 2,94% Cost of Debt 4,90%
Tax Rate 33,50% Tax Rate 25%
WACC 7,21% WACC 8,79%
Industrial WACC Joint Venture WACC Financial Services Cost of Equity
Valuation Summary
As mentioned above, we considered three different possible scenarios and
obtained a certain share price by discounting the free cash flows to the firm (and
free cash flows to equity) by the respective WACC (cost of equity). Finally, we
“B AYERISCHE MOTOREN WERKE” C OMPANY REPORT
PAGE 28/31
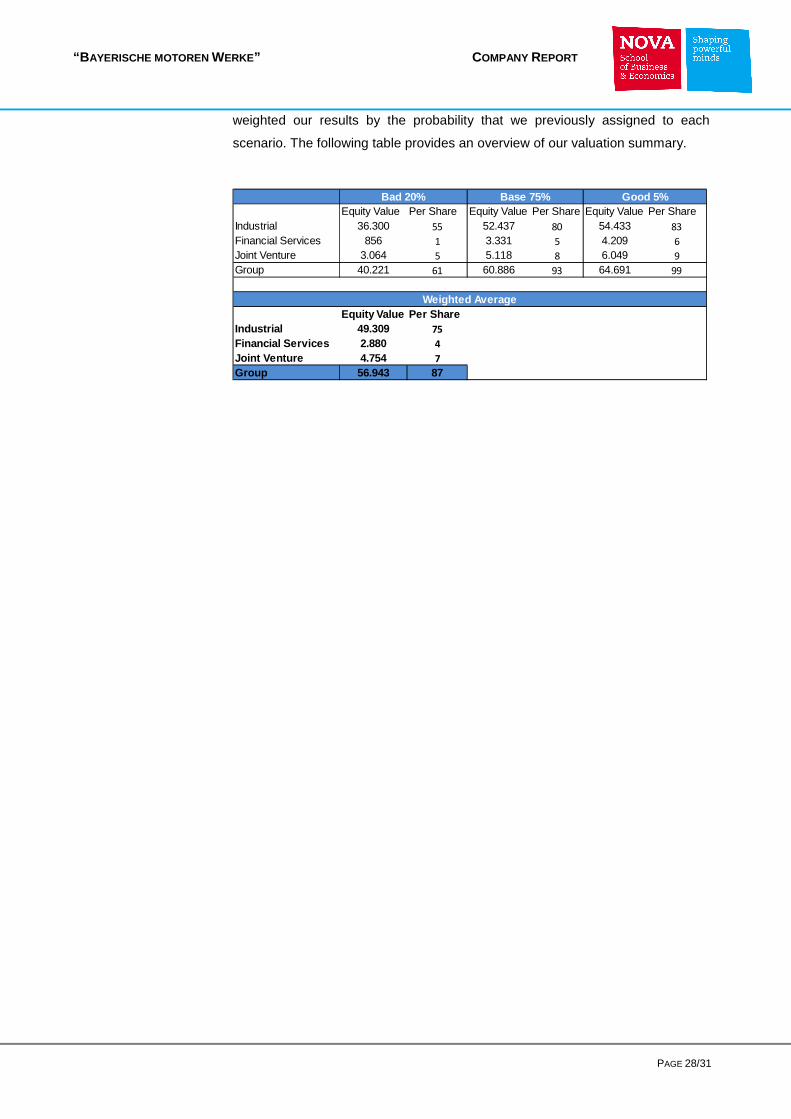
weighted our results by the probability that we previously assigned to each
scenario. The following table provides an overview of our valuation summary.
Equity Value Per Share Equity Value Per Share Equity Value Per ShareIndustrial 36.300 55 52.437 80 54.433 83
Financial Services 856 1 3.331 5 4.209 6
Joint Venture 3.064 5 5.118 8 6.049 9
Group 40.221 61 60.886 93 64.691 99
Equity Value Per ShareIndustrial 49.309 75
Financial Services 2.880 4
Joint Venture 4.754 7
Group 56.943 87
Weighted Average
Bad 20% Base 75% Good 5%
“B AYERISCHE MOTOREN WERKE” C OMPANY REPORT
PAGE 29/31
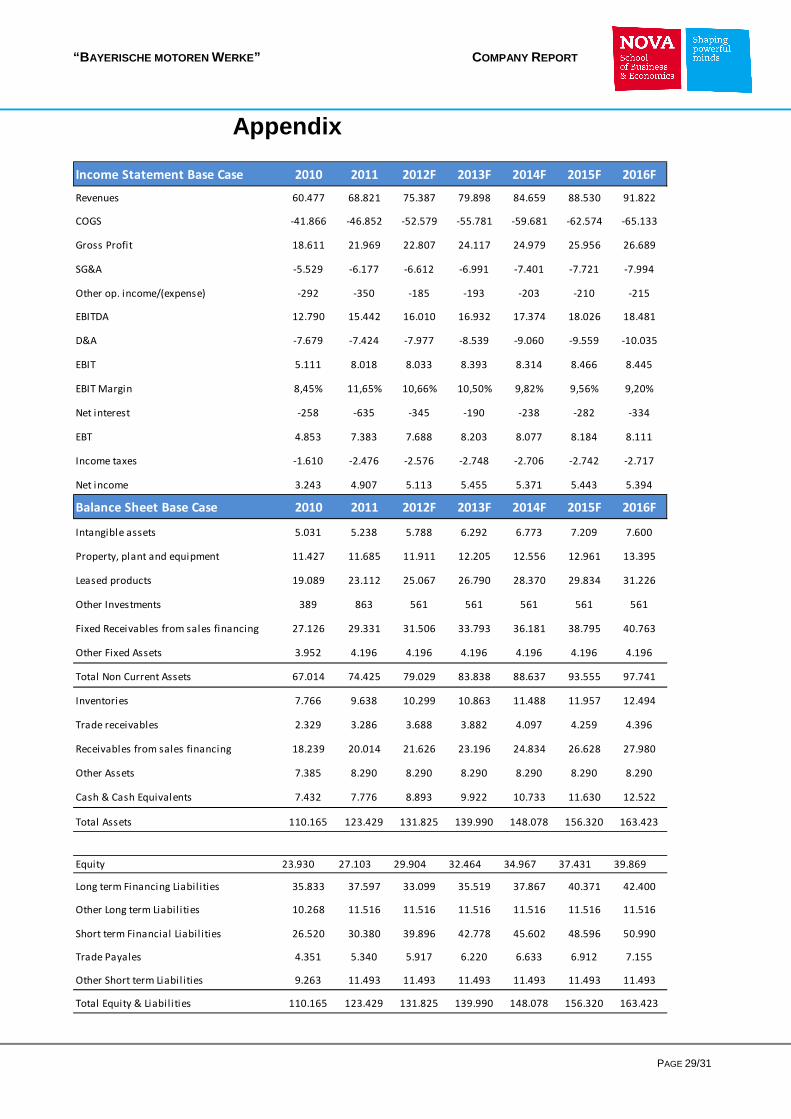
Appendix
Income Statement Base Case 2010 2011 2012F 2013F 2014F 2015F 2016F
Revenues 60.477 68.821 75.387 79.898 84.659 88.530 91.822
COGS -41.866 -46.852 -52.579 -55.781 -59.681 -62.574 -65.133
Gross Profit 18.611 21.969 22.807 24.117 24.979 25.956 26.689
SG&A -5.529 -6.177 -6.612 -6.991 -7.401 -7.721 -7.994
Other op. income/(expense) -292 -350 -185 -193 -203 -210 -215
EBITDA 12.790 15.442 16.010 16.932 17.374 18.026 18.481
D&A -7.679 -7.424 -7.977 -8.539 -9.060 -9.559 -10.035
EBIT 5.111 8.018 8.033 8.393 8.314 8.466 8.445
EBIT Margin 8,45% 11,65% 10,66% 10,50% 9,82% 9,56% 9,20%
Net interest -258 -635 -345 -190 -238 -282 -334
EBT 4.853 7.383 7.688 8.203 8.077 8.184 8.111
Income taxes -1.610 -2.476 -2.576 -2.748 -2.706 -2.742 -2.717
Net income 3.243 4.907 5.113 5.455 5.371 5.443 5.394
Balance Sheet Base Case 2010 2011 2012F 2013F 2014F 2015F 2016F
Intangible assets 5.031 5.238 5.788 6.292 6.773 7.209 7.600
Property, plant and equipment 11.427 11.685 11.911 12.205 12.556 12.961 13.395
Leased products 19.089 23.112 25.067 26.790 28.370 29.834 31.226
Other Investments 389 863 561 561 561 561 561
Fixed Receivables from sales financing 27.126 29.331 31.506 33.793 36.181 38.795 40.763
Other Fixed Assets 3.952 4.196 4.196 4.196 4.196 4.196 4.196
Total Non Current Assets 67.014 74.425 79.029 83.838 88.637 93.555 97.741
Inventories 7.766 9.638 10.299 10.863 11.488 11.957 12.494
Trade receivables 2.329 3.286 3.688 3.882 4.097 4.259 4.396
Receivables from sales financing 18.239 20.014 21.626 23.196 24.834 26.628 27.980
Other Assets 7.385 8.290 8.290 8.290 8.290 8.290 8.290
Cash & Cash Equivalents 7.432 7.776 8.893 9.922 10.733 11.630 12.522
Total Assets 110.165 123.429 131.825 139.990 148.078 156.320 163.423
Equity 23.930 27.103 29.904 32.464 34.967 37.431 39.869
Long term Financing Liabil ities 35.833 37.597 33.099 35.519 37.867 40.371 42.400
Other Long term Liabil ities 10.268 11.516 11.516 11.516 11.516 11.516 11.516
Short term Financial Liabil ities 26.520 30.380 39.896 42.778 45.602 48.596 50.990
Trade Payales 4.351 5.340 5.917 6.220 6.633 6.912 7.155
Other Short term Liabil ities 9.263 11.493 11.493 11.493 11.493 11.493 11.493
Total Equity & Liabilities 110.165 123.429 131.825 139.990 148.078 156.320 163.423
“B AYERISCHE MOTOREN WERKE” C OMPANY REPORT
PAGE 30/31
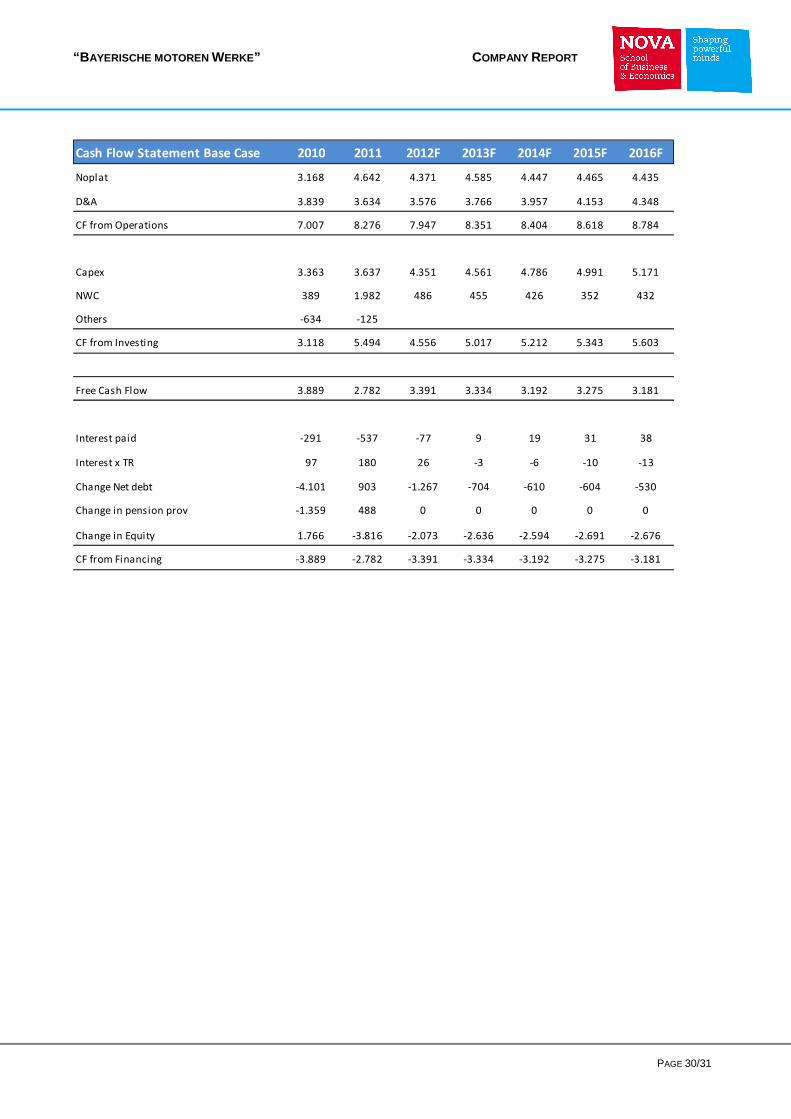
Cash Flow Statement Base Case 2010 2011 2012F 2013F 2014F 2015F 2016F
Noplat 3.168 4.642 4.371 4.585 4.447 4.465 4.435
D&A 3.839 3.634 3.576 3.766 3.957 4.153 4.348
CF from Operations 7.007 8.276 7.947 8.351 8.404 8.618 8.784
Capex 3.363 3.637 4.351 4.561 4.786 4.991 5.171
NWC 389 1.982 486 455 426 352 432
Others -634 -125
CF from Investing 3.118 5.494 4.556 5.017 5.212 5.343 5.603
Free Cash Flow 3.889 2.782 3.391 3.334 3.192 3.275 3.181
Interest paid -291 -537 -77 9 19 31 38
Interest x TR 97 180 26 -3 -6 -10 -13
Change Net debt -4.101 903 -1.267 -704 -610 -604 -530
Change in pension prov -1.359 488 0 0 0 0 0
Change in Equity 1.766 -3.816 -2.073 -2.636 -2.594 -2.691 -2.676
CF from Financing -3.889 -2.782 -3.391 -3.334 -3.192 -3.275 -3.181
“B AYERISCHE MOTOREN WERKE” C OMPANY REPORT
PAGE 31/31
Disclosures and Disclaimer
Research Recommendations
Buy Expected total return (including dividends) of more than 15% over a 12-month period.
Hold Expected total return (including dividends) between 0% and 15% over a 12-month period.
Sell Expected negative total return (including dividends) over a 12-month period.
This report was prepared by “Student’s Name”, a stu dent of the NOVA School of Business and Economics, following the Masters in Finance Equity Research – Field Lab Work Project, exclusively for academic purposes. Thus, the author, which is a Masters in Finance student, is the sole responsible for the information and estimates conta ined herein and for the opinions expressed, which reflect exclusively his/her own personal judg ement. This report was supervised by professor Rosário André (registered with Comissão do Mercado de Valores Mobiliários as financial analyst) who revised the valuation methodology and the finan cial model. All opinions and estimates are subject to change without notice. NOVA SBE or its faculty accepts no responsibility whatsoever for the content of this report nor for any consequences of its use. The information contained herein has been compiled by students from public sources believed to be reliable, but NOVA SBE or the students make no representation that it is accurate or complete, and accept no liability whatsoever for any direct or indirect loss resulting from the use of this report or its content. The author hereby certifies that the views expressed in this report accurately reflect his/her personal opinion about the subject company and its securities. He/she has not received or been promised any direct or indirect compensation for expressing the opinions or recommendation included in this report. The author of this report may have a position, or otherwise be interested, in transactions in securities which are directly or indirectly the subject of this report. NOVA SBE may have received compensation from the subject company during the last 12 months related to its fund raising program. Nevertheless, no compensation eventually received by NOVA SBE is in any way related to or dependent on the opinions expressed in this report. The Nova School of Business and Economics, though registered with Comissão do Mercado de Valores Mobiliários, does not deal for or otherwise offers any investment or intermediation services to market counterparties, private or intermediate customers. This report may not be reproduced, distributed or published without the explicit previous consent of its author, unless when used by NOVA SBE for academic purposes only. At any time, NOVA SBE may decide to suspend this report reproduction or distribution without further notice.