brain structural complexity and life course cognitive change
TRANSCRIPT
NeuroImage 61 (2012) 694–701
Contents lists available at SciVerse ScienceDirect
NeuroImage
j ourna l homepage: www.e lsev ie r .com/ locate /yn img
Brain structural complexity and life course cognitive change
Nazahah Mustafa a,d, Trevor S. Ahearn b, Gordon D. Waiter a, Alison D. Murray a,Lawrence J. Whalley c, Roger T. Staff b,⁎a Aberdeen Biomedical Imaging Centre, Lilian Sutton Building, University of Aberdeen, Foresterhill, AB25 2ZD Aberdeen, Scotland, UKb Aberdeen Royal Infirmary, NHS Grampian, Foresterhill, AB25 2ZD Aberdeen, Scotland, UKc Department of Mental Health, University of Aberdeen, Foresterhill, AB25 2ZD Aberdeen, Scotland, UKd School of Mechatronic Engineering, University Malaysia Perlis, 02600 Pauh, Perlis, Malaysia
⁎ Corresponding author. Fax: +44 1224 554753.E-mail address: [email protected] (R.T. Staf
1053-8119/$ – see front matter © 2012 Elsevier Inc. Alldoi:10.1016/j.neuroimage.2012.03.088
a b s t r a c t
a r t i c l e i n f oArticle history:Accepted 30 March 2012Available online 10 April 2012
Keywords:Childhood intelligenceFluid intelligenceCrystallized intelligenceCognitive ageingFractal dimensionBrain MR image
Fractal measures such as fractal dimension (FD) can quantify the structural complexity of the brain. Thesehave been used in clinical neuroscience to investigate brain development, ageing and in studies of psychiatricand neurological disorders. Here, we examined associations between the FD of white matter and cognitivechanges across the life course in the absence of detectable brain disease. The FD was calculated from seg-mented cerebral white matter MR images in 217 subjects aged about 68 years, in whom archived intelligencescores from age 11 years were available. Cognitive test scores of fluid and crystallised intelligence wereobtained at the time of MR imaging. Significant differences were found (intracranial volume, brain volume,white matter volume and Raven's Progressive Matrices score) between men and women at age 68 yearsand novel associations were found between FD and measures of cognitive change over the life course fromage 11 to 68 years. Those with greater FD were found to have greater than expected fluid abilities at age68 years than predicted by their childhood intelligence and less cognitive decline from age 11 to 68 years.These results are consistent with other reports that FD measures of cortical structural complexity increaseacross the early life course during maturation of the cerebral cortex and add new data to support an associ-ation between FD and cognitive ageing.
© 2012 Elsevier Inc. All rights reserved.
Introduction
The neurobiological basis of cognition and age-related changes incognitive abilities (‘cognitive ageing’) is uncertain. Development ofeffective interventions to delay cognitive ageing will almost certainlyrely on, at least in part, careful scientific analysis of structural changesin the ageing brain. For years the notion has prevailed that more isbetter, in terms of neuro-development and in terms of reserve or pro-tection against ageing and disease in late life. Testing the ‘more isbetter’ hypothesis has produced mixed results, although an extensivemeta-analysis (McDaniel, 2005) concluded that brain size correlatedwith fluid intelligence measures. The size of this correlation indicatesthat size is not everything. It would be rash to assume that cognitioncould be entirely explained by brain volume measures, but there isevidence to suggest that having more in particular regions is seen inindividuals with superior cognitive abilities (Haier et al., 2004; Staffet al., 2006).
The cerebral cortex is a fractal structure made up of parts that arein some ways similar to the whole. The cortical fractal structure canbe characterised by a single numerical value (the fractal dimension,
f).
rights reserved.
FD) that summarises the irregularity of the external cortical surfaceand the boundary between subcortical grey and white matter(Bullmore et al., 1994). As shown below, FD measures are used inneuroscience to reveal gender and age structural differences in thecerebral cortex in the absence of disease and to investigate psychiat-ric and neurological disorders. Development and ageing of the humanbrain can be studied with FD and have shown increasing cortical com-plexity from early foetal life (Garel et al., 2001; Kedzia et al., 2002;Rybaczuk et al., 1996; Shyu et al., 2010; Wu et al., 2009) throughchildhood (Blanton et al., 2001) and into adulthood (Amunts et al.,1997; Free et al., 1996; Takahashi et al., 2004) until decreasing com-plexity is seen in late life and in Alzheimer's disease (King et al.,2009, 2010; Zhang et al., 2007). There is also a growing literature onthe cortical FD in many psychiatric disorders including schizophreniaand manic depression (Bullmore et al., 1994; Ha et al., 2005; Narret al., 2001, 2004), obsessive compulsive disorder (Ha et al., 2005),autism (Raznahan et al., 2010) and neurological disorders includingstroke (Zhang et al., 2008), Williams syndrome (Thompson et al.,2005; Van Essen et al., 2006) and multiple sclerosis (Esteban et al.,2007, 2009).
Cognitive abilities increase across the life course from childhood tomid-life and then decline; slowly at first, accelerating through latemiddle age into old age. ‘Crystallised intelligence’ remains relativelystable and ‘fluid intelligence’ tends to decline in late life. ‘Crystallised
695N. Mustafa et al. / NeuroImage 61 (2012) 694–701
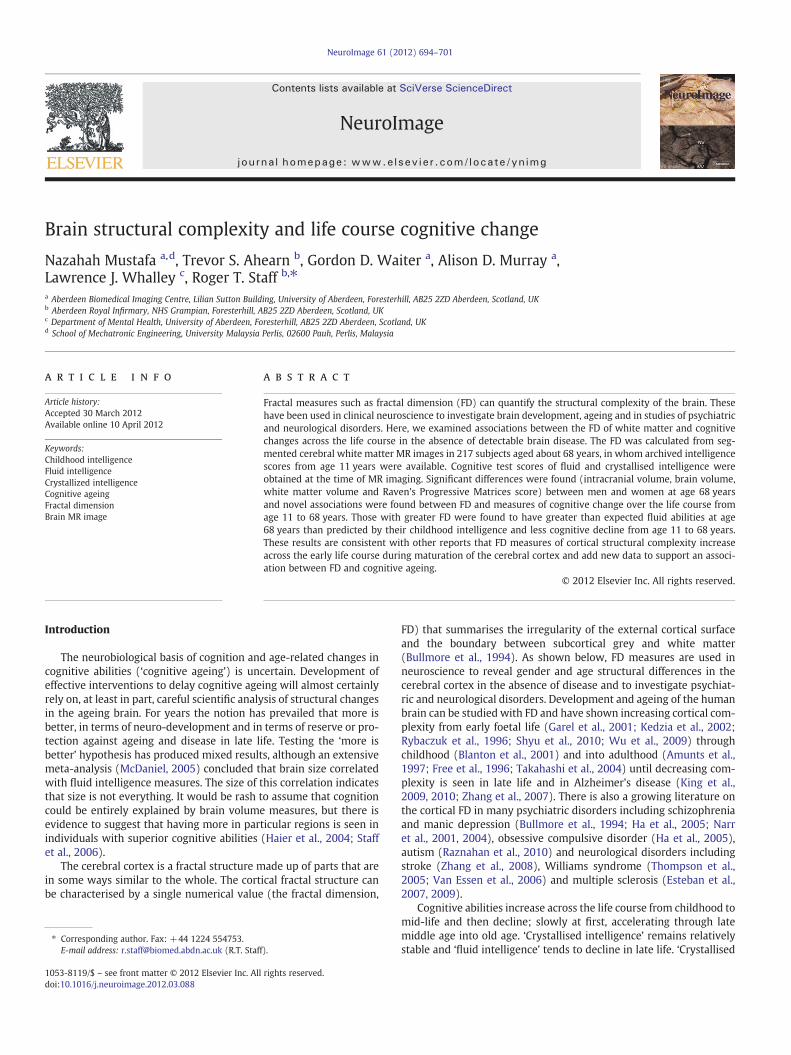
intelligence’ is considered a reliable estimate of an individual's ‘bestever’ ability before the onset of disease and ageing (Crawford et al.,2001). The ‘fluid intelligence’ measures speed of thought and someaspects of current problem solving ability. The difference betweenfluid and crystallised intelligence in late life is often considered areliable estimate of overall life course decline from pre-morbid ability(ΔL). Similarly, the difference between an estimate of childhoodintelligence and adult crystallised intelligence measures cognitivematuration from early life to the ‘best ever’ level of adult ability(ΔE). The difference between an early life measure of ability and alate life measure of fluid ability is an estimate of lifelong change influid ability (ΔF). The hypothesised cognitive life course changesand the estimates of maturation (ΔE), fluid ability change (ΔF) anddecline (ΔL) are schematically shown in Fig. 1.
There are reports that human intelligence is related to the totalvolume of grey and white matter in frontal, temporal and parietalareas (Haier et al., 2004). Im et al. (2006) examined 44 volunteersof mean (SD) age, 26.4 (±5.5) years to investigate: (1) how structur-al properties of the cerebral cortex affected the value of FD; (2) therelationships between FD of the cortical surface and intelligence(mean IQ of 116.27 (range between 89 and 134)) and the durationof education (mean of 15.7 years (range between 12 and 21 years)).They found that FD increased with intelligence and years of educa-tion. Their findings were interpreted as support for a contribution tocortical structural complexity by education and intelligence and areconsistent with the view that learning and training through educationcan change and reorganise cortical structure (Draganski et al., 2004;Mechelli et al., 2004). Sex differences in cortical structure and cogni-tive performance are major potential confounders of correlative stud-ies of cortical structure variations with specific cognitive abilities.Women are better at many tests of verbal ability whereas men havebetter spatial ability. Comparisons between sexes show men havelarger brains and a thicker cortex, but women have greater gyrifica-tion (Luders et al., 2004, 2006; Staff et al., 2006; Thompson et al.,2005). In 176 individuals, Sowell et al. (2007) found that women onaverage have thicker grey matter in temporal and parietal corticesand these differences are independent of brain and body size.
Brain size reduces with age in late adulthood. This is predominate-ly due to a loss of grey matter with white matter volume remainingrelatively stable (Good et al., 2002). When considering the influenceof brain structure (measured in later life) on the change in cognitivemeasures across the life course, it is reasonable to expect that white
Cognitive ability ( t d di d i t lli )
Cognitive ability changes v
(standardised intelligence score)
Maximum cognitive ability
E
Fluid intelligence at
F
Childhood intelligence at age 11 (MHT)
11 Age
Fig. 1. Schematic diagram of cognitive ability changes (standardised intelligence score) a
matter would remain relatively stable when compared to grey mat-ter, which loses volume faster and is susceptible to disease suchAlzheimer's disease.
FD has the potential to contribute in understanding how differ-ences in structural complexity might explain individual differencesin cognitive ageing. Therefore, we decided to analyse our structuralMRI database to explore how differences in cognitive variablesmight be accounted for by variance in the FD measures and howthese could be related to changes in mental performance across thelife course. We hypothesised that fractal descriptors of white matterwill be associated with childhood IQ, suggesting early cognitive mat-uration, better cognitive performance, less decline in late life and thatin general, more complex structures are associated with better cogni-tive outcomes.
Methods and materials
Subjects
Aberdeen 1936 Birth Cohort (ABC36) project has been describedin detail elsewhere (Deary et al., 2004b; Whalley et al., 2011). Briefly,the data used in the analyses reported here were taken from theABC36 brain imaging database held in the Aberdeen Biomedical Im-aging Centre. The primary goal of ABC36 is to identify brain imaging,biomedical and neuropsychological predictors of progress to demen-tia with onset after age 68 years in a volunteer sample without de-mentia all born in 1936 and recruited to the project between theyears 2000 and 2002. A subset of 248 subjects from 506 recruited toABC36 volunteered for brain MRI examination at age about 68 years.ABC36 volunteers were drawn from an original sample of Aberdeenschool children who were born in 1936 and in 1947 took part in theScottish Mental Survey of the general intelligence of Scottish schoolchildren (Deary et al., 2004a). Intelligence scores from age 11 werearchived by the Scottish Council for Research in Education whichgave the University of Aberdeen access to these IQ scores. The volun-teers have been assessed on four occasions since age 64 years whencomprehensive clinical, sociodemographic, nutritional and neuropsy-chological data have been collected. MRI data were first obtained atage about 68 years and are reported here. Cognitive tests have includ-ed non-verbal abstract reasoning using Raven's Progressive Matrices(RPM; Raven, 1960) and the National Adult Reasoning Test (NART;Nelson and Willison, 1982) which tests the ability to pronounce
ersus age
NART
RPM L
age 64
E: Estimate of maturationF: Estimate of fluid ability changeL: Estimate of decline
MHT : Moray House TestMHT : Moray House TestNART: National Adult Reading TestRPM : Raven’s Progressive Matrices Test
64
years
cross the life course and estimation of maturation, fluid ability change and decline.
696 N. Mustafa et al. / NeuroImage 61 (2012) 694–701
irregular words and is associated with educational level and generalintelligence. For this study, 217 subjects who have a complete dataset have been used in this analysis.
MR acquisition
The MR imaging study was performed on a 1.5 Tesla GE NVi sys-tem. The 3 dimensional (3D) images of brain were acquired with aT1 SPGR (T1W) MR sequence with the following parameters; 20 msrepetition time (TR), 6 ms echo time (TE), 35° flip angle (α), numberof slices between 100 and 124, effective slice thickness 1.6 mm andmatrix 256×256 in-plane resolution 1 mm×1 mm.
Segmentation
White matter structure was obtained from the T1W MR imageusing Freesurfer (FS) software (Fischl et al., 2002). FS is a free soft-ware package used as a set of semi automated tools for creating com-puterised model of the brain from MR imaging data and measuringthe brain's morphometric properties. Details of the segmentation pro-cedures are described elsewhere (Fischl et al., 2002, 2004; Han andFischl 2007).
The first steps in FS processing concern motion correction, affinetransformation to Talairach image space, non-uniform intensity nor-malisation for intensity inhomogeneity correction and removal ofnon-brain tissues. Intensity normalisation was then applied to thebrain volume to match the FS atlas image intensity histogram andcontinued with a non-linear warping of the atlas brain image to sub-ject brain image. The warped atlas brain image space was utilised inatlas-based tissue segmentation to label the subcortical structural,brain stem, cerebellum and cerebral cortex. The second step involvescortical parcellation of the white matter surface. The main compo-nents in surface mapping are surface inflation, projection to sphericalcoordinates, topology correction and surface based warping to alignanatomically homologous points. After processing was completed, theleft and right cerebral whitematters were extracted from the subcorticalstructure to form a whole white matter mask (256×256×256 mm3).The 3D white matter mask generated by FS was used for the fractal di-mension calculation. The mask was not altered in any way (e.g. trim-ming). The total brain size and total intracranial volume (TICV) wereextracted from the FS statistical output file and the total white mattervolume (WMV) was counted using a program written in the InteractiveData Language (IDL, Boulder, CO, USA).
Fractal measure
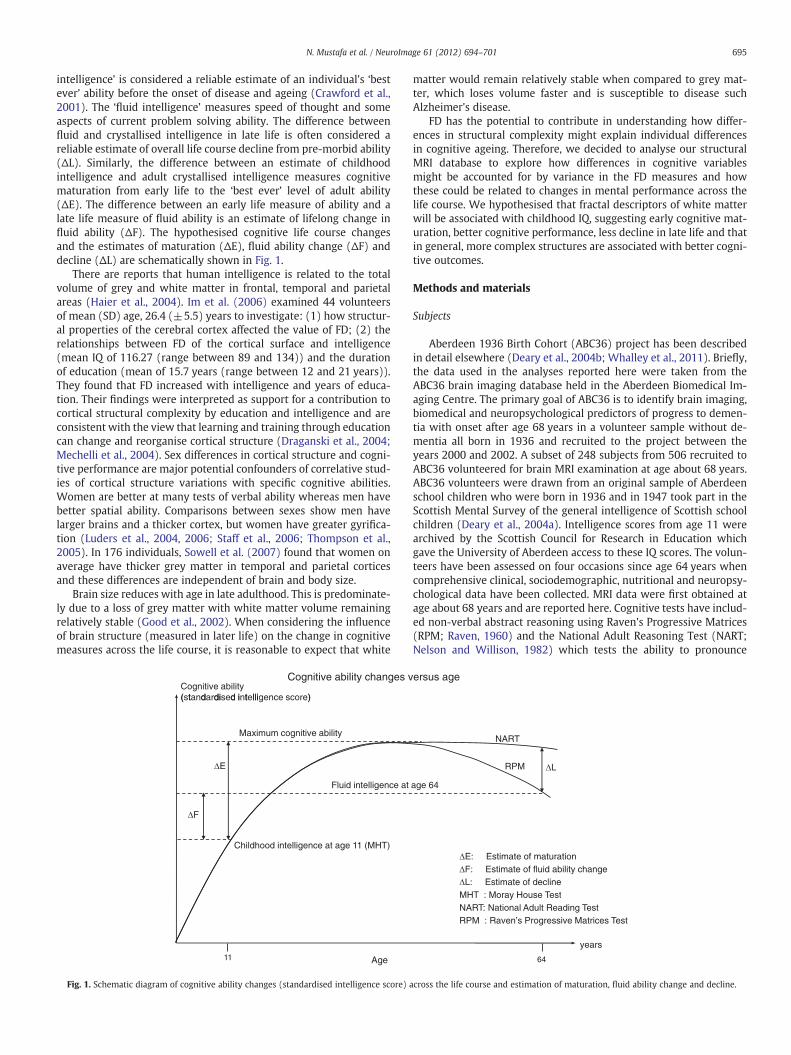
The fractal dimension (FD) of the cerebral white matter was esti-mated using a box-counting method (voxel based). The box-countingmethod was chosen because of its simplicity, robustness (Jiang et al.,2008) and ability to evaluate the fractal with and without self-similarity (Esteban et al., 2007; Zhang et al., 2006). A program to
Fig. 2. Example of FD estimation for cerebral white matter using box-counting method. Each
calculate and analyse white matter's fractal measures was written inthe Interactive Data Language (IDL, Boulder, CO, USA).
FD was computed by altering the scale of the image and countingthe number of white matter voxels at each scale. This was done bystarting at the original resolution and removing a part of the borderto give a 240×240×240 matrix and counting the white matter vox-els. The original 240×240×240 image was then rescaled to give ma-trix sizes of 120×120×120, 80×80×80, 60×60×60, 40×40×40and 20×20×20. At each scale (rFD=1, 2, 3, 4, 6, 12 respectively),the number of white matter voxels (N) was counted (observeddata). The white matter structures with three different scales areshown in Fig. 2 (the images are represented in 2D for illustrationonly).
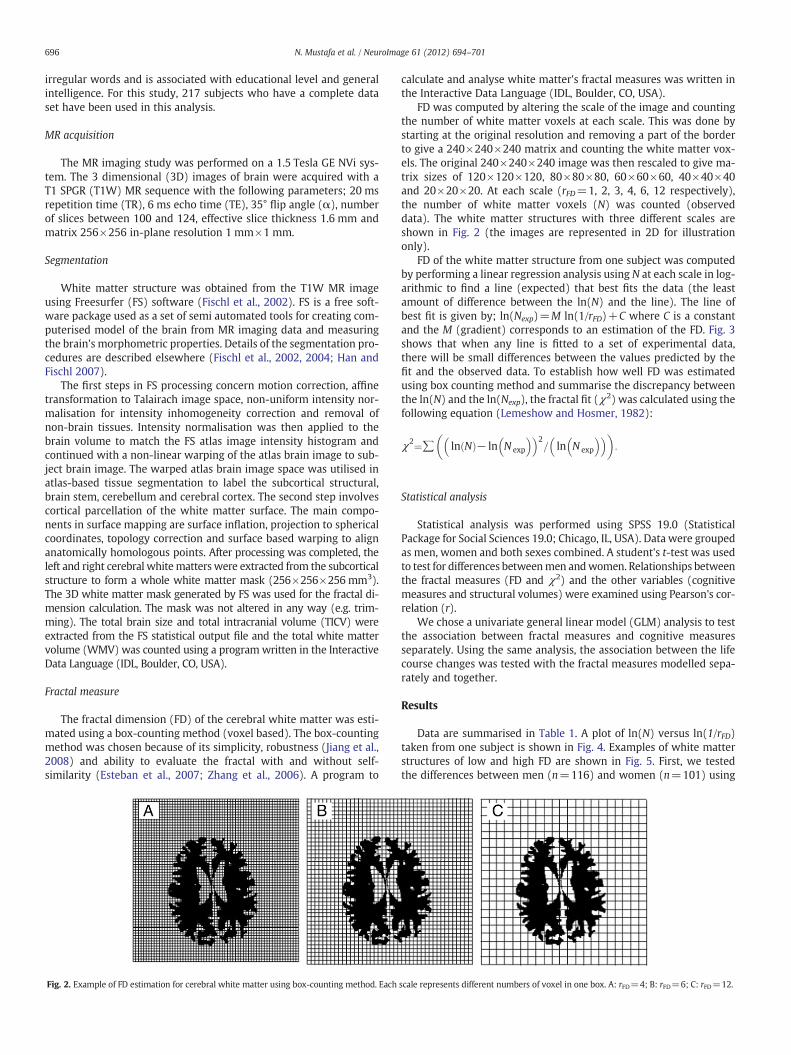
FD of the white matter structure from one subject was computedby performing a linear regression analysis using N at each scale in log-arithmic to find a line (expected) that best fits the data (the leastamount of difference between the ln(N) and the line). The line ofbest fit is given by; ln(Nexp)=M ln(1/rFD)+C where C is a constantand the M (gradient) corresponds to an estimation of the FD. Fig. 3shows that when any line is fitted to a set of experimental data,there will be small differences between the values predicted by thefit and the observed data. To establish how well FD was estimatedusing box counting method and summarise the discrepancy betweenthe ln(N) and the ln(Nexp), the fractal fit (χ2) was calculated using thefollowing equation (Lemeshow and Hosmer, 1982):
χ2¼∑ ln Nð Þ− ln N exp
� �� �2= ln N exp
� �� �� �:
Statistical analysis
Statistical analysis was performed using SPSS 19.0 (StatisticalPackage for Social Sciences 19.0; Chicago, IL, USA). Data were groupedas men, women and both sexes combined. A student's t-test was usedto test for differences betweenmen andwomen. Relationships betweenthe fractal measures (FD and χ2) and the other variables (cognitivemeasures and structural volumes) were examined using Pearson's cor-relation (r).
We chose a univariate general linear model (GLM) analysis to testthe association between fractal measures and cognitive measuresseparately. Using the same analysis, the association between the lifecourse changes was tested with the fractal measures modelled sepa-rately and together.
Results
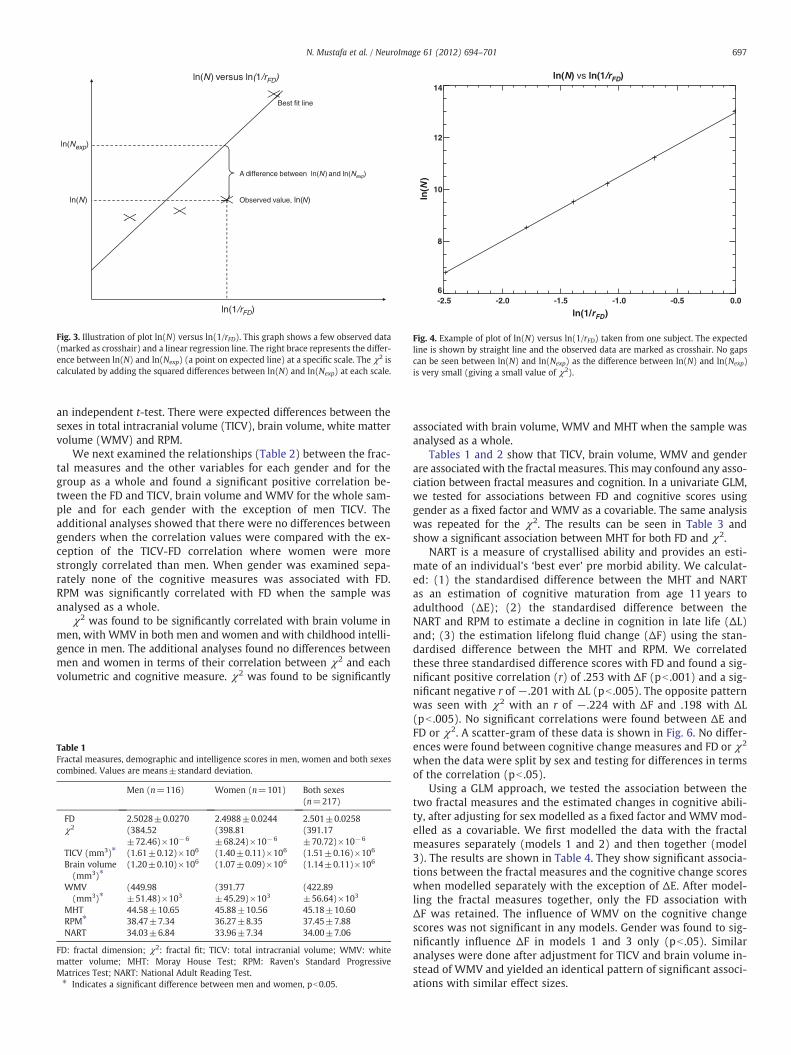
Data are summarised in Table 1. A plot of ln(N) versus ln(1/rFD)taken from one subject is shown in Fig. 4. Examples of white matterstructures of low and high FD are shown in Fig. 5. First, we testedthe differences between men (n=116) and women (n=101) using
scale represents different numbers of voxel in one box. A: rFD=4; B: rFD=6; C: rFD=12.
ln(1/rFD)
ln(N)
ln(Nexp)
Best fit line
A difference between ln(N ) and ln(Nexp)
Observed value, ln(N)
ln(N versus ln(1/rFD) )
Fig. 3. Illustration of plot ln(N) versus ln(1/rFD). This graph shows a few observed data(marked as crosshair) and a linear regression line. The right brace represents the differ-ence between ln(N) and ln(Nexp) (a point on expected line) at a specific scale. The χ2 iscalculated by adding the squared differences between ln(N) and ln(Nexp) at each scale.
ln(N) vs ln(1/rFD)
-2.5 -2.0 -1.5 -1.0 -0.5 0.0
ln(1/rFD)
6
8
10
12
14
ln(N
)
Fig. 4. Example of plot of ln(N) versus ln(1/rFD) taken from one subject. The expectedline is shown by straight line and the observed data are marked as crosshair. No gapscan be seen between ln(N) and ln(Nexp) as the difference between ln(N) and ln(Nexp)is very small (giving a small value of χ2).
697N. Mustafa et al. / NeuroImage 61 (2012) 694–701
an independent t-test. There were expected differences between thesexes in total intracranial volume (TICV), brain volume, white mattervolume (WMV) and RPM.
We next examined the relationships (Table 2) between the frac-tal measures and the other variables for each gender and for thegroup as a whole and found a significant positive correlation be-tween the FD and TICV, brain volume and WMV for the whole sam-ple and for each gender with the exception of men TICV. Theadditional analyses showed that there were no differences betweengenders when the correlation values were compared with the ex-ception of the TICV-FD correlation where women were morestrongly correlated than men. When gender was examined sepa-rately none of the cognitive measures was associated with FD.RPM was significantly correlated with FD when the sample wasanalysed as a whole.
χ2 was found to be significantly correlated with brain volume inmen, with WMV in both men and women and with childhood intelli-gence in men. The additional analyses found no differences betweenmen and women in terms of their correlation between χ2 and eachvolumetric and cognitive measure. χ2 was found to be significantly
Table 1Fractal measures, demographic and intelligence scores in men, women and both sexescombined. Values are means±standard deviation.
Men (n=116) Women (n=101) Both sexes(n=217)
FD 2.5028±0.0270 2.4988±0.0244 2.501±0.0258χ2 (384.52
±72.46)×10−6(398.81±68.24)×10−6
(391.17±70.72)×10−6
TICV (mm3)⁎ (1.61±0.12)×106 (1.40±0.11)×106 (1.51±0.16)×106
Brain volume(mm3)⁎
(1.20±0.10)×106 (1.07±0.09)×106 (1.14±0.11)×106
WMV(mm3)⁎
(449.98±51.48)×103
(391.77±45.29)×103
(422.89±56.64)×103
MHT 44.58±10.65 45.88±10.56 45.18±10.60RPM⁎ 38.47±7.34 36.27±8.35 37.45±7.88NART 34.03±6.84 33.96±7.34 34.00±7.06
FD: fractal dimension; χ2: fractal fit; TICV: total intracranial volume; WMV: whitematter volume; MHT: Moray House Test; RPM: Raven's Standard ProgressiveMatrices Test; NART: National Adult Reading Test.⁎ Indicates a significant difference between men and women, pb0.05.
associated with brain volume, WMV and MHT when the sample wasanalysed as a whole.
Tables 1 and 2 show that TICV, brain volume, WMV and genderare associated with the fractal measures. This may confound any asso-ciation between fractal measures and cognition. In a univariate GLM,we tested for associations between FD and cognitive scores usinggender as a fixed factor and WMV as a covariable. The same analysiswas repeated for the χ2. The results can be seen in Table 3 andshow a significant association between MHT for both FD and χ2.
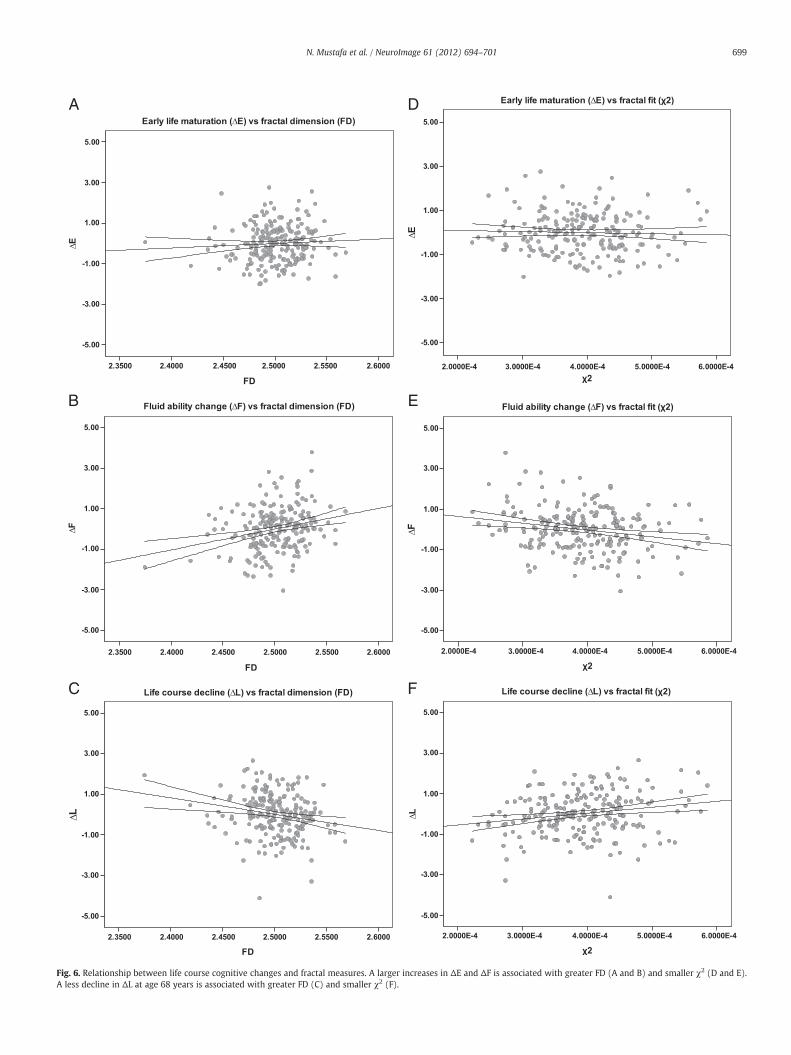
NART is a measure of crystallised ability and provides an esti-mate of an individual's ‘best ever’ pre morbid ability. We calculat-ed: (1) the standardised difference between the MHT and NARTas an estimation of cognitive maturation from age 11 years toadulthood (ΔE); (2) the standardised difference between theNART and RPM to estimate a decline in cognition in late life (ΔL)and; (3) the estimation lifelong fluid change (ΔF) using the stan-dardised difference between the MHT and RPM. We correlatedthese three standardised difference scores with FD and found a sig-nificant positive correlation (r) of .253 with ΔF (pb .001) and a sig-nificant negative r of −.201 with ΔL (pb .005). The opposite patternwas seen with χ2 with an r of −.224 with ΔF and .198 with ΔL(pb .005). No significant correlations were found between ΔE andFD or χ2. A scatter-gram of these data is shown in Fig. 6. No differ-ences were found between cognitive change measures and FD or χ2
when the data were split by sex and testing for differences in termsof the correlation (pb .05).
Using a GLM approach, we tested the association between thetwo fractal measures and the estimated changes in cognitive abili-ty, after adjusting for sex modelled as a fixed factor and WMV mod-elled as a covariable. We first modelled the data with the fractalmeasures separately (models 1 and 2) and then together (model3). The results are shown in Table 4. They show significant associa-tions between the fractal measures and the cognitive change scoreswhen modelled separately with the exception of ΔE. After model-ling the fractal measures together, only the FD association withΔF was retained. The influence of WMV on the cognitive changescores was not significant in any models. Gender was found to sig-nificantly influence ΔF in models 1 and 3 only (pb .05). Similaranalyses were done after adjustment for TICV and brain volume in-stead of WMV and yielded an identical pattern of significant associ-ations with similar effect sizes.
Low fractal dimension, high χ2
A
High fractal dimension, low χ2
B
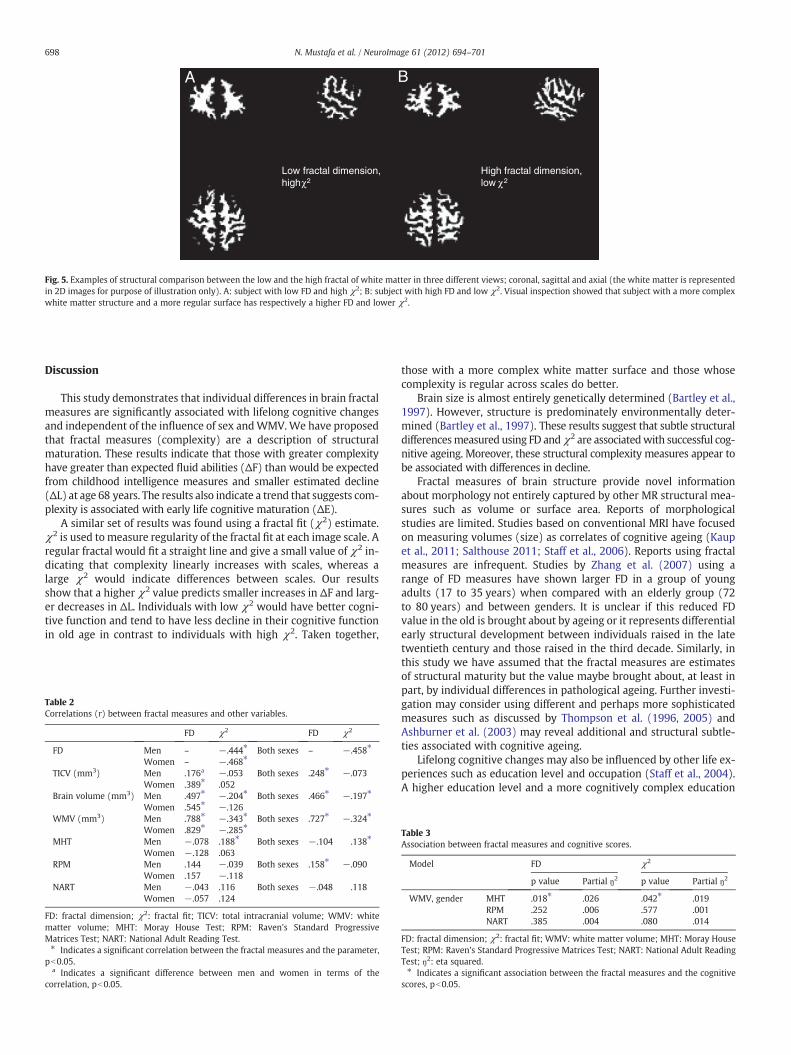
Fig. 5. Examples of structural comparison between the low and the high fractal of white matter in three different views; coronal, sagittal and axial (the white matter is representedin 2D images for purpose of illustration only). A: subject with low FD and high χ2; B: subject with high FD and low χ2. Visual inspection showed that subject with a more complexwhite matter structure and a more regular surface has respectively a higher FD and lower χ2.
698 N. Mustafa et al. / NeuroImage 61 (2012) 694–701
Discussion
This study demonstrates that individual differences in brain fractalmeasures are significantly associated with lifelong cognitive changesand independent of the influence of sex andWMV.We have proposedthat fractal measures (complexity) are a description of structuralmaturation. These results indicate that those with greater complexityhave greater than expected fluid abilities (ΔF) than would be expectedfrom childhood intelligence measures and smaller estimated decline(ΔL) at age 68 years. The results also indicate a trend that suggests com-plexity is associated with early life cognitive maturation (ΔE).
A similar set of results was found using a fractal fit (χ2) estimate.χ2 is used to measure regularity of the fractal fit at each image scale. Aregular fractal would fit a straight line and give a small value of χ2 in-dicating that complexity linearly increases with scales, whereas alarge χ2 would indicate differences between scales. Our resultsshow that a higher χ2 value predicts smaller increases in ΔF and larg-er decreases in ΔL. Individuals with low χ2 would have better cogni-tive function and tend to have less decline in their cognitive functionin old age in contrast to individuals with high χ2. Taken together,
Table 2Correlations (r) between fractal measures and other variables.
FD χ2 FD χ2
FD Men – −.444⁎ Both sexes – −.458⁎
Women – −.468⁎
TICV (mm3) Men .176a −.053 Both sexes .248⁎ −.073Women .389⁎ .052
Brain volume (mm3) Men .497⁎ −.204⁎ Both sexes .466⁎ −.197⁎
Women .545⁎ −.126WMV (mm3) Men .788⁎ −.343⁎ Both sexes .727⁎ −.324⁎
Women .829⁎ −.285⁎
MHT Men −.078 .188⁎ Both sexes −.104 .138⁎
Women −.128 .063RPM Men .144 −.039 Both sexes .158⁎ −.090
Women .157 −.118NART Men −.043 .116 Both sexes −.048 .118
Women −.057 .124
FD: fractal dimension; χ2: fractal fit; TICV: total intracranial volume; WMV: whitematter volume; MHT: Moray House Test; RPM: Raven's Standard ProgressiveMatrices Test; NART: National Adult Reading Test.⁎ Indicates a significant correlation between the fractal measures and the parameter,
pb0.05.a Indicates a significant difference between men and women in terms of the
correlation, pb0.05.
those with a more complex white matter surface and those whosecomplexity is regular across scales do better.
Brain size is almost entirely genetically determined (Bartley et al.,1997). However, structure is predominately environmentally deter-mined (Bartley et al., 1997). These results suggest that subtle structuraldifferencesmeasured using FD andχ2 are associatedwith successful cog-nitive ageing. Moreover, these structural complexity measures appear tobe associated with differences in decline.
Fractal measures of brain structure provide novel informationabout morphology not entirely captured by other MR structural mea-sures such as volume or surface area. Reports of morphologicalstudies are limited. Studies based on conventional MRI have focusedon measuring volumes (size) as correlates of cognitive ageing (Kaupet al., 2011; Salthouse 2011; Staff et al., 2006). Reports using fractalmeasures are infrequent. Studies by Zhang et al. (2007) using arange of FD measures have shown larger FD in a group of youngadults (17 to 35 years) when compared with an elderly group (72to 80 years) and between genders. It is unclear if this reduced FDvalue in the old is brought about by ageing or it represents differentialearly structural development between individuals raised in the latetwentieth century and those raised in the third decade. Similarly, inthis study we have assumed that the fractal measures are estimatesof structural maturity but the value maybe brought about, at least inpart, by individual differences in pathological ageing. Further investi-gation may consider using different and perhaps more sophisticatedmeasures such as discussed by Thompson et al. (1996, 2005) andAshburner et al. (2003) may reveal additional and structural subtle-ties associated with cognitive ageing.
Lifelong cognitive changes may also be influenced by other life ex-periences such as education level and occupation (Staff et al., 2004).A higher education level and a more cognitively complex education
Table 3Association between fractal measures and cognitive scores.
Model FD χ2
p value Partial ŋ2 p value Partial ŋ2
WMV, gender MHT .018⁎ .026 .042⁎ .019RPM .252 .006 .577 .001NART .385 .004 .080 .014
FD: fractal dimension; χ2: fractal fit; WMV: white matter volume; MHT: Moray HouseTest; RPM: Raven's Standard Progressive Matrices Test; NART: National Adult ReadingTest; ŋ2: eta squared.⁎ Indicates a significant association between the fractal measures and the cognitive
scores, pb0.05.
A
E
F
D
C
B
Fig. 6. Relationship between life course cognitive changes and fractal measures. A larger increases in ΔE and ΔF is associated with greater FD (A and B) and smaller χ2 (D and E).A less decline in ΔL at age 68 years is associated with greater FD (C) and smaller χ2 (F).
699N. Mustafa et al. / NeuroImage 61 (2012) 694–701
Table 4Association between life course cognitive changes and fractal measures.
Model Early lifematuration (ΔE)
Fluid abilitychange (ΔF)
Life course decline(ΔL)
p value Partial ŋ2 p value Partial ŋ2 p value Partial ŋ2
1: gender WMV FD .093 .013 .001⁎ .055 .047⁎ .0192: gender WMV χ2 .592 .001 .009* .032 .027⁎ .0233: gender WMV FD .112 .012 .007⁎ .034 .197 .008
χ2 .945 .000 .129 .011 .107 .012
FD: fractal dimension; χ2: fractal fit; WMV: white matter volume; ŋ2: eta squared.⁎ Indicates a significant association between the fractal measures and the cognitive
change scores, pb0.05.
700 N. Mustafa et al. / NeuroImage 61 (2012) 694–701
obtained across the life course predict higher cognitive ability in oldage than would be expected from a person's childhood ability and ac-cumulated brain burden. In addition to these intellectual activities,genetics, lifestyle, diet and nutrition can also influence cognitive abil-ities (Deary et al., 2009). Therefore, the roles of the other variablesshould be investigated in the future as the underlying source of vari-ance in the models.
Conclusion
To the best of our knowledge, this is the first use of fractal mea-sures to estimate life course changes in cognitive ability. This studydemonstrates the potential of complexity measures as an estimateof structural maturation. The results indicate that those with greaterwhite matter complexity have a superior cognitive life course trajec-tory. A better understanding of structural brain maturation and itsimpact on late life decline and disease could prove essential to devel-opment of new therapies aimed at maintaining cognitive ability inlate life.
Acknowledgment
The authors would like to thank the participant in the Aberdeen1936 Birth Cohort studies for their contribution to these projects.Funding was provided by the Chief Scientist Office, Department ofHealth, Scottish Government, Biotechnology and Biological SciencesResearch Council, the Wellcome Trust and the Alzheimer's ResearchTrust UK. Alison D. Murray, Roger T. Staff, Trevor S. Ahearn andGordon D. Waiter are members of the Scottish Imaging Network: APlatform for Scientific Excellence (www.sinapse.ac.uk). The authorswould also like to thank Ian J. Deary, John M. Starr, Helen A. Lemmonand Jen Herbert; and the Ministry of Higher Education Malaysia forfunding a PhD student.
References
Amunts, K., Schmidt-Passos, F., Schleicher, A., Zilles, K., 1997. Postnatal development ofinterhemispheric asymmetry in the cytoarchitecture of human area 4. Anat.Embryol. (Berl) 196 (5), 393–402.
Ashburner, J., Csernansk, J.G., Davatzikos, C., Fox, N.C., Frisoni, G.B., Thompson, P.M.,2003. Computer-assisted imaging to assess brain structure in healthy and diseasedbrains. Lancet Neurol. 2 (2), 79–88.
Bartley, A.J., Jones, D.W., Weinberger, D.R., 1997. Genetic variability of human brain sizeand cortical gyral patterns. Brain 120 (2), 257–269.
Blanton, R.E., Levitt, J.G., Thompson, P.M., Narr, K.L., Capetillo-Cunliffe, L., Nobel, A.,Singerman, J.D., McCracken, J.T., Toga, A.W., 2001. Mapping cortical asymmetryand complexity patterns in normal children. Psychiatry Res. 107 (1), 29–43.
Bullmore, E., Brammer, M., Harvey, I., Persaud, R., Murray, R., Ron, M., 1994. Fractalanalysis of the boundary between white matter and cerebral cortex in magneticresonance images: a controlled study of schizophrenic and manic-depressive pa-tients. Psychol. Med. 24 (3), 771–781.
Crawford, J.R., Deary, I.J., Starr, J., Whalley, L.J., 2001. The NART as an index of priorintellectual functioning: a retrospective validity study covering a 66-year interval.Psychol. Med. 31 (3), 451–458.
Deary, I.J., Whiteman, M.C., Starr, J.M., Whalley, L.J., Fox, H.C., 2004a. The impact ofchildhood intelligence on later life: following up the Scottish mental surveys of1932 and 1947. J. Pers. Soc. Psychol. 86 (1), 130–147.
Deary, I.J., Wright, A.F., Harris, S.E., Whalley, L.J., Starr, J.M., 2004b. Searching forgenetic influences on normal cognitive ageing. Trends Cogn. Sci. 8 (4),178–184.
Deary, I.J., Corley, J., Gow, A.J., Harris, S.E., Houlihan, L.M., Marioni, R.E., Penke, L.,Rafnsson, S.B., Starr, J.M., 2009. Age-associated cognitive decline. Br. Med. Bull. 92(1), 135–152.
Draganski, B., Gaser, C., Busch, V., Schuierer, G., Bogdahn, U., May, A., 2004. Neuro-plasticity: changes in grey matter induced by training. Nature 427 (6972),311–312.
Esteban, F.J., Sepulcre, J., de Mendizábal, N.V., Navas, J., de Miras, J.R., Bejarano, B.,Masdeu, J.C., Villoslada, P., 2007. Fractal dimension and white matter changes inmultiple sclerosis. NeuroImage 36 (3), 543–549.
Esteban, F.J., Sepulcre, J., de Miras, J.R., Navas, J., de Mendizábal, N.V., Goñi, J., Quesada,J.M., Bejarano, B., Villoslada, P., 2009. Fractal dimension analysis of grey matter inmultiple sclerosis. J. Neurol. Sci. 282 (1), 67–71.
Fischl, B., Salat, D.H., Busa, E., Albert, M., Dieterich, M., Haselgrove, C., van der Kouwe,A., Killiany, R., Kennedy, D., Klaveness, S., 2002. Whole brain segmentation auto-mated labeling of neuroanatomical structures in the human brain. Neuron 33(3), 341–355.
Fischl, B., Salat, D.H., van der Kouwe, A.J.W., Makris, N., Ségonne, F., Quinn, B.T., Dale,A.M., 2004. Sequence-independent segmentation of magnetic resonance images.NeuroImage 23, S69–S84.
Free, S., Sisodiya, S., Cook, M., Fish, D., Shorvon, S., 1996. Three-dimensional fractalanalysis of the white matter surface from magnetic resonance images of thehuman brain. Cereb. Cortex 6 (6), 830–836.
Garel, C., Chantrel, E., Brisse, H., Elmaleh, M., Luton, D., Oury, J.F., Sebag, G., Hassan, M.,2001. Fetal cerebral cortex: normal gestational landmarks identified using prenatalMR imaging. Am. J. Neuroradiol. 22 (1), 184–189.
Good, C.D., Johnsrude, I.S., Ashburner, J., Henson, R.N.A., Fristen, K., Frackowiak, R.S.J.,2002. A voxel-based morphometric study of ageing in 465 normal adult humanbrains. NeuroImage 14, 21–36.
Ha, T.H., Yoon, U., Lee, K.J., Shin, Y.W., Lee, J.M., Kim, I.Y., Ha, K.S., Kim, S.I., Kwon, J.S.,2005. Fractal dimension of cerebral cortical surface in schizophrenia andobsessive-compulsive disorder. Neurosci. Lett. 384 (1–2), 172–176.
Haier, R.J., Jung, R.E., Yeo, R.A., Head, K., Alkire, M.T., 2004. Structural brain variationand general intelligence. NeuroImage 23 (1), 425–433.
Han, X., Fischl, B., 2007. Atlas renormalization for improved brain MR image segmenta-tion across scanner platforms. IEEE Trans. Med. Imaging 26 (4), 479–486.
Im, K., Lee, J.M., Yoon, U., Shin, Y.W., Hong, S.B., Kim, I.Y., Kwon, J.S., Kim, S.I., 2006.Fractal dimension in human cortical surface: multiple regression analysis withcortical thickness, sulcal depth, and folding area. Hum. Brain Mapp. 27 (12),994–1003.
Jiang, J., Zhu, W., Shi, F., Zhang, Y., Lin, L., Jiang, T., 2008. A robust and accurate algo-rithm for estimating the complexity of the cortical surface. J. Neurosci. Methods172 (1), 122–130.
Kaup, A.R., Mirzakhanian, H., Jeste, D.V., Eyler, L.T., 2011. A review of the brain structurecorrelates of successful cognitive aging. J. Neuropsychiatry Clin. Neurosci. 23 (1),6–15.
Kedzia, A., Rybaczuk, M., Andrzejak, R., 2002. Fractal dimensions of human brain cortexvessels during the fetal period. Med. Sci. Monit. 8 (3), MT46–MT51.
King, R.D., George, A.T., Jeon, T., Hynan, L.S., Youn, T.S., Kennedy, D.N., Dickerson, B.,2009. Characterization of atrophic changes in the cerebral cortex using fractaldimensional analysis. Brain Imaging Behav. 3 (2), 154–166.
King, R.D., Brown, B., Hwang, M., Jeon, T., George, A.T., 2010. Fractal dimensionanalysis of the cortical ribbon in mild Alzheimer's disease. NeuroImage 53 (2),471–479.
Lemeshow, S., Hosmer, D.W., 1982. A review of goodness of fit statistics for use in thedevelopment of logistic regression models. Am. J. Epidemiol. 115 (1), 92–106.
Luders, E., Narr, K.L., Thompson, P.M., Rex, D.E., Jancke, L., Steinmetz, H., Toga,A.W., 2004. Gender differences in cortical complexity. Nat. Neurosci. 7 (8),799–800.
Luders, E., Thompson, P., Narr, K., Toga, A., Jancke, L., Gaser, C., 2006. A curvature-basedapproach to estimate local gyrification on the cortical surface. NeuroImage 29 (4),1224–1230.
McDaniel, M.A., 2005. Big-brained people are smarter: a meta-analysis of the rela-tionship between in vivo brain volume and intelligence. Intelligence 33 (4),337–346.
Mechelli, A., Crinion, J.T., Noppeney, U., O'Doherty, J., Ashburner, J., Frackowiak, R.S.,Price, C.J., 2004. Neurolinguistics: structural plasticity in the bilingual brain. Nature431 (7010), 757.
Narr, K.L., Thompson, P.M., Sharma, T., Moussai, J., Zoumalan, C., Rayman, J., Toga, A.W.,2001. Three-dimensional mapping of gyral shape and cortical surface asymmetriesin schizophrenia: gender effects. Am. J. Psychiatry 158 (2), 244–255.
Narr, K.L., Bilder, R.M., Kim, S., Thompson, P.M., Szeszko, P., Robinson, D., Luders, E.,Toga, A.W., 2004. Abnormal gyral complexity in first-episode schizophrenia. Biol.Psychiatry 55 (8), 859–867.
Nelson, H.E., Willison, J., 1982. National Adult Reading Test (NART): Test Manual.NFER-Nelson, Windsor.
Raven, J.C., 1960. Guide to the Standard Progressive Matrices. HK Lewis, London.Raznahan, A., Toro, R., Daly, E., Robertson, D., Murphy, C., Deeley, Q., Bolton, P.F., Paus,
T., Murphy, D.G.M., 2010. Cortical anatomy in autism spectrum disorder: an in vivoMRI study on the effect of age. Cereb. Cortex 20 (6), 1332–1340.
Rybaczuk, M., Kedzia, A., Blaszczyk, E., 1996. Fractal description of cerebellum surfaceduring fetal period. Folia Morphol. (Warsz) 55 (4), 434–436.
Salthouse, T.A., 2011. Neuroanatomical substrates of age-related cognitive decline. Psy-chol. Bull. 137 (5), 753–784.
701N. Mustafa et al. / NeuroImage 61 (2012) 694–701
Shyu, K.K.,Wu, Y.T., Chen, T.R., Chen, H.Y., Hu, H.H., Guo, W.Y., 2010. Measuring complexityof fetal cortical surface from MR images using 3-D modified box-counting method.IEEE Trans. Instrum. Meas. 99, 1–10.
Sowell, E.R., Peterson, B.S., Kan, E., Woods, R.P., Yoshii, J., Bansal, R., Xu, D., Zhu, H.,Thompson, P.M., Toga, A.W., 2007. Sex differences in cortical thickness mappedin 176 healthy individuals between 7 and 87 years of age. Cereb. Cortex 17 (7),1550–1560.
Staff, R.T., Murray, A.D., Deary, I.J., Whalley, L.J., 2004. What provides cerebral reserve?Brain 127 (5), 1191–1199.
Staff, R.T., Murray, A.D., Deary, I.J., Whalley, L.J., 2006. Generality and specificity incognitive aging: a volumetric brain analysis. NeuroImage 30 (4), 1433–1440.
Takahashi, T., Murata, T., Omori, M., Kosaka, H., Takahashi, K., Yonekura, Y., Wada, Y.,2004. Quantitative evaluation of age-related white matter microstructural changeson MRI by multifractal analysis. J. Neurol. Sci. 225 (1–2), 33–37.
Thompson, P., Schwartz, C., Toga, A., 1996. High-resolution random mesh algorithms forcreating a probabilistic 3D surface atlas of the human brain. NeuroImage 3 (1), 19–34.
Thompson, P.M., Lee, A.D., Dutton, R.A., Geaga, J.A., Hayashi, K.M., Eckert, M.A., Bellugi, U.,Galaburda, A.M., Korenberg, J.R., Mills, D.L., 2005. Abnormal cortical complexity andthickness profiles mapped in Williams syndrome. J. Neurosci. 25 (16), 4146–4158.
Van Essen, D.C., Dierker, D., Snyder, A., Raichle, M.E., Reiss, A.L., Korenberg, J., 2006.Symmetry of cortical folding abnormalities in Williams syndrome revealed bysurface-based analyses. J. Neurosci. 26 (20), 5470–5483.
Whalley, L.J., Murray, A.D., Staff, R.T., Starr, J.M., Deary, I.J., Fox, H.C., Lemmon, H.,Duthie, S.J., Collins, A.R., Crawford, J.R., 2011. How the 1932 and 1947 mentalsurveys of Aberdeen schoolchildren provide a framework to explore the childhoodorigins of late onset disease and disability. Maturitas 69 (4), 365–372.
Wu, Y.T., Shyu, K.K., Chen, T.R., Guo, W.Y., 2009. Using three-dimensional fractaldimension to analyze the complexity of fetal cortical surface from magneticresonance images. Nonlinear Dyn. 58 (4), 745–752.
Zhang, L., Liu, J.Z., Dean, D., Sahgal, V., Yue, G.H., 2006. A three-dimensional fractalanalysis method for quantifying white matter structure in human brain. J. Neurosci.Methods 150 (2), 242–253.
Zhang, L., Dean, D., Liu, J.Z., Sahgal, V., Wang, X., Yue, G.H., 2007. Quantifying degenerationof white matter in normal aging using fractal dimension. Neurobiol. Aging 28 (10),1543–1555.
Zhang, L., Butler, A.J., Sun, C.K., Sahgal, V., Wittenberg, G.F., Yue, G.H., 2008. Fractaldimension assessment of brain white matter structural complexity post stroke inrelation to upper-extremity motor function. Brain Res. 1228, 229–240.