bracing for the silver tsunami - legislative news, … · bracing for the silver tsunami may 2013...
TRANSCRIPT

BRACING FOR
THE SILVER TSUNAMI
May 2013
James H. Johnson, Jr. Frank Hawkins Kenan Institute of Private Enterprise
Kenan-Flagler Business School University of North Carolina at Chapel Hill
OVERVIEW
• Disruptive Demographics
• The Greying of America
• Challenges & Opportunities
• A Social Purpose Venture
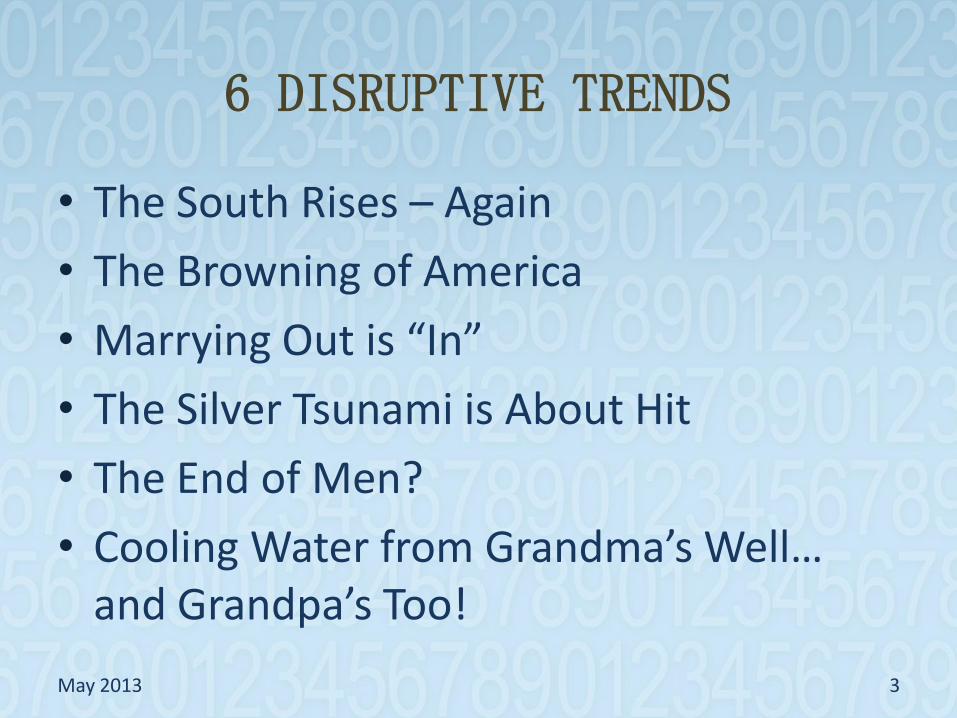
6 DISRUPTIVE TRENDS
• The South Rises – Again
• The Browning of America
• Marrying Out is “In”
• The Silver Tsunami is About Hit
• The End of Men?
• Cooling Water from Grandma’s Well… and Grandpa’s Too!
May 2013 3

THE GREYING OF AMERICA
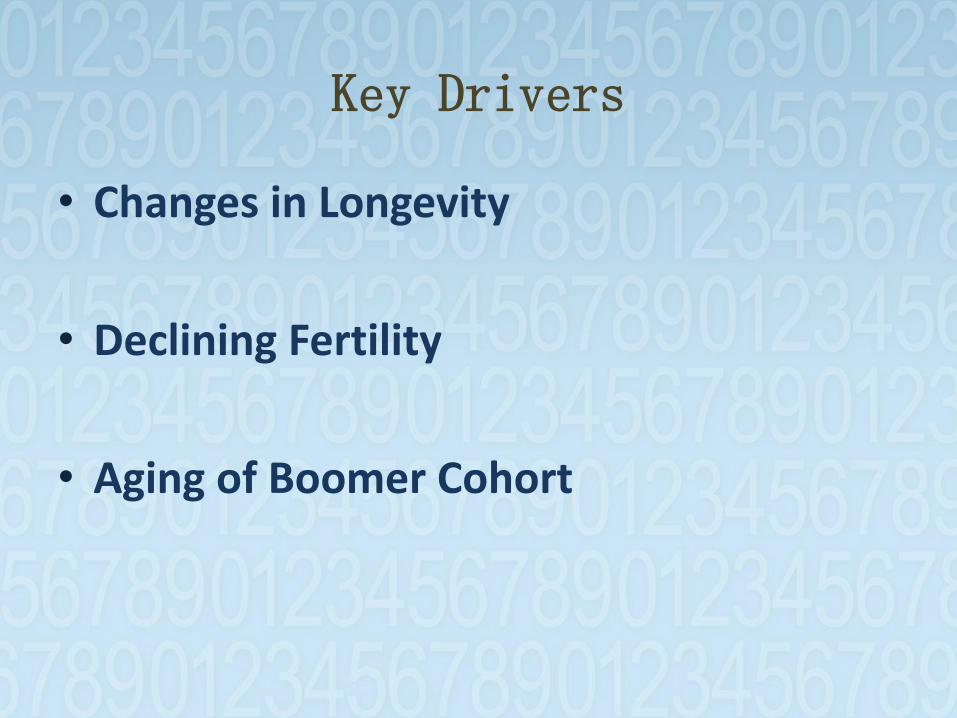
Key Drivers
• Changes in Longevity
• Declining Fertility
• Aging of Boomer Cohort
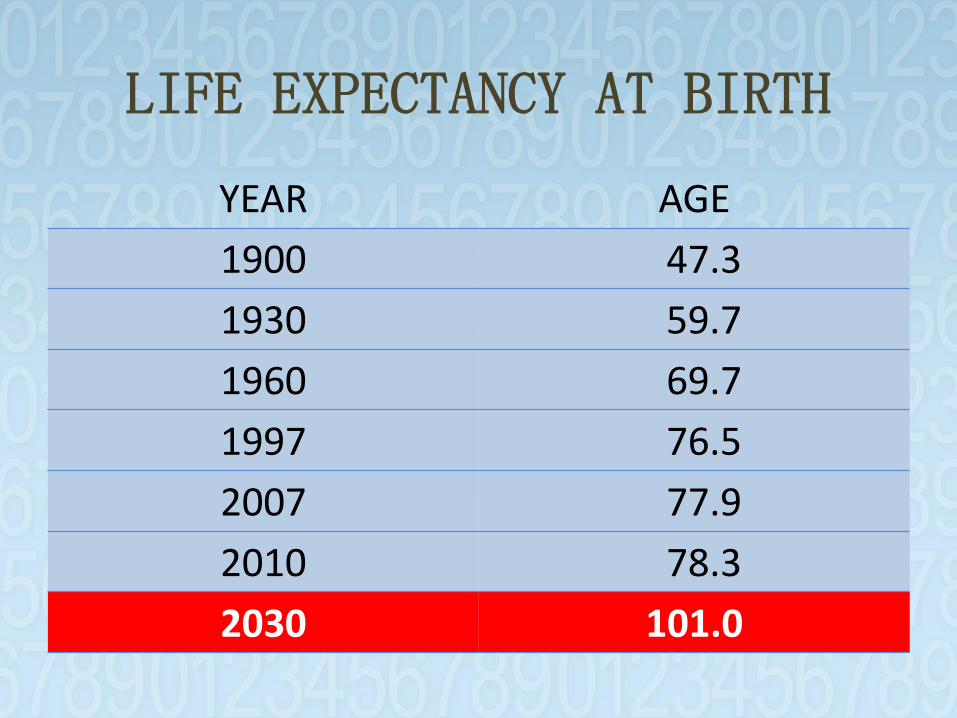
LIFE EXPECTANCY AT BIRTH
YEAR AGE
1900 47.3
1930 59.7
1960 69.7
1997 76.5
2007 77.9
2010 78.3
2030 101.0
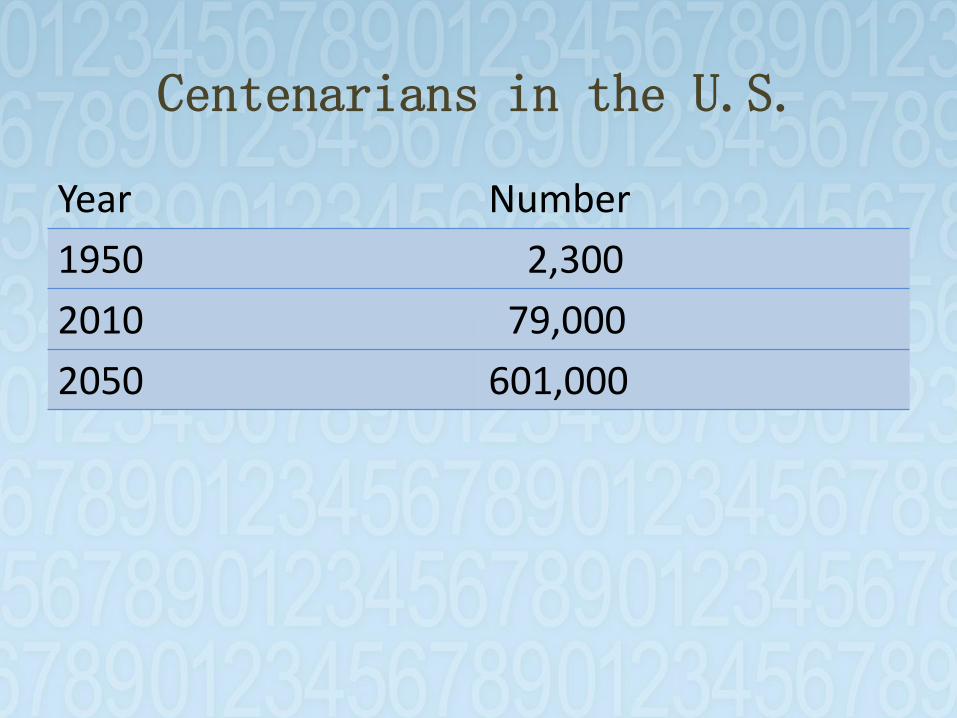
Centenarians in the U.S.
Year Number
1950 2,300
2010 79,000
2050 601,000
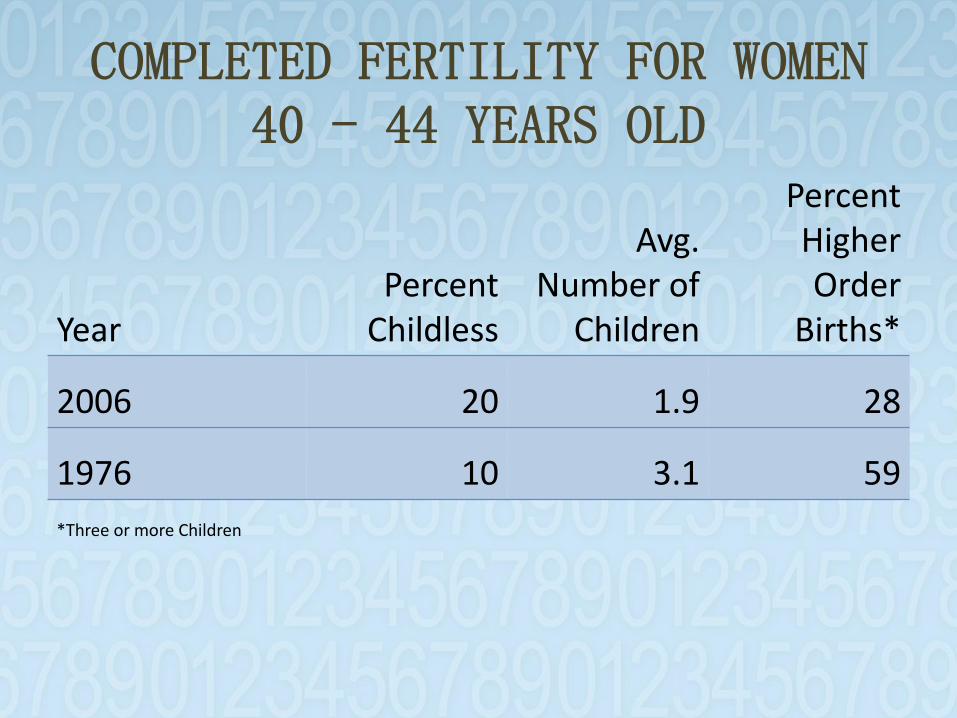
COMPLETED FERTILITY FOR WOMEN 40 - 44 YEARS OLD
YearPercent
Childless
Avg. Number of
Children
Percent Higher Order
Births*
2006 20 1.9 28
1976 10 3.1 59
*Three or more Children
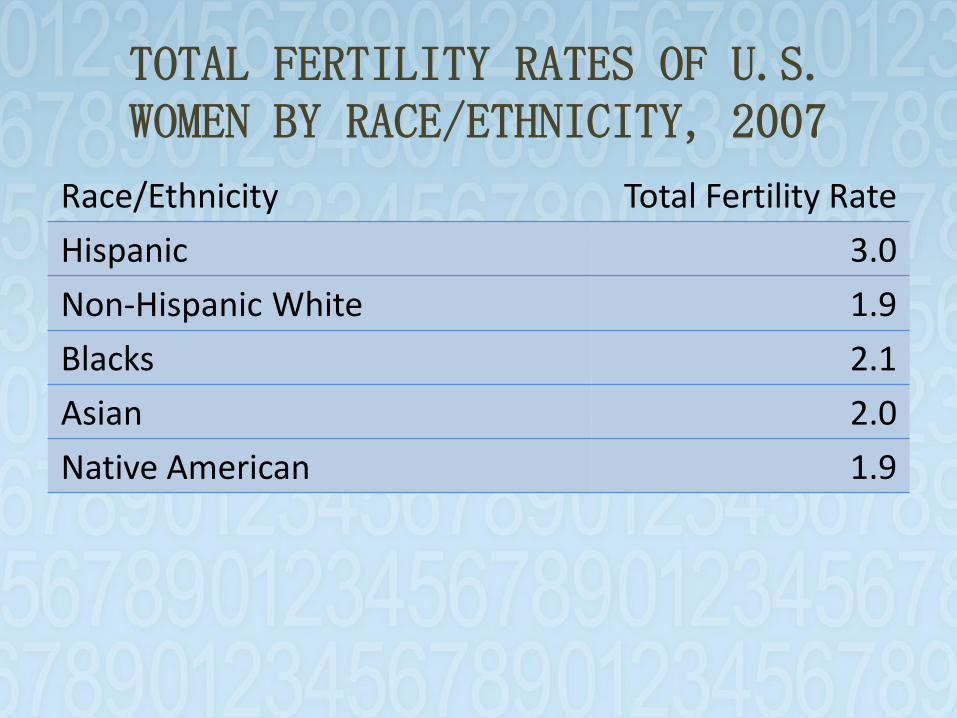
TOTAL FERTILITY RATES OF U.S. WOMEN BY RACE/ETHNICITY, 2007
Race/Ethnicity Total Fertility Rate
Hispanic 3.0
Non-Hispanic White 1.9
Blacks 2.1
Asian 2.0
Native American 1.9

THE SILVER TSUNAMI
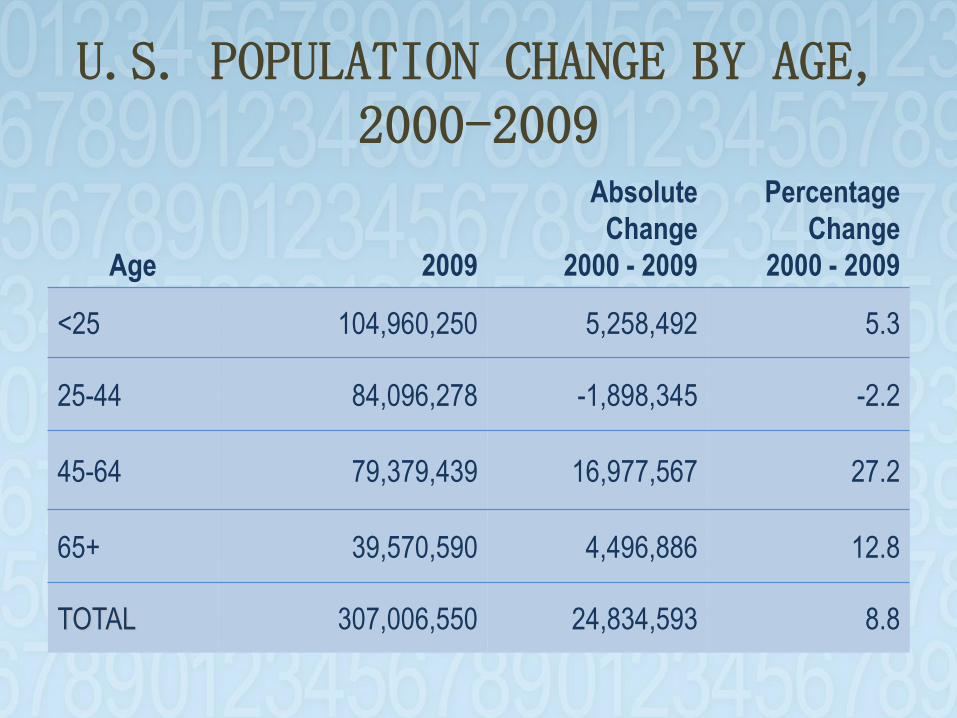
U.S. POPULATION CHANGE BY AGE, 2000-2009
Age 2009
Absolute
Change
2000 - 2009
Percentage
Change
2000 - 2009
<25 104,960,250 5,258,492 5.3
25-44 84,096,278 -1,898,345 -2.2
45-64 79,379,439 16,977,567 27.2
65+ 39,570,590 4,496,886 12.8
TOTAL 307,006,550 24,834,593 8.8
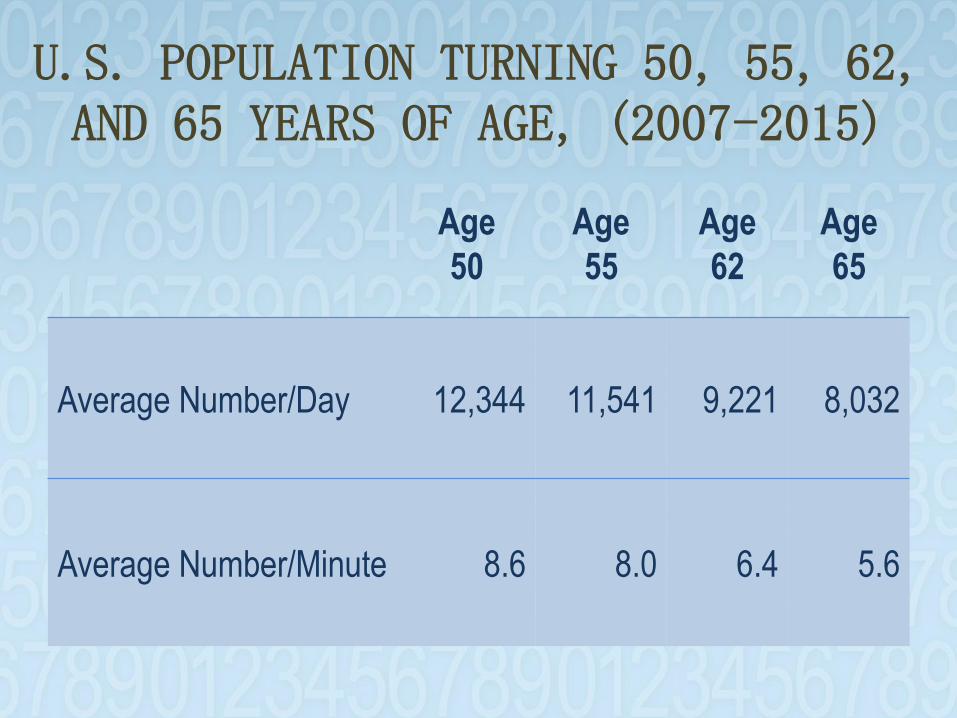
U.S. POPULATION TURNING 50, 55, 62, AND 65 YEARS OF AGE, (2007-2015)
Age
50
Age
55
Age
62
Age
65
Average Number/Day 12,344 11,541 9,221 8,032
Average Number/Minute 8.6 8.0 6.4 5.6
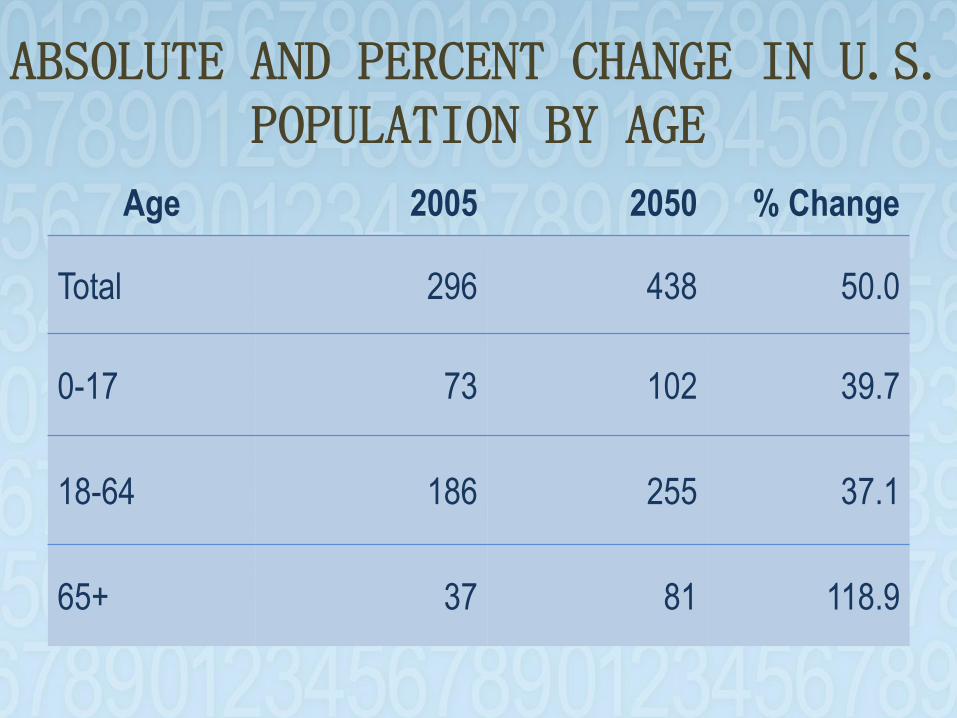
ABSOLUTE AND PERCENT CHANGE IN U.S. POPULATION BY AGE
Age 2005 2050 % Change
Total 296 438 50.0
0-17 73 102 39.7
18-64 186 255 37.1
65+ 37 81 118.9
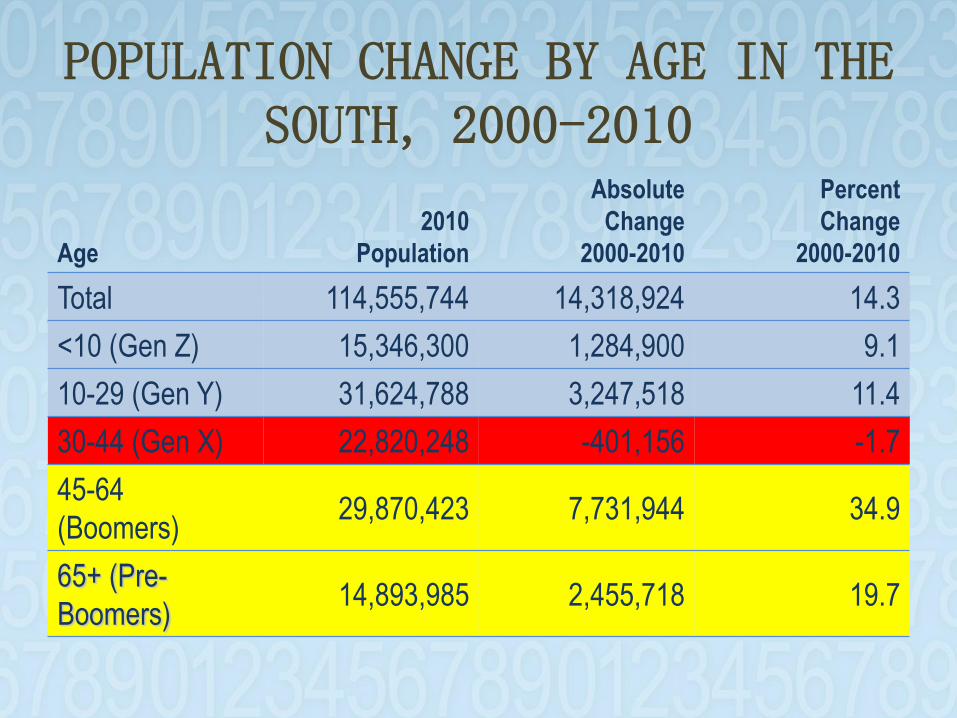
POPULATION CHANGE BY AGE IN THE SOUTH, 2000-2010
Age
2010
Population
Absolute
Change
2000-2010
Percent
Change
2000-2010
Total 114,555,744 14,318,924 14.3
<10 (Gen Z) 15,346,300 1,284,900 9.1
10-29 (Gen Y) 31,624,788 3,247,518 11.4
30-44 (Gen X) 22,820,248 -401,156 -1.7
45-64
(Boomers)29,870,423 7,731,944 34.9
65+ (Pre-
Boomers)14,893,985 2,455,718 19.7
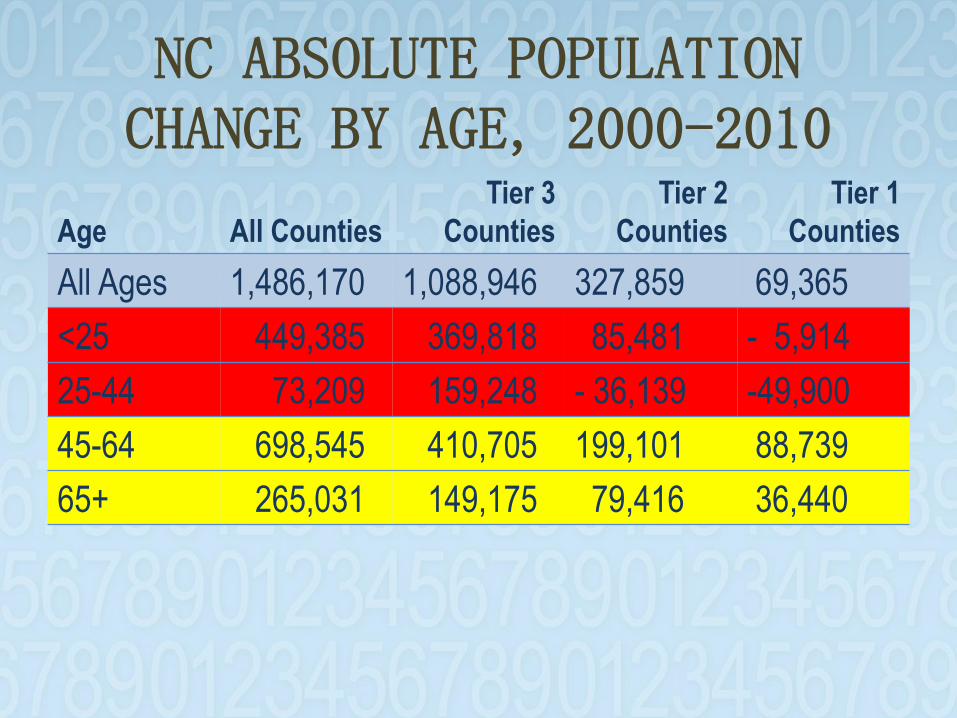
NC ABSOLUTE POPULATION CHANGE BY AGE, 2000-2010
Age All Counties
Tier 3
Counties
Tier 2
Counties
Tier 1
Counties
All Ages 1,486,170 1,088,946 327,859 69,365
<25 449,385 369,818 85,481 - 5,914
25-44 73,209 159,248 - 36,139 -49,900
45-64 698,545 410,705 199,101 88,739
65+ 265,031 149,175 79,416 36,440

THE BIG CHALLENGE
And The Big Opportunity
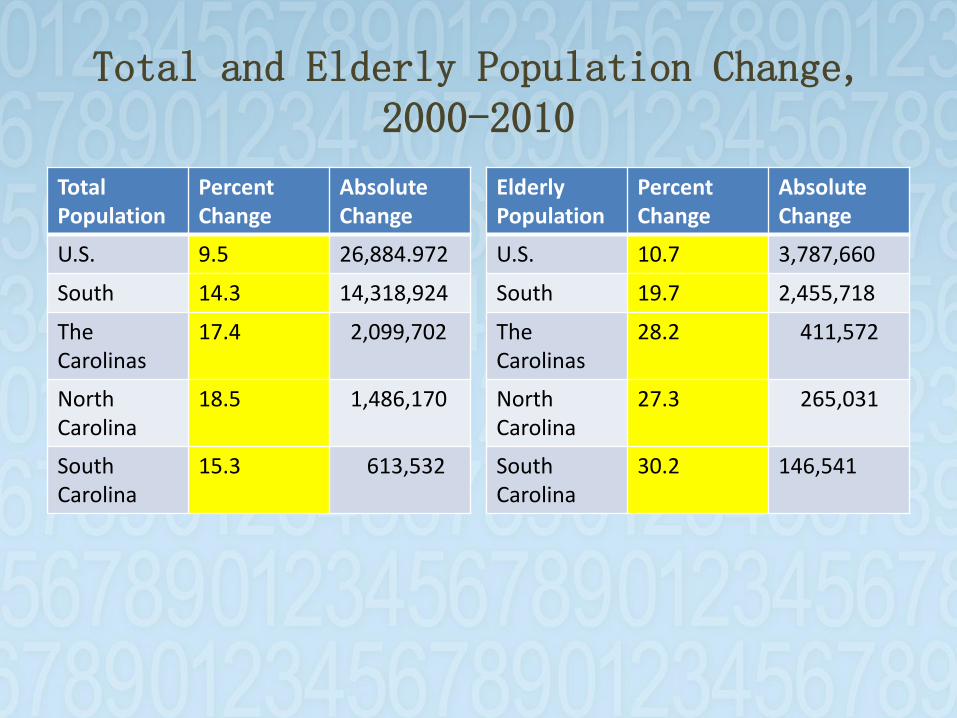
Total and Elderly Population Change, 2000-2010
TotalPopulation
Percent Change
Absolute Change
U.S. 9.5 26,884.972
South 14.3 14,318,924
The Carolinas
17.4 2,099,702
NorthCarolina
18.5 1,486,170
South Carolina
15.3 613,532
ElderlyPopulation
PercentChange
Absolute Change
U.S. 10.7 3,787,660
South 19.7 2,455,718
The Carolinas
28.2 411,572
North Carolina
27.3 265,031
South Carolina
30.2 146,541
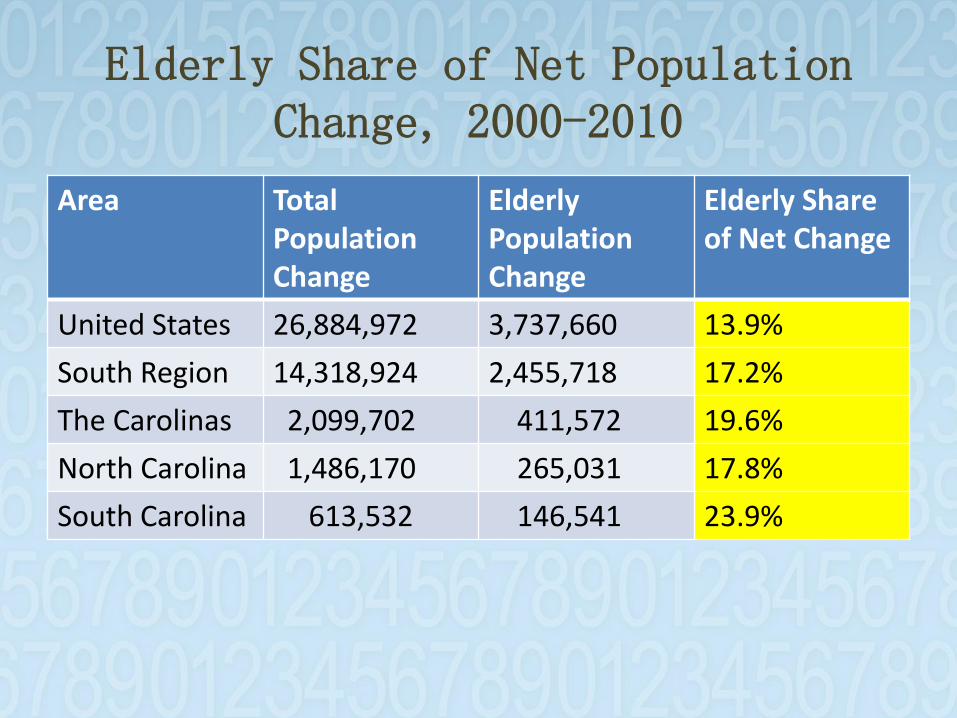
Elderly Share of Net Population Change, 2000-2010
Area Total PopulationChange
ElderlyPopulation Change
Elderly Share of Net Change
United States 26,884,972 3,737,660 13.9%
South Region 14,318,924 2,455,718 17.2%
The Carolinas 2,099,702 411,572 19.6%
North Carolina 1,486,170 265,031 17.8%
South Carolina 613,532 146,541 23.9%
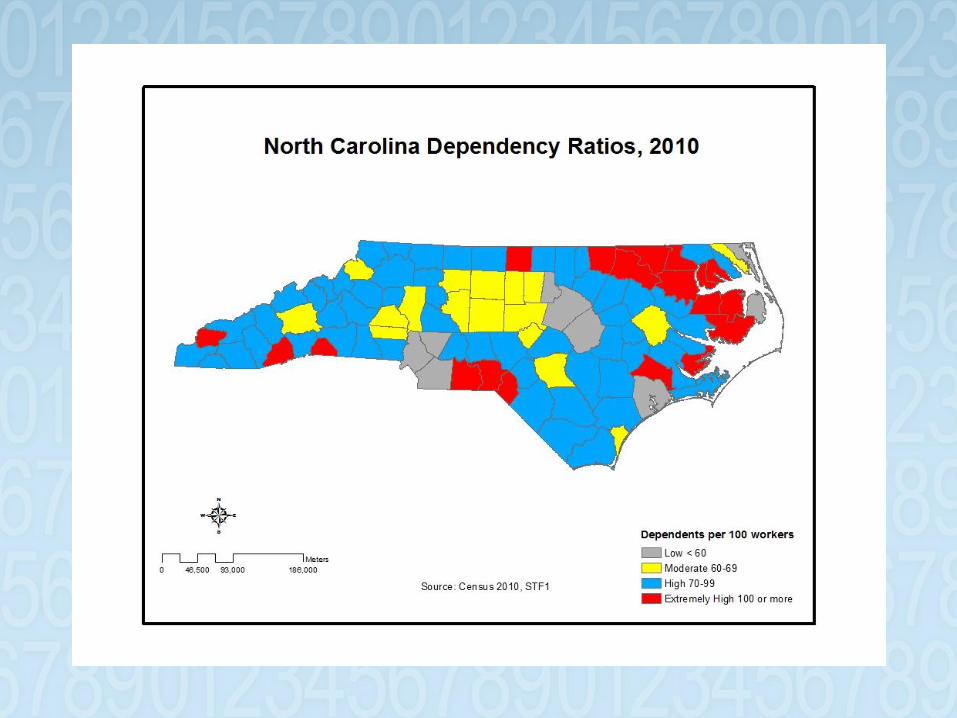
GROWING DEPENDENCY
A Train Wreck in the Making
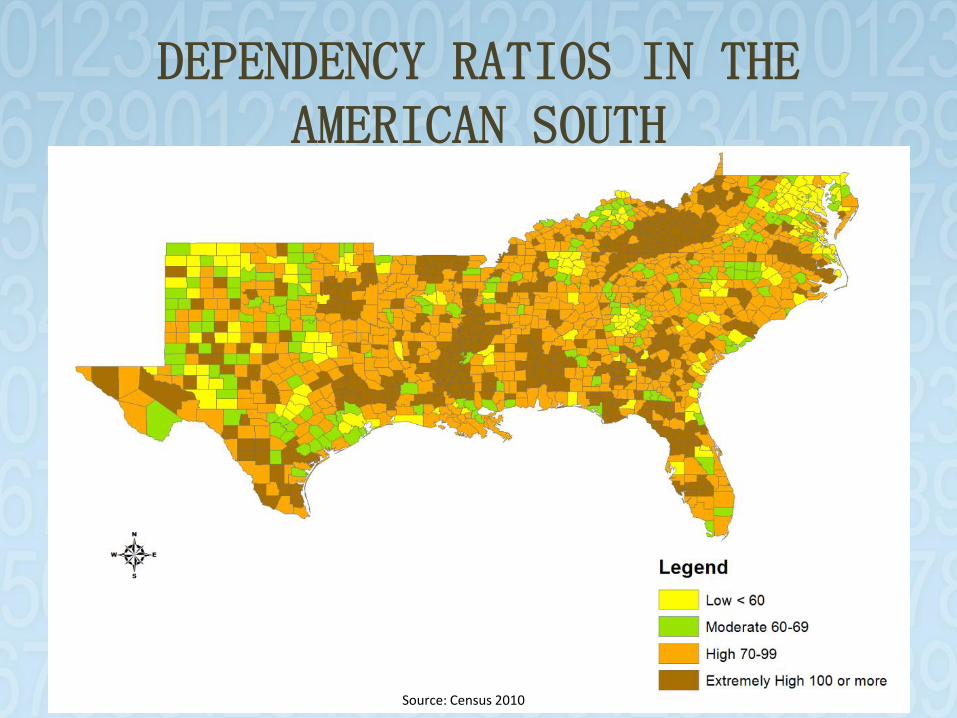
DEPENDENCY RATIOS IN THE AMERICAN SOUTH
Source: Census 2010
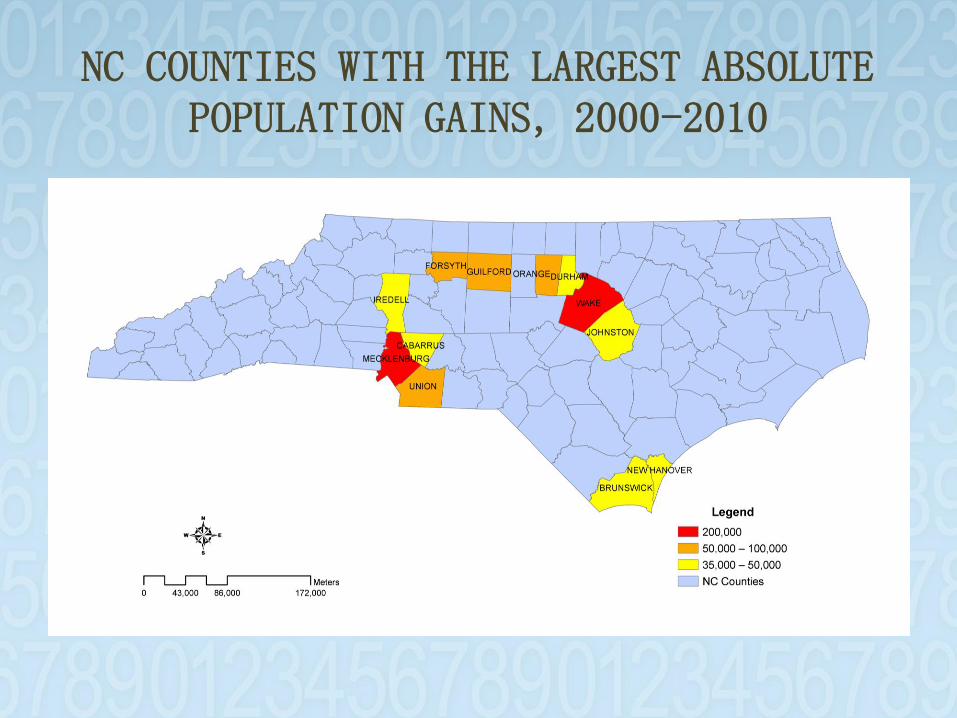
NC COUNTIES WITH THE LARGEST ABSOLUTE POPULATION GAINS, 2000-2010
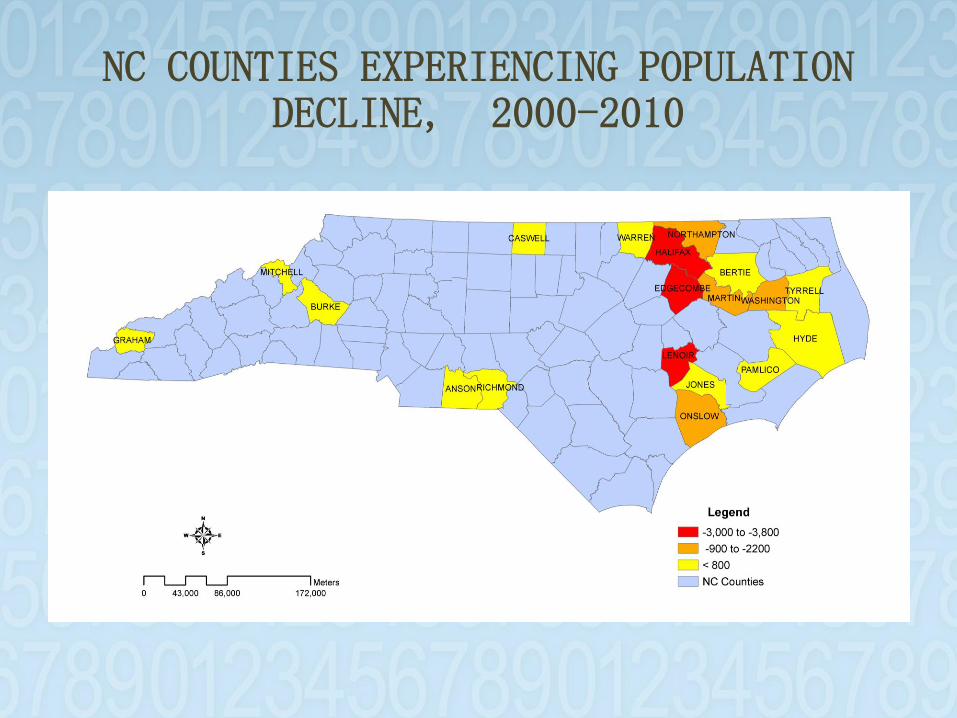
NC COUNTIES EXPERIENCING POPULATION DECLINE, 2000-2010
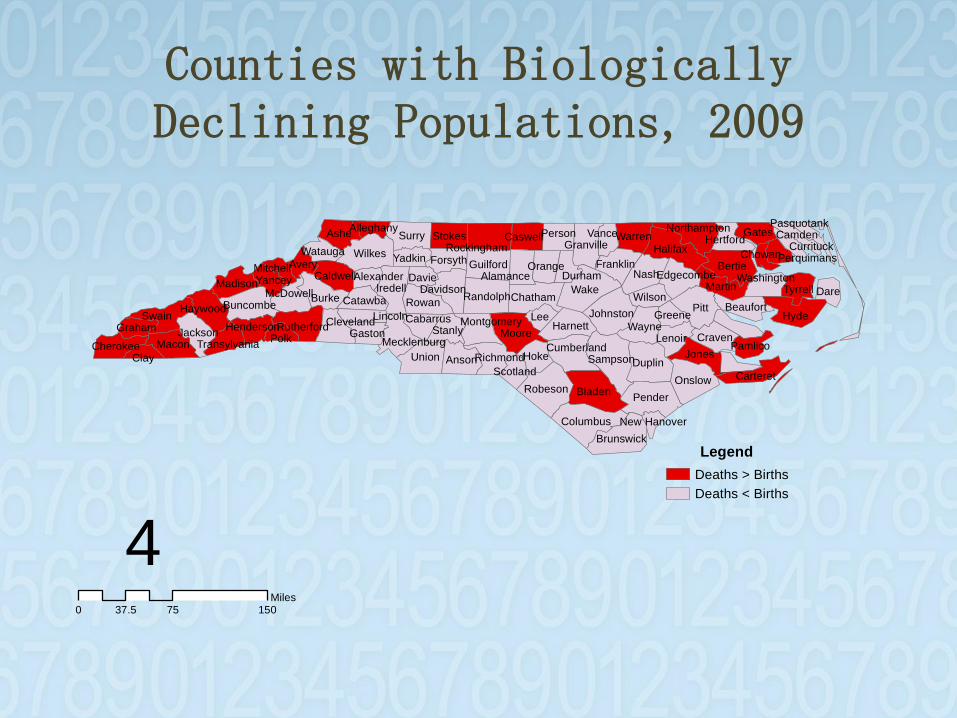
Counties with Biologically Declining Populations, 2009
Legend
Deaths > Births
Deaths < Births
40 75 15037.5
Miles
Pitt
Wake
Bladen
Duplin
Hyde
BertieWilkes
Pender
Moore
Union
Nash
Robeson
Surry
Onslow
Columbus
Burke
Ashe
Anson
Guilford
Harnett
Brunswick
Chatham
Macon
Rowan
Stokes Gates
ForsythYadkinHalifax
Sampson
Iredell
Swain Johnston
Randolph
Wayne
Jones
Martin
Hoke
Lee
LenoirStanly
Craven
WarrenGranville
Tyrrell
Franklin
Buncombe
Davidson
Haywood
Person
Jackson
Dare
Carteret
Caswell
Beaufort
Caldwell
Cumberland
Wilson
Madison
Orange
RutherfordPolk Gaston
Cherokee
Rockingham
Davie
Catawba
Richmond
Hertford
McDowell
Cleveland
NorthamptonVance
Clay
Avery
Mecklenburg
Alamance
Lincoln
EdgecombeYancey
Montgomery
Pamlico
Cabarrus
Durham
GrahamGreene
Watauga
Scotland
Henderson
Washington
Transylvania
Mitchell
Camden
Alexander
Currituck
Alleghany
ChowanPerquimans
Pasquotank
New Hanover
Age-Related Challenges
• Mobility Limitations
• Hearing Loss
• Vision Impairments
• Mental Disorders
• Substance Abuse Issues
• Chronic Disabilities
• Economic Constraints
The Triple Whammy
• Aging Boomers Face Mortality
• Elder Care Responsibilities
• Raising Grandchildren
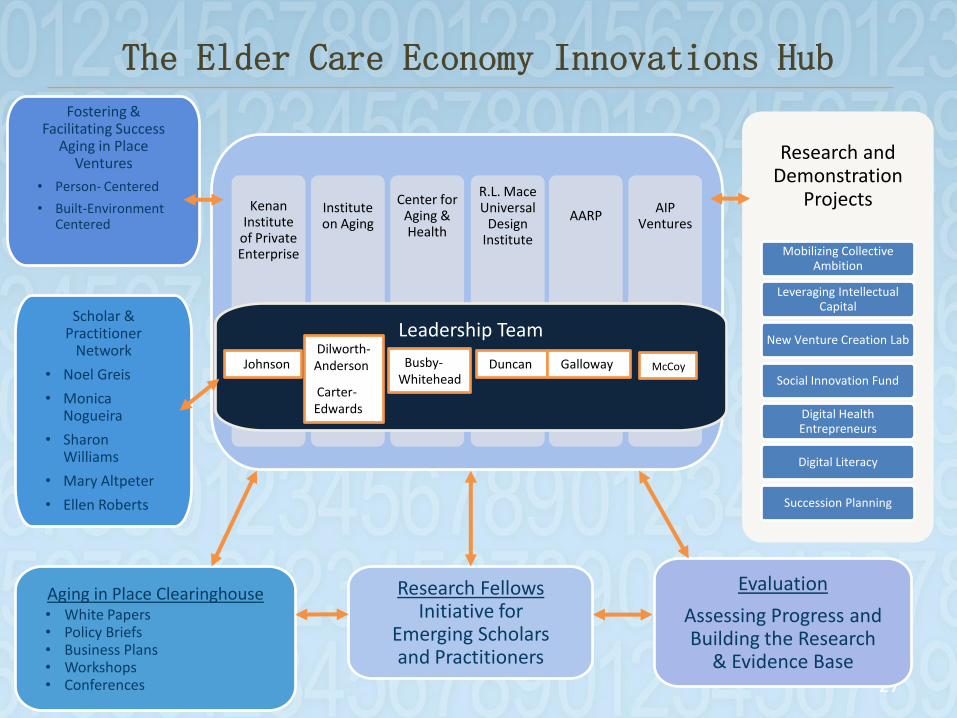
The Elder Care Economy Innovations Hub
27
Research and Demonstration
Projects
Mobilizing Collective Ambition
Leveraging Intellectual Capital
New Venture Creation Lab
Social Innovation Fund
Digital Health Entrepreneurs
Digital Literacy
Succession Planning
Research Fellows Initiative for
Emerging Scholars and Practitioners
Aging in Place Clearinghouse• White Papers• Policy Briefs• Business Plans• Workshops• Conferences
Scholar & Practitioner
Network
• Noel Greis
• Monica Nogueira
• Sharon Williams
• Mary Altpeter
• Ellen Roberts
Evaluation
Assessing Progress and Building the Research
& Evidence Base
Fostering & Facilitating Success
Aging in Place Ventures
• Person- Centered
• Built-Environment Centered
KenanInstitute
of Private Enterprise
Institute on Aging
Center for Aging & Health
R.L. Mace Universal
Design Institute
AARPAIP
Ventures
Leadership Team
JohnsonDilworth-Anderson
Carter-Edwards
Busby-Whitehead
Duncan Galloway McCoy
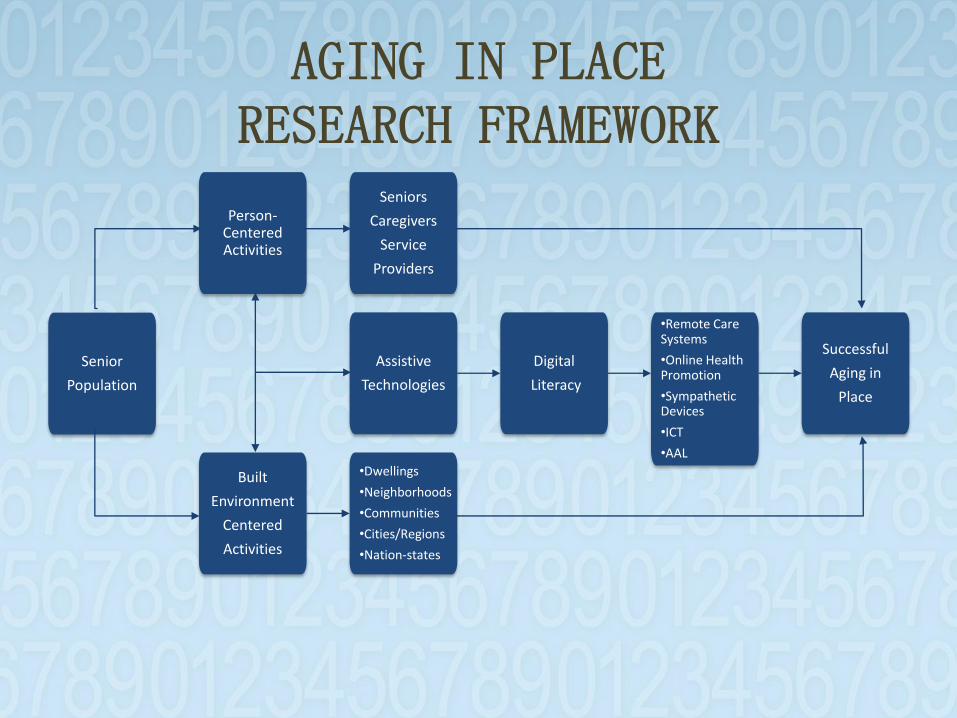
AGING IN PLACE RESEARCH FRAMEWORK
Senior
Population
Person-Centered Activities
Seniors
Caregivers
Service
Providers
Assistive
Technologies
Digital
Literacy
•Remote Care Systems
•Online Health Promotion
•Sympathetic Devices
•ICT
•AAL
Successful
Aging in
Place
Built
Environment
Centered
Activities
•Dwellings
•Neighborhoods
•Communities
•Cities/Regions
•Nation-states

SAFE: Secure Audits for the Elderly Anatomy of an Intervention
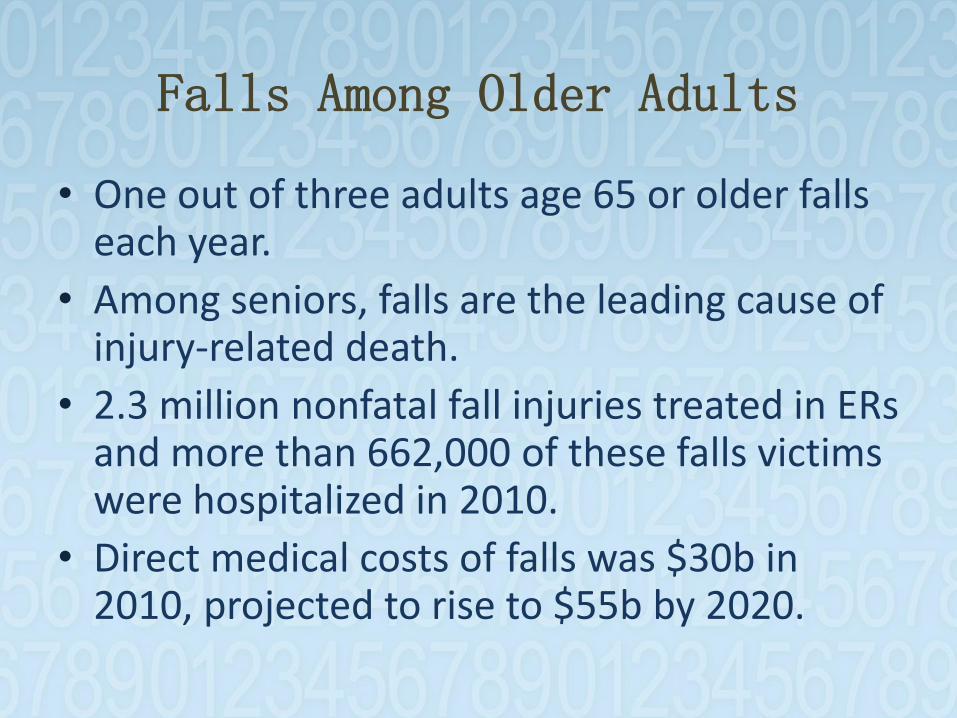
Falls Among Older Adults
• One out of three adults age 65 or older falls each year.
• Among seniors, falls are the leading cause of injury-related death.
• 2.3 million nonfatal fall injuries treated in ERs and more than 662,000 of these falls victims were hospitalized in 2010.
• Direct medical costs of falls was $30b in 2010, projected to rise to $55b by 2020.

Joint Venture Partners
• Kenan Institute, Managing Director
• UNC Center for Aging and Health
• Universal Design Institute
• Athletic Concepts, LLC
• AT&T & Other Private Sector Firms
Program Goals
• Reduce Falls & Falls-Related Injuries & Deaths Among Seniors
• Create Jobs and Nurture Small Business Growth and Expansion
Program Components
• Falls Prevention Education
• Home Audits and Modifications
• Senior Fitness Parks and Wellness Centers
• Formative and Summative Evaluations

SMART SLIPPERS

GLOWCAPS
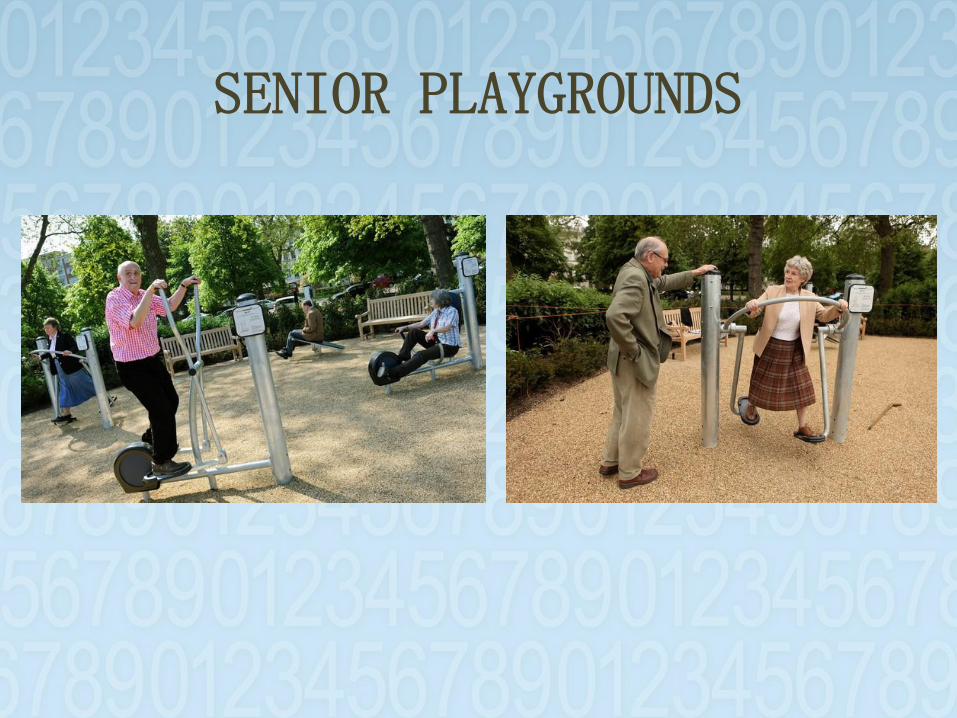
SENIOR PLAYGROUNDS
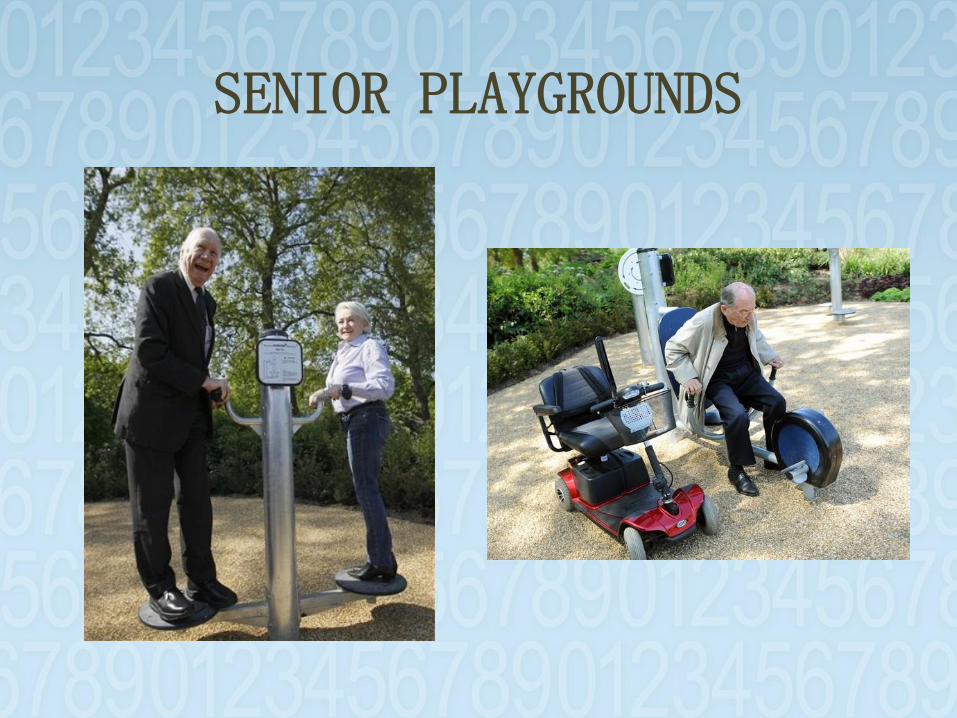
SENIOR PLAYGROUNDS
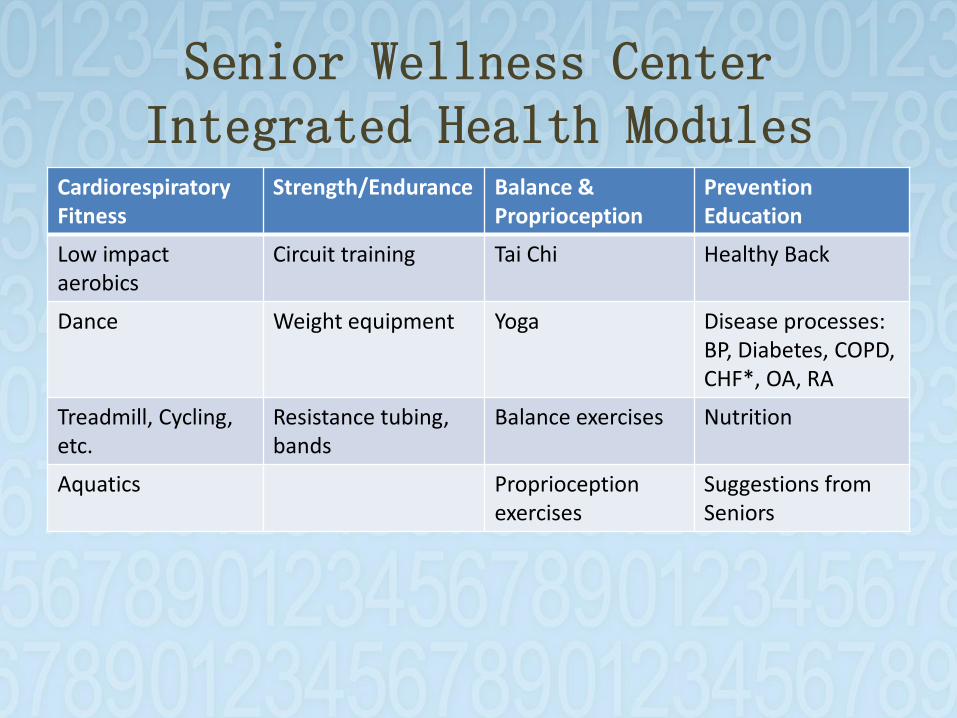
Senior Wellness Center Integrated Health Modules
CardiorespiratoryFitness
Strength/Endurance Balance & Proprioception
Prevention Education
Low impact aerobics
Circuit training Tai Chi Healthy Back
Dance Weight equipment Yoga Disease processes: BP, Diabetes, COPD, CHF*, OA, RA
Treadmill, Cycling, etc.
Resistance tubing, bands
Balance exercises Nutrition
Aquatics Proprioception exercises
Suggestions from Seniors

Human Resource Demand
• Lay Health Professionals
• Wellness Advisors & Fitness Instructors
• Home modification experts
• Architects
• Landscape Architects

Target Markets

Gender Composition of Elderly Population by Age, 2010
Age The Carolinas North Carolina South Carolina
All Elderly (65+) 1,865,953 1,234,079 631,874
% Female 57.3 57.5 56.7
Young Old (65-74) 1,066,610 697,567 369,043
% Female 53.8 54.0 53.4
Middle Old (75-84) 581,165 389,051 192,114
% Female 59.0 59.2 58.4
Oldest Old (85+) 218,178 147,461 70,717
% Female 69.9 70.0 69.7
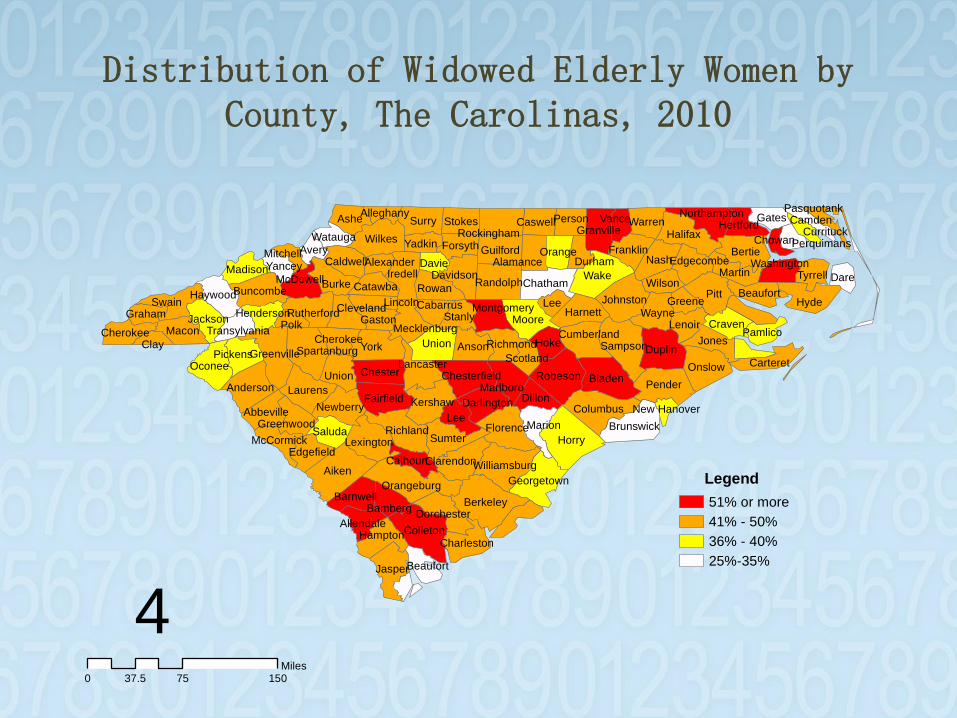
Distribution of Widowed Elderly Women by County, The Carolinas, 2010
Legend
51% or more
41% - 50%
36% - 40%
25%-35%
40 75 15037.5
Miles
Horry
Pitt
Aiken
York
Wake
Berkeley
Bladen
Duplin
Colleton
Hyde
BertieWilkes
Pender
Moore
Union
Lee
Nash
Robeson
Surry
Onslow
Columbus
Laurens
Burke
Fairfield
Ashe
Union
Anson
Guilford
Harnett
Brunswick
Chatham
Macon
Rowan
Chester
Stokes Gates
ForsythYadkinHalifax
Sampson
Iredell
Jasper
Orangeburg
SumterFlorence
Swain Johnston
Richland
Oconee
Kershaw
Randolph
Greenville
Wayne
Jones
Anderson
Lexington
Martin
Hoke
Dillon
Williamsburg
Marion
Lee
Spartanburg
Chesterfield
Georgetown
Newberry
Clarendon
Saluda
LenoirStanly
Craven
Pickens
Warren
Barnwell
Granville
Tyrrell
Franklin
Buncombe
Davidson
Haywood
Person
Hampton
Jackson
Dare
Carteret
Caswell
Beaufort
Caldwell
Abbeville
Marlboro
Lancaster
Charleston
Cumberland
Wilson
Darlington
Madison
Orange
RutherfordPolk
Dorchester
Edgefield
Gaston
Cherokee
Rockingham
Davie
Catawba
Richmond
Hertford
McDowell
Cleveland
Northampton
Calhoun
Vance
Clay
Allendale
Avery
Mecklenburg
Alamance
Beaufort
Lincoln
EdgecombeYancey
Bamberg
Cherokee
Montgomery
Pamlico
Greenwood
Cabarrus
Durham
GrahamGreene
Watauga
McCormick
Scotland
Henderson
Washington
Transylvania
Mitchell
Camden
Alexander
Currituck
Alleghany
ChowanPerquimans
Pasquotank
New Hanover
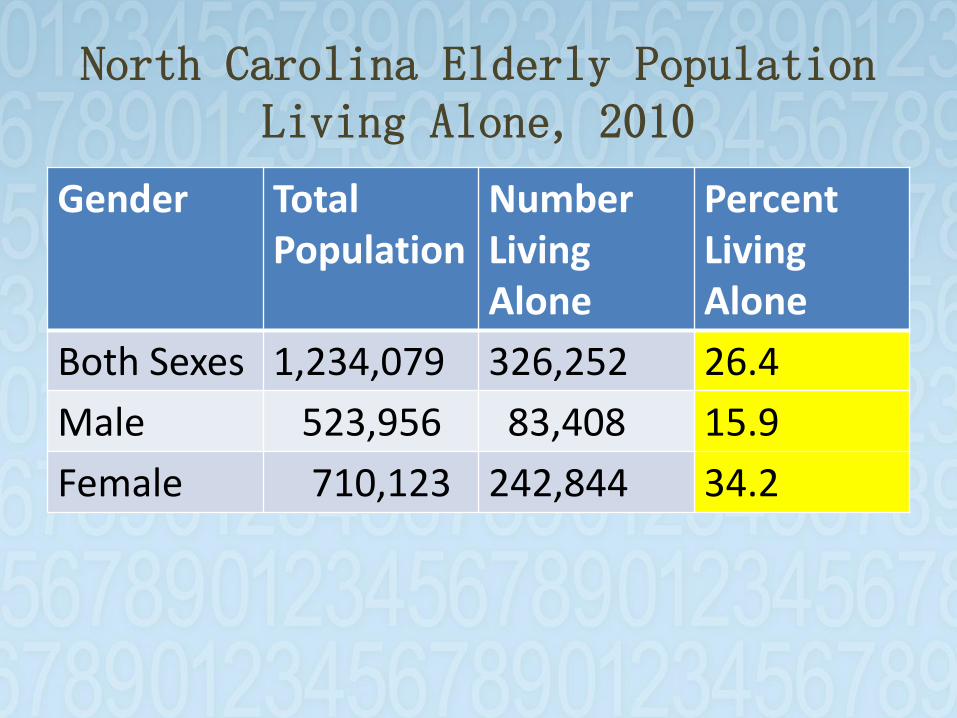
North Carolina Elderly Population Living Alone, 2010
Gender Total Population
Number Living Alone
Percent Living Alone
Both Sexes 1,234,079 326,252 26.4
Male 523,956 83,408 15.9
Female 710,123 242,844 34.2
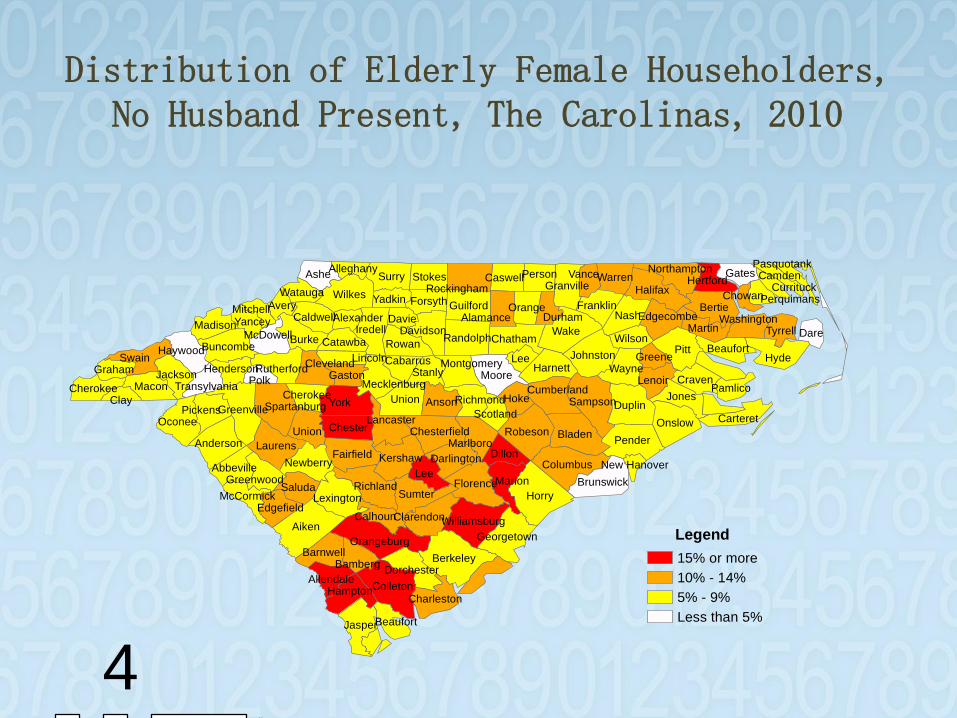
Distribution of Elderly Female Householders, No Husband Present, The Carolinas, 2010
Legend
15% or more
10% - 14%
5% - 9%
Less than 5%
40 75 15037.5
Miles
Horry
Pitt
Aiken
York
Wake
Berkeley
Bladen
Duplin
Colleton
Hyde
BertieWilkes
Pender
Moore
Union
Lee
Nash
Robeson
Surry
Onslow
Columbus
Laurens
Burke
Fairfield
Ashe
Union
Anson
Guilford
Harnett
Brunswick
Chatham
Macon
Rowan
Chester
Stokes Gates
ForsythYadkinHalifax
Sampson
Iredell
Jasper
Orangeburg
SumterFlorence
Swain Johnston
Richland
Oconee
Kershaw
Randolph
Greenville
Wayne
Jones
Anderson
Lexington
Martin
Hoke
Dillon
Williamsburg
Marion
Lee
Spartanburg
Chesterfield
Georgetown
Newberry
Clarendon
Saluda
LenoirStanly
Craven
Pickens
Warren
Barnwell
Granville
Tyrrell
Franklin
Buncombe
Davidson
Haywood
Person
Hampton
Jackson
Dare
Carteret
Caswell
Beaufort
Caldwell
Abbeville
Marlboro
Lancaster
Charleston
Cumberland
Wilson
Darlington
Madison
Orange
RutherfordPolk
Dorchester
Edgefield
Gaston
Cherokee
Rockingham
Davie
Catawba
Richmond
Hertford
McDowell
Cleveland
Northampton
Calhoun
Vance
Clay
Allendale
Avery
Mecklenburg
Alamance
Beaufort
Lincoln
EdgecombeYancey
Bamberg
Cherokee
Montgomery
Pamlico
Greenwood
Cabarrus
Durham
GrahamGreene
Watauga
McCormick
Scotland
Henderson
Washington
Transylvania
Mitchell
Camden
Alexander
Currituck
Alleghany
ChowanPerquimans
Pasquotank
New Hanover
Demonstration Sites
• Bertie County
• Guilford County
• Henderson County
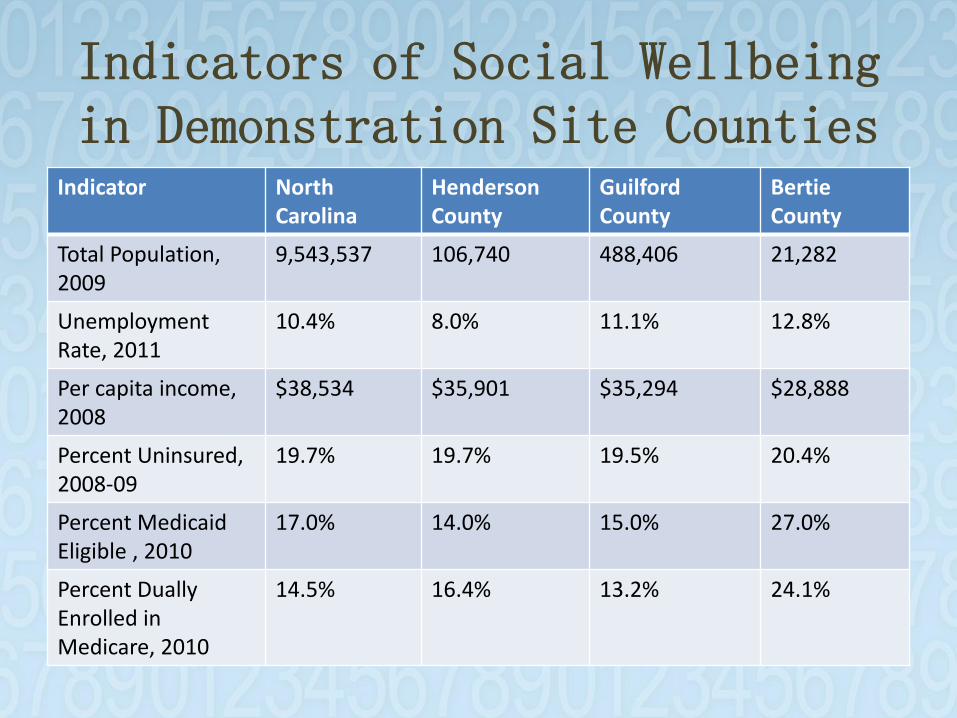
Indicators of Social Wellbeing in Demonstration Site Counties
Indicator North Carolina
Henderson County
GuilfordCounty
Bertie County
Total Population,2009
9,543,537 106,740 488,406 21,282
Unemployment Rate, 2011
10.4% 8.0% 11.1% 12.8%
Per capita income, 2008
$38,534 $35,901 $35,294 $28,888
Percent Uninsured, 2008-09
19.7% 19.7% 19.5% 20.4%
Percent Medicaid Eligible , 2010
17.0% 14.0% 15.0% 27.0%
Percent Dually Enrolled in Medicare, 2010
14.5% 16.4% 13.2% 24.1%

Strategic Alliance
Partners Fall Prevention campaign will involve wide-ranging partners
May 2013 47
Anticipated Outcomes
• Fewer Falls
• Reduced hospitalizations
• Extended independent living
• Reduced unemployment
• Sustainable model of falls prevention
IMPACT
• Reduced Medicaid Burden
• Lowered Caregiver Stress
• Greater Health Equity
• Healthier Communities

THE END