bqoe iii fundamentals of accounting and...
TRANSCRIPT

BQOE III FUNDAMENTALS OF ACCOUNTING AND FINANCE Noor Asma Jamaludin Nor Asma Lode Junaidah Hanim Ahmad Azlan Zainol Abidin Amin Ali Norazita Marina Abd. Aziz

First Printing, January 2009 Copyright @ Open University Malaysia (OUM), BQOE III All rights reserved. No part of this work may be reproduced in any form or by any means without the written permission of the President, Open University Malaysia (OUM). Version January 2009
Project Directors: Prof. Dr. Mansor Fadzil Prof. Dr. Shaari Abd. Hamid Open University Malaysia Module Writers: Noor Asma Jamaludin Nor Asma Lode Junaidah Hanim Ahmad Azlan Zainol Abidin Amin Ali Norazita Marina Abd. Aziz Universiti Utara Malaysia Moderators: Assoc Prof. Dr. Arfah Salleh Assoc. Prof. Hashanah Ismail Universiti Putra Malaysia Azlina Abdul Aziz Loo Sze Wei Rosila Abu Zarin Open University Malaysia Translated & Edited: Pearson (M) Sdn. Bhd. Compiled by: Lilian Kek Siew Yick Open University Malaysia Desktop Publishing: Centre for Instructional Design and Technology Open University Malaysia Printed by: Meteor Doc. Sdn. Bhd. Lot 47-48, Jalan SR 1/9, Seksyen 9, Jalan Serdang Raya, Taman Serdang Raya, 43300 Seri Kembangan, Selangor Darul Ehsan

Table of Contents Course Guide ix-xi Topic 1 Accounting Environment 1 1.1 Introduction to Accounting 2 1.1.1 Definition of Accounting 2 1.1.2 Users of Accounting Information 2 1.1.3 Branches of Accounting 3 1.1.4 Professional Accounting Bodies in Malaysia 4 1.2 Fundamental Accounting Concepts 6 1.2.1 Qualitative Characteristics of
Accounting Information 6 1.2.2 Accounting Assumptions 10 1.2.3 Basic Principles of Accounting 13 1.2.4 Accounting Constraints 16 1.3 Accounting Equation 17 1.3.1 Analysis of Transaction 17 1.3.2 Summary of Analysis 22 1.4 Types and Objectives of Financial Statements 24 1.4.1 Income Statement 25 1.4.2 Statement of Changes in Owner's Equity 25 1.4.3 Balance Sheet 26 1.4.4 Cash Flow Statement 27 Summary 33 Topic 2 Recording Process 34 2.1 Chart of Accounts 35 2.2 Format of Account 37 2.3 Rules of Debit and Credit 38 2.3.1 Normal Balance 39 2.4 Steps in Recording Process 41 2.4.1 Journal 41 2.4.2 Journalising and Posting of Entry 42 2.4.3 Example of Analysis and Summary Transactions 49 2.4.4 Trial Balance 73 Summary 77 Tutorial Question 78

TABLE OF CONTENTS
iv
Topic 3 Financial Statements 79 3.1 Annual Report and Users of Financial Statements 80 3.2 Income Statement 82 3.3 Balance Sheet 85 3.3.1 Assets 87 3.3.2 Liabilities 88 3.3.3 OwnersÊ Equity or ShareholderÊs Equity 89 3.3.4 Summary of Basic Accounting 90 3.4 Statement of Retained Earnings 94 3.5 Cash Flow Statement 94 3.5.1 Preparing Cash Flow Statement 95 3.5.2 Differentiating Cash Resources and Usage 98 Summary 104 Topic 4 Financial Statement Analysis 105 4.1 Financial Ratio Analysis 106 4.1.1 Income Statement 108 4.1.2 Balance Sheet 108 4.2 Liquidity Ratio 110 4.2.1 Net Working Capital 110 4.2.2 Current Ratio 111 4.2.3 Quick Ratio 112 4.3 Asset Management Ratio 113 4.3.1 Account Receivable Turnover 114 4.3.2 Average Collection Period 115 4.3.3 Inventory Turnover 116 4.3.4 Average Inventory Sales Period 117 4.3.5 Fixed Asset Turnover 118 4.3.6 Total Asset Turnover 118 4.4 Leverage Ratio 120 4.4.1 Debt Ratio 121 4.4.2 Debt-Equity Ratio 121 4.4.3 Equity Multiplier 122 4.4.4 Interest Coverage Ratio 123 4.5 Profitability Ratio 124 4.5.1 Gross Profit Margin 125 4.5.2 Net Profit Margin 126 4.5.3 Operating Profit Margin 126 4.5.4 Return on Asset 127 4.5.5 Return on Equity 127 4.5.6 Earnings Per Share 128
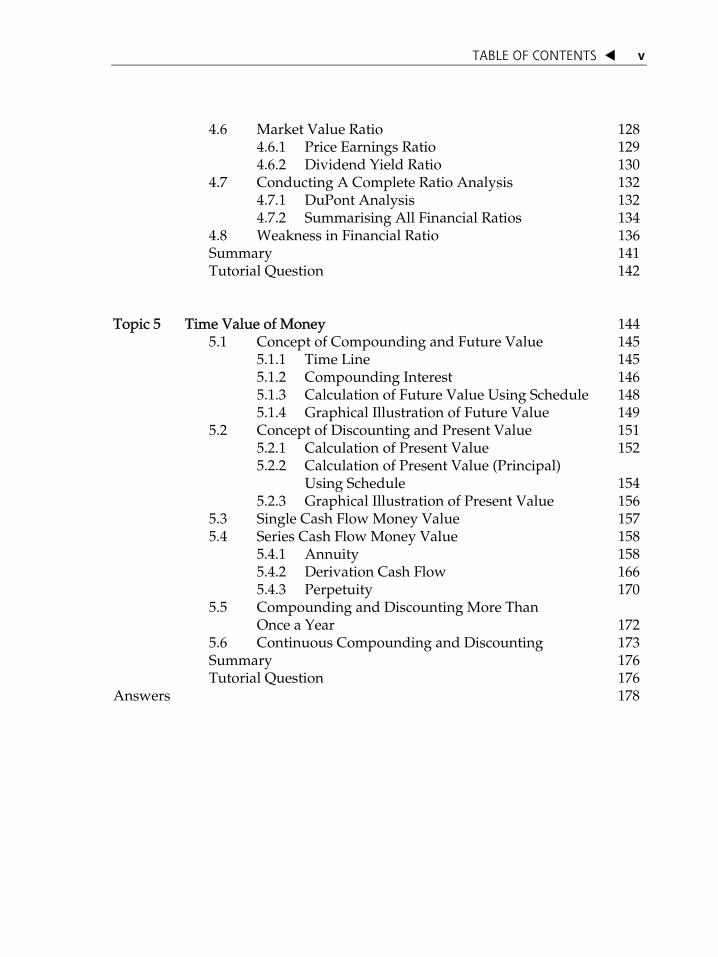
TABLE OF CONTENTS
v
4.6 Market Value Ratio 128 4.6.1 Price Earnings Ratio 129 4.6.2 Dividend Yield Ratio 130 4.7 Conducting A Complete Ratio Analysis 132 4.7.1 DuPont Analysis 132 4.7.2 Summarising All Financial Ratios 134 4.8 Weakness in Financial Ratio 136 Summary 141 Tutorial Question 142 Topic 5 Time Value of Money 144 5.1 Concept of Compounding and Future Value 145 5.1.1 Time Line 145 5.1.2 Compounding Interest 146 5.1.3 Calculation of Future Value Using Schedule 148 5.1.4 Graphical Illustration of Future Value 149 5.2 Concept of Discounting and Present Value 151 5.2.1 Calculation of Present Value 152 5.2.2 Calculation of Present Value (Principal) Using Schedule 154 5.2.3 Graphical Illustration of Present Value 156 5.3 Single Cash Flow Money Value 157 5.4 Series Cash Flow Money Value 158 5.4.1 Annuity 158 5.4.2 Derivation Cash Flow 166 5.4.3 Perpetuity 170 5.5 Compounding and Discounting More Than Once a Year 172 5.6 Continuous Compounding and Discounting 173 Summary 176 Tutorial Question 176 Answers 178

COURSE GUIDE


INTRODUCTION
Fundamentals of Accounting and Finance is a preparatory course for open entry learners who intend to pursue postgraduate programmes in Masters in Management (MM) and Masters of Business Administration (MBA). This course provides learners with fundamental knowledge in the area of accounting and finance.
COURSE OBJECTIVES
This course integrates the fundamental concepts of Financial Accounting and Financial Management. The first section of this course handles the introduction to the fundamental accounting concepts. This section will also elaborate on the process of preparing accounting information starting from the journal entries to the preparation of financial statement or report. Students will then be taught on how to evaluate, use and apply the financial information provided. At the end of this course, you should be able to:
1. understand the fundamental concepts of accounting;
2. describe the meaning of accounting information, its role as well as its importance;
3. elaborate the process of preparing accounting information from beginning until the completion of the accounting cycle;
4. discuss the functions and information contained in financial statements;
5. analyse the financial performance of a company using financial ratio analysis; and
6. apply the concept of the time value of money in computing cash flows.
COURSE SYNOPSIS
Topic 1 discusses the Accounting Environment. It introduces you to accounting fundamentals, involving the definition of accounting, users of accounting information, branches of accounting, professional accounting bodies in Malaysia as well as the fundamental concepts found in accounting. Also discussed are the accounting assumptions and the four main types of financial statements in financial reporting, namely Income Statement, Statement of Changes in Equity, Balance Sheet and Cash Flow Statement.

COURSE GUIDE
x
Topic 2 discusses the Recording Process. It revolves around the usage of accounts as well as the rules of debit and credit for each type of accounts (asset, liability and owner equity accounts). The rule of debit and credit will also include the normal balance for each type of accounts. This topic also tracks the steps taken in the recording process, which include the journal entry, transfer of entries to ledger and consequently the preparation of balance sheet. A complete example of the whole process is included to provide better understanding. Topic 3 discusses on the different types of financial statements used in business such as the income statement, balance sheet, statement of retained earnings and cash flow statement. You will get to understand the functions well as the information contained in the financial statements. Topic 4 discusses the usage of financial ratio analysis such as the liquidity ratio, asset management, leverage, profitability, and market value ratio. Besides that, this topic also discuss on the DuPont analysis and the overall financial analysis. Topic 5 exposes students to the basic concept for time value of money, which is the concept of present value and future value. You will learn the application and formula for the time value of money for single cash flow and net cash flow, annuity, perpetuity and derivation cash flow. The discussion will also include compounding and discounting methods that occurs more than once a year and compounding and discounting that occurs continuously.
REFERENCES
Emery, D.R., et. al. (1997). Principles of Financial Management. (1st ed.). Prentice Hall.
Gitman, L.J. (2005). Principles of Managerial Finance, (11th ed.). Addison Wesley. Horngren C. T., Harrison W. T. Jr. and Bamber L. S. (2002), Accounting (5th ed.),
Prentice Hall, New Jersey. Larson Kermit D., Wild John J., Chiappetta Barbara, (2004) Fundamentals
Accounting Principles, (17th ed.), McGraw Hill.
Lasher, W.R. (2005). Practical Financial Management, (4th ed.). South-Western Thomson Learning.
Roger, H.H et al. (1997), Accounting: A Business Perspective, (7th ed.), Irwin US.
COURSE GUIDE xi
Scott, D.F. Jr., et. al. (1998). Basic Financial Management (8th ed.). Prentice Hall. Warren C.S., Reeve J. M. and Fess P. E. (2004), Accounting (21st ed.),
International Thompson Publishing, Ohio, USA. Warren et. Al (2001), Accounting: Customized by School Of Accountancy UUM
for Business Accounting Students, Thompson Learning. Weygandt Jerry J., Keiso Donald E., Kimmel Paul D., (2004) Accounting
Principles, (7th ed.), John Wiley & Sons, Inc.
EVALUATION
Refer to the CAPL website at http://capl.oum.edu.my for the evaluation method for this course.

INTRODUCTION
Accounting plays an important role in our daily lives without us realising it. Accounting is a financial information system that helps us make better economic decisions. We might assume that accounting is only important to businessmen or accountants. In fact, we also need accounting in our daily lives. We need financial information to make economic decisions. For example, when making a decision on buying a new car, we need to know the total net revenue in a month (gross revenues minus all expenses) to know whether we can afford to buy the car. We also need to estimate other costs that might be involved in having a car.
TTooppiicc 11 Accounting Environment
LEARNING OUTCOMES At the end of this topic, you should be able to: 1. explain the meaning, role and importance of accounting; 2. state the users and branches of accounting; 3. describe the main functions of professional accounting bodies in
Malaysia; 4. describe the qualitative characteristics of financial information,
assumptions, principles and constraints in accounting; 5. explain the accounting equation; 6. analyse transactions based on the accounting equation; and 7. list 4 main financial statements in financial reporting.
TOPIC 1 ACCOUNTING ENVIRONMENT
2
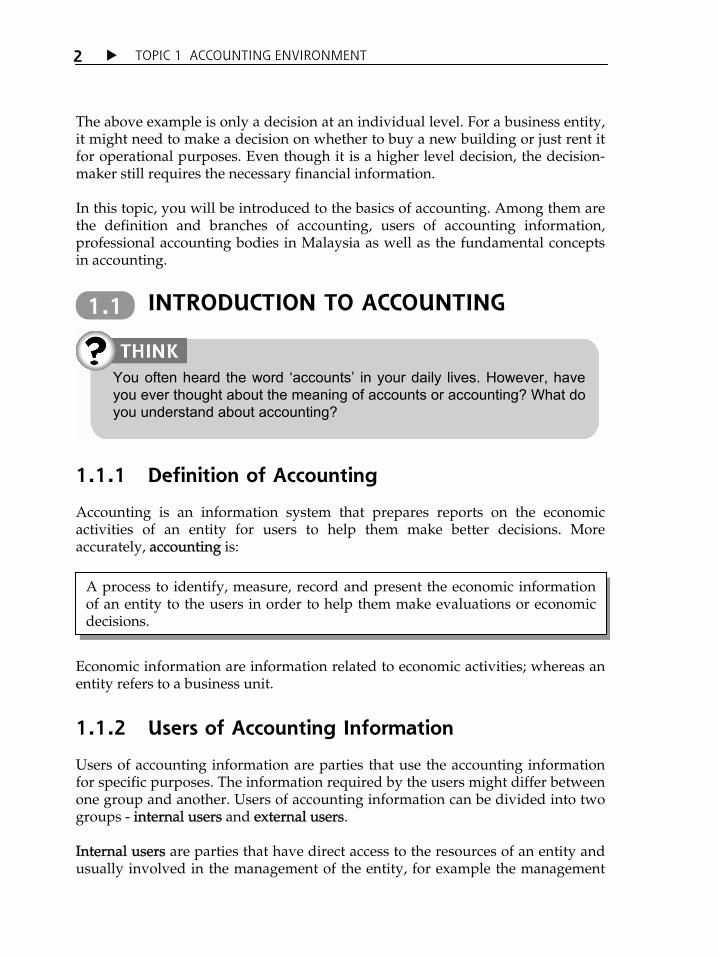
The above example is only a decision at an individual level. For a business entity, it might need to make a decision on whether to buy a new building or just rent it for operational purposes. Even though it is a higher level decision, the decision- maker still requires the necessary financial information. In this topic, you will be introduced to the basics of accounting. Among them are the definition and branches of accounting, users of accounting information, professional accounting bodies in Malaysia as well as the fundamental concepts in accounting.
INTRODUCTION TO ACCOUNTING
1.1.1 Definition of Accounting
Accounting is an information system that prepares reports on the economic activities of an entity for users to help them make better decisions. More accurately, accounting is:
Economic information are information related to economic activities; whereas an entity refers to a business unit.
1.1.2 Users of Accounting Information
Users of accounting information are parties that use the accounting information for specific purposes. The information required by the users might differ between one group and another. Users of accounting information can be divided into two groups - internal users and external users. Internal users are parties that have direct access to the resources of an entity and usually involved in the management of the entity, for example the management
1.1
You often heard the word ‘accounts’ in your daily lives. However, have you ever thought about the meaning of accounts or accounting? What do you understand about accounting?
A process to identify, measure, record and present the economic information of an entity to the users in order to help them make evaluations or economic decisions.
TOPIC 1 ACCOUNTING ENVIRONMENT 3
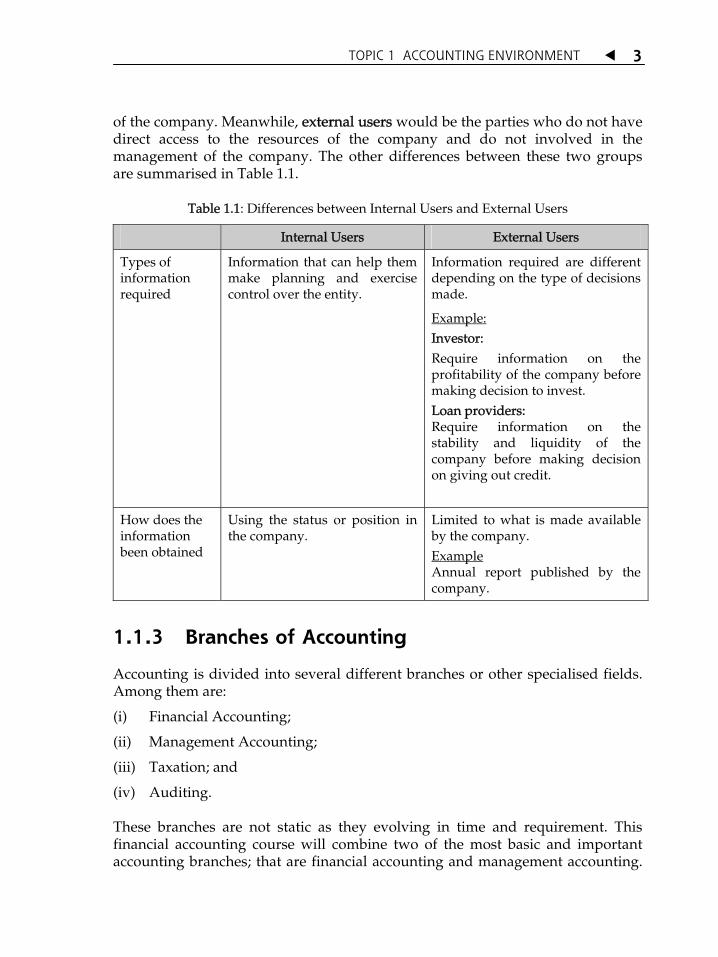
of the company. Meanwhile, external users would be the parties who do not have direct access to the resources of the company and do not involved in the management of the company. The other differences between these two groups are summarised in Table 1.1.
Table 1.1: Differences between Internal Users and External Users
Internal Users External Users
Types of information required
Information that can help them make planning and exercise control over the entity.
Information required are different depending on the type of decisions made.
Example: Investor: Require information on the profitability of the company before making decision to invest. Loan providers: Require information on the stability and liquidity of the company before making decision on giving out credit.
How does the information been obtained
Using the status or position in the company.
Limited to what is made available by the company. Example Annual report published by the company.
1.1.3 Branches of Accounting
Accounting is divided into several different branches or other specialised fields. Among them are:
(i) Financial Accounting;
(ii) Management Accounting;
(iii) Taxation; and
(iv) Auditing. These branches are not static as they evolving in time and requirement. This financial accounting course will combine two of the most basic and important accounting branches; that are financial accounting and management accounting.
TOPIC 1 ACCOUNTING ENVIRONMENT
4
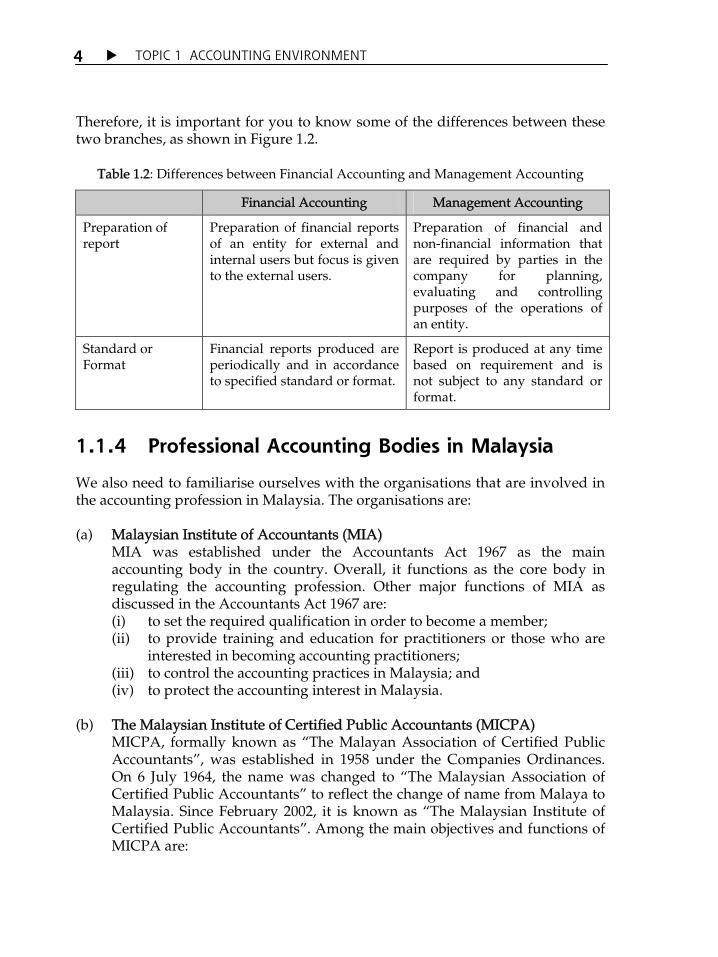
Therefore, it is important for you to know some of the differences between these two branches, as shown in Figure 1.2.
Table 1.2: Differences between Financial Accounting and Management Accounting
1.1.4 Professional Accounting Bodies in Malaysia
We also need to familiarise ourselves with the organisations that are involved in the accounting profession in Malaysia. The organisations are: (a) Malaysian Institute of Accountants (MIA) MIA was established under the Accountants Act 1967 as the main
accounting body in the country. Overall, it functions as the core body in regulating the accounting profession. Other major functions of MIA as discussed in the Accountants Act 1967 are: (i) to set the required qualification in order to become a member; (ii) to provide training and education for practitioners or those who are
interested in becoming accounting practitioners; (iii) to control the accounting practices in Malaysia; and (iv) to protect the accounting interest in Malaysia.
(b) The Malaysian Institute of Certified Public Accountants (MICPA) MICPA, formally known as „The Malayan Association of Certified Public
Accountants‰, was established in 1958 under the Companies Ordinances. On 6 July 1964, the name was changed to „The Malaysian Association of Certified Public Accountants‰ to reflect the change of name from Malaya to Malaysia. Since February 2002, it is known as „The Malaysian Institute of Certified Public Accountants‰. Among the main objectives and functions of MICPA are:
Financial Accounting Management Accounting
Preparation of report
Preparation of financial reports of an entity for external and internal users but focus is given to the external users.
Preparation of financial and non-financial information that are required by parties in the company for planning, evaluating and controlling purposes of the operations of an entity.
Standard or Format
Financial reports produced are periodically and in accordance to specified standard or format.
Report is produced at any time based on requirement and is not subject to any standard or format.

TOPIC 1 ACCOUNTING ENVIRONMENT 5
(i) to advance the accounting theories and practices in all aspects; (ii) to train and evaluate the competent members; (iii) to ensure the independence of professional accountants; and (iv) to oversee the practices and professional conducts of its members.
(c) Malaysian Accounting Standards Board (MASB) MASB was established under the Financial Reporting Act 1997. Among the
main functions of MASB are: (i) to set and approve new accounting standards; (ii) to revise or accept the usage of existing standards as approved
accounting standards; and (iii) to develop the conceptual accounting framework.
(d) Financial Reporting Foundation (FRF) FRF was established under the Financial Reporting Act 1997 together with
MASB. Among the main functions of FRF are: (i) to provide opinion to MASB on matters to be implemented; (ii) to evaluate the performance of MASB; and (iii) to be responsible for the overall funding of the operation of MASB,
including to approve its budget.
EXERCISE 1.1 1. Provide examples of common decisions made by both internal and
external users. 2. How does Financial Accounting and Management Accounting assist
users in making decision?

TOPIC 1 ACCOUNTING ENVIRONMENT
6
FUNDAMENTAL ACCOUNTING CONCEPTS
1.2.1 Qualitative Characteristics of Accounting Information
In this section, you will be exposed to the qualitative characteristics of accounting information. Qualitative characteristics of accounting information refer to the characteristics that must be present in the accounting information to make it useful. These characteristics are divided into two categories; primary and secondary qualities. The primary qualities of accounting information are relevant and reliability, while the secondary qualities are comparability and consistency. In summary, accounting information is only useful if it has relevant, reliability, comparability and consistency qualities. Figure 1.1 shows the summary for qualitative characteristics of accounting information.
Figure 1.1: Qualitative characteristics of accounting information
(a) Relevant In everyday terms, we might describe relevant as important or being
related. In accounting, relevant is described as something that makes a
1.2
What are the important qualitative characteristics of accounting information?

TOPIC 1 ACCOUNTING ENVIRONMENT 7
difference in arriving at a decision. In other words, something is said to be relevant if it influences or affects the decision being made.
The extent to which information is considered relevant depends on its
importance in decision making and may differ between one decision maker to another. Information that is relevant to you might not be relevant to another person and vice versa.
For example, suppose you are an investor and you intend to buy shares of a
public listed company. What kind of information might be relevant to your needs? You might want to know the profitability and performance of the said company for the past five years, including new projects or products for the company that will be profitable in the future. This information is relevant as it will influence your decision. Suppose the information that you obtained showed that the company is experiencing continuous losses for the past five years and it does not have any new projects. Will you still proceed with the proposal to invest in the company? Probably not.
Figure 1.2 shows an example of performance information of a company in
order to assist investors in decision making.
Figure 1.2: Performance information of a company to assist investor in decision making.
After knowing the meaning of relevant, you must also know how certain
information are said to be relevant. To become relevant, the information must have three characteristics, namely feedback value, forecast value and timeliness.

TOPIC 1 ACCOUNTING ENVIRONMENT
8
(i) Feedback Value Relevant information must be able to assist users in substantiating or
correcting early expectations matters at hand. (ii) Forecast Value Relevant information must be able to assist users in forecasting. (iii) Timeliness Relevant information must be obtained before it becomes obsolete or
unusable. (b) Reliability Reliability means that users can rely or depend on the said information to
make good decisions. This characteristic is important because users might not have the time or expertise to evaluate some information. Generally, users simply depend on the information presented by the related entity and assume it to be true. This information is then used in decision making.
Reliability does not mean that the said information must be precise. This is
because in accounting there are a lot of information that involves estimation and approximation that might not be precise. What is important is that the estimation and approximation made must be reliable.
Reliable information must have the following characteristics:
(i) Verifiable This means that the accounting information could be verified
objectively by another person using the same method. (ii) Objective Objective in this case means that the information is not biased.
Information contained in the financial statements must be able to fulfil the requirements of various users and not concentrating on certain groups only.
(iii) Trustworthy Information presented is based on the actual result of economic
activities using specified methods. (c) Comparability Comparability means that the information can be compared whether among
companies, industries or different periods. This will enable users to identify the similarities or differences that might exist in the said information. This characteristic is important because information that can be compared is more useful.
This example might help you to understand comparability. Let us assume
that you were told that the net profit of a business in the year 2000 was RM5 million. Is this information useful? This information would only be

TOPIC 1 ACCOUNTING ENVIRONMENT 9
meaningful if you can compare it with the net profit of the business in the year 1999 or the net profit of other businesses in the same industry as shown in Figure 1.3. Thus, financial statements contained in the Annual Report also include information on the previous year in addition to the current year for comparison purposes.
Figure 1.3: Profitability comparison
(d) Consistency Consistency means that an entity must use the same accounting procedures
in every period. It is for the purpose of enabling comparison to be made more effectively. In other words, a company cannot change their accounting procedure every year. This does not mean that the company cannot change the accounting procedure at all. Changes can still be made, but the company must make complete disclosure in the financial statement to explain to the users why they are making the changes and the effect of the changes towards the financial statements.
In your opinion, what will happen to a business entity if it only presents the qualitative characteristics of main accounting information in its annual report?
EXERCISE 1.2
1. State the qualitative characteristics of accounting information. 2. Explain the meaning of comparability provide an example to show
its role in making accounting information useful.
TOPIC 1 ACCOUNTING ENVIRONMENT
10
1.2.2 Accounting Assumptions
In this section you will be exposed to accounting assumptions. There are four accounting assumptions, created to aid the reporting entity and the users, which are generally accepted. They are: (a) Assumption of Separate Entity For the purpose of accounting, an entity is assumed to be separate from its
owner and also other entities. An accounting entity is an economic entity in its own right which controls resources involving economic activities. All activities relating to the accounting entity must be separated from the ownerÊs activities or other accounting entitiesÊ activities. The examples below should explain this concept clearly.
Example 1: Assume that you own a business, your personal economic activities must be
kept separate from the businessÊ economic activities. If you wish to buy products for personal use, you cannot take the businessÊ money and assume that as part of the business activities. Instead, you must record it as drawings. The Drawings Account shows the money or products from the business taken by the owner for personal use.
Example 2: Supposing you have just set up a business which offers computer repair
services. As it is a small business and you are the sole proprietor, the businessÊ cash is deposited into your private account. Assume that on 31 December 2003, the bank balance of your account is RM5,000. Based on your record, RM1,000 is the money from your business and the balance of RM4,000 is funds for your studies.
If you did not comply with the assumption of separate entity and assume
RM5,000 is the money from your business, you might make an inaccurate business decision. You might feel that your business has adequate funds while in fact only RM1,000 is the businessÊ cash. Although all the money belongs to you, from the accounting perspective, RM1,000 is for the business funds and the balance of RM4,000 is the money for your education purposes.
Segregation would enable you to evaluate the financial status of the
business much better and to make accurate decisions to enhance the performance of the business. If an owner has more than one business entity, each entity must be assumed as separate entity from the others. Please refer to the example below.

TOPIC 1 ACCOUNTING ENVIRONMENT 11
Assuming that Mr. Ali owns three different businesses, all three are considered to be separate from accounting perspective. Accounting records must be maintained separately; assets and liabilities for each business cannot be mixed together. Segregation would enable the owner to know the performance for each business.
As a simple example, suppose that Mr. AliÊs businesses show the following
result on 31 December 2003:
Business Transaction (RM)
Business 1 Profit 6,000
Business 2 Loss 8,000
Business 3 Profit 12,000
If the assumption of separate entity is not complied with and all the entities
are assumed as one, Mr. Ali will have an overall business profit of RM10,000 [RM6,000 + (-8,000) + RM12,000]. Based on this result, Mr. Ali might be satisfied and might not take any measures for improvement.
However, by preparing separate accounts, Mr. Ali will know that Business 2
is facing problems as it is suffering a loss of RM8,000, while Business 3 is performing very well with a profit of RM12,000.
(b) Assumption of Going Concern According to this assumption, an entity is assumed to continue to exist and
in operation in the future. This assumption is important because it enables the principle of historical cost to be applied. According to the historical cost principle, all assets and liabilities must be recorded at the purchase price (original cost). For most assets, this cost would be depreciated throughout the life span of the assets to depict its usage. However, asset of property would not be depreciated as its value would always appreciate.
As an example, a machine with a life span of 25 years will be depreciated
for 25 years based on the assumption of going concern. With this assumption, the entity would continue to exist for a period of more than 25 years. If we assume that the entity would exist only for another 10 years in absence of this assumption, we obviously cannot use 25 years as the basis for calculating the depreciation.
The assumption also enables users to make decisions without any doubt or
worries. Suppose you are interested to invest in a company that has consistently achieved high profits in the past few years. However, you were

TOPIC 1 ACCOUNTING ENVIRONMENT
12
informed that the company would exist only for another five years. Would you still continue with your plan to invest in the said company? Generally, we will only invest when we believe the company will continue to exist in the future.
(c) Assumption of Monetary Unit According to this assumption, all economic activities are measured and
valued in currency unit. In Malaysia, the currency unit used is Malaysian Ringgit (RM). Only transactions that can be stated in currency unit will be recorded for accounting purposes. Currency unit enables the transactions to be summarised, reported and compared. Before the existence of currency, transactions were conducted by way of exchanging goods (barter system). The non-existence of currency unit had created difficulties in ascertaining the value of transactions. With a countryÊs standard currency unit, we would be able to value every product.
However, this assumption has two weaknesses, that are:
(i) It restricts the scope of accounting. Only transactions that can be measured in monetary terms will be taken into account, neglecting other factors that have impact on the business.
(ii) It assumes that the value of currency is constantly stable, whereas we know that the currency value is always changing.
(d) Assumption of Accounting Period In the assumption of going concern, we assumed that the entity will
continue to operate for an unlimited period. However, users (whether manager, shareholders, loan providers or other parties) require periodical measurements to help them making decisions. With this assumption, the lifetime of the entity is divided into a certain period for the purpose of reporting its economic activities. Normally the period selected is one year. Financial reports must be produced every accounting year.
The selected accounting period can start from 1 January and ends on 31
December, or starts from 1 July and ends on 30 June the following year, and so on depending on the operation of the company. For example, if an entity is established on 1 March, it might choose an accounting period that starts from 1 March and ends on 28 February of the following year. This accounting period can be changed if the entity feels that there is a need to do so.

TOPIC 1 ACCOUNTING ENVIRONMENT 13
Figure 1.4 shows examples of accounting period.
Starting Date Ending Date
1 January 2001 30 December 2001
1 July 2002 30 June 2003
1 March 2002 28 February 2003
Figure 1.4: Examples of accounting period There are also companies which produce reports within a period of less than a year, for example monthly, quarterly or half yearly. These reports are known as interim reports. Interim report is normally produced to fulfil the requirement of users that might need a more up-to-date report.
1.2.3 Basic Principles of Accounting
After understanding the qualitative characteristics of information and accounting assumptions, you will be exposed to the basic principles of accounting, which are the principles used in the process to identify, measure, evaluate and report financial information. There are four basic principles that you must know: (a) Principle of Historical Cost According to this principle, all business resources will be recorded based on
historical cost, which is the original cost at time of purchase. Although the value of the resources might change in the future, no adjustment will be made to recognise the changes in the value.
There is a company that has obtained high profits consistently for the past 5 years and would exist for a period of another 10 years. Would you invest in the company? Explain your decision.
The word income is used daily especially in relation to business. However, do you know what is meant by income?
TOPIC 1 ACCOUNTING ENVIRONMENT
14
For example, you want to buy a piece of land for your business site. The seller set the price at RM80,000. You do not agree with the price and ask the seller to sell it RM70,000. After negotiation, the seller agreed with the price of RM72,000. In this case, the land would be recorded at the value of RM72,000 in your financial statement. Five years later, you wish to revalue the land. The assessor informed you that the value of the land had appreciated to RM120,000. Although there is a high appreciation in value, you must still record it at the value of RM72,000, which is the original cost of the land during the purchase.
The principle of historical cost is justified by its high reliability. The value
recorded in the financial statement is based on the original cost at the time of purchase supported by documentation. This advantage is also a weakness for certain parties. These parties criticised the failure of the principle to recognise any possible changes in asset value. Regardless, this principle is still adopted.
(b) Principle of Income Recognition Principle of income recognition provides guidance regarding when and
how to recognise income. The three conditions that must be complied with before income is recognised are:
The seller had performed the necessary actions to obtain the income (for example, providing the goods for trade or rendering services);
The amount of income can be measured objectively; and The income can be collected.
Normally, income is recognised at the point of sale. The point of sale refers
to a situation whereby ownership has been transferred from the seller to the buyer, notwithstanding whether the cash has been received or not. For an entity that offers services, the point of sale is when the service has been provided to the customer.
However, in certain cases, the point of sale method is inappropriate. There
are several different methods that can be used, for instance the percentage of completion and cash basis methods. (i) Percentage of Completion Method is normally used by companies
involved in the construction industry which takes a long time to complete. For example, a housing project might take three years to complete. It would be inappropriate to recognise the revenue only after the project is completed. This is because revenue and expenses accrued throughout the duration of the project that could be determined periodically based on the degree of completion. This method is more appropriate because it complies with the accounting
TOPIC 1 ACCOUNTING ENVIRONMENT 15
period principle and provides a true picture of the project development.
(ii) Cash Basis Method complies with the basis of cash accounting. According to this method, revenue is only recognised when cash is received. This method is applied in credit transactions when cash receipts are not assured.
(c) Principle of Matching
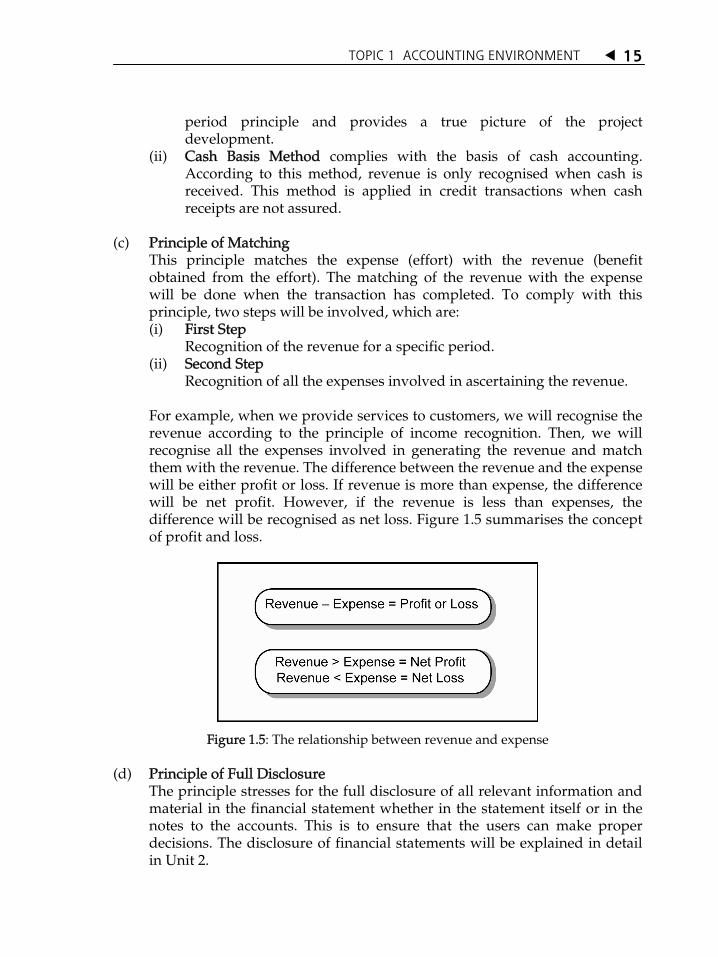
This principle matches the expense (effort) with the revenue (benefit obtained from the effort). The matching of the revenue with the expense will be done when the transaction has completed. To comply with this principle, two steps will be involved, which are: (i) First Step Recognition of the revenue for a specific period. (ii) Second Step Recognition of all the expenses involved in ascertaining the revenue. For example, when we provide services to customers, we will recognise the revenue according to the principle of income recognition. Then, we will recognise all the expenses involved in generating the revenue and match them with the revenue. The difference between the revenue and the expense will be either profit or loss. If revenue is more than expense, the difference will be net profit. However, if the revenue is less than expenses, the difference will be recognised as net loss. Figure 1.5 summarises the concept of profit and loss.
Figure 1.5: The relationship between revenue and expense
(d) Principle of Full Disclosure The principle stresses for the full disclosure of all relevant information and
material in the financial statement whether in the statement itself or in the notes to the accounts. This is to ensure that the users can make proper decisions. The disclosure of financial statements will be explained in detail in Unit 2.

TOPIC 1 ACCOUNTING ENVIRONMENT
16
1.2.4 Accounting Constraints
We have seen the principles that must be complied with in accounting. However, there are constraints or obstructions that might result in these principles not being complied with. The main constraints in accounting are: (a) Cost-Benefit Relationship Before deciding on obtaining specific information, a company would
normally analyse the cost involved and the benefit that may be gained from the information. If the cost of obtaining the information is very high but the benefit generated is not so much, the company might not reveal the information even though all information must be completely disclosed in accordance with the principle of full disclosure.
(b) Materiality Materiality refers to the effect of an item towards the overall operation of
the entity. An item is considered immaterial if it does not affect the decision that will be made. Materiality is often measured based on size. A transaction that involves a huge amount is normally treated as material. A material transaction must be disclosed in detail, while immaterial transactions are sometimes combined or not disclosed in detail.
For example, a small amount of expense like a purchase of stamps and fares
are combined into one account known as sundry expenses. Another example will be the practice of approximation. You can see examples in the annual report published by companies. Generally, companies would not record the cents value, but instead will round the figures up to the nearest ringgit (example: RM471.20 is recorded as RM471). For larger companies, it might make the approximation to the nearest hundred ringgit (example: RM525,795 is recorded as 525,800).
ACTIVITY 1.3
1. Explain the weaknesses exist in the assumption of monetary unit. 2. Describe THREE conditions that must be fulfilled before revenue can
be recognised.
TOPIC 1 ACCOUNTING ENVIRONMENT 17
ACCOUNTING EQUATION
Accounting equation is the basis of accounting that will always be used each time we record a transaction. It consists of three components or basic elements, which are asset, liability and ownerÊs equity. What is meant by asset? Asset is the resources that can bring economic benefit, owned by the entity. For example, cash, building and fittings. For each resource, there must be a claim or rights on it. A simple example, if you own some money, the money belongs to you. If you buy a vehicle with bank loan, the ownership of the vehicle is claimed by the bank until you have settled your loan. In other words, the vehicle is not owned by you (but is owned by the bank) until you have settled your entire loan. It is the same in business. Every asset owned by the business can be claimed either by the owner itself, or loan providers. Rights or claims made by the loan providers are known as liabilities, whereas the rights or claims made by the owner itself are known as equities. Loan providers have priority over the rights to the business assets. If the entity is facing problems, it must first settle its loans. The owner can only claim his rights if there are assets left. Therefore, liability is put ahead of ownerÊs equity in the accounting equation as shown below:
1.3.1 Analysis of Transaction
You must always remember that the accounting equation is always equal regardless of the transaction that has transpired. All transactions can be stated by changes in the three components of the accounting equation. Now we will look at a few common transactions and analyse the results on the accounting equation.
1.3
Accounting Equation:
ASSET = LIABILITY + OWNERÊS EQUITY
A business has assets valued at RM120,000. RM50,000 is the owner’s capital and the balance is bank loan. What is the accounting equation?

TOPIC 1 ACCOUNTING ENVIRONMENT
18
We will use the example of a sole proprietor business owned by Reen. Reen, who is skilled in the computer field, has established her own company on 1 November 2000. For a start, the business (Reen Cyber Service) offers services in computer consultancy. If successful, Reen intends to expand her business to selling computers. The following is a list of transactions incurred by Reen Cyber Service throughout the month of November 2000:
Table 1.3: List of Transactions for Reen Cyber Service, November 2000
No. Date (Nov) Transactions
1 1 Reen invested cash of RM30,000 into Reen Cyber Service.
2 2 Purchased a piece of land valued at RM20,000. The business paid cash RM5,000 and the balance is financed by bank loan.
3 4 Purchased office supplies valued at RM2,700 on credit.
4 15 Received revenue from consultancy services provided to customer. The customer paid RM15,000 cash.
5 30 Paid staff salary expense RM4,250; rental expense RM1,600; utility expense RM900 and other expenses RM550.
6 30 Made payment for account payable of RM1,900.
7 30 Unused office supplies valued at RM1,100.
8 30 Reen withdrew money from the business amounting to RM4,000 for her personal use.
All the transactions above are pertaining to Reen Cyber Service. The personal transactions of the owner (Reen) will not be taken into account if it does not involve the business. Now we have to analyse each transaction to see their effects on the accounting equation. Transaction 1: Reen invested cash of RM30,000 into Reen Cyber Service. Again, it needs to be emphasised that we are only interested in transactions involving Reen Cyber Service, and not ReenÊs personal transactions. Therefore, even though the cash owned by Reen was reduced by RM30,000, the cash owned by Reen Cyber Service has increased by RM30,000. This capital was contributed by Reen. Therefore, ownerÊs equity will increase by RM30,000.
Transaction ASSET = LIABILITY + OWNERÊS EQUITY Cash Capital, Reen 1 30,000 = 30,000
TOPIC 1 ACCOUNTING ENVIRONMENT 19
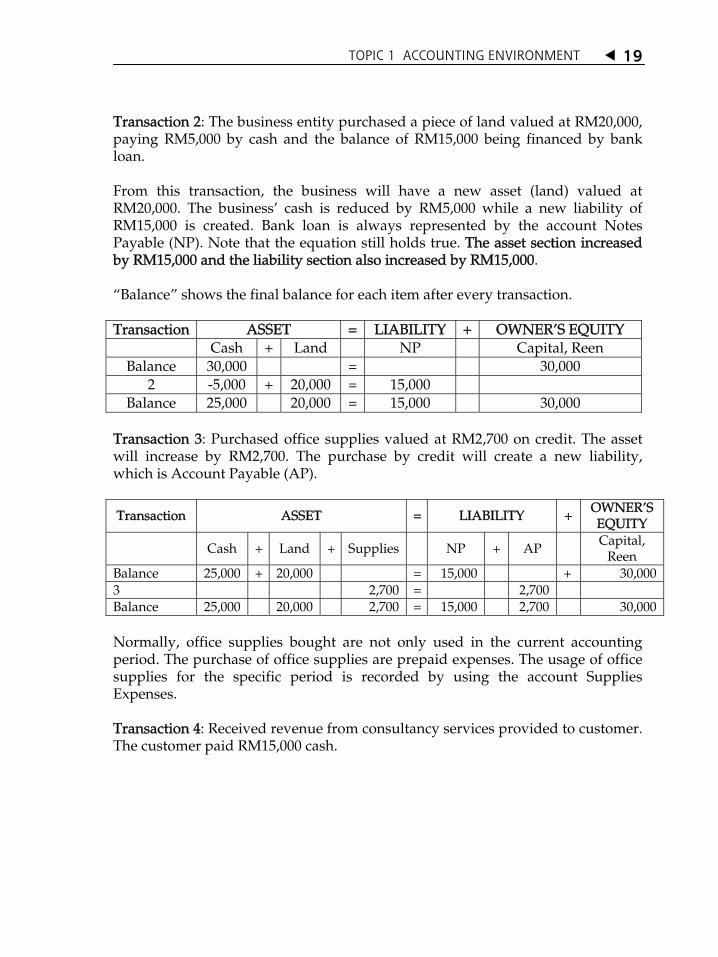
Transaction 2: The business entity purchased a piece of land valued at RM20,000, paying RM5,000 by cash and the balance of RM15,000 being financed by bank loan. From this transaction, the business will have a new asset (land) valued at RM20,000. The businessÊ cash is reduced by RM5,000 while a new liability of RM15,000 is created. Bank loan is always represented by the account Notes Payable (NP). Note that the equation still holds true. The asset section increased by RM15,000 and the liability section also increased by RM15,000. „Balance‰ shows the final balance for each item after every transaction. Transaction ASSET = LIABILITY + OWNERÊS EQUITY
Cash + Land NP Capital, Reen Balance 30,000 = 30,000
2 -5,000 + 20,000 = 15,000 Balance 25,000 20,000 = 15,000 30,000
Transaction 3: Purchased office supplies valued at RM2,700 on credit. The asset will increase by RM2,700. The purchase by credit will create a new liability, which is Account Payable (AP).
Transaction ASSET = LIABILITY + OWNERÊS EQUITY
Cash + Land + Supplies NP + AP Capital, Reen
Balance 25,000 + 20,000 = 15,000 + 30,000 3 2,700 = 2,700 Balance 25,000 20,000 2,700 = 15,000 2,700 30,000 Normally, office supplies bought are not only used in the current accounting period. The purchase of office supplies are prepaid expenses. The usage of office supplies for the specific period is recorded by using the account Supplies Expenses. Transaction 4: Received revenue from consultancy services provided to customer. The customer paid RM15,000 cash.
TOPIC 1 ACCOUNTING ENVIRONMENT
20
Transaction ASSET = LIABILITY + OWNERÊS EQUITY
Cash + Land + Supplies NP + AP Capital, Reen
Balance 25,000 + 20,000 + 2,700 = 15,000 + 2,700 + 30,000 4 +15,000
=
15,000
service revenue
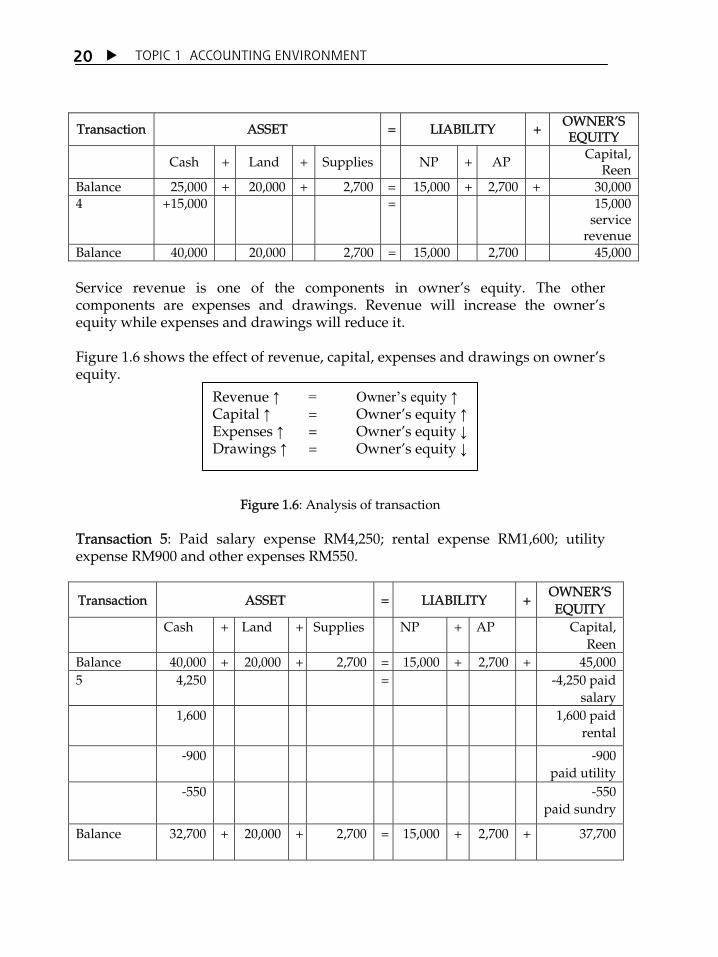
Balance 40,000 20,000 2,700 = 15,000 2,700 45,000 Service revenue is one of the components in ownerÊs equity. The other components are expenses and drawings. Revenue will increase the ownerÊs equity while expenses and drawings will reduce it. Figure 1.6 shows the effect of revenue, capital, expenses and drawings on ownerÊs equity.
Figure 1.6: Analysis of transaction Transaction 5: Paid salary expense RM4,250; rental expense RM1,600; utility expense RM900 and other expenses RM550.
Transaction ASSET = LIABILITY + OWNERÊS EQUITY
Cash + Land + Supplies NP + AP Capital, Reen
Balance 40,000 + 20,000 + 2,700 = 15,000 + 2,700 + 45,000 5 4,250 = -4,250 paid
salary 1,600
1,600 paid
rental
-900 -900 paid utility
-550 -550 paid sundry
Balance 32,700 + 20,000 + 2,700 = 15,000 + 2,700 + 37,700
Revenue ↑ = Owner’s equity ↑ Capital ↑ = OwnerÊs equity ↑Expenses ↑ = OwnerÊs equity ↓Drawings ↑ = OwnerÊs equity ↓

TOPIC 1 ACCOUNTING ENVIRONMENT 21
In this transaction, all the expenses were paid by cash. Therefore, cash will decrease according to the amount involved. Each expense item has to be recorded separately and cannot be combined. As explained in transaction 4, expenses will reduce ownerÊs equity. Transaction 6: Made payment for account payable of RM1,900. When the business paid RM1,900, cash will decrease by RM1,900 and liability will also decrease by RM1,900.
Transaction ASSET = LIABILITY + OWNERÊS EQUITY
Cash + Land + Supplies NP + AP Capital, Reen
Balance 32,700 + 20,000 + 2,700 = 15,000 + 2,700 + 37,700 6 1,900 = -1,900 Balance 30,800 + 20,000 + 2,700 = 15,000 + 800 + 37,700 Transaction 7: At the end of the month, the unused office supplies were valued at RM1,100. The office supplies was originally bought for RM2,700. The value of office supplies used up during the period is RM1,600 (RM2,700 RM1,100)
Transaction ASSET = LIABILITY + OWNERÊS EQUITY
Cash + Land + Supplies NP + AP Capital, Reen
Balance 30,800 + 20,000 + 2,700 = 15,000 + 800 + 37,700 7 -1,600 -1,600 = -1,600
Supplies expenses
Balance 30,800 + 20,000 + 1,100 = 15,000 + 800 + 36,100 Transaction 8: Reen took RM4,000 of the businessÊ cash for personal use.
Transaction ASSET = LIABILITY + OWNERÊS EQUITY
Cash + Land + Supplies NP + AP Capital, Reen
Balance 30,800 + 20,000 + 1,100 = 15,000 + 800 + 36,100 8 4,000 = -4,000 cash
drawings Balance 26,800 + 20,000 + 1,100 = 15,000 + 800 + 32,100

TOPIC 1 ACCOUNTING ENVIRONMENT
22
Drawings is the reverse of capital investment. Capital investment will increase the capital (example in the form of cash) of the business. Drawings will reduce the capital. At the end of the accounting period, the drawings account will be closed and the balance will be transferred to the capital account. Therefore, drawings will be recorded as a reduction in capital account. Although both drawings and expenses reduced capital, there is a clear difference between these two types of accounts. Drawings are not for the purpose of generating revenue, but for the ownerÊs personal use.
1.3.2 Summary of Analysis
Some important items that we must be aware of during the analysis of transaction:
(a) Each transaction will affect, either as an increase or decrease, one or more components in the accounting equation. However, each transaction will definitely involve more than one item in the financial statements;
(b) The accounting equation explained at the earlier stage will always be equal. You can examine this yourself by looking into the „Balance‰ section after every transaction analysis; and
(c) OwnerÊs equity will increase with investment from the owner and revenue, while drawings by the owner and expenses will reduce ownerÊs equity.
Table 1.4 is a summary of analysis for all the transactions of Reen Cyber Service. After all the transactions have been recorded, we will discover that the accounting equation will still be equal.

TOPIC 1 ACCOUNTING ENVIRONMENT 23
Table 1.4: Analysis of Transaction for R.C.S, November 2000
Transaction ASSET = LIABILITY + OWNER EQUITY
Cash + Land + Supplies NP + AP Capital, Reen
1 30,000 = 30,000 investment
by Reen Balance 30,000 = 30,000
2 -5,000 20,000 = 15,000 Balance 25,000 20,000 = 15,000 + 30,000
3 + 2,700 = 2,700 Balance 25,000 + 20,000 + 2,700 = 15,000 + 2,700 + 30,000
4 15,000 = 15,000 service
revenue Balance 40,000 + 20,000 + 2,700 = 15,000 + 2,700 + 45,000
5 4,250 = -4,250 paid
salary -1,600 -1,600
paid rental
-900 -900 paid
utility -550 -550
paid sundry
Balance 32,700 + 20,000 + 2,700 = 15,000 + 2,700 + 37,700 6 1,900 = -1,900
Balance 30,800 + 20,000 + 2,700 = 15,000 + 800 + 37,700 7 1,600 = -1,600
bought supplies
Balance 30,800 + 20,000 + 1,100 = 15,000 + 800 + 36,100 8 4,000 = -4,000
cash drawings
Balance 26,800 + 20,000 + 1,100 = 15,000 + 800 + 32,100
ASSET = LIABILITY + OWNERÊS EQUITY 47,900 = 15,800 + 32,100 47,900 = 47,900

TOPIC 1 ACCOUNTING ENVIRONMENT
24
TYPES AND OBJECTIVES OF FINANCIAL STATEMENT
After the transactions have been identified, analysed and recorded, we need to prepare a report for the users. This report is the final product of the accounting process and is known as financial statement. There are four types of financial statement that you need to know:
(a) Income Statement;
(b) Statement of Changes in OwnerÊs Equity;
(c) Balance Sheet; and
(d) Cash Flow Statement. These statements are interconnected with one another. The title for each statement must contain the reporting entityÊs name, type of statement and the reporting period covered. In this section, we will see in summary, the format for each of the four statements based on the transactions for Reen Cyber Service. We will learn about the preparation of each statement in detail in Unit 2.
Figure 1.7: Types of business
Let us take a look at Figure 1.7. Generally, businesses are divided into three types, which are sole proprietorship, partnership and company. Sole proprietorship is owned by a single owner while partnership is owned by 2 to 20 owners. Financial statements for these two types of business are not subject to the standards released by MASB. Therefore, there might be several formats used by these two types of business. Companies are divided into private limited and public listed companies. Private limited companies can be owned by 2 to 50 owners. However, there are unlimited number of owners for public listed companies. The preparation of financial
1.4

TOPIC 1 ACCOUNTING ENVIRONMENT 25
statements for companies is subject to the standards released by MASB, whether in the form of accounting method, disclosure and reporting format.
1.4.1 Income Statement
This statement is also known as Profit and Loss statement which lists all the revenues and expenses incurred by the entity for a specific period. The difference between the revenue and expense will result in either net profit or net loss. Excess of revenue over expense will give us net profit, while expense in excess of revenue will give us net loss. Figure 1.8 shows the income statement for Reen Cyber Service for the month ended 30 November 2000.
Reen Cyber Service Income Statement
for the month ended 30 November 2000 RM RM
Service revenue Expenses: Salary expenses Rental expenses Utility expenses Supplies expenses Sundry expenses
4,250 1,600
900 1,600
550
15,000
(8,900)
Net profit 6,100
Figure 1.8: Income statement/Profit and loss statement
1.4.2 Statement of Changes in Owner’s Equity
This statement shows the changes in ownerÊs equity for a specific accounting period. OwnerÊs equity will increase when the owner makes a capital investment or when the entity gains net profit. OwnerÊs equity will decrease when the owner makes drawings or when the entity incurs net loss. Figure 1.9 shows the statement of changes in ownerÊs equity for Reen Cyber Services.

TOPIC 1 ACCOUNTING ENVIRONMENT
26
Reen Cyber Service Statement of Changes in OwnerÊs Equity for the month ended 30 November 2000
Opening Capital 1 November (+) Net profit
(-) Drawings
Closing Capital 30 November
RM 30,000 6,100
36,100 (4,000)
32,100
Figure 1.9: Statement of changes in ownerÊs equity
1.4.3 Balance Sheet
This statement is also known as the financial position statement, listing all the assets, liabilities and ownerÊs equity of the entity on a specific date. The purpose of this statement is to show the financial status of the entity on a specific date. There are two formats normally used, which are the statement format and accounts format. The accounts format places the asset on the left side with liability and ownerÊs equity on the right side (refer to Figure 1.10 and Figure 1.11)
Reen Cyber Service Balance Sheet
as at 30 November 2000
ASSETS RM LIABILITIES AND OWNERÊS EQUITY RM
Current Assets: Liabilities:
Cash 26,800 Current Liabilities:
Supplies 1,100 Account payable 800
27,900 Long-term liabilities:
Fixed Assets: Notes payable 15,000
Land 20,000 Total liabilities 15,800
Owner Equity:
Capital 32,100
TOTAL LIABILITIES AND
TOTAL ASSETS 47,900 OWNERÊS EQUITY 47,900
Figure 1.10: Balance Sheet in accounts format

TOPIC 1 ACCOUNTING ENVIRONMENT 27
In the statement format, the asset, liability and ownerÊs equity are listed vertically.
Reen Cyber Service Balance Sheet
as at 30 November 2000
RM RM
Fixed Assets:
Land 20,000
Current Assets:
Cash 26,800
Supplies 1,100
27,900
( ) Current liabilities:
Account payable (800)
27,100
Net current assets 47,100
Financed by:
OwnerÊs equity:
Capital, Reen 32,100
Long term liabilities:
Notes payable 15,000
47,100
Figure 1.11: Balance Sheet in statement format
1.4.4 Cash Flow Statement
This statement reports all the cash receipts and payments of the entity in a specific period. Through this statement, the users will know the sources of cash received and why cash is paid. The difference between cash inflows and outflows will provide the final cash account balance of the entity. This balance will be the same as the cash amount shown in the Balance Sheet. In the cash flow statement, cash transactions are divided according to the type of activities, which are operating, investing and financing activities. Figure 1.12 shows the cash flow statement for Reen Cyber Services.

TOPIC 1 ACCOUNTING ENVIRONMENT
28
Reen Cyber Services Cash Flow Statement
for the month ended 30 November 2000
RM RM RM Cash from operating activities:
Cash received from customers 15,000 ( ) Expenditure paid 7,300 Payment to supplier 1,900 (9,200) Net cash flow from operating activities 5,800
Cash from investing activities: Payment for purchase of land (5,000) Net cash flow from investing activities (5,000)
Cash flow from financing activities: Investment by owner 30,000 ( ) Drawings by owner (4,000) Net cash flow from financing activities 26,000 Net cash flow for entity and cash account balance as at 30 November 26,800
Figure 1.12: Cash flow statement
Discuss the issues that might arise if a business entity did not disclose the relevant information in its financial statement.

TOPIC 1 ACCOUNTING ENVIRONMENT 29
Further information regarding the professional accounting bodies in Malaysia can be obtained from the following websites: Malaysian Institute of Accountants (MIA) www.mia.org.my
The Malaysian Institute of Certified Public Accountants (MICPA)
www.micpa.com.my
Malaysian Accounting Standards Board (MASB) www.masb.org.my
Financial Reporting Foundation (FRF) www.masb.org.my
EXERCISE 1.4
1. Fill the blanks with the most accurate answer: (a) Financial statement prepared on a yearly basis complies with the
assumption of ______________. (b) The principle that requires the economic resources of the entity
to be recorded at the original cost at time of purchase is the principle of ___________.
(c) _____________ information must have feedback value, forecast value and is presented on a timely basis.
(d) The professional body responsible for setting the accounting standards in Malaysia is _______________________________.
(e) The qualitative characteristic that enables users to depend or rely on the information presented is _____________.
(f) The principle that matches the revenue with the expenses in the specific accounting period is ___________________.
(g) Not all accounting information can be disclosed in detail due to constraints of ___________________ and __________________.
(h) The branch of accounting that prepares specialised information for internal users and not subject to specified standard or format is ______________.
(i) According to the assumption of _____________, the entity is assumed to continue to exist and in operation in the future.
(j) Revenue is normally recognised when ________________. (k) The statement that shows the cash flow of an entity for a specific
period is _______________. (l) ____________________ lists all the assets, liabilities and ownerÊs
equity of an entity in a specific period.

TOPIC 1 ACCOUNTING ENVIRONMENT
30
2. If revenue = RM12,000; expense = RM8,400 and drawings by owner =
RM2,000; how much is the net profit or net loss for that period? A. Net profit RM5,600 B. Net loss RM3,600 C. Net profit RM1,600 D. Net profit RM3,600
3. Which of these is NOT a qualitative characteristic of accounting
information? A. Materiality B. Reliability C. Relevant D. Comparability
4. One example of internal user is:
A. Inland Revenue Board B. Investor C. Creditors D. Management
5. If the total assets increased by RM15,000 and the total liabilities decreased
by RM10,000; ownerÊs equity had: A. increased by RM5,000 B. decreased by RM5,000 C. increased by RM25,000 D. decreased by RM25,000
6. For the purpose of simplifying accounting, the business owner and
business entity are assumed as the same.
True False 7. The accounting period for all businesses must start from 1 January and
ends at 31 December each year.
True False
8. Income statement shows the net profit or loss of a business entity at a specific date.
True False

TOPIC 1 ACCOUNTING ENVIRONMENT 31
9. Determine the appropriate amount in the spaces marked „?‰
ASSET = LIABILITY + OWNERÊS EQUITY
(a) 84,000 = ? + 38,000
(b) ? = 72,000 + 28,000
(c) 125,000 = 50,000 + ?
10. State the effects of the following transactions on the asset, liability and ownerÊs equity. An example is shown in transaction (a):
Transaction Effect
(a) Paid debts to supplier. Asset decreased, Liability decreased.
(b) Purchased office equipment by cash.
(c) Owner took cash from the business for personal use.
(d) Paid staff salary for the current period.
(e) Received cash from customer to settle his account receivable.
(f) Owner contributed office equipment for business use.
11. Mr. Ashwin established a tour agency on 1 June 2001. The transactions
for the month are as follows: (a) Deposited cash into the business account totalling RM20,000. (b) Purchased supplies on credit for RM800. (c) Made payment to supplier for RM620. (d) Received cash on the services provided for RM4,200. (e) Paid staff salary of RM1,000. (f) Paid transportation of RM700 and sundry expenses of RM150. (g) Paid office rental of RM1,200. (h) Charged customer RM2,500 for services provided. (i) Supplies unused at the end of the period is valued at RM250. (j) Mr. Ashwin took cash from the business totalling RM750 for his
personal use.
TOPIC 1 ACCOUNTING ENVIRONMENT
32
Required: (a) State the effect of each transaction and the balance after each
transaction using the accounting equation format that you have learned.
(b) Create the accounting equation for Mr. Ashwin business after the last transaction for that month.
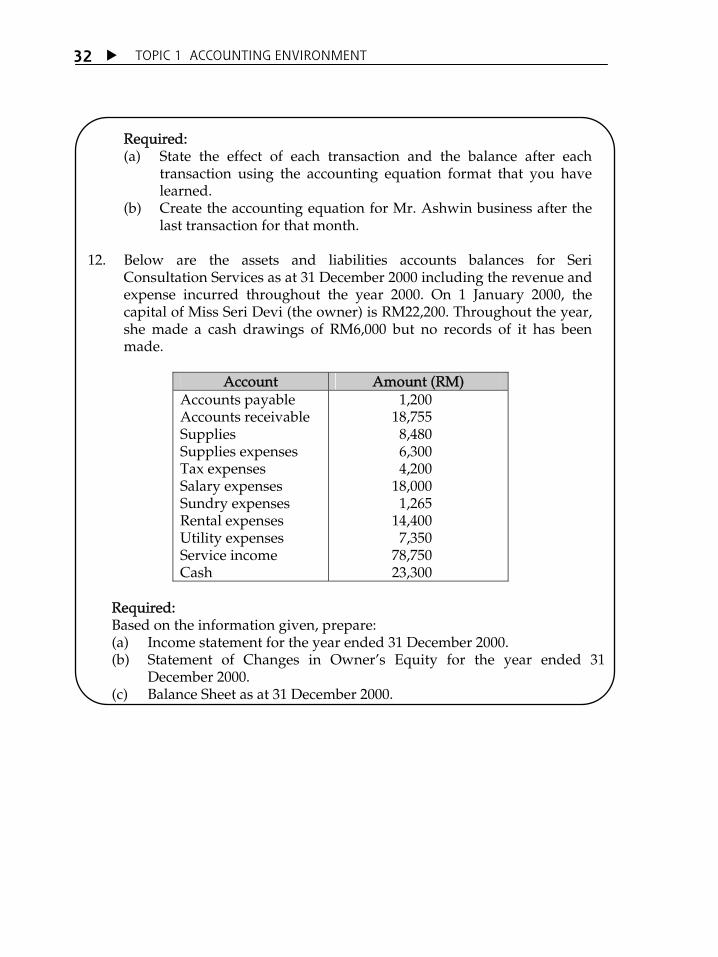
12. Below are the assets and liabilities accounts balances for Seri
Consultation Services as at 31 December 2000 including the revenue and expense incurred throughout the year 2000. On 1 January 2000, the capital of Miss Seri Devi (the owner) is RM22,200. Throughout the year, she made a cash drawings of RM6,000 but no records of it has been made.
Account Amount (RM)
Accounts payable Accounts receivable Supplies Supplies expenses Tax expenses Salary expenses Sundry expenses Rental expenses Utility expenses Service income Cash
1,200 18,755
8,480 6,300 4,200
18,000 1,265
14,400 7,350
78,750 23,300
Required: Based on the information given, prepare:
(a) Income statement for the year ended 31 December 2000. (b) Statement of Changes in OwnerÊs Equity for the year ended 31
December 2000. (c) Balance Sheet as at 31 December 2000.
TOPIC 1 ACCOUNTING ENVIRONMENT 33
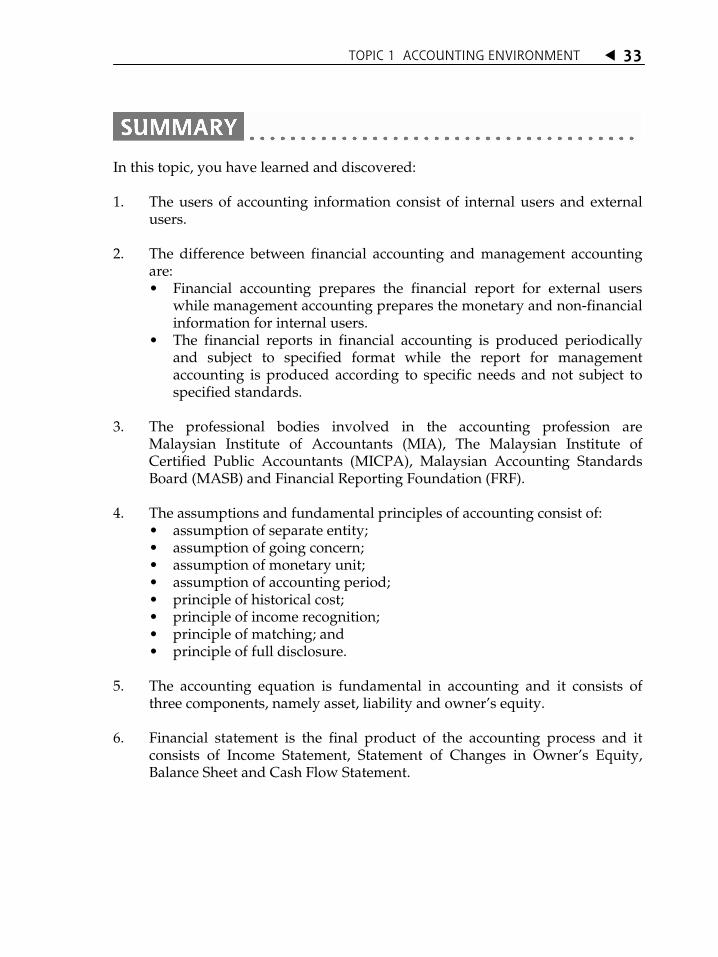
In this topic, you have learned and discovered: 1. The users of accounting information consist of internal users and external
users. 2. The difference between financial accounting and management accounting
are: Financial accounting prepares the financial report for external users
while management accounting prepares the monetary and non-financial information for internal users.
The financial reports in financial accounting is produced periodically and subject to specified format while the report for management accounting is produced according to specific needs and not subject to specified standards.
3. The professional bodies involved in the accounting profession are
Malaysian Institute of Accountants (MIA), The Malaysian Institute of Certified Public Accountants (MICPA), Malaysian Accounting Standards Board (MASB) and Financial Reporting Foundation (FRF).
4. The assumptions and fundamental principles of accounting consist of:
assumption of separate entity; assumption of going concern; assumption of monetary unit; assumption of accounting period; principle of historical cost; principle of income recognition; principle of matching; and principle of full disclosure.
5. The accounting equation is fundamental in accounting and it consists of
three components, namely asset, liability and ownerÊs equity. 6. Financial statement is the final product of the accounting process and it
consists of Income Statement, Statement of Changes in OwnerÊs Equity, Balance Sheet and Cash Flow Statement.

INTRODUCTION
After studying how to analyse transactions, we will now learn about recording. Recording is the most important step in accounting for a business entity. However, before recording, we must identify the event that had occurred. Only events that occur to the business entity will be recorded in the entityÊs book. Not all events are transactions, for example, recruitment of staff. Although it will affect the entity economically, this event is not considered a transaction.
TTooppiicc 22 Recording Process
LEARNING OUTCOMES At the end of this topic, you should be able to: 1. describe the chart of accounts for recording and summarise the effect
of transactions on financial statement; 2. explain the format of accounts used; 3. list the rule of debit and credit for each type of accounts; 4. prepare journal entries; 5. transfer entries to ledger; and 6. prepare trial balance.
TOPIC 2 RECORDING PROCESS 35
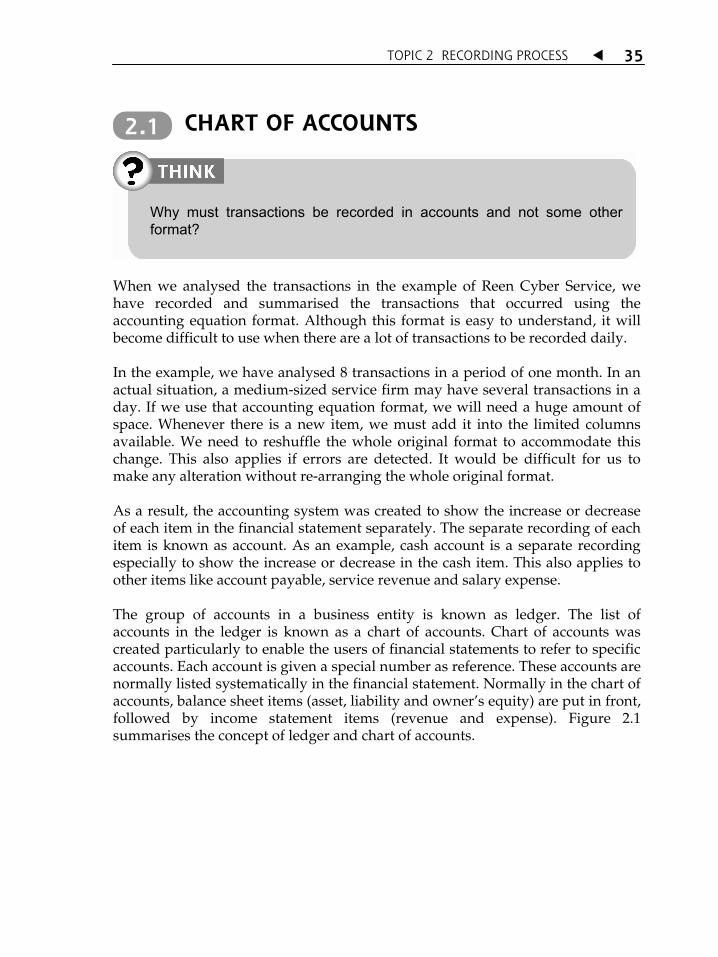
CHART OF ACCOUNTS
When we analysed the transactions in the example of Reen Cyber Service, we have recorded and summarised the transactions that occurred using the accounting equation format. Although this format is easy to understand, it will become difficult to use when there are a lot of transactions to be recorded daily. In the example, we have analysed 8 transactions in a period of one month. In an actual situation, a medium-sized service firm may have several transactions in a day. If we use that accounting equation format, we will need a huge amount of space. Whenever there is a new item, we must add it into the limited columns available. We need to reshuffle the whole original format to accommodate this change. This also applies if errors are detected. It would be difficult for us to make any alteration without re-arranging the whole original format. As a result, the accounting system was created to show the increase or decrease of each item in the financial statement separately. The separate recording of each item is known as account. As an example, cash account is a separate recording especially to show the increase or decrease in the cash item. This also applies to other items like account payable, service revenue and salary expense. The group of accounts in a business entity is known as ledger. The list of accounts in the ledger is known as a chart of accounts. Chart of accounts was created particularly to enable the users of financial statements to refer to specific accounts. Each account is given a special number as reference. These accounts are normally listed systematically in the financial statement. Normally in the chart of accounts, balance sheet items (asset, liability and ownerÊs equity) are put in front, followed by income statement items (revenue and expense). Figure 2.1 summarises the concept of ledger and chart of accounts.
2.1
Why must transactions be recorded in accounts and not some other format?

TOPIC 2 RECORDING PROCESS
36
Figure 2.1: Ledger and chart of accounts
Figure 2.1 explains the chart of accounts clearly. This chart will be used as an example in this topic. New accounts will be introduced in the following units when the entity increases its business scope. The chart is created by the entity itself. Therefore, the chart of accounts between one entity and another entity might be different. For Reen Cyber Service, its chart of accounts consists of only two digits. The first digit will show the type of account (example: 1 for asset account, 2 for liability account, 3 for ownerÊs equity account, 4 for revenue account and 5 for expense account). The second digit will show the account itself. For larger businesses, the chart might consist of three to four digits. If the entity has a branch at different location, the first digit might be used to show the branch location.

TOPIC 2 RECORDING PROCESS 37
Table 2.1: Chart of Accounts for Reen Cyber Service
Accounts in Balance Sheet Accounts in Income Statement
1 ASSETS 11 Cash 12 Account receivable 14 Supplies 15 Insurance prepayment 17 Land 18 Office equipment
4 REVENUE 41 Service revenue
2 LIABILITIES 21 Account payable 22 Notes Payable 23 Deferred Rental
3 OWNERÊS EQUITY 31 Capital, Reen 32 Drawings, Reen
5 EXPENSES 51 Salary expenses 52 Rental expenses 53 Utility expenses 54 Supplies expenses 55 Sundry expenses
FORMAT OF ACCOUNT
Each account has three sections: (a) Title or name of the account, which is the name of the items recorded in that
particular account. (b) Debit section on the left side. (c) Credit section on the right side. The debit and credit section are used to record either the increase or decrease in the specific account. However, do remember that, debit does not necessarily show an increase and that credit does not necessarily show a reduction. It depends on the type of account. This subject will be explained in detail later under the rule of debit and credit.
2.2
EXERCISE 2.1
Which of these events can be considered as a transaction and must be recorded? Please discuss. (a) The death of a branch manager. (b) The capital contribution of the owner into the business.

TOPIC 2 RECORDING PROCESS
38
Accounts are also known as T-accounts due to their shapes that look like the letter T.
Account Title
Debit (left)
Credit (right)
Figure 2.2: T-Account (simple format ) Each section of the T-account should have four columns in the debit section and four columns in the credit section. Debit Account Title Credit
Date Description Reference Amount Date Description Reference Amount
Figure 2.3: T-Account (detailed format ) There is another format of account known as the three column account. Although in fact there are actually six columns in this accountÊs format, the three columns refer to the debit, credit and balance columns. An advantage of this format is that it can show the latest account balance at any particular time.
Date Description Reference Debit Credit Balance
Figure 2.4: Three column account format
RULES OF DEBIT AND CREDIT
2.3
What will happen if the rule of debit and credit are not complied with while recording the business transaction?

TOPIC 2 RECORDING PROCESS 39
We have previously stated that asset, liability and ownerÊs equity are the three main components in the accounting equation. Other items that are involved include drawings, revenue and expense. Every transaction that occurs will involve debit and credit and every transaction will affect at least two accounts. For every transaction, the total debit must be equal to the total credit. This is the basis of the double entry system. This rule of debit and credit is important to ensure that we make accurate recording. Table 2.2 shows the rules of debit and credit for each type of accounts.
Table 2.2: Rules of Debit and Credit
Type of Account Increase Decrease Asset Debit Credit
Liability Credit Debit Capital Credit Debit
Drawings Debit Credit Revenue Credit Debit Expense Debit Credit
Do you understand the rules listed in Table 2.2? Table 2.2 shows that when the asset account increases, we will debit the said account. For example, when the entity receives cash, we will debit cash account. When the asset account decreases, we will credit the said account. For example, when the entity made cash payment, we will credit the entityÊs cash account. Referring to Table 2.2, we will discover that the nature of the asset account is opposite to that of the liability and ownerÊs equity accounts. To observe this more clearly, please refer back to the accounting equation we had learned:
The asset item is on the left side while the liability and ownerÊs equity are on the right side. Asset is the economic resources owned by the entity while liability and owner equity are parties claiming ownership on the asset. Therefore, asset is the opposite of liability and ownerÊs equity.
2.3.1 Normal Balance
Normal balance is included in the rule of debit and credit. This refers to the balance ordinarily shown in the account.
ASSET = LIABILITY + OWNERÊS EQUITY

TOPIC 2 RECORDING PROCESS
40
Let us take the asset account as an example. When asset increases, the account is debited. When asset decreases, the account is credited. Therefore, the normal balance for asset account is debit. This is because the reduction in asset normally would not exceed the increase that had occurred. As a simple example, if we have cash of RM1,000 in the bank, normally we cannot withdraw more than the said value. Table 2.3 shows the rules of debit and credit including the normal balances for each type of accounts.
Table 2.3: The Rules of Debit and Credit Including Normal Balances
Type of Account Increase Decrease Normal Balance Asset Debit Credit Debit
Liability Credit Debit Credit Capital Credit Debit Credit
Drawings Debit Credit Debit Revenue Credit Debit Credit Expense Debit Credit Debit
Note that the normal balance for each account is the same as the increase in the said account. The rule of normal balance is important as it may help you to identify errors. For example, if the land account has a credit balance, you might have made a mistake in recording. However, you must also remember that normal balance is the balance that is ordinarily shown. The cash account that normally has a debit balance can also have a credit balance. This occurs when a company has withdrawn more cash than what is available. This might occur if the company has an overdraft agreement with the bank. When an entity has an overdraft agreement with the bank, it will be allowed to withdraw more money than what it is available in its account. The amount that can be withdrawn is subject to agreement.
Identify the characteristics that allow an event to be viewed as a transaction and therefore must be recorded?

TOPIC 2 RECORDING PROCESS 41
STEPS IN RECORDING PROCESS
Once the entityÊs transactions are identified, they must be recorded according to the accounting procedure specified. Recording begins with journal entry, then post to ledger and finally preparation of trial balance. This process can be illustrated in Figure 2.5.
Figure 2.5: Steps in recording process
2.4.1 Journal
Journal is the first book to be used in the recording process. Recording in journals (journalising) is the first process of recording. Transactions are recorded chronologically in the journal before been transferred to ledger. There are two main types of journal, the general journal and special journal. (a) General Journal General journal is the journal normally owned by all entities. This journal
can be used to record all kinds of transaction like sales, purchases, cash receipts and cash payments.
(b) Special Journal Large businesses normally have many transactions. Special journals are
created to avoid confusion due to many entries made in the general journal. The type of special journal created depends on the needs of the entity.
For example, an entity that have numerous cash transactions might want to
create Cash Receipts Journal and Cash Payment Journal that will be specially used for cash transactions. All the other transactions can still be recorded in the General Journal. This segregation will simplify recording and control. Among the special journals that are commonly used are:
2.4

TOPIC 2 RECORDING PROCESS
42
(i) Purchase Journal: particularly for recording purchases of goods on credit.
(ii) Sales Journal: particularly for recording sales of goods on credit. (iii) Cash Receipt Journal: particularly for recording all cash received. (iv) Cash Payment Journal: particularly for recording all cash payment.
However, this course will only emphasise to the general journal. The format of general journal is shown in Figure 2.6.
Figure 2.6: Format of general journal
It is important to ensure that journalising is done correctly. This is because these information will be transferred to ledger for the purpose of preparing the financial statement. Errors made in the journal will result in errors in the financial statement. The name of accounts used must be specified in the beginning and used consistently in order to avoid confusion.
2.4.2 Journalising and Posting of Entry
After the transactions have been recorded in the journal, it will be posted to the ledger. This process is known as transfer of entry or posting. We will now record the transactions of Reen Cyber Service in the General Journal and then post them to the ledger using the T-account format.
In your opinion, what are the appropriate journals for a book shop in a school? Please discuss.

TOPIC 2 RECORDING PROCESS 43
Transaction 1: On I November, Reen invested RM30,000 as capital for Reen Cyber Service business. From our analysis in Topic 1, we know that this transaction will increase the cash and ownerÊs equity by RM30,000. According to the rules of debit and credit, the increase in asset account (cash) will be debited and increase in ownerÊs equity account (capital) will be credited. When recording, note that the name of the account to be debited is listed first, followed by the name of account to be credited. The name of the credited account will be aligned slightly to the right to differentiate it from the account to be debited. Journal entry: General Journal pg 1
Date Description Reference Debit Credit
Nov 1 Cash 30,000
Capital, Reen 30,000
(Cash invested by Reen)
Journal 1: General Journal for Transaction 1 Post to ledger:
Cash
Nov 1 Capital, Reen 30,000
Capital, Reen
Nov 1 Cash 30,000
Ledger 1: Ledger for Transaction 1 Transaction 2: On 2 November, the business purchased a piece of land valued at RM20,000. A total of RM5,000 cash had been paid while the balance is financed by bank loan (notes payable). Note that even though this transaction involves more than two accounts, the total amount of debit is still equal to the total amount of credit.
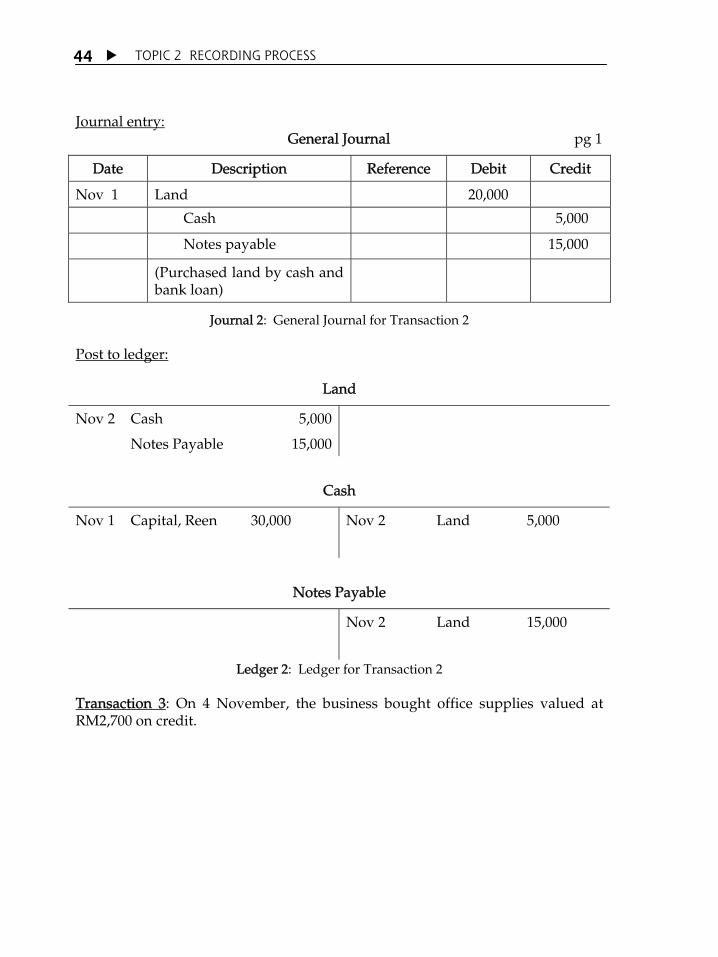
TOPIC 2 RECORDING PROCESS
44
Journal entry: General Journal pg 1
Date Description Reference Debit Credit
Nov 1 Land 20,000
Cash 5,000
Notes payable 15,000
(Purchased land by cash and bank loan)
Journal 2: General Journal for Transaction 2 Post to ledger:
Land
Nov 2 Cash 5,000
Notes Payable 15,000
Cash
Nov 1 Capital, Reen 30,000 Nov 2 Land 5,000
Notes Payable
Nov 2 Land 15,000
Ledger 2: Ledger for Transaction 2
Transaction 3: On 4 November, the business bought office supplies valued at RM2,700 on credit.
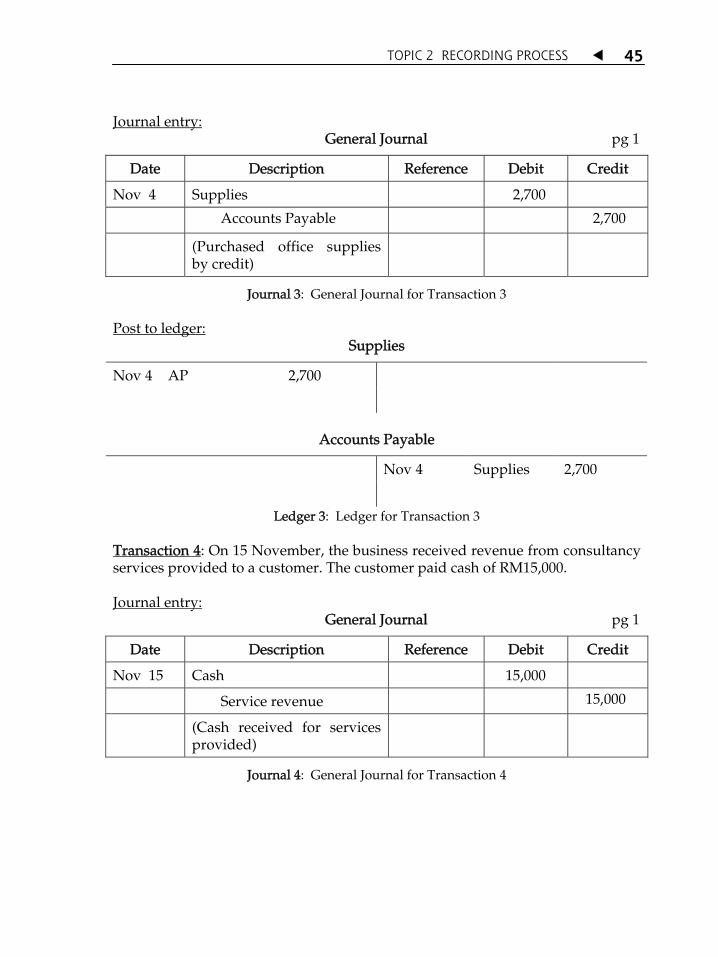
TOPIC 2 RECORDING PROCESS 45
Journal entry: General Journal pg 1
Date Description Reference Debit Credit
Nov 4 Supplies 2,700
Accounts Payable 2,700
(Purchased office supplies by credit)
Journal 3: General Journal for Transaction 3 Post to ledger:
Supplies
Nov 4 AP 2,700
Accounts Payable
Nov 4 Supplies 2,700
Ledger 3: Ledger for Transaction 3
Transaction 4: On 15 November, the business received revenue from consultancy services provided to a customer. The customer paid cash of RM15,000. Journal entry: General Journal pg 1
Date Description Reference Debit Credit
Nov 15 Cash 15,000
Service revenue 15,000
(Cash received for services provided)
Journal 4: General Journal for Transaction 4
TOPIC 2 RECORDING PROCESS
46
Post to ledger: Cash
Nov 1 15
Capital, Reen Service revenue
30,00015,000
Nov 2 Land 5,000
Service revenue
Nov 15 Cash 15,000
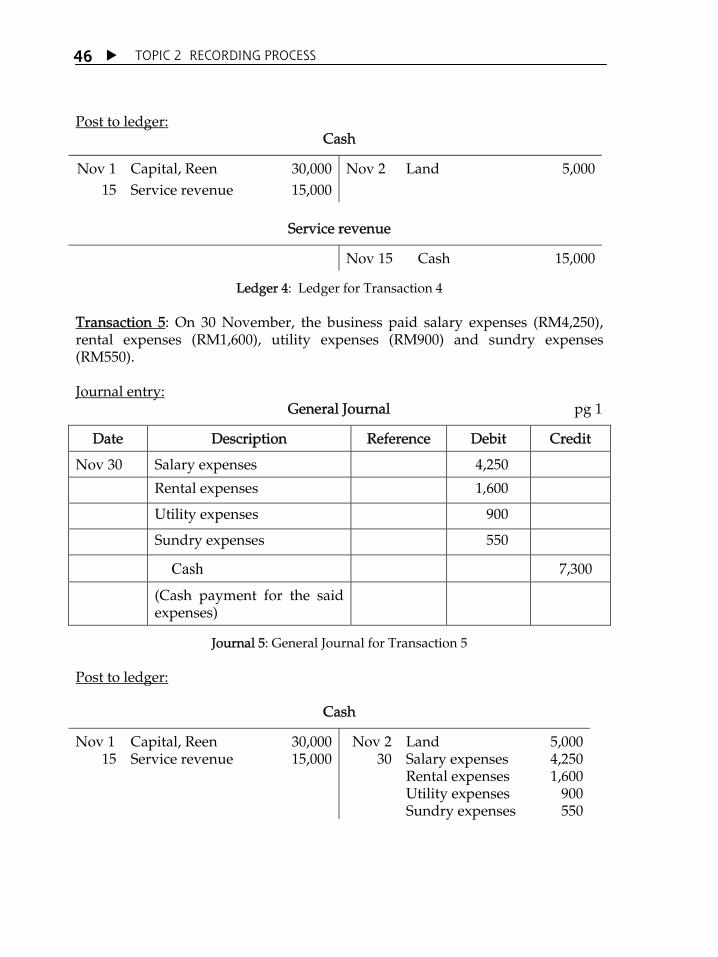
Ledger 4: Ledger for Transaction 4 Transaction 5: On 30 November, the business paid salary expenses (RM4,250), rental expenses (RM1,600), utility expenses (RM900) and sundry expenses (RM550). Journal entry: General Journal pg 1
Date Description Reference Debit Credit
Nov 30 Salary expenses 4,250
Rental expenses 1,600
Utility expenses 900
Sundry expenses 550
Cash 7,300
(Cash payment for the said expenses)
Journal 5: General Journal for Transaction 5 Post to ledger:
Cash
Nov 1 15
Capital, Reen Service revenue
30,00015,000
Nov 230
Land Salary expenses Rental expenses Utility expenses Sundry expenses
5,000 4,250 1,600
900 550

TOPIC 2 RECORDING PROCESS 47
Salary expenses Rental expenses
Nov 30 Cash 4,250 Nov 30 Cash 1,600
Utility expenses Sundry expenses
Nov 30 Cash 900 Nov 30 Cash 550
Ledger 5: Ledger for Transaction 5 Transaction 6: On 30 November, the business paid its debt to the supplier of supplies purchased on 4 November for RM1,900. Journal entry: General Journal pg 1
Date Description Reference Debit Credit
Nov 30 Accounts Payable 1,900
Cash 1,900
(Payment to accounts payable)
Journal 6: General Journal for Transaction 6 Post to ledger:
Cash
Nov 1 15
Capital, Reen Service revenue
30,00015,000
Nov 230
30
Land Salary expenses Rental expenses Utility expenses Sundry expenses Accounts payable
5,000 4,250 1,600
900 550
1,900
Accounts Payable
Nov 30 Cash 1,900 Nov 4 Supplies 2,700
Ledger 6: Ledger for Transaction 6

TOPIC 2 RECORDING PROCESS
48
Transaction 7: Unused office supplies on 30 November were valued at RM1,100. Journal entry: General Journal pg 1
Date Description Reference Debit Credit
Nov 30 Supplies expenses 1,600
Supplies 1,600
(Recording usage of supplies)
Journal 7: General Journal for Transaction 7 Post to ledger:
Supplies
Nov 4 Accounts payable 2,700 Nov 30 Supplies 1,600
Supplies expenses
Nov 30 Supplies 1,600
Ledger 7: Ledger for Transaction 7 Transaction 8: On 30 November, Reen took RM4,000 cash from the business for her personal use. Journal entry: General Journal pg 1
Date Description Reference Debit Credit
Nov 30 Drawings, Reen 4,000
Cash 4,000
(Cash drawings by owner)
Journal 8: General Journal for Transaction 8

TOPIC 2 RECORDING PROCESS 49
Post to ledger: Cash
Nov 1 15
Capital, Reen Service revenue
30,00015,000
Nov 230
3030
Land Salary expenses Rental expenses Utility expenses Sundry expenses Accounts payable Drawings, Reen
5,000 4,250 1,600
900 550
1,900 4,000
Drawings, Reen
Nov 30 Cash 4,000
Ledger 8: Ledger for Transaction 8 How are you doing so far? Can you understand the recording process at this stage? By using the same transactions, we have prepared the journal entries and transferred them to ledger. The journalising and posting process that we have done is a very simple example for you to better understand the basic process, emphasising only on the date, accounts and amounts involved. In the next example, we will perform postings in detail involving reference column.
2.4.3 Example of Analysis and Summary of Transaction
The double entry system is very useful for analysing the effects of transactions. According to the system, every transaction will affect at least two items in the financial statements. In analysing the transactions, three important things that must be dealt with:
(a) Determine whether the transaction will affect the asset, liability, ownerÊs equity, revenue or expense accounts.
(b) For every account involved, determine whether the account will increase or decrease.
(c) Decide whether the increase or decrease should be recorded as debit or credit.

TOPIC 2 RECORDING PROCESS
50
You might feel difficult at this stage to make an analysis, or feel there are too many things to remember. However, with familiarisation and frequent practice, you will find that these three things can be done simultaneously. We will now continue with the example of Reen Cyber Service by extending the transactions to December. In December, we will see more transactions. We will analyse the transactions one by one with emphasis given on the types of transaction that have not been analysed before. The transactions throughout December are listed in Table 2.4.
Table 2.4: Transactions for the month of December
No. Date (Dec 2000) Transactions
1 1 Paid insurance premium of RM4,800 for coverage against losses due to fire and burglary for a period of 24 months.
2 1 Paid office rental for the month of December of RM1,600.
3 1 A company planned to rent the land owned by Reen Cyber Service. The business rented the land for three months for RM720. The tenant paid the amount in cash.
4 4 Purchased office equipment by credit from Office Equipment Sdn. Bhd. totalling RM3,600.
5 6 Paid RM360 to advertise the business in the newspaper.
6 11 Paid RM800 for the transaction on 4 December.
7 13 Paid salary of temporary staff for RM1,900 for the first two weeks of December.
8 16 Received RM6,200 cash from customer for services provided.
9 16 Provided services valued at RM3,500 to a customer. The customer promised to pay next month.
10 20 Made another payment of RM1,800 for transaction on 4 December.
11 21 Customer made payment for account receivable of RM1,300.
12 23 Purchased supplies by cash for RM2,900.
13 27 Paid salary of temporary staff for RM2,400 for the last two weeks of December.
14 31 Paid telephone and electricity bill for the month December for RM620 and RM450 respectively.
15 31 Received cash of RM5,740 from customer on the services provided.
16 31 Billed customer for the services provided of RM2,240.
17 31 Reen made cash drawings of RM4,000.

TOPIC 2 RECORDING PROCESS 51
Transaction 1: Paid insurance premium for 24 months totalling RM4,800. Have you ever paid insurance premium? If you own a vehicle, you will be familiar with paying insurance premium. Insurance premium must be paid at the beginning of the coverage period. Payment made in advance is known as prepaid expenses and it is an asset. The asset you get is the insurance coverage for 24 months starting from 1 December 2000.
Analysis 1 and 2: Accounts involved and effects of transaction
Prepaid insurance account (asset) increased by RM4,800. Cash account (asset) reduced by RM4,800.
Analysis 3: Rule of debit and credit
Prepaid insurance account (asset) increased: debit Cash account (asset) reduced: credit
Journal entry: General Journal pg 1
Date Description Reference Debit Credit
Dec 1 Prepaid insurance L15 4,800
Cash L11 4,800
(Paid insurance premium for 24 months)
Journal 9: General Journal for Transaction 1 Post to ledger:
Prepaid Insurance Account No: 15
Date Description Reference Debit Credit Balance
Dec 1 Cash J2 4,800
Cash Account No: 11
Date Description Reference Debit Credit Balance
Dec 1 Prepaid insurance J2 4,800
Ledger 9: Ledger for Transaction 1

TOPIC 2 RECORDING PROCESS
52
In this example, we did not use the T-account format. Instead, we used the three column account format to make you more familiar with the different types of accounting format available. This format is better as it can show the balance after each transaction. The balance column is supposed to show final balance after each transaction including the previous transactions in November. However, in this section, the column is left blank to avoid confusion. After completing all the transactions, we will combine all the processes of journal entries and entry post to ledger. After that, you will be able to understand better the function of the balance column in this three column account format. Note that for reference purposes, the account number (refer to the chart of accounts in section 1) must be recorded in the Reference column in the journal, while the page of general journal is recorded in the Reference column in the accounts. Transaction 2: Paid RM1,600 rental for the month of December . This transaction is prepaid expense as the rental expenses was paid at the beginning of December. However, it is different from transaction 1 in terms of the coverage period. In transaction 1, the premium paid was for a period of 24 months. In this transaction, the rental paid was only for one month. For such a short period, we normally do not use the prepaid rental account. This is easier as we need not make any adjustments at the end of the period. Analysis 1 and 2: Accounts involved and effects of transaction
Rental expenses account (expense) increased by RM1,600. Cash account (asset) reduced by RM1,600.
Analysis 3: Rule of debit and credit
Rental expenses account (expense) increased: debit Cash account (asset) reduced: credit
Journal entry: General Journal pg 1
Date Description Reference Debit Credit
Dec 1 Rental expenses L52 1,600
Cash L11 1,600
(Paid rental expenses for December month)
Journal 10: General Journal for Transaction 2
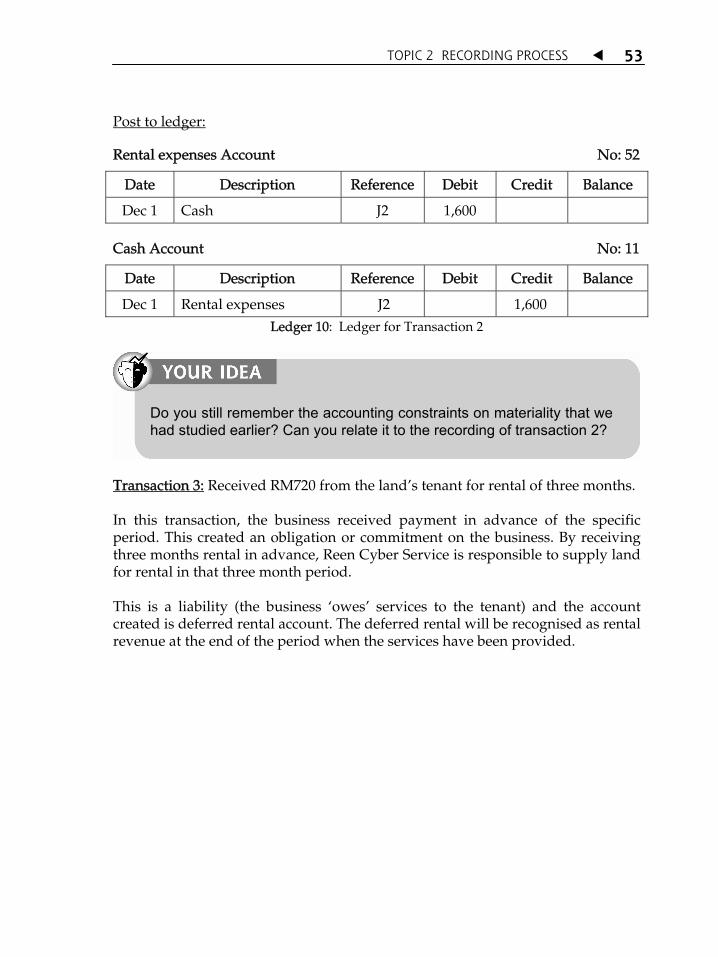
TOPIC 2 RECORDING PROCESS 53
Post to ledger:
Rental expenses Account No: 52
Date Description Reference Debit Credit Balance
Dec 1 Cash J2 1,600
Cash Account No: 11
Date Description Reference Debit Credit Balance
Dec 1 Rental expenses J2 1,600 Ledger 10: Ledger for Transaction 2
Transaction 3: Received RM720 from the landÊs tenant for rental of three months. In this transaction, the business received payment in advance of the specific period. This created an obligation or commitment on the business. By receiving three months rental in advance, Reen Cyber Service is responsible to supply land for rental in that three month period. This is a liability (the business ÂowesÊ services to the tenant) and the account created is deferred rental account. The deferred rental will be recognised as rental revenue at the end of the period when the services have been provided.
Do you still remember the accounting constraints on materiality that we had studied earlier? Can you relate it to the recording of transaction 2?

TOPIC 2 RECORDING PROCESS
54
Analysis 1 and 2: Accounts involved and effects of transaction
Cash account (asset) increased by RM720. Deferred rental account (liability) increased by RM720.
Analysis 3: Rule of debit and credit
Cash account (asset) increased: debit Deferred rental account (liability) increased: credit
Journal entry: General Journal pg 1
Date Description Reference Debit Credit
Dec 1 Cash L11 720
Deferred rental L23 720
(Cash received for three months rental)
Journal 11: General Journal for Transaction 3 Post to ledger:
Cash Account No: 11
Date Description Reference Debit Credit Balance
Dec 1 Deferred rental J2 720
Deferred rental Account No: 23
Date Description Reference Debit Credit Balance
Dec 1 Rental expenses J2 720
Ledger 11: Ledger for Transaction 3
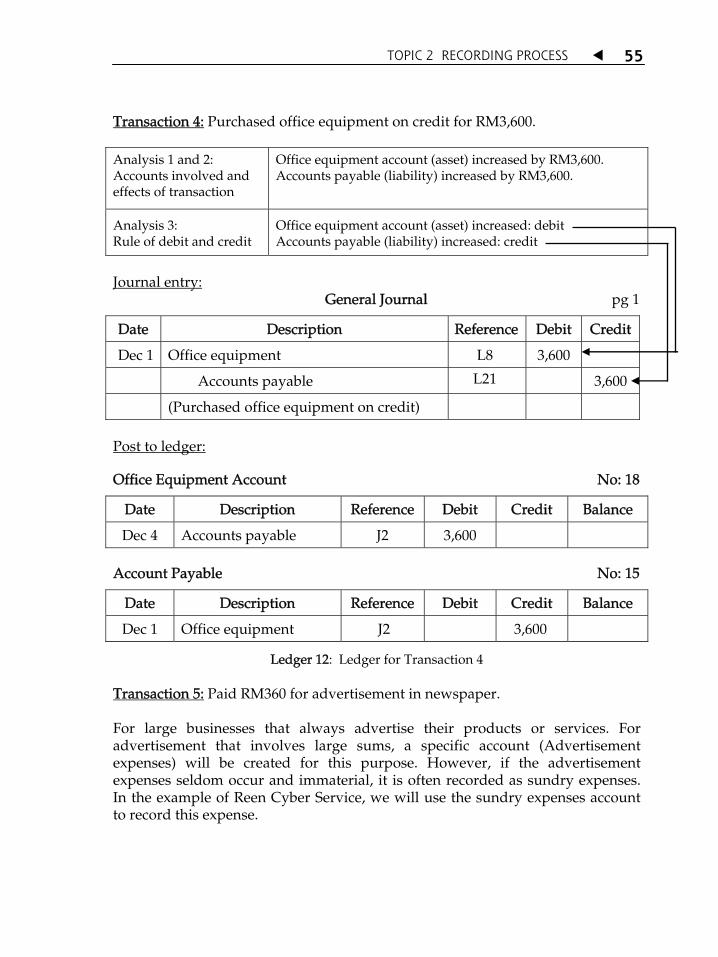
TOPIC 2 RECORDING PROCESS 55
Transaction 4: Purchased office equipment on credit for RM3,600. Analysis 1 and 2: Accounts involved and effects of transaction
Office equipment account (asset) increased by RM3,600. Accounts payable (liability) increased by RM3,600.
Analysis 3: Rule of debit and credit
Office equipment account (asset) increased: debit Accounts payable (liability) increased: credit
Journal entry: General Journal pg 1
Date Description Reference Debit Credit
Dec 1 Office equipment L8 3,600
Accounts payable L21 3,600
(Purchased office equipment on credit) Post to ledger:
Office Equipment Account No: 18
Date Description Reference Debit Credit Balance
Dec 4 Accounts payable J2 3,600
Account Payable No: 15
Date Description Reference Debit Credit Balance
Dec 1 Office equipment J2 3,600
Ledger 12: Ledger for Transaction 4 Transaction 5: Paid RM360 for advertisement in newspaper. For large businesses that always advertise their products or services. For advertisement that involves large sums, a specific account (Advertisement expenses) will be created for this purpose. However, if the advertisement expenses seldom occur and immaterial, it is often recorded as sundry expenses. In the example of Reen Cyber Service, we will use the sundry expenses account to record this expense.

TOPIC 2 RECORDING PROCESS
56
Analysis 1 and 2: Accounts involved and effects of transaction
Sundry expenses account (expense) increased by RM360. Cash account (asset) decreased by RM360
Analysis 3: Rule of debit and credit
Sundry expenses account (expense) increased: debit Cash account (asset) decreased: credit
Journal entry: General Journal pg 2
Date Description Reference Debit Credit
Dec 6 Sundry expenses L55 360
Cash L11 360
(Payment for advertisement expenses)
Journal 13: General Journal for Transaction 5 Post to ledger:
Sundry Expenses Account No: 55
Date Description Reference Debit Credit Balance
Dec 6 Cash J2 360
Cash Account No: 11
Date Description Reference Debit Credit Balance
Dec 6 Sundry expenses J2 360
Ledger 13: Ledger for Transaction 5
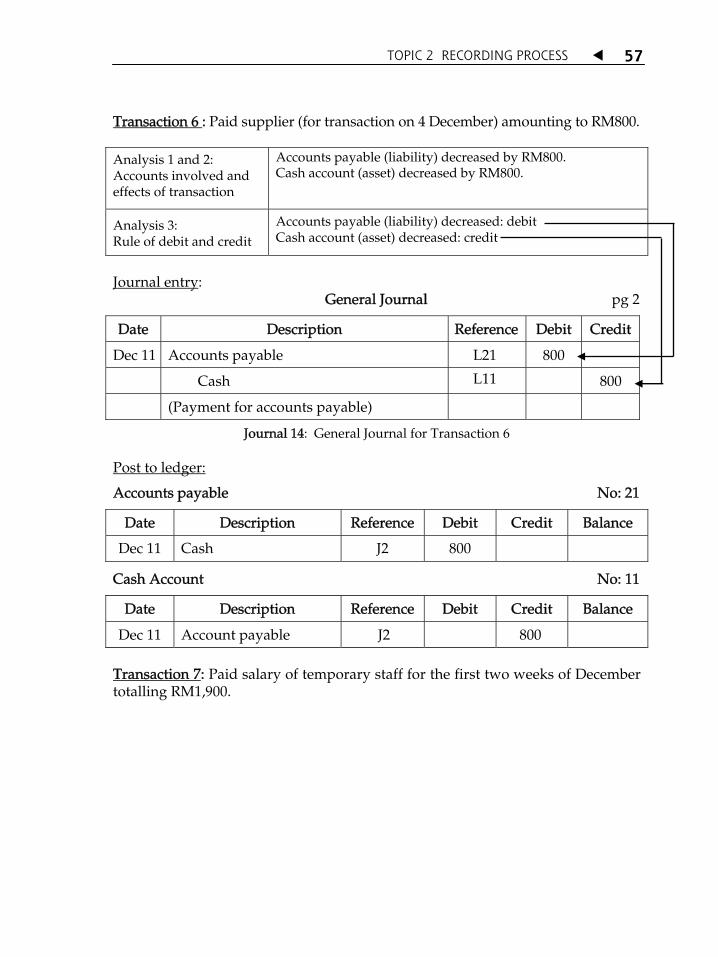
TOPIC 2 RECORDING PROCESS 57
Transaction 6 : Paid supplier (for transaction on 4 December) amounting to RM800. Analysis 1 and 2: Accounts involved and effects of transaction
Accounts payable (liability) decreased by RM800. Cash account (asset) decreased by RM800.
Analysis 3: Rule of debit and credit
Accounts payable (liability) decreased: debit Cash account (asset) decreased: credit
Journal entry: General Journal pg 2
Date Description Reference Debit Credit
Dec 11 Accounts payable L21 800
Cash L11 800
(Payment for accounts payable)
Journal 14: General Journal for Transaction 6 Post to ledger:
Accounts payable No: 21
Date Description Reference Debit Credit Balance
Dec 11 Cash J2 800
Cash Account No: 11
Date Description Reference Debit Credit Balance
Dec 11 Account payable J2 800 Transaction 7: Paid salary of temporary staff for the first two weeks of December totalling RM1,900.

TOPIC 2 RECORDING PROCESS
58
Analysis 1 and 2: Accounts involved and effects of transaction
Salary expenses account (expense) increased by RM1,900. Cash account (asset) decreased by RM1,900.
Analysis 3: Rule of debit and credit
Salary expenses account (expense) increased: debit Cash account (asset) decreased: credit
Journal entry: General Journal pg 2
Date Description Reference Debit Credit
Dec 13 Salary expenses L51 1,900
Cash L11 1,900
(Salary payment for temporary staff)
Journal 15: General Journal for Transaction 7 Post to ledger:
Salary expense Account No: 51
Date Description Reference Debit Credit Balance
Dec 13 Cash J2 1,900
Cash Account No: 11
Date Description Reference Debit Credit Balance
Dec 13 Salary expenses J2 1,900
Ledger 15: Ledger for Transaction 7

TOPIC 2 RECORDING PROCESS 59
Transaction 8: Received cash for services provided for RM6,200: Analysis 1 and 2: Accounts involved and effects of transaction
Cash account (asset) increased by RM6,200. Service revenue account (revenue) increased by RM6,200.
Analysis 3: Rule of debit and credit
Cash account (asset) increased: debit Service revenue account (revenue) increased: credit
Journal entry: General Journal pg 2
Date Description Reference Debit Credit
Dec 16 Cash L11 6,200
Service revenue L41 6,200
(Received cash for services provided)
Journal 16: General Journal for Transaction 8 Post to ledger:
Cash Account No: 51
Date Description Reference Debit Credit Balance
Dec 16 Service revenue J2 6,200
Service revenue Account No: 41
Date Description Reference Debit Credit Balance
Dec 16 Cash J2 6,200
Ledger 16: Ledger for Transaction 8

TOPIC 2 RECORDING PROCESS
60
Transaction 9: Billed customer for RM3,500 for services provided. Analysis 1 and 2: Accounts involved and effects of transaction
Accounts receivable (asset) increased by RM3,500. Service revenue account (revenue) increased by RM3,500.
Analysis 3: Rule of debit and credit
Accounts receivable (asset) increased: debit Service revenue account (revenue) increased: credit
Journal entry: General Journal pg 2
Date Description Reference Debit Credit
Dec 16 Accounts receivable L12 3,500
Service revenue L41 3,500
(Billed customer for services provided)
Journal 17: General Journal for Transaction 9 Post to ledger:
Accounts receivable No: 12
Date Description Reference Debit Credit Balance
Dec 16 Service revenue J2 3,500
Service revenue Account No: 41
Date Description Reference Debit Credit Balance
Dec 16 Accounts receivable J2 3,500
Ledger 17: Ledger for Transaction 9
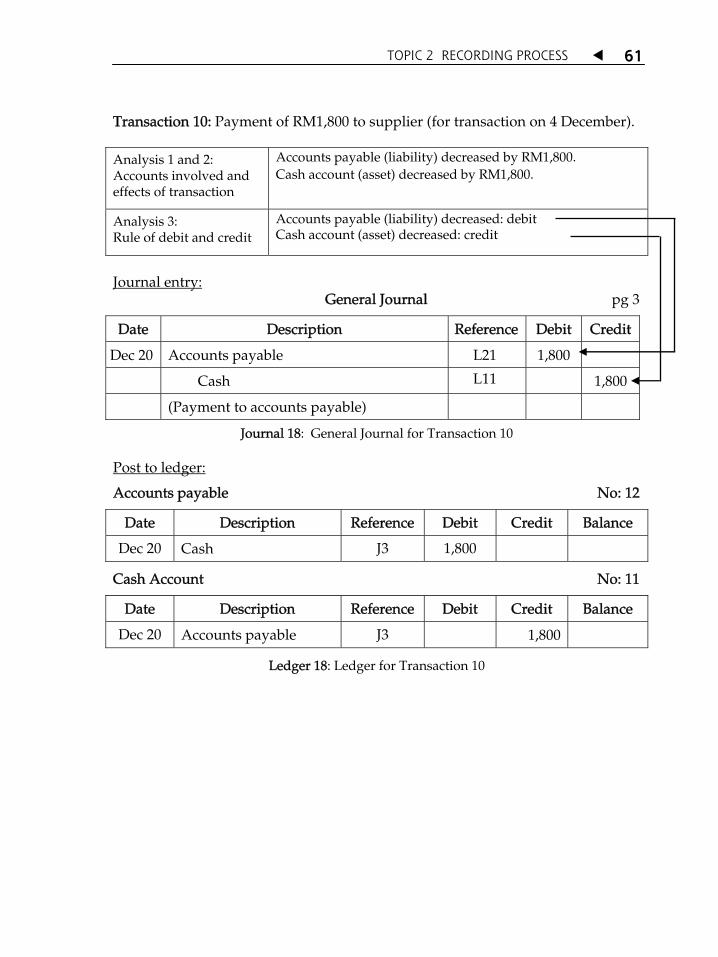
TOPIC 2 RECORDING PROCESS 61
Transaction 10: Payment of RM1,800 to supplier (for transaction on 4 December). Analysis 1 and 2: Accounts involved and effects of transaction
Accounts payable (liability) decreased by RM1,800. Cash account (asset) decreased by RM1,800.
Analysis 3: Rule of debit and credit
Accounts payable (liability) decreased: debit Cash account (asset) decreased: credit
Journal entry: General Journal pg 3
Date Description Reference Debit Credit
Dec 20 Accounts payable L21 1,800
Cash L11 1,800
(Payment to accounts payable)
Journal 18: General Journal for Transaction 10 Post to ledger:
Accounts payable No: 12
Date Description Reference Debit Credit Balance
Dec 20 Cash J3 1,800
Cash Account No: 11
Date Description Reference Debit Credit Balance
Dec 20 Accounts payable J3 1,800
Ledger 18: Ledger for Transaction 10

TOPIC 2 RECORDING PROCESS
62
Transaction 11: Customer paid cash RM1,300 as payment on its accounts receivable. Analysis 1 and 2: Accounts involved and effects of transaction
Cash account (asset) increased by RM1,300 Accounts receivable (asset) decreased by RM1,300
Analysis 3: Rule of debit and credit
Cash account (asset) increased: debit Accounts receivable (asset) decreased: credit
Journal entry: General Journal pg 3
Date Description Reference Debit Credit
Dec 21 Cash L11 1,300
Accounts receivable L12 1,300
(Payment received for accounts receivable)
Journal 19: General Journal for Transaction 11 Post to ledger:
Cash Account No: 11
Date Description Reference Debit Credit Balance
Dec 21 Accounts receivable J3 1,300
Accounts Receivable No: 12
Date Description Reference Debit Credit Balance
Dec 21 Cash J3 1,300
Ledger 19: Ledger for Transaction 11
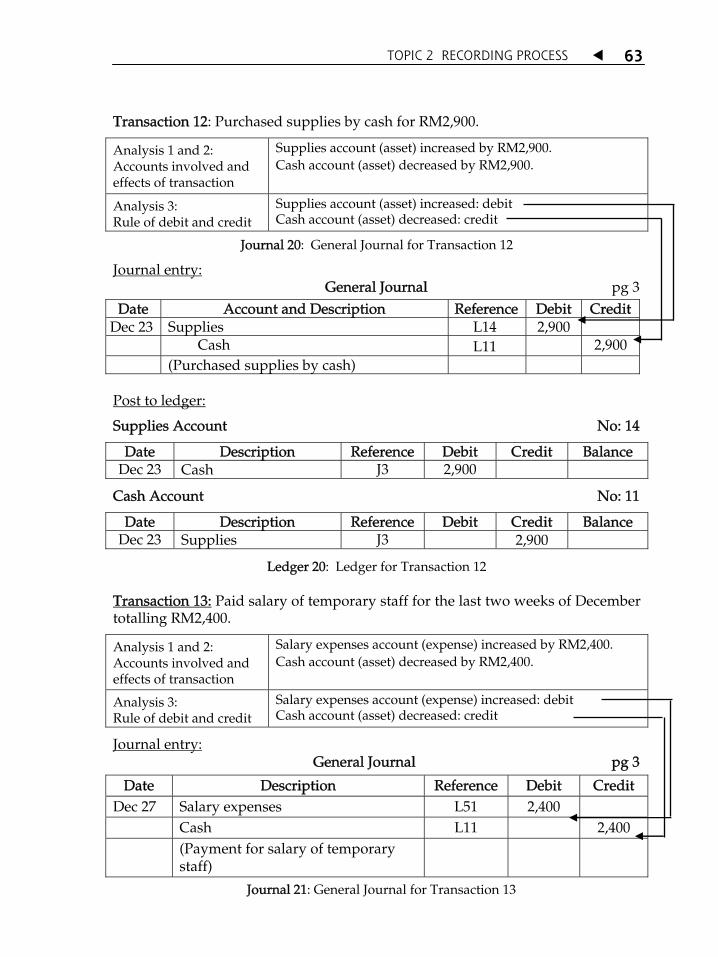
TOPIC 2 RECORDING PROCESS 63
Transaction 12: Purchased supplies by cash for RM2,900.
Analysis 1 and 2: Accounts involved and effects of transaction
Supplies account (asset) increased by RM2,900. Cash account (asset) decreased by RM2,900.
Analysis 3: Rule of debit and credit
Supplies account (asset) increased: debit Cash account (asset) decreased: credit
Journal 20: General Journal for Transaction 12
Journal entry: General Journal pg 3 Date Account and Description Reference Debit Credit
Dec 23 Supplies L14 2,900 Cash L11 2,900 (Purchased supplies by cash) Post to ledger:
Supplies Account No: 14
Date Description Reference Debit Credit Balance Dec 23 Cash J3 2,900
Cash Account No: 11
Date Description Reference Debit Credit Balance Dec 23 Supplies J3 2,900
Ledger 20: Ledger for Transaction 12 Transaction 13: Paid salary of temporary staff for the last two weeks of December totalling RM2,400.
Analysis 1 and 2: Accounts involved and effects of transaction
Salary expenses account (expense) increased by RM2,400. Cash account (asset) decreased by RM2,400.
Analysis 3: Rule of debit and credit
Salary expenses account (expense) increased: debit Cash account (asset) decreased: credit
Journal entry: General Journal pg 3
Date Description Reference Debit Credit Dec 27 Salary expenses L51 2,400 Cash L11 2,400 (Payment for salary of temporary
staff)
Journal 21: General Journal for Transaction 13

TOPIC 2 RECORDING PROCESS
64
Post to ledger:
Salary expenses Account No: 51 Date Description Reference Debit Credit Balance
Dec 27 Cash J3 2,400
Cash Account No: 11 Date Description Reference Debit Credit Balance Dec 27 Salary expenses J3 2,400
Ledger 21: Ledger for Transaction 13 Transaction 14: Made payment for telephone and electricity bill for December, RM620 and RM450, respectively. The payment of bills like electricity, water and telephone are normally grouped into the utility expenses account. This is because the expenses incurred are normally immaterial in terms of amount and significance until the entity has to open a separate account for each type of bill. Therefore, the total utility expenses paid on this date is RM1,070. Analysis 1 and 2: Accounts involved and effects of transaction
Utility expenses account (expense) increased by RM1,070. Cash account (asset) decreased by RM1,070.
Analysis 3: Rule of debit and credit
Utility expenses account (expense) increased: debit Cash account (asset) decreased: credit
Journal entry: General Journal pg 3
Date Description Reference Debit Credit Dec 31 Utility expenses L53 1,070 Cash L11 1,070 (Payment for telephone and electricity bill
for December)
Journal 22: General Journal for Transaction 14
Post to ledger:
Utility expenses Account No: 53 Date Description Reference Debit Credit Balance
Dec 31 Cash J3 1,070
Cash Account No: 11 Date Description Reference Debit Credit Balance
Dec 31 Utility expenses J3 1,070 Ledger 22: Ledger for Transaction 14

TOPIC 2 RECORDING PROCESS 65
Transaction 15: Received cash RM5,740 for services provided.
Analysis 1 and 2: Accounts involved and effects of transaction
Cash account (asset) increased by RM5,740. Service revenue account (revenue) increased by RM5,740.
Analysis 3: Rule of debit and credit
Cash account (asset) increased: debit Service revenue account (revenue) increased: credit
Journal entry: General Journal pg 3
Date Description Reference Debit Credit Dec 31 Cash L11 5,740 Service revenue L41 5,740 (Received cash for services
provided)
Journal 23: General Journal for Transaction 15
Post to ledger:
Cash Account No: 11 Date Description Reference Debit Credit Balance
Dec 31 Service revenue J3 5,740
Service revenue Account No: 41 Date Description Reference Debit Credit Balance
Dec 31 Cash J3 5,740 Ledger 23: Ledger for Transaction 15
Transaction 16: Billed customer for RM2,240 for services provided.
Analysis 1 and 2: Accounts involved and effects of transaction
Accounts receivable (asset) increased by RM2,240 Service revenue account (revenue) increased by RM2,240
Analysis 3: Rule of debit and credit
Accounts receivable (asset) increased: debit Service revenue account (revenue) increased: credit
Journal entry: General Journal pg 3
Date Description Reference Debit Credit Dec 31 Accounts receivable L12 2,240 Service revenue L41 2,240 (Billed customer for services provided)
Journal 24: General Journal for Transaction 16
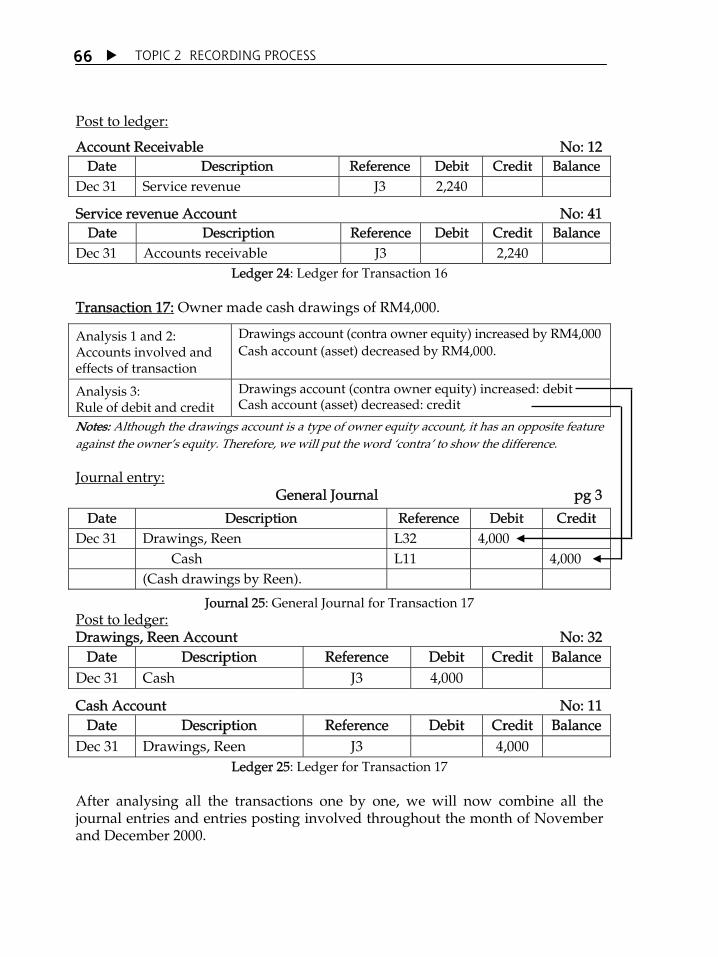
TOPIC 2 RECORDING PROCESS
66
Post to ledger:
Account Receivable No: 12 Date Description Reference Debit Credit Balance
Dec 31 Service revenue J3 2,240
Service revenue Account No: 41 Date Description Reference Debit Credit Balance
Dec 31 Accounts receivable J3 2,240 Ledger 24: Ledger for Transaction 16
Transaction 17: Owner made cash drawings of RM4,000.
Analysis 1 and 2: Accounts involved and effects of transaction
Drawings account (contra owner equity) increased by RM4,000 Cash account (asset) decreased by RM4,000.
Analysis 3: Rule of debit and credit
Drawings account (contra owner equity) increased: debit Cash account (asset) decreased: credit
Notes: Although the drawings account is a type of owner equity account, it has an opposite feature against the ownerÊs equity. Therefore, we will put the word ÂcontraÊ to show the difference. Journal entry: General Journal pg 3
Date Description Reference Debit Credit Dec 31 Drawings, Reen L32 4,000 Cash L11 4,000 (Cash drawings by Reen).
Journal 25: General Journal for Transaction 17 Post to ledger: Drawings, Reen Account No: 32
Date Description Reference Debit Credit Balance Dec 31 Cash J3 4,000
Cash Account No: 11 Date Description Reference Debit Credit Balance
Dec 31 Drawings, Reen J3 4,000 Ledger 25: Ledger for Transaction 17
After analysing all the transactions one by one, we will now combine all the journal entries and entries posting involved throughout the month of November and December 2000.

TOPIC 2 RECORDING PROCESS 67
The following are the general journal entries and postings throughout November and December 2000. GENERAL JOURNAL pg 1
Date Account and Description Reference Debit Credit Nov 1 Cash L11 30,000 Capital, Reen L31 30,000 (Investment by Reen) 2 Land L17 20,000 Cash L11 5,000 Notes payable L22 15,000 (Purchase of land by cash and
bank loan)
4 Supplies L14 2,700 Accounts payable L21 2,700 (Purchase of supplies on credit) 15 Cash L11 15,000 Service revenue L41 15,000 (Received cash for services
provided)
30 Salary expenses L51 4,250 Rental expenses L52 1,600 Utility expenses L53 900 Sundry expenses L55 550 Cash L11 7,300 (Payment of expenses by cash) 30 Account payable L21 1,900
Cash L11 1,900 (Payment to accounts payable) 30 Supplies expenses L54 1,600 Supplies L14 1,600 (Recording of supplies usage) 30 Drawings, Reen L32 4,000 Cash L11 4,000 (Cash drawings by owner)
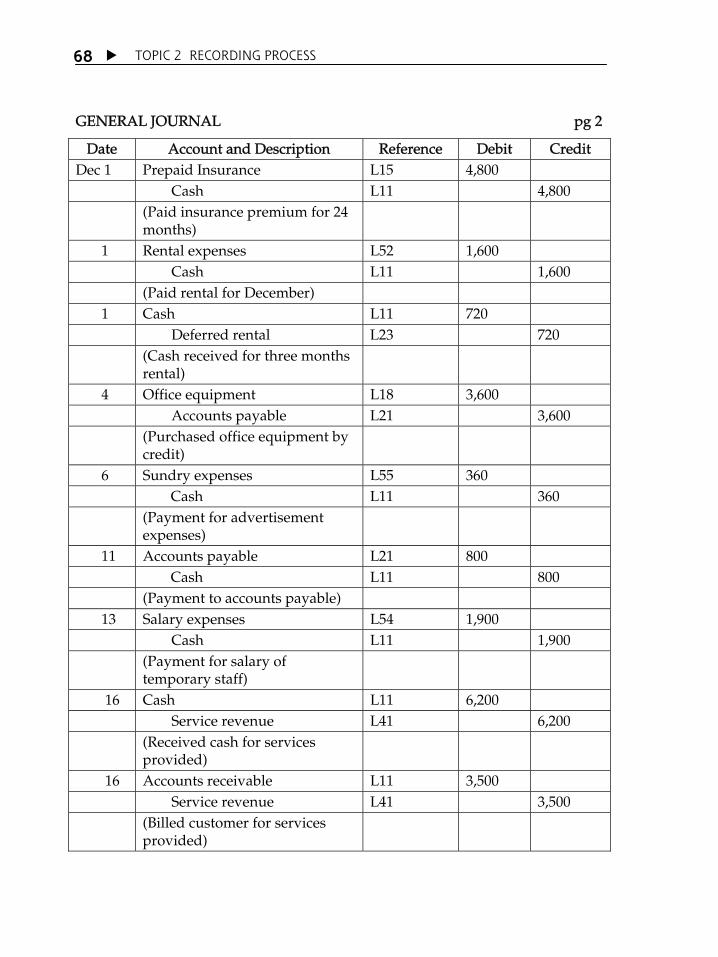
TOPIC 2 RECORDING PROCESS
68
GENERAL JOURNAL pg 2
Date Account and Description Reference Debit Credit Dec 1 Prepaid Insurance L15 4,800 Cash L11 4,800 (Paid insurance premium for 24
months)
1 Rental expenses L52 1,600 Cash L11 1,600 (Paid rental for December) 1 Cash L11 720 Deferred rental L23 720 (Cash received for three months
rental)
4 Office equipment L18 3,600 Accounts payable L21 3,600 (Purchased office equipment by
credit)
6 Sundry expenses L55 360 Cash L11 360 (Payment for advertisement
expenses)
11 Accounts payable L21 800 Cash L11 800 (Payment to accounts payable) 13 Salary expenses L54 1,900 Cash L11 1,900 (Payment for salary of
temporary staff)
16 Cash L11 6,200 Service revenue L41 6,200 (Received cash for services
provided)
16 Accounts receivable L11 3,500 Service revenue L41 3,500 (Billed customer for services
provided)

TOPIC 2 RECORDING PROCESS 69
GENERAL JOURNAL pg 3
Date Account and Description Reference Debit Credit Dec 20 Accounts payable L12 1,800 Cash L11 1,800 (Payment to accounts payable) 21 Cash L11 1,300 Accounts receivable L12 1,300 (Received payment for accounts
receivable)
23 Supplies L14 2,900 Cash L11 2,900 (Purchased of supplies by cash) 27 Salary expenses L54 2,400 Cash L11 2,400 (Payment for salary of temporary staff) 31 Utility expenses L53 1,070 Cash L11 1,070 (Payment of telephone and electricity
bill)
31 Cash L11 5,740 Service revenue L41 5,740 (Received cash for services provided) 31 Accounts receivable L12 2,240 Service revenue L41 2,240 (Billed customer for services provided) 31 Drawings, Reen L32 4,000 Cash L11 4,000 (Cash drawings by owner)
Journal 26: General Journal for Reen Cyber Service for the month of November and
December 2000.
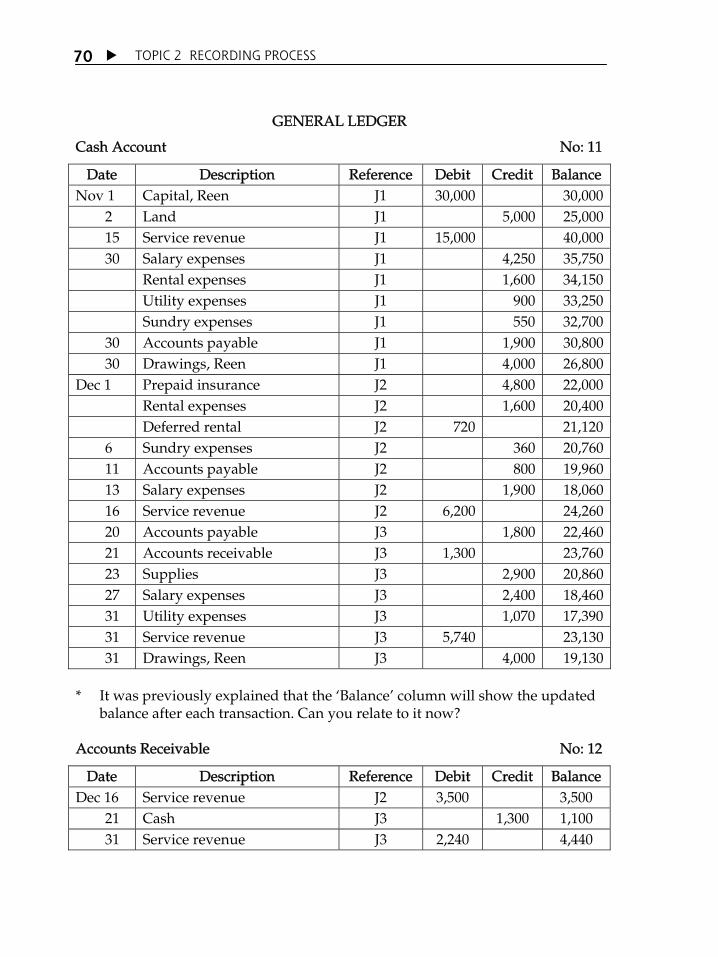
TOPIC 2 RECORDING PROCESS
70
GENERAL LEDGER
Cash Account No: 11
Date Description Reference Debit Credit Balance Nov 1 Capital, Reen J1 30,000 30,000 2 Land J1 5,000 25,000 15 Service revenue J1 15,000 40,000 30 Salary expenses J1 4,250 35,750 Rental expenses J1 1,600 34,150 Utility expenses J1 900 33,250 Sundry expenses J1 550 32,700 30 Accounts payable J1 1,900 30,800 30 Drawings, Reen J1 4,000 26,800 Dec 1 Prepaid insurance J2 4,800 22,000 Rental expenses J2 1,600 20,400 Deferred rental J2 720 21,120 6 Sundry expenses J2 360 20,760 11 Accounts payable J2 800 19,960 13 Salary expenses J2 1,900 18,060 16 Service revenue J2 6,200 24,260 20 Accounts payable J3 1,800 22,460 21 Accounts receivable J3 1,300 23,760 23 Supplies J3 2,900 20,860 27 Salary expenses J3 2,400 18,460 31 Utility expenses J3 1,070 17,390 31 Service revenue J3 5,740 23,130 31 Drawings, Reen J3 4,000 19,130 * It was previously explained that the ÂBalanceÊ column will show the updated
balance after each transaction. Can you relate to it now? Accounts Receivable No: 12
Date Description Reference Debit Credit Balance Dec 16 Service revenue J2 3,500 3,500 21 Cash J3 1,300 1,100 31 Service revenue J3 2,240 4,440

TOPIC 2 RECORDING PROCESS 71
Supplies Account No: 14
Date Description Reference Debit Credit Balance Nov 4 Accounts payable J1 2,700 2,700 30 Supplies expenses J1 1,600 1,100 Dec 23 Cash J3 2,900 4,000 Prepaid insurance Account No: 15
Date Description Reference Debit Credit Balance Dec 1 Cash J2 4,800 4,800 Land Account No: 17
Date Description Reference Debit Credit Balance Nov 2 Cash J1 5,000 5,000 Notes payable J1 15,000 20,000 Office Equipment Account No: 18
Date Description Reference Debit Credit Balance Dec 4 Accounts payable J2 3,600 3,600 Accounts Payable No: 22
Date Description Reference Debit Credit Balance Nov 4 Supplies J1 2,700 2,700 30 Cash J1 1,900 800 Dec 4 Supplies J2 3,600 4,400 11 Cash J2 800 3,600 20 Cash J3 1,800 1,800 Notes Payable Account No: 22
Date Description Reference Debit Credit Balance Nov 2 Land J1 15,000 15,000 Deferred Rental Account No: 23
Date Description Reference Debit Credit Balance Dec 1 Cash J2 720 720

TOPIC 2 RECORDING PROCESS
72
Capital, Reen Account No: 31
Date Description Reference Debit Credit Balance Nov 1 Cash J1 30,000 30,000 Drawings, Reen Account No: 32
Date Description Reference Debit Credit Balance Nov 30 Cash J1 4,000 4,000 Dec 31 Cash J3 4,000 8,000 Service Revenue Account No: 41
Date Description Reference Debit Credit Balance Nov 15 Cash J1 15,000 15,000 Dec 16 Cash J2 6,200 21,200 Accounts receivable J2 3,500 24,700 31 Cash J3 5,740 30,440 Accounts receivable J3 2,240 32,680 Salary Expenses Account No: 51
Date Description Reference Debit Credit Balance Nov 30 Cash J1 4,250 4,250 Dec 13 Cash J2 1,900 6,150 27 Cash J3 2,400 8,550 Rental Expenses Account No: 52
Date Description Reference Debit Credit Balance Nov 30 Cash J1 1,600 1,600 Dec 1 Cash J2 1,600 3,200 Utility Expenses Account No: 53
Date Description Reference Debit Credit Balance Nov 30 Cash J1 900 900 Dec 31 Cash J3 1,070 1,970 Supplies Expenses Account No: 54
Date Description Reference Debit Credit Balance Nov 30 Supplies J1 1,600 1,600
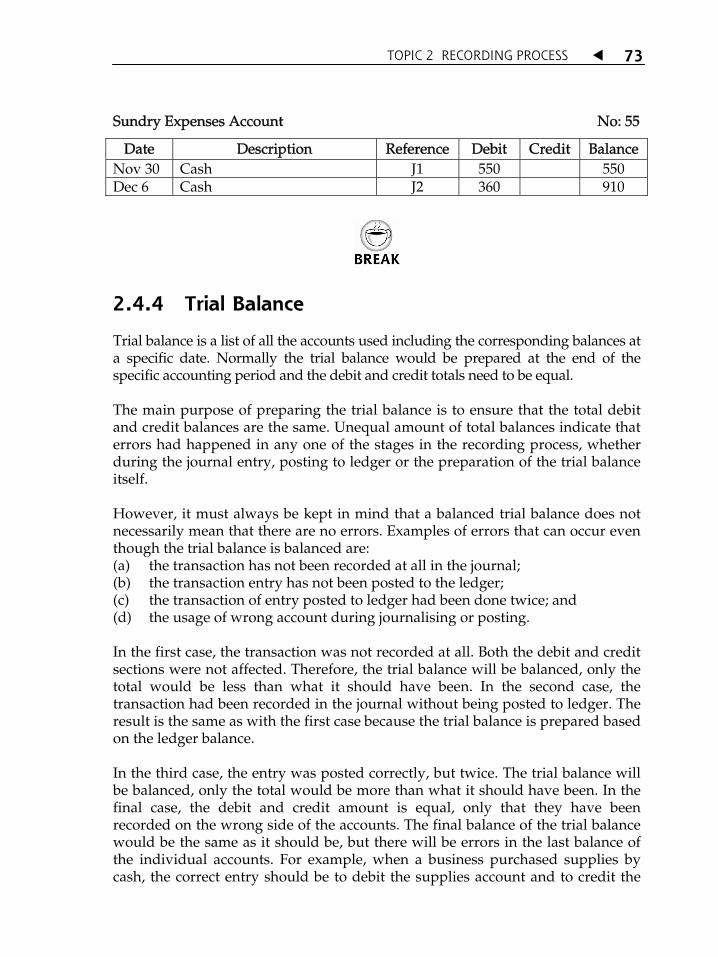
TOPIC 2 RECORDING PROCESS 73
Sundry Expenses Account No: 55
Date Description Reference Debit Credit Balance Nov 30 Cash J1 550 550 Dec 6 Cash J2 360 910
2.4.4 Trial Balance
Trial balance is a list of all the accounts used including the corresponding balances at a specific date. Normally the trial balance would be prepared at the end of the specific accounting period and the debit and credit totals need to be equal. The main purpose of preparing the trial balance is to ensure that the total debit and credit balances are the same. Unequal amount of total balances indicate that errors had happened in any one of the stages in the recording process, whether during the journal entry, posting to ledger or the preparation of the trial balance itself. However, it must always be kept in mind that a balanced trial balance does not necessarily mean that there are no errors. Examples of errors that can occur even though the trial balance is balanced are: (a) the transaction has not been recorded at all in the journal; (b) the transaction entry has not been posted to the ledger; (c) the transaction of entry posted to ledger had been done twice; and (d) the usage of wrong account during journalising or posting. In the first case, the transaction was not recorded at all. Both the debit and credit sections were not affected. Therefore, the trial balance will be balanced, only the total would be less than what it should have been. In the second case, the transaction had been recorded in the journal without being posted to ledger. The result is the same as with the first case because the trial balance is prepared based on the ledger balance. In the third case, the entry was posted correctly, but twice. The trial balance will be balanced, only the total would be more than what it should have been. In the final case, the debit and credit amount is equal, only that they have been recorded on the wrong side of the accounts. The final balance of the trial balance would be the same as it should be, but there will be errors in the last balance of the individual accounts. For example, when a business purchased supplies by cash, the correct entry should be to debit the supplies account and to credit the
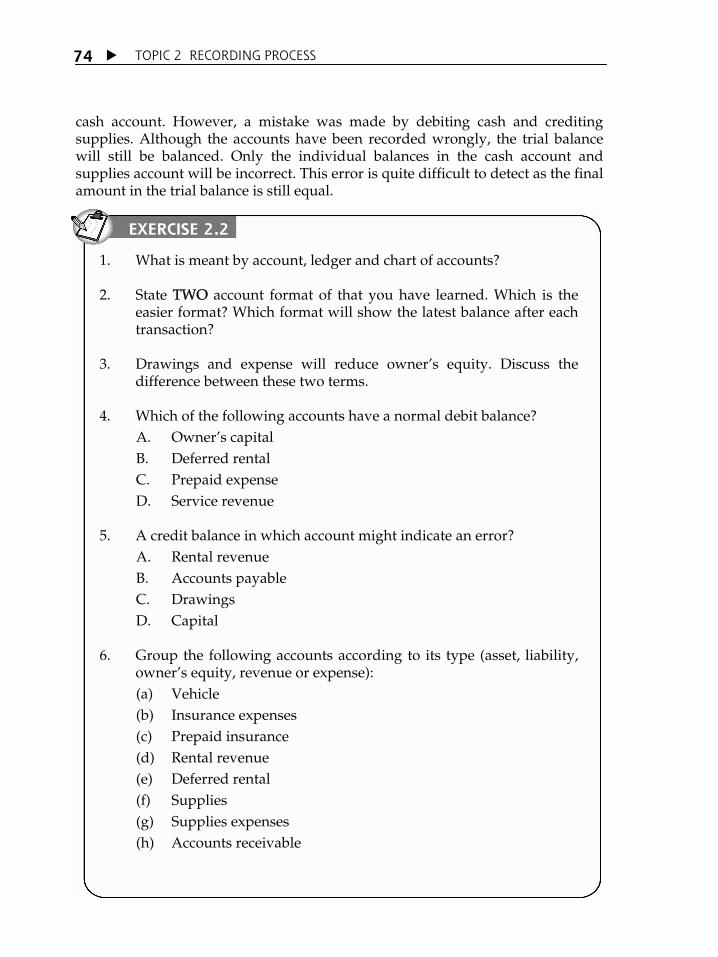
TOPIC 2 RECORDING PROCESS
74
cash account. However, a mistake was made by debiting cash and crediting supplies. Although the accounts have been recorded wrongly, the trial balance will still be balanced. Only the individual balances in the cash account and supplies account will be incorrect. This error is quite difficult to detect as the final amount in the trial balance is still equal.
1. What is meant by account, ledger and chart of accounts? 2. State TWO account format of that you have learned. Which is the
easier format? Which format will show the latest balance after each transaction?
3. Drawings and expense will reduce ownerÊs equity. Discuss the
difference between these two terms. 4. Which of the following accounts have a normal debit balance?
A. OwnerÊs capital B. Deferred rental C. Prepaid expense D. Service revenue
5. A credit balance in which account might indicate an error?
A. Rental revenue B. Accounts payable C. Drawings D. Capital
6. Group the following accounts according to its type (asset, liability,
ownerÊs equity, revenue or expense): (a) Vehicle (b) Insurance expenses (c) Prepaid insurance (d) Rental revenue (e) Deferred rental (f) Supplies (g) Supplies expenses (h) Accounts receivable
EXERCISE 2.2

TOPIC 2 RECORDING PROCESS 75
7. Cindy established Cindy Insurance Agency on 1 April 2001. The effects of all transactions throughout April 2001 are summarised in the following schedule:
Asset = Liability + OwnerÊs Equity
Trans. Cash + AR + Supplies = AP + Capital, Cindy
a. +5,000 +5,000 Capital,
Cindy b. +275 +275 c. +3,250 +3,250
Service revenue
d. 750 -750 Paid rental
expense e. -125 -125 f. +1,875 +1,875
Service revenue
g. -577 -390 Paid utility
expense -187 Paid
sundry expense
h. -1,250 -1,250
Paid salary expense
i. -162 -162 Paid
supplies expenses
j. -500 -50 -550 Drawings,
Cindy
Required: (a) Prepare the journal entries for all the above transactions. (b) Transfer the entries to ledger using the 3 column account format. (c) Prepare the trial balance as at 30 April 2001.

TOPIC 2 RECORDING PROCESS
76
8. The following are the chart of accounts and accounts balances for Edlin Enterprise on 1 February 2001:
Account No Accounts Balance as at 1/2/01
(RM)
101 Cash 15,238
102 Accounts receivable 4,575
104 Supplies 427
108 Office equipment 8,400
201 Accounts payable 1,730
301 Capital, Edlin 26,910
302 Drawings, Edlin
401 Service revenue
501 Rental expenses
502 Advertisement expenses
503 Utility expenses
509 Sundry expenses
Transactions involving Edlin Enterprise throughout the month of
February 2001 are:
Date Transaction
Feb 1 Purchased office supplies by cash RM274.
2 Edlin withdrew cash from business totalling RM2,000 for personal use.
5 Received RM2,740 cash from customer for payment on accounts receivable.
9 Purchased office equipment valued at RM4,000 on credit. The seller agreed to give a discount of RM150 from the amount.
15 Made payment to accounts payable for RM1,200.
18 Received cash for services provided for RM580.
25 Paid RM420 to advertise its business in the newspaper.
28 Paid telephone bills (RM75 for EdlinÊs house and RM135 for business) and electricity bills (RM42 for EdlinÊs house and RM80 for business). All the payments had been made using money from his savings.
29 Paid RM1,200 for rental of business premises.
30 Paid RM220 to repair the office equipment.
TOPIC 2 RECORDING PROCESS 77
The important matters discussed in this topic were:
1. The chart and format of accounts used to present the financial report of an organisation.
2. The rules of debit and credit are fundamental to the double entry system.
3. The rules of normal balance for each type of account are used to assist in identifying errors in recording.
4. Steps in recording beginning from journal entry, posting entries to ledger and preparation of the trial balance.
Required: (a) Prepare the journal entries to record all the above transactions by
using the accounts listed in the chart of accounts for Edlin Enterprise.
(b) Post the entries to ledger by using the three column account format.
(c) Prepare the trial balance as at 28 February 2001.
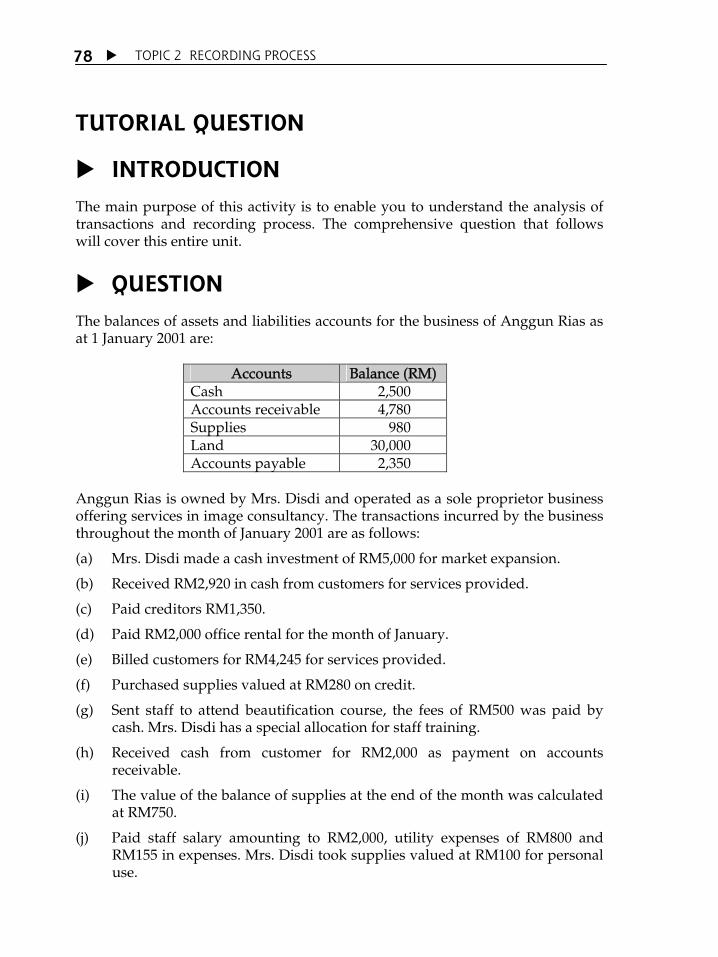
TOPIC 2 RECORDING PROCESS
78
TUTORIAL QUESTION
INTRODUCTION
The main purpose of this activity is to enable you to understand the analysis of transactions and recording process. The comprehensive question that follows will cover this entire unit.
QUESTION
The balances of assets and liabilities accounts for the business of Anggun Rias as at 1 January 2001 are:
Accounts Balance (RM) Cash 2,500 Accounts receivable 4,780 Supplies 980 Land 30,000 Accounts payable 2,350
Anggun Rias is owned by Mrs. Disdi and operated as a sole proprietor business offering services in image consultancy. The transactions incurred by the business throughout the month of January 2001 are as follows:
(a) Mrs. Disdi made a cash investment of RM5,000 for market expansion.
(b) Received RM2,920 in cash from customers for services provided.
(c) Paid creditors RM1,350.
(d) Paid RM2,000 office rental for the month of January.
(e) Billed customers for RM4,245 for services provided.
(f) Purchased supplies valued at RM280 on credit.
(g) Sent staff to attend beautification course, the fees of RM500 was paid by cash. Mrs. Disdi has a special allocation for staff training.
(h) Received cash from customer for RM2,000 as payment on accounts receivable.
(i) The value of the balance of supplies at the end of the month was calculated at RM750.
(j) Paid staff salary amounting to RM2,000, utility expenses of RM800 and RM155 in expenses. Mrs. Disdi took supplies valued at RM100 for personal use.

TOPIC 2 RECORDING PROCESS 79
QUESTION
1. Determine the amount of asset, liability and ownerÊs equity for the business of Anggun Rias as at 1 January 2001.
2. Analyse each transaction using the accounting equation format that you have learned. For each transaction, show the increase or decrease that has occurred. Also show the balance after each transaction.
3. Prepare: (a) Income Statement for the month of January 2001. (b) Statement of Changes in OwnerÊs Equity for the month of January
2001. (c) Balance Sheet as at 31 January 2001. (d) Cash Flow Statement for the month of January 2001.
To resolve this problem, you must:
1. understand what is meant by asset, liability and ownerÊs equity. You must also be familiar with several examples of the common accounts used for each type of account.
2. know the structure of the accounting equation and the effect of transactions on the components in the equation.
3. be familiar with the formats of the four main financial statements in financial reporting.
INTRODUCTION
Financial statement is a summary data on asset, liability and equity as well as income and expenditure of a business for a specific period. Financial statement is used by financial managers to evaluate the companyÊs status and for making the companyÊs future planning. In this chapter, you will learn about the four main financial statements, which are the income statement, balance sheet, statement of retained earnings and cash flow statement. In the beginning, you will be exposed to the basic format of each financial statement. Subsequently, you will learn how to prepare each of the financial statement. Understanding of the financial statements are important as these financial statements will assist in evaluating the companyÊs performance.
TTooppiicc 33 Financial Statements
LEARNING OUTCOMES
At the end of this topic, you should able to:
1. identify the accounts contained in the income statement and in the balance sheet;
2. prepare the statement of retained earnings and cash flow statement; and
3. interpret the financial statements prepared.

TOPIC 3 FINANCIAL STATEMENTS
80
3.1 ANNUAL REPORT AND USERS OF FINANCIAL STATEMENTS
Figure 3.1: Information in the annual report Companies are required to report their businessÊs financial status at the end of each accounting period in the annual report. Annual reports usually contain messagesÊ from the chairman, financial statements and notes explaining the practices and policies adopted in reporting the companyÊs accounts. There are two types of information in an annual report. The first section is the message from the chairman. It reports the companyÊs achievement throughout that year and discusses on new developments that will affect the companyÊs future operations. The second section will report on the basic financial statements such as the income statement, balance sheet, statement of retained earnings and cash flow statement. Financial statements illustrate the operations and financial status of a company. Detailed data are prepared for past two or three years together with a summary
Who are the users of financial statements? What sort or type of information is required by them?

TOPIC 3 FINANCIAL STATEMENTS 81
of the main statistics for the past five or ten years. Normally, financial statements are followed by notes explaining in detail the items found in the statements. These notes explain the policies or accounting practices that were used in the preparation of the financial statements. For example, further notes on inventory might explain the method of inventory recording being adopted by the company. Several groups of users are interested in the information contained in the financial statements. They examine the statements in detail and interpret the information according to their own interests. The objective of the analysis is the evaluation on the specific aspect of the companyÊs performance. The information required by the user depends on the type of intended decision. We can divide the users of financial statements into two groups:
Figure 3.2 Two groups of users of financial statements
(a) Internal users include the manager and other officers that operate the
business. They are responsible in planning the strategies and operations of the company. Therefore, they use the financial statements to obtain information on the overall companyÊs performance.
(b) External users of the company are not directly involved in the operations of
the company. They comprise of users whom have direct interest in the company (such as shareholders, investors and creditors) and users whom have indirect interest in the company (such as customers, tax agent and labour organisations).
Shareholders and potential investors use financial statements to help them to interpret what will happen to the company in the future. Short-term creditors will look at the companyÊs liquidity while long-term creditors look at the ability of the company to settle the interests and payment of the long-term principal debts.

TOPIC 3 FINANCIAL STATEMENTS
82
The Companies Act 1965 stipulates that at least four of the following financial statements must to be included in the annual reports, which are:
• income statements; • balance sheet; • statement of retained earnings; and • cash flow statement Let us look at these financial statements and the relationship between each of them by basing on the financial statements of Company FAZ as an example.
INCOME STATEMENT
Income statement measures the operating performance of a company for a specific period, normally for a period of one year ending at a specific date, usually at 31 December. Monthly statements are also prepared for the usage of the management who required more frequent information to enable more prudent decisions to be made. Yearly quarter statements are also prepared for shareholders of public companies. Income statements provide information to evaluate the firmsÊ performances. To measure a firmÊs performance, several important aspects in the income statement must be given priority: • Sales figure can be compared with the firmÊs sales for the previous year and
the expected sales in the future. This information can be used for the firmÊs future planning.
• Gross profit/gross loss can be compared with the sales figure to show profit from the products/services sold.
• Firm expenditures can be compared with the firmÊs expenditures for the previous year to see which policy can be adopted to reduce costs.
3.2
What are the usages of income statement to the financial operations of a company?

TOPIC 3 FINANCIAL STATEMENTS 83
Table 3.1 is the income statement of Company FAZ for year ended 31 December 2002. This statement starts with sales revenue that is the sales value in ringgit throughout the accounting period. Cost of goods sold is deducted from the sales revenue to obtain gross profit of RM70,000. This total is the amount obtained from sales to cover the financial operating costs and tax. All the operating expenditures such as sales expenses, general and administrative expenses and depreciation expenses will be listed and totalled to obtain the total operating expenditure. This total will then be deducted from the gross profit to obtain profit from operations of RM37,000. Profit from operations is the profit obtained from activities of manufacturing and selling of products; it does not take into account the financial costs and tax. Profit from operations is also known as profit before interest and tax. Thereafter, the financial cost that is the interest expenses of RM7,000 will be deducted from the profit from operations to obtain the profit before tax of RM30,000. After deducting tax, we will obtain profit after tax (or profit before preference shares) of RM18,000. Any dividends for preference shares must be deducted from the profit after tax to obtain net profit. This total is also known as profit available to the ordinary shareholders and is the total obtained by the company on behalf of ordinary shareholders throughout the specific period. Normally, reports on earnings per share are provided at the last section of the income statement. Earnings per share show the total obtained by the company throughout the specific period for each ordinary share. In year 2002, Company FAZ obtained RM17,000 for the ordinary shareholders or RM0.17 for each share issued (total ordinary shares is 100,000). Earnings per share are often referred as the Âbottom lineÊ to show that earnings per share are the most important item in the income statement compared to the other items.

TOPIC 3 FINANCIAL STATEMENTS
84
Figure 3.3: CompanyÊs objectives are to increase earnings and maximise profit
If you are one of the preference shareholders in Company FAZ, how would the information contained in the company’s financial statements be useful to you?
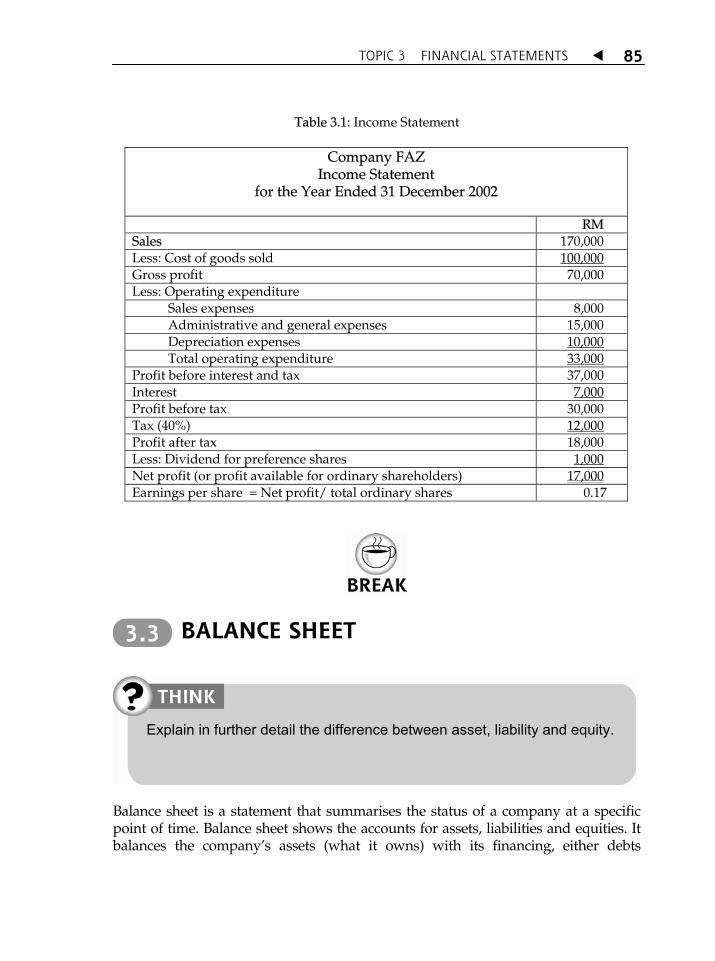
TOPIC 3 FINANCIAL STATEMENTS 85
Table 3.1: Income Statement
Company FAZ Income Statement
for the Year Ended 31 December 2002
RM Sales 170,000 Less: Cost of goods sold 100,000 Gross profit 70,000 Less: Operating expenditure
Sales expenses 8,000 Administrative and general expenses 15,000 Depreciation expenses 10,000 Total operating expenditure 33,000
Profit before interest and tax 37,000 Interest 7,000 Profit before tax 30,000 Tax (40%) 12,000 Profit after tax 18,000 Less: Dividend for preference shares 1,000 Net profit (or profit available for ordinary shareholders) 17,000 Earnings per share = Net profit/ total ordinary shares 0.17
BALANCE SHEET
Balance sheet is a statement that summarises the status of a company at a specific point of time. Balance sheet shows the accounts for assets, liabilities and equities. It balances the companyÊs assets (what it owns) with its financing, either debts
3.3
Explain in further detail the difference between asset, liability and equity.
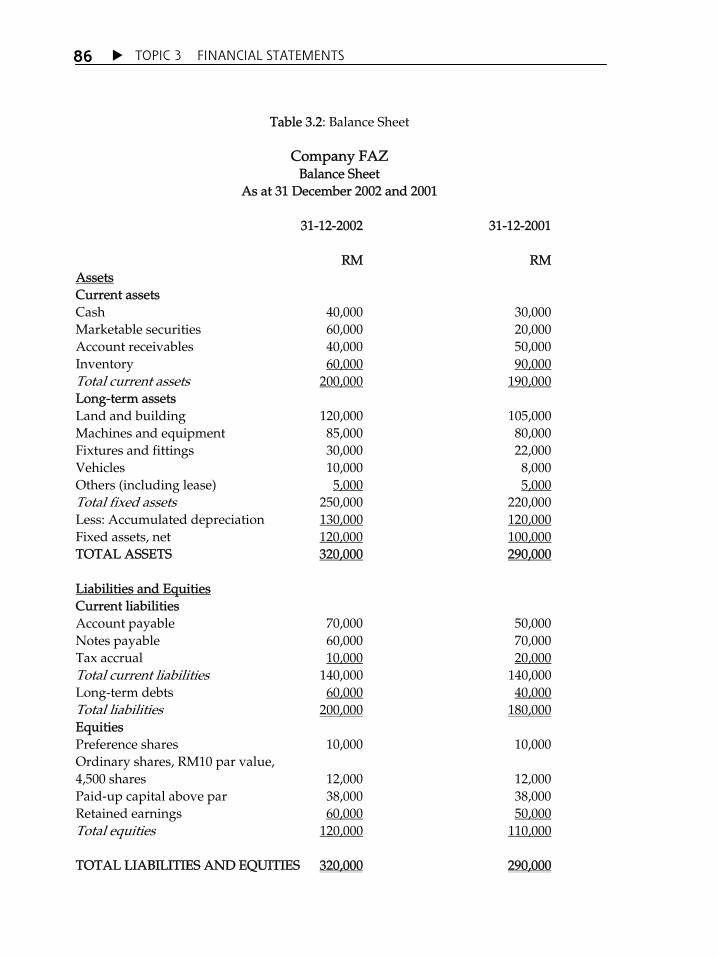
TOPIC 3 FINANCIAL STATEMENTS
86
Table 3.2: Balance Sheet
Company FAZ Balance Sheet
As at 31 December 2002 and 2001 31-12-2002 31-12-2001 RM RM Assets Current assets Cash 40,000 30,000 Marketable securities 60,000 20,000 Account receivables 40,000 50,000 Inventory 60,000 90,000 Total current assets 200,000 190,000 Long-term assets Land and building 120,000 105,000 Machines and equipment 85,000 80,000 Fixtures and fittings 30,000 22,000 Vehicles 10,000 8,000 Others (including lease) 5,000 5,000 Total fixed assets 250,000 220,000 Less: Accumulated depreciation 130,000 120,000 Fixed assets, net 120,000 100,000 TOTAL ASSETS 320,000 290,000 Liabilities and Equities Current liabilities Account payable 70,000 50,000 Notes payable 60,000 70,000 Tax accrual 10,000 20,000 Total current liabilities 140,000 140,000 Long-term debts 60,000 40,000 Total liabilities 200,000 180,000 Equities Preference shares 10,000 10,000 Ordinary shares, RM10 par value, 4,500 shares 12,000 12,000 Paid-up capital above par 38,000 38,000 Retained earnings 60,000 50,000 Total equities 120,000 110,000 TOTAL LIABILITIES AND EQUITIES 320,000 290,000
TOPIC 3 FINANCIAL STATEMENTS 87
3.3.1 Assets
Assets are valuable economy resources owned by the business. It can be used in several activities such as manufacturing, usage and exchange. Assets have Âservice potentialÊ or will Âbring economic benefit in the futureÊ. Assets have the capability to provide services or generate benefit to the business entity that owns it. In businesses, services or economic benefit will generate cash inflow (receiving cash) to the business. Assets can be categorised into current assets and long-term assets. Assets are listed in the balance sheet according to its liquidity level from the most liquid to the less liquid. Therefore, current assets are arranged first, followed by fixed assets. (a) Current Assets Current assets are assets that can be converted into cash in the shortest
period, which is within a year or less. The current assets for Company FAZ comprised of:
• Cash • Marketable securities • Account receivables • Inventory
Cash is the most liquid of current assets. Marketable securities such as government bills or deposit certificates are short-term investments that are highly liquid. Marketable securities can sometimes be seen as a form of cash due to its high liquidity. Account receivables are debts owed by customers who bought goods by credit from the company. Inventory comprised of raw materials, work in process and finished goods held by the company. Other current assets which are not in Company FAZÊs balance sheet are prepaid expenses (prepayment). Prepaid expenses are expenses that have been paid in advance by cash but the benefits from the expenses have not been received. Examples of prepaid expenses are prepaid rental, prepaid insurance and office supplies.
(b) Long-Term Assets Long-term assets are assets that are held by the company for a rather long
period, which is more than a year. Long-term assets are categorised into fixed assets, other long-term assets and intangible assets. The long-term assets of Company FAZ only comprised of fixed assets.
TOPIC 3 FINANCIAL STATEMENTS
88
Fixed assets are land and buildings, machines and equipment, fixtures and fittings and vehicles. Usually, a company will report the total fixed asset that is the original cost of all the fixed assets owned by the company. From that total, the company will deduct the accumulated depreciation for all fixed assets to obtain net fixed assets. All fixed assets must be depreciated except for land. This is because the value of land will always increase while the values of other fixed assets such as machines and equipment, as well as vehicles will decrease when the life span of the asset increases.
Other long-term assets comprise of long-term investments (such as bonds
and shares) prepaid expenses and account receivables that involve a period of more than a year.
Besides current assets and fixed assets, a business might show intangible
assets in its balance sheet. Intangible assets are long-term assets that cannot be physically seen and usually provides a competitive advantage compared to the competitors. Examples of intangible assets are patents, franchise licences, licences, trademarks, copyrights and goodwill. Although these assets cannot be physically seen, it is recorded using the same method as the other fixed assets. This means that the assets will be recorded at its original cost and this cost will be amortised throughout its lifetime. Among the intangible assets that are famous are the patent of Polaroid, the franchise of McDonald and the trademark of Colonel SanderÊs Kentucky Fried Chicken.
3.3.2 Liabilities
Most businesses have been in situations where they need to take loans to finance the businessÊs assets or to buy assets such as raw materials on credit. Liabilities are claims made by creditors on the company assets. In other words, liabilities are debts and obligations of a company. Liabilities comprise of current liabilities and long-term liabilities. If a situation occurs where the company is unable to pay its business liabilities, the creditors can force the company to be liquidated. In this situation, the
If you used a private vehicle to conduct the company’s business, would that vehicle be considered a company’s asset?
TOPIC 3 FINANCIAL STATEMENTS 89
creditorsÊ claims must be settled first before the company can settle the claims of the shareholders. (a) Current Liabilities Current liabilities are short-term debts, or debts that will mature within the
period of one year or less. Company FAZÊs current liabilities are:
• Account payable; • Notes payable; and • Tax accrual
Account payable is the obligation of the company towards its suppliers
when the company purchases raw materials and finished goods on credit. Notes payable is a written obligation of Company FAZ. The obligation is with the Bank for the loan to purchase vehicles for the usage of the company. The company also has tax accrual, that is the tax that must be paid to the government but still outstanding.
Other current liability that is not in the balance sheet of Company FAZ is
deferred income. Deferred income is cash that had been received from customers but the services or products paid had not been provided. Examples of deferred income are deferred rental and deposit from customers.
(b) Long-Term Liabilities
Long-term liabilities are the responsibilities or obligations that mature in a period of more than a year. These claims might be in the type of bonds, long-term notes payable and lease.
Bonds are a type of fixed income securities that are issued by companies. Notes payables are a type of credit transaction that involves a written agreement between the company and creditors. Mortgage loans are long-term loan that use the assets (such as land and buildings) as a mortgage for the loan. Notes payable can also be mortgaged with the other assets as a security for the loan. A lease is a contractual agreement between the lessor and the lessee. The lessor gives the right to the lessee to use the asset for a specific period and will impose charges for usage of the asset.
3.3.3 Owners’ Equity or Shareholder’s Equity
OwnersÊ or shareholdersÊ claim towards the assets are known as ownersÊ equity or shareholdersÊ equity. In the balance sheet of Company FAZ, the ownersÊ equity comprised of:
TOPIC 3 FINANCIAL STATEMENTS
90
(a) preference shares;
(b) ordinary shares;
(c) paid up capital above par; and
(d) retained earnings Preference shares are securities that provide fixed return dividend to its holders. Preference shareholders do not have ownership in the company. Ordinary shares are securities that reflect the ownership of the company. Ordinary shareholders are the real owners of the company. They will receive returns in dividends that will be paid to them in cash or shares (bonus issues). There will be situations where the par value (stated value) is not equal to the market price of the ordinary shares at the time of issue. Cash earnings from the issuance of shares might be equal, more or less from the par value. When this situation occurs, the company will record the issuance of shares at the par value in the Ordinary Shares account and the difference between the par value and the shareÊs selling price (surplus earnings) will be recorded in a separate account known as Paid Up Capital Above Par. Retained earnings are the total accumulated earnings since incorporation that had not been distributed to the shareholders as dividend but was re-invested into the company. It is important to remember that retained earnings are not cash but are earnings that have been used to finance the companyÊs assets.
3.3.4 Summary of Basic Accounting
Assuming that a newly started business was self financed by the businessÊs owner. This means that all the companyÊs assets belongs or claimable by the businessÊs owner. This relationship can be shown by the equation below:
Assets = OwnerÊs Equity However, businesses are normally financed by the businessesÊ owners and creditors. Therefore, claims on the assets are equal to the claims by the creditors (liabilities) added with the claims by the owner of the business (ownerÊs equity) towards the assets. This relationship can be shown in the equation below:
Assets = Liabilities + OwnerÊs Equity

TOPIC 3 FINANCIAL STATEMENTS 91
The equation above is known as the summary of basic accounting where the total assets must be equal to the total liabilities plus owner's equity. Owner's equity is equal to total assets less total liabilities. This is because the assets of a business are financed by either the creditors or the owner. To determine the owner's portion (owner's equity), we must deduct the creditors' portion (liabilities) from the assets. The balance will be the claim of the owner on the business's assets. As the creditors' claims would be given priority over the owner's claims upon liquidation, the owner's claims are also known as residual equity.
By using the summary of basic accounting, connect the relationship between cash, account payable, account receivable, retained earnings, marketable securities and ordinary shares.
EXERCISE 3.1
1. Balance sheet is the statement on the financial status of a company for a specific period. (a) True (b) False
2. Income statement is the statement that attempts to measure the
result of a company's operating decisions at specific point of time.
(a) True (b) False 3. Fixed assets are items would not be converted into cash within a
period of one year. (a) True (b) False 4. Investments in financial securities are considered as current
assets (a) True (b) False 5. Which is FALSE?
A. Assets = Liabilities + Owner's Equity B. Assets Liabilities = Owner's Equity C. Assets + Liabilities = Owner's Equity D. Assets Owner's Equity = Liabilities
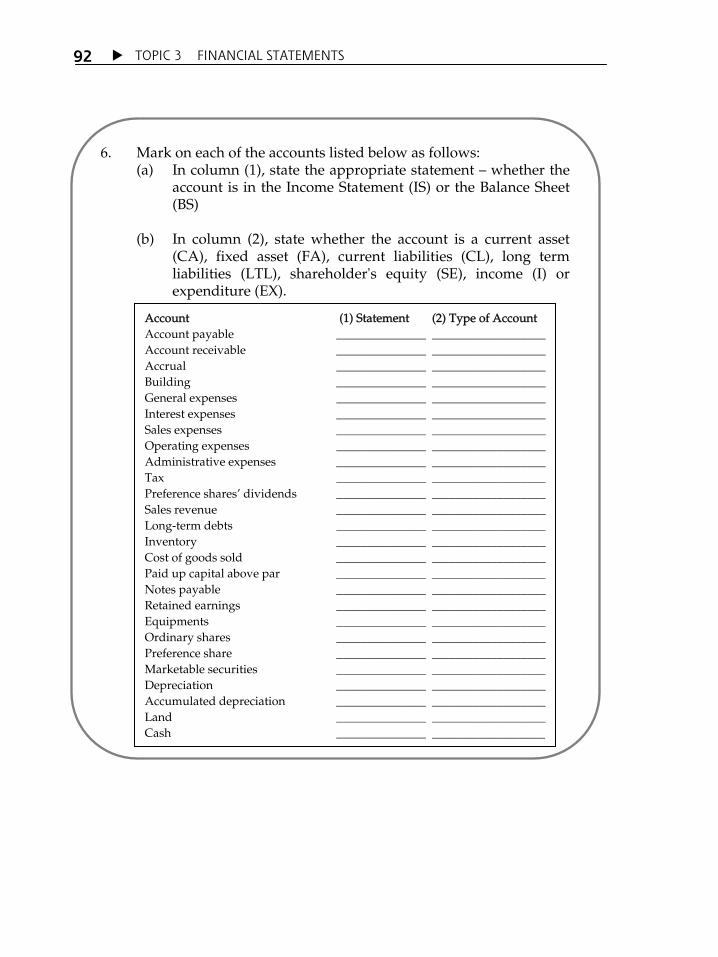
TOPIC 3 FINANCIAL STATEMENTS
92
6. Mark on each of the accounts listed below as follows: (a) In column (1), state the appropriate statement whether the
account is in the Income Statement (IS) or the Balance Sheet (BS)
(b) In column (2), state whether the account is a current asset
(CA), fixed asset (FA), current liabilities (CL), long term liabilities (LTL), shareholder's equity (SE), income (I) or expenditure (EX).
Account (1) Statement (2) Type of Account Account payable _______________ ___________________ Account receivable _______________ ___________________ Accrual _______________ ___________________ Building _______________ ___________________ General expenses _______________ ___________________ Interest expenses _______________ ___________________ Sales expenses _______________ ___________________ Operating expenses _______________ ___________________ Administrative expenses _______________ ___________________ Tax _______________ ___________________ Preference sharesÊ dividends _______________ ___________________ Sales revenue _______________ ___________________ Long-term debts _______________ ___________________ Inventory _______________ ___________________ Cost of goods sold _______________ ___________________ Paid up capital above par _______________ ___________________ Notes payable _______________ ___________________ Retained earnings _______________ ___________________ Equipments _______________ ___________________ Ordinary shares _______________ ___________________ Preference share _______________ ___________________ Marketable securities _______________ ___________________ Depreciation _______________ ___________________ Accumulated depreciation _______________ ___________________ Land _______________ ___________________ Cash _______________ _________________

TOPIC 3 FINANCIAL STATEMENTS 93
7. Use the relevant items listed below to prepare the income statement for Company PC for period ending 31 December 2001.
Items Value as at 31 December 2001 (RM Â000) Account receivable 3,500 Accumulated depreciation 2,050 Cost of goods sold 2,850 Depreciation expenses 550 General and administrative expenses 600 Interest expenses 250 Preference sharesÊ dividends 100 Sales revenue 5,250 Sales expenses 350 ShareholdersÊ equity 2,650 Tax Rate = 30% 8. Use the relevant items from the list below to prepare the balance
sheet for Company ODC as at 31 December 2001.
Item Value at 31 December 2001 (RM Â000) Account payable 2,200 Account receivable 4,500 Accrual 550 Building 2,250 General expenses 3,200 Depreciation expenses 450 Sales revenue 3,600 Long-term loans 4,200 Inventory 3,750 Equipments 2,350 Cost of goods sold 25,000 Machines 4,200 Paid up capital above par 3,600 Note payable 4,750 Retained earnings 2,100 Ordinary shares (at par) 900 Preference shares 1,000 Marketable securities 750 Accumulated depreciation 2,650 Land 2,000 Cash 2,150

TOPIC 3 FINANCIAL STATEMENTS
94
STATEMENT OF RETAINED EARNINGS
Statement of retained earnings showed how the retained earnings account in the balance sheet is adjusted between two dates of the balance sheet. Statement of retained earnings will adjust the net profit generated throughout the period and any dividends paid, with the changes in the retained earnings in the beginning and ending of the year. Table 3.3 showed the statement of retained earnings for Company FAZ for year ended 31 December 2002. The statement showed that the company started with a retained earnings of RM50,000 on 31 December 2001 or 1 January 2002 and profit after tax of RM18,000 (data obtained from the income statement). From this total, the company had paid dividends for preference shares of RM1,000 and dividends for ordinary shares of RM7,000. Therefore, the retained earnings had increased by RM10,000 from RM50,000 as at 1 January 2002 to RM60,000 as at 31 December 2002.
Table 3.3: Statement of Retained Earnings
CASH FLOW STATEMENT
3.5
3.4
What will affect the status of cash and marketable securities of a company?
Company FAZ Statement of Retained Earnings
for the Year Ended 31 December 2002
Retained earnings, 1 January 2002 RM50,000 + Net profit (throughout year 2002) 18,000 Dividends paid (throughout year 2002) Preference shares RM1,000 Ordinary shares 7,000 8,000 Retained earnings, 31 December 2002 RM60,000

TOPIC 3 FINANCIAL STATEMENTS 95
Cash flow statement shows how the activities in a company such as operating, investing and financing activity that can influence the status of cash and marketable securities. Cash flow statement is the statement that summarises the cash flow throughout a specific period, normally for the current year ended. Data from the balance sheet and income statement are used to prepare the cash flow statements. Cash flow statement can assist the finance manager to:
• evaluate the companyÊs capability to generate positive cash flow in the future; and
• evaluate the companyÊs capability to settle debts, pay dividends and provide loans.
(a) Operating Activities Operating activities refer to the activities that are directly related to the
production of products, sales and services of the company such as the sales and purchases of goods/services, rental income, fees income, wages and salaries of employees, utility expenses and rental expenses.
(b) Investing Activities Investing activities refer to the activities that are related with the buying
and selling of long-term assets such as the sale and purchase of fixed assets, selling of investments, buying of stocks and bonds (investing) and loans to other entities.
(c) Financing Activities Financing activities refer to the activities that are related to the current
liabilities and long-term liabilities as well as ownerÊs equity such as repayment of loans, short-term and long-term loans and shares buyback.
3.5.1 Preparing Cash Flow Statement
Data obtained from the balance sheet together with the net profit, depreciation and dividends obtained from the income statement can be used to prepare the cash flow statement. You can do this by using the three steps below: Step 1 Classify the data into one of these three components:
(a) Cash flow from operating activities (b) Cash flow from investing activities (c) Cash flow from financing activities
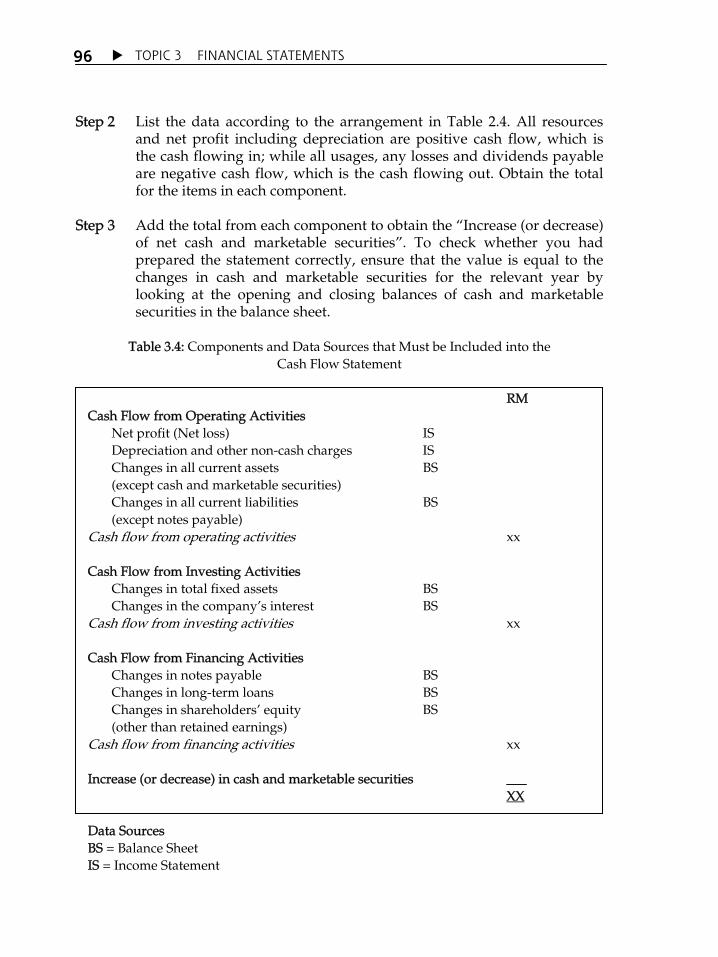
TOPIC 3 FINANCIAL STATEMENTS
96
Step 2 List the data according to the arrangement in Table 2.4. All resources and net profit including depreciation are positive cash flow, which is the cash flowing in; while all usages, any losses and dividends payable are negative cash flow, which is the cash flowing out. Obtain the total for the items in each component.
Step 3 Add the total from each component to obtain the „Increase (or decrease)
of net cash and marketable securities‰. To check whether you had prepared the statement correctly, ensure that the value is equal to the changes in cash and marketable securities for the relevant year by looking at the opening and closing balances of cash and marketable securities in the balance sheet.
Table 3.4: Components and Data Sources that Must be Included into the
Cash Flow Statement
RM Cash Flow from Operating Activities Net profit (Net loss) IS Depreciation and other non-cash charges IS Changes in all current assets BS (except cash and marketable securities) Changes in all current liabilities BS (except notes payable) Cash flow from operating activities xx Cash Flow from Investing Activities Changes in total fixed assets BS Changes in the companyÊs interest BS Cash flow from investing activities xx Cash Flow from Financing Activities Changes in notes payable BS Changes in long-term loans BS Changes in shareholdersÊ equity BS (other than retained earnings) Cash flow from financing activities xx Increase (or decrease) in cash and marketable securities ___ XX Data Sources BS = Balance Sheet IS = Income Statement

TOPIC 3 FINANCIAL STATEMENTS 97
Example of Cash Flow Statement: Company FAZ The cash flow statement of Company FAZ for year ended 31 December 2002 is shown in Table 2.5. Based on this cash flow statement, the company had enjoyed an increase of RM50,000 in cash and marketable securities for the year 2002 (refer to Table 3.5). The cash of the company increased by RM10,000 while the marketable securities increased by RM40,000 between the two dates.
Table 3.5: Cash Flow Statement of Company FAZ
Company FAZ Cash Flow Statement
as at 31 December 2002 RM RM Cash Flow from Operating Activities Net Profit 18,000 Depreciation 10,000 Decrease in account receivable 10,000 Decrease in inventory 30,000 Increase in account payable 20,000 Decrease in tax accrual (10,000) Cash flow from operating services 78,000 Cash Flow from Investing Activities Increase in total fixed assets (30,000) Cash flow from investing activities (30,000) Cash Flow from Financing Activities Decrease in short term notes payable (10,000) Increase in long term loan 20,000 Changes in shareholders' equity - Dividends paid (8,000)
Cash flow from financing activities 2,000
Net increase in cash and marketable securities 50,000

TOPIC 3 FINANCIAL STATEMENTS
98
(a) Cash Flow from Operating Activities The operating activities in the cash flow statements showed that the profit
after tax of Company FAZ is RM18,000 for year 2002. Depreciation expenses of RM10,000 deducted from the income statement had been added back into the cash flow statement as it is not cash outflow.
Account receivable had decreased by RM10,000 which means that the
company had collected credit accounts from its customers. Inventory had also decreased from RM90,000 in year 2001 to RM60,000 in year 2002, representing cash resources of RM30,000 to the company. In the liabilities section, notice that the account payable had increased by RM20,000. This means that the company had increase its debts from the suppliers and this represents cash inflow. Tax accrual had decreased by RM10,000 indicating that the company had used RM10,000 cash to pay tax.
(b) Cash Flow from Investing Activities Fixed assets of Company FAZ had increased by RM30,000 between 31
December 2001 and 31 December 2002. This increment reflected in the cash outflow used to by additional assets.
(c) Cash Flow from Financing Activities Notes payable of Company FAZ has decreased by RM10,000 indicating
cash outflow as the company paid its shor-term loans. Long-term liabilities increased by RM20,000 indicating cash inflow. The company obtained loans to acquire additional cash.
3.5.2 Differentiating Cash Resources and Usage
Before we can prepare the cash flow, we must classify the cash flow from operating, investing and financing activities into cash resources or usage. Table 2.6 lists the basic cash resources and usage. Several issues that can help you to classify between cash resources and usage:
Table 3.6: Cash Resources and Usage
Cash Resources Cash Usage
Decrease in asset
Increase in liability
Net profit
Increase in asset
Decrease in liability
Net loss

TOPIC 3 FINANCIAL STATEMENTS 99
Depreciation
Sale of shares
Payment of dividends
Shares Buyback
(a) Decrease in the asset account is a cash inflow resource while increase in the asset account is a cash usage or cash outflow.
Company bought new assets by cash. Therefore, any increase in the asset
items between the two dates of the balance sheets will indicate that cash outflow had occurred. Any decrease in the asset items will indicate cash inflow as the company had sold the assets to obtain cash.
(b) Increase in the liability account and ownerÊs equity is a cash inflow
resources and a decrease in the liability account is cash usage. The company might use cash to settle its liability and claims on the assets.
Therefore, any decrease in the liability items, preference shares or ordinary shares between the two dates of balance sheets indicates cash outflow. To obtain additional cash, the company can make loans. Therefore, any increase in the liability items, preference shares or ordinary shares indicated cash inflow.
(c) Depreciation is a cash flow resource as is not cash expenses (non-cash
charges). Non-cash expenditures are all expenses deducted from sales in the income statement but actually do not involve any cash outflow throughout the period. Depreciation and amortisation are examples of non-cash expenses.
(d) Direct changes in the retained earnings are not included in the cash flow
statement as these items affects the retained earnings and are shown as profit after tax (or loss after tax) and cash dividends.
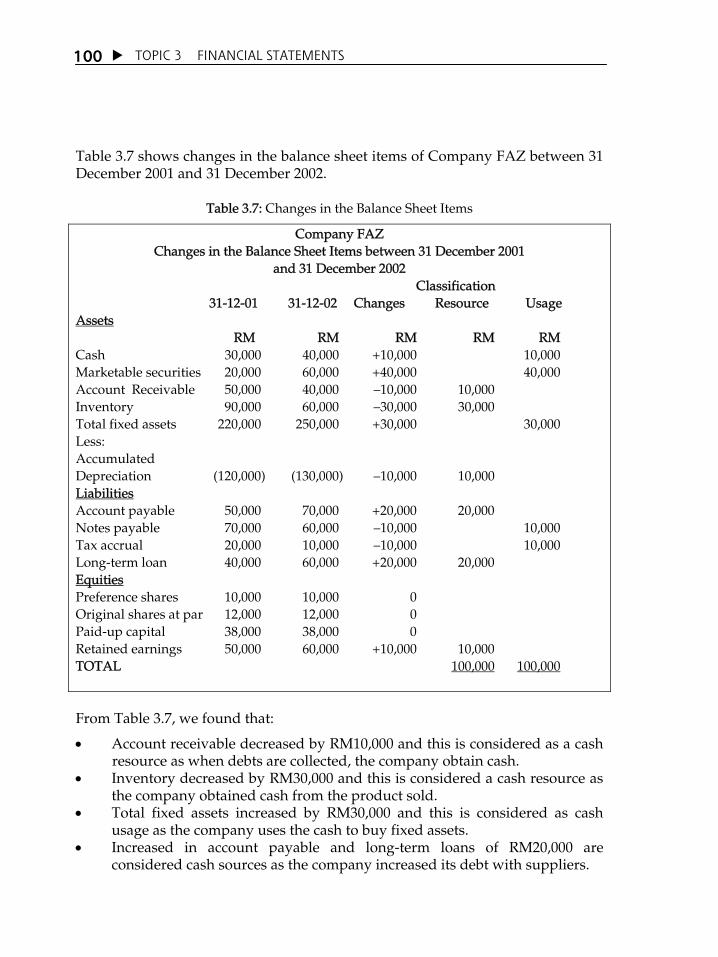
TOPIC 3 FINANCIAL STATEMENTS
100
Table 3.7 shows changes in the balance sheet items of Company FAZ between 31 December 2001 and 31 December 2002.
Table 3.7: Changes in the Balance Sheet Items
Company FAZ Changes in the Balance Sheet Items between 31 December 2001
and 31 December 2002 Classification 31-12-01 31-12-02 Changes Resource Usage Assets RM RM RM RM RM Cash 30,000 40,000 +10,000 10,000 Marketable securities 20,000 60,000 +40,000 40,000 Account Receivable 50,000 40,000 10,000 10,000 Inventory 90,000 60,000 30,000 30,000 Total fixed assets 220,000 250,000 +30,000 30,000 Less: Accumulated Depreciation (120,000) (130,000) 10,000 10,000 Liabilities Account payable 50,000 70,000 +20,000 20,000 Notes payable 70,000 60,000 10,000 10,000 Tax accrual 20,000 10,000 10,000 10,000 Long-term loan 40,000 60,000 +20,000 20,000 Equities Preference shares 10,000 10,000 0 Original shares at par 12,000 12,000 0 Paid-up capital 38,000 38,000 0 Retained earnings 50,000 60,000 +10,000 10,000 TOTAL 100,000 100,000 From Table 3.7, we found that:
• Account receivable decreased by RM10,000 and this is considered as a cash resource as when debts are collected, the company obtain cash.
• Inventory decreased by RM30,000 and this is considered a cash resource as the company obtained cash from the product sold.
• Total fixed assets increased by RM30,000 and this is considered as cash usage as the company uses the cash to buy fixed assets.
• Increased in account payable and long-term loans of RM20,000 are considered cash sources as the company increased its debt with suppliers.

TOPIC 3 FINANCIAL STATEMENTS 101
• Notes payable and tax accrual decreased by RM10,000 and this are considered as cash usage as the cash was used to settle debts to the creditors and tax to the government.
These types of classifications (based on Table 2.6) are made on every item in the balance sheet. The result of these classifications will be totalled to obtain the total cash resources and total cash usage. If these classifications are done correctly, the total cash resources will be equal to the total cash usages.
All sorts of support and loan assistance had been provided by the government through organisations such as the Perbadanan Usahawan Nasional Berhad (PUNB) to encourage the participation of bumiputera in the area of entrepreneurship. Many have grabbed this opportunity to be involved in their own businesses covering various economic sectors but not all of them succeeded. What is your opinion on this matter?
YOUR IDEA
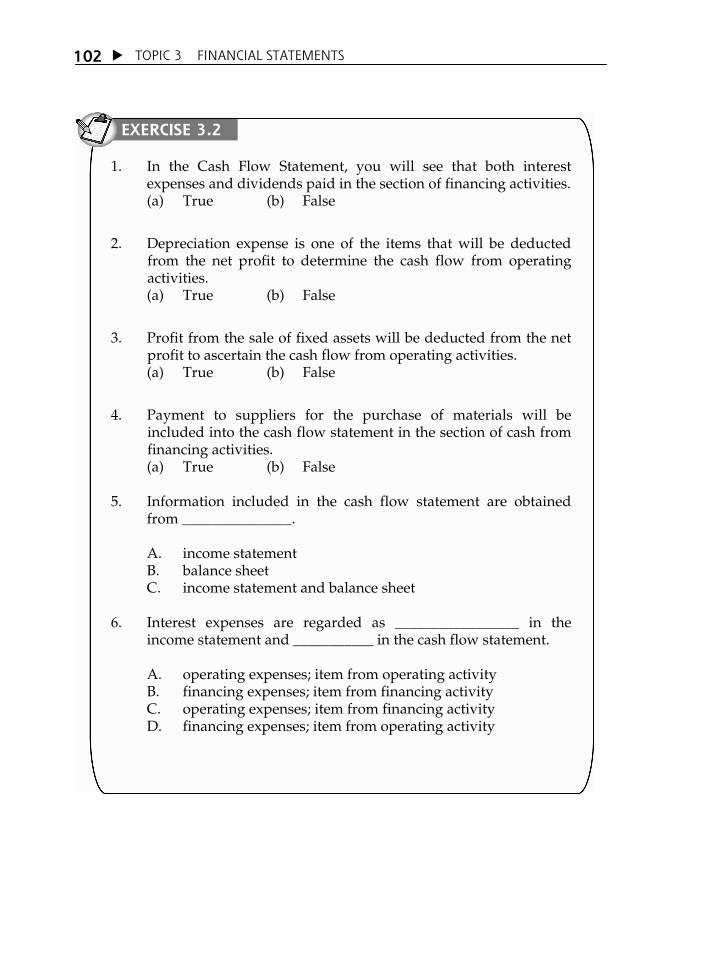
TOPIC 3 FINANCIAL STATEMENTS
102
EXERCISE 3.2
1. In the Cash Flow Statement, you will see that both interest expenses and dividends paid in the section of financing activities. (a) True (b) False
2. Depreciation expense is one of the items that will be deducted from the net profit to determine the cash flow from operating activities. (a) True (b) False
3. Profit from the sale of fixed assets will be deducted from the net profit to ascertain the cash flow from operating activities.
(a) True (b) False
4. Payment to suppliers for the purchase of materials will be included into the cash flow statement in the section of cash from financing activities.
(a) True (b) False 5. Information included in the cash flow statement are obtained
from _______________.
A. income statement B. balance sheet C. income statement and balance sheet
6. Interest expenses are regarded as _________________ in the
income statement and ___________ in the cash flow statement.
A. operating expenses; item from operating activity B. financing expenses; item from financing activity C. operating expenses; item from financing activity D. financing expenses; item from operating activity

TOPIC 3 FINANCIAL STATEMENTS 103
7. Hugo Enterprise begun the year 2000 with retained earnings of RM92,800. Throughout year 2000, the company obtained RM37,700 after tax. From this amount, preference shareholders were paid dividends of RM4,700. At the end of year 2000, retained earnings of the company total RM104,800. 14,000 units of ordinary shares were issued throughout year 2000.
(a) Prepare the retained earnings statement for the year ended
31 December 2000 (ensure that you calculate and include the total dividends of ordinary shares paid in the year 2000).
(b) Calculate the earnings per share for year 2000. (c) How much dividend per share was paid by the company to
the ordinary shareholders for the year 2000? 8. Profit after tax of year 2001 for Company Ceria is RM186,000. The
closing balance for retained earnings for year 2001 and 2000 were RM812,000 and RM736,000 accordingly. How much dividend did the company paid in the year 2000?
9. Classify each of the following items as funds resource (R) or usage
(U), or neither (N) both.
Item Changes (RM) Cash Flow
Cash + 1,000 ________________ Account payable - 10,000 ________________ Notes payable + 5,000 ________________ Long term loans - 20,000 ________________ Inventory + 2,000 ________________ Fixed assets + 4,000 ________________ Account receivable - 7,000 ________________ Net profit + 6,000 ________________ Depreciation + 1,000 ________________ Share buyback + 6,000 ________________ Cash dividend + 8,000 ________________ Sale of Share +10,000 ________________

TOPIC 3 FINANCIAL STATEMENTS
104
Financial statements represents the financial outlook of a company. Information from the income statements; balance sheet; statement of retained earning and cash flow statement are used to measure the companyÊs current financial status as well as financial planning for the future. Having a clear understanding of financial statements will prepare you to analyse the financial ratio in the next topic.

INTRODUCTION
Financial analysis is an evaluation of the companyÊs financial achievement for the previous years and its prospect in the future. Normally the evaluation will involve analysis of the companyÊs financial statement. Information from the financial statement is used to identify the relative strengths and weaknesses of the company compared to its competitor and providing indication on areas that needs to be investigated and improved.
TTooppiicc 44 Financial Statement Analysis
LEARNING OUTCOMES At the end of this topic, you should able to: 1. calculate and define three liquidity ratios, which are the net
working capital, current ratio and quick ratio; 2. calculate and explain the six asset management ratios, which are
the account receivable turnover ratio, average collection period, inventory turnover, average inventory sales period, fixed assets turnover and total assets turnover;
3. calculate and explain the three financial leverage ratios, which are the debt ratio, debt equity ratio, equity multiplier and interest coverage ratio;
4. calculate and explain the four profitability ratios, which are the gross profit margin, net profit margin, return on asset and return on equity;
5. calculate and explain the two market value ratios which are price earnings ratio and dividend yield ratio; and
6. calculate the DuPont analysis and explaining its advantages to the finance managers.
TOPIC 4 FINANCIAL STATEMENT ANALYSIS
106
Finance manager use the financial analysis for the companyÊs future planning. For example, shareholders and potential investors are interested in the level of returns and risks of the company. Creditors are interested in the short-term liquidity level and the ability of the company to settle its interests and debts. They will also emphasis on the profitability of the company as they want to ensure that the companyÊs performance is good and will be successful. Therefore, the finance manager must know the entire aspects of the financial analysis that are being focused by several parties having their own interests in evaluating the company. Beside the finance manager, the management also uses the financial analysis to monitor the companyÊs achievement from time to time. Any unexpected changes will be examined to identify the problems that need to be dealt with.
FINANCIAL RATIO ANALYSIS
Financial ratio analysis involves the calculation of several ratios that will enable the manager to evaluate the performance and financial status of the company by comparing its financial ratios with the financial ratios of other companies. These ratios are divided into five groups or categories, which are: (a) Liquidity Ratio Liquidity ratio refers to the companyÊs ability to fulfil its short-term
maturity claims or obligations.
(b) Asset Management Ratio Asset management ratio refers to the efficiency of the company to use its
assets and how fast specific accounts can be converted into sales or cash.
(c) Leverage Ratio Leverage ratio refers to the level of debt usage or the ability of the company
to fulfil its financial claims such as interest claims.
(d) Profitability Ratio Profitability ratio refers to the effectiveness of the company in generating
returns from investments and sales, for example, gross profit margin, net profit margin, operating profit margin, return from assets and returns from equity.
4.1
What is the relevance in calculating the financial ratios for short term and long term operations? Should its value be in accordance with the average performance of the industry? Please explain.

TOPIC 4 FINANCIAL STATEMENT ANALYSIS 107
(e) Market value Ratio Market value ratio refers to the ability of the company to create market
values in excess of its investment costs. Liquidity, asset management and leverage ratios measure the companyÊs risk while the profitability ratio measures the companyÊs returns.
Within the short-term period, liquidity, asset management and profitability ratios are important to the management of the company as these ratios provide critical information on the companyÊs short-term operations. If a business is unable to sustain within the short-term period, it would be irrelevant to discuss its long-term prospects. Before preparing the ratio analysis, the finance manager must have consideration to the following issues:
• One ratio is unable to give complete information on the status of the company. This means that several categories of ratios must be looked at simultaneously before any conclusion can be made.
• Comparisons between the financial ratios for one company with other companies in the industry must be made at the same point of time. Industry average is not a figure that must be achieved by a company. There are many companies that had been managed efficiently but the performance of their financial ratios is much higher or lower than the performance of the industry average. The obvious difference between the financial ratios of the company and the industry average is an indication to the analysers to check on the ratio further.
• Use the financial statements that have been audited. This will show the actual status of the company.
• Use the same method to evaluate items in the financial statement that will be compared. For example, to record inventory, a company might use different accounting methods such as the first-in-first-out, first-in-last-out or moving average method. Choose only one of these methods for comparison purposes. Different methods will provide different ratio values. Therefore, actual evaluation cannot be done.
Financial statements of the company are the main input for the manager who intend to prepare the ratio analysis for its company. Each example of the ratios that will be discussed in the next section will be using the financial information extracted from the income statement and balance sheet of Company ABC (refer to Table 4.1 and Table 4.2).

TOPIC 4 FINANCIAL STATEMENT ANALYSIS
108
4.1.1 Income Statement
The income statement for Company ABC for the year ended 31 December 2001 and 31 December 2002 are shown in Table 2.8. The income statement shows the operating performance of the company for a specific period.
Table 4.1: Income Statement for Company ABC
4.1.2 Balance Sheet
Balance sheet shows the overall value of various assets and claims on these assets at a specific point of time. For Company ABC, the balance sheet shows the assets, liabilities and equities as at 31 December 2001 and 31 December 2000 as shown in Table 4.2.
Company ABC
Income Statement for the Year Ended 31 December 2001 and 2000
2001 2000 RM RM Sales 307,400 256,700 Less: Cost of goods sold 208,800 171,000 Gross profit 98,600 85,600 Less: Operating expenses Sales expenses 10,000 10,800 Administrative and general expenses 19,400 18,700 Lease expenses 3,500 3,500 Depreciation expenses 23,900 22,300 Total operating expenses 56,800 55,300 Profit before interest and tax (operating profit) 41,800 30,300 Less: Interest expense 9,300 9,100 Profit before tax 32,500 21,200 Less: Tax (29%) 9,400 6,100 Profit after tax 23,100 15,100 Less: Preference sharesÊ dividend 1,000 1,000 Profit available for ordinary shareholders 22,100 14,100 Earnings per share 0.29 0.18

TOPIC 4 FINANCIAL STATEMENT ANALYSIS 109
Table 4.2: Balance Sheet
Company ABC Balance Sheet
as at 31 December 2001 and 31 December 2000 2001 2000 RM RM Assets Current Assets Cash 36,300 28,800 Marketable securities 6,800 5,100 Account receivable 50,300 36,500 Inventory 28,900 30,000 Total current assets 122,300 100,400 Net Fixed Assets 237,400 226,600 Total Assets 359,700 327,000 Liabilities and Equities Current liabilities Account payable 38,200 27,000 Notes payable 7,900 9,900 Accruals 15,900 11,400 Total current liabilities 62,000 48,300 Long-term loans 102,300 96,700 Total liabilities 164,300 145,000 Equities Preference shares 20,000 20,000 Ordinary shares, RM2.50 par value, 19,100 19,000 100,000 shares issued 2001: 76,262; 2000: 76,244 Paid-up capital above par 42,800 41,800 Retained earnings 113,500 101,200
Total equities 195,400 182,000 Total liabilities and shareholders' equities 359,700 327,000
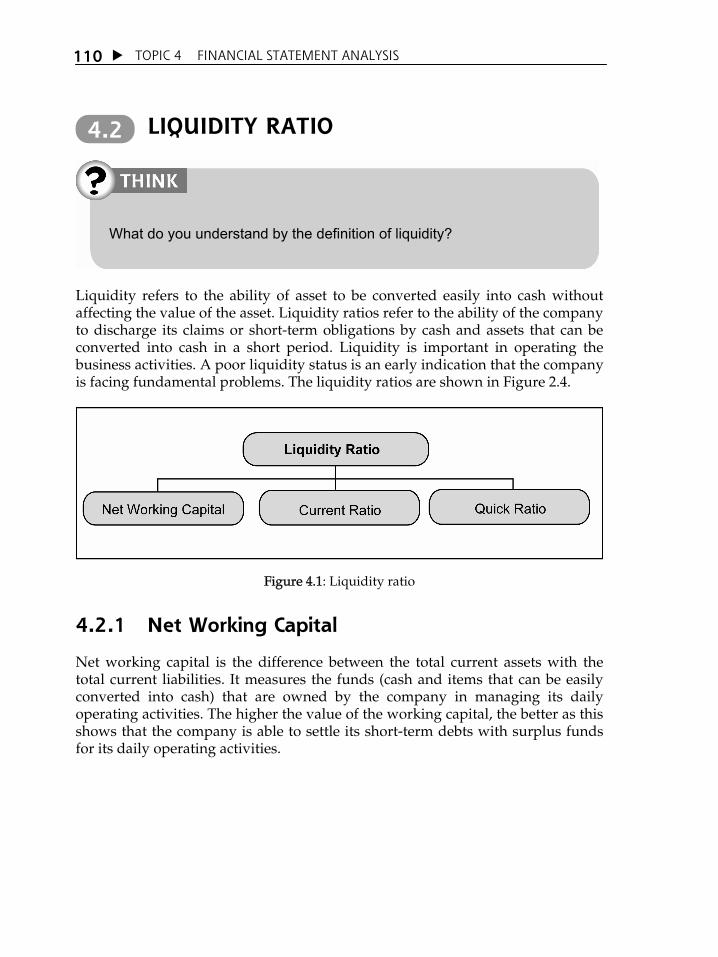
TOPIC 4 FINANCIAL STATEMENT ANALYSIS
110
LIQUIDITY RATIO
Liquidity refers to the ability of asset to be converted easily into cash without affecting the value of the asset. Liquidity ratios refer to the ability of the company to discharge its claims or short-term obligations by cash and assets that can be converted into cash in a short period. Liquidity is important in operating the business activities. A poor liquidity status is an early indication that the company is facing fundamental problems. The liquidity ratios are shown in Figure 2.4.
Figure 4.1: Liquidity ratio
4.2.1 Net Working Capital
Net working capital is the difference between the total current assets with the total current liabilities. It measures the funds (cash and items that can be easily converted into cash) that are owned by the company in managing its daily operating activities. The higher the value of the working capital, the better as this shows that the company is able to settle its short-term debts with surplus funds for its daily operating activities.
4.2
What do you understand by the definition of liquidity?

TOPIC 4 FINANCIAL STATEMENT ANALYSIS 111
Net working capital of Company ABC for the year 2001 is calculated as follows: Net working capital = Current assets Current liabilities (2.1) = RM122,300 RM62,000 = RM60,300 Industry average = RM42,700 Based on the calculation above, the net working capital of Company ABC is higher than the industry average. This shows that Company ABC is able to settle its short-term debts and has higher surplus funds than the other companies in the industry to manage its daily operations.
4.2.2 Current Ratio
Current ratio measures the ability of the company to fulfil its long-term loans using its current assets. The higher the value of this ratio, the better the liquidity status of the company. This shows that the company is able to settle short-term debts using its current assets. Current ratio is obtained by dividing the current assets with the current liabilities. The current ratio of Company ABC is as follows: Current Assets (2.2) Current Liabilities
RM122,300 RM 62,000
1.97
2.05
The current ratio of Company ABC is 1.97 which is lower compared with the industry average of 2.05. This shows that for every ringgit of current liability, the company only has RM1.97 current assets for its payment compared to the other companies in the industry that has RM2.05 to settle their current liabilities. However, the current ratio of the company is not too low for concern. Current ratio of 2.0 times is acceptable; however, this acceptance depends on the type of industry. For example, current ratio of 1.0 is satisfactory for industries such as utilities that have a rather stable business but unsatisfactory for industries such as manufacturing due to business volatility.
Current ratio =
=
Industry average =
=
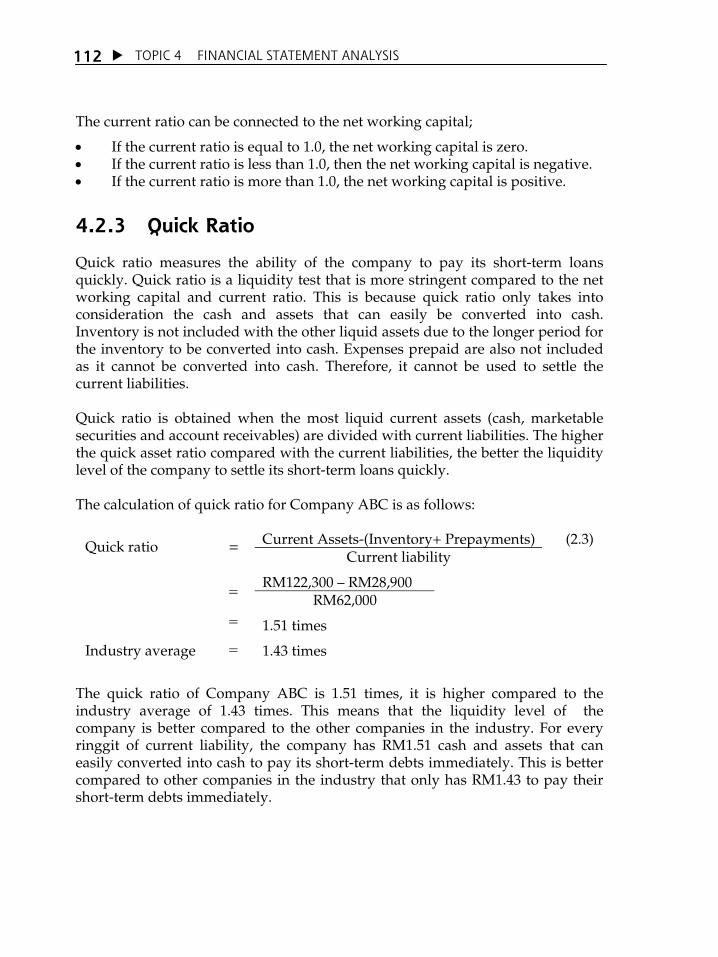
TOPIC 4 FINANCIAL STATEMENT ANALYSIS
112
The current ratio can be connected to the net working capital;
• If the current ratio is equal to 1.0, the net working capital is zero. • If the current ratio is less than 1.0, then the net working capital is negative. • If the current ratio is more than 1.0, the net working capital is positive.
4.2.3 Quick Ratio
Quick ratio measures the ability of the company to pay its short-term loans quickly. Quick ratio is a liquidity test that is more stringent compared to the net working capital and current ratio. This is because quick ratio only takes into consideration the cash and assets that can easily be converted into cash. Inventory is not included with the other liquid assets due to the longer period for the inventory to be converted into cash. Expenses prepaid are also not included as it cannot be converted into cash. Therefore, it cannot be used to settle the current liabilities. Quick ratio is obtained when the most liquid current assets (cash, marketable securities and account receivables) are divided with current liabilities. The higher the quick asset ratio compared with the current liabilities, the better the liquidity level of the company to settle its short-term loans quickly. The calculation of quick ratio for Company ABC is as follows: Current Assets-(Inventory+ Prepayments) (2.3) Current liability
RM122,300 RM28,900 RM62,000
1.51 times
1.43 times
The quick ratio of Company ABC is 1.51 times, it is higher compared to the industry average of 1.43 times. This means that the liquidity level of the company is better compared to the other companies in the industry. For every ringgit of current liability, the company has RM1.51 cash and assets that can easily converted into cash to pay its short-term debts immediately. This is better compared to other companies in the industry that only has RM1.43 to pay their short-term debts immediately.
Quick ratio =
=
Industry average =
=

TOPIC 4 FINANCIAL STATEMENT ANALYSIS 113
ASSET MANAGEMENT RATIO
Asset management ratio measures the efficiency of the management in using the assets and specific accounts to generate sales or cash. Ratios that can be used to measure the efficiency in asset management are shown in Figure 4.2.
4.3
1. The following data is taken from the financial statements of Company Fazrul
1999 1998
Sales RM640,000 RM560,000 Cost of sold goods 380,000 360,000 Cash 30,000 26,000 Marketable securities 40,000 52,000 Account receivable 70,000 62,000 Inventory 150,000 140,000 Prepayment items 10,000 10,000 Net fixed assets 300,000 260,000 Current liabilities 120,000 140,000
Based on the data above, calculate the following liquidity ratios for the years 1998 and 1999:
(a) Net working capital (b) Current ratio (c) Quick ratio
EXERCISE 4.1

TOPIC 4 FINANCIAL STATEMENT ANALYSIS
114
Figure 4.2: Asset management ratio
4.3.1 Account Receivable Turnover
Account receivable turnover measures the ability of the company to collect debts from its customers. It provides the total of account receivables collected throughout the year. The higher the ratio, the better as it is an indication that:
• The company can collect debts from its customers quickly; • The company has low bad debts; and • The company can use the funds for the next investments Account receivable turnover is the net credit sales revenue (if unavailable, use the total sales) divided by the account receivables (or average account receivable). Credit sales (2.4) Account receivable
RM307,400 RM50,300
6.11 times
8.24 times
The account receivable turnover for the company unsatisfactory compared to the industry average. This may indicate the inefficiency of the credit department in credit collection.
=
=
Account receivable turnover =
Industry average =

TOPIC 4 FINANCIAL STATEMENT ANALYSIS 115
4.3.2 Average Collection Period
Average collection period showed the average days taken by the company to collect the account receivable. Assuming there are 360 days in a year. The comparison between the average periods with the companyÊs credit term could measure the efficiency of the company in collecting debts from its customers. Average collection period of Company ABC is as follows: 360 (2.5) Account Receivable Turnover
360 6.11
58.92 days
44.3 days
The average collection period of Company ABC are 58.92 days which is unsatisfactory compared with the performance of the industry average of 44.3 days. On average, Company ABC takes 58.92 days to collect its account receivables while other companies in the industry only takes an average of 44.3 days to collect debts from their customers. If the credit period for Company ABC is 30 days, the average collection period of 58.2 days is unsatisfactory. This means, on average, the customers did not settle their payments with the period specified. This could also indicate that the credit management or credit department is inefficient or both. If the collection period extends for several years without changes to the credit policy, the company must take action to expedite the collection of account receivables. However, if the companyÊs credit period is 60 days and the average collection period is 58.92 days, this shows a practical collection period. The average collection period can also be calculated using formula 2.6. Account receivables (2.6) Yearly sales/360
RM50,300 RM307,400/360
= 58.92 days
=
=
Industry average =
=
=
Average collection period =
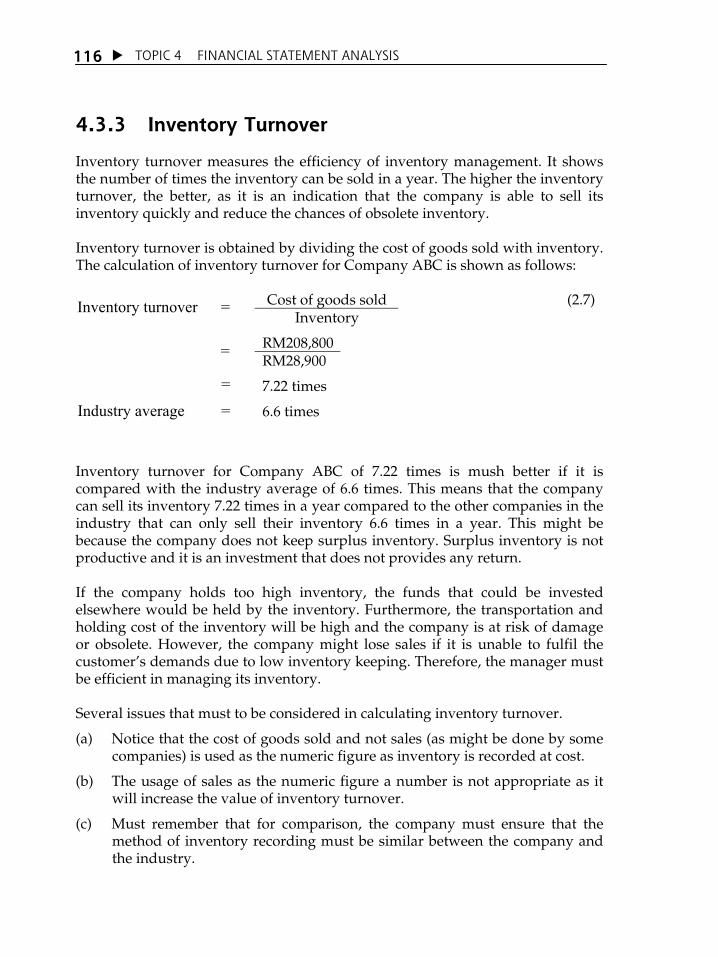
TOPIC 4 FINANCIAL STATEMENT ANALYSIS
116
4.3.3 Inventory Turnover
Inventory turnover measures the efficiency of inventory management. It shows the number of times the inventory can be sold in a year. The higher the inventory turnover, the better, as it is an indication that the company is able to sell its inventory quickly and reduce the chances of obsolete inventory. Inventory turnover is obtained by dividing the cost of goods sold with inventory. The calculation of inventory turnover for Company ABC is shown as follows: Cost of goods sold (2.7) Inventory
RM208,800 RM28,900
7.22 times
6.6 times
Inventory turnover for Company ABC of 7.22 times is mush better if it is compared with the industry average of 6.6 times. This means that the company can sell its inventory 7.22 times in a year compared to the other companies in the industry that can only sell their inventory 6.6 times in a year. This might be because the company does not keep surplus inventory. Surplus inventory is not productive and it is an investment that does not provides any return. If the company holds too high inventory, the funds that could be invested elsewhere would be held by the inventory. Furthermore, the transportation and holding cost of the inventory will be high and the company is at risk of damage or obsolete. However, the company might lose sales if it is unable to fulfil the customerÊs demands due to low inventory keeping. Therefore, the manager must be efficient in managing its inventory. Several issues that must to be considered in calculating inventory turnover.
(a) Notice that the cost of goods sold and not sales (as might be done by some companies) is used as the numeric figure as inventory is recorded at cost.
(b) The usage of sales as the numeric figure a number is not appropriate as it will increase the value of inventory turnover.
(c) Must remember that for comparison, the company must ensure that the method of inventory recording must be similar between the company and the industry.
Inventory turnover =
=
=
Industry average =
TOPIC 4 FINANCIAL STATEMENT ANALYSIS 117
(d) The inventory turnover can be changed into number of days when it is divided with 360 days (average number of days a year). This ratio is known as the average inventory sales period as discussed in the next section.
4.3.4 Average Inventory Sales Period
The average inventory sales period shows the number of days taken to make one round of inventory sales. The high average inventory sales period is less unsatisfactory as this indicates that the company took longer time to sell its inventory. For Company ABC, the average inventory sales period is 50 days as calculated below: 360 (2.8) Inventory turnover
360 7.22
49.86 days
55.30 days
The average inventory sales period for Company ABC of 49.86 days is better compared to the performance for the industry of 55.30 days. This indicates that the company takes shorter time to sell its inventory compared to the other companies in the industry. This ratio can also be calculated using the following formula: Inventory (2.9) Cost of goods sold/360
RM28,900 RM208,800/360
49.83days
55.30 days
=
=
Industry average =
=
Average inventory sales period =
Average inventory sales period =
Average inventory sales period = Average inventory sales period =

TOPIC 4 FINANCIAL STATEMENT ANALYSIS
118
4.3.5 Fixed Asset Turnover
Fixed asset turnover shows the efficiency of the company in using its fixed assets to generate sales. The higher this ratio, the better because it shows indicated efficient asset management. This ratio is obtained when the sales is divided by the net fixed assets. The calculation of fixed asset turnover for Company ABC is as follows: Sales (2.10) Net Fixed assets
RM307,400 RM237,400
1.29 times
Industry average = 1.35 times
The fixed asset turnover ratio for Company ABC is lower compared to the other companies in the industry indicating that the asset management of the company in generating sales is less efficient compared to the other companies. This might be because the company has lots of fixed assets or unsatisfactory sales.
4.3.6 Total Asset Turnover
The total asset turnover shows the efficiency of the company in using all its assets to generate sales. Usually, the higher this ratio, the more efficient the usage of the assets. This ratio might be the most frequent ratio referred by management as it can show the overall efficiency of the companyÊs operations. Total asset turnover of Company ABC is as follows: Sales (2.11) Total assets
RM307,400 RM359,700
0.85 times
Industry average = 0.75 times
=
Fixed asset turnover =
=
=
=
=
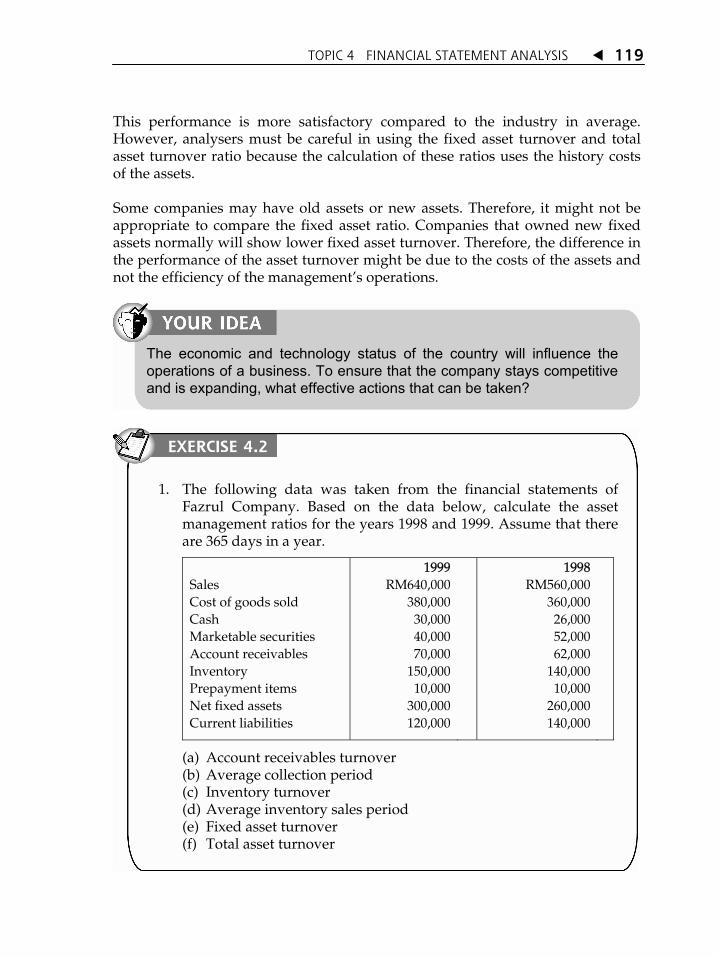
TOPIC 4 FINANCIAL STATEMENT ANALYSIS 119
This performance is more satisfactory compared to the industry in average. However, analysers must be careful in using the fixed asset turnover and total asset turnover ratio because the calculation of these ratios uses the history costs of the assets. Some companies may have old assets or new assets. Therefore, it might not be appropriate to compare the fixed asset ratio. Companies that owned new fixed assets normally will show lower fixed asset turnover. Therefore, the difference in the performance of the asset turnover might be due to the costs of the assets and not the efficiency of the managementÊs operations.
The economic and technology status of the country will influence the operations of a business. To ensure that the company stays competitive and is expanding, what effective actions that can be taken?
1. The following data was taken from the financial statements of Fazrul Company. Based on the data below, calculate the asset management ratios for the years 1998 and 1999. Assume that there are 365 days in a year.
Sales Cost of goods sold Cash Marketable securities Account receivables Inventory Prepayment items Net fixed assets Current liabilities
1999RM640,000
380,00030,00040,00070,000
150,00010,000
300,000120,000
1998 RM560,000
360,000 26,000 52,000 62,000
140,000 10,000
260,000 140,000
(a) Account receivables turnover (b) Average collection period (c) Inventory turnover (d) Average inventory sales period (e) Fixed asset turnover (f) Total asset turnover
EXERCISE 4.2

TOPIC 4 FINANCIAL STATEMENT ANALYSIS
120
LEVERAGE RATIO
Leverage ratio measures a company' level of debt funding and the ability of the company to fulfil its financial demands such as interest claim. Leverage ratios are shown in Figure 4.3.
Figure 4.3: Leverage ratio Leverage occurs when a company is being funded by debt. Debts include all current liabilities and long-term liabilities. Debt is one of the main sources of funding. It provides tax advantage as interest is a tax deductible item. The costs of debt transactions are also lower as debts are easier to obtain compared to the issuance of shares. Usually, the more debt in relative to total assets, the higher the financial leverage of the company. Leverage ratios can be divided into two groups, that is: (a) ratios to evaluate the debt level used by the company such as debt ratio,
debt-equity ratio and equity multiplier; and (b) ratios to see the ability of the company in fulfilling its claims or obligations
to the creditors such as interest coverage ratio. Normally, analysers would focus their attention on the long-term loans as the company is bound by interest payments for a longer period and at the end of that period, the company must repay the principal amount of the loan. As creditors'claims must be settle first before any earnings can be distributed to the shareholders, potential shareholders will usually look at the debt level and the ability of the company to repay the company's debts. Creditors will also focus on the leverage ratios as the higher the debt level, the higher the probability of the company being unable to settle the debts of all its creditors. Therefore, the management of the company must prioritise on the
4.4

TOPIC 4 FINANCIAL STATEMENT ANALYSIS 121
leverage ratio as it attracts attention from several parties that are concerned with the debt level of the company.
4.4.1 Debt Ratio
Debt ratio measures the percentage of total asset that are financed by debts. Creditors prefer lower debt ratio as the lower the debt ratio, the higher the protection for their losses upon liquidation. Unlike the preference of creditors for a lower debt ratio, the management might choose a higher leverage to increase earnings. This is because they do not like to issue new equity as they fear the degree of control in the company will reduce. The higher the debt ratio, the higher the percentage of assets being funded by debts. The debt ratio of Company ABC is:
Debt ratio = X Total liabilities100
Total assets (2.12)
= X RM164, 300100
RM359, 700
= 45.7% Industry average = 40.0% The debt ratio of the company is 45.7% higher compared to the industry average of 40%. Potential creditors might be reluctant to provide additional loans to the company as they worry that the company would be incapable to settle the interest and principal payment, due to its rather high debt ratio.
4.4.2 Debt-Equity Ratio
Debt equity ratio measures the total long-term debts for each ringgit of equity. The lower this ratio, the better it is because it shows that the total equity owned by the company exceeds the long-term debts.
TOPIC 4 FINANCIAL STATEMENT ANALYSIS
122
The debt-equity ratio of Company ABC is:
Debt-equity ratio = Long - term liabilities
Shareholders equity (2.13)
= RM102, 300
100RM195, 400
X
= 52.4%
Industry average = 50%
The debt equity ratio of the company is higher compared to the industry average. This shows that the long-term debt of the company is 52.4% more compared to the shareholders' equity.
4.4.3 Equity Multiplier
Equity multiplier shows the asset ownership for each ringgit of equity. Debt ratio and equity multiplier provides the same information but in different approach. Debt ratio of 40% means that the company is being funded by 40% debts. Based on the balance sheet identity:
Asset = Liability + Equity From this information, we know that the company is being funded by 60% equity. Equity multiplier is 100/60 = 1.67 times. Therefore, when the debt ratio of Company ABC is 45.7%, thus the equity multiplier is 100/54.3 = 1.84 times. In general,
Equity multiplier = 1
1 - Debt ratio (2.14)
= Total asset
Total equity
= RM359, 700
RM195, 400
= 1.84 times
Industry average = 1.67 times

TOPIC 4 FINANCIAL STATEMENT ANALYSIS 123
The equity multiplier of the company is higher compared to the industry average. This shows that the funding of the company's assets via equity is higher compared to the other companies in the industry.
4.4.4 Interest Coverage Ratio
Creditors and other parties intend to know the company's ability to make interest payments periodically by using the current operation's income. Interest coverage ratio is used to decide the number of times the company can repay all its interest expenses with the current income. This ratio is obtained by dividing the operations profit with interest expenses. Interest coverage ratio of Company ABC is:
= Profit before interest and tax
Interest expenses (2.15)
= RM41, 800
RM 9, 300
= 4.49 times
Industry average = 4.3 times
Interest coverage ratio of 4.49 times is more satisfactory compared to the industry average performance of 4.3 times. This indicates the interest expenses margin with current income. Interest coverage ratio can also be calculated by using the following formula: Interest coverage ratio = Net profit + Interest expenses + Tax expenses (2.16) Interest expenses
= RM22,100 + RM9,300 + RM9,400 RM9,300 = 4.39 times

TOPIC 4 FINANCIAL STATEMENT ANALYSIS
124
PROFITABILITY RATIO
The profitability ratio measures the effectiveness of the company in generating returns from investments and sales. It is used as a sign to determine the business's efficiency and effectiveness in achieving its profit objective. Profitability ratios are shown in Figure 4.4.
4.5
1. The summary balance sheet and income statement of Adiy Corporation are as below:
Adiy Corporation
Balance Sheet Income Statement Assets: Sales (all credit) RM6,000,000 Cash RM 150,000 Cost of goods sold 3,000,000 Account receivable 450,000 Operating expenses 750,000 Inventory 600,000 Interest expenses 750,000 Net fixed assets 1,800,000 Tax 420,000 Net Profit 1,080,000 Liabilities and Equities: Account payable 150,000 Notes payable 150,000 Long-term liabilities 1,200,000 Equities 1,500,000
(a) Calculate the financial ratios for Adiy Corporation based on the information given above. Assume that there are 365 days in a year.
(b) Debt ratio (c) Interest coverage ratio (d) Return on assets (e) Average collection period (f) Total asset turnover
EXERCISE 4.3

TOPIC 4 FINANCIAL STATEMENT ANALYSIS 125
Figure 4.4: Profitability ratio
4.5.1 Gross Profit Margin
Gross profit margin measures the profit for each ringgit of sales that can be used to pay the sales and administration expenditures. The higher the gross profit margin, the better the status of the company as this shows lower expenditures or costs involved in implementing sales activities. Gross profit margins can be obtained by dividing the gross profit with sales. It shows the balance percentage for each ringgit of sales after the company had paid all the costs of goods.
Gross Profit Margin = Gross Profit
100Sales
X (2.17)
= RM98, 600
100RM307, 400
X
= 32.1%
Industry average = 30%
Gross profit margin of 32.1% is higher compared to the industry average of 30%. This shows that the purchasing management and cost of the company are better compared to the industry average. The company generates 32.1 cents profit after deducting all costs of goods for each ringgit of sale.

TOPIC 4 FINANCIAL STATEMENT ANALYSIS
126
4.5.2 Net Profit Margin
Net profit margin measures the ability of the company to generate net profit from each ringgit of sale after deducting all expenditure including the cost of goods sold, sales expenditures, general and administrative expenditures, depreciation expenses, interest expenses and tax. The higher the net profit margin, the better the status of the company as this shows an efficient purchasing management with low purchasing costs. Net profit margin is calculated by dividing the profit after tax with sales. Net profit margin of Company ABC is as follows:
Net profit margin = Profit after tax
100Sales
X (2.18)
= RM23,100
100RM307, 400
X
= 7.5%
Industry average = 6.4%
The net profit margin for the company of 7.5% is higher compared to the industryÊs performance of 6.4%. This shows that the management of purchasing and related purchasing costs are better compared to the industry average. The company had managed to generate 7.5 cents net profit for each ringgit of sale compared to the industry average that only managed to generate 6.4 cents for each ringgit of sale.
4.5.3 Operating Profit Margin
The operating profit margin measures the efficiency of operations in reducing costs and increasing returns before interest and tax. The higher the result of this ratio, the better as it indicates that the company is able to operate efficiently. The operating profit margin of Company ABC is:
Operating Profit Margin = Operating Profit
100Sales
X (2.19)
= RM41, 800
100RM307, 400
X
= 13.6%
Industry average = 10%

TOPIC 4 FINANCIAL STATEMENT ANALYSIS 127
The operating profit margin of company ABC is better compared to the industry average. This shows that the company is more efficient in its operations and control its operating expenditures to generate high earnings before interest and tax.
4.5.4 Return on Asset
Return on asset or return on investment measures the effectiveness of the company in using its assets to generate profit. The higher this ratio, the better the status of the company as it indicates the management's efficiency in using its assets to generate profit.
Return on Asset = Profit after tax
100Total Assets
X (2.20)
= RM23,100
100RM359, 700
X
= 6.42%
Industry average = 4.8%
Return on assets of the company is better compared to the industry average that only contributes 4.8%. This shows that the company is better in managing its assets to generate profit compared to the other companies in the industry.
4.5.5 Return on Equity
Return on equity measures the efficiency of the company in generating profit for its ordinary shareholders. The higher the ratio, the better as the company is able to generate high profit for its owners.
Return on Equity = Profit after tax
100Shareholders' Equity
X (2.20)
= RM23,100
100RM195, 400
X
= 11.8%
Industry average = 8%

TOPIC 4 FINANCIAL STATEMENT ANALYSIS
128
Return on equity of the company is 11.8% more satisfactory compared to 8% for the industry average. This shows that the management of the company is more efficient compared to the industry average. The calculation of return on equity will be discussed further when we discuss the DuPont analysis.
4.5.6 Earnings Per Share
Earnings per share calculate the net profit that is generated from each ordinary share. This information is often given priority by the management and investors as it is regarded as an important indication of the company's success. Therefore, the bigger the value of this ratio, the better the status of the shareholders. Earnings per share is obtained by dividing the net profit with the number of shares issued Earnings per share = Profit available to ordinary shareholders (2.22) Number of ordinary shares issued
= RM22,100 76,262
= RM0.29 Industry average = RM0.26 The company obtained RM0.29 for each unit of shares issued compared to the industry average of only RM0.26. The value of this difference is small and in practice, this value does represent the actual amount that will be distributed to the shareholders.
MARKET VALUE RATIO
4.6
Provide the differences between price earnings ratio and dividend yield ratio.

TOPIC 4 FINANCIAL STATEMENT ANALYSIS 129
Market value ratio measures the ability of the company to generate market values in excess of its investment costs. This aspect is very important as these market value ratios are directly related to the objective of the company, that is to maximise shareholders' wealth and value of the company. Therefore, it can be said that the value of market value ratio influences the market's reaction and investors' confidence towards the ability of the company's management in generating profit efficiently and effectively. Market value ratios are shown in Figure 4.5.
Figure 4.5: Market value ratio
4.6.1 Price Earnings Ratio
Price earnings ratio shows the total ringgit that the investor is willing to pay for each ringgit of profit reported by the company. The level of price earnings ratio shows the degree of confidence of the investors towards the future performance of the company. The higher the price earnings ratio, the higher the confidence of the investors towards the company's future. Price earnings ratio can be obtained when the market price per share is divided by the earnings per share. To calculate the price earnings of Company ABC, we assumed that the market price for the company's share is RM3.23. Market price per share (2.23) Earnings per share
RM3.23 RM0.29
11.1
1.25
Price Earnings Ratio =
=
Industry average =
=
TOPIC 4 FINANCIAL STATEMENT ANALYSIS
130
The ratio shows that the degree of confidence of the investors towards the company is significantly higher compared to the industry average as the investors are willing to pay 11.10 times more for each company's share compared to 1.25 for each share in the industry average. You can see this price earning ratio in share prices section in the newspaper. However, newspapers provides current price ratio instead of latest profits. Investors prioritise more on the price relative to future earnings.
4.6.2 Dividend Yield Ratio
There are investors who will buy ordinary shares to receive dividends. Others will be more interested in the growth of their share market value. Dividend yield ratio measures the rate of return in the form of dividends received from a share investment. Assume that Company ABC practices a stable dividend policy and pays dividends of RM0.15 per share. This means that the investors will receive return from dividends of 4.6%. A lot of companies try to maintain paying a stable dividend and, if possible, increases the dividends so that investors will receive more returns from their share holdings. There are companies that pay small dividends and there are those that do not pay any dividends to their shareholders. This is because they put in more effort to expand their businesses by retaining and reinvesting the profit obtained.
Dividend Yield = Dividend per share
Market price per share (2.24)
= RM0.15
100RM3.23
X
= 4.6%

TOPIC 4 FINANCIAL STATEMENT ANALYSIS 131
1. ___________ is the ability of the company to fulfil its current liabilities' obligations by using its current assets.
2. Current ratio is similar to _________ divided with ___________. ______ is included in the calculation of current ratio but excluded from the calculation of the quick ratio.
3. Inventory turnover is obtained by dividing ___________ with _______________.
4. Ratio of total liabilities to ____________ is used to ascertain the level of debt in the capital structure.
5. Return on equity is obtained when ______________ is divided with ____________.
6. Price earnings ratio is equal to ______________ per share divided with _____________ per share.
X-Cell and N-Hance are two companies operating in the same industry. The financial information for both companies as at 31 December 2000 are as follows
Total assets Total liabilities Total equities Net sales Interest expenses Tax expenses Net profit Earnings per share Market price per share of ordinary shares Dividends per share for ordinary shares
X-CellRM3,000,000
1,800,0001,200,0003,700,000
90,000240,000380,000
5.6035.002.40
N-Hance RM1,600,000
960,000 640,000
1,880,000 38,000
100,000 180,000
2.10 26.50 0.50
For each of the company, calculate the following ratios: X-Cell N-Hance
(a) Return on assets _______________ _______________ (b) Return on equity _______________ _______________ (c) Net profit margin _______________ _______________ (d) Total asset turnover _______________ _______________ (e) Debt ratio _______________ _______________ (f) Equity multiplier _______________ _______________ (g) Interest coverage ratio _______________ ____________ __ (h) Price earnings ratio _______________ _______________ (i) Dividend yield ratio _______________ _______________
EXERCISE 4.4

TOPIC 4 FINANCIAL STATEMENT ANALYSIS
132
CONDUCTING A COMPLETE RATIO ANALYSIS
As stated above, one ratio is not sufficient to evaluate all aspects of the company's financial status. Therefore, the manager must conduct a complete ratio analysis to cover all aspects of liquidity, asset management, leverage, profitability and market value ratio. The two approaches can be conducted are: (a) DuPont Analysis looks at the main sections that contribute to the
companyÊs financial performance. (b) Summary of financial ratio analysis looks at all the financial aspects of the
company to identify sections that required further investigations or improvements.
4.7.1 DuPont Analysis
DuPont analysis is used by finance managers to evaluate the financial status of a company. The DuPont analysis combines the income statement and the balance sheet to become two measurements of profitability.
(a) return on assets; and
(b) return on equity The first step in DuPont analysis is to show the DuPont formula: Return on asset = Net profit margin x Total asset turnover = Profit after tax x Sales Sales Total assets = 7.5% x 0.85 times = 6.4% In the DuPont formula, the net profit margin measures the profitability of sales while the total asset turnover shows the efficiency of management in using assets to generate sales. The value of return on asset is calculated by using the DuPont formula is the same as the value of return on assets calculated directly parting section 2.10.4. However, the DuPont formula allows the company to evaluate its return on asset by separating it into two different components that is the profit on sales and efficiency in asset management.
4.7
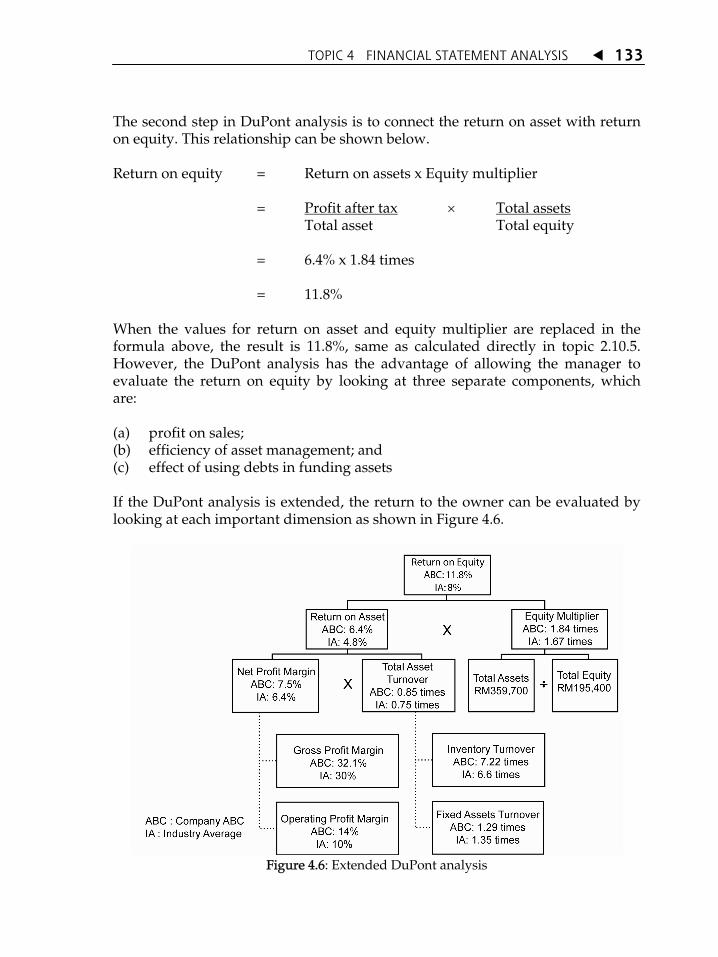
TOPIC 4 FINANCIAL STATEMENT ANALYSIS 133
The second step in DuPont analysis is to connect the return on asset with return on equity. This relationship can be shown below. Return on equity = Return on assets x Equity multiplier
= Profit after tax × Total assets Total asset Total equity
= 6.4% x 1.84 times
= 11.8% When the values for return on asset and equity multiplier are replaced in the formula above, the result is 11.8%, same as calculated directly in topic 2.10.5. However, the DuPont analysis has the advantage of allowing the manager to evaluate the return on equity by looking at three separate components, which are: (a) profit on sales; (b) efficiency of asset management; and (c) effect of using debts in funding assets If the DuPont analysis is extended, the return to the owner can be evaluated by looking at each important dimension as shown in Figure 4.6.
Figure 4.6: Extended DuPont analysis

TOPIC 4 FINANCIAL STATEMENT ANALYSIS
134
From Figure 4.6, we found that the return on equity for Company ABC (11.8%) is higher compared to the industry average (8%). This higher return on equity is influenced by the companyÊs higher return on asset compared to the industry and less influenced by the pattern of funding as illustrated by the equity multiplier. (Return on asset of the company is 6.41% while the return on asset of the industry is only 4.8%. The difference in equity multiplier between the company and the industry is quite marginal, 1.84 times for the company and 1.67 times for the industry). The difference in returns between the company and the industry is influenced by the difference in net profit margin compared to the difference in total assets turnover. The difference in profit margin between the company and industry is significant. (7.5% for the company and 6.4% for the industry) compared to the difference in total assets turnover (0.85 times for the company and 0.75 times for the industry). Net profit margin of the company is influenced by the higher operating profit margin compared to the gross profit margin. Therefore, the higher return on equity for the company is due to the management efficiently in managing its operations.
4.7.2 Summarising All Financial Ratios
The performance of Company ABC is valued based on five groups of ratio, which are:
(a) liquidity;
(b) asset management;
(c) leverage;
(d) profitability; and
(e) market value The companyÊs financial ratios can be compared with the ratio of other equivalent companies, or with the industry average at one point of time. These comparisons provides explanations on the financial status and performance of the company relatively compared to the performance of its competitors. This analysis uses industry average as a benchmark or standard of comparison. When the industry average cannot be obtained, comparisons are usually made with other companies in the same industry. This benchmark is assumed as the suitable value for a company in the same industry. The assumption here is for the companies in the same industry to have an almost identical financial ratio. If the
TOPIC 4 FINANCIAL STATEMENT ANALYSIS 135
ratio of a company shows a significant difference with the standard ratio, then further investigation must to be done to find the source of that difference. For evaluation, a companyÊs financial ratio is compared to the industryÊs ratios one by one, and then classified as satisfactory or unsatisfactory, depending upon the direction and how far it has diverted from standard. Figure 2.10 summarises the comparison between Company ABCÊs financial ratios with the industry average for the year 2001. From Figure 2.10, we can make a summary that: (a) Liquidity The companyÊs achievement in current ratio and quick ratio are much
different compared with the industry. Overall, the companyÊs liquidity is rather satisfactory.
(b) Asset Management The companyÊs inventory management is quite satisfactory. The company
might face problems with its account receivables as the collection period for company is higher compared to the industry. Therefore, attention had to be given to the management of account receivables.
(c) Leverage The level of the companyÊs debts is higher than the industry average.
However, the ability of the company to pay interests is better compared to the industry.
(d) Profitability Profitability, relative to the investors (as seen in the return on asset and
return on equity ratios) of the company is better compared to the industry. This is the same with the gross profit margin and net profit margin.
(e) Market Value The companyÊs shares were sold at the lower price earnings ratio than the
industry. This is the same for dividends yield ratio which is smaller compared with the industry.

TOPIC 4 FINANCIAL STATEMENT ANALYSIS
136
Table 4.1: Summary of Ratio Analysis for Company ABC Compared with the Industry Average for Year 2001
Company ABC Industry Average Notes* Liquidity Ratio Current ratio Quick ratio Asset Management Ratio Account receivable turnover Average collection period Inventory turnover Average inventory sales period Fixed asset turnover Total asset turnover Leverage Ratio Debt ratio Debt-equity ratio Interest coverage ratio Profitability Ratio Gross profit margin Net profit margin Return on assets Return on equity Earnings per share Market Value Ratio Price earnings ratio Dividend yield ratio
1.97 times 1.51 times 6.11 times 58.92 days 7.22 times 49.86 days 1.29 times 0.85 times 45.7% 52.4% 4.49 times 32.1% 7.5% 6.42% 11.80% RM0.29 RM11.1 RM0.046
2.05 times 1.43 times 8.24 times 44.3 days 6.6 times 55.30 days 1.35 times 0.75 times 40.0% 50% 4.3 times 30% 6.4% 4.8% 8.0% RM0.26 RM1.25 RM0.50
US US US US S US US S US S S S S S S S US US
* S = Satisfactory US = Unsatisfactory
WEAKNESSES IN FINANCIAL RATIO
Financial ratio is an important tool in financial analysis but when the users apply the financial ratios, they must take into consideration the weaknesses related to these financial ratios. Among the weaknesses are:
(a) The accuracy of the financial ratio depends on the accuracy of the data found in the financial statements.
4.8

TOPIC 4 FINANCIAL STATEMENT ANALYSIS 137
(b) In using the financial ratio for industrial comparison purposes, the users must take into consideration that the industry ratio is only a rough estimate. This is due to the difficulty to obtain the entire firms in the same industry.
(c) Financial ratio is a relative measurement and does not show the actual size of the firm.
(d) Financial ratio is used to measure the status of the firm but it can not show the issues that had caused the situation.
Please visit the following websites to obtain additional information regarding the topics discussed in this chapter. http://www.ppkm.net/ Description: Persatuan Pasaran Kewangan Malaysia was established with the objective to provide an organisation for individuals who are actively engaged in the foreign exchange and financial markets in Malaysia. http://www.finpipe.com/equity/finratan.htm Description: Introduction of Financial Ratio Analysis http://www.investopedia.com/university/ratios/ Description: Steps and explanations on the calculations of Financial Ratio Analysis http://www.credit-to-cash-advisor.com/Document.asp?lid=120 Description: Detail explanation on DuPont Analysis including a convenient web calculator.

TOPIC 4 FINANCIAL STATEMENT ANALYSIS
138
1. When ratio comparisons show an obvious change in the financial status of a company, the manager should investigate the matter further.
(a) True (b) False
2. In the DuPont Analysis, return on equity is the result of
multiplying three other ratios: net profit margin, total asset turnover and return on asset.
(a) True (b) False
3. Net profit divided by total asset is ___________ ratio.
A. Return on equity B. Current ratio C. Gross profit margin D. Return on asset
4. Dividend yield ratio is:
A. Total money distributed to shareholders. B. Dividends paid to shareholders divided by retained
earnings. C. Dividends per share divided by price per share. D. Retained earnings divided by sales.
5. Use the following information to calculate the net profit.
Return on asset = 2% Total asset turnover = 0.5 times Cost of goods sold = RM105,000 Gross profit margin = 30%
6. Calculate the return on equity based on the information below:
Sales = RM100,000 Net profit = RM3,000 Total assets = RM150,000 Total liabilities = RM75,000
EXERCISE 4.5
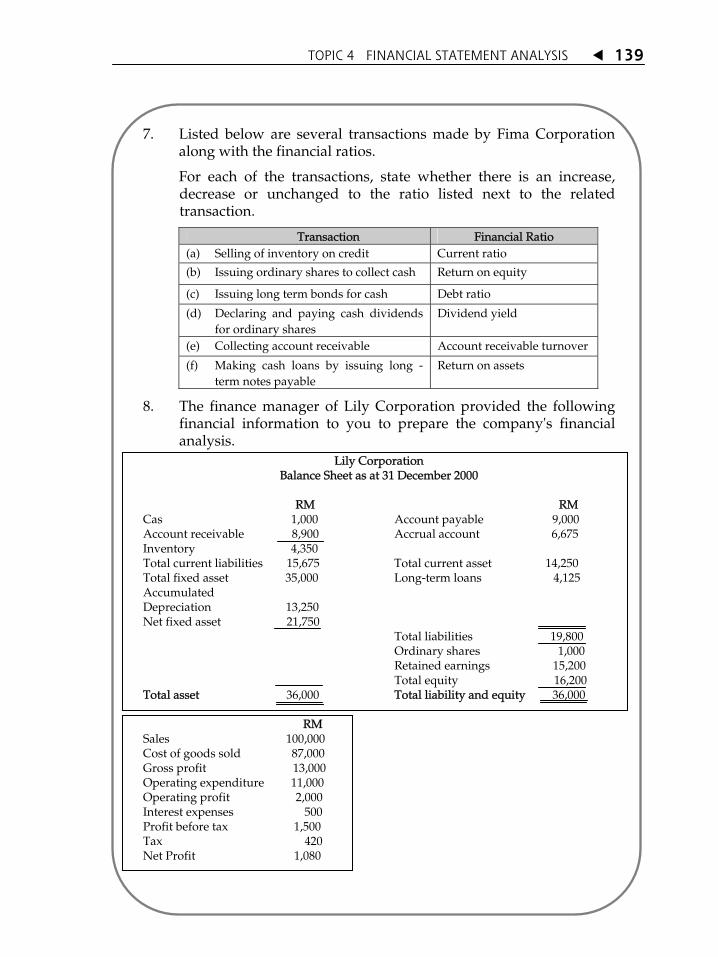
TOPIC 4 FINANCIAL STATEMENT ANALYSIS 139
7. Listed below are several transactions made by Fima Corporation along with the financial ratios.
For each of the transactions, state whether there is an increase, decrease or unchanged to the ratio listed next to the related transaction.
Transaction Financial Ratio (a) Selling of inventory on credit Current ratio
(b) Issuing ordinary shares to collect cash Return on equity
(c) Issuing long term bonds for cash Debt ratio
(d) Declaring and paying cash dividends for ordinary shares
Dividend yield
(e) Collecting account receivable Account receivable turnover
(f) Making cash loans by issuing long -term notes payable
Return on assets
8. The finance manager of Lily Corporation provided the following financial information to you to prepare the company's financial analysis.
Lily Corporation Balance Sheet as at 31 December 2000
RM RM Cas 1,000 Account payable 9,000 Account receivable 8,900 Accrual account 6,675 Inventory 4,350 Total current liabilities 15,675 Total current asset 14,250 Total fixed asset 35,000 Long-term loans 4,125 Accumulated Depreciation 13,250 Net fixed asset 21,750 Total liabilities 19,800 Ordinary shares 1,000 Retained earnings 15,200 Total equity 16,200 Total asset 36,000 Total liability and equity 36,000 RM Sales 100,000 Cost of goods sold 87,000 Gross profit 13,000 Operating expenditure 11,000 Operating profit 2,000 Interest expenses 500 Profit before tax 1,500 Tax 420 Net Profit 1,080
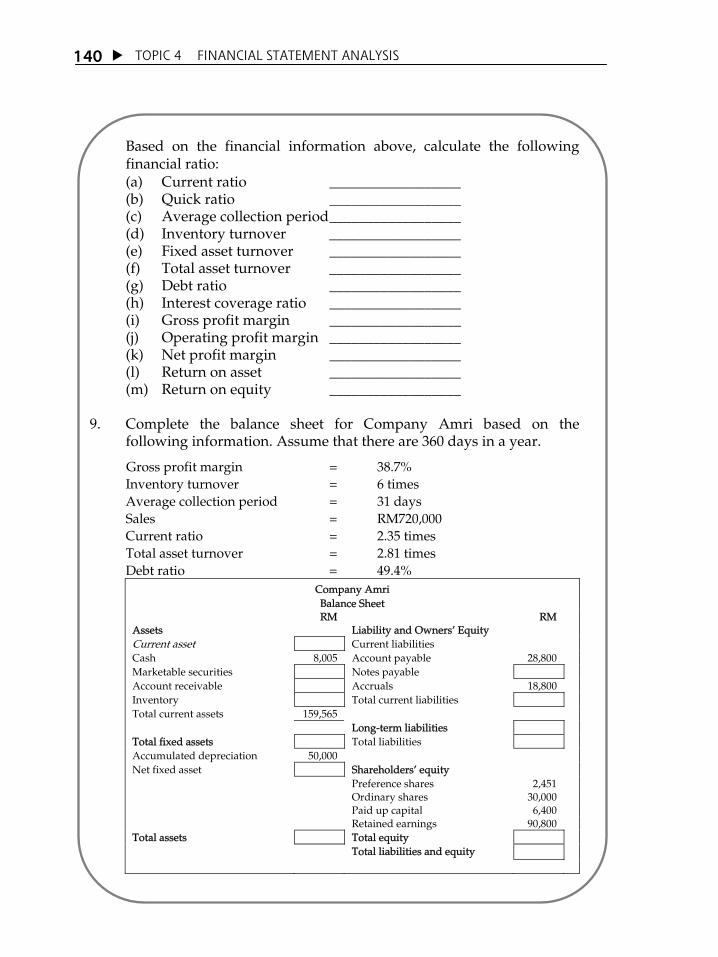
TOPIC 4 FINANCIAL STATEMENT ANALYSIS
140
Based on the financial information above, calculate the following financial ratio: (a) Current ratio __________________ (b) Quick ratio __________________ (c) Average collection period __________________ (d) Inventory turnover __________________ (e) Fixed asset turnover __________________ (f) Total asset turnover __________________ (g) Debt ratio __________________ (h) Interest coverage ratio __________________ (i) Gross profit margin __________________ (j) Operating profit margin __________________ (k) Net profit margin __________________ (l) Return on asset __________________ (m) Return on equity __________________
9. Complete the balance sheet for Company Amri based on the
following information. Assume that there are 360 days in a year.
Gross profit margin = 38.7% Inventory turnover = 6 times Average collection period = 31 days Sales = RM720,000 Current ratio = 2.35 times Total asset turnover = 2.81 times Debt ratio = 49.4%
Company Amri Balance Sheet
RM RM Assets Liability and OwnersÊ Equity Current asset Current liabilities Cash 8,005 Account payable 28,800 Marketable securities Notes payable Account receivable Accruals 18,800 Inventory Total current liabilities Total current assets 159,565 Long-term liabilities Total fixed assets Total liabilities Accumulated depreciation 50,000 Net fixed asset ShareholdersÊ equity Preference shares 2,451 Ordinary shares 30,000 Paid up capital 6,400 Retained earnings 90,800 Total assets Total equity Total liabilities and equity

TOPIC 4 FINANCIAL STATEMENT ANALYSIS 141
Financial analysis ratio is suitable to be used when the company wants to interpret the financial statements of the company. Liquidity ratios such as net working capital, current ratio and quick ratio enables the measurement of the companyÊs ability to fulfil its short-term maturity claims. Asset management ratios measure the companyÊs efficacy in using the assets. The examples of this ratio includes account receivable turnover, average collection period, inventory turnover, average inventory sales period, fixed asset turnover and total asset turnover. Leverage ratio measures the level a company being funded by debt or the ability of a company to fulfil its financial claims such as interest claims. Profitability ratio measures the effectiveness of the company in generating returns from investment and sales; for example gross profit margin, net profit margin, return on assets and return on equity. Market value ratio such as price earnings ratio and dividend yield ratio, measures the ability of a company to create values in the market exceeding its investment costs. This aspect is very important as these ratios are directly connected with the companyÊs objective that is to maximise shareholderÊs wealth and value of the company. The DuPont analysis is used by finance managers to evaluate the financial status of the company by measuring the two important ratios, which are return on assets ratio and return on equity ratio while the approach on summarising the financial ratio analysis is to show all aspects of the companyÊs overall financial status to identify sectors that require further investigation.

TOPIC 4 FINANCIAL STATEMENT ANALYSIS
142
TUTORIAL QUESTION
INTRODUCTION
This activity is for the purpose of enhancing your further understanding on the main financial statements that are used to make the future plans of the company.
PROBLEM
The following are the financial data for Company SAA. The items in the balance sheet are values as at year ended 2000 and 2001, while the items in the income statement are income or expenditure throughout the year ended 2000 or 2001 (all values are in thousand of ringgit).
2000 2001 Sales revenue Cost of goods sold Depreciation Inventory Administrative expenses Interest expenses Tax Account payable Account receivable Fixed asset, net Long term loan Notes payable Dividends payable Cash and marketable securities
RMÊ000 4,000 1,600
500 300 500 150 400 300 400
5,000 2,000 1,000
410 800
RMÊ000 4,100 1,700
520 350 550 150 420 350 450
5,800 2,400
600 410 300

TOPIC 4 FINANCIAL STATEMENT ANALYSIS 143
QUESTION
(a) Prepare the balance sheet for Company SAA as at year 2000 and 2001. How much is the shareholdersÊ equity?
(b) Net working capital = Current asset Current liability. What had happened
to the net working capital throughout the year? (c) Prepare the income statement for Company SAA for the year ended 2000
and 2001. How much is the retained earnings for year 2001? Compare the increase in shareholdersÊ equity between these two years.
(d) Assumed the numbers of shares issued are 500,000 units. What is the
earnings per share? (e) Look at the values of net fixed asset for year 2000 and depreciation for year
2001. How much is the total investment of fixed assets in the year 2001? (f) Prepare the cash flow statement for Company SAA for year 2001.

INTRODUCTION
The public generally, assume time as very precious and must be managed efficiently. They place the value of time on par with various valuable objects and one of the globally accepted proverb is 'time is money'. From the financial management perspective, this proverb is a phrase that can be measured and proven quantitatively by using the financial mathematics. In fact, this quantitative prove has developed as one of the basic principles in financial decisions making known as the concept for time value of money.
TTooppiicc 55 Time Value of Money
LEARNING OUTCOMES At the end of this topic, you will be able to:
1. identify the basic concept for time value of money that is known as the concept of compounding to determine the future time value of an investment made today;
2. identify the advance concept for time value of money that is known as the concept of discounting to calculate the present value for a sum of cash that will be accepted in the future;
3. explain the concept for time value of money for single cash flow and series cash flow, annuity, perpetuity and derivation cash flow; and
4. analyse the concepts of compounding and discounting that occur frequently, more than once a year and that occur continuously.

TOPIC 5 TIME VALUE OF MONEY 145
CONCEPT OF COMPOUNDING AND FUTURE VALUE
Rationally, you will certainly choose the offer at the beginning of the year as the value of money makes this alternative more profitable. The concept of compounding is the core in the concept for time value of money. The concept of compounding, in brief, explains that RM1 today is more valuable than RM1 in the future. This is because RM1 today can be invested to generate interest and subsequently multiply to become more than RM1 at the end of the investment year. Among the reasons why the time value of money makes this alternative more valuable are: • In general, individuals are more interested in the present usage than
postponing the usage to the future. • During the inflation periods caused by uncontrollable development in the
economy, the real purchasing power of RM1 now is more that the real purchasing power of RM1 in the coming years.
• Capital that is obtained now can be invested productively to generate a higher return in the future.
5.1.1 Time Line
The drawing of time line in Figure 3.1 can ease the understanding of the concept of time value of money especially for complex problems. Time is divided into several periods of valuation that is shown along the horizontal line and the calculation of the period begins from left to right. Time 0 (t0) refers to the present time or the starting of the first period, time 1 (t1) refers to the end of the first period or the starting of the second period, time 2 (t2) refers to the end of the second period or the starting of the third period and so forth.
5.1
If you were given two choices either an offer of RM1,000 in the beginning of the year or an offer of RM1,000 at the end of the year, which offer will you choose?
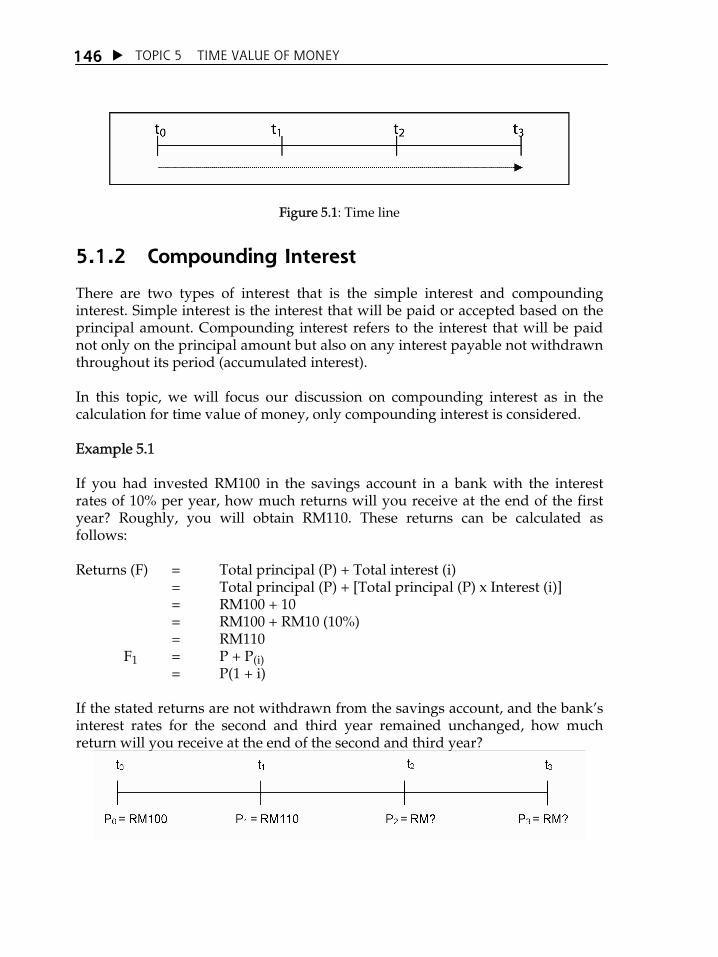
TOPIC 5 TIME VALUE OF MONEY
146
Figure 5.1: Time line
5.1.2 Compounding Interest
There are two types of interest that is the simple interest and compounding interest. Simple interest is the interest that will be paid or accepted based on the principal amount. Compounding interest refers to the interest that will be paid not only on the principal amount but also on any interest payable not withdrawn throughout its period (accumulated interest). In this topic, we will focus our discussion on compounding interest as in the calculation for time value of money, only compounding interest is considered. Example 5.1 If you had invested RM100 in the savings account in a bank with the interest rates of 10% per year, how much returns will you receive at the end of the first year? Roughly, you will obtain RM110. These returns can be calculated as follows: Returns (F) = Total principal (P) + Total interest (i) = Total principal (P) + [Total principal (P) x Interest (i)] = RM100 + 10 = RM100 + RM10 (10%) = RM110
F1 = P + P(i) = P(1 + i) If the stated returns are not withdrawn from the savings account, and the bankÊs interest rates for the second and third year remained unchanged, how much return will you receive at the end of the second and third year?
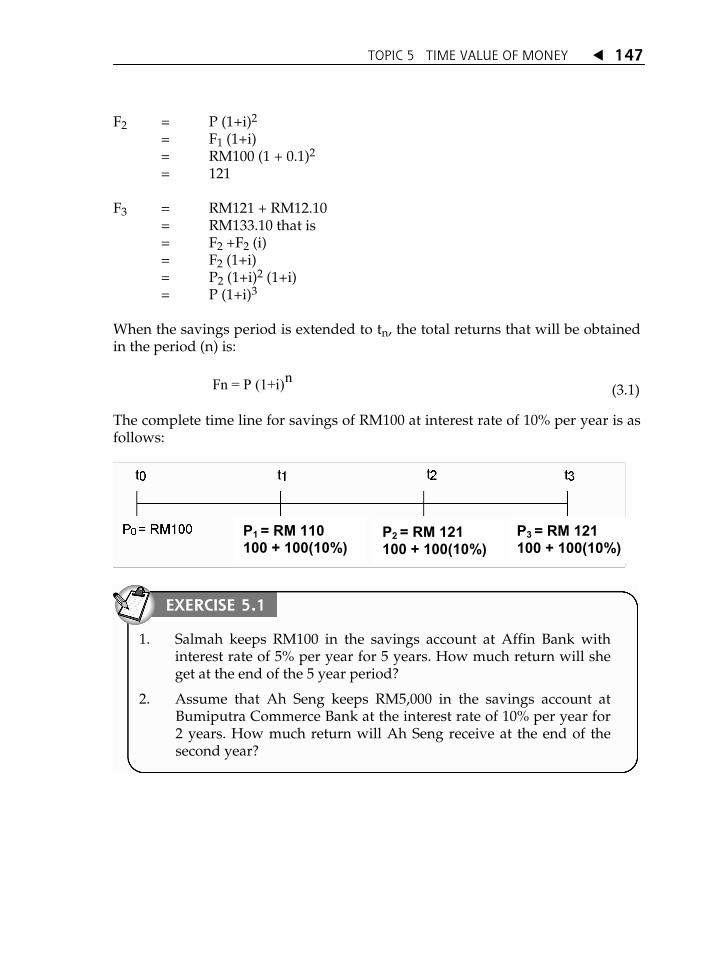
TOPIC 5 TIME VALUE OF MONEY 147
F2 = P (1+i)2 = F1 (1+i) = RM100 (1 + 0.1)2 = 121 F3 = RM121 + RM12.10 = RM133.10 that is = F2 +F2 (i) = F2 (1+i) = P2 (1+i)2 (1+i) = P (1+i)3
When the savings period is extended to tn, the total returns that will be obtained in the period (n) is:
nFn = P (1+i) (3.1)
The complete time line for savings of RM100 at interest rate of 10% per year is as follows:
1. Salmah keeps RM100 in the savings account at Affin Bank with interest rate of 5% per year for 5 years. How much return will she get at the end of the 5 year period?
2. Assume that Ah Seng keeps RM5,000 in the savings account at Bumiputra Commerce Bank at the interest rate of 10% per year for 2 years. How much return will Ah Seng receive at the end of the second year?
EXERCISE 5.1
P1 = RM 110 100 + 100(10%)
P2 = RM 121 100 + 100(10%)
P3 = RM 121 100 + 100(10%)

TOPIC 5 TIME VALUE OF MONEY
148
5.1.3 Calculation of Future Value Using Schedule
Calculation of future value using the formula of Fn = nP (1+i) with the value of n being more than one sometimes takes a rather long time. Therefore, the usage of a financial schedule that is the schedule of Future Value Interest Factor (FVIF i,n) helps to save time in calculations. The equation 3.2 shows that the future value (FVn) is equivalent to the principal at the point of time equal to 0 or the original principal amount (PV0) multiply with the future value factor stated in the schedule of Future Value Interest Factor (FVIF i,n). This schedule is enclosed in Attachment A.
FVn = PV0 (FVIF i,n) (3.2)
As a basic guide on the usage of the financial schedule, please refer to the extract on the schedule of Future Value Interest Factor (FVIFi,n) in Table 3.1 to solve examples 5.2 and 5.3. Example 5.2 You deposited RM2,000 in the savings account in a bank at a yearly interest rate of 5% for the period of one year. Upon the completion of one year, how much return will you receive?
FVn = PV0 (FVIF i,n) = RM2,000 (FVIF 5%, 1) = RM2,000 (1.0500) = RM2,100 Example 5.3 Assume you deposited RM2,000 in the savings account in your bank at a yearly interest rate of 5% for the period of four years. Upon the completion of four years, how much return will you receive?
FVn = PV0 (FVIF i,n) = RM2,000 (FVIF 5%, 4) = RM2,000 (1.216) = RM2,432

TOPIC 5 TIME VALUE OF MONEY 149
Table 5.1: Extract from the Future Value Interest Factor (FVIF i, n) Schedule
It must be remembered that sometimes different answer might exist by using manual calculation compared to the calculations using the schedule. This is due to the usage of different numbers of decimal points. However, the difference is not obvious and both answers are acceptable.
5.1.4 Graphical Illustration of Future Value
There are three basic elements which will influenced the future value, these are:
(a) principal (amount that was borrowed or invested);
(b) time period (the number of periods or frequency of interest payments); and
(c) interest rate payable (if the money was borrowed) or interest receivable (if the money was invested).
Use the schedule of Future Value Interest Factor (FVIFi,n) in Attachment A to calculate the answers for the questions below.
1. Assume that you keep RM5,555 in the savings account at Affin Bank with an interest rate of 15% per year for 5 years. How much potential return will you obtain at the end of the 5 year period?
2. If you keep RM4,321 in the savings account at Maybank with an interest rate of 7% per year for 2 years, how much potential return will you obtain at the end of the 2 years period?
EXERCISE 5.2
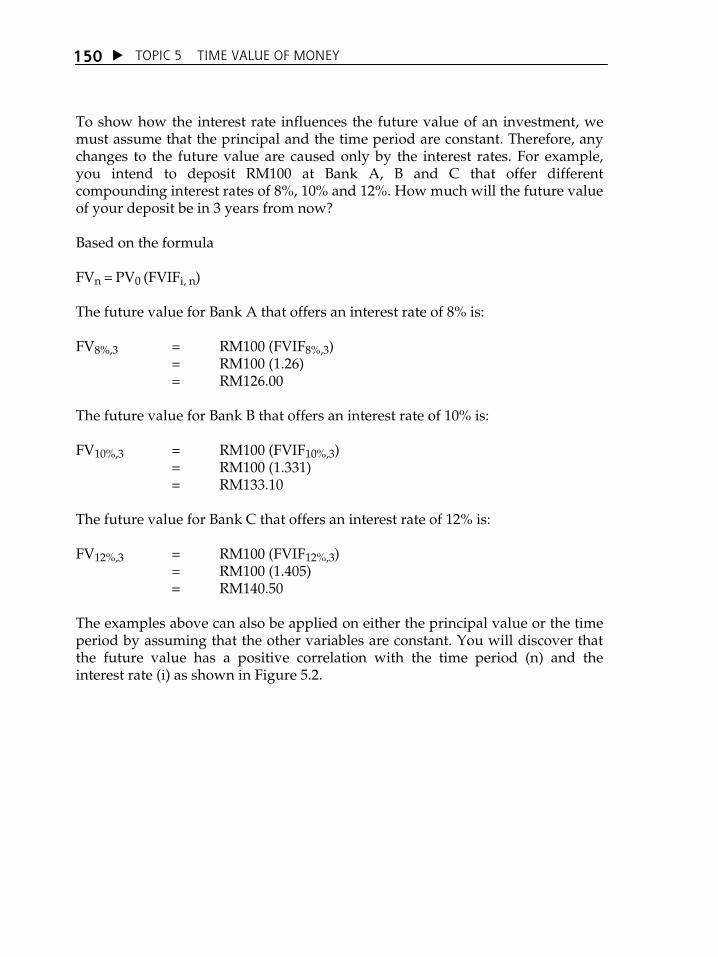
TOPIC 5 TIME VALUE OF MONEY
150
To show how the interest rate influences the future value of an investment, we must assume that the principal and the time period are constant. Therefore, any changes to the future value are caused only by the interest rates. For example, you intend to deposit RM100 at Bank A, B and C that offer different compounding interest rates of 8%, 10% and 12%. How much will the future value of your deposit be in 3 years from now? Based on the formula FVn = PV0 (FVIFi, n) The future value for Bank A that offers an interest rate of 8% is: FV8%,3 = RM100 (FVIF8%,3) = RM100 (1.26) = RM126.00 The future value for Bank B that offers an interest rate of 10% is: FV10%,3 = RM100 (FVIF10%,3) = RM100 (1.331) = RM133.10 The future value for Bank C that offers an interest rate of 12% is: FV12%,3 = RM100 (FVIF12%,3) = RM100 (1.405) = RM140.50 The examples above can also be applied on either the principal value or the time period by assuming that the other variables are constant. You will discover that the future value has a positive correlation with the time period (n) and the interest rate (i) as shown in Figure 5.2.

TOPIC 5 TIME VALUE OF MONEY 151
Figure 5.2: Correlation between interest rate, time period and future value for RM100.
CONCEPT OF DISCOUNTING AND PRESENT VALUE
The second concept that is related with the time value of money is the concept of cash flow discounting. This concept is used to ascertain the present value (PV0) or principal value for a sum of money in the future (FV0) that is discounted at an interest rate known as rate of return (i) for the valuation period (t).
5.2
As a bank manager, what are your strategies in attracting more people to deposit and invest in your bank?
In your opinion, how is the concept of discounting and present value different from compounding and future value?

TOPIC 5 TIME VALUE OF MONEY
152
The process to determine the present value is the reverse process of determining the future value. The relationship between these two processes is illustrated in the time line in Figure 5.3.
Figure 5.3: Comparison between future value and present value
5.2.1 Calculation of Present Value
The process of discounting is the reverse process of compounding. The present value (principal) can be found with a small variation to the basic formula of calculating the future value (formula 5.1). Example 5.4 Assume you expect to receive returns of RM2,500 a year from now. How much is the present value for RM2,500 if the discount rate or rate of return is 8% per year?
nFV = 0nPV (1+ i)
RM2, 500 = 10PV (1+ 0.08)
0PV = RM2, 500
1.08
= RM2, 314.81

TOPIC 5 TIME VALUE OF MONEY 153
What is the present value that you must invest if you expect a return of RM2,500 in the period (a) 2 years and (b) 3 years at a discount rate of 8% per year?
The present value of RM2,500 at a rate of 8% in period 1,2 and 3 years are as follows:
If the discounting period is extended to tn, the principal amount that must be invested is
n0 n
FVPV =
(1+i) (3.3)
Or PV 0 = FVn [1/(1+i)n]
RM2,314.81 RM2,500
FV2 = PV0 (1+i)2
RM2,500 = PV0 (1+0.08)2
PV0 =
RM2,500(1+1.08) 3
RM2,143.35
FV3 = PV0 (1+i)3
RM2,500 = PV0 (1+0.08)3
PV0 =
PV0 =
RM2,500(1+1.08)2
= RM1,984.58

TOPIC 5 TIME VALUE OF MONEY
154
5.2.2 Calculation of Present Value (Principal) Using Schedule
Similar to the future value factor, the present value factor can also be obtained by using a schedule that is the Present Value Interest Factor (PVIFi,n) as attached in Attachment B. The usage of this schedule helps to simplify the calculation of present value especially in complex problems. The equation 5.4 shows the present value (PV0) is equal to the future value amount (FVn) multiply with the present value interest factor (PVIFi,n). PV0 = FVn (PVIF i,n) (3.4) As a basic guide on the usage of the financial schedule, please refer to the extract on the schedule of Present Value Interest Factor (PVIFi,n) in Table 3.2 to solve examples 5.5 and 5.6. Example 5.5
Assume you expect to receive RM3,999 in 3 years time from now. How much is the present value for RM3,999 if the discount rate or rate of return is 9% per year? PV 0 = FV (PVIF i,n) = RM3,999 (PVIF 9%,3) = RM3,999 (0.772) = RM3,087.23 Example 5.6
You intend to accumulate savings money at the bank for RM5,713 in the period of 4 years from now. How much savings you must make now if the interest rate offered by the bank is 10 percent per year?
1. You want RM1,100 in your account a year from now. How much investment must you make now if the interest rate offered by the bank is 10%?
2. Seri Sdn. Bhd. offers a low risk security that promises a payment of RM3,000 at the end of 2 years period with an offer of 15% interest rate per year. What is the present value for RM3,000?
EXERCISE 5.3

TOPIC 5 TIME VALUE OF MONEY 155
PV 0 = FV (PVIF i,n) = RM5,713 (PVIF 10%,4) = RM5,713 (0.683) = RM3,901.98
Table 5.2: Extract of Present Value Interest Factor Schedule (PVIF i, n)
It must be remembered that sometimes different answer might exist by using manual calculation compared to the calculations using the schedule. This is due to the usage of different numbers of decimal points. However, the difference is not obvious and both answers are acceptable.
Use the schedule of present value interest factor to help you solve the questions below: 1. Assume that you are given the opportunity to purchase a low
risk security that promised a payment of RM127.63 at the end of the period of 5 years with an interest rate offer of 5% per year. How much is the present value for RM127.63?
2. You plan to accumulate savings money in the bank for RM6,213
in a period of 5 years from now. How much savings must you make now if the interest rate offered by the bank is 12% per year?
EXERCISE 5.4

TOPIC 5 TIME VALUE OF MONEY
156
5.2.3 Graphical Illustration of Present Value
To show how the interest rate influences the present value (principal) of an investment, we must assume that the future value (returns) and the time period are constant. Therefore, any changes to the present value are caused only by the interest rates. Example 5.7 You intend to obtain returns of RM1,000 in a period of 3 years in Bank A, B and C that offer different compounding interest rates of 8%, 10% and 12%. What is the principal value that you should make? The principal value for Bank A that offers an interest rate of 8% is: PV 8%,3 = RM1,000 (PVIF 8%,3) = RM1,000 (0.7938) = RM793.80 The principal value for Bank B that offers an interest rate of 10% is: PV 10%,3 = RM1,000 (PVIF 10%,3) = RM1,000 (0.7513) = RM751.30 The principal value for Bank C that offers an interest rate of 12% is: PV 12%,3 = RM1,000 (PVIF 12%,3) = RM1,000 (0.7118) = RM711.80 The examples above can also be applied either in the future value or time period by assuming that the other variables are constant. You will find that the future value has a negative relation with the time period (n) and interest rates (i) as shown in Figure 5.4. This graph explains that the principal value of RM1,000 that will be received in the future will decrease when the acceptance period is extended. The rate of decrease for present value is higher with the increase in discount rates or interest rates.
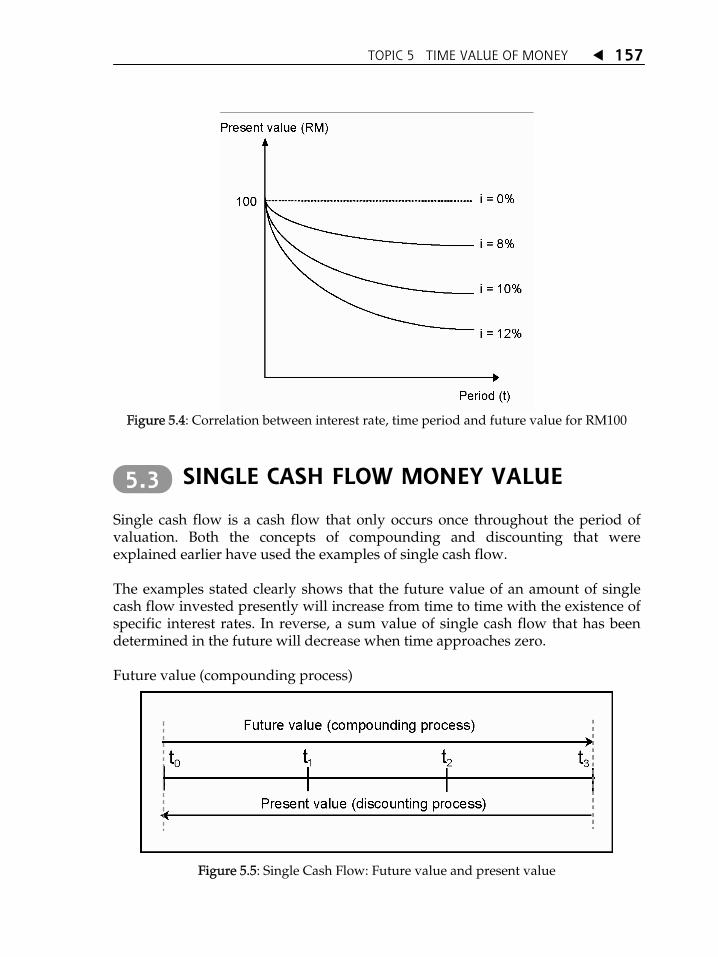
TOPIC 5 TIME VALUE OF MONEY 157
Figure 5.4: Correlation between interest rate, time period and future value for RM100
SINGLE CASH FLOW MONEY VALUE
Single cash flow is a cash flow that only occurs once throughout the period of valuation. Both the concepts of compounding and discounting that were explained earlier have used the examples of single cash flow. The examples stated clearly shows that the future value of an amount of single cash flow invested presently will increase from time to time with the existence of specific interest rates. In reverse, a sum value of single cash flow that has been determined in the future will decrease when time approaches zero. Future value (compounding process)
Figure 5.5: Single Cash Flow: Future value and present value
5.3

TOPIC 5 TIME VALUE OF MONEY
158
SERIES CASH FLOW MONEY VALUE
The concept of future value and present value is not limited to the process of compounding and discounting single cash flow only. These concepts can be applied to a series of cash flow. A series cash flow means that there are a series of receiving or payments of cash that occur throughout the valuation period. There are several categories of series cash flow which are annuity, derivation cash flow and perpetuity.
5.4.1 Annuity
Annuity is a series of payment or receiving of the same amount at the same intervals throughout the period of valuation. Therefore, a cash flow of RM5 each month for one year is an annuity. While a cash flow of RM5 that is swap alternately with a cash flow of RM10 each month for a year is not an annuity. Annuity has a clearly stated starting point and an ending, in other words, annuity cash flow would not be indefinite. Normally, annuity occurs at the end of each period and this annuity is known as ordinary annuity. However, in some cases, annuity occurs at the beginning of the period and this type of annuity is known as annuity due. (a) Future Value of Ordinary Annuity Ordinary annuity is annuity that occurs at the end of each period as shown
in Figure 5.6.
Figure 5.6: Time line of ordinary annuity
The finance manager often makes future planning for the company but they usually do not know how much investment or savings that must be saved continuously to accumulate the sum of money required in the future. The future value of annuity is the number of annuity payments at a specific amount (n) that will increase at a specific period based on a specific interest rate (i).
5.4

TOPIC 5 TIME VALUE OF MONEY 159
Example 5.8 You had deposited RM100 at the end of each year for 3 years continuously in the account that pays a yearly interest of 10%. How much is the future value of that said annuity? The solution can be illustrated by the time line below:
First step : Calculate the future value for t1, t2 and t3. Second step : Total the three future values to get the future value annuity
(FVA). First step: F1 = RM100(1+0.1) 1 = RM100 (1.1) = RM110 F2 = RM100(1+0.1) 2 = RM100 (1.21) = RM121 F3 = RM100 (no increase in the future value as the deposit was made at the end of the third year). Second step: FVA3 = F1 + F2 + F3 = RM110 + RM121 + RM100 = RM331

TOPIC 5 TIME VALUE OF MONEY
160
The steps shown in the example above takes time even though it is a simple example. In cases where the calculation for future value of annuities are for a period of 20 or 30 years, it will be slow with complicated calculations. Therefore, we can simplify the calculations by using the formula below:
nA [ (1 + i) – 1]FVA = n i
(3.5)
FVAn = A(FVIFAi,n ) (3.6) Equation 3.5 used to solve the future value problems that involve the ordinary annuity is by manual calculation. While equation 3.6 is the solution formula for ordinary annuity using schedule. Annuity future value schedule can be obtained in Attachment C. Example 5.9 Danon Company deposited RM5,000 at the end of each year for a period of 3 years consecutively in an account that pays a yearly interest of 10 percent. What is the future value of that annuity? (i) Manual solution
n
n
A [ (1 + i) - 1]FVA =
i3RM5, 000 [(1 + 0.10) 1]
= 0.10
= RM16, 550
(ii) Solution using schedule
i, nFVA = A (FVIFA )n = RM5, 000
= RM5, 000 (3.310)
= RM16, 550

TOPIC 5 TIME VALUE OF MONEY 161
The time line for future value of ordinary annuity of RM5,000 for 3 years at a rate of 10% per year is as below:
(b) Future Value of Annuity Due
Sometimes we face a situation where the payment of annuity is at the beginning of a period, for example, the beginning of each month or year. This type of annuity is known as annuity due where it is different from ordinary annuity as ordinary annuity is paid at the end of a period. Annuity due occurs more frequently in future value annuity problems than present value annuity (PVA). Figure 5.7 shows the timeline for annuity due.
Figure 5.7: Time line for annuity in advance.
The equation of annuity due can be formulated with a little alteration to the ordinary annuity equation that is by multiplying the equation of ordinary annuity with (1 + i). This alteration is made because the cash flow for annuity due occurs at the beginning of a period. (i) Manual equation
n
n
A [ (1 + i) 1] (1 + i)FVA =
i (3.7)
(ii) Equation using schedule
FVA n = A (FVIFA i,n) (1 + i) (3.8)

TOPIC 5 TIME VALUE OF MONEY
162
Example 5.10 helps you to differentiate between ordinary annuity and annuity due. Example 5.10 Danon Company deposited RM5,000 at the beginning of each period for 3 years consecutively in the account that pays yearly interest of 10 percent. How much is the future value for that annuity? (i) Solving manually
⎡ ⎤⎢ ⎥⎣ ⎦
⎡ ⎤⎢ ⎥⎢ ⎥⎣ ⎦
n (1 + i) 1 nA = A (1 + i) i
3[1 + 0.10) 1] (1 + 0.10)= RM5, 000
0.10
= RM18, 205
(ii) Solving using schedule
FVA = A (FVIFA ) (1 + i)n i, n= RM5,000 (3.310) (1.10)
= RM18,205
The time line for future value annuity due of RM5,000 for 3 years at an interest rate of 10% per year is as follows:
t0 t1 t2 t3
RM5,000 RM5,000 RM5,000
From the solution above, we found that the future value for annuity due (RM18,205 in example 5.10) is higher compared to the future value for ordinary annuity (RM16,550 in example 5.9). This is because for annuity due, the deposit is
RM18,205

TOPIC 5 TIME VALUE OF MONEY 163
deposited in the beginning of the period and therefore generates interest longer compared to the ordinary annuity where the deposit is deposited at the end of the period.
(c) Present Value of Ordinary Annuity Payment of annuity promises a return rate (investment in bonds) and cash
flow (cash flow resulting from investment in equipment and plant). Therefore, it is important for a finance manager to know the value of the investment at the present time.
As an example, a finance manager finds that an annuity that promises four
yearly payments of RM500 starting from the current year. How much must be paid by the finance manager to obtain that annuity? The principal amount that must be paid by the finance manager is the present value of ordinary annuity.
The present value of ordinary annuity (PVAn) can be obtained by using the
manual equation (equation 5.9) or by using the financial schedule in Attachment D (equation 5.10). Both the equations below refer to the present value annuity (PVA n) equivalent to the annuity cash flow multiply by the present value annuity factor.
(i) Manual equation
n
n [ 1 –[1/(1 + i) ]PVA = A
i⎧ ⎫⎨ ⎬⎩ ⎭
(5.9)
Solve the questions below by using the manual formula or schedule (FVIFA i,n). 1. Assume you had deposited RM100 into the bank at the beginning
of the year for 3 years in the savings account that gives 5% interest rate. How much can be obtained at the end of the third year?
2. Mr. Yeoh deposited RM10,000 into the bank on 31st December each
year for 5 years at an interest rate of 10%. How much can he obtain at the end of the fifth year?
EXERCISE 5.5
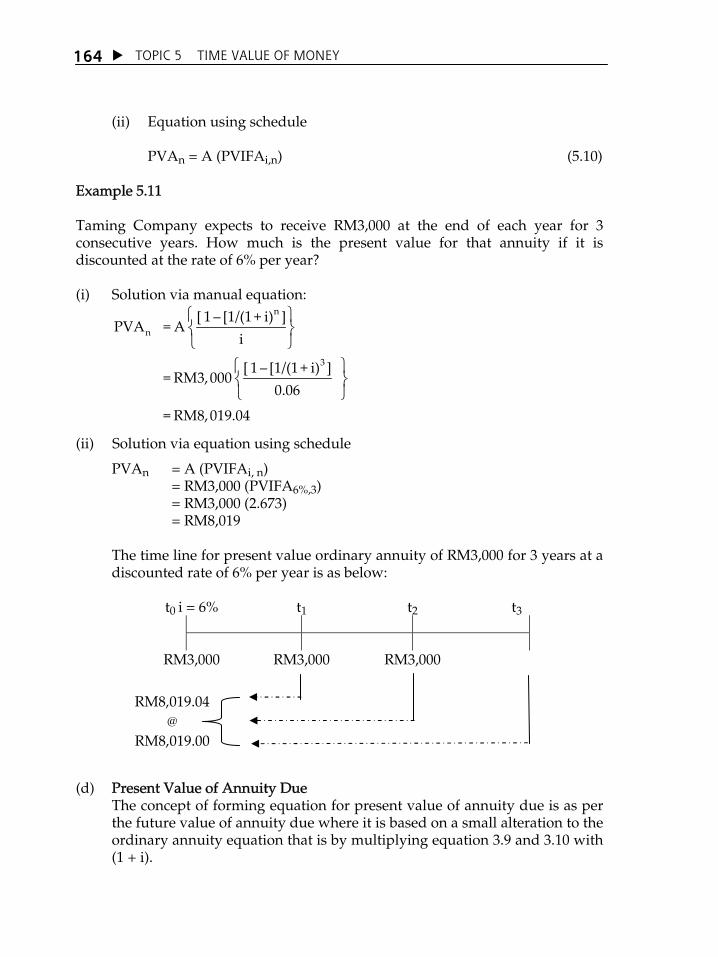
TOPIC 5 TIME VALUE OF MONEY
164
(ii) Equation using schedule PVAn = A (PVIFAi,n) (5.10)
Example 5.11 Taming Company expects to receive RM3,000 at the end of each year for 3 consecutive years. How much is the present value for that annuity if it is discounted at the rate of 6% per year? (i) Solution via manual equation:
⎧ ⎫⎨ ⎬⎩ ⎭
⎧ ⎫⎨ ⎬⎩ ⎭
n
n
3
[ 1 – [1/(1 + i) ]PVA = A
i
[ 1 – [1/(1 + i) ]= RM3,000
0.06
= RM8,019.04
(ii) Solution via equation using schedule
PVAn = A (PVIFAi, n) = RM3,000 (PVIFA6%,3) = RM3,000 (2.673) = RM8,019
The time line for present value ordinary annuity of RM3,000 for 3 years at a discounted rate of 6% per year is as below:
t0 i = 6% t1 t2 t3
RM3,000 RM3,000 RM3,000
(d) Present Value of Annuity Due The concept of forming equation for present value of annuity due is as per
the future value of annuity due where it is based on a small alteration to the ordinary annuity equation that is by multiplying equation 3.9 and 3.10 with (1 + i).
RM8,019.04 @
RM8,019.00

TOPIC 5 TIME VALUE OF MONEY 165
n
n[ 1 – [1/(1 + i) ]PVA = A (1 + i)
i (5.11)
Example 5.12 can help you to differentiate between the ordinary annuity with the annuity due for present value. Example 5.12 Taming Company expects to receive RM3,000 at the beginning of each year for consecutive 3 years. How much is the present value of that annuity if it is discounted at the rate of 6% per year? (i) Manual solution:
n
n
3
[ 1 [1/(1 + i) ]PVA = A (1 + i)
i[ 1 - [1/(1 + 0.063) ]
= RM3,000 (1 + 0.06)0.06
= RM8,500.18
(ii) Solution using schedule:
n i,n
6%,3
PVA = A (PVIFA ) (1 + i)
= A (PVIFA ) (1 + 0.06)
= RM3,000 (2.673) (1.06)
= RM8,500.14
The time line for present value annuity due of RM3,000 for 3 years at a discounted rate of 6% per year is as below:
t0 i = 6% t1 t2 t3
RM3,000 RM3,000 RM3,000
RM8,500.18 @
RM8,500.14

TOPIC 5 TIME VALUE OF MONEY
166
As per the difference between ordinary annuity and annuity due for future value, the solution for present value of annuity due (RM8,500 in example 5.12) is also higher compared to the present value of ordinary annuity (RM8,019.00 in example 5.11). This is because in annuity due, the deposit is deposited in the beginning of the period and therefore generates interest longer compared to the ordinary annuity.
5.4.2 Derivation Cash Flow
Lots of decision in the financial field, for example the capital budgeting and dividend payments that involves a mixture of cash flow or cash flow that is irregular. The calculation of future value and present value of an irregular cash flow is a combination concept of determining money value for single cash flow and also annuity. (a) Future Value of Derivation Cash Flow The calculation for future value of derivation cash flow involves the
determination of future value for each of the cash flows and subsequently totalling all that future values. Formula in equation 5.12 shows the future value (FVn) is obtained by adding each of the cash flow (Pt) that is adjusted with the exponent (n t) that is the number of periods in which the interest is obtained.
Exponent is used in this formula because the last cash flow happens at the end of the last period. Therefore, interest is not obtained for it. The sigma symbol ( Σ ) is the mathematical symbol for a total of a series of value.
(i) Manual equation
∑ n 1tnFV = P (1 + i)
t = 10
n
(5.12)
1. You are offered an annuity payment of RM100 at the end of each year for
3 years and is deposited into the bank. The interest rate offered is 5% per year. How much is the present value of that annuity payment?
EXERCISE 5.6
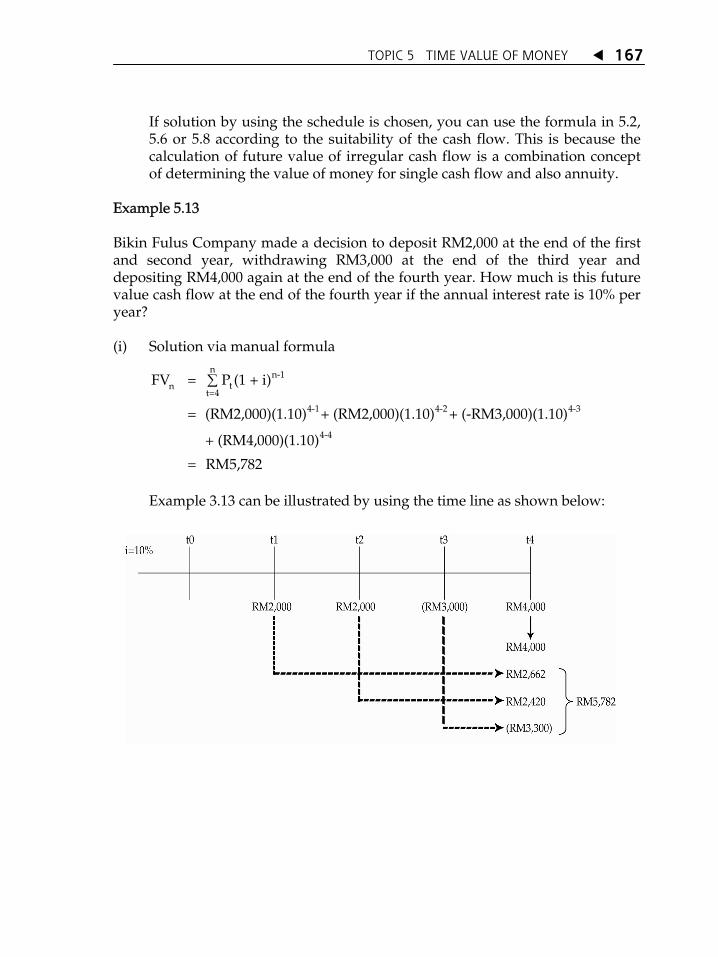
TOPIC 5 TIME VALUE OF MONEY 167
If solution by using the schedule is chosen, you can use the formula in 5.2, 5.6 or 5.8 according to the suitability of the cash flow. This is because the calculation of future value of irregular cash flow is a combination concept of determining the value of money for single cash flow and also annuity.
Example 5.13 Bikin Fulus Company made a decision to deposit RM2,000 at the end of the first and second year, withdrawing RM3,000 at the end of the third year and depositing RM4,000 again at the end of the fourth year. How much is this future value cash flow at the end of the fourth year if the annual interest rate is 10% per year? (i) Solution via manual formula
∑n n-1
tnt=4
4-1 4-2 4-3
4-4
FV = P (1 + i)
= (RM2,000)(1.10) + (RM2,000)(1.10) + (-RM3,000)(1.10)
+ (RM4,000)(1.10)
= RM5,782
Example 3.13 can be illustrated by using the time line as shown below:

TOPIC 5 TIME VALUE OF MONEY
168
(ii) Solution by using schedule
Step 1: Find the future value of annuity for RM2,000 for 2 years (end of second year).
RM2,000 (FVIFA 10%, 2) = RM2,000 (2.10)
= RM4,200
Step 2: Find the future value of RM4,2000 at the end of fourth year.
RM4,200 (FVIFA 10%, 2) = RM4,200 (1.21)
= RM5,082
Step 3: Find the future value at the end of fourth year for the withdrawal of RM3,000 that occurred at the end of third year.
–RM3,000 (FVIFA 10%, 1) = –RM3,000 (1.10)
= – RM3,300
Step 4: The present value cash flow is obtained by adding the result of step 2-3 with the final cash flow of RM4,000. As RM4,000 occurs that the last period, there is no interest earnings from it.
FV4 = RM5,082 + (-RM3,300) + RM4,000
= RM5,782
(b) Present Value of Derivation Cash Flow Similar to the concept in determining the future value of derivation cash
flow, the present value of derivation cash flow is also a combination concept of present value of single cash flow and annuity.
Manual equation:
∑n n
0 tt=10
PV = P [1/(1 + i) ] (5.13)
If solution by using the schedule is chosen, you can use the formula in present value of single cash flow, present value of ordinary annuity or present value of annuity in advance according to the suitability of the type of cash flow stated in the problem.

TOPIC 5 TIME VALUE OF MONEY 169
Example 5.14 Buat Pitih Company expects to receive RM1,000 at the end of the first and second year, RM2,000 at the end of the third year and RM4,000 at the end of the fourth year. How much is the present value cash flow if the yearly interest rate is 10% per year? (i) Solution via manual formula
∑n n-t
0 tt=10
1 2 3
4
PV = P (1 + i)
= [RM1,000][1/(1.10) ] + [RM1,000][1/(1.10) ] + [RM2,000][1/(1.10) ]
+ [RM4,000][1/(1.10) ]
= RM5,970.22
The time line for example 3.14; present value for derivation cash flow is as below:
t0 t1 t2 t3 t4
RM1,000 RM1,000 RM2,000 RM4,000
(ii) Solution via schedule
Step 1:
Find the present value for annuity of RM1,000 for 2 years.
RM1,000 (PVIFA 10%, 2) = RM1,000 (1.736)
= RM1,736
Step 2:
Find the present value for RM2,000 that occurs at the end of third year.
RM2,000 (PVIF 10%, 3) = RM2,000 (0.751)
= RM1,502
RM909.99 RM826.45
RM1,502.632 RM2,732.05
RM5,970.22
i = 10%

TOPIC 5 TIME VALUE OF MONEY
170
Step 3:
Find the present value for RM4,000 that occurs at the end of forth year.
RM4,000 (PVIF 10%, 4) = RM4,000 (0.683)
= RM2,732
Step 4:
The present value cash flow is obtained by adding all the previous results
earlier (figure bolded).
PV 0 = RM1,736 + RM1,502 + RM2,732
= RM5,970
5.4.3 Perpetuity
Perpetuity is a type of series cash flow that involves the same amount for each period continuously. In other words, perpetuity is an annuity that has an infinity period. An example of perpetuity is the payment of dividends for preference shares. The concept for future value of perpetuity is illogical and cannot be used in making financial decisions as the concept do not predict the period ending point while future value is something that can be expected. Instead, the concept for present value of perpetuity can be applied in making financial decisions. For example, the usage of this concept to determine the present value for preference shares and present value for pensions. From the formula of present value of annuity, we know that:
n
n[ 1 [1/(1 + i) ]
PVA = A i
(5.14)

TOPIC 5 TIME VALUE OF MONEY 171
Try to imagine what will happen if the value of n increases. The value of (1 + i)n will also increase. This will caused 1/(1 + i)n to become smaller. When (n) approaches infinity, the value of (1 + i)n will become extremely big while the value of 1/(1 + i)n will approach zero. The situation above can be summarised as follows:
PV p = P / i (5.15) Based on this equation, the present value of perpetuity is equivalent to the payment of annuity amount (P) divided by the interest rate (i). Solution by schedule and scientific calculator cannot resolve the present value of perpetuity. This is because schedule PVIFA does not contain the value for infinity and the same with scientific calculators that do not have an infinity button. It must be calculated manually by calculation in stages. Figure 3.19 shows the position of variables in equation 3.15.
t0 i% t1 t2 t60 t= ∞
PVp P P P
Figure 5.19: Present value of perpetuity Example 5.15 Sukehati Company issued securities that promised a payment of RM100 per year at the yearly interest rate of 8% to the holders of that security. How much is the present value for that cash flow?
PVp = P / i = RM100 / 0.08 = RM1,250
The financial schedule does not provide the factor for present value of perpetuity because perpetuity involves an infinity period. Therefore, the solution for perpetuity cases can only depend on manual calculations.

TOPIC 5 TIME VALUE OF MONEY
172
COMPOUNDING AND DISCOUNTING MORE THAN ONCE A YEAR
The practice of compounding or discounting interest more than once a year is also known as intrayear compounding or discounting. For example, compounding or discounting twice a year, three times a year, four times a year or each month. The frequency of compounding or discounting several times in a year is a normal practice in making financial decisions. When the frequency of compounding or discounting for future value or present value is more than once a year (n x m), the interest rate must also be divided with the said frequency (i / m). The purpose is to adjust the changes in the period and interest rate to enable both the variables to change consistently. Therefore, a little alteration must be made to the formulas that had been learned previously. The formula for manual solution is:
FV = PV × (1 + i/m)nm (5.16) FV = Future value PV = Present value i = Interest rate m = Frequency of compounding or discounting in a year n = Number of years While the solution by schedule is as follow:
FV = PV x (FVIF i/m,nm) (5.17)
5.5
1. Consider the perpetuity that pays RM100 per year, with an interest rate of 10%. How much is the present value of this perpetuity?
EXERCISE 5.7

TOPIC 5 TIME VALUE OF MONEY 173
Example 5.16 The future value of RM1 now after 6 years, using the interest rate of 10% per year with different compounding frequencies.
Presumed Compounding nm i / m FV nm
Once a year
Twice a year
Four times a year
Every month
6 x 1 = 6
6 x 2 = 12
6 x 4 = 24
6 x 12 = 72
0.1/1=0.01
0.1/2=0.05
0.1/4=0.025
0.1/12=0.0083
RM1.772
RM1.796
RM1.809
RM1.817
Example 5.17 The present value of RM1 received in 6 years from now, discounted at the interest rate of 10% per year with different discounting frequencies.
Presumed Discounting nm i / m PV 0
Once a year
Twice a year
Four times a year
Every month
6 x 1 = 6
6 x 2 = 12
6 x 4 = 24
6 x 12 = 72
0.1/1=0.01
0.1/2=0.05
0.1/4=0.025
0.1/12=0.0083
RM0.564
RM0.557
RM0.553
RM0.550
The conclusion that can be made based on examples 5.16 and 5.17 is: the higher the frequency of compounding, the higher the future value of cash flow; and higher the frequency of discounting, the lower the present value of cash flow.
CONTINUOUS COMPOUNDING AND DISCOUNTING
Before this, you were only exposed to situations where the interest is compounded or discounted at specific discrete intervals whether yearly or twice a year, monthly and so forth. However, in some cases of time value of money, interest must be compounded or discounted continuously or at each micro-second. Referring to formula 3.16, FV = PV x (1 + i/m) nm, we cannot divide the value (i) with infinity and multiply (n) with infinity. Instead, we use the term (e) that is e ~ 2.71828. The value e is an antilog to 1 and same as pi ( π ) with value of 3.142, which cannot be represented by one exact value but only as an estimated value.
5.6
TOPIC 5 TIME VALUE OF MONEY
174
The new formula for future value and present value that is compounded and discounted continuously is as follows. Future value: FVn = PV0 (e in) (5.18) Present value: PV0 = FVn (e in) (5.19) The estimate number for the symbol e in equation 5.18 and 5.19 is 2.72 (or more accurately, 2.71828183). Example 5.18 What is the future value for RM100 that is invested now for 6 years with an interest rate of 8 percent per year and compounded continuously? Manual solution: FVn = PV 0 (e in) = RM100 (2.72 (0.08)(6)) = RM161.61 Example 5.19 What is the present value of RM161.61 that will be received in 6 years from now that is discounted continuously at an interest rate of 8 percent per year? PVn = FVn (e in)
= 161.61 (2.72 (0.08)(6) = RM100

TOPIC 5 TIME VALUE OF MONEY 175
1. What is the future value for RM260 that is invested now for 3
years at the interest rate of 10 percent per year and compounded continuously?
2. What is the present value for RM200 that will be received 5 years from now and discounted continuously at the interest rate of 6 percent per year?
3. Mr. Sarbat plans to invest RM3,000 a year in the Pension Investment Scheme for a period of 15 years. Mr. Sarbat wants to know the result of the RM3,000 investment at the beginning of each year compared with the end of each year. Calculate the value differences between the two types of cash flow if the interest rate is 8 percent per year.
4. Mas Joko Company is considering an investment on a new machine that involves a total purchase and assembly cost of RM30,000. The usage of this new machine is expected to generate a yearly cash flow for 5 consecutive years: end of first year RM4,000, end of second and third year RM5,000, end of fourth year RM6,000 and end of fifth year RM8,000. If the company requires a yearly 18% rate of return on its investment, is it reasonable for the company to continue with its investment?
5. Complete the present value for a series of indefinite yearly payments of RM180, assuming that the interest rate is
(a) 5 percent
(b) 10 percent
6. You have just won a puzzle contest where you were offered two choice of prizes that is whether to accept RM60,000 today or RM12,000 at the end of each year for 5 consecutive years. If the cash flow is discounted at a yearly rate of 12 percent and compounded twice a year, which choice would you choose?
7. Mrs. Aimi plans to get a loan for a total of RM6,000 at the interest rate of 10% from a kind-hearted money lender. The money lender agrees to receive a sum of payment for the same amount at the end of each year for 4 years. What is the size of payment that Mrs. Aimi must give to the money lender each year?
8. What is the present value for RM400 that will be received in 7 years from now and discounted continuously at the interest rate of 10 percent per year?
EXERCISE 5.8
TOPIC 5 TIME VALUE OF MONEY
176
In this topic, you have learnt the importance of time value of money. The concepts of compounding and discounting are used respectively to compute future value and present value for single or series of cash flows. The knowledge in this area would help you to make better financial decisions that involves cash flows.
TUTORIAL QUESTION
INTRODUCTION
The purpose of these activities is to test your understanding on the basic concepts in financial management, which is the concept of time value of money, risk and return as well as leverage. These concepts are important in financial decisions making.
PROBLEM 1
Naim and Nadiah are planning in sharing to buy a house 10 years from now with the expected price of RM100,000. Naim will save RM5,000 every year in his account beginning a year from now. His last annual savings will be made at the end of the tenth year. Nadiah will deposit RM4,000 in the account now and another RM8,000 four years from now. They also plan to help NaimÊs father (Mr. Roslee) who had just retired and NadiahÊs sister (Nurul) who had just started her studies in university. Naim will deposit a sum of money into his fatherÊs account to enable him to withdraw RM3,600 per year, starting a year from now until his fatherÊs death. While, Nadiah will deposit RM6,000 into NurulÊs account and will only allow Nurul to withdraw the same amount every year starting a year from now. As the period of her studies is four years, Nurul will make four withdrawals.
ASSIGNMENT With the assumption that all the accounts will pay an interest of 9%, compounded yearly, answer the following questions:
(a) How much should be added by Naim and Nadiah at the end of the tenth year to enable them to buy the said house?
(b) How much is the amount that Naim must deposit into his fatherÊs account?
(c) How much is the amount that Nurul can withdraw every year?

ANSWERS 177
Answers TOPIC 1: ACCOUNTING ENVIRONMENT
Exercise 1.1
1. Internal users are people who have direct access to the resources of an entity and are normally involved in the management of the company; an example being the companyÊs management. These people are involved in planning and controlling the activities of the company to enable it to achieve specified objectives. Examples of common decision making are:
(a) does the company require additional capital or not; if the company requires additional capital, would the company be applying for loan or issue shares.
(b) does the company require additional asset; if the company requires additional asset, would the company be buying or renting it.
(c) how much is the companyÊs excess cash, if any, should be utilised.
(d) how the company is going to overcome insufficient cash flow problems it might be facing.
(e) the companyÊs strategy to expand the market for its products External users are people who do not have direct access to the resources of
the company and to not involved in the management of the company. Examples of external users are investors, loan providers, Inland Revenue Board, government agencies and the public. The types of decision made are different according to user groups. For example, investors make decisions on whether to invest in a company, loan providers make decisions on whether to approve loans while the Inland Revenue Board decide on the total tax to be imposed.
2. Financial accounting helps decision makers by preparing the entityÊs
financial reports for external and internal users; but is focused more on external users. The financial report is released periodically and is subject to specific standards and formats. The users are able to make decisions on the performance and status of the company through this report.
Management Accounting provides the financial and non-financial
information required by the management of the company for planning,

ANSWERS
178
evaluating and controlling the operations of the entity. Reports may be issued at any time according to requirement and are not subject to any standards and formats. Through this report, the users are able to take the necessary measures required for improvement in order to ensure that the company achieves its objectives.
Exercise 1.2
1. The characteristics of accounting information can be divided into two categories, primary characteristics and secondary characteristics. The primary characteristics are comprised of relevant and reliability, while the secondary characteristics are comparability and consistency.
2. Comparability means that the information can be compared; whether
among companies, among industries or across different periods. Let us assume that you are interested in investing in a company. You were informed that the net income of the company in year 2000 was RM10 million. Is this information useful?
Actually, it is only useful if you have other information that can be
compared with that figure. For example, the net income in 1999 for the company was RM3 million. This information enables you to conclude that the company has gained a huge increase in net income. What if you were told that the net income of the company in 1999 was RM19 million? You might not want to proceed with the investment because the company has experienced a huge decline in net income. You would not be able to come to this conclusion by only referring to the RM10 million figure.
Exercise 1.3
1. The weaknesses in the assumption of monetary unit:
(a) Limiting the scope of accounting. This is because only transactions that can be measured in monetary unit will be taken into consideration in accounting, whereas there are many other factors that will also affect the business. For example, the death of the companyÊs manager, termination of staff, recognition by specific bodies on the business achievements and other factors. All these cannot be recorded in the financial statements as it cannot be stated in monetary terms.
(b) Assuming the value of money is stable at all times; when we know that the currency value fluctuates. You have often heard the grumblings or even experienced the fluctuation in currency value. We used to be able to buy several items with RM10 but not so presently.

ANSWERS 179
In the early days, school children only took 20 cents to school, now they bring RM2. All these examples show that the currency value has changed. In other words, the RM1 you have today will not have the same value as the RM1 you will receive in a couple of monthsÊ time. The fluctuation in the currency value should have been taken into account when recording transactions but was ignored.
2. Three conditions that must be fulfilled before revenue can be recognised
are:
(a) The seller had done the necessary action to obtain the revenue (for example, had supplied the goods for trade or rendered its services to customer). The revenue cannot be recognised if the goods or services are not supplied or rendered to the customer, even though the customer had paid cash.
(b) The amount of revenue can be measured objectively. If the seller had handed over the goods or provided the services, but have not determined the amount that must paid by the customer, then the revenue cannot be recognised.
(c) For credit transactions, the revenue can be collected. The seller had handed over the goods or provided the services and had stated the amount to be paid by the customer. If the seller is confident that cash is collectable from the customer, then the revenue will be recognised at the point of sale. However, if the seller is uncertain, then the revenue will only be recognised when cash is received.
Exercise 1.4
1. (a) accounting period
(b) historical cost
(c) relevant
(d) Malaysian Accounting Standards Board
(e) reliability
(f) principle of matching
(g) cost benefit relation, materiality
(h) management accounting
(i) going concern
(j) point of sale
(k) Cash Flow Statement
(l) Balance Sheet
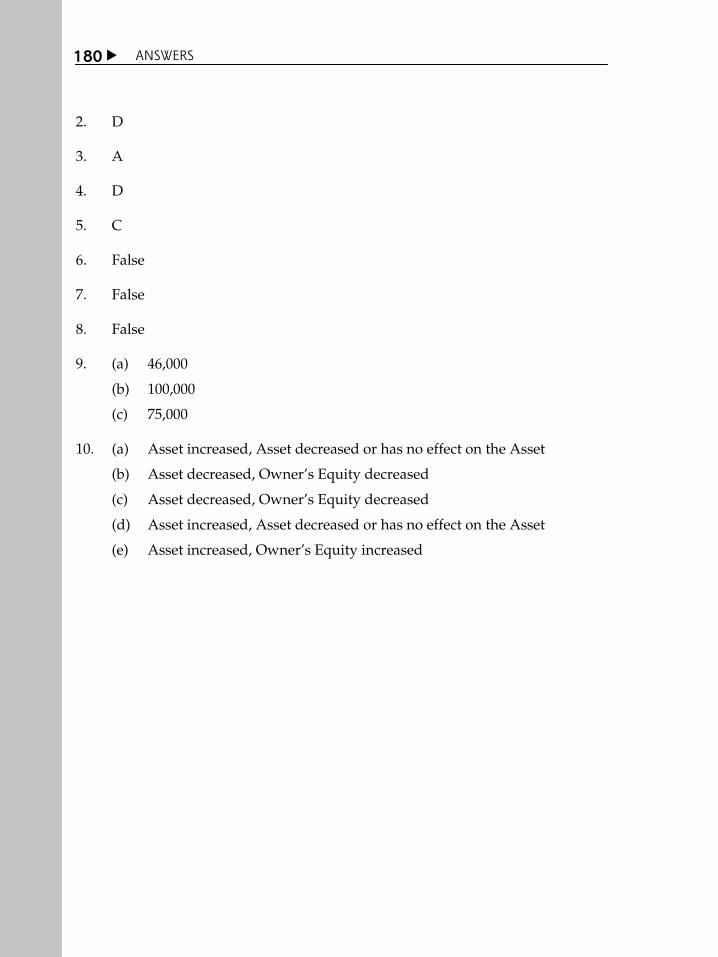
ANSWERS
180
2. D 3. A 4. D 5. C 6. False 7. False 8. False 9. (a) 46,000
(b) 100,000
(c) 75,000 10. (a) Asset increased, Asset decreased or has no effect on the Asset
(b) Asset decreased, OwnerÊs Equity decreased
(c) Asset decreased, OwnerÊs Equity decreased
(d) Asset increased, Asset decreased or has no effect on the Asset
(e) Asset increased, OwnerÊs Equity increased
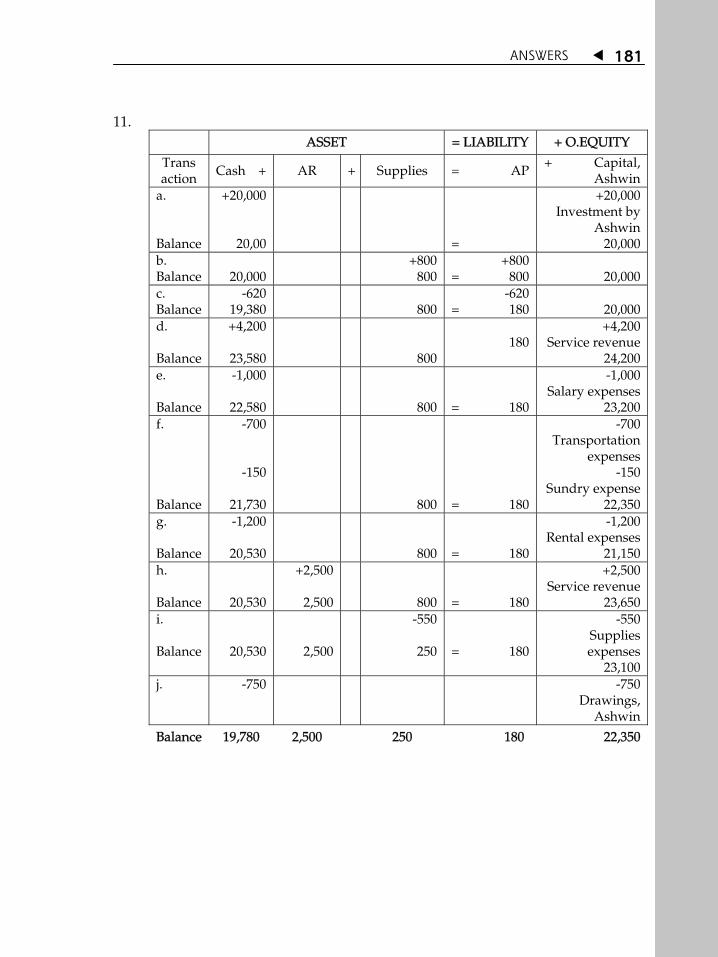
ANSWERS 181
11. ASSET = LIABILITY + O.EQUITY
Trans action Cash + AR + Supplies = AP + Capital,
Ashwin a. Balance
+20,000
20,00
=
+20,000 Investment by
Ashwin 20,000
b. Balance
20,000
+800 800
+800 = 800
20,000
c. Balance
-620 19,380
800
-620 = 180
20,000
d. Balance
+4,200
23,580
800
180
+4,200 Service revenue
24,200 e. Balance
-1,000
22,580
800
= 180
-1,000 Salary expenses
23,200 f. Balance
-700
-150
21,730
800
= 180
-700 Transportation
expenses -150
Sundry expense 22,350
g. Balance
-1,200
20,530
800
= 180
-1,200 Rental expenses
21,150 h. Balance
20,530
+2,500
2,500
800
= 180
+2,500 Service revenue
23,650 i. Balance
20,530 2,500
-550
250
= 180
-550 Supplies expenses
23,100 j. -750 -750
Drawings, Ashwin
Balance 19,780 2,500 250 180 22,350
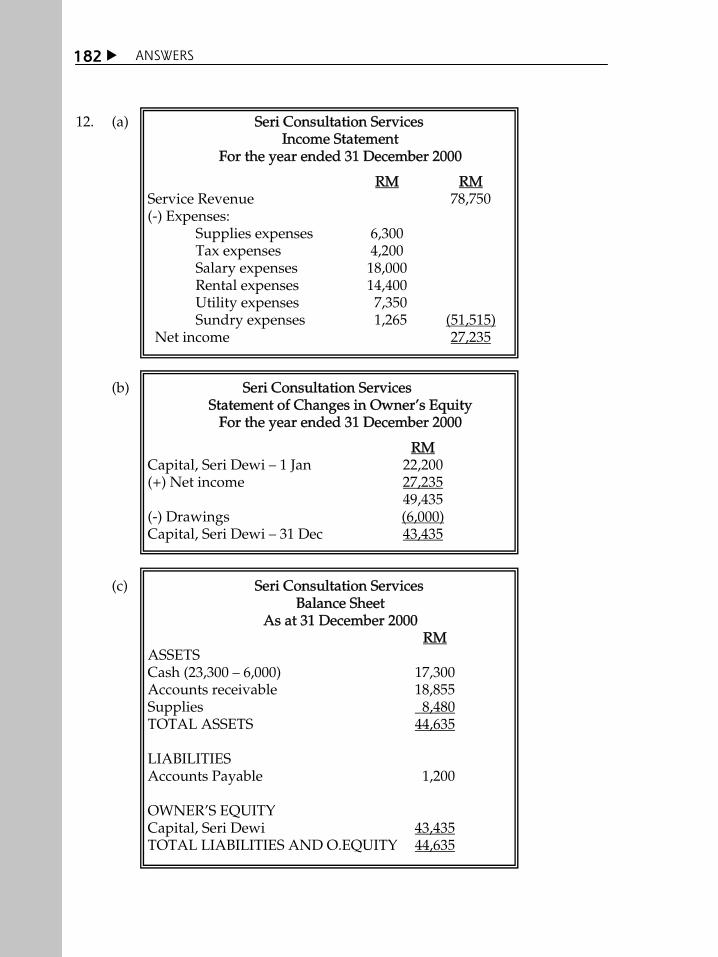
ANSWERS
182
12. (a) Seri Consultation Services Income Statement
For the year ended 31 December 2000
RM RM Service Revenue 78,750 (-) Expenses: Supplies expenses 6,300 Tax expenses 4,200 Salary expenses 18,000 Rental expenses 14,400 Utility expenses 7,350 Sundry expenses 1,265 (51,515) Net income 27,235
(b) Seri Consultation Services Statement of Changes in OwnerÊs Equity
For the year ended 31 December 2000
RM Capital, Seri Dewi 1 Jan 22,200 (+) Net income 27,235 49,435 (-) Drawings (6,000) Capital, Seri Dewi 31 Dec 43,435
(c) Seri Consultation Services
Balance Sheet As at 31 December 2000
RM ASSETS Cash (23,300 6,000) 17,300 Accounts receivable 18,855 Supplies 8,480 TOTAL ASSETS 44,635 LIABILITIES Accounts Payable 1,200 OWNERÊS EQUITY Capital, Seri Dewi 43,435 TOTAL LIABILITIES AND O.EQUITY 44,635

ANSWERS 183
TOPIC 2: RECORDING PROCESS
Exercise 2.1
1. (a) It is not a transaction and must not be recorded. This is because it will not affect the entityÊs financial position (will not affect the asset, liability or owner equity) and cannot be measured in currency unit.
(b) It is a transaction and must be recorded. This will affect the entityÊs
financial position (increase asset and ownerÊs equity) and can be measured in currency unit.
Exercise 2.2
1. Account is a specific and separate accounting record for each item in the financial statement. All transactions that affect the items will be recorded in the accounts. Ledger is a group of accounts for a business entity. Chart of accounts is the list of accounts in the ledger.
2. T-Account and three column account. T-account is easier but the three
column account enables us to know the last balance after each transaction. 3. Drawings are made by the owner for personal use while expenses are
incurred by the entity for the purpose of generating income. Drawings are not considered in the calculation of net profit or loss, but are deducted directly from ownerÊs equity. Expenses will be matched against income. The difference between income and expenses will be either net profit or net loss. This difference will be added or deducted from ownerÊs equity.
4. C 5. C 6. (a) Asset (b) Expense (c) Asset (d) Income (e) Liability (f) Asset (g) Expense (h) Asset

ANSWERS
184
7. (a)
Date Account and Description Reference Debit Credit Apr 2001 a. Cash 5,000 Capital, Cindy 5,000 (Cash investment by Cindy) b. Supplies 275 Accounts payable 275 (Purchase of supplies on credit) c. Cash 3,250 Service revenue 3,250
(Cash received for services provided)
d. Rental expenses 750 Cash 750 (Payment of rental by cash) e. Accounts payable 125 Cash 125 (Payment to accounts payable) f. Accounts receivable 1,875 Service revenue 1875
( Customer has not paid for services provided)
g. Utility expenses 390 Sundry expenses 187 Cash 577 (Payment for expenses by cash) h. Salary expenses 1,250 Cash 1,250 (Payment for salary by cash) i. Supplies expenses 162 Supplies 162 (Usage of supplies) j. Drawings 550 Cash 500 Supplies 50
(Cash and supplies drawings by owner)

ANSWERS 185
(b) Post to ledger
Cash Account
Date Description Reference Debit Credit Balance Apr 2001 Capital, Cindy 5,000 5,000 Service revenue 3,250 8,250 Rental expenses 750 7,500 Accounts payable 125 7,375 Utility expenses 390 6,985 Sundry expenses 187 6,798 Salary expenses 1,250 5,548 Drawings, Cindy 500 5,048
Account Receivable
Date Description Reference Debit Credit Balance Apr 2001 Service revenue 1,875 1,875
Supplies Account
Date Description Reference Debit Credit Balance Apr 2001 Accounts payable 275 275 Supplies expenses 162 113 Drawings, Cindy 50 63
Accounts Payable
Date Description Reference Debit Credit Balance Apr 2001 Supplies 275 275 Cash 125 150
Capital Account, Cindy
Date Description Reference Debit Credit Balance Apr 2001 Cash 5,000 5,000
Drawings Account, Cindy
Date Description Reference Debit Credit Balance Apr 2001 Cash 500 500 Supplies 50 550

ANSWERS
186
Service Revenue Account
Date Description Reference Debit Credit Balance Apr 2001 Cash 3,250 3,250 Accounts
receivable 1,875 5,125
Rental Expenses Account
Date Description Reference Debit Credit Balance Apr 2001 Cash 750 750
Utility Expenses Account
Date Description Reference Debit Credit Balance Apr 2001 Cash 350 350
Sundry Expenses Account
Date Description Reference Debit Credit Balance Apr 2001 Cash 187 187
Salary Expenses Account
Date Description Reference Debit Credit Balance Apr 2001 Cash 1,250 1,250
Supplies Expenses Account
Date Description Reference Debit Credit Balance Apr 2001 Cash 162 162

ANSWERS 187
(c) Trial Balance
Cindy Insurance Agency Trial Balance
as at 30 April 2001
Accounts Debit (RM) Credit (RM)
Cash 5,048 Accounts receivable 1,875 Supplies 63 Accounts payable 150 Capital, Cindy 5,000 Drawings, Cindy 550 Service revenue 5,125 Salary expenses 750 Rental expenses 390 Utility expenses 187 Supplies expenses 1,250 Sundry expenses 162 TOTAL 10,275 10,275
8. (a) GENERAL JOURNAL
Date Account and Description Reference Debit Credit Feb 1 Supplies L104 274
Cash L101 274 (Purchased supplies by cash)
2 Drawings, Edlin L302 2,000 Cash L101 2,000 (Cash drawings by owner)
5 Cash L101 2,740 Accounts receivable L102 2,740 (Received cash from customer
for payment of accounts receivable)
9 Office equipment L108 3,850 Accounts payable L201 3,850 (Purchased office equipment
on credit)
15 Accounts payable L201 1,200 Cash L101 1,200 (Payment to accounts
payable)

ANSWERS
188
18 Cash L101 580 Service revenue L401 580 (Received for services
provided)
25 Advertisement expenses L502 420 Cash L101 420 (Payment for advertisement)
28 Utility expenses L503 215 Cash L101 215 (Payment for businessÊs
telephone and electricity bill)
28 Drawings, Edlin L302 117 Cash L101 117 (Payment for telephone and
electricity bill of ownerÊs house by cash from the business)
28 Rental expenses L501 1,200 Cash L101 1,200 (Payment for rental of
business premises)
28 Sundry expenses L509 220 Cash
(Repair of office equipment by cash)
L101 220
(b) Post of entries to ledger
Cash Account No: 101
Date Description Reference Debit Credit Balance Feb 1 Cash 15,238
1 Supplies J1 274 14,964 2 Drawings, Edlin J1 2,000 12,964 5 Accounts
receivable J1 2,740 15,704
15 Accounts payable J1 1,200 14,504 18 Service revenue J1 580 15,084 25 Advertisement
expenses J1 420 14,664
28 Utility expenses J1 215 14,449 28 Drawings, Edlin J1 117 14,332 28 Rental expenses J1 1,200 13,132 28 Sundry expenses J1 220 12,912
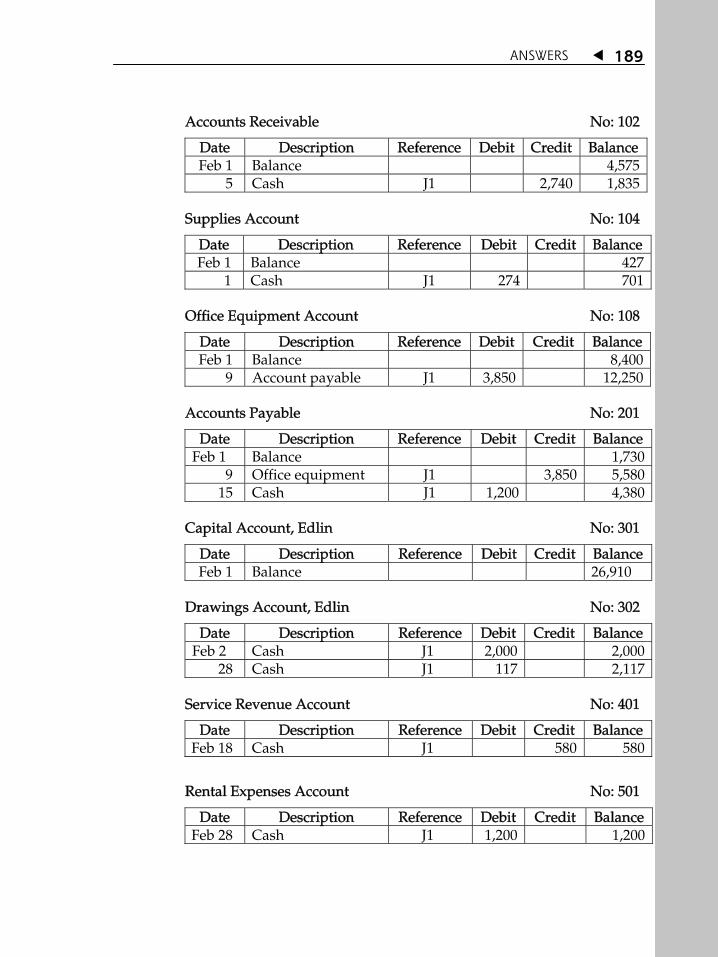
ANSWERS 189
Accounts Receivable No: 102
Date Description Reference Debit Credit Balance Feb 1 Balance 4,575
5 Cash J1 2,740 1,835
Supplies Account No: 104
Date Description Reference Debit Credit Balance Feb 1 Balance 427
1 Cash J1 274 701
Office Equipment Account No: 108
Date Description Reference Debit Credit Balance Feb 1 Balance 8,400
9 Account payable J1 3,850 12,250
Accounts Payable No: 201
Date Description Reference Debit Credit Balance Feb 1 Balance 1,730
9 Office equipment J1 3,850 5,580 15 Cash J1 1,200 4,380
Capital Account, Edlin No: 301
Date Description Reference Debit Credit Balance Feb 1 Balance 26,910
Drawings Account, Edlin No: 302
Date Description Reference Debit Credit Balance Feb 2 Cash J1 2,000 2,000
28 Cash J1 117 2,117
Service Revenue Account No: 401
Date Description Reference Debit Credit Balance Feb 18 Cash J1 580 580
Rental Expenses Account No: 501
Date Description Reference Debit Credit Balance Feb 28 Cash J1 1,200 1,200
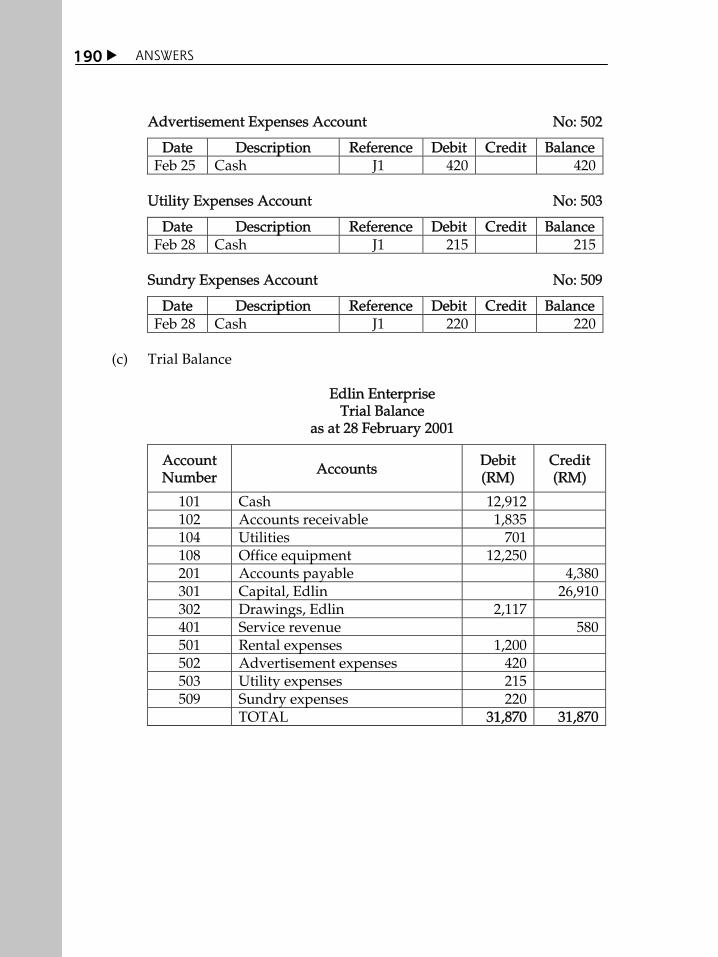
ANSWERS
190
Advertisement Expenses Account No: 502
Date Description Reference Debit Credit Balance Feb 25 Cash J1 420 420
Utility Expenses Account No: 503
Date Description Reference Debit Credit Balance Feb 28 Cash J1 215 215
Sundry Expenses Account No: 509
Date Description Reference Debit Credit Balance Feb 28 Cash J1 220 220
(c) Trial Balance
Edlin Enterprise
Trial Balance as at 28 February 2001
Account Number Accounts Debit
(RM) Credit (RM)
101 Cash 12,912 102 Accounts receivable 1,835 104 Utilities 701 108 Office equipment 12,250 201 Accounts payable 4,380 301 Capital, Edlin 26,910 302 Drawings, Edlin 2,117 401 Service revenue 580 501 Rental expenses 1,200 502 Advertisement expenses 420 503 Utility expenses 215 509 Sundry expenses 220
TOTAL 31,870 31,870

ANSWERS 191
TOPIC 3: FINANCIAL STATEMENTS
Exercise 3.1
1. (b) False 2. (b) False 3. (a) True 4. (b) False 5. C 6.
Account (1) Statement
(2) Type of Account
Account payable Account receivable Accruals Building General expenses Interest expenses Sales expenses Operating expenses Administrative expenses Tax Preference shares' dividends Sales revenue Long term loans Inventory Cost of goods sold Paid up capital above par Notes payable Retained earnings Equipment Ordinary shares Preference shares Marketable securities Depreciation Accumulated depreciation Land Cash
BS BS BS BS IS IS IS IS IS IS IS IS BS BS IS BS BS BS BS BS BS BS IS BS BS BS
CL CA CL FA E E E E E E E R LTL CA E EQ CL or LTL EQ FA EQ EQ CA E FA (contra account) FA CA

ANSWERS
192
7. Company PC
Income Statement for the Year Ended 31 December 2001
Sales Less: Cost of goods sold Gross profit Less Operating expenditure Sales expenses Administrative and general expenses Depreciation expenses Total operating costs Profit before interest and tax Interest expenses Profit before tax Tax (30%) Profit after tax Less: Preference sharesÊ dividend Net profit (or profit available for ordinary shareholders) Earnings per share
RM350,000 600,000 550,000
RM5,250,000 2,850,000
RM2,400,000
RM1,500,000 RM 900,000
250,000 RM 650,000
195,000 RM 455,000
100,000
RM 355,000 RM 0.17
8. Company ODC
Balance Sheet as at 31 December 2001
Assets Current assets Cash Marketable securities Account receivable Inventory Total current assets Fixed assets Land Building Machines Equipments Total fixed assets Less: Accumulated depreciation Fixed assets, net Total Assets
RM2,150,000 750,000
4,500,000 3,750,000
RM11,150,000
RM2,000,000 RM2,250,000
4,200,000 2,350,000
RM10,800,000 2,650,000 8,150,000
RM19,300,000

ANSWERS 193
Liabilities and Equities Current liabilities Account payable Notes payable Accruals Total current liabilities Long-term loans Total liabilities Equities Preference shares Ordinary shares Paid up capital Retained earnings Total equities Total liabilities and equities
RM2,200,000 4,750,000
550,000 RM7,500,000
4,200,000 RM11,700,000
RM1,000,000 900,000
3,600,000 2,100,000
RM7,600,000 RM19,300,000
Exercise 3.2
1. (b) False 2. (b) False 3. (a) True 4. (b) False 5. C 6. D 7. (a)
Hugo Enterprise Statement of Retained Earnings
for the year ended 31 December 2000 Retained Earnings, 1 January 2000 RM 92,800 + Net Profit (throughout year 2000) 37,000 - Dividends paid (throughout year 2000) Preference shares RM 4,700 Ordinary shares 21,000 25,700
Retained Earnings, 31 December 2000 RM104,800
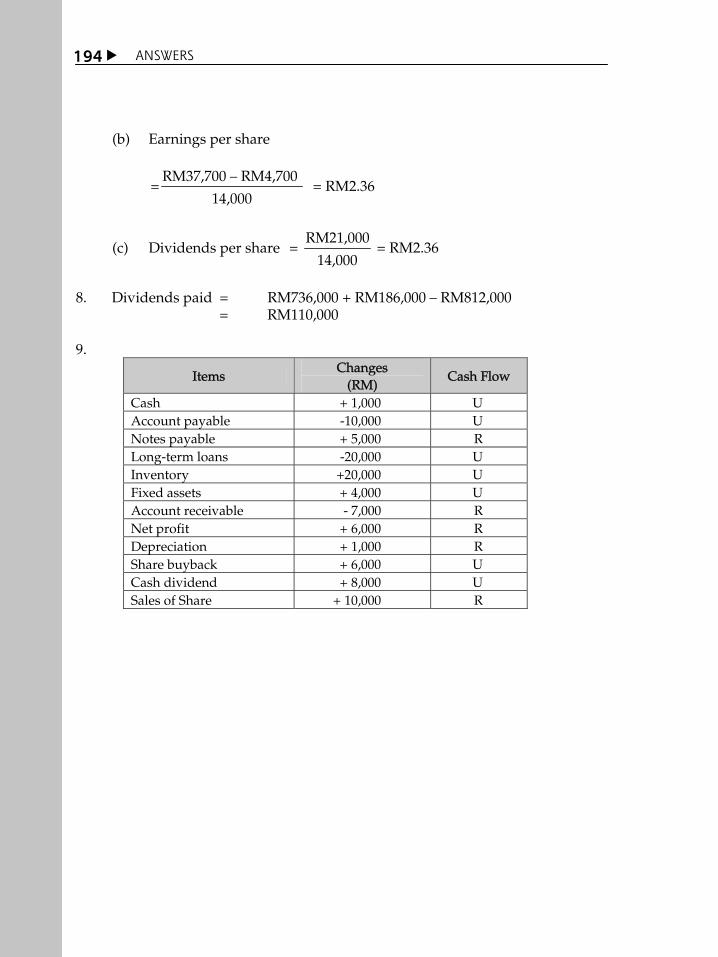
ANSWERS
194
(b) Earnings per share
RM37,700 RM4,700
= = RM2.3614,000
(c) Dividends per share RM21,000
= = RM2.3614,000
8. Dividends paid = RM736,000 + RM186,000 RM812,000 = RM110,000 9.
Items Changes
(RM) Cash Flow
Cash + 1,000 U Account payable -10,000 U Notes payable + 5,000 R Long-term loans -20,000 U Inventory +20,000 U Fixed assets + 4,000 U Account receivable - 7,000 R Net profit + 6,000 R Depreciation + 1,000 R Share buyback + 6,000 U Cash dividend + 8,000 U Sales of Share + 10,000 R
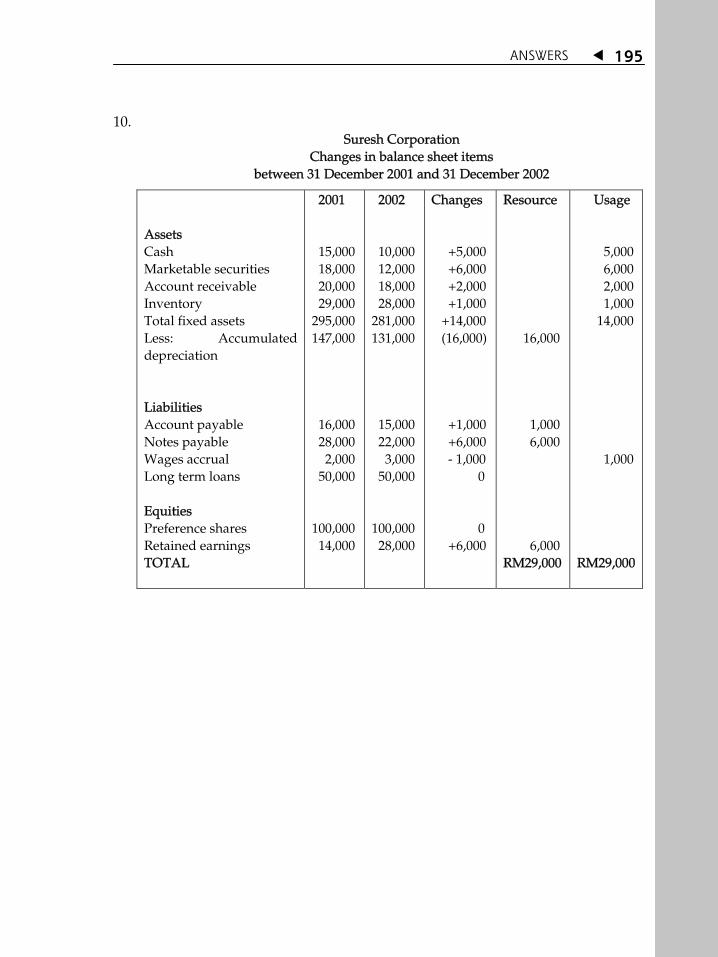
ANSWERS 195
10. Suresh Corporation
Changes in balance sheet items between 31 December 2001 and 31 December 2002
Assets Cash Marketable securities Account receivable Inventory Total fixed assets Less: Accumulated depreciation Liabilities Account payable Notes payable Wages accrual Long term loans Equities Preference shares Retained earnings TOTAL
2001 15,000 18,000 20,000 29,000 295,000 147,000 16,000 28,000 2,000 50,000 100,000 14,000
2002 10,000 12,000 18,000 28,000 281,000 131,000 15,000 22,000 3,000 50,000 100,000 28,000
Changes +5,000 +6,000 +2,000 +1,000 +14,000 (16,000) +1,000 +6,000 - 1,000 0 0 +6,000
Resource 16,000 1,000 6,000 6,000 RM29,000
Usage 5,000 6,000 2,000 1,000 14,000 1,000 RM29,000
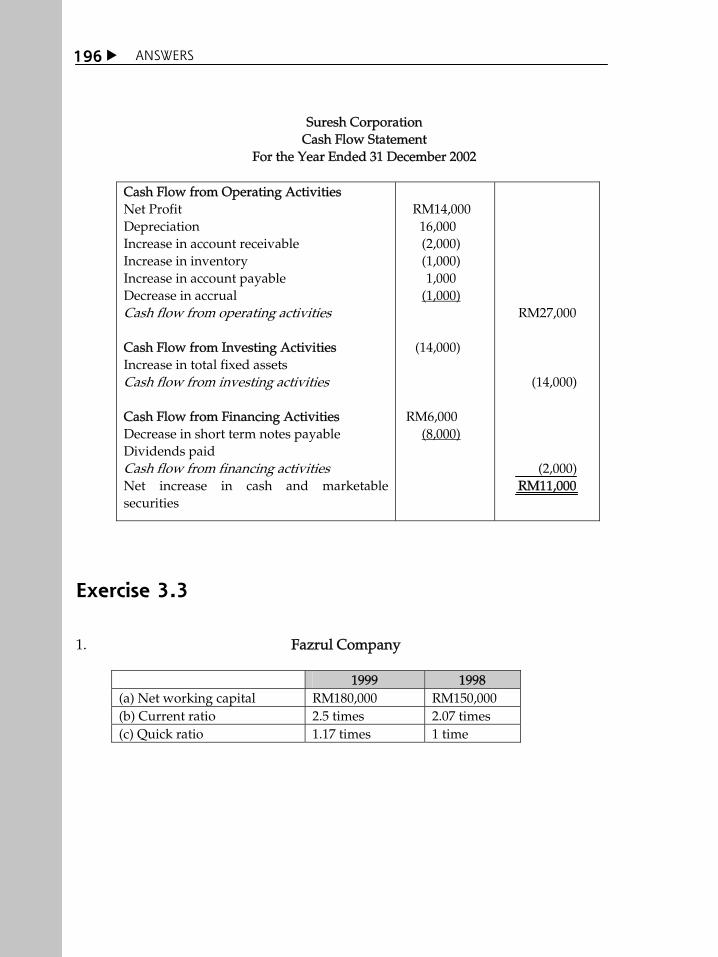
ANSWERS
196
Suresh Corporation Cash Flow Statement
For the Year Ended 31 December 2002
Cash Flow from Operating Activities Net Profit Depreciation Increase in account receivable Increase in inventory Increase in account payable Decrease in accrual Cash flow from operating activities Cash Flow from Investing Activities Increase in total fixed assets Cash flow from investing activities Cash Flow from Financing Activities Decrease in short term notes payable Dividends paid Cash flow from financing activities Net increase in cash and marketable securities
RM14,000
16,000 (2,000) (1,000) 1,000
(1,000)
(14,000)
RM6,000 (8,000)
RM27,000
(14,000)
(2,000) RM11,000
Exercise 3.3
1. Fazrul Company
1999 1998 (a) Net working capital RM180,000 RM150,000 (b) Current ratio 2.5 times 2.07 times (c) Quick ratio 1.17 times 1 time

ANSWERS 197
Exercise 3.4
1. Fazrul Company
1999 1998 (a) Account receivable turnover 9.14 times 9.03 times (b) Average collection period 39.9 days 40.4 days (c) Inventory turnover 2.54 times 39.87 times (d) Average inventory sales period 14.4 days 14.2 days (e) Fixed asset turnover 142.3 times 140.01 times (f) Total asset turnover 1.07 times 1.02 times
Exercise 3.5
1. Adiy Corporation
(a) Debt ratio = 50% (b) Interest coverage ratio = 3 times (c) Return on asset = 36% (d) Average collection period = 27 days (e) Total asset turnover = 2 times
Exercise 3.6
1. liquidity 2. current asset; current liability 3. inventory 4. cost of goods sold; inventory 5. total asset 6. net profit; ownersÊ equity 7. share price; earnings 8.
X-Cell N-Hance (a) Return on asset 12.67% 11.25% (b) Return on equity 31.67% 28.13% (c) Net profit margin 10.27% 9.57% (d) Total asset turnover 1.23 times 1.18 times (e) Debt ratio 60% 60% (f) Equity multiplier 2.5 times 2.5 times (g) Interest coverage ratio 7.89 times 8.37 times (h) Price/earnings ratio 6.25 12.62 (i) Dividend yield ratio 6.86% 1.89%
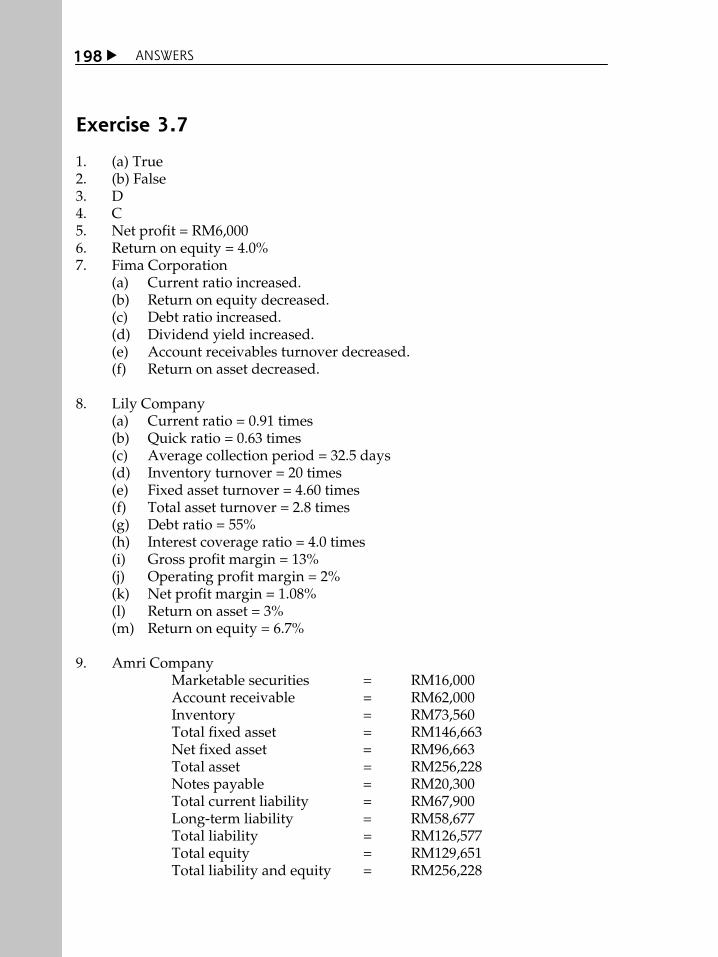
ANSWERS
198
Exercise 3.7
1. (a) True 2. (b) False 3. D 4. C 5. Net profit = RM6,000 6. Return on equity = 4.0% 7. Fima Corporation
(a) Current ratio increased. (b) Return on equity decreased. (c) Debt ratio increased. (d) Dividend yield increased. (e) Account receivables turnover decreased. (f) Return on asset decreased.
8. Lily Company
(a) Current ratio = 0.91 times (b) Quick ratio = 0.63 times (c) Average collection period = 32.5 days (d) Inventory turnover = 20 times (e) Fixed asset turnover = 4.60 times (f) Total asset turnover = 2.8 times (g) Debt ratio = 55% (h) Interest coverage ratio = 4.0 times (i) Gross profit margin = 13% (j) Operating profit margin = 2% (k) Net profit margin = 1.08% (l) Return on asset = 3% (m) Return on equity = 6.7%
9. Amri Company
Marketable securities = RM16,000 Account receivable = RM62,000 Inventory = RM73,560 Total fixed asset = RM146,663 Net fixed asset = RM96,663 Total asset = RM256,228 Notes payable = RM20,300 Total current liability = RM67,900 Long-term liability = RM58,677 Total liability = RM126,577 Total equity = RM129,651 Total liability and equity = RM256,228
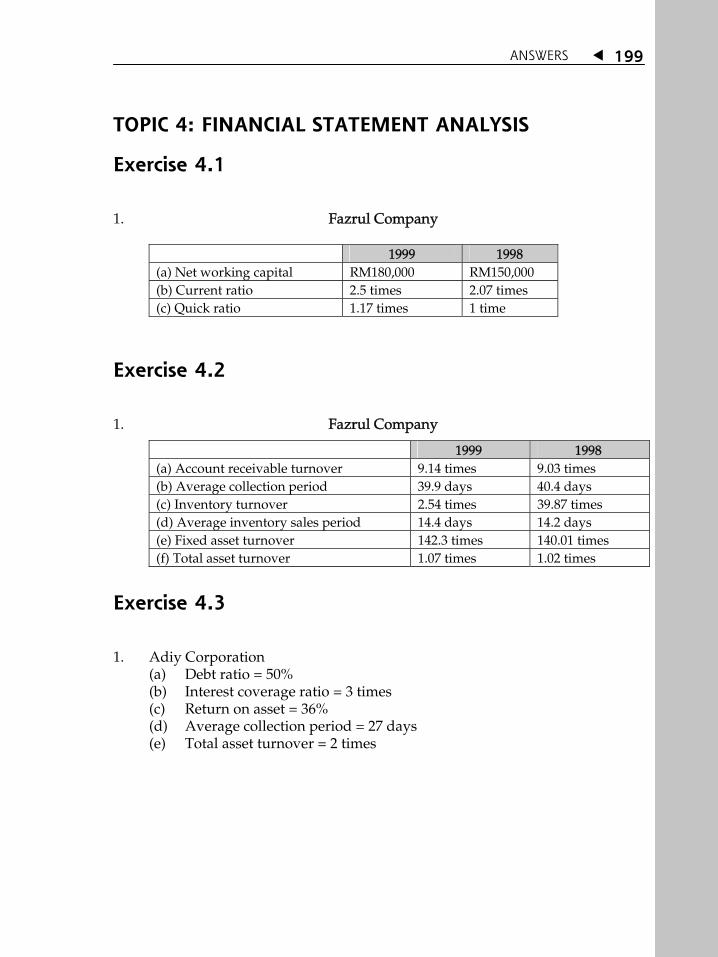
ANSWERS 199
TOPIC 4: FINANCIAL STATEMENT ANALYSIS
Exercise 4.1
1. Fazrul Company
1999 1998 (a) Net working capital RM180,000 RM150,000 (b) Current ratio 2.5 times 2.07 times (c) Quick ratio 1.17 times 1 time
Exercise 4.2
1. Fazrul Company
1999 1998 (a) Account receivable turnover 9.14 times 9.03 times (b) Average collection period 39.9 days 40.4 days (c) Inventory turnover 2.54 times 39.87 times (d) Average inventory sales period 14.4 days 14.2 days (e) Fixed asset turnover 142.3 times 140.01 times (f) Total asset turnover 1.07 times 1.02 times
Exercise 4.3
1. Adiy Corporation
(a) Debt ratio = 50% (b) Interest coverage ratio = 3 times (c) Return on asset = 36% (d) Average collection period = 27 days (e) Total asset turnover = 2 times

ANSWERS
200
Exercise 4.4
1. liquidity 2. current asset; current liability 3. inventory 4. cost of goods sold; inventory 5. total asset 6. net profit; ownersÊ equity 7. share price; earnings 8.
X-Cell N-Hance (a) Return on asset 12.67% 11.25% (b) Return on equity 31.67% 28.13% (c) Net profit margin 10.27% 9.57% (d) Total asset turnover 1.23 times 1.18 times (e) Debt ratio 60% 60% (f) Equity multiplier 2.5 times 2.5 times (g) Interest coverage ratio 7.89 times 8.37 times (h) Price/earnings ratio 6.25 12.62 (i) Dividend yield ratio 6.86% 1.89%
Exercise 4.5
1. True 2. False 3. D 4. C 5. Net profit = RM6,000 6. Return on equity = 4.0% 7. Fima Corporation
(a) Current ratio increased. (b) Return on equity decreased. (c) Debt ratio increased. (d) Dividend yield increased. (e) Account receivables turnover decreased. (f) Return on asset decreased.
8. Lily Company
(a) Current ratio = 0.91 times (b) Quick ratio = 0.63 times (c) Average collection period = 32.5 days (d) Inventory turnover = 20 times
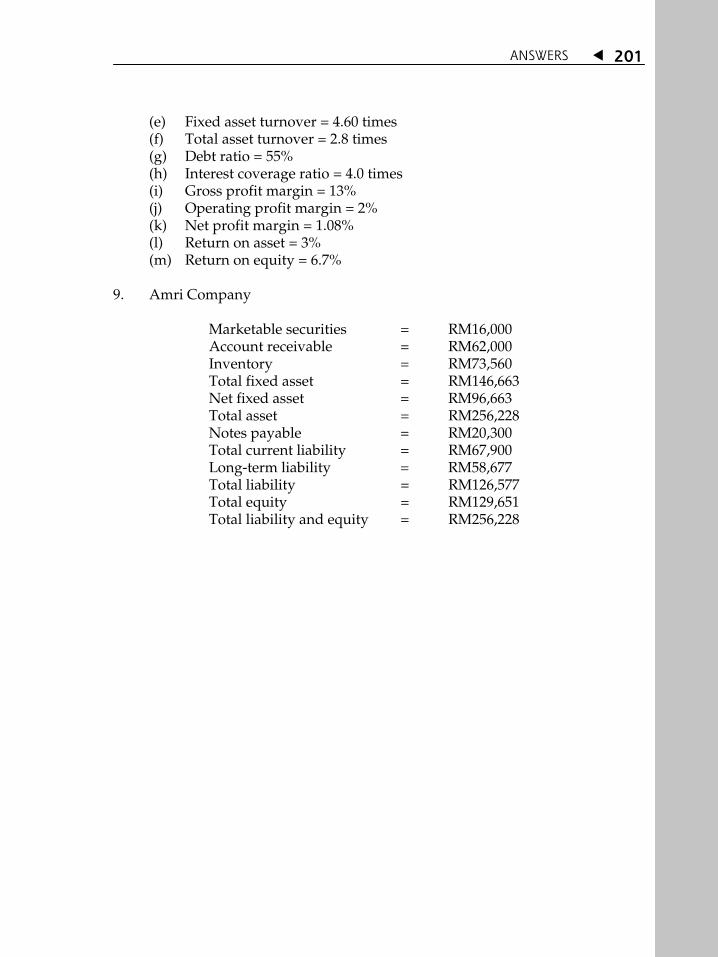
ANSWERS 201
(e) Fixed asset turnover = 4.60 times (f) Total asset turnover = 2.8 times (g) Debt ratio = 55% (h) Interest coverage ratio = 4.0 times (i) Gross profit margin = 13% (j) Operating profit margin = 2% (k) Net profit margin = 1.08% (l) Return on asset = 3% (m) Return on equity = 6.7%
9. Amri Company Marketable securities = RM16,000 Account receivable = RM62,000 Inventory = RM73,560 Total fixed asset = RM146,663 Net fixed asset = RM96,663 Total asset = RM256,228 Notes payable = RM20,300 Total current liability = RM67,900 Long-term liability = RM58,677 Total liability = RM126,577 Total equity = RM129,651 Total liability and equity = RM256,228

ANSWERS
202
TOPIC 5: TIME VALUE OF MONEY
Exercise 5.1
1. RM127.63 2. RM6,050
Exercise 5.2
1. RM11,171.10 2. RM4,974.55
Exercise 5.3
1. RM1,000 2. RM2,268.43
Exercise 5.4
1. RM100.06 2. RM3,522.77
Exercise 5.5
1. RM330.96 2. RM61,050
Exercise 5.6
1. RM272.30
Exercise 5.7
1. RM1,000

ANSWERS 203
Exercise 5.8
1. RM346.06 2. RM149.4 3. FVOA = RM3,000 (FVIFA 8%,15)
= RM3,000 (27.1521) = RM81,456.30
FVAD = RM3,000 (FVIFA 8%,15) (1.08) = RM3,000 (29.32) = RM87,972.80 The difference: RM6,516.50 4. PV1 = RM4,000 (PVIF 18%,1) = RM3,390.00
PV2 = RM5,000 (PVIF 18%,2) = RM3,591.00 PV3 = RM5,000 (PVIF 18%,3) = RM3,043.00 PV4 = RM6,000 (PVIF 18%,4) = RM3,094.80 PV5 = RM8,000 (PVIF 18%,5) = RM3,496.80
Total PV = RM16,615.60 RM16,615.60 – RM30,000 = –RM13,384.40 Therefore, Mas Joko Company should not continue with its investment.
5. (a) RM180/5% = RM3,600 (b) RM180/10% = RM1,800 6. PVOA = RM12,000 (PVIFA 6%,10)
= RM12,000 (7.3601) = RM88,321.20
The second choice should be chosen (RM88,321.20) as the present value is more compared to the first choice (RM60,000).
7. PMTA = PVA / (PVIFA 10%,4) = RM6,000 / 3.170 = RM1,892.74 8. PV = RM400 (2.72) –(0.10) (7) = RM198.55