bounce test - dot.state.mn.us · bounce test a bounce test is used to verify the proper function of...
TRANSCRIPT
Bounce Test
A bounce test is used to verify the proper function of the accelerometers with relation to the wheel
path lasers. Follow the instructions below for details of performing a bounce test on the
PathRunner.
Step 1—Prepare the PathRunner
To begin, start up the Data Collection Unit as if to collect data and put the DMI in TEST mode. It is
recommended to run the test at forty MPH (in test mode). Using the precision machined testing
blocks provided by Pathway Services, place the base plate and ¼” block underneath the Left
Wheel Path (LWP) laser and the Right Wheel Path (RWP) laser located on the front bumper of
the PathRunner.
Step 2—Initial Bounce Verification
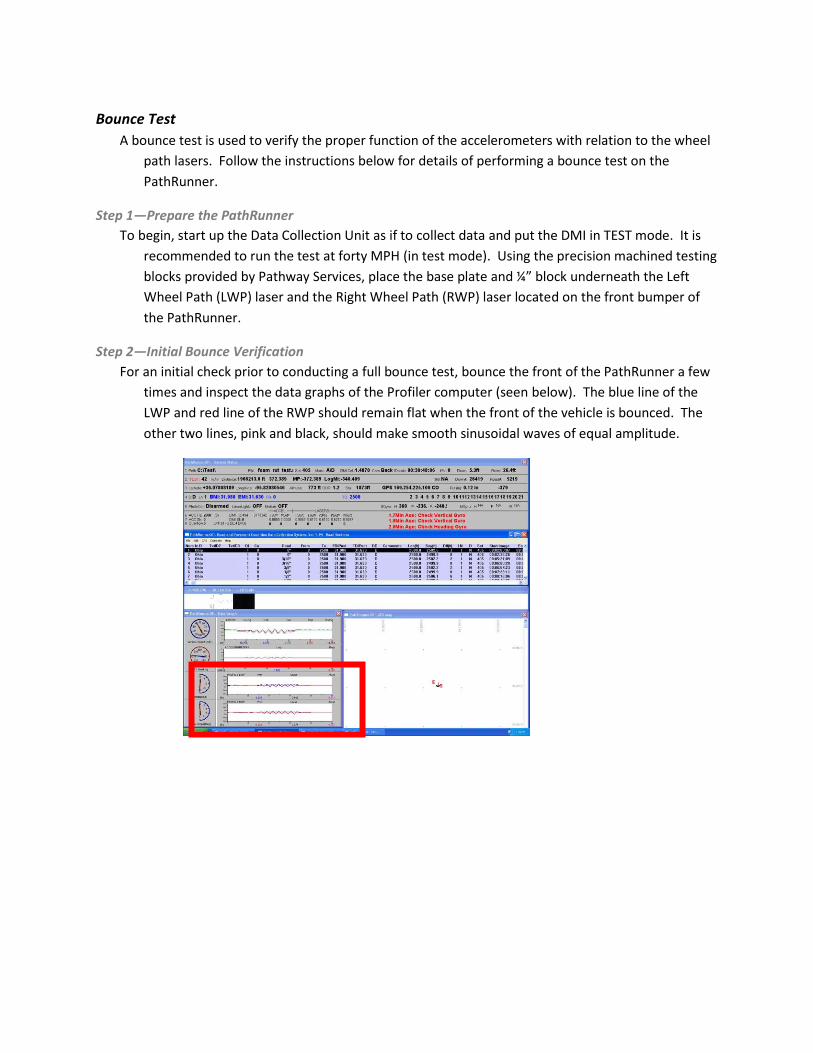
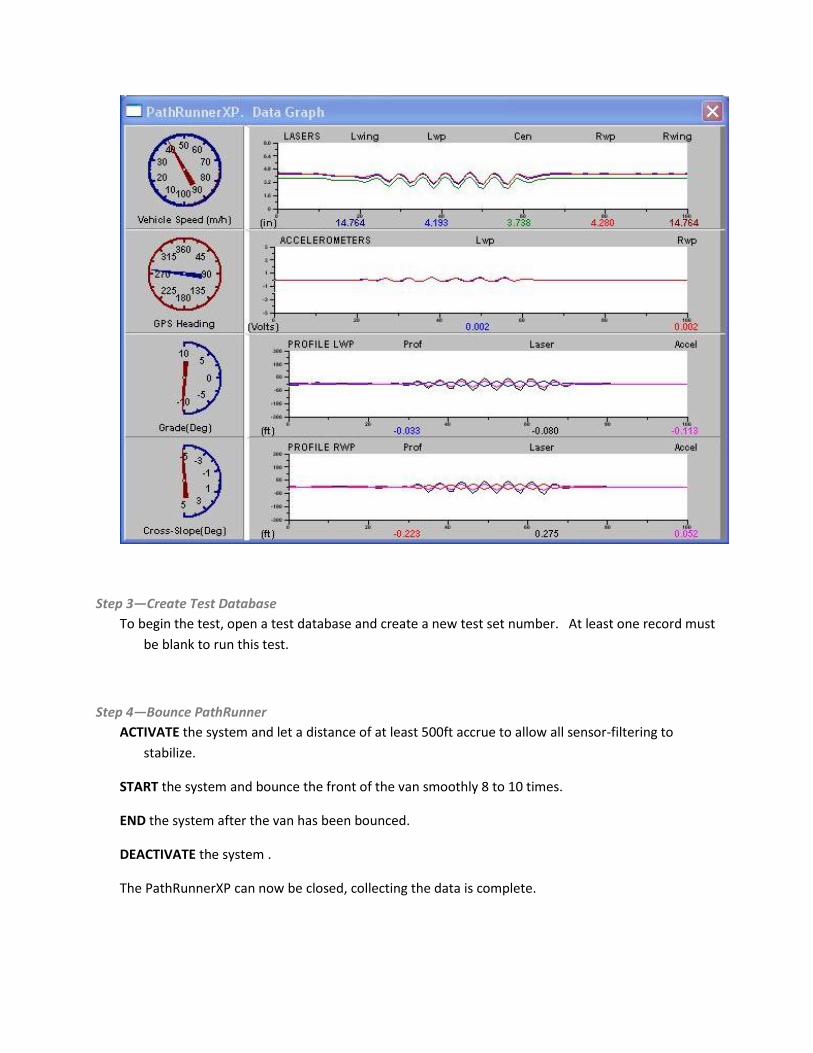
For an initial check prior to conducting a full bounce test, bounce the front of the PathRunner a few
times and inspect the data graphs of the Profiler computer (seen below). The blue line of the
LWP and red line of the RWP should remain flat when the front of the vehicle is bounced. The
other two lines, pink and black, should make smooth sinusoidal waves of equal amplitude.
Step 3—Create Test Database
To begin the test, open a test database and create a new test set number. At least one record must
be blank to run this test.
Step 4—Bounce PathRunner
ACTIVATE the system and let a distance of at least 500ft accrue to allow all sensor-filtering to
stabilize.
START the system and bounce the front of the van smoothly 8 to 10 times.
END the system after the van has been bounced.
DEACTIVATE the system .
The PathRunnerXP can now be closed, collecting the data is complete.
Step 5—Create *.ERD files
After the data has been collected, open the PathView II processing software to create an *.ERD file. To create
the *.ERD files for a bounce test, first highlight the correct database record and then select“Create
Bounce Test ERD Files” from the Sensor menu. This will create all four *.ERD files needed.
Step 6—Open RoadRuf
After the *.ERD files have been created, open the RoadRuf software found on the desktop of the
computer and click the “Start” button.
There are four *.ERD files which will need to be loaded in the RoadRuf software. These include:
BounceL.erd
BounceR.erd
ProfileL.erd
ProfileR.erd If these files are not present then they will need to be added to the list. Use the “Add File” button to
add them. Only add one file at a time and make sure the bounce files are loaded before the
wheel path files.
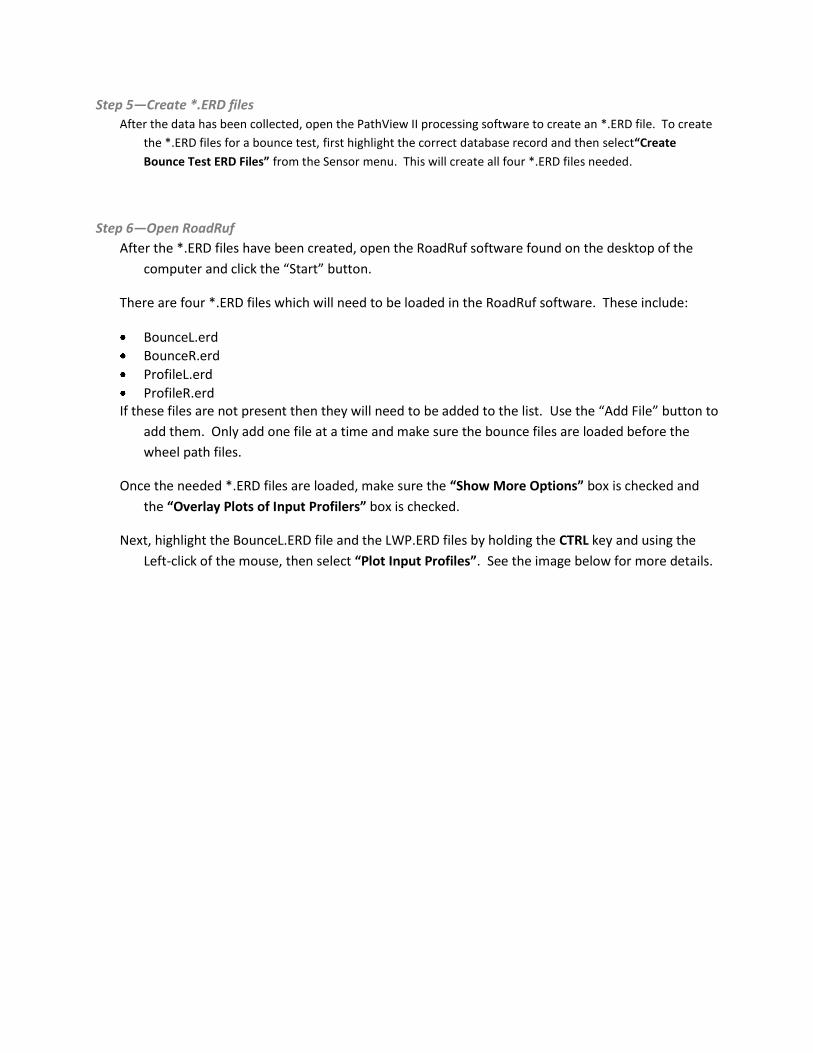
Once the needed *.ERD files are loaded, make sure the “Show More Options” box is checked and
the “Overlay Plots of Input Profilers” box is checked.
Next, highlight the BounceL.ERD file and the LWP.ERD files by holding the CTRL key and using the
Left-click of the mouse, then select “Plot Input Profiles”. See the image below for more details.
This will create a graph of the laser, accelerometer, and the corresponding elevation profile found
by combining the sensor data.
Step 7—Compare Graphs & Make Adjustments
After the graphs are created they can be analyzed for calibration purposes. See image below for
more details:
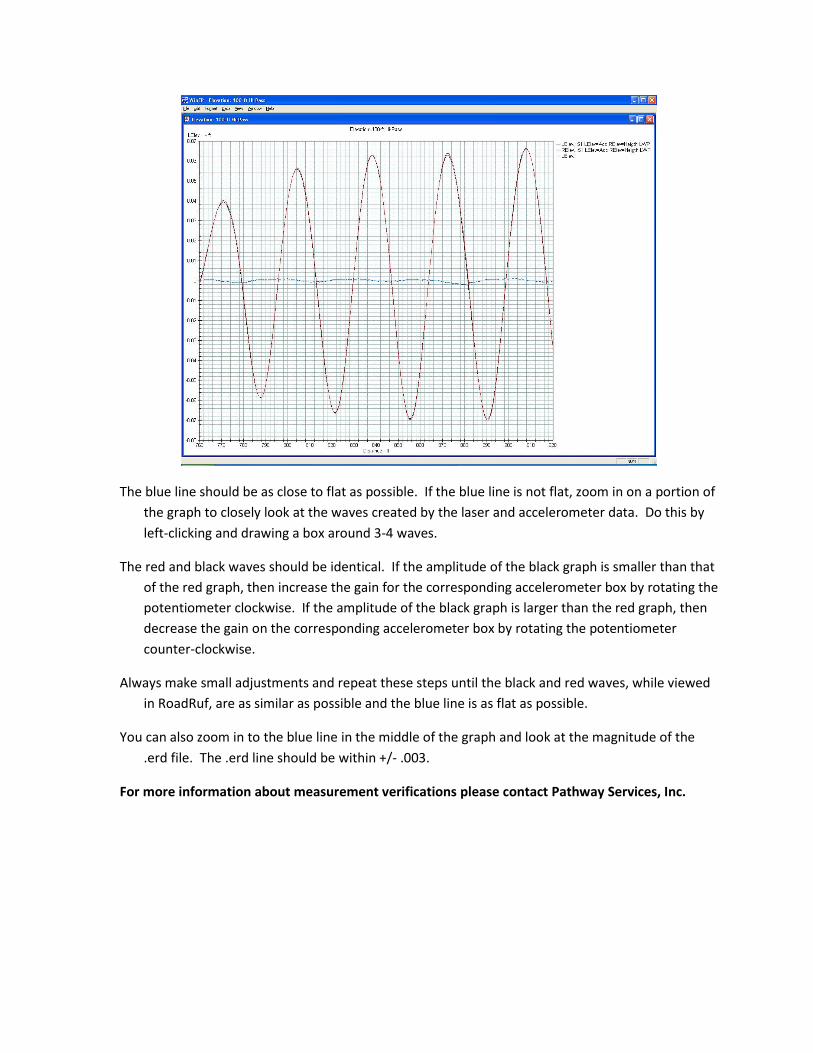
The blue line should be as close to flat as possible. If the blue line is not flat, zoom in on a portion of
the graph to closely look at the waves created by the laser and accelerometer data. Do this by
left-clicking and drawing a box around 3-4 waves.
The red and black waves should be identical. If the amplitude of the black graph is smaller than that
of the red graph, then increase the gain for the corresponding accelerometer box by rotating the
potentiometer clockwise. If the amplitude of the black graph is larger than the red graph, then
decrease the gain on the corresponding accelerometer box by rotating the potentiometer
counter-clockwise.
Always make small adjustments and repeat these steps until the black and red waves, while viewed
in RoadRuf, are as similar as possible and the blue line is as flat as possible.
You can also zoom in to the blue line in the middle of the graph and look at the magnitude of the
.erd file. The .erd line should be within +/- .003.
For more information about measurement verifications please contact Pathway Services, Inc.