border delay report - laredo · 1 border crossing freight delay data collection and analysis world...
TRANSCRIPT
1
Border Crossing Freight Delay Data Collection and Analysis World Trade Bridge – Laredo International Bridge 4
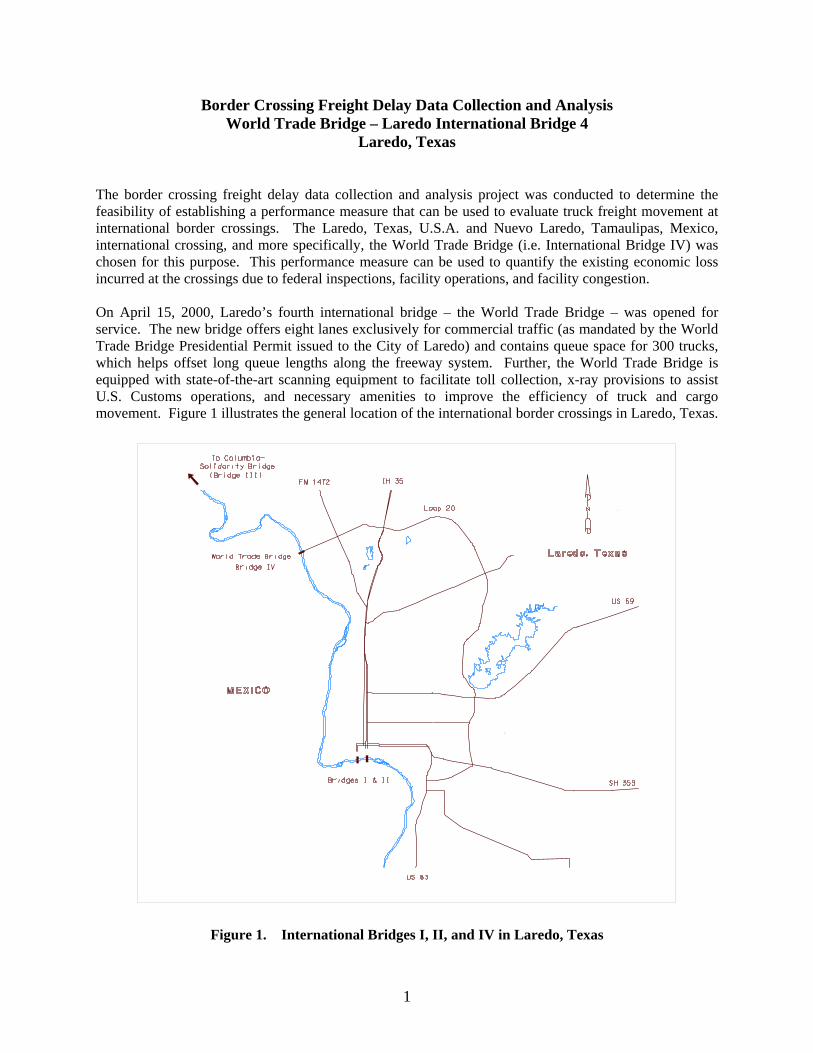
Laredo, Texas The border crossing freight delay data collection and analysis project was conducted to determine the feasibility of establishing a performance measure that can be used to evaluate truck freight movement at international border crossings. The Laredo, Texas, U.S.A. and Nuevo Laredo, Tamaulipas, Mexico, international crossing, and more specifically, the World Trade Bridge (i.e. International Bridge IV) was chosen for this purpose. This performance measure can be used to quantify the existing economic loss incurred at the crossings due to federal inspections, facility operations, and facility congestion. On April 15, 2000, Laredo’s fourth international bridge – the World Trade Bridge – was opened for service. The new bridge offers eight lanes exclusively for commercial traffic (as mandated by the World Trade Bridge Presidential Permit issued to the City of Laredo) and contains queue space for 300 trucks, which helps offset long queue lengths along the freeway system. Further, the World Trade Bridge is equipped with state-of-the-art scanning equipment to facilitate toll collection, x-ray provisions to assist U.S. Customs operations, and necessary amenities to improve the efficiency of truck and cargo movement. Figure 1 illustrates the general location of the international border crossings in Laredo, Texas.
Figure 1. International Bridges I, II, and IV in Laredo, Texas
2
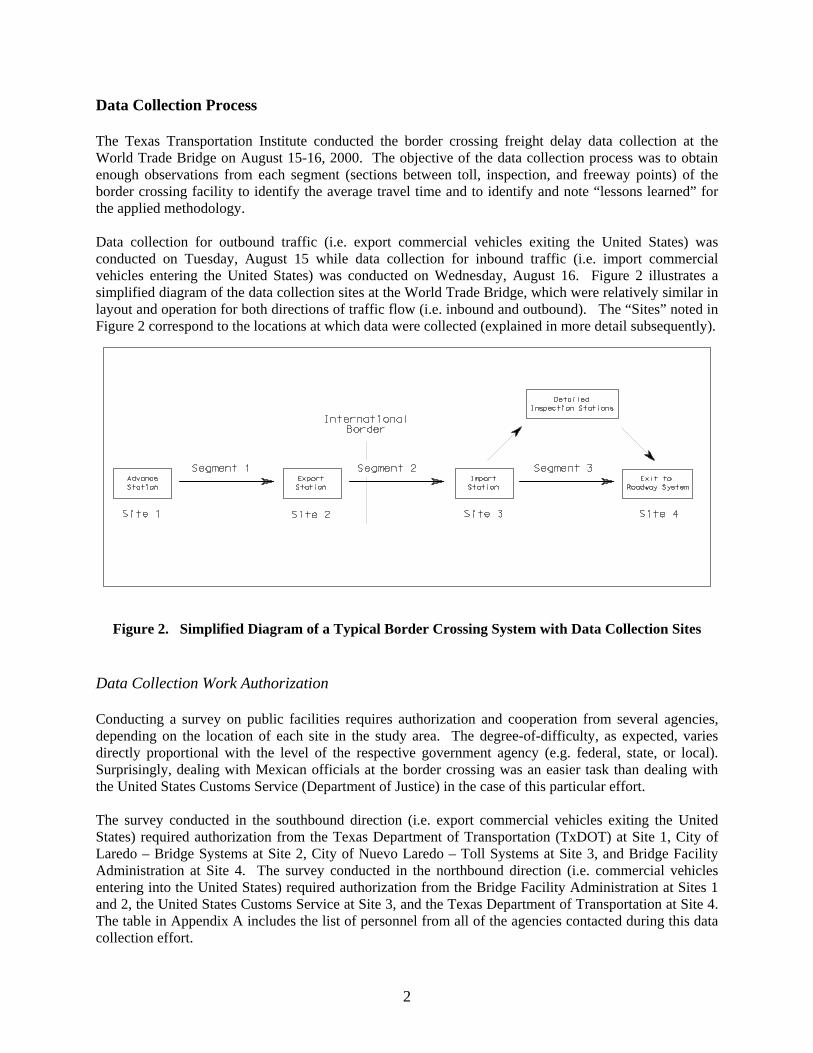
Data Collection Process The Texas Transportation Institute conducted the border crossing freight delay data collection at the World Trade Bridge on August 15-16, 2000. The objective of the data collection process was to obtain enough observations from each segment (sections between toll, inspection, and freeway points) of the border crossing facility to identify the average travel time and to identify and note “lessons learned” for the applied methodology. Data collection for outbound traffic (i.e. export commercial vehicles exiting the United States) was conducted on Tuesday, August 15 while data collection for inbound traffic (i.e. import commercial vehicles entering the United States) was conducted on Wednesday, August 16. Figure 2 illustrates a simplified diagram of the data collection sites at the World Trade Bridge, which were relatively similar in layout and operation for both directions of traffic flow (i.e. inbound and outbound). The “Sites” noted in Figure 2 correspond to the locations at which data were collected (explained in more detail subsequently).
Figure 2. Simplified Diagram of a Typical Border Crossing System with Data Collection Sites
Data Collection Work Authorization Conducting a survey on public facilities requires authorization and cooperation from several agencies, depending on the location of each site in the study area. The degree-of-difficulty, as expected, varies directly proportional with the level of the respective government agency (e.g. federal, state, or local). Surprisingly, dealing with Mexican officials at the border crossing was an easier task than dealing with the United States Customs Service (Department of Justice) in the case of this particular effort. The survey conducted in the southbound direction (i.e. export commercial vehicles exiting the United States) required authorization from the Texas Department of Transportation (TxDOT) at Site 1, City of Laredo – Bridge Systems at Site 2, City of Nuevo Laredo – Toll Systems at Site 3, and Bridge Facility Administration at Site 4. The survey conducted in the northbound direction (i.e. commercial vehicles entering into the United States) required authorization from the Bridge Facility Administration at Sites 1 and 2, the United States Customs Service at Site 3, and the Texas Department of Transportation at Site 4. The table in Appendix A includes the list of personnel from all of the agencies contacted during this data collection effort.
3
In addition to authorization from the various agencies, permission to work at the World Trade Bridge facility needs to be approved by the United States General Services Administration (GSA). The GSA – Public Building Service leases, constructs, renovates, and manages office space for Federal agencies, including federal agencies at the World Trade Bridge. No special privileges are obtained through the GSA other than permission to be within the federal facility. Finally, authorization to conduct business in a foreign country, such as Mexico, requires a work permit (Form FM3) available for 30 days through the Mexican Consulate General. This 30-Day visitor form can be secured upon presentation of:
• A valid passport or a certified copy of the birth certificate, and • Letter from the company represented by the interested individual (if traveling alone), stating
the specific purpose and length of the trip and guaranteeing that the salaries and all expenses will be paid by the company of the individual and not by anyone in Mexico.
Data Collection Details Border crossing statistical data was provided by the City of Laredo/Bridge System and evaluated for an assessment of the variability in travel conditions at the World Trade Bridge. The goal of this analysis process is to obtain statistically useful data with as few data collection days as possible. In order to customize the data collection activities to the World Trade Bridge, the following steps were conducted:
Define significant “seasonal” variations, Define significantly different days of the week, Identify traffic streams that experience significantly different conditions, and Estimate the number of days needed for the data collection survey.
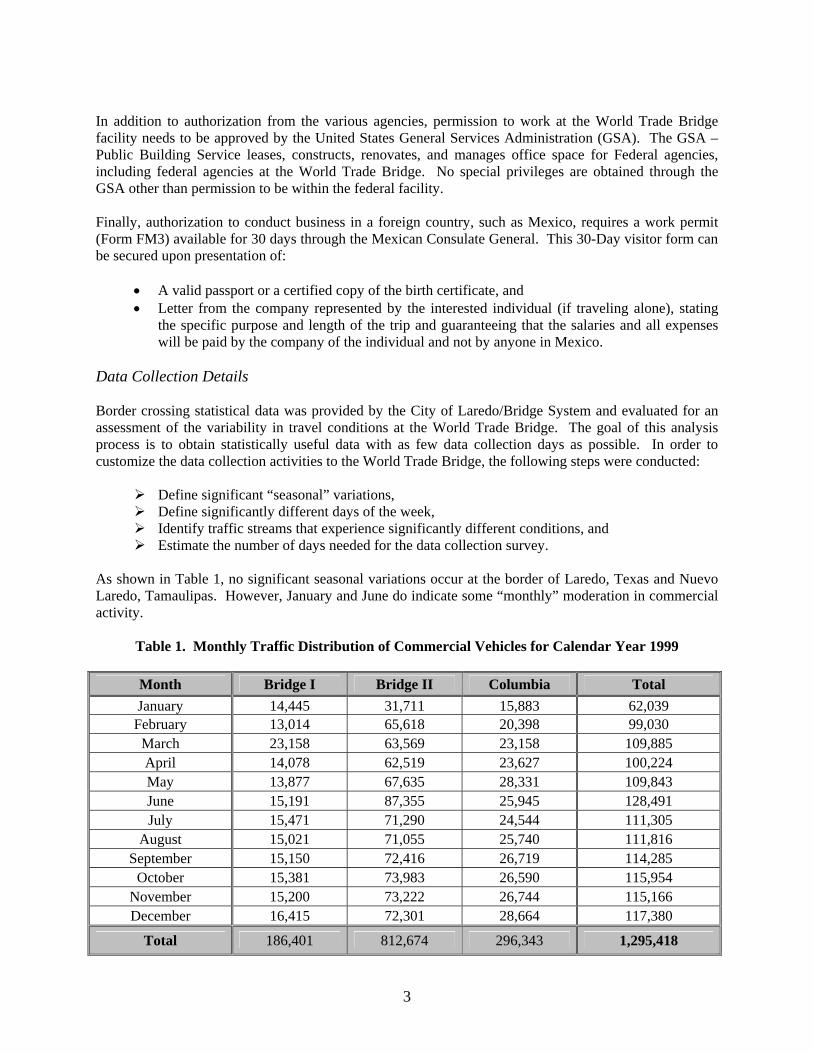
As shown in Table 1, no significant seasonal variations occur at the border of Laredo, Texas and Nuevo Laredo, Tamaulipas. However, January and June do indicate some “monthly” moderation in commercial activity.
Table 1. Monthly Traffic Distribution of Commercial Vehicles for Calendar Year 1999
Month Bridge I Bridge II Columbia Total January 14,445 31,711 15,883 62,039
February 13,014 65,618 20,398 99,030 March 23,158 63,569 23,158 109,885 April 14,078 62,519 23,627 100,224 May 13,877 67,635 28,331 109,843 June 15,191 87,355 25,945 128,491 July 15,471 71,290 24,544 111,305
August 15,021 71,055 25,740 111,816 September 15,150 72,416 26,719 114,285
October 15,381 73,983 26,590 115,954 November 15,200 73,222 26,744 115,166 December 16,415 72,301 28,664 117,380
Total 186,401 812,674 296,343 1,295,418
4
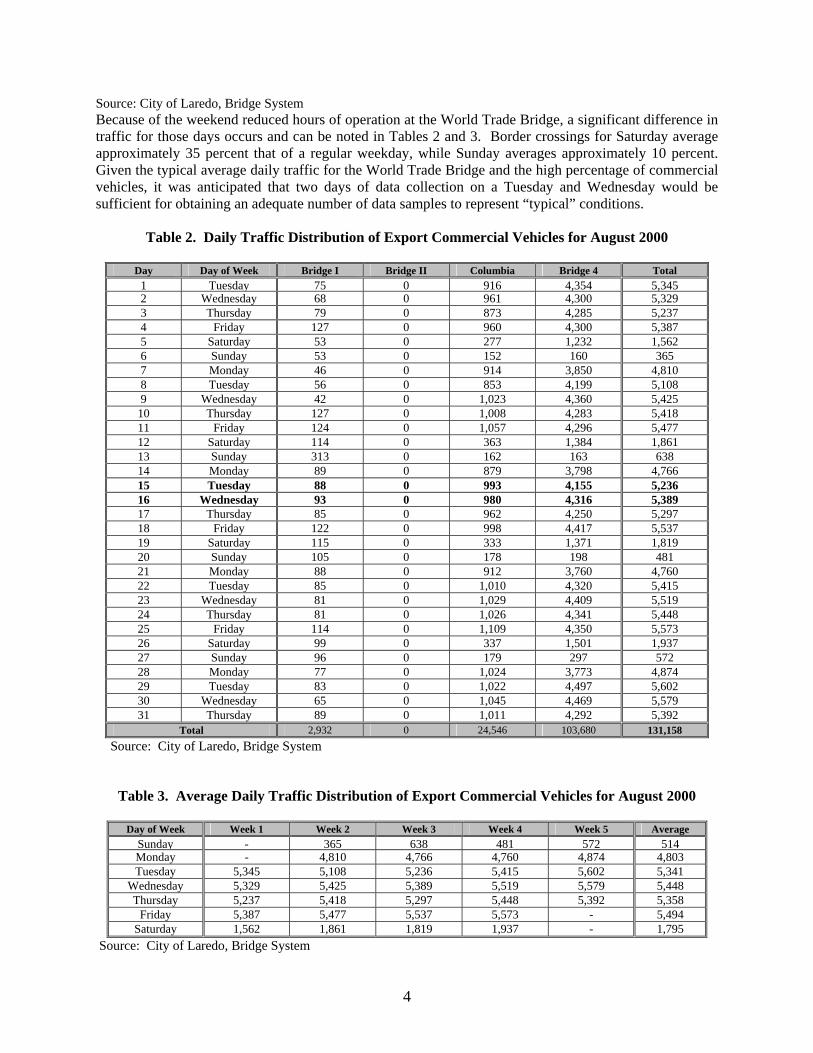
Source: City of Laredo, Bridge System Because of the weekend reduced hours of operation at the World Trade Bridge, a significant difference in traffic for those days occurs and can be noted in Tables 2 and 3. Border crossings for Saturday average approximately 35 percent that of a regular weekday, while Sunday averages approximately 10 percent. Given the typical average daily traffic for the World Trade Bridge and the high percentage of commercial vehicles, it was anticipated that two days of data collection on a Tuesday and Wednesday would be sufficient for obtaining an adequate number of data samples to represent “typical” conditions.
Table 2. Daily Traffic Distribution of Export Commercial Vehicles for August 2000
Day Day of Week Bridge I Bridge II Columbia Bridge 4 Total
1 Tuesday 75 0 916 4,354 5,3452 Wednesday 68 0 961 4,300 5,329 3 Thursday 79 0 873 4,285 5,237 4 Friday 127 0 960 4,300 5,387 5 Saturday 53 0 277 1,232 1,562 6 Sunday 53 0 152 160 365 7 Monday 46 0 914 3,850 4,810 8 Tuesday 56 0 853 4,199 5,108 9 Wednesday 42 0 1,023 4,360 5,425 10 Thursday 127 0 1,008 4,283 5,418 11 Friday 124 0 1,057 4,296 5,477 12 Saturday 114 0 363 1,384 1,861 13 Sunday 313 0 162 163 638 14 Monday 89 0 879 3,798 4,766 15 Tuesday 88 0 993 4,155 5,236 16 Wednesday 93 0 980 4,316 5,389 17 Thursday 85 0 962 4,250 5,297 18 Friday 122 0 998 4,417 5,537 19 Saturday 115 0 333 1,371 1,819 20 Sunday 105 0 178 198 481 21 Monday 88 0 912 3,760 4,760 22 Tuesday 85 0 1,010 4,320 5,415 23 Wednesday 81 0 1,029 4,409 5,519 24 Thursday 81 0 1,026 4,341 5,448 25 Friday 114 0 1,109 4,350 5,573 26 Saturday 99 0 337 1,501 1,937 27 Sunday 96 0 179 297 572 28 Monday 77 0 1,024 3,773 4,874 29 Tuesday 83 0 1,022 4,497 5,602 30 Wednesday 65 0 1,045 4,469 5,579 31 Thursday 89 0 1,011 4,292 5,392
Total 2,932 0 24,546 103,680 131,158 Source: City of Laredo, Bridge System
Table 3. Average Daily Traffic Distribution of Export Commercial Vehicles for August 2000
Day of Week Week 1 Week 2 Week 3 Week 4 Week 5 Average Sunday - 365 638 481 572 514Monday - 4,810 4,766 4,760 4,874 4,803 Tuesday 5,345 5,108 5,236 5,415 5,602 5,341
Wednesday 5,329 5,425 5,389 5,519 5,579 5,448 Thursday 5,237 5,418 5,297 5,448 5,392 5,358
Friday 5,387 5,477 5,537 5,573 - 5,494 Saturday 1,562 1,861 1,819 1,937 - 1,795
Source: City of Laredo, Bridge System
5
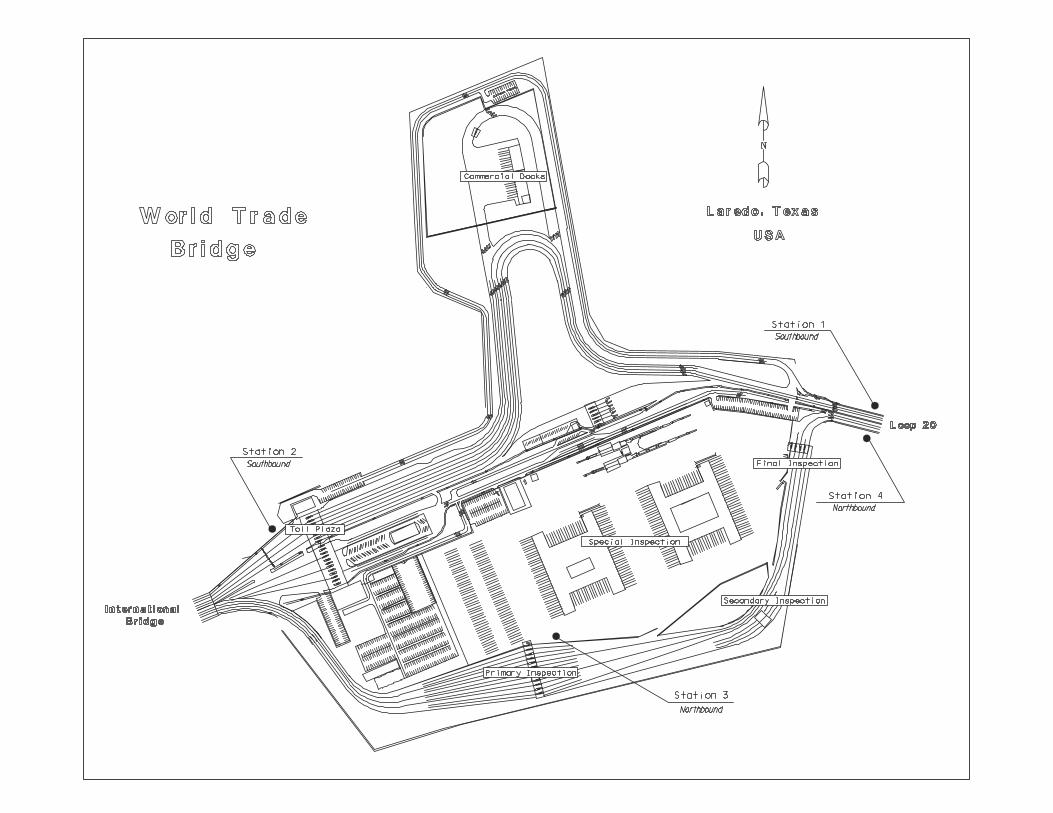
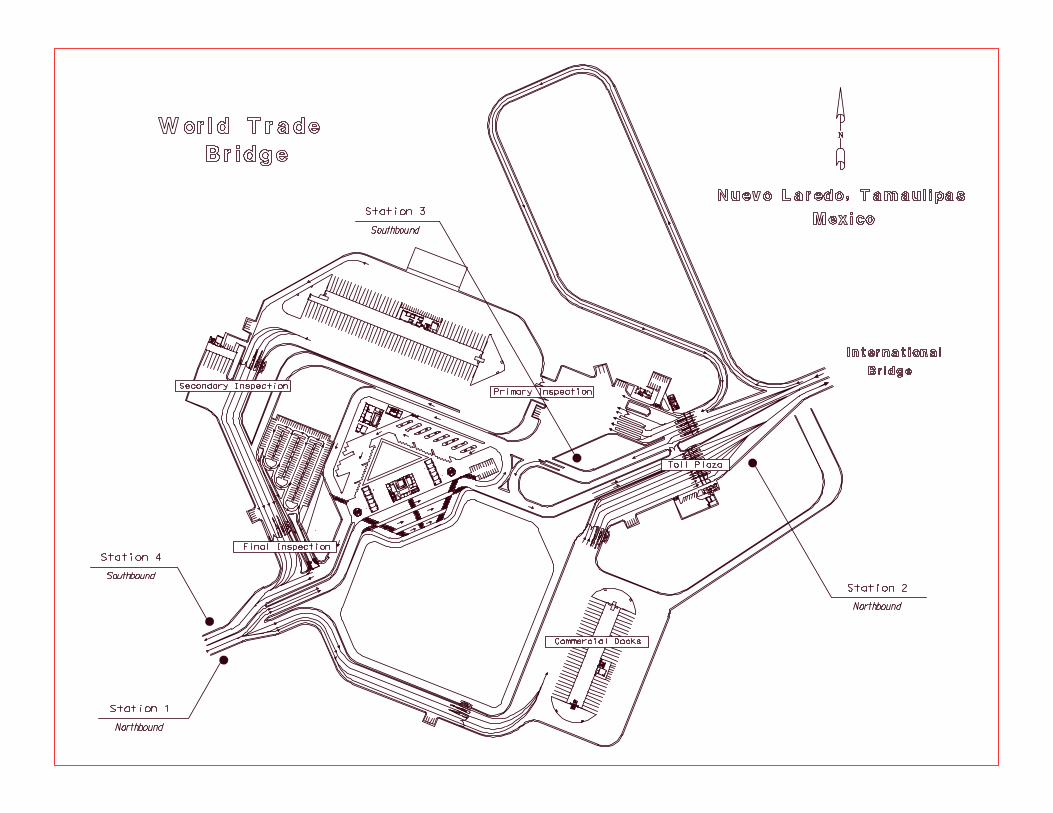
Data Collection Procedures The data collection sites selected for the World Trade Bridge were chosen because of the particular actions that occur at each site. Segments defined by these data collection stations were used to determine the commercial vehicle travel times and specific location of freight delay. As illustrated in Figure 2, the four data collection sites were located at:
• An advance station located upstream of the commercial vehicle queue, • The export station (booth before the international crossing), • The import station (booth before detailed inspection), and • An exit station to the roadway system.
Data collection was conducted by recording commercial vehicle license plate figures as vehicles crossed a fixed point within the data collection sites. Four survey teams, each consisting of two surveyors, were placed at one of the four data collection sites to record commercial vehicle license plate data. Data collection for the two directions of travel was conducted on separate days to maximize the number of stations (i.e. four stations for outbound traffic and four stations for inbound traffic) at the World Trade Bridge. Appendix B contains diagrams of the World Trade Bridge facilities on both sides of the border, including station locations and major points of inspection (1,2). The assignment of two-member survey teams to each station allowed for an efficient and accurate data collection survey. With one member continuously reading out commercial vehicle license plates using a pair of binoculars, the other member would enter the data into the data collection device (described in the following section). The collection of four characters when reading the license plates has been used by most agencies, and experience has indicated that the first four are easier to read than the last four (3). However, it was discovered during the initial hours of the data collection effort that many commercial transportation carriers were assigned license plates for an entire fleet, thus having similar numbers and requiring that the survey team record the entire license plate number. After completion of day one data collection activities, the license plate data stored in the data collection devices were downloaded onto the field laptop computer and saved on the hard disk. Once all data collection devices were successfully downloaded, they were set to recharge and prepared for day two of the data collection study. Upon completion of day two data collection activities, the data collection devices were once again downloaded to the field laptop computer and saved on the hard disk. Data collection for both study days was scheduled between the hours of 8:00 AM and 5:00 PM. Hours of operation for the World Trade Bridge are 8:00 AM to 12:00 AM during weekdays and 8:00 AM to 4:00 PM during the weekend. After review of the hourly traffic volume and delay data collected during the license plate survey, vehicle volumes exceed 300 vehicles per hour (vph) between the hours of 12:00 PM and 8:00 PM. Future surveys at this location should consider this time period as the optimal range for license plate data collection. Data Collection Sample Size Sample sizes are typically not a large concern with the video or portable data collection device license plate matching techniques, because data collection includes a large number of vehicles. However, minimum sample sizes should be verified with variability values from field data. Early research found that sample sizes from 25 to 100 license matches were necessary for a given roadway segment and time period (3).
6
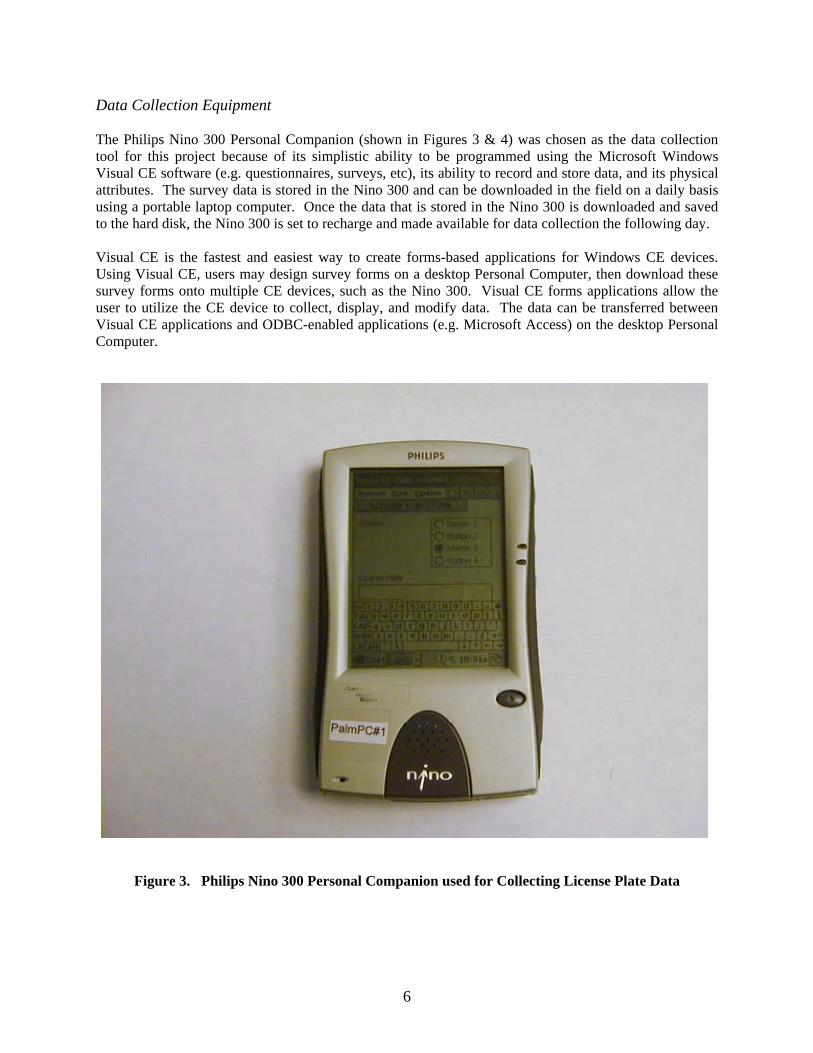
Data Collection Equipment The Philips Nino 300 Personal Companion (shown in Figures 3 & 4) was chosen as the data collection tool for this project because of its simplistic ability to be programmed using the Microsoft Windows Visual CE software (e.g. questionnaires, surveys, etc), its ability to record and store data, and its physical attributes. The survey data is stored in the Nino 300 and can be downloaded in the field on a daily basis using a portable laptop computer. Once the data that is stored in the Nino 300 is downloaded and saved to the hard disk, the Nino 300 is set to recharge and made available for data collection the following day. Visual CE is the fastest and easiest way to create forms-based applications for Windows CE devices. Using Visual CE, users may design survey forms on a desktop Personal Computer, then download these survey forms onto multiple CE devices, such as the Nino 300. Visual CE forms applications allow the user to utilize the CE device to collect, display, and modify data. The data can be transferred between Visual CE applications and ODBC-enabled applications (e.g. Microsoft Access) on the desktop Personal Computer.
Figure 3. Philips Nino 300 Personal Companion used for Collecting License Plate Data
7
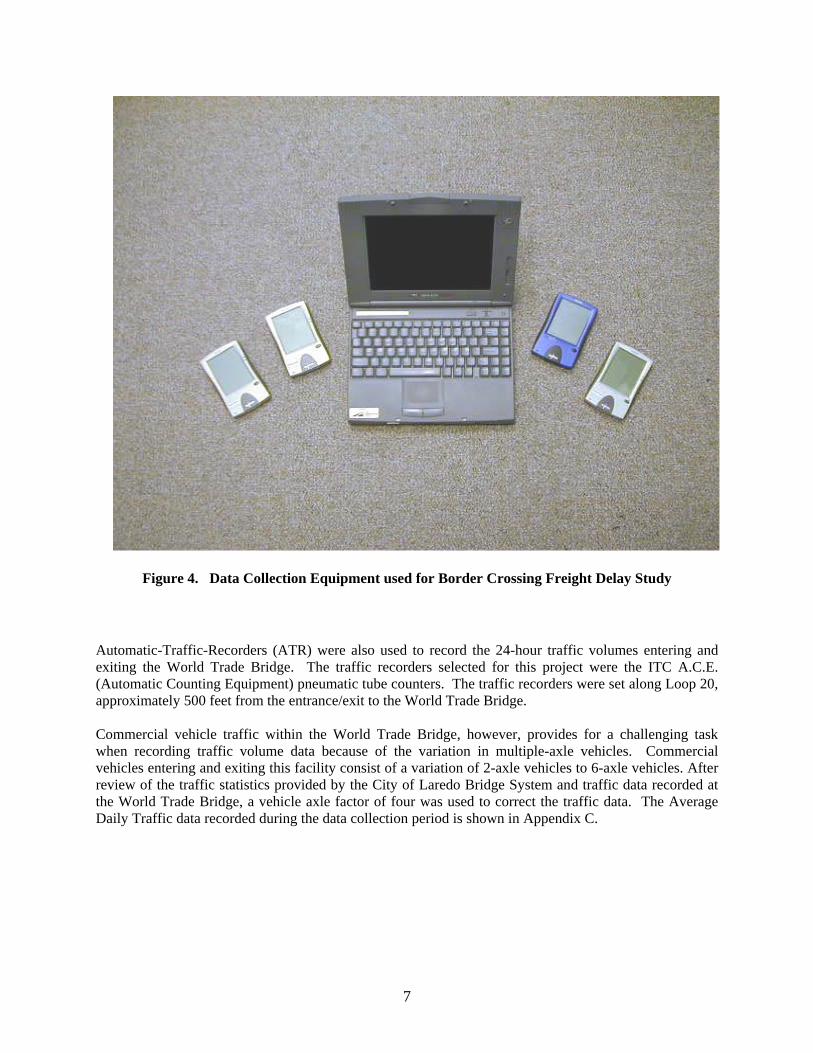
Figure 4. Data Collection Equipment used for Border Crossing Freight Delay Study Automatic-Traffic-Recorders (ATR) were also used to record the 24-hour traffic volumes entering and exiting the World Trade Bridge. The traffic recorders selected for this project were the ITC A.C.E. (Automatic Counting Equipment) pneumatic tube counters. The traffic recorders were set along Loop 20, approximately 500 feet from the entrance/exit to the World Trade Bridge. Commercial vehicle traffic within the World Trade Bridge, however, provides for a challenging task when recording traffic volume data because of the variation in multiple-axle vehicles. Commercial vehicles entering and exiting this facility consist of a variation of 2-axle vehicles to 6-axle vehicles. After review of the traffic statistics provided by the City of Laredo Bridge System and traffic data recorded at the World Trade Bridge, a vehicle axle factor of four was used to correct the traffic data. The Average Daily Traffic data recorded during the data collection period is shown in Appendix C.
8
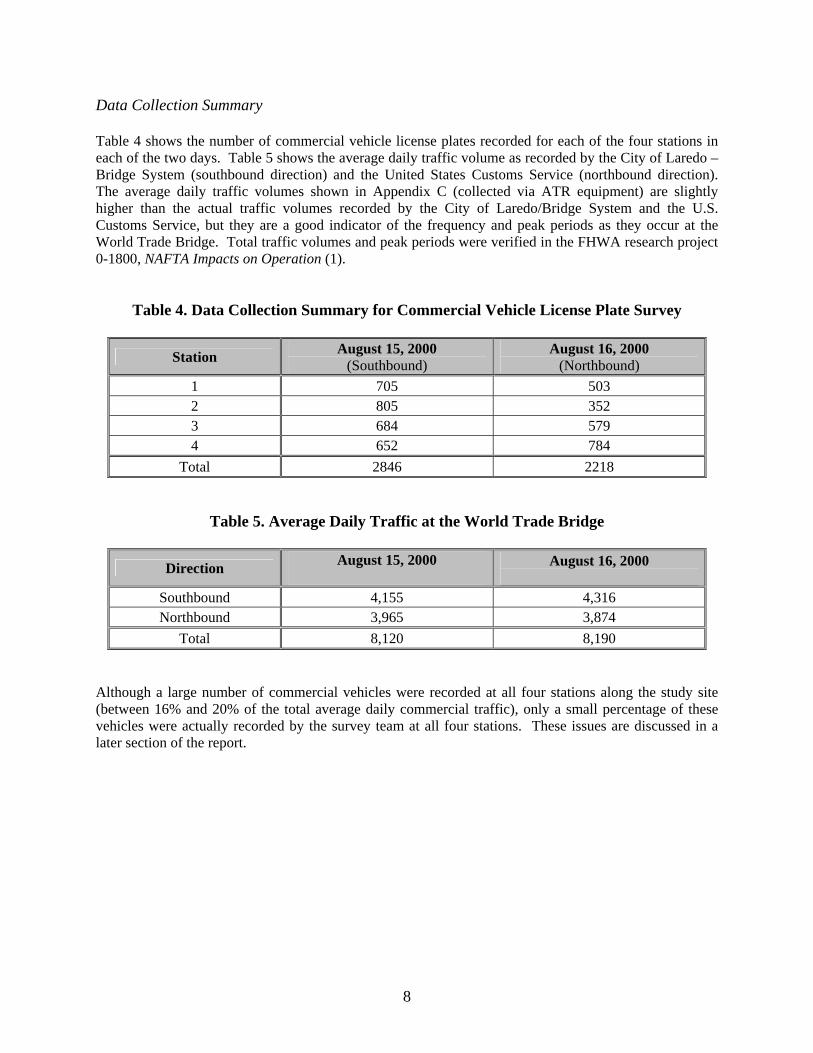
Data Collection Summary Table 4 shows the number of commercial vehicle license plates recorded for each of the four stations in each of the two days. Table 5 shows the average daily traffic volume as recorded by the City of Laredo – Bridge System (southbound direction) and the United States Customs Service (northbound direction). The average daily traffic volumes shown in Appendix C (collected via ATR equipment) are slightly higher than the actual traffic volumes recorded by the City of Laredo/Bridge System and the U.S. Customs Service, but they are a good indicator of the frequency and peak periods as they occur at the World Trade Bridge. Total traffic volumes and peak periods were verified in the FHWA research project 0-1800, NAFTA Impacts on Operation (1).
Table 4. Data Collection Summary for Commercial Vehicle License Plate Survey
Station August 15, 2000 (Southbound)
August 16, 2000 (Northbound)
1 705 503 2 805 352 3 684 579 4 652 784
Total 2846 2218
Table 5. Average Daily Traffic at the World Trade Bridge
Direction August 15, 2000
August 16, 2000
Southbound 4,155 4,316 Northbound 3,965 3,874
Total 8,120 8,190 Although a large number of commercial vehicles were recorded at all four stations along the study site (between 16% and 20% of the total average daily commercial traffic), only a small percentage of these vehicles were actually recorded by the survey team at all four stations. These issues are discussed in a later section of the report.
9
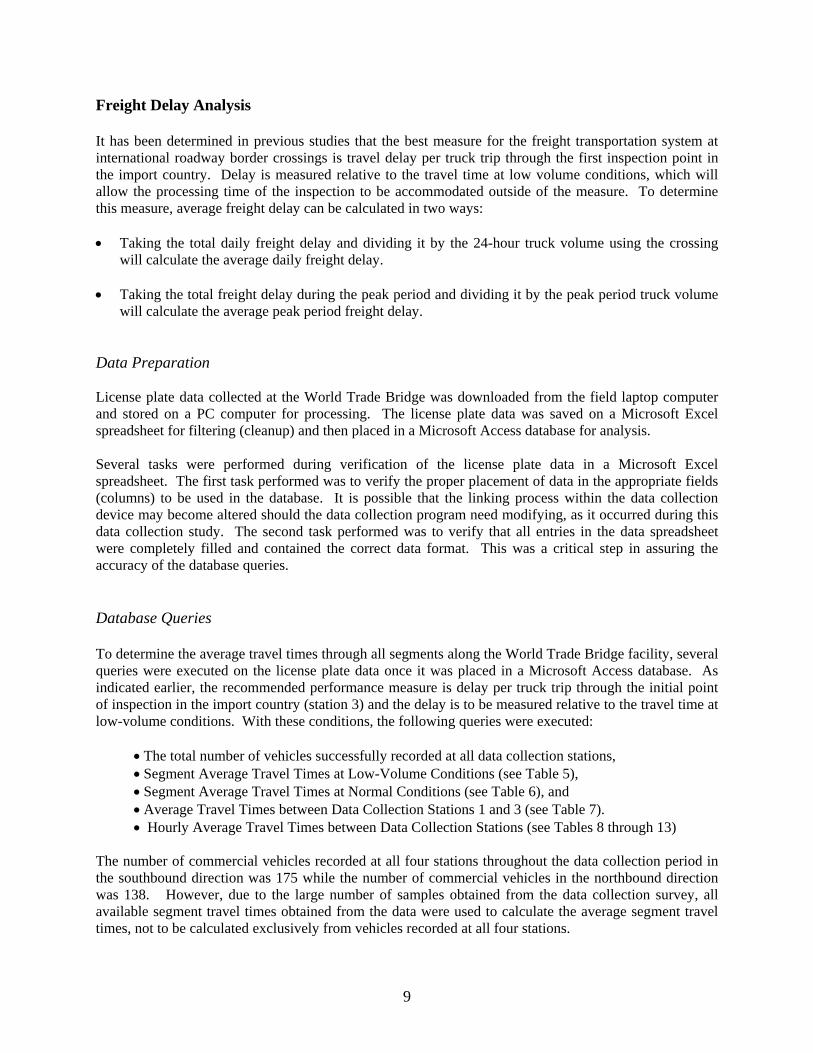
Freight Delay Analysis It has been determined in previous studies that the best measure for the freight transportation system at international roadway border crossings is travel delay per truck trip through the first inspection point in the import country. Delay is measured relative to the travel time at low volume conditions, which will allow the processing time of the inspection to be accommodated outside of the measure. To determine this measure, average freight delay can be calculated in two ways: • Taking the total daily freight delay and dividing it by the 24-hour truck volume using the crossing
will calculate the average daily freight delay. • Taking the total freight delay during the peak period and dividing it by the peak period truck volume
will calculate the average peak period freight delay. Data Preparation License plate data collected at the World Trade Bridge was downloaded from the field laptop computer and stored on a PC computer for processing. The license plate data was saved on a Microsoft Excel spreadsheet for filtering (cleanup) and then placed in a Microsoft Access database for analysis. Several tasks were performed during verification of the license plate data in a Microsoft Excel spreadsheet. The first task performed was to verify the proper placement of data in the appropriate fields (columns) to be used in the database. It is possible that the linking process within the data collection device may become altered should the data collection program need modifying, as it occurred during this data collection study. The second task performed was to verify that all entries in the data spreadsheet were completely filled and contained the correct data format. This was a critical step in assuring the accuracy of the database queries. Database Queries To determine the average travel times through all segments along the World Trade Bridge facility, several queries were executed on the license plate data once it was placed in a Microsoft Access database. As indicated earlier, the recommended performance measure is delay per truck trip through the initial point of inspection in the import country (station 3) and the delay is to be measured relative to the travel time at low-volume conditions. With these conditions, the following queries were executed:
• The total number of vehicles successfully recorded at all data collection stations, • Segment Average Travel Times at Low-Volume Conditions (see Table 5), • Segment Average Travel Times at Normal Conditions (see Table 6), and • Average Travel Times between Data Collection Stations 1 and 3 (see Table 7). • Hourly Average Travel Times between Data Collection Stations (see Tables 8 through 13)
The number of commercial vehicles recorded at all four stations throughout the data collection period in the southbound direction was 175 while the number of commercial vehicles in the northbound direction was 138. However, due to the large number of samples obtained from the data collection survey, all available segment travel times obtained from the data were used to calculate the average segment travel times, not to be calculated exclusively from vehicles recorded at all four stations.
10
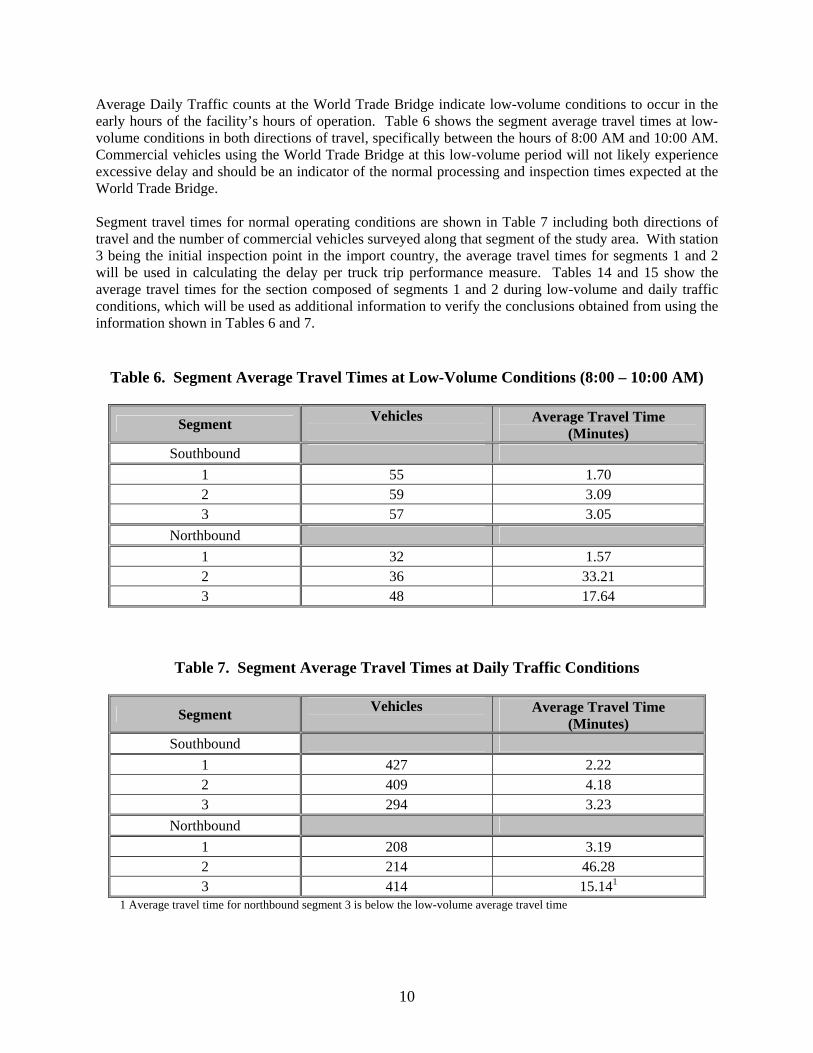
Average Daily Traffic counts at the World Trade Bridge indicate low-volume conditions to occur in the early hours of the facility’s hours of operation. Table 6 shows the segment average travel times at low-volume conditions in both directions of travel, specifically between the hours of 8:00 AM and 10:00 AM. Commercial vehicles using the World Trade Bridge at this low-volume period will not likely experience excessive delay and should be an indicator of the normal processing and inspection times expected at the World Trade Bridge. Segment travel times for normal operating conditions are shown in Table 7 including both directions of travel and the number of commercial vehicles surveyed along that segment of the study area. With station 3 being the initial inspection point in the import country, the average travel times for segments 1 and 2 will be used in calculating the delay per truck trip performance measure. Tables 14 and 15 show the average travel times for the section composed of segments 1 and 2 during low-volume and daily traffic conditions, which will be used as additional information to verify the conclusions obtained from using the information shown in Tables 6 and 7.
Table 6. Segment Average Travel Times at Low-Volume Conditions (8:00 – 10:00 AM)
Segment Vehicles
Average Travel Time (Minutes)
Southbound 1 55 1.70 2 59 3.09 3 57 3.05
Northbound 1 32 1.57 2 36 33.21 3 48 17.64
Table 7. Segment Average Travel Times at Daily Traffic Conditions
Segment Vehicles
Average Travel Time (Minutes)
Southbound 1 427 2.22 2 409 4.18 3 294 3.23
Northbound 1 208 3.19 2 214 46.28 3 414 15.141
1 Average travel time for northbound segment 3 is below the low-volume average travel time
11
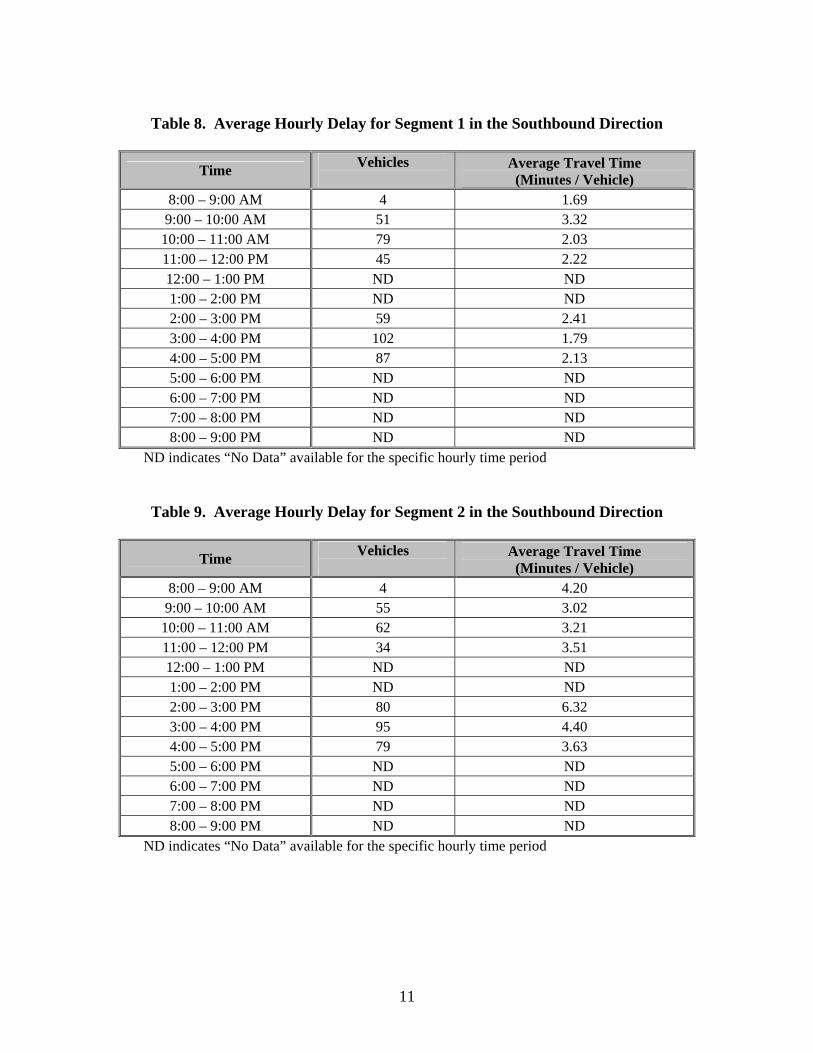
Table 8. Average Hourly Delay for Segment 1 in the Southbound Direction
Time Vehicles
Average Travel Time (Minutes / Vehicle)
8:00 – 9:00 AM 4 1.69 9:00 – 10:00 AM 51 3.32
10:00 – 11:00 AM 79 2.03 11:00 – 12:00 PM 45 2.22 12:00 – 1:00 PM ND ND 1:00 – 2:00 PM ND ND 2:00 – 3:00 PM 59 2.41 3:00 – 4:00 PM 102 1.79 4:00 – 5:00 PM 87 2.13 5:00 – 6:00 PM ND ND 6:00 – 7:00 PM ND ND 7:00 – 8:00 PM ND ND 8:00 – 9:00 PM ND ND
ND indicates “No Data” available for the specific hourly time period
Table 9. Average Hourly Delay for Segment 2 in the Southbound Direction
Time Vehicles
Average Travel Time (Minutes / Vehicle)
8:00 – 9:00 AM 4 4.20 9:00 – 10:00 AM 55 3.02
10:00 – 11:00 AM 62 3.21 11:00 – 12:00 PM 34 3.51 12:00 – 1:00 PM ND ND 1:00 – 2:00 PM ND ND 2:00 – 3:00 PM 80 6.32 3:00 – 4:00 PM 95 4.40 4:00 – 5:00 PM 79 3.63 5:00 – 6:00 PM ND ND 6:00 – 7:00 PM ND ND 7:00 – 8:00 PM ND ND 8:00 – 9:00 PM ND ND
ND indicates “No Data” available for the specific hourly time period
12
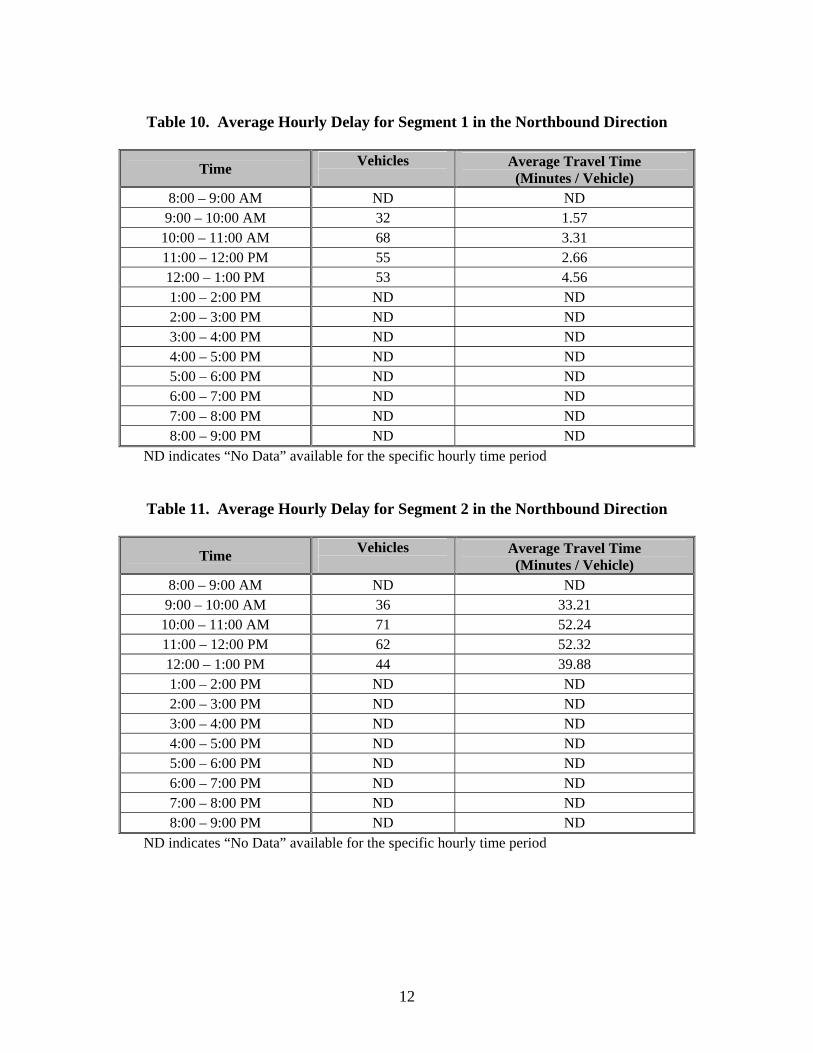
Table 10. Average Hourly Delay for Segment 1 in the Northbound Direction
Time Vehicles
Average Travel Time (Minutes / Vehicle)
8:00 – 9:00 AM ND ND 9:00 – 10:00 AM 32 1.57
10:00 – 11:00 AM 68 3.31 11:00 – 12:00 PM 55 2.66 12:00 – 1:00 PM 53 4.56 1:00 – 2:00 PM ND ND 2:00 – 3:00 PM ND ND 3:00 – 4:00 PM ND ND 4:00 – 5:00 PM ND ND 5:00 – 6:00 PM ND ND 6:00 – 7:00 PM ND ND 7:00 – 8:00 PM ND ND 8:00 – 9:00 PM ND ND
ND indicates “No Data” available for the specific hourly time period
Table 11. Average Hourly Delay for Segment 2 in the Northbound Direction
Time Vehicles
Average Travel Time (Minutes / Vehicle)
8:00 – 9:00 AM ND ND 9:00 – 10:00 AM 36 33.21
10:00 – 11:00 AM 71 52.24 11:00 – 12:00 PM 62 52.32 12:00 – 1:00 PM 44 39.88 1:00 – 2:00 PM ND ND 2:00 – 3:00 PM ND ND 3:00 – 4:00 PM ND ND 4:00 – 5:00 PM ND ND 5:00 – 6:00 PM ND ND 6:00 – 7:00 PM ND ND 7:00 – 8:00 PM ND ND 8:00 – 9:00 PM ND ND
ND indicates “No Data” available for the specific hourly time period
13
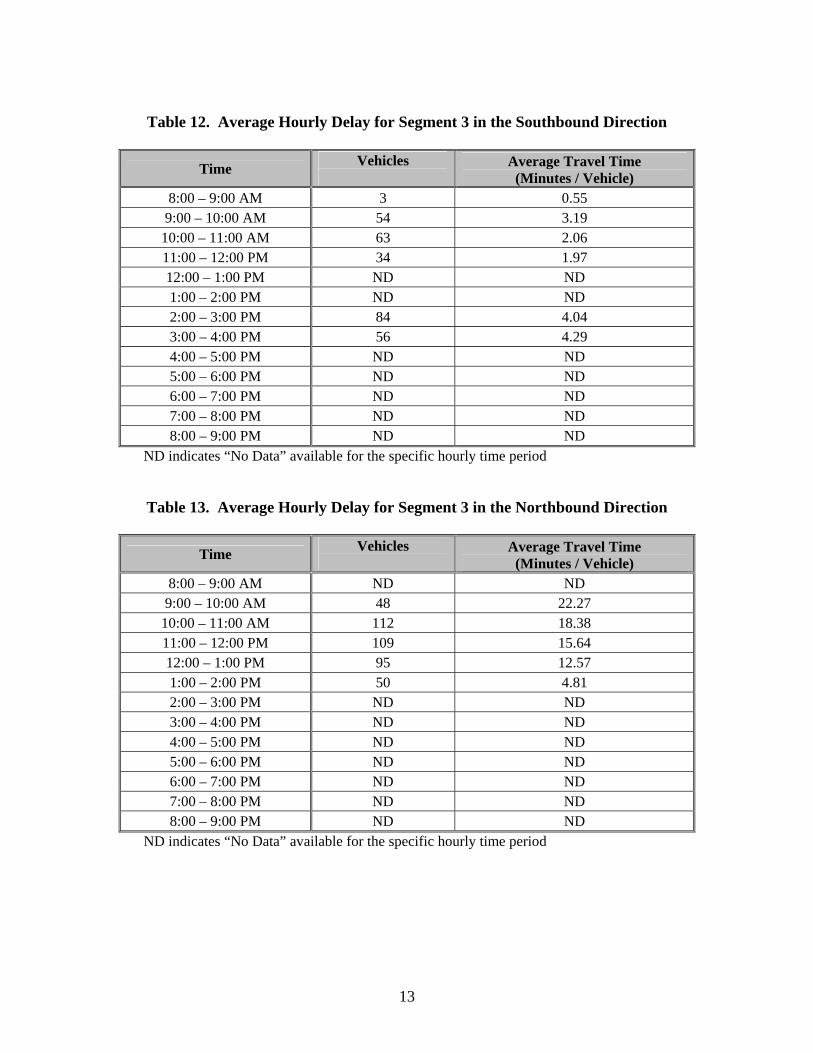
Table 12. Average Hourly Delay for Segment 3 in the Southbound Direction
Time Vehicles
Average Travel Time (Minutes / Vehicle)
8:00 – 9:00 AM 3 0.55 9:00 – 10:00 AM 54 3.19
10:00 – 11:00 AM 63 2.06 11:00 – 12:00 PM 34 1.97 12:00 – 1:00 PM ND ND 1:00 – 2:00 PM ND ND 2:00 – 3:00 PM 84 4.04 3:00 – 4:00 PM 56 4.29 4:00 – 5:00 PM ND ND 5:00 – 6:00 PM ND ND 6:00 – 7:00 PM ND ND 7:00 – 8:00 PM ND ND 8:00 – 9:00 PM ND ND
ND indicates “No Data” available for the specific hourly time period
Table 13. Average Hourly Delay for Segment 3 in the Northbound Direction
Time Vehicles
Average Travel Time (Minutes / Vehicle)
8:00 – 9:00 AM ND ND 9:00 – 10:00 AM 48 22.27
10:00 – 11:00 AM 112 18.38 11:00 – 12:00 PM 109 15.64 12:00 – 1:00 PM 95 12.57 1:00 – 2:00 PM 50 4.81 2:00 – 3:00 PM ND ND 3:00 – 4:00 PM ND ND 4:00 – 5:00 PM ND ND 5:00 – 6:00 PM ND ND 6:00 – 7:00 PM ND ND 7:00 – 8:00 PM ND ND 8:00 – 9:00 PM ND ND
ND indicates “No Data” available for the specific hourly time period
14
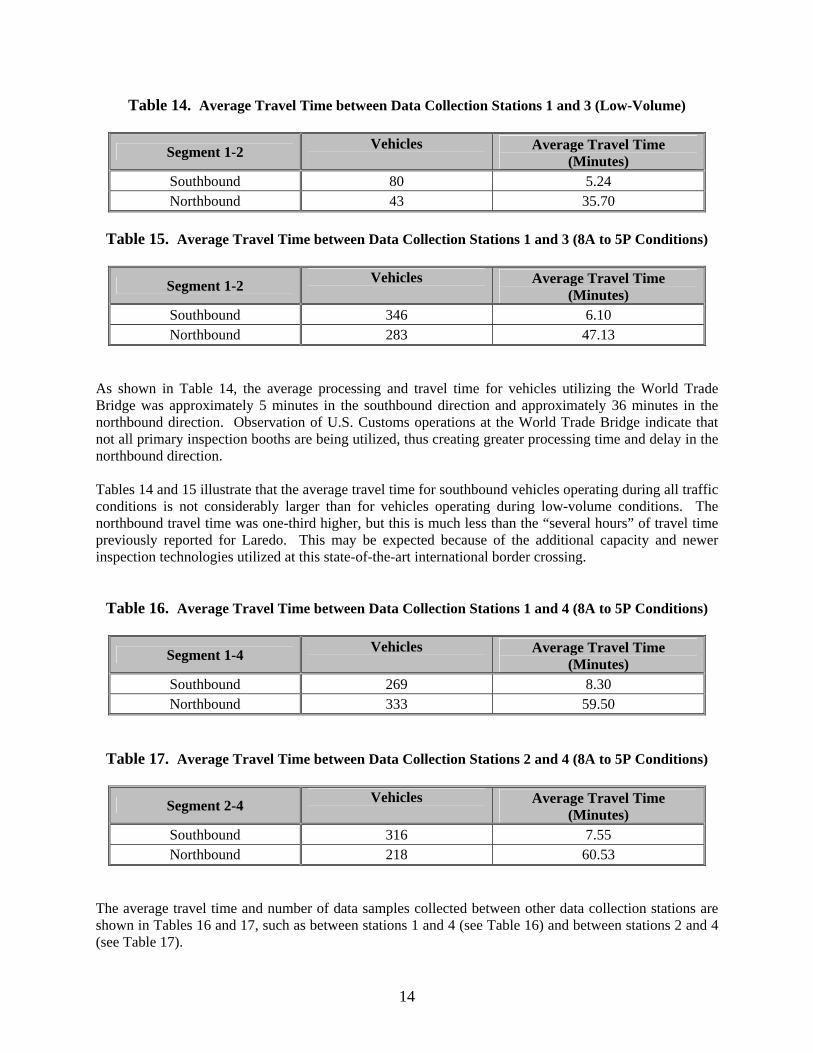
Table 14. Average Travel Time between Data Collection Stations 1 and 3 (Low-Volume)
Segment 1-2 Vehicles
Average Travel Time (Minutes)
Southbound 80 5.24 Northbound 43 35.70
Table 15. Average Travel Time between Data Collection Stations 1 and 3 (8A to 5P Conditions)
Segment 1-2 Vehicles
Average Travel Time (Minutes)
Southbound 346 6.10 Northbound 283 47.13
As shown in Table 14, the average processing and travel time for vehicles utilizing the World Trade Bridge was approximately 5 minutes in the southbound direction and approximately 36 minutes in the northbound direction. Observation of U.S. Customs operations at the World Trade Bridge indicate that not all primary inspection booths are being utilized, thus creating greater processing time and delay in the northbound direction. Tables 14 and 15 illustrate that the average travel time for southbound vehicles operating during all traffic conditions is not considerably larger than for vehicles operating during low-volume conditions. The northbound travel time was one-third higher, but this is much less than the “several hours” of travel time previously reported for Laredo. This may be expected because of the additional capacity and newer inspection technologies utilized at this state-of-the-art international border crossing.
Table 16. Average Travel Time between Data Collection Stations 1 and 4 (8A to 5P Conditions)
Segment 1-4 Vehicles
Average Travel Time (Minutes)
Southbound 269 8.30 Northbound 333 59.50
Table 17. Average Travel Time between Data Collection Stations 2 and 4 (8A to 5P Conditions)
Segment 2-4 Vehicles
Average Travel Time (Minutes)
Southbound 316 7.55 Northbound 218 60.53
The average travel time and number of data samples collected between other data collection stations are shown in Tables 16 and 17, such as between stations 1 and 4 (see Table 16) and between stations 2 and 4 (see Table 17).
15
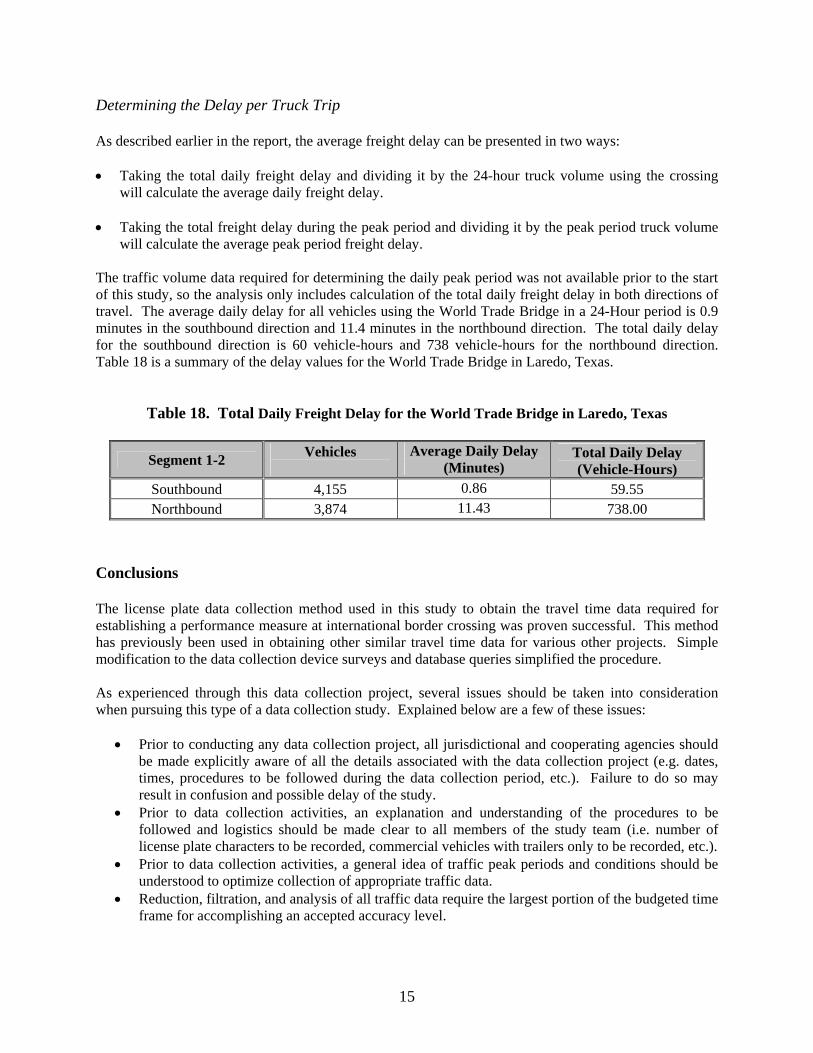
Determining the Delay per Truck Trip As described earlier in the report, the average freight delay can be presented in two ways: • Taking the total daily freight delay and dividing it by the 24-hour truck volume using the crossing
will calculate the average daily freight delay. • Taking the total freight delay during the peak period and dividing it by the peak period truck volume
will calculate the average peak period freight delay. The traffic volume data required for determining the daily peak period was not available prior to the start of this study, so the analysis only includes calculation of the total daily freight delay in both directions of travel. The average daily delay for all vehicles using the World Trade Bridge in a 24-Hour period is 0.9 minutes in the southbound direction and 11.4 minutes in the northbound direction. The total daily delay for the southbound direction is 60 vehicle-hours and 738 vehicle-hours for the northbound direction. Table 18 is a summary of the delay values for the World Trade Bridge in Laredo, Texas.
Table 18. Total Daily Freight Delay for the World Trade Bridge in Laredo, Texas
Segment 1-2 Vehicles
Average Daily Delay (Minutes)
Total Daily Delay (Vehicle-Hours)
Southbound 4,155 0.86 59.55 Northbound 3,874 11.43 738.00
Conclusions The license plate data collection method used in this study to obtain the travel time data required for establishing a performance measure at international border crossing was proven successful. This method has previously been used in obtaining other similar travel time data for various other projects. Simple modification to the data collection device surveys and database queries simplified the procedure. As experienced through this data collection project, several issues should be taken into consideration when pursuing this type of a data collection study. Explained below are a few of these issues:
• Prior to conducting any data collection project, all jurisdictional and cooperating agencies should be made explicitly aware of all the details associated with the data collection project (e.g. dates, times, procedures to be followed during the data collection period, etc.). Failure to do so may result in confusion and possible delay of the study.
• Prior to data collection activities, an explanation and understanding of the procedures to be followed and logistics should be made clear to all members of the study team (i.e. number of license plate characters to be recorded, commercial vehicles with trailers only to be recorded, etc.).
• Prior to data collection activities, a general idea of traffic peak periods and conditions should be understood to optimize collection of appropriate traffic data.
• Reduction, filtration, and analysis of all traffic data require the largest portion of the budgeted time frame for accomplishing an accepted accuracy level.

16
• Providing appropriate information to all jurisdictional agencies and obtaining proper authorization for conducting the data collection study is time consuming and should be adequately accounted.
• Proper identification for all survey members and written documentation of authorization from all jurisdictional agencies should be carried at all times by all members of the study team, especially when conducting business in a foreign country.
The procedures developed to conduct this type of a data collection study are highly recommended because of the simplistic level of accomplishing the goals set for this project.
17
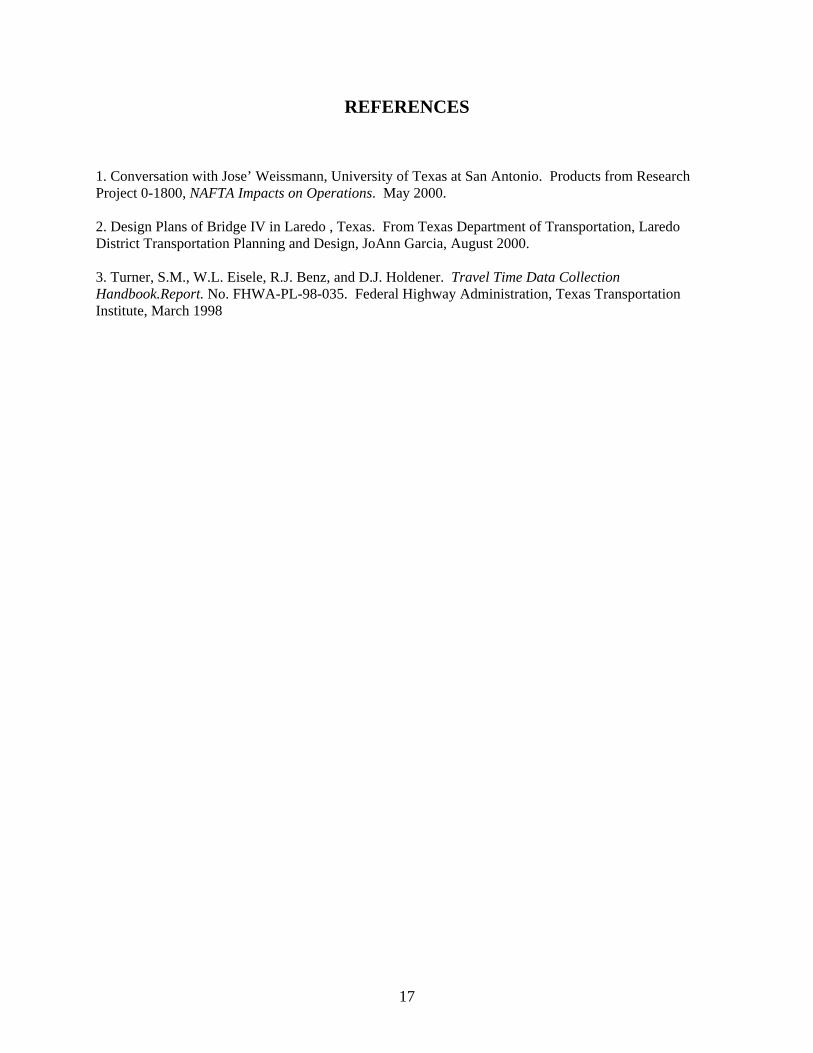
REFERENCES
1. Conversation with Jose’ Weissmann, University of Texas at San Antonio. Products from Research Project 0-1800, NAFTA Impacts on Operations. May 2000. 2. Design Plans of Bridge IV in Laredo , Texas. From Texas Department of Transportation, Laredo District Transportation Planning and Design, JoAnn Garcia, August 2000. 3. Turner, S.M., W.L. Eisele, R.J. Benz, and D.J. Holdener. Travel Time Data Collection Handbook.Report. No. FHWA-PL-98-035. Federal Highway Administration, Texas Transportation Institute, March 1998

Agency Contacts
APPENDIX A
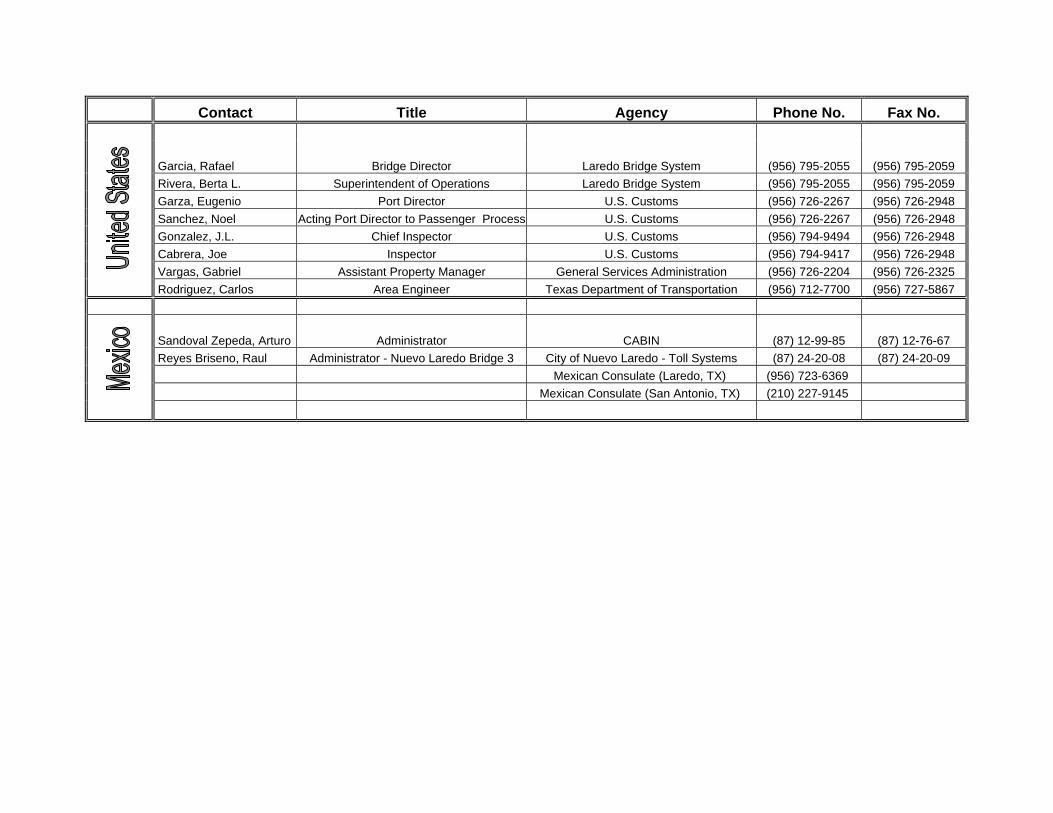
Contact Title Agency Phone No. Fax No.
Garcia, Rafael Bridge Director Laredo Bridge System (956) 795-2055 (956) 795-2059 Rivera, Berta L. Superintendent of Operations Laredo Bridge System (956) 795-2055 (956) 795-2059 Garza, Eugenio Port Director U.S. Customs (956) 726-2267 (956) 726-2948 Sanchez, Noel Acting Port Director to Passenger Process U.S. Customs (956) 726-2267 (956) 726-2948 Gonzalez, J.L. Chief Inspector U.S. Customs (956) 794-9494 (956) 726-2948 Cabrera, Joe Inspector U.S. Customs (956) 794-9417 (956) 726-2948 Vargas, Gabriel Assistant Property Manager General Services Administration (956) 726-2204 (956) 726-2325 Rodriguez, Carlos Area Engineer Texas Department of Transportation (956) 712-7700 (956) 727-5867 Sandoval Zepeda, Arturo Administrator CABIN (87) 12-99-85 (87) 12-76-67 Reyes Briseno, Raul Administrator - Nuevo Laredo Bridge 3 City of Nuevo Laredo - Toll Systems (87) 24-20-08 (87) 24-20-09 Mexican Consulate (Laredo, TX) (956) 723-6369 Mexican Consulate (San Antonio, TX) (210) 227-9145

Data Collection Survey Stations
APPENDIX B

Average Daily Traffic Counts for the World Trade Bridge
APPENDIX C
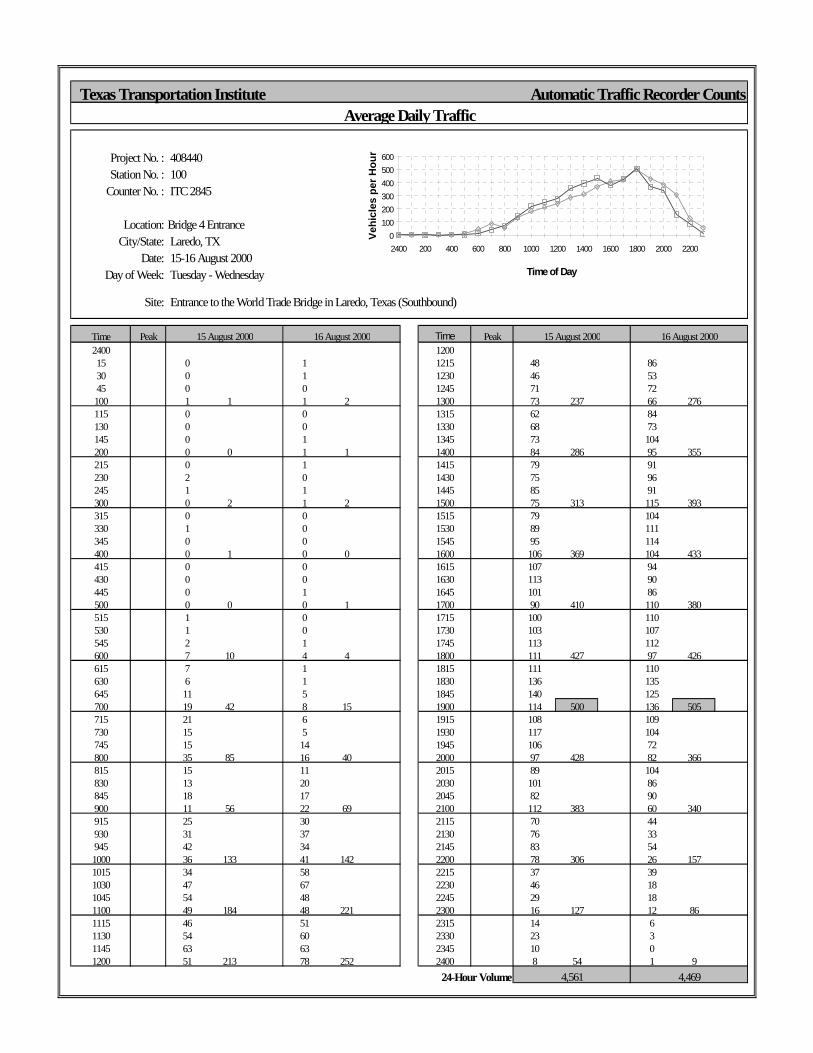
Texas Transportation Institute Automatic Traffic Recorder Counts
Project No. : 408440Station No. : 100
Counter No. : ITC 2845
Location: Bridge 4 EntranceCity/State: Laredo, TX
Date: 15-16 August 2000Day of Week: Tuesday - Wednesday
Site: Entrance to the World Trade Bridge in Laredo, Texas (Southbound)
Time Peak Time Peak2400 120015 0 1 1215 48 8630 0 1 1230 46 5345 0 0 1245 71 72100 1 1 1 2 1300 73 237 66 276115 0 0 1315 62 84130 0 0 1330 68 73145 0 1 1345 73 104200 0 0 1 1 1400 84 286 95 355215 0 1 1415 79 91230 2 0 1430 75 96245 1 1 1445 85 91300 0 2 1 2 1500 75 313 115 393315 0 0 1515 79 104330 1 0 1530 89 111345 0 0 1545 95 114400 0 1 0 0 1600 106 369 104 433415 0 0 1615 107 94430 0 0 1630 113 90445 0 1 1645 101 86500 0 0 0 1 1700 90 410 110 380515 1 0 1715 100 110530 1 0 1730 103 107545 2 1 1745 113 112600 7 10 4 4 1800 111 427 97 426615 7 1 1815 111 110630 6 1 1830 136 135645 11 5 1845 140 125700 19 42 8 15 1900 114 500 136 505715 21 6 1915 108 109730 15 5 1930 117 104745 15 14 1945 106 72800 35 85 16 40 2000 97 428 82 366815 15 11 2015 89 104830 13 20 2030 101 86845 18 17 2045 82 90900 11 56 22 69 2100 112 383 60 340915 25 30 2115 70 44930 31 37 2130 76 33945 42 34 2145 83 541000 36 133 41 142 2200 78 306 26 1571015 34 58 2215 37 391030 47 67 2230 46 181045 54 48 2245 29 181100 49 184 48 221 2300 16 127 12 861115 46 51 2315 14 61130 54 60 2330 23 31145 63 63 2345 10 01200 51 213 78 252 2400 8 54 1 9
24-Hour Volume
15 August 2000 15 August 2000
Average Daily Traffic
4,561 4,469
16 August 2000 16 August 2000
0100200300400500600
2400 200 400 600 800 1000 1200 1400 1600 1800 2000 2200
Time of Day
Vehi
cles
per
Hou
r
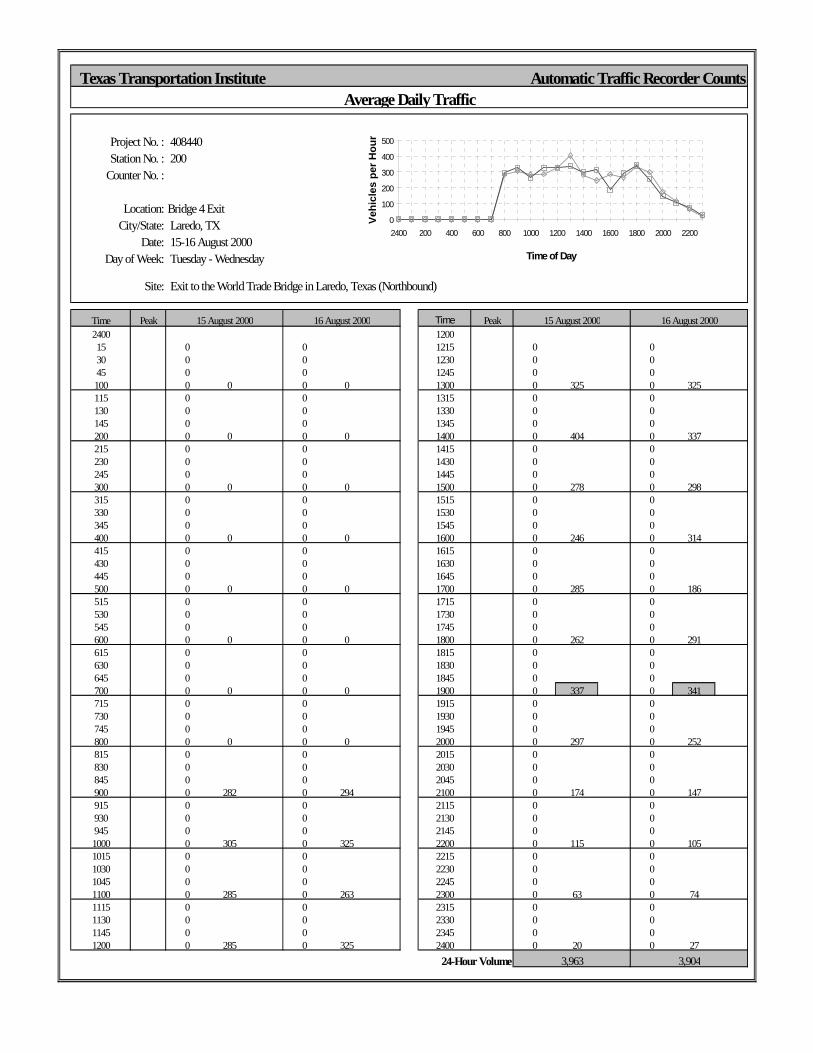
Texas Transportation Institute Automatic Traffic Recorder Counts
Project No. : 408440Station No. : 200
Counter No. :
Location: Bridge 4 ExitCity/State: Laredo, TX
Date: 15-16 August 2000Day of Week: Tuesday - Wednesday
Site: Exit to the World Trade Bridge in Laredo, Texas (Northbound)
Time Peak Time Peak2400 120015 0 0 1215 0 030 0 0 1230 0 045 0 0 1245 0 0100 0 0 0 0 1300 0 325 0 325115 0 0 1315 0 0130 0 0 1330 0 0145 0 0 1345 0 0200 0 0 0 0 1400 0 404 0 337215 0 0 1415 0 0230 0 0 1430 0 0245 0 0 1445 0 0300 0 0 0 0 1500 0 278 0 298315 0 0 1515 0 0330 0 0 1530 0 0345 0 0 1545 0 0400 0 0 0 0 1600 0 246 0 314415 0 0 1615 0 0430 0 0 1630 0 0445 0 0 1645 0 0500 0 0 0 0 1700 0 285 0 186515 0 0 1715 0 0530 0 0 1730 0 0545 0 0 1745 0 0600 0 0 0 0 1800 0 262 0 291615 0 0 1815 0 0630 0 0 1830 0 0645 0 0 1845 0 0700 0 0 0 0 1900 0 337 0 341715 0 0 1915 0 0730 0 0 1930 0 0745 0 0 1945 0 0800 0 0 0 0 2000 0 297 0 252815 0 0 2015 0 0830 0 0 2030 0 0845 0 0 2045 0 0900 0 282 0 294 2100 0 174 0 147915 0 0 2115 0 0930 0 0 2130 0 0945 0 0 2145 0 01000 0 305 0 325 2200 0 115 0 1051015 0 0 2215 0 01030 0 0 2230 0 01045 0 0 2245 0 01100 0 285 0 263 2300 0 63 0 741115 0 0 2315 0 01130 0 0 2330 0 01145 0 0 2345 0 01200 0 285 0 325 2400 0 20 0 27
24-Hour Volume
15 August 2000 15 August 2000
Average Daily Traffic
3,963 3,904
16 August 2000 16 August 2000
0
100
200
300
400
500
2400 200 400 600 800 1000 1200 1400 1600 1800 2000 2200
Time of Day
Vehi
cles
per
Hou
r