border crossing freight travel time and delay · web viewas is the case at canadian customs, if a...
TRANSCRIPT

Final Site Report
EVALUATION OF TRAVEL
TIME METHODS TO SUPPORT
MOBILITY PERFORMANCE
MONITORING
BLAINE (PACIFIC HIGHWAY)
To
Office of Freight Mgt. and Operations
Federal Highway Administration
U.S. Department of Transportation
Washington, DC 20590
April 2002

Border Crossing Freight Delay Data Collection and AnalysisFY 2001 Data Collection Pacific Highway (Blaine Border) Crossing
Site Description
The Pacific Highway (Blaine Border) Crossing is the major truck border crossing linking western Washington state with the coastal mainland of British Columbia (BC). The border between Washington and BC is located on the 49th parallel and since it is defined by degrees of latitude north of the equator it does not correspond to any natural feature such as a river. Consequently, there is only an imaginary line demarcating the border and no bridge or toll facility. The border crossing is the mandatory crossing point for all trucks traveling north on I-5 towards BC and south on BC route 99 towards Washington State. The Blaine crossing is located about one mile to the east of the auto crossing. The Blaine Border Crossing is the gateway that trucks traveling from Seattle north to Vancouver or Vancouver south to Seattle and beyond use. Trucks traveling north on I-5 must exit the Interstate at state route 543, cross the border about a mile to the north then continue north on BC route 15 to BC route 914. On BC route 914, the trucks travel west to join the BC route 99, the major route north to Vancouver. Heading south the process is reversed. Figure 1 shows a map of the general region in Washington and British Columbia that provides access to the border.
Data collection activities took place at the Blaine Border Crossing on Tuesday through Thursday, July 10 through 12, 2001 for approximately 12 hours each day. The times of data collection were selected to correspond to those hours with the highest truck traffic flows and anticipated longest delays. The Blaine Border Crossing is open 24 hours a day, seven days a week.
Outbound (northbound) truck traffic traveling to Canada must exit I-5 at state route 543 and drive the approximately one mile north to the border. Route 543 is a two-lane road but trucks must use the shoulder when there are backups at the border crossing. There is a small duty free shop close to the crossing but it does not appear to be used by the trucks. Close to the border, the number of lanes expands to four to enable the vehicles to proceed to their respective Customs booth. Automobiles, pickups and vans curve slightly to the east to enter Canadian Customs while buses are diverted further east to enter their primary inspection area. Trucks are diverted furthest to the east past the truck Customs booths. Ordinarily, the Canadians have one booth operating but usually open a second when traffic conditions warrant. Trucks are either released from primary inspection or must continue on to the secondary inspection facilities that are located to the north and east of the primary booths. At secondary inspection, trucks can undergo further papers checks and/or physical inspection at truck bays or in the parking area. All trucks regardless of whether or not they require secondary inspection then proceed north on BC route 15. This route provides two lanes of traffic in each direction.
Inbound (southbound) trucks traveling to the United States follow a similar pattern to outbound trucks. As they approach the border crossing, smaller vehicles curve slightly to the west and then proceed to the Customs booths while buses move just to the west of the small vehicles. Trucks turn sharply westward to reach the truck primary inspection booths. A number of trucks stop at the Canadian duty free shop, which is about a quarter-mile north of the border, and then
Blaine (Pacific Highway) April 20021

rejoin the border crossing traffic after the trucks have diverted from the rest of the traffic and are proceeding towards the booths.
Figure 1. Blaine Border Region
Some trucks stop at the small parking lot located just north of the point where the trucks turn towards the primary booths in order to check their paper work and visit the brokers located just south of the border on the east side of the road. There are currently spaces for 14 trucks but a
Blaine (Pacific Highway) April 20022

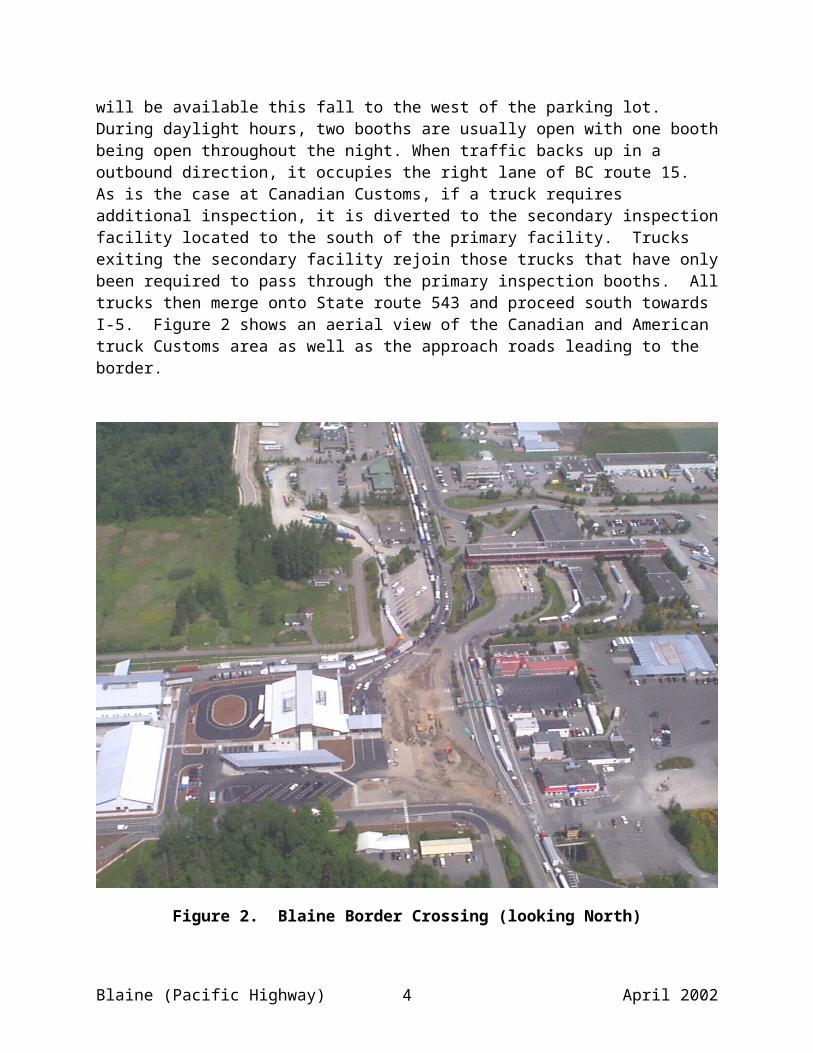
number of additional spaces will be available this fall to the west of the parking lot. During daylight hours, two booths are usually open with one booth being open throughout the night. When traffic backs up in a outbound direction, it occupies the right lane of BC route 15. As is the case at Canadian Customs, if a truck requires additional inspection, it is diverted to the secondary inspection facility located to the south of the primary facility. Trucks exiting the secondary facility rejoin those trucks that have only been required to pass through the primary inspection booths. All trucks then merge onto State route 543 and proceed south towards I-5. Figure 2 shows an aerial view of the Canadian and American truck Customs area as well as the approach roads leading to the border.
Figure 2. Blaine Border Crossing (looking North)
Data Collection Process
For this study, two data collection locations were used in each direction. The “number 1” locations were located to the north or south of where the truck queues were anticipated to form due to backups at the primary Customs location. The “number 2” location was immediately after the primary inspection booths. For consistency among all border crossings visited as part of the
Blaine (Pacific Highway) April 20023
overall project, the data collection positions were distinguished by whether the trucks were traveling out of or into the United States. For the Blaine border crossing, outbound corresponded to northbound and inbound to southbound. Figure 3 shows the approximate locations of the data collection points both for the United States and Canada. The figure shows three outbound locations designated OB 1A, 1B and 1C. These locations represent each of the data collection points in the outbound direction. The OB-1 data collector shifted locations as the outbound truck queue backed up along SR 543. OB-1A was located on the south side of a truck parking area about 0.4 miles from the Canadian primary inspection booths. OB-2 was located about 0.7 of a mile from the custom booths along SR 543 and OB-1C about 1.1 miles from the custom booths on the ramp leading to I-5. Figures 4 and 5 show the location of OB-1C and OB-2 data collection points respectively. The Inbound 1 (IB-1) position was located at the north end of a truck parking area about 0.5 miles from the US primary truck custom inspection booths. This data collection point was located north of the Duty Free Shop and the parking lot with the 14 truck parking spaces used by trucks visiting brokers. The inbound 2 (IB-2) data collection point was located adjacent to the American Customs booths. Figure 6 shows the location of the IB-2 data collection point. The IB-1 data collector moved on one occasion when the queue extended past the position shown on the map as IB-1. However, when the data collector finally drove into the new data collection location along the road, the queue had dissipated and she returned to the original collection point.
Each data collector would use a handheld computer to record partial license plate information of all commercial vehicles that passed their location. The computer would also store the time that each license plate was entered. The data from the two locations in each direction would be combined, allowing the determination of the travel time for each vehicle that was recorded at both locations.
For the data collection, the on-site team included four data collectors and one supervisor. The hours during which data were collected were selected to encompass the peak truck traffic period when delays would be most likely. They were selected from an examination of the available truck flow data and discussions with knowledgeable officials. Table 1 shows the data collection hours for each day during the site visit. Data collection extended about 12 hours and included the periods when the supervisor collected data during break periods and the 30-minute meal period.
Blaine (Pacific Highway) April 20024

Figure 3. Sampling Sites at the Blaine Border Crossing
Blaine (Pacific Highway) April 20025

Figure 4. OB-1C
Figure 5. OB-2
Blaine (Pacific Highway) April 20026

Figure 6. IB-2
Table 1. Hours of Data Collection
Date Start End
7/10/01 8:00 am 8:00 pm7/11/01 8:00 am 8:00 pm7/12/01 7:00 am 7:00 pm
The arrangements that led to the data collection activities required a considerable number of phone calls, e-mail correspondence, and a site visit. A meeting was held at the Blaine Border Crossing with representatives of Canadian and U.S. Immigration, Canadian and U.S. Customs, the B.C. Ministry of Transportation, the Whatcom Council of Government, FHWA representatives, and Battelle. In addition, the Battelle representative toured the border area and potential data collection sites on both sides of the border with local officials.
Blaine (Pacific Highway) April 20027

Table 2 contains a list of the individuals who were contacted and their telephone and e-mail information. Future data collection for this project should be able to be organized and authorized more easily. However, any new project would require additional time to explain the data collection objectives to the involved parties and gain their approval.
Table 2. Agency Contacts
Contact Agency Phone/Fax E-mailGary Baker
Customs Supervisor Canada Customs (604) 538-3607(604) 538-8961(fax)
Jay BrandtAssistant Port Director U.S. Customs (360) 332-4656
(360) 332-4701(fax)j.r.brandt@
Customs.treas.gpovMike Brower
Transportation Mobility Engineer FHWA (360) 753-9550)
(360) 753-9889 (fax)[email protected]
Bruce BrunerPort Director U.S. Immigration (360)332-6091
(360)332-3747 (fax)Bruce.m.bruner@
usdoj.govBridgette Canil
Intelligent Transportation System Engineer
BC Ministry of Transportation
(604) 660-8239(604) 660-2181 Bridgid.Canil@gems.
5.gov.bc.ca
Hugh ConroyProject Manager
Whatcom Council of Governments
(360) 676-6974(360) 738-6232 (fax) [email protected]
Ken MoyesShift Superintendent Canadian Immigration
(604) 535-5450(604) 541-5621 ken.seebach@
ccra-adrc.gc.ca
Data Collection Details
Both the Canadian and U.S. Customs official provided some data on past traffic flows at the border. Unfortunately, to date, the data collected has been fragmentary. However, the data that was available was used to select the sampling hours for the data collection at the border. The goal of this analysis process was to obtain statistically useful data with as few data collection days as possible. In order to customize the data collection activities at the Blaine Border Crossing, the following steps were conducted:
Define significant “seasonal” variations, Define significantly different days of the week, Identify traffic streams that experience significantly different conditions, and Estimate the number of days needed for the data collection survey.
As shown in Figure 7, there is some variation is the commercial traffic by month. Due to project constraints, data collection needed to occur between late May and early September 2001. From Figure 7, the two months with the greatest average volumes during this data collection window were May and July.
Blaine (Pacific Highway) April 20028

Table 3 shows that at least for inbound traffic from Canada into the United States, there is a significant difference in commercial traffic between weekdays and weekends. Weekend traffic is about 51 percent of typical weekday traffic. However there is not a significant difference between Monday and Friday and the three mid-week days although traffic on Mondays and Fridays is about 97% of the traffic on Tuesday through Thursday. Nevertheless, a decision was made to collect only three days of data from Tuesday through Thursday and that this would provide an adequate number of data samples to represent “typical” conditions.
Table 3. Sample Month – Daily Traffic Distribution of Commercial Vehicles for May 2001
Day Day of Week Inbound
1 Tuesday 1,8182 Wednesday 1,6403 Thursday 1,5794 Friday 1,5565 Saturday 8936 Sunday 8277 Monday 1,5768 Tuesday 1,6989 Wednesday 1,61310 Thursday 1,59111 Friday 1,50312 Saturday 80713 Sunday 669
Blaine (Pacific Highway) April 20029

Day Day of Week Inbound
14 Monday 1,57515 Tuesday 1,67016 Wednesday 1,84617 Thursday 1,70418 Friday 1,43919 Saturday 98820 Sunday 85321 Monday 1,05322 Tuesday 1,83723 Wednesday 1,86224 Thursday 1,86325 Friday 1,55726 Saturday 78727 Sunday 76528 Monday 1,35029 Tuesday 1,72530 Wednesday 1,71331 Thursday 1,687
Source: U.S. Customs, Blaine Crossing
Blaine (Pacific Highway) April 200210

Data Collection Procedures
The data collection stations selected for the crossing were chosen because of the particular actions that occur at each site. Segments defined by the data collection stations were used to determine the commercial vehicle travel times and freight delay. As illustrated in Figures 2 through 9, the data collection sites were located at:
An advance station located upstream of the commercial vehicle queue – IB-1 and OB-1.
The import station (primary inspection booths before detailed, or secondary, inspection) – IB-2 and OB-2.
Data collection was conducted by recording commercial vehicle license plates as vehicles crossed fixed points within the data collection sites. Survey individuals or teams, were placed at each of the four data collection sites to record commercial vehicle license plate data.
Collectors at these locations would record the last five characters of the front, lower-left license plate of as many trucks as possible that passed their location. When trucking firms register many vehicles at once, they often get assigned sequential license plate numbers. Using the last five characters helps to ensure that as different trucks operated by the same firm travel across the bridge that they are uniquely identified. License plate information was entered into handheld computers with a special application designed for this project. Each entry was time-stamped with the current date and time. Prior to each day’s collection, all handheld computers were synchronized to the same time. Prior experience indicated that recording the entire license plate was too time consuming and that entering only the last four characters did not provide adequate distinction between different vehicles, so the project team chose to record the last five characters.
Typically, the queue of trucks crossing the border outbound would not extend beyond OB-1B as shown in Figure 3. However, when the queue would extend southward towards I-5 the data collector at the #1 location would have to move to a point on the entrance ramp to the interstate that was beyond the end of the queue. In this way, they could continue to record trucks before they began their wait at the end of the line. When this or any other event of interest occurred, the collectors would use an “EVENT” feature of the PDA software to record it.
For each #1 location, the supervisor would record the distance from any data collection point other than the original position that would be OB-1A. During post-processing, the data from the locations nearer to the border than the farthest location would be adjusted to include the additional travel time from the farthest location to the original location. The travel time would be computed at free-flow speeds, since there would have been no queue at the times that the data were collected at these closer locations. In this way, the data all would appear to be collected from the same location, the one most distant from the primary Customs Canadian booth.
The data collection team used cell phones to communicate. This was particularly important when the queues lengthened such that a collector had to move farther upstream. The supervisor could be kept informed without repeated trips to each data collection location. This was also useful at the end of the day when the #1 collectors would inform the #2 collectors of the last truck they recorded, so the #2 collectors would know when to stop. Although cell tower location
Blaine (Pacific Highway) April 200211

limitations created some problems with reception, each collector was usually able to use their cell phone to reach other team members.
Data Collection Sample Size
Sample sizes are typically not a concern with videotape or handheld data entry devices, because the data collection includes a large number of vehicles. However, minimum sample sizes should be verified with variability values from field data. Early research found that sample sizes from 25 to 100 license matches were necessary for a given roadway segment and time period (Turner, et. al.). In most cases, there were sufficient records to meet this requirement.
Data Collection Equipment
As outlined in the “Data Collection Procedures” section above, Handspring Visor PDAs were used as the data entry device and proved adequate to the task. Low-end models with 2 Mb of storage capacity were selected as the application and data size were projected to be well below this limit. The Handspring Visors use the Palm OS (operating system) and have faster processing speeds (at least in side-by-side comparison with this application) and larger screen sizes than comparable models from Palm Computing.
A custom application was developed for the Palm OS which allowed the data collectors to identify their locations (e.g., OB-1, IB-2), the number of open booths (primarily used for the Customs inspection booths), special events or other comments, and license plate information. A screen shot of the application interface is shown in Figure 8.
Figure 8. Data Collection Device and Software Application
Blaine (Pacific Highway) April 200212

The data were downloaded via a serial cable directly from the application into a text file on the field laptop computer, which was a Dell Latitude CPx H running with a 500 MHz Pentium III processor.
Data Collection Summary
Table 4 shows the number of commercial vehicle license plates recorded for each of the stations on each of the data collection days. Table 5 shows the matches for each direction for the data collection days. Matches from the northernmost U.S. Primary booth were eliminated because the trucks passing through this booth had a greater chance of stopping at the duty free shop after they were recorded at IB-1. Table 6 shows the average daily traffic volume as recorded by the U.S. Customs (inbound direction) and the Canadian Customs (outbound direction). Hourly volumes are used in the calculation of delay and are shown with the delay calculations in Tables 7 through 12.
Table 4. Number of Commercial Vehicle License Plates Collected
Station 7/10/01 7/11/01 7/12/01
OB-1 700 878 828OB-2 737 926 850IB-1 610 709 789IB-2 870 985 830Total 2,917 3,498 3,297
Table 5. Number of Matched License Plates Utilized
Station 7/10/01 7/11/01 7/12/01
OB 547 641 647IB 266 291 320
Total 813 932 967
Table 6. Average Daily Traffic at the Blaine Border Crossing
Direction 7/10/01 7/11/01 7/12/01
Outbound* 1,137 1,317 1,179Inbound 1,943 1,746 1,848
Total 3,080 3,063 3,027
*Underreporting is inherent in this data because no data was collected for the early morning hours before 6:00 AM and after 11:00 PM
Blaine (Pacific Highway) April 200213

Data Quality Steps
At the end of each day of data collection, the supervisor would collect the PDAs and download the data into the field laptop computer where it was stored on the hard drive. The data would be examined for any anomalies and transferred across the Internet to a secondary location for backup purposes. The OB-1 and OB-2 data would be merged together and license plates from the two locations would be “matched” using a spreadsheet developed in Microsoft Excel. As it is easy to mistake certain characters, particularly letters that looked like numbers, the license plate data was pre-processed. All ‘I’s were replaced with ‘1’s; all ‘O’s, ‘D’s, and ‘Q’s were replaced with ‘0’s; all ‘S’s were replaced with ‘5’s; and all ‘Z’s were replaced with ‘2’s. In addition, the data collectors were instructed to always use ‘1’s for ‘I’s and ‘0’s for ‘O’s (i.e., to use the digit, rather than the letter).
Occasionally, collectors would be unsure about a license plate and would append “QQQ” to their entry. This would typically occur when several trucks passed the collector in rapid succession or if one truck blocked the license plate of another and he or she could only manage a quick glimpse. This would allow the supervisor to search the downloaded data for a potential match by using the travel times of other trucks that were recorded in the same general time frame. During this process, the supervisor could also identify the few records in which the data collector forgot to press “ENTER” after recording a license plate before recording the next one. These ten-character entries could be split into two and the time for the first interpolated from the adjacent entries if they were less than a minute or so apart.
Data post-processing also included a step to identify any anomalies in the data, including outliers. Outliers, records that indicated travel times significantly greater than typical for that time period, were most often caused by recording the license plate of a vehicle only some of the time as it made repeated trips across the border during a single day. This is because the matching algorithm uses the most recent time at the #1 position when matching to a record from a #2 location. For example, if the vehicle was recorded as it headed from Canada to the U.S. early in the morning, later returned to Canada, was missed as it re-entered the U.S. later in the day, and then recorded on its subsequent return to Canada, the #1 time from its first trip would be matched with it #1 time from the first trip (for a valid travel time) an also matched to the #2 time from its second trip (an invalid travel time). This invalid travel time would be easily identified by manual inspection of the data, aided by highlighting those travel times above a specific, but variable, threshold.
Freight Delay Analysis
The measure for the freight transportation system at international roadway border crossings is travel delay per truck trip through the first inspection point in the import country. Delay is measured relative to the travel time at low volume conditions, which will allow the processing time of the inspection to be accommodated outside of the measure. Estimating the average delay per truck for each hour where congestion is present and then applying the average hourly truck volume produces an estimate of total delay.
Blaine (Pacific Highway) April 200214

The average delay per truck for each hour is the difference between the travel time at low volume conditions and the travel time each hour. Travel time is also affected by the number of open inspection booths and this information was recorded on all days as it changed. To determine the average travel time for each road segment, the matched license plate data in the database is used. The number of matches are noted for statistical analysis and the travel time is noted for each hour. The travel time for each truck was assigned to the hour when they passed through the primary Customs inspection location. The data are presented in Tables 7 through 12. The columns illustrate the key elements for estimating delay: No Delay Travel Time – The time through the system at low volume conditions. For this
report, the value used was that of the lowest hourly travel time in that direction for each three-day data collection period.
Average Number of Open Booths – The average number of primary Customs commercial vehicle inspection booths open and available for processing trucks. This figure is not used to compute delay but is useful to help understand the relationship between booths, traffic volume, and delay.
Number of Matched Vehicles – The number of vehicle observation used to estimate the travel time for each hour.
Average Travel Time – The amount of travel time from entry to exit for trucks entering the system each hour (use the time the vehicle passes the advance point as the determinant of the time period label).
Delay per Trip – The difference between the average travel time and the “no delay” time. Average Traffic Volume – The average hourly truck volume for the period being analyzed. Total Delay – The product of the hourly truck volume and delay per trip.
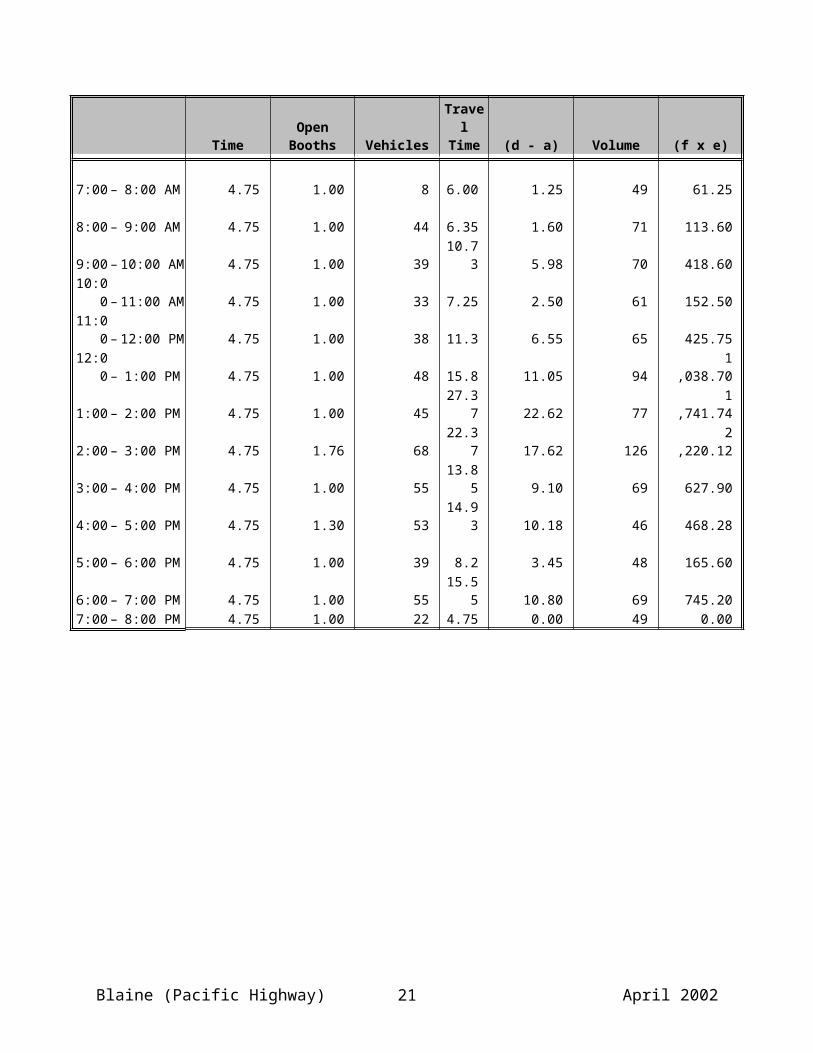
Table 7. Total Delay – 7/10/2001 – Outbound
Time Period
(a)"No Delay" Travel Time
(b)Average No.
of Open Booths
(c)Number of "Matched"
Vehicles
(d)Average Travel Time
(e)Delay Per
Trip(d - a)
(f)Average Traffic Volume
(g)Total Delay
(f x e)
7:00 – 8:00 AM 4.75 1.00 8 6.00 1.25 49 61.25 8:00 – 9:00 AM 4.75 1.00 44 6.35 1.60 71 113.60 9:00 – 10:00 AM 4.75 1.00 39 10.73 5.98 70 418.60
10:00 – 11:00 AM 4.75 1.00 33 7.25 2.50 61 152.50 11:00 – 12:00 PM 4.75 1.00 38 11.3 6.55 65 425.75 12:00 – 1:00 PM 4.75 1.00 48 15.8 11.05 94 1,038.70 1:00 – 2:00 PM 4.75 1.00 45 27.37 22.62 77 1,741.74 2:00 – 3:00 PM 4.75 1.76 68 22.37 17.62 126 2,220.12 3:00 – 4:00 PM 4.75 1.00 55 13.85 9.10 69 627.90 4:00 – 5:00 PM 4.75 1.30 53 14.93 10.18 46 468.28 5:00 – 6:00 PM 4.75 1.00 39 8.2 3.45 48 165.60 6:00 – 7:00 PM 4.75 1.00 55 15.55 10.80 69 745.20 7:00 – 8:00 PM 4.75 1.00 22 4.75 0.00 49 0.00
Blaine (Pacific Highway) April 200215

Table 8. Total Delay – 7/11/2001 – Outbound
Table 9. Total Delay – 7/12/2001 – Outbound
Blaine (Pacific Highway) April 200216

Table 10. Total Delay – 7/10/2001 – Inbound
Table 11. Total Delay – 7/11/2001 – Inbound
Blaine (Pacific Highway) April 200217

Table 12. Total Delay – 7/12/2001 – Inbound
Statistics
Table 13 shows the baseline or “no delay” travel time, the average travel time, and three other measures that indicate the reliability of the travel time estimates. The baseline time (in minutes) is the time needed to travel the study distance (between the starting point in the exporting country and the initial inspection point in the importing country) in free-flow traffic conditions. The average time is computed from all vehicles measured during the data collection period over the study distance. The 95th percentile time is the time (in minutes) within which 95 percent of all trucks can cross the border. The buffer time is the additional time above the average crossing time (in minutes) that it takes for 95 percent of all trucks to cross. The buffer index expresses the buffer time in terms of the average time and is the percentage of extra time that must be budgeted to cross the border within the 95th percentile time. For example, if the average time was 10 minutes and the buffer time was 5 minutes, the buffer index would be 50 percent.
Table 13. Crossing Times
BaselineTime
Average Crossing
Time
95th
Percentile Time
Buffer Time
Buffer Index
Outbound 4.8 21.0 9.1 14.3 66.5Inbound 8.1 17.3 80.3 18.3 105.8
From the table, it is apparent that while the average travel time is slightly lower for inbound traffic, the reliability is much more favorable for outbound traffic.
Figure 9 illustrates the average travel time experienced for different truck volumes per lane per hour in each direction.
Blaine (Pacific Highway) April 200218
Figure 9. Average Travel Time for Different Hourly Volumes
Figures 10 and 11 show typical average hourly traffic volumes per booth for the study period as well as the measured average hourly travel times. In addition, the average number of open primary Customs booths in each direction is shown.
Figure 10. Typical Inbound Traffic
Blaine (Pacific Highway) April 200219

Figure 11. Typical Outbound Traffic
Conclusions
Lessons learned during data collection activities in this project at the Blaine Border Crossing and at others along the Canadian and Mexican borders with the U.S. have identified several issues that should be taken into consideration to assist future data collection efforts. Some apply to advance planning and the initial site visit and others apply more specifically to the data collection activities themselves.
Planning and Site Visits
Prior to conducting any data collection project, all jurisdictional and cooperating agencies should be made explicitly aware of the purpose and objectives of the study as well as all the details associated with the data collection project (e.g. dates, times, procedures to be followed during the data collection period, etc.). Failure to do so may result in confusion and possible delay of the study. This has been very time-consuming at some ports and should be adequately accounted for in the schedule. For some agencies, including U.S. Customs, it is important to contact both the federal and local levels. Some entities that should be contacted might not be readily apparent and can include construction companies working on public rights-of-way, state police and city officials. Some agencies provide verbal approval for the data collection and may even provide supporting documentation to their field staff, yet are reluctant to provide documentation for the data collectors to carry. Every effort should be made to obtain written authorization that can be carried by the data collectors. For example, Canadian immigration officials at the Blaine Crossing provided work permit documents that ensured smooth data collection operations in Canada.
Blaine (Pacific Highway) April 200220
Prior to data collection activities, a general idea of traffic peak periods and conditions should be understood to optimize collection of appropriate traffic data and coverage of the appropriate times. This information should be obtained from discussions with knowledgeable officials and by examining historical traffic data.
Any additional data needs should be discussed explicitly with the appropriate officials. Canadian Customs at the Blaine Crossings, for example, does not normally record and maintain average hourly truck volumes, but will do so if special arrangements are made in advance. Alternatively, it may be appropriate to use other means to measure truck volumes, such as roadway counters or having the data collectors indicate the vehicles that pass without their license plates being recorded (assuming continuous data collection during each day). These additional traffic volumes could be used to corroborate data provided by the local authorities or used if their planned data collection did not occur or there was some other problem in providing the data.
It is also important to be aware of special federal or local holidays on both sides of the border when scheduling data collections as these could affect traffic flows. Some minor holidays that occur on Mondays and Fridays, might not significantly affect traffic for a Tuesday through Thursday data collection period, but may increase the likelihood that key local officials will be on vacation and unavailable should any problems arise.
Photographs of the border facilities and data collection locations should be taken during the site visits to assist in documenting the collection effort and to better inform the data collectors prior to their arrival on-site.
Processing, data quality, and analysis of all traffic data require the largest portion of the study time.
Data Collection Activities
Prior to data collection activities, an explanation and understanding of the procedures to be followed and logistics should be made clear to all members of the study team (e.g., number and location of license plate characters to be recorded, all commercial vehicles should be recorded, when and how to contact the on-site supervisor, etc.).
Proper identification for all survey members and written documentation of authorization from all jurisdictional agencies should be carried at all times by all members of the study team, especially when conducting business in a foreign country.
Blaine (Pacific Highway) April 200221

The supervisor should assess all conditions upon arrival for data collection to note any changes from the site visit or prior collection activities. Sometimes unplanned construction or other events may alter the preferred data collector locations or the truck flow patterns.
The supervisor should be used to maintain nearly constant data collection during breaks. This improves data quality by ensuring the supervisor observe each collector and can identify and correct any problems they might be having. Further, this improves the number of trucks matched at both the #1 and #2 locations, improving the sample size for analysis.
It is important to ensure that the data collectors are safe and comfortable during their long periods of collection. If their data collection locations cannot provide adequate cover from severe rains or heat, additional vehicles should be considered. Comfortable sport chairs with attachable beach umbrellas served to protect the collectors well during light rain and moderate sun. Ensure that the collectors have an adequate supply of water and that facilities are conveniently accessible. This becomes more difficult for the remote locations upstream from the border crossing.
REFERENCES
Turner, S.M., W.L. Eisele, R.J. Benz, and D.J. Holdener. Travel Time Data Collection Handbook.Report. No. FHWA-PL-98-035. Federal Highway Administration, Texas Transportation Institute, March 1998
Blaine (Pacific Highway) April 200222