bong escape hydropower project
DESCRIPTION
Bong Escape Hydropower ProjectTRANSCRIPT

7/14/2019 Bong Escape Hydropower Project
http://slidepdf.com/reader/full/bong-escape-hydropower-project 1/60
PROJECT DESIGN DOCUMENT FORM (CDM PDD) - Version 03.1.
CDM – Executive Board page 1
This template shall not be altered. It shall be completed without modifying/adding headings or logo, format or font.
CLEAN DEVELOPMENT MECHANISM
PROJECT DESIGN DOCUMENT FORM (CDM-PDD)
Version 03 - in effect as of: 28/07/2006
CONTENTS
A. General description of project activity
B. Application of a baseline and monitoring methodology
C. Duration of the project activity / Crediting period
D. Environmental impacts
E. Stakeholders’ comments
Annexes
Annex 1: Contact information on participants in the project activity
Annex 2: Information regarding public funding
Annex 3: Baseline information
Annex 4: Monitoring information
Annex 5: Assumptions and Financial Analysis for Year 2001
Annex 6: Assumptions and Financial Analysis for Year 2007

7/14/2019 Bong Escape Hydropower Project
http://slidepdf.com/reader/full/bong-escape-hydropower-project 2/60
PROJECT DESIGN DOCUMENT FORM (CDM PDD) - Version 03.1.
CDM – Executive Board page 2
This template shall not be altered. It shall be completed without modifying/adding headings or logo, format or font.
SECTION A. General description of project activity
A.1. Title of the project activity:
>>The 84 MW New Bong Escape Hydropower Project, Azad Jammu and Kashmir (AJK), PakistanVersion 0804/06/2008
A.2. Description of the project activity:
>>
The 84 MW New Bong Escape Hydropower Project, Azad Jammu and Kashmir (AJK), Pakistan (the“Project”) is a run-of-the river hydropower scheme without any dam, new storage,displacement/resettlement of human habitation, change in the hydrological regime or any other adverseenvironmental impact. The Project is a low head hydropower scheme and is strictly run-of-the-riverwithout any storage or new reservoir. The Mangla reservoir, dam and 1000 MW power house,
constructed in the early sixties feeds the Project downstream of the Mangla powerhouse, through itstailrace channel.
The main purpose of the project activity is to generate electricity for supply to the national grid usingclean, renewable and sustainable natural resources and tapping the significant hydropower potential inthe country. The project activity represents development of the first hydropower independent powerproducer in Pakistan and is expected to act as a catalyst for hydropower development in the country andopen the way for private investment in this vital sector. The power generated will be sold, through a 25year power purchase agreement, to the Government owned National Transmission and DespatchCompany Limited (NTDC).
Despite the large hydropower potential, Pakistan’s grid is predominantly hydrocarbon intensive. Due tolooming power shortages and increasing demand/supply gap expected from 2007 and onwards at a rate
of some 1,000 MW per annum planners are forced turn once again to “quick fix” thermal generation tomitigate the significant power shortages expected.
The Project will contribute clean and renewable hydroelectricity to the deficient national powerresources and contribute to GHG emission reduction by displacing the electricity productionrequirement of fossil fuel-fired power plants to the extent of its generation. The interconnection is closeto the load centre and it is expected that new plant will result in reduction of some 4.572 million tons of CO2e emissions over the crediting period of 21 years.
The project has and will contribute to the local and national economy in the following manner:
Sustainable Development:
• Enhance local employment opportunities during construction (500-700 persons) and
during operations (100-120 persons);
• Spin off benefits and stimulation of local economy through creation of businessopportunities and different stages of project implementation to provide goods andservices for the project both during construction and operations;
• Improving the skill set for local inhabitants through training and capacity building foremployment in the project contributing to growing technical advancement;

7/14/2019 Bong Escape Hydropower Project
http://slidepdf.com/reader/full/bong-escape-hydropower-project 3/60
PROJECT DESIGN DOCUMENT FORM (CDM PDD) - Version 03.1.
CDM – Executive Board page 3
This template shall not be altered. It shall be completed without modifying/adding headings or logo, format or font.
• Reduction of poverty in a economically depressed region with very little industry andhigh unemployment;
Environment:
• reduce carbon emissions in the national grid and replace carbon intensive thermalgeneration;
• Replacing oil fired and future coal based thermal generation and thus mitigatingenvironmental pollution with positive spin off for community health;
• The project not only reduces or replaces equivalent thermal generation with all theassociated environmental benefits but it also promotes an overall environmental wellbeing since the project will help to avoid all associated pollution caused throughextraction, processing, storage and transportation of conventional fuels required forthermal generation and substituted (reduced) to the extent of the project generation;
• The Project will assist in improving social infrastructure and public amenities in the areathrough construction of a new medical clinic and improvement of existing schools.
Development of hydropower potential
• Stimulate private investment to develop some 20,000 MW of neglected hydel potentialespecially small to medium run-of-the river projects with low environmental impact ;
National Economy, saving foreign exchange and balance of payments:
• Create space in national balance of payments through saving of foreign exchange requiredto import oil to service an equivalent thermal generating plant;
• Reduce cost of electricity in the national grid through improved thermal/hydel mix in the
system and enhancement of competitive advantage for industry and commerce;
Capacity Building
• Assist the Designated National Authority for development of CDM projects in thecountry as the pioneer private hydropower project eligible for CERs;
• Assist in development of a legal, financial and conceptual framework for privatehydropower and facilitate removal of obstacles and bottlenecks for private hydropowerdevelopment thus providing a template which will be used by forthcoming projects;
The project stakeholders include the project sponsors, Government of Azad Jammu & Kashmir
(GOAJK), inhabitants close to the project area, the power purchaser and the Government of Pakistan
and a brief introduction to each is provided below:
• The project sponsors represent a dedicated group of local and foreign investors whosedetermination is reflected by their untiring efforts battling against dysfunctional policy, biasagainst hydropower and other obstacles for over a decade and achieving significant progress;
• The Azad Jammu & Kashmir (AJ&K) is a relatively backward and undeveloped region andhydropower is the only significant natural resource. The Project will bring in significantinvestment and economic activity in a region which is economically depressed, has very littleindustry and high level unemployment. The GOAJK is fully committed to the project recognizing
7/14/2019 Bong Escape Hydropower Project
http://slidepdf.com/reader/full/bong-escape-hydropower-project 4/60
PROJECT DESIGN DOCUMENT FORM (CDM PDD) - Version 03.1.
CDM – Executive Board page 4
This template shall not be altered. It shall be completed without modifying/adding headings or logo, format or font.
its importance to the local economy, income from water use charges and as landmark for futurehydropower development; the GOAJK has been extended the Letter of Support some 13 times tofacilitate and support the Project;
• The power purchaser, ex- WAPDA (Pakistan Water & Power Development Authority), in the
state sector, is the only developer and owner of hydropower projects in the country and has beenunwilling to support private hydropower sector by refusing to accept a commercially reasonabletariff; this has caused many years of delay in the take off of private hydropower in general andthe project in particular. Notwithstanding this long standing institutional bottleneck over tariff,dysfunctional policy is highlighted by inclusion of the Project in the national power planning andscheduling. The intervention of the Government and the Ministry of Water & Power enabledrestoration of the 1995 Hydel Policy tariff which has formed a basis for the project to moveahead;
• The Government of Pakistan represented by the Ministry of Water & Power and the PrivatePower Infrastructure Board supports implementation of the project;
• The local inhabitants in the project fully support implementation of the project as confirmedthrough public consultations and meetings (refer to Section E – Stakeholders Comments).
A.3. Project participants:
>>
Name of Party involved (*)
((host) indicates a host
Party)
Private and/or public
entity(ies)
project participants (*)
(as applicable)
Kindly indicate if
the Party involved
wishes to be
considered as
project participant
(Yes/No) Islamic Republic of Pakistan
(host)
Laraib Energy Limited No
A.4. Technical description of the project activity:
A.4.1. Location of the project activity:
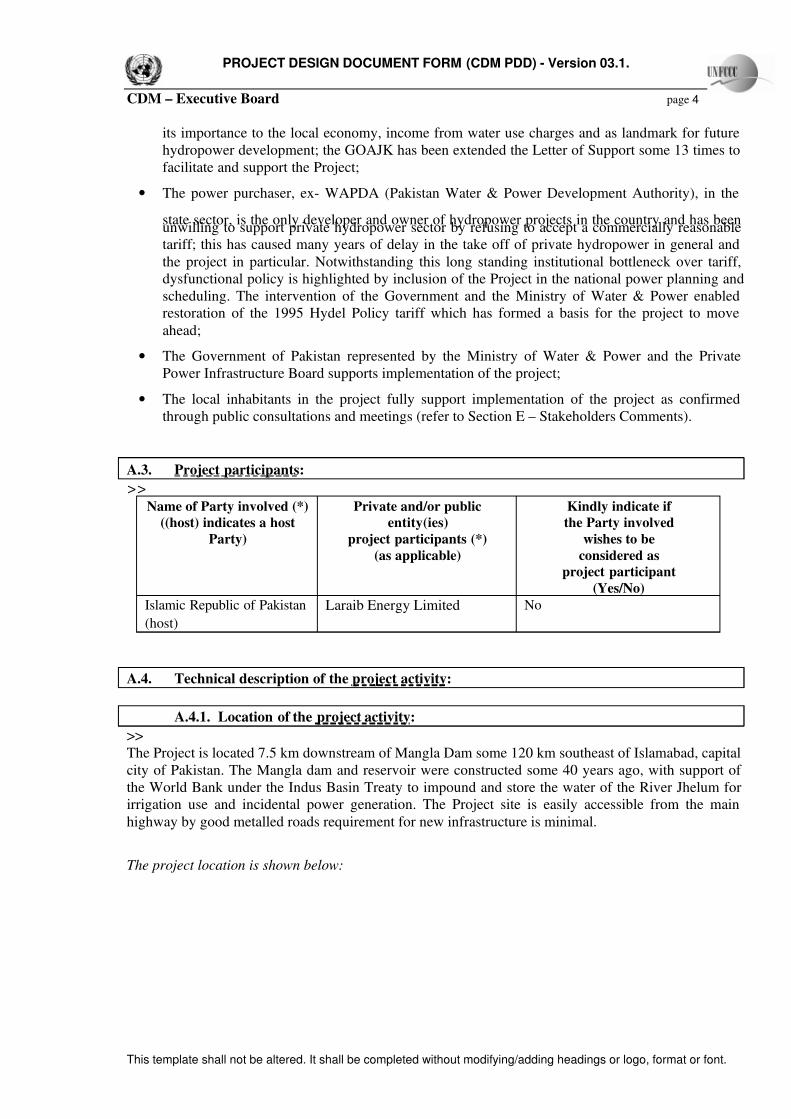
>>The Project is located 7.5 km downstream of Mangla Dam some 120 km southeast of Islamabad, capitalcity of Pakistan. The Mangla dam and reservoir were constructed some 40 years ago, with support of the World Bank under the Indus Basin Treaty to impound and store the water of the River Jhelum forirrigation use and incidental power generation. The Project site is easily accessible from the mainhighway by good metalled roads requirement for new infrastructure is minimal.
The project location is shown below:
7/14/2019 Bong Escape Hydropower Project
http://slidepdf.com/reader/full/bong-escape-hydropower-project 5/60
PROJECT DESIGN DOCUMENT FORM (CDM PDD) - Version 03.1.
CDM – Executive Board page 5
This template shall not be altered. It shall be completed without modifying/adding headings or logo, format or font.
A.4.1.1. Host Party(ies):
>>Islamic Republic of Pakistan (host)
A.4.1.2. Region/State/Province etc.:
>>The Azad Jammu & Kashmir
A.4.1.3. City/Town/Community etc:
>>Village Lehri and Ferozabad, about 7.5 km from Mangla dam/ powerhouse.
A.4.1.4. Detail of physical location, including information allowing the unique
identification of this project activity (maximum one page):
>>
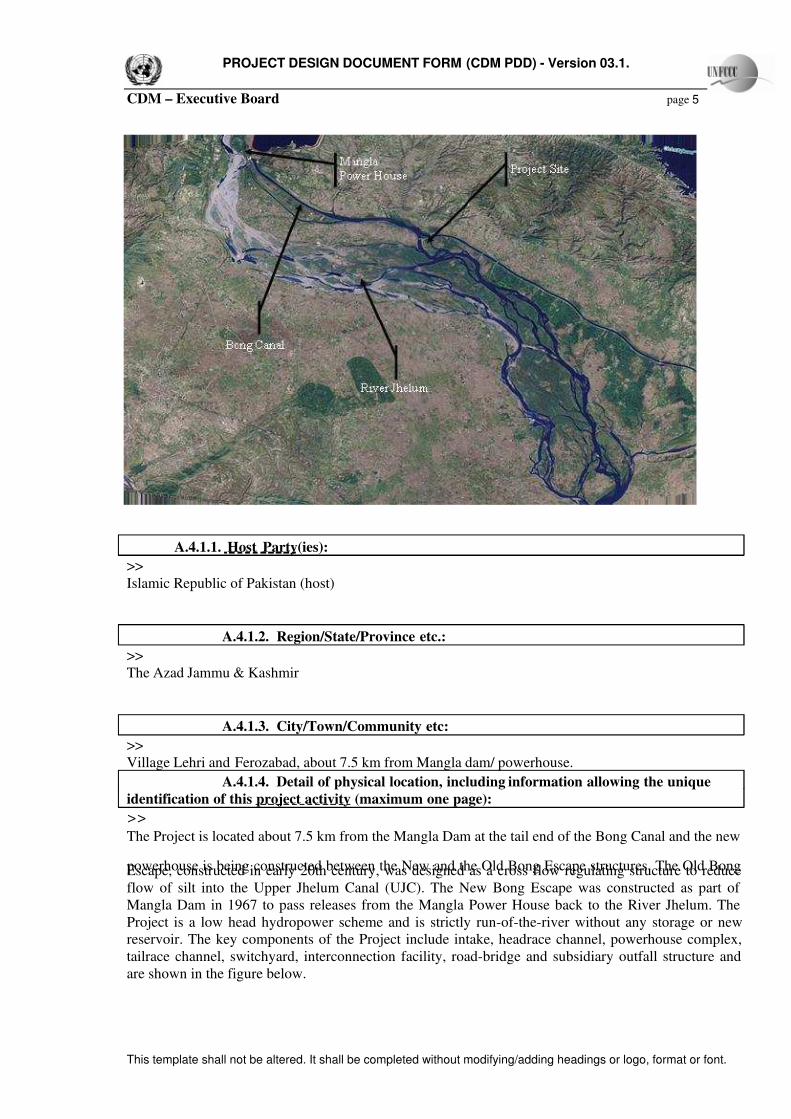
The Project is located about 7.5 km from the Mangla Dam at the tail end of the Bong Canal and the new
powerhouse is being constructed between the New and the Old Bong Escape structures. The Old BongEscape, constructed in early 20th century, was designed as a cross flow regulating structure to reduceflow of silt into the Upper Jhelum Canal (UJC). The New Bong Escape was constructed as part of Mangla Dam in 1967 to pass releases from the Mangla Power House back to the River Jhelum. TheProject is a low head hydropower scheme and is strictly run-of-the-river without any storage or newreservoir. The key components of the Project include intake, headrace channel, powerhouse complex,tailrace channel, switchyard, interconnection facility, road-bridge and subsidiary outfall structure andare shown in the figure below.

7/14/2019 Bong Escape Hydropower Project
http://slidepdf.com/reader/full/bong-escape-hydropower-project 6/60
PROJECT DESIGN DOCUMENT FORM (CDM PDD) - Version 03.1.
CDM – Executive Board page 6
This template shall not be altered. It shall be completed without modifying/adding headings or logo, format or font.
The Project headrace inlet is taken from the Bong Pond (tail end of the Bong Canal).The concrete linedheadrace of some 2,000 feet leads into the intake and powerhouse; discharges from the powerhouse areconveyed into the tailrace which feeds back into the River Jhelum. The physical location of the Project
is 73o
42’43.14” E (Longitude) and 33o
05’21.02” N (Latitutde).

7/14/2019 Bong Escape Hydropower Project
http://slidepdf.com/reader/full/bong-escape-hydropower-project 7/60
PROJECT DESIGN DOCUMENT FORM (CDM PDD) - Version 03.1.
CDM – Executive Board page 7
This template shall not be altered. It shall be completed without modifying/adding headings or logo, format or font.
A.4.2. Category(ies) of project activity:
>>
Scope
Number
Sectorial
Scope
Approved Consolidated
Methodology
Version
Number
1 Energy Industries(renewable andnon-renewable sources)
ACM0002 6
A.4.3. Technology to be employed by the project activity:
>>
The Project’s hydropower potential is derived from the water flow from the Mangla reservoir drawnthrough Mangla Powerhouse into the Bong Canal (tailrace of Mangla powerhouse) and a natural fall atthe New Bong Escape some 7.5 km downstream of the Mangla Powerhouse. Discharge of River

7/14/2019 Bong Escape Hydropower Project
http://slidepdf.com/reader/full/bong-escape-hydropower-project 8/60
PROJECT DESIGN DOCUMENT FORM (CDM PDD) - Version 03.1.
CDM – Executive Board page 8
This template shall not be altered. It shall be completed without modifying/adding headings or logo, format or font.
Jhelum, one of the five major rivers flowing through Kashmir into Pakistan’s Punjab (land of the 5rivers) has been measured since 1922 and shows a stable average annual river flow of about 23 MAF.
The Project feasibility was carried out by leading local engineering consultants Pakistan EngineeringServices with due diligence and updates by Harza International Inc and Montgomery Watson Harza,
USA. The site is easily accessible through metalled roads and does not require development of anyadditional infrastructure.Both pit-type horizontal Kaplan units and horizontal bulb turbines are suitable for low head run-of-riverhydropower projects and are more economical than vertical Kaplan configuration. Bulb units have highefficiency, low maintenance and are suitable for such sites with low head, large and variable waterflow. Low head bulb turbines represent mature and robust technology and have a higher efficiency,quicker erection time, lower civil work costs and easier accessibility for maintenance. Accordingly, thepower potential will be harnessed through installation of four low speed bulb-turbine units andsynchronous direct drive generators within the bulb housing which, together with transformers andbalance of electrical/powerhouse plant will provide basis of the generating equipment.
The selected bulb turbine/generators will operate at about 100 rpm and are expected to have a long
operating life. The low-maintenance units are considered environmentally safe and reliable. Thetechnology and know how for manufacture of hydro turbine-generators is not available in Pakistan andaccordingly it is proposed to procure the bulb units governing/excitation systems, protection,automation and control systems from Alstom Power Hydro or other leading supplier. The selected plantis backed by well proven and mature technology. The balance of electrical plant including transformerswill be procured from ABB, Siemens or one of the other leading international suppliers.
The direct-drive generator placed within the turbine housing will have a rated capacity of about 23MVA and generators will be insulated with a class F temperature rating to handle the overloadcondition without undue stress. The unit transformers with 10 percent higher than the generatorcapacity are recommended to accommodate the anticipated overloads. The stop start capability of theplant will exceed 500 per annum to match with Mangla Power House.
The obligations regarding training, personnel and maintenance efforts are covered in several of theproject documents and comprise a robust set of contractual obligations of the Company and/ or itsContractors. The project O&M Contract will be entered into with O&M Energy, Spain, a wholly ownedsubsidiary of Union Fenosa, 3rd largest utility of Spain. A comprehensive and detailed O&M contracthas been negotiated which covers manpower requirements. As Pakistan has significant public sectorhydropower projects there is a large local resource of trained manpower. The strategy adopted by theO&M Operator would be to base the O&M team upon local resources with backup support from Spainexpatriates posted at the plant. The provisions for manpower, training, health, safety, environment andemergencies is adequately covered in the contract both during construction phase and operations phase.The EPC Contract contains provisions regarding training for operations and maintenance and the EPCContractor will be responsible for creating the interface between the equipment supplier and the O&Moperator and training activities. The Project Management Plan structure, details and organization of the
project owner’s administration, including, staff training, health, safety and environment. The PowerPurchase Agreement covers obligation of the Company to employ qualified personnel and to complywith prudent utility practices. Representations and Warrantees creates covenants for the company tooperate and maintain the complex in accordance with ‘sound engineering practices’ and ‘prudent utilitypractices’; finally the company’s failure to operate, maintain, modify or repair the complex inaccordance with the prudent utility practices would be considered a company event of default leadingto termination of the PPA.

7/14/2019 Bong Escape Hydropower Project
http://slidepdf.com/reader/full/bong-escape-hydropower-project 9/60
PROJECT DESIGN DOCUMENT FORM (CDM PDD) - Version 03.1.
CDM – Executive Board page 9
This template shall not be altered. It shall be completed without modifying/adding headings or logo, format or font.
Concept Design The key components of the Project include intake, headrace channel, powerhouse complex, tailracechannel, switchyard, interconnection facility, road-bridge and subsidiary outfall structure. Theswitchyard will provide connectivity with the double circuit in-out arrangement with the two existing132 kV Mangla-Kharian transmission lines pass over the Project Site and connected to the grid system.
For location of the transmission line please refer to figure provided in Section A 4.1.4. All the powergenerated by the Project will be sold to the National Transmission and Despatch Company (NTDC)under a long term power purchase agreement with a 25 year term.
A.4.4. Estimated amount of emission reductions over the chosen crediting period:
Years Annual estimation of emission reductions
In tonnes of CO2e For the period/year ended June 30 th
2010-2011 (01/10/2010 to 30/06/2011) – 9 months 164,241
2011-2012 218,988
2012-2013 218,988
2013-2014 218,9882014-2015 218,988
2015-2016 218,988
2016-2017 218,988
2017-2018 (01/07/2017 to 30/09/2017) – 3 monthsend of 1
stcrediting period
54,747
Total estimated reductions for first crediting period
(tonnes of CO2e)
1,532,916
Total number of crediting years 7
Annual average over the first crediting period of Estimated reductions (tonnes of CO2e) 218,988
Note:
Split-years are computed on a pro-rata basis with annual CER’s.
A.4.5. Public funding of the project activity:
>>
The project activity does not involve any public funding from Annex 1 countries
SECTION B. Application of a baseline and monitoring methodology:
B.1. Title and reference of the approved baseline and monitoring methodology applied to the
project activity:
>>
• Title: “Consolidated baseline methodology for grid connected electricity generation from
renewable sources”;
• Tool for demonstration and assessment of additionality agreed by the CDM Executive Board;
• A pproved consolidated monitoring methodology ACM0002 (Version 6) “consolidated monitoring
methodology for zero emissions grid connected electricity generation from renewable sources”
B.2. Justification of the choice of the methodology and why it is applicable to the project
activity:
7/14/2019 Bong Escape Hydropower Project
http://slidepdf.com/reader/full/bong-escape-hydropower-project 10/60
PROJECT DESIGN DOCUMENT FORM (CDM PDD) - Version 03.1.
CDM – Executive Board page 10
This template shall not be altered. It shall be completed without modifying/adding headings or logo, format or font.
>>
The approved methodology ACM0002 covers:
a) “Consolidated baseline methodology for grid connected electricity generation from renewable
sources”; and
b) “Consolidated monitoring methodology for zero emissions grid connected electricitygeneration from renewable sources”
The approved methodology is applicable to grid connected renewable power generation activities and isapplicable to the proposed project because it meets all the applicability criteria stated in themethodology and the project activity meets all the conditions stated in the methodology; which are:
The project activity is a run-of-river hydropower plant without any impoundment or storage;
The project activity displaces fossil fuel based electricity generation in the national grid;
It is not a project activity which involves switching from fossil fuels to renewable energy at theproject site; and
The geographic and system boundaries for the relevant electricity grid can be clearly identifiedand information and characteristics of the grid is available.
Accordingly the project activity is in accordance with and falls under applicability of methodologyACM0002 (Version 6).
B.3. Description of how the sources and gases included in the project boundary:
>>
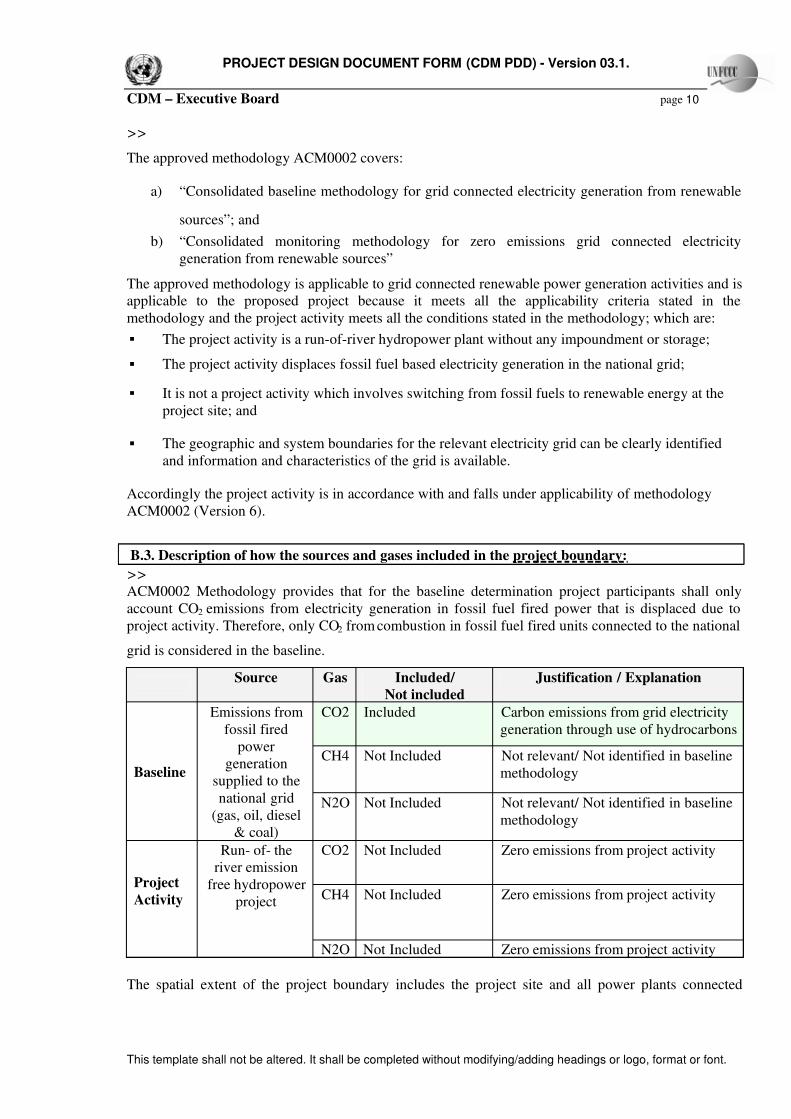
ACM0002 Methodology provides that for the baseline determination project participants shall onlyaccount CO2 emissions from electricity generation in fossil fuel fired power that is displaced due toproject activity. Therefore, only CO2 from combustion in fossil fuel fired units connected to the national
grid is considered in the baseline.
Source Gas Included/
Not included Justification / Explanation
CO2 Included Carbon emissions from grid electricitygeneration through use of hydrocarbons
CH4 Not Included Not relevant/ Not identified in baselinemethodologyBaseline
Emissions fromfossil fired
powergeneration
supplied to thenational grid
(gas, oil, diesel& coal)
N2O Not Included Not relevant/ Not identified in baselinemethodology
CO2 Not Included Zero emissions from project activity
CH4 Not Included Zero emissions from project activityProject
Activity
Run- of- theriver emission
free hydropowerproject
N2O Not Included Zero emissions from project activity
The spatial extent of the project boundary includes the project site and all power plants connected
7/14/2019 Bong Escape Hydropower Project
http://slidepdf.com/reader/full/bong-escape-hydropower-project 11/60
PROJECT DESIGN DOCUMENT FORM (CDM PDD) - Version 03.1.
CDM – Executive Board page 11
This template shall not be altered. It shall be completed without modifying/adding headings or logo, format or font.
physically to the electricity system that the Project is connected to i.e. national grid. Pakistan comprisestwo distinct grids (a) the national grid; and (b) the Karachi Electricity Supply Company (KESC) grid.Each grid has its own independent despatch centre, generation and distribution system. Thoughinterconnected for occasional supply from the national grid to KESC which ranges from 400-600 MW,there are no material interdependencies between the two grids. The generating plants for each grid are
clearly identifiable and data for each grid is available. By separating KESC generation (100% thermal)the emission factors for the national grid (thermal + hydro) are broadly reduced, providing a correct andconservative estimate of the impact of the new plant on emissions. At present, no imports or exportsoccur in the project system because national grid is not linked to any other foreign electricity system.Power projects that feed into the national grid can be built almost anywhere in the country and can bedispatched without significant transmission constraints provided that transmission facilities areavailable.
B.4. Description of how the baseline scenario is identified and description of the identified baseline
scenario:
>>
The approved consolidated baseline methodology ACM0002 “Consolidated baseline methodology forgrid-connected electricity generation from renewable sources” recommends an analytical approachwhereby the following options should be considered:
(a) Existing, actual or historical emissions as applicable; or
(b) Emissions from a technology that represents an economically attractive course of action, takinginto account barriers to investment.
The approved consolidated methodology further prescribes that the baseline scenario for projectactivities that do not modify or retrofit an existing electricity generation facility is:
Electricity delivered to the grid by the project would have otherwise been generated by the
operation of grid-connected power plants and by the addition of new generation sources
The Project activity is generation of electricity from renewable energy sources. The electricitygenerated from the run-of-the new river hydropower plant has zero emissions, there is no materialleakage and the Project generation will be fed into the fossil intensive national grid through theinterconnection facility at the site.
The grid in Pakistan is predominantly thermal and over 70% comprises gas and oil based generation.Heavily subsidized gas has virtually run out and is not available for power generation forcing allforthcoming projects to be set up based on oil (with coal being designated as the fuel of choice in thelonger term). It would be appropriate to state that the Project activity would directly replace oil basedthermal generation i.e. reciprocating engines/steam turbines operating on furnace oil and would thus
result in saving such emissions to the extent of its generation, however, in order to ensure theconservative approach it was decided to use the approved ACM0002 methodology which considers thatthe Project activity would replace the weighted average of the ratio of emissions in the systemrepresented (a) the Operating Margin (OM) which is the ratio of emissions from generation of allpower generating projects in the defined system over the latest three (3) year periodexcluding leastcost/must run projects; and (b) the Build Margin (BM) which is the ratio of emissions attributable to thehigher of (i) generation (MWh) from five (5) most recent power projects built or (ii) generation (MWh)of the most recently built power plants equating to 20% of the most current annual system generation.

7/14/2019 Bong Escape Hydropower Project
http://slidepdf.com/reader/full/bong-escape-hydropower-project 12/60
PROJECT DESIGN DOCUMENT FORM (CDM PDD) - Version 03.1.
CDM – Executive Board page 12
This template shall not be altered. It shall be completed without modifying/adding headings or logo, format or font.
Both the OM and BM are the ratio of generation (MWh) with emissions (tCO2) and are “weighted”using specific or default weightage factor of OM=0.5 and BM=0.5.
The baseline emission factor is calculated as a combined margin (CM), consisting of the operatingmargin (OM) and build margin (BM) emission factors. The CM based weighted average CEF of 0.46593 is computed using the OM of 0.62790 and the BM of 0.30397 computed, herein. This results inaverage saving of some 218,988 tCO2 per annum as applied to the projected annual power generationof 470,000 MWh over the term.
Accordingly, it is proposed to present in this PDD the measurement of emissions observed whencomparing the “business as usual” case (without the project activity) with emissions under the project(the “project scenario” case). The baseline emission factor (EF,y) represents a conservative estimate of emissions per kWh of grid generation and the emissions “saved” per kWh of the project generation.
All computations are based on official data available in the public domain and published annually in the“Pakistan Energy Yearbook” published by the Hydrocarbon Development Institute of Pakistan,Ministry of Petroleum & Natural Resources, Government of Pakistan.
B.5. Description of how the anthropogenic emissions of GHG by sources are reduced below those
that would have occurred in the absence of the registered CDM project activity (assessment and
demonstration of additionality):
>>
A step wise approach has been adopted to demonstrate and assess additionality according to the “Tool
for the demonstration and assessment of additionality” Version 4. These steps include:
Step 1-Identification of alternatives to the project activity
Step 2-Investment analysis to determine that the proposed project activity is not the mosteconomically or financially attractive;
Step 3-Barrier analysis; and
Step 4-Common practice analysis
STEP 1 – Identification of alternatives to the project activity consistent with current laws and
regulations
Define realistic and credible alternatives to the project activity that can be part of the baseline
scenario through the following sub-steps:
Sub-step 1a. Define alternatives to the Project activity:
Realistic and credible alternatives available to the project participants or similar project developers thatprovide outputs or services comparable with the proposed CDM activity could be:
The proposed Project activity is implemented without the CDM
The Project is not implemented and other alternatives are considered;
Continuation of current situation (no project activity or alternatives are considered)
Scenario 1 – The proposed project activity is not undertaken as a CDM activity:

7/14/2019 Bong Escape Hydropower Project
http://slidepdf.com/reader/full/bong-escape-hydropower-project 13/60
PROJECT DESIGN DOCUMENT FORM (CDM PDD) - Version 03.1.
CDM – Executive Board page 13
This template shall not be altered. It shall be completed without modifying/adding headings or logo, format or font.
Without CDM assistance the following disadvantages would accrue:
a) Project Failure: The Project would not come on stream as it would be unable to achieve thefinancial returns necessary to attract equity investment and secure investor interest especiallykeeping in view the longer construction period and greater geological risk for hydropower
projects;
b) Inability to achieve financial closing: Lenders already exposed to greater risks, long loantenures, would hesitate to finance the Project owing to poor financial returns/depth in the projectrevenues resulting in increased lenders risk in the proposed non-recourse project financeenvironment;
c) Failed public Listing: The intended public flotation and stock exchange listing would notachieve a satisfactory price level due to low financial returns and it would affect all subsequentpublic investment sentiment for private hydropower;
d) Setback to development of Private Hydropower: As a precursor of private hydropowerdevelopment in Pakistan, failure of the Project would effect the private hydropower sector, and
impact equity investment in and debt financing of future private hydropower projects; due to theGovernment’s reluctance to assure hydropower with an economic return compared with thermalprojects, further investment in the sector will be encouraged through successful implementation of the Project and through financial viability achieved through carbon financing.
Scenario 2 – Other plausible and credible alternatives to the project activity that delivers outputs andon services i.e. electricity with comparable quality, properties and application are described below:
Presently the Country is in a critical power shortage crisis which is evidenced by recent blackouts,burnouts and load shedding. With the high growth of the economy at above 7%, there is consequentialrapid growth of power demand of approx 6-7% per annum It is anticipated that there will be a shortageof some 1,000 MW per annum from 2007 onwards. Based on this fact, the Project Participants selectedthe proposed project activity as against the other alternatives available which are briefly described as
follows:
Real and credible alternatives to the project activity are considered and discussed below:
(a) Rented oil/gas based power plants
Crisis management is forcing the Government to seek expensive rental contracts and PowerPurchaser has awarded 3-year rental contracts for GE and Alstom plants. These are based onopen-cycle, fuel inefficient and high carbon emitting technologies. Once the capacity shortfallis filled through such means, hydropower projects continue to suffer from institutional neglect
(b) Implementation of CCGT gas or DG set oil based generation projects in the public sector
This may be a quick short term “fix” as it flies in the face of “de-bundling” of the power sector,proposed and funded by the WB and ADB and causes dysfunctional policy.
(c) Implementation of CCGT gas or DG set oil based generation projects in the private sector
This appears to be the most preferred alternative as thermal independent power producers(IPPs) are being invited to set up fossil intensive gas/oil based projects but will once againcause increased emissions.
(d) Implementation of similar small/medium hydropower schemes
Some hydel IPPs are under development but the gestation period would be very long to be apractical alternative to mitigate the current and increasing power shortages;

7/14/2019 Bong Escape Hydropower Project
http://slidepdf.com/reader/full/bong-escape-hydropower-project 14/60
PROJECT DESIGN DOCUMENT FORM (CDM PDD) - Version 03.1.
CDM – Executive Board page 14
This template shall not be altered. It shall be completed without modifying/adding headings or logo, format or font.
(e) Implementation of large mega hydropower schemes in the public sector
Some mega hydropower projects like Bhasha and Kalabagh are under consideration in thepublic sector but they also suffer from timing issues; already delayed by some 20 years theywould take at least 15-20 years to implement at great financial and social cost due to large
reservoirs and massive displacement of human habitation.
(f) Other renewables like wind, solar are developed.
There are a number of wind projects under development but they suffer from (a) located in thesouth of the country far from the load centre in mid country; lack of transmission infrastructureand intermittent nature of supply and consequent low capacity value of such projects; there ishardly any significant solar power development in the Country.
Scenario 3 – If applicable, continuation of the current situation (no project activity or other alternativesundertaken):
This option appears highly unlikely if not impossible. The country faces daunting power shortages with
a capacity shortfall of some 1,000 MW per year from 2007 onwards. As the Project is budgeted as partof the generation plan non-implementation of the Project will make it imperative for the Government toplan and implement an alternative fossil fuel intensive thermal project (which is the baseline scenario).In this situation the national grid will be deprived of ecologically friendly and non pollutinghydropower.
Outcome of Step 1a:
Realistic and credible alternatives to the Project activity are Ser 1, 2 and 3 of the above table underScenario 2.
Sub-step 1b. Enforcement with applicable laws and regulations:
All the alternatives are in compliance with all mandatory applicable legal and regulatory requirements.
Outcome of Step 1b:
The alternatives to the Project activity are in compliance with applicable legal and regulatoryrequirements.
Tools for demonstration and assessment of additionality provide that Project participants can use eitherinvestment analysis or barrier analysis step. They may, if they so wish, use both investment and barrieranalysis step. For the purposes of this Project participants have decided to use both investment andbarrier analysis steps. Based on this understanding we can now proceed to Step 2 (Investment analysis)and Step 3 (Barrier analysis):
STEP 2 – Investment analysis
Sub-step 2a – Determine appropriate analysis method
After studying the options that are available to analyze additionality i.e. simple cost analysis,investment comparison analysis and benchmark analysis, it has been concluded that benchmark analysisis the most appropriate methodology for Project because the evaluation criterion that was used by theProject Parties in their decision was benchmark analysis.
The simple cost is not appropriate since the project activity produces economic benefits in the form of revenues from the sale of electricity in addition to CDM related income.
7/14/2019 Bong Escape Hydropower Project
http://slidepdf.com/reader/full/bong-escape-hydropower-project 15/60
PROJECT DESIGN DOCUMENT FORM (CDM PDD) - Version 03.1.
CDM – Executive Board page 15
This template shall not be altered. It shall be completed without modifying/adding headings or logo, format or font.
In order to determine whether the proposed Project is economically and financially attractive withoutthe revenue from the sale of CERs, Option III – “Apply benchmark analysis”, is completed below.
Sub-step 2b – Option III – Apply benchmark analysis
Equity Internal Rate of Return (IRR) is considered the most suitable financial indicator for the Project.As suggested in the tool for the demonstration and assessment of additionality, the Project IRR will beused to analyse the financial situation of the Project. Further, the equity IRR will also be analysed toevaluate and justify investor interest. Considering the bank interest rates of above 10% and risk freerate on Government securities and bond above 10%, the cost of money in Pakistan is high. TheGovernment has fixed IRR returns for thermal private power projects as 15% and keeping in view thathydel projects have greater construction risks and longer construction period and PPA under Section4.2(b) of Schedule 6 allows a return of 16% indexed to protect for inflation and exchange ratefluctuations, the hurdle Equity IRR baseline is also considered as minimum16%. It may also be notedhere that “Policy Framework and Package of Incentives for Private Sector Power Generation Projects inPakistan” of 1994 provides that “For hydro projects exceeding 20 MW, the tariff will be decided on
project to project basis on a 25% return on equity” (Ref: Para C-1)
It may be further added that, due to dysfunctional policy and institutional bias against privatehydropower, despite strong representations, the project currently continues to be deprived of (a) EPCcost adjustment in tariff at financial close; (b) indexation from date of establishment/announcement of tariff (1995); and pass through for certain critical costs (e.g. insurance); such concessions are freelyavailable to thermal projects.
The Project is commercially unviable without CDM revenue and the returns and financial indicatorswill render the Project un-fundable and it would be close to impossible to attract equity investment intoan enterprise with high country and project risk while returns are low; implementation is thusdependent on CDM registration. The Project Company is negotiating for advance payment againstforward sale of CERs generated by the project (up to 31/12/2012) with the leading international carbonfund to partly finance Project construction cost.
Sub-step 2c- Calculation and comparison of financial indicators
Calculate the suitable financial indicators for the proposed CDM Project activity
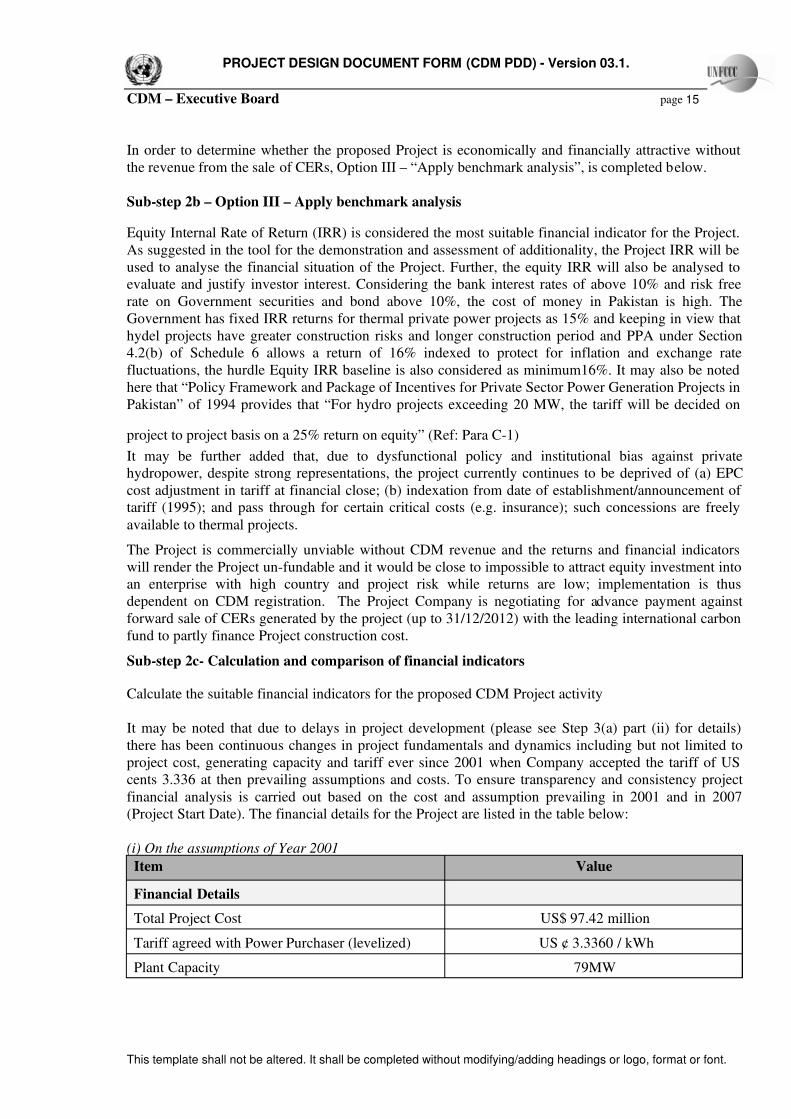
It may be noted that due to delays in project development (please see Step 3(a) part (ii) for details)there has been continuous changes in project fundamentals and dynamics including but not limited toproject cost, generating capacity and tariff ever since 2001 when Company accepted the tariff of UScents 3.336 at then prevailing assumptions and costs. To ensure transparency and consistency projectfinancial analysis is carried out based on the cost and assumption prevailing in 2001 and in 2007(Project Start Date). The financial details for the Project are listed in the table below:
(i) On the assumptions of Year 2001
Item Value
Financial Details
Total Project Cost US$ 97.42 million
Tariff agreed with Power Purchaser (levelized) US ¢ 3.3360 / kWh
Plant Capacity 79MW
7/14/2019 Bong Escape Hydropower Project
http://slidepdf.com/reader/full/bong-escape-hydropower-project 16/60
PROJECT DESIGN DOCUMENT FORM (CDM PDD) - Version 03.1.
CDM – Executive Board page 16
This template shall not be altered. It shall be completed without modifying/adding headings or logo, format or font.
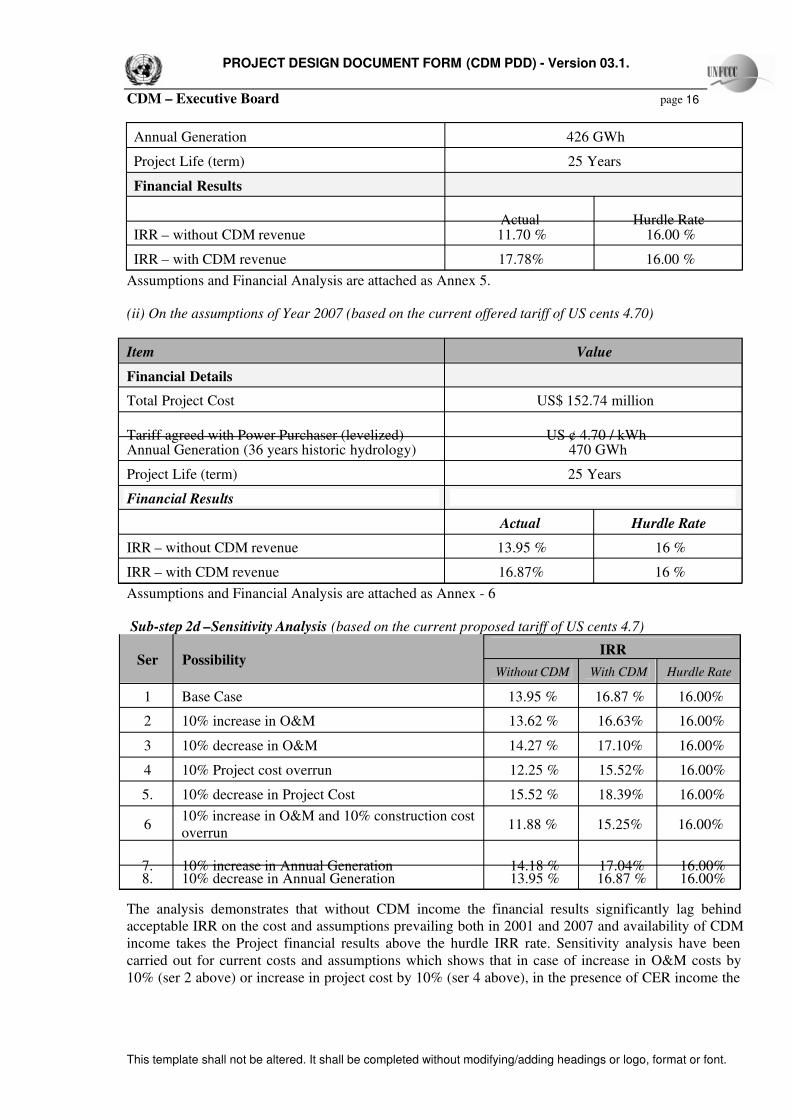
Annual Generation 426 GWh
Project Life (term) 25 Years
Financial Results
Actual Hurdle RateIRR – without CDM revenue 11.70 % 16.00 %
IRR – with CDM revenue 17.78% 16.00 %
Assumptions and Financial Analysis are attached as Annex 5.
(ii) On the assumptions of Year 2007 (based on the current offered tariff of US cents 4.70)
Assumptions and Financial Analysis are attached as Annex - 6
Sub-step 2d –Sensitivity Analysis (based on the current proposed tariff of US cents 4.7)
IRRSer Possibility
Without CDM With CDM Hurdle Rate
1 Base Case 13.95 % 16.87 % 16.00%
2 10% increase in O&M 13.62 % 16.63% 16.00%
3 10% decrease in O&M 14.27 % 17.10% 16.00%
4 10% Project cost overrun 12.25 % 15.52% 16.00%
5. 10% decrease in Project Cost 15.52 % 18.39% 16.00%
610% increase in O&M and 10% construction costoverrun
11.88 % 15.25% 16.00%
7. 10% increase in Annual Generation 14.18 % 17.04% 16.00%8. 10% decrease in Annual Generation 13.95 % 16.87 % 16.00%
The analysis demonstrates that without CDM income the financial results significantly lag behindacceptable IRR on the cost and assumptions prevailing both in 2001 and 2007 and availability of CDMincome takes the Project financial results above the hurdle IRR rate. Sensitivity analysis have beencarried out for current costs and assumptions which shows that in case of increase in O&M costs by10% (ser 2 above) or increase in project cost by 10% (ser 4 above), in the presence of CER income the
Item Value
Financial Details
Total Project Cost US$ 152.74 million
Tariff agreed with Power Purchaser (levelized) US ¢ 4.70 / kWhAnnual Generation (36 years historic hydrology) 470 GWh
Project Life (term) 25 Years
Financial Results
Actual Hurdle Rate
IRR – without CDM revenue 13.95 % 16 %
IRR – with CDM revenue 16.87% 16 %

7/14/2019 Bong Escape Hydropower Project
http://slidepdf.com/reader/full/bong-escape-hydropower-project 17/60
PROJECT DESIGN DOCUMENT FORM (CDM PDD) - Version 03.1.
CDM – Executive Board page 17
This template shall not be altered. It shall be completed without modifying/adding headings or logo, format or font.
acceptable IRR is maintained. In case where both increase in O&M cost and project cost occurs (ser 6above) it is seen that, in the presence of CER income, the return falls marginally below the hurdle rateof 16%, however, without such income the project becomes unviable.
Decrease in project cost and/or decrease in O&M Cost is unlikely as for typical project financing such
costs are based on fixed price contracts, however, in the later paragraph sensitivity analysis has beenprovided to achieve benchmark without CDM income based on the assumptions of substantial reductionin project and O&M cost.
Increase in the project cost is unlikely due to the following reasons:
(a) the project construction arrangements are based on a tightly structured EPC contractapproved by non-recourse lenders and based on a special FIDIC licensed version of EPCcontract which requires fixed price and time certain completion; and
(b) In the unlikely event of any variation orders, the project cost includes sufficient contingencyto provide for up to about 5% project cost increase.
The decreased generation by 10% (ser 8 above) has no impact on IRR because of assured minimummonthly amount every month; however the increased generation may increase the IRR for the Project asthe amended and restated Power Purchase Agreement provides nominal tariff i.e. 10% of MinimumEnergy Purchase Price for any excess energy above Average Energy of 470 GWh. The increasedgeneration by 10% (ser 7 above) has therefore increased the IRR by (0.23%.) which is very nominal.Furthermore, Benchmark of 16% can be achieved if there is 100% increase in energy generation i.e.940 GWh, which is not a practical scenario.
Benchmark of 16% (without CDM income) can be achieved if the project cost is reduced to US$132.62 million from projected cost of US$ 152.74 million. A reduction of US$ 20.12 million is highlyunlikely to occur due to exploding cost of construction materials, labour and fuel as it is a struggle justto maintain costs. Similarly, by reducing the O&M expenses to US$ 0.88 million from US$ 3 million
annually will give the required benchmark of 16%, a 70% reduction in O&M expenses is practicallyimpossible.
Full details and spreadsheets of the financial workings are available upon request
Supporting arguments for additionality
In addition to well imbedded institutional barriers, country risk, preference for nominally cheaperthermal power capacity and weak commercial viability without CER income, as a hydropower projectwith a high civil works cost component, the Project is also subject to the following risk factors:
Construction completion risk; Geological surprises, especially dewatering in the river bed; Technology, design and performance risk
Though the Project is attractive due to low environmental and social impact and the beneficialenvironmental impact upon completion, the low IRR (without CER income), high-perceived countryrisk and project location in the AJ&K, nominally considered as disputed territory is such thatimplementation is only possible with CDM assistance.
STEP 3- Barrier analysis

7/14/2019 Bong Escape Hydropower Project
http://slidepdf.com/reader/full/bong-escape-hydropower-project 18/60
PROJECT DESIGN DOCUMENT FORM (CDM PDD) - Version 03.1.
CDM – Executive Board page 18
This template shall not be altered. It shall be completed without modifying/adding headings or logo, format or font.
If this is used, determine whether the proposed project activity faces barriers that:
(a) Prevent the implementation of this type of proposed project activity; and
(b) Do not prevent the implementation of at least one of the alternatives.
Sub-step: 3a- Identify barriers that would prevent the implementation of the proposed Project
activity.
1. Establish that there are realistic and credible barriers that would prevent the implementation of theproposed project activity from being carried out if the project activity was not registered as a CDMactivity. Such realistic and credible barriers may include, among others:
Investment barriers, other than the economic/financial barriers in Step 2 above , inter alia:
o For alternatives undertaken and operated by private entities: Similar activities haveonly been implemented with grants or other non-commercial finance terms. Similaractivities are defined as activities that rely on a broadly similar technology or practices,are of a similar scale, take place in a comparable environment with respect toregulatory framework.
o No private capital is available from domestic or international capital markets due toreal or perceived risks associated with investment in the country where the proposedCDM project activity is to be implemented, as demonstrated by the credit rating of thecountry or other country investments reports of reputed origin.
There are currently 14 hydropower plants despatching electricity to the national grid. All these projectsare owned by public sector. There is no private hydropower project supplying electricity to the grid.The Project is first ever-private hydropower Project of the country.
In Pakistan availability of project financing and access to international capital markets is greatlyaffected by the investment barriers. The investment barriers not only make non-recourse financing in
Pakistan more difficult to secure but also make the terms and conditions of the debt more onerous. Inthe context of the above following barriers are considered relevant for the Project: (i) high upfrontcapital cost; scarcity of debt with sufficiently long tenure to support longer hydropower constructionperiod and mitigate impact on tariff of high capital cost, completion risk, country risk, location risk andimplementation risk; (ii) institutional barriers including discouragement of private sector competitionwith public sector and refusal to give a commercially reasonable tariff to hydropower projects (a tariff set in 1995 was withdrawn from 1997 to 2006 and re-instated when such 12-year old tariff had becomeirrelevant); (iii) Geological/Civil Risks; (iv) Scheduling Risk; and (v) Non Recourse Risk.
i. High Costs of Capital
High costs of capital are the result of scarcity of financial resources for activities such as hydro powerProject development, originated by the perception of Pakistan as a risky country by foreign investors.
Low head hydropower projects based on bulb turbines are relatively expensive due to large size of plant. Development and implementation of such projects by the public sector in Pakistan at cost US$2.4 million per MW (e.g. 184 MW Chashma low head project) and equivalent tariff of US ¢ 6 per kWh.These points will be elaborated in this section;
i.a Country risk This may be measured by the sovereign ratings of International Credit Rating Agencies. The tablebelow is reproduced from the data taken by “The Political Risk Survey (PRS) Group” ratings.(http://www.prsgroup.com/icrg/sampletable.html) this data shows the relative risk of country with

7/14/2019 Bong Escape Hydropower Project
http://slidepdf.com/reader/full/bong-escape-hydropower-project 19/60
PROJECT DESIGN DOCUMENT FORM (CDM PDD) - Version 03.1.
CDM – Executive Board page 19
This template shall not be altered. It shall be completed without modifying/adding headings or logo, format or font.
respect to other Asian countries. The countries with in range of 51-100 are declared as less risky andfrom 0-49 as high-risk countries by PRS.
COUNTRY RISK RATINGS
CURRENT RATINGS COMPOSITE RATINGSPolitical Financial Economic Year Year
Risk Risk Risk Ago CurrentCOUNTRY
March 2005 March 2005 March 2005 April 2004 March 2005
China, Peoples' Rep. 69.0 45.5 38.5 77.0 76.5
India 63.0 44.5 36.0 72.0 71.8
Indonesia 52.0 38.0 37.0 61.5 63.5
Japan 83.0 47.0 39.0 86.3 84.5
Korea, Republic 77.0 42.5 43.5 79.8 81.5
Malaysia 76.0 41.5 40.5 80.0 79.0Pakistan 43.5 37.5 34.5 64.0 57.8
Philippines 65.0 36.0 36.5 69.0 68.8
Singapore 84.5 45.0 47.0 87.8 88.3
Taiwan 77.5 46.0 42.5 81.8 83.0
Thailand 68.0 41.5 38.0 76.5 73.8
i.b Scarce Foreign Direct Investment.
Pakistan actively seeks foreign investment and government investment liberalization initiatives begun
in 1992 and have progressively opened Pakistan to foreign investment, offering broad arrays of incentives to attract new capital inflows.
Notwithstanding this pro-investment stance, foreign direct investment (FDI) activity remains relativelymodest due to significant security threats to foreign interests in Pakistan; concerns about politicalinstability; inadequate infrastructure; delays in the privatization of state-owned enterprises; pastprotracted disputes between foreign investors and the government; piracy of intellectual property,arbitrary and non-transparent application of government regulations; and resistance to the adoption of new policies by some elements of federal and provincial bureaucracies who have not yet fully adjustedto the new, more open economic environment.
All of these factors created perceptions of Pakistan as a high risk country, resulting in low levels of foreign investment, particularly in the capital intensive electric, gas and water Projects, as can be
appreciated in the Tables below.
ASIA: FOREIGN DIRECT INVESTMENT
US$ Billion
1999-00 2001-02 2002-03 2003-04 2004-05 % Of GDP
Asia Total 82.2 64.5 79.2 80.4 90.0 1.0China 38.6 46.8 52.7 51.0 54.9 3.4

7/14/2019 Bong Escape Hydropower Project
http://slidepdf.com/reader/full/bong-escape-hydropower-project 20/60
PROJECT DESIGN DOCUMENT FORM (CDM PDD) - Version 03.1.
CDM – Executive Board page 20
This template shall not be altered. It shall be completed without modifying/adding headings or logo, format or font.
Korea 9.3 3.0 0.2 5.9 8.2 1.2
Japan 11.9 7.5 9.2 6.5 7.4 0.2
Singapore 10.2 -2.9 1.7 5.5 5.4 5.0India 2.9 5.5 3.6 5.0 5.3 0.8
Malaysia 3.8 1.9 1.2 3.5 5.6 3.9Taiwan 9.3 2.8 1.4 1.2 1.9 0.6
Thailand 4.8 2.4 0.8 1.5 1.1 0.7Pakistan 0.46 0.48 0.7 0.94 0.89 0.8
Indonesia -3.6 -2.9 0.1 0.2 1.0 0.4Philippines 0.4 0.4 1.0 0.1 0.1 0.1
Source: JPMorgan
i.c Low levels of foreign investment translate into scarcity of capital and high interest rates
The reference rate for credit operations has been nominated by the Central Bank, State Bank of Pakistan as KIBOR (Karachi Inter bank Offered Rate). KIBOR which reflects the market liquidity andother factors such as core inflation is currently quoted above 10%. The operations of domestic banks
are not directed towards infrastructure development and have more of an emphasis on consumerfinance. Such banks are mainly engaged in short to mid-term financing and, therefore the offeredinterest rates, are not compatible with the requirements of capital-intensive hydroelectric projects,which present significant up-front investments and long payback periods.
Capital-intensive projects with long payback period, such as hydroelectric projects require long-termcredits for their development. However, the Pakistani government has not been able to attract thoseinvestments due to its high Country risk classification. Also, no long-term finance has been provided byinternational creditors to the Pakistani government, forcing the Country to rollover its external debts atvery short terms.
Governments are major provider of log-term money to the local banks within developing countries. Thelack of credit of the Pakistani government is directly reflected in the scarcity of long-term loans
available for private companies in Pakistan.
i.d Local savings
Pakistan suffers from a low rate of domestic savings and the saving rate per capita in Pakistan is verylow as compared to other countries in Asia.
ii. Institutional Barriers
Private hydropower in Pakistan has had a very mixed past. Hydropower development has beenthe sole prerogative of the public sector that has focused more on mega dam/storage projectsand in its time Pakistan has constructed some of the largest dams in the world e.g. Mangla,Tarbela and Warsak which total approx 4,700 MW represented over 70% of the total developed
hydropower capacity in Pakistan.
Private power developers were invited to participate in power project development under the1994 Power Policy; however, the policy attracted interest only from thermal power developers.Fourteen projects totaling over 3,000 MW came on ground but not a single application wasreceived for hydropower.
7/14/2019 Bong Escape Hydropower Project
http://slidepdf.com/reader/full/bong-escape-hydropower-project 21/60
PROJECT DESIGN DOCUMENT FORM (CDM PDD) - Version 03.1.
CDM – Executive Board page 21
This template shall not be altered. It shall be completed without modifying/adding headings or logo, format or font.
In 1995 in an attempt to attract interest from hydropower developers the Government broughtout the “Policy Framework and Package of Incentives for Private Sector Hydel PowerGeneration Projects in Pakistan”; dated May 1995.
Letters of support were issued for some 29 hydropower projects totaling 1,684 MW allowing
sponsors to complete feasibility studies, design, finance and construct the projects; however, inthe past 11 years not a single hydropower project could come on stream. The major reason forthis failure was the refusal of the power purchaser to offer a commercially reasonable tariff; infact the upfront tariff of 4.7 US cents offered in the 1995 Hydel Policy and forming basis of agreement with developers under the Letters of Support remained withdrawn from 1997 to2006 effectively causing default of the agreements.
Developers negotiating financial close got stalled and the banks that had based the financialmodel on a tariff of 4.7 cents refused to finance the projects. The upfront policy tariff hadprovided a predictable environment which dispensed with the need for protracted tariff negotiations; reversal of the policy meant that developers were once again at the mercy of thepower purchaser and long protracted negotiations led nowhere. From 1998 to 2001 the
companies were stuck in endless negotiations and the power purchaser was not ready to offermore than 2.5 cents per kWh, wrongly claiming that that was the cost of hydel generation in thepublic sector. Finally in 2001 the power purchaser offered a levelized tariff of US ¢ 3.1(excluding water use charges) which Laraib was constrained to accept vide MOU dated21/12/2001 placing a heavy reliance on potential CDM revenue to bolster the commercialviability of the project.
Most hydropower developers abandoned the projects and left the field leaving a fewdetermined and obstinate developers to face the challenges. The power purchaser continued toretard hydropower development through failure to recognize real capital cost of hydropowerprojects and inappropriate financial assumptions. In 2002, Iqbal Power Limited, developer of the 132 MW Rajdhani hydropower project, with totally different project fundamentals,followed suit and succumbed to same tariff of US ¢ 3.1 per kWh, entering into MOU with
WAPDA once again heavily relying on CDM revenue to secure its commercial viability.
Despite the clear commitment in the 1995 Hydel Policy and in contrast with thermal projects,investors were not provided a standard set of concession documents for hydropower and it fellupon Laraib to initiate preparation of custom designed hydropower concession documentsnamely the PPA, IA, WUA etc for its own use and by default for forthcoming hydropowerprojects too. It took some three years for this process while the power purchaser continued inits refusal to consider any revision of the tariff of US ¢ 3.1 per kWh to reflect significant costincreases over this period.
Finally on 16/04/2004 the company decided to sign the concession documents at the same tariff US ¢ 3.1 per kWh with ever slipping commercial viability despite the potential CDM income.
However, this move was necessary to secure the company’s interests and move on with otherproject development activities. The absolute need for CDM income was recognized andincluded in the concession documents to ensure that the company would be able to secure suchincome. Without the expectation of such income at that time the project would be abandoned asthe tariff of US ¢ 3.1 per kWh would render the project financially and commercially unviable.
In the two years after signing the concession documents the company made notable progressand attracted the interest of international banks ADB and IDB who lent strong support to theproject to meet the challenge with governmental entities. These developmental banks found the

7/14/2019 Bong Escape Hydropower Project
http://slidepdf.com/reader/full/bong-escape-hydropower-project 22/60
PROJECT DESIGN DOCUMENT FORM (CDM PDD) - Version 03.1.
CDM – Executive Board page 22
This template shall not be altered. It shall be completed without modifying/adding headings or logo, format or font.
project to be viable, subject to revenue sufficiency (tariff and CER revenue); they appreciatedthe determination of the sponsors to battle on for so many years; and also saw an opportunityto help in correcting dysfunctional government policy.
In August 2005, the Company applied to the Government for a tariff revision justified on basis
of massive cost increases in building materials, steel, copper and plant costs.
A tariff proposal based on 2005 price level and assumptions was submitted requesting a tariff of US ¢ 4.81 per kWh (excluding water use charges) or US ¢ 5.03 per kWh (including wateruse charges) based on project cost of US$148 million was submitted to the Ministry of Water &Power on 07/09/2005.
Thereafter, the Company embarked on a long process of interaction, presentations and petitionswith the PPIB, Ministry of Water & Power and the power purchaser who still opposed any formof tariff revision; however by this time the Company managed to solicit Government supportwho decided that they were unable to accede to the Company’s proposal but agreed to restorethe Policy tariff US ¢ 4.7 per kWh (fixed over a decade ago), without any adjustment or
indexation for the significant cost increases in this period. Once again project commercialviability relied to a great degree on the restored tariff supplemented by CDM revenue.
iii. Geological/Civil Risk
Though high head hydropower projects are exposed to substantial civil works risk, however, unlikesuch hydropower projects the Project is exposed to considerable civil works risk on account of theexcavation and dewatering of 30 meter for powerhouse foundations where there is a potential risk of failure of dewatering due to underground geological conditions and possibility of flooding beforecompletion of the powerhouse construction. Further, the 7 KM tailrace channel has similar dewateringand side slope stability risks attached to it.
iv. Scheduling/Project Completion Risk
The development and construction schedule of New Bong Escape Hydropower Project faces barriersnot encountered by alternative thermal generation projects in Pakistan. The construction period of theProject is significantly greater than the alternative thermal projects. An extended construction periodcreates increased exposure to the adverse conditions, increased exposure to construction risks andincrease in development and financing costs. Unlike alternatives and other hydropower projects inpublic sector the Project is under obligation under the terms of the PPA to achieve COD within 39months of the construction start which keeping in view the geological/civil risk is very challenging toachieve and extended delays in COD may cause termination of the PPA thus failure of the Project.
v. Non Recourse Risk
In developing countries, it is common for project lenders to establish a security interest in the Project’sassets. Typically the security interest gives the lenders the ability to foreclose on the security andremove project assets in the event of a default on the project loan. This is a viable option for lenders insituations where capacity increments are satisfied by thermal generation units – combustion turbines orreciprocating engines are relatively easy to relocate. In the case of the Project, this obviously was not anoption - the Project assets are specifically made for the Project and are immovable, therefore the assetshave very little salvage value. In the event of a default, lender recourse is limited to either operate ornot operate the Project, or sell it as a distressed asset.

7/14/2019 Bong Escape Hydropower Project
http://slidepdf.com/reader/full/bong-escape-hydropower-project 23/60
PROJECT DESIGN DOCUMENT FORM (CDM PDD) - Version 03.1.
CDM – Executive Board page 23
This template shall not be altered. It shall be completed without modifying/adding headings or logo, format or font.
The above investment barriers have directly impacted the ability of the Company to negotiate andfinalize favourable terms and condition in the financing documents. Projects lenders, being aware of thecountry risks and project specific risks, nonetheless showed real interest in the Project. Following arethe examples of some financing terms offered and agreed by the Company which reveals the greaterrisk perception about the Project by the lenders:
The requirement of the lenders to provide cost overrun support of US$ 11 million by theshareholders which if needed by the Project will seriously damage the returns of theshareholders. This term is indicative of the high degree of Project completion risk.
Interest rate spread especially from local banks was considered higher compared with themarket. The higher pricing indicates that the lenders considered the Project to be risky andwanted to be compensated for accepting additional risks.
A date certain for the commencement of principal repayments which limits the lendersexposure to delay in project completion.
Inability of the Company to distribute dividends if there is any change in insurance plan which
shows that lenders are heavily relying on insurance arrangements to cover the risks of theProject.
Very high upfront fee charged by local lenders compared with alternative projects in Pakistandue to higher risk and longest tenure ever provided.
The risks identified above, in the absence of CDM registration, will seriously impact the financialviability of the Project. The above barriers to investment were considered by the shareholders but thebenefits of CDM participation helped to counter these concerns.
Technological barriers, inter alia:
o Skilled and/or properly trained labour to operate and maintain the technology is noteasily available. Though Pakistan has significant public sector hydropower projectsthere is a large local resource of trained manpower, however, it is very difficult torelocate experienced people from Government jobs.
Barriers due to prevailing practice, inter alia:
o The Project activity is the “first of its kind”. The project activities of this type arecurrently operational in public sector only which is altogether a different regime as faras risk perception is concerned.
Scarcity of loans as shown in item i.c, coupled with low local savings rates (i.e. lack of equity) as peritem i.d, result in lack of capital for private investments, non-availability of commercially viable tariff
as per item ii, geological/civil risks, scheduling risks and lesser security interests for lenders due todifficult relocation and heavy civil works. The above-mentioned factors explain the absence of privatehydroelectric plants in Pakistan.
Sub-step: 3b – Show that the identified barriers would not prevent the implementation of at least one
of the alternatives (except the proposed project activity)“2. If the identified barriers also affect other alternatives, explain how they are affected lessstrongly than they affect the proposed project activity. In other words, explain how the identified
7/14/2019 Bong Escape Hydropower Project
http://slidepdf.com/reader/full/bong-escape-hydropower-project 24/60
PROJECT DESIGN DOCUMENT FORM (CDM PDD) - Version 03.1.
CDM – Executive Board page 24
This template shall not be altered. It shall be completed without modifying/adding headings or logo, format or font.
barriers are not preventing the implementation of at least one of the alternatives. Any alternative thatwould be prevented by the barriers identified in Sub-step 3a is not a viable alternative, and shall beeliminated from consideration. At least one viable alternative shall be identified.”
In this section we will demonstrate that while some of the same barriers generally exist for alternative
projects, however their influence on those projects is greatly reduced and in most cases non-existent.
i. High Cost of Capital
While it is acknowledged that all infrastructure projects in Pakistan are affected by the country risk,scarce foreign direct investment and local savings, the degree of risk varies from project to project.Projects that are less capital intensive and have shorter development and construction period are lessprone to effects of such risks. Alternative projects in Pakistan are less capital intensive on per kilowattbasis (thermal projects can be set up at half the cost), and can be put into operation much more quicklythan run-of-river hydropower project, thereby, lowering their exposure to country risk.
ii. Institutional Barriers
Unlike hydropower for which tariff was non-existent/suspend for a decade, alternative thermal projectsin Pakistan had a well established tariff framework during this period. From 1994 to 2002, tariff underPower Policy 1994 was available to such thermal projects and some 15 IPPs were commissioned inPakistan during this period. From 2002 onward the Power Policy 2002 provided tariff guidelines andthe regulator, NEPRA announced upfront as well as cost-plus tariffs of around 11 alternative thermalprojects during this period. Two of these thermal projects based on combined cycle gas technologyhave already achieved financial close, with others are expected shortly. Furthermore tariff determinations by NEPRA assured the IRR of 15% for all alternative thermal projects opting for “costplus tariff”.
iii. Geological/Civil Risk
The Project is a run-of-the-river low head hydropower project constructed in the river bed with a 7-km
tailrace under the round water level. Underground flood control, diversion of existing river, de-wateringand side slop stability of tailrace is a major risk.
On the other hand, thermal projects are not exposed to any civil/geological risks and have a relativelylow content of civil woks. Such projects not only enjoy easy site access but typically present fewchallenges with regard to site topography and conformation. Civil works are largely a matter of clearingand grading.
iv. Scheduling/Project Completion Risk
The time period to develop and construct an alternative thermal project is significantly less than that
required to develop and construct a hydropower project. A typical simple cycle thermal project can bedeveloped in 3-4 years including construction, whereas a hydropower project could take 8-10 years.Consequently risk associated with time is significantly reduced. Similarly hydropower projects underpublic sector are not under obligation to complete the project in given timeframe as required for thisproject under the terms of PPA.
v. Non Recourse Risk
7/14/2019 Bong Escape Hydropower Project
http://slidepdf.com/reader/full/bong-escape-hydropower-project 25/60
PROJECT DESIGN DOCUMENT FORM (CDM PDD) - Version 03.1.
CDM – Executive Board page 25
This template shall not be altered. It shall be completed without modifying/adding headings or logo, format or font.
Alternative Thermal projects, especially the simple cycle projects provide lenders with tangible assetsthat can be pledged as security and seized and relocated in the event of default. The combustionturbine/power island represents the majority of project assets. The class of turbines typically used toprovide incremental capacity in Pakistan is relatively easy to relocate. This provides lenders with arecourse option unavailable to those who would fund a hydro project, and lowers the overall project
risk profile accordingly.
As the risk analysis amply demonstrates, the various risk-related barriers identified for hydropowerincluding the New Bong Escape Hydropower Project have much less impact on the alternative thermalplants in every case. To our knowledge, no alternative project in Pakistan has been nor should beprevented from implementation due to the barriers identified in this review. On the other hand, all theidentified risks not only have the potential to significantly impact hydropower development but haveactually and practically affected the New Bong Escape Hydropower and other hydropower Projects.
“3. In applying sub-steps 3a and 3b, provide transparent and documented evidence, and offerconservative interpretations of this documented evidence, as to how it demonstrates the existence andsignificance of the identified barriers and whether alternatives are prevented by these barriers.
Anecdotal evidence can be included, but alone is not sufficient proof of barriers. The type of evidenceto be provided should include at least one of the following:
(a) Relevant legislation, regulatory information or industry norms;
(b) Relevant (sectoral) studies or surveys (e.g. market surveys, technology studies, etc) undertaken byuniversities, research institutions, industry associations, companies, bilateral/multilateralinstitutions, etc;
(c) Relevant statistical data from national or international statistics;
(d) Documentation of relevant market data (e.g. market prices, tariffs, rules);
(e) Written documentation from the company or institution developing or implementing the CDMproject activity or the CDM project developer, such as minutes from Board meetings;
(f) correspondence, feasibility studies, financial or budgetary information, etc;
(g) Documents prepared by the project developer, contractors or project partners in the context of theproposed project activity or similar previous project implementations;
(h) Written documentation of independent expert judgments from industry, educational institutions(e.g. universities, technical schools and training centres), industry associations and others.”
Documentary Evidences:
(a) Cost of Chashma Hydropower Project is at US$ 2.4 million per MW (Source: WAPDA AnnualReport – 2000-2001)
(b) Suspension of tariff for hydel power projects mentioned in 1995 Policy and restoration of Tariff in2006.
i) Cabinet Committee on Investment decision dated 27/12/1997ii) Correspondence with WAPDA for tariff and their refusal to accept tariff iii) Memorandum of Understand between Laraib and WAPDA
7/14/2019 Bong Escape Hydropower Project
http://slidepdf.com/reader/full/bong-escape-hydropower-project 26/60
PROJECT DESIGN DOCUMENT FORM (CDM PDD) - Version 03.1.
CDM – Executive Board page 26
This template shall not be altered. It shall be completed without modifying/adding headings or logo, format or font.
iv) ECC Decision for restoration of tariff
(c) NEPRA Determinations for thermal power projects providing 15% IRR
(d) Extract of PPA to demonstrate allowed Equity IRR of 16.00%
(e) Concession Documents for thermal based Projects are available on PPIB Website while for HydelProjects these are not yet finalized. (Please refer http://www.ppib.gov.pk)
The results of conducting the Step 3, Barrier Analysis and the conclusion drawn clearly demonstratethat the New Bong Escape Hydropower Project has been and continues to be subject to barriers thathave had a material influence in the financing and overall development, construction and operation of the Project. We further believe that the alternative Thermal Projects are not affected by the samebarriers, and that the barriers have not caused an inability for them to be implemented.
“ If both Sub-steps 3a – 3b are satisfied, proceed to Step 4 (Common practice analysis)”
“ If one of the Sub-steps 3a – 3b is not satisfied, the project activity is not additional”.
STEP 4 – Common practice analysis
Sub-step 4a. Analyse other activities similar to the proposed project activity:
There are currently 14 hydropower plants despatching electricity to the national grid. All these projectsare owned by public sector. There is no private hydropower project supplying to the grid announced bythe Government for private sector development seewww.ppib.gov.pk
The Project is first ever-private hydropower Project of the country. Successful implementation of theProject has a major bearing on successful completion of the private hydropower projects followingclosely behind:
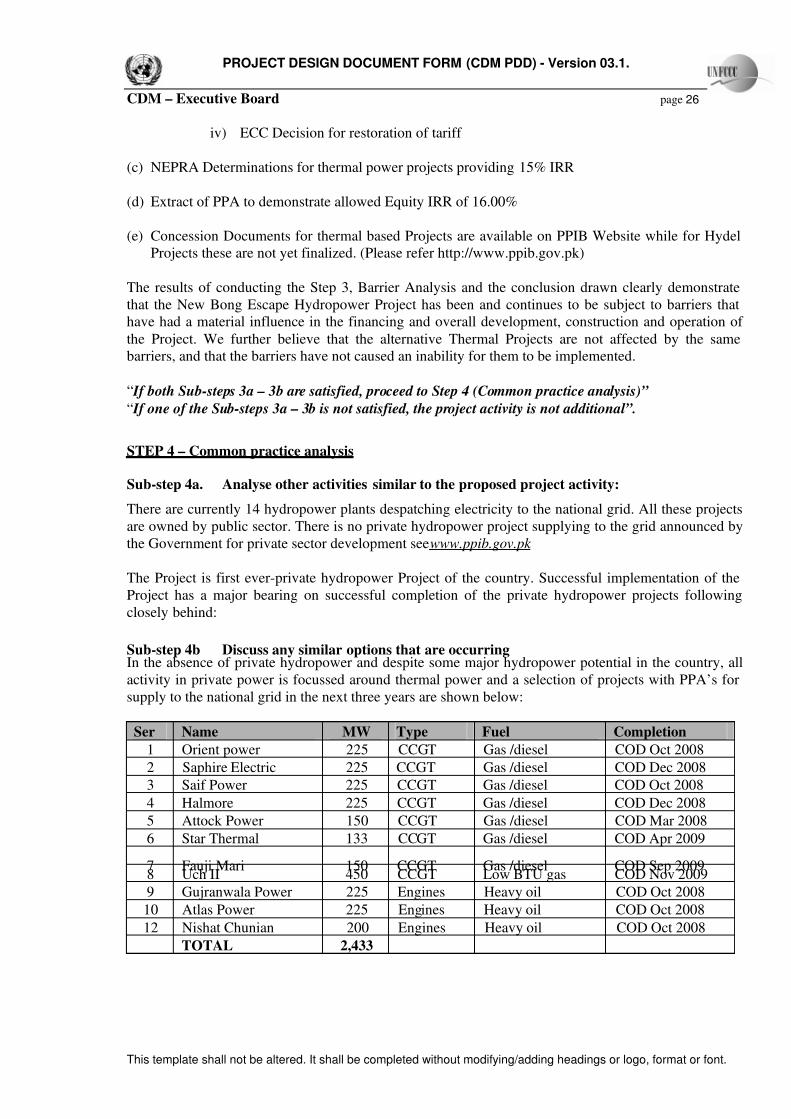
Sub-step 4b Discuss any similar options that are occurringIn the absence of private hydropower and despite some major hydropower potential in the country, allactivity in private power is focussed around thermal power and a selection of projects with PPA’s forsupply to the national grid in the next three years are shown below:
Ser Name MW Type Fuel Completion
1 Orient power 225 CCGT Gas /diesel COD Oct 2008
2 Saphire Electric 225 CCGT Gas /diesel COD Dec 2008
3 Saif Power 225 CCGT Gas /diesel COD Oct 2008
4 Halmore 225 CCGT Gas /diesel COD Dec 2008
5 Attock Power 150 CCGT Gas /diesel COD Mar 2008
6 Star Thermal 133 CCGT Gas /diesel COD Apr 2009
7 Fauji Mari 150 CCGT Gas /diesel COD Sep 20098 Uch II 450 CCGT Low BTU gas COD Nov 2009
9 Gujranwala Power 225 Engines Heavy oil COD Oct 2008
10 Atlas Power 225 Engines Heavy oil COD Oct 2008
12 Nishat Chunian 200 Engines Heavy oil COD Oct 2008
TOTAL 2,433
7/14/2019 Bong Escape Hydropower Project
http://slidepdf.com/reader/full/bong-escape-hydropower-project 27/60
PROJECT DESIGN DOCUMENT FORM (CDM PDD) - Version 03.1.
CDM – Executive Board page 27
This template shall not be altered. It shall be completed without modifying/adding headings or logo, format or font.
Recent initiatives have also addressed development of hydropower projects in the private sector,however, many of the projects are plagued with local land, resettlement, environmental and tariff issuesand are not expected to start supply to the national grid before 2011, except the New Bong EscapeHydropower Project. A summary of key projects is provided below:
Ser Name MW Policy Status Completion
1 New Bong Escape 84 1995 Under implementation COD Oct 2011
2 Kotli 96 2002 Tariff under process COD Jun 2012
3 Munda Dam 660 2002 Feasibility study under review COD Jan 2014
TOTAL 840 Note:
1. The restoration of Hydel Policy tariff and other concessions initiated and successfully achieved by Laraib
Energy Limited may benefit ser-1 above.
2. Ser-2 above is not feasible at the restored policy tariff
In addition, Projects announced and under development total some 4,700 MW and are in various stagesof implementation, however most of these projects are still in very early stages of development and will
take 6-8 years to come on stream if the complex issues relating to tariff, resettlement and a generallynegative perspective towards private hydropower are resolved.
Sub-steps 4a and 4b are satisfied. The New Bong Escape Hydropower Project activity does notrepresent common practice.
Since all of the above necessary steps are satisfied, it is demonstrated that the proposed CDM activity
is not part of the baseline scenario and, therefore, additional.
B.6. Emission reductions:
B.6.1. Explanation of methodology choices:
>>The project activities do not modify or retrofit an existing electricity generation facility. The baselinescenario is the following:
Electricity delivered to the grid by the project would have otherwise have been generated by the
operation of grid-connected power plants and by the addition of new generation sources, as reflected
in the combined margin (CM) calculations described below.
The baseline scenario is the continuing operation of the existing thermal intensive grid and futureexpansion mainly through increase in capacity of the system by the addition of new fossil fuel basedgeneration sources. In the project scenario, the same electricity demand is met with the incrementalcontribution of the Project electricity generation. Because the Project uses renewable sources toproduce electricity, there are no additional emissions from the Project activity and emissions
attributable to an equivalent thermal plant are saved.
Following the Methodology, the baseline emission factor is calculated as a combined margin (CM),consisting of the simple average of the operating margin emission factor (OM) and build marginemission factor (BM) by utilizing an ex-ante 3 years data period.
EFy= wOM * EFOM,y + wBM * EFBM,y

7/14/2019 Bong Escape Hydropower Project
http://slidepdf.com/reader/full/bong-escape-hydropower-project 28/60
PROJECT DESIGN DOCUMENT FORM (CDM PDD) - Version 03.1.
CDM – Executive Board page 28
This template shall not be altered. It shall be completed without modifying/adding headings or logo, format or font.
The default weight of the wOM and wBM are 50% (i.e. wOM = wBM =50%) and EFOM,y and EFBM,y
All margins are expressed in tCO2 /MWh.
The results show that the OM is 0.62790
The baseline emission factor is calculated using the following four steps:
STEP 1 – Calculate the Operating Margin Emission Factor (EFOM, y)
There are 4 options for calculating OM:
(a) Simple OM; or
(b) Simple adjusted OM; or
(c) Dispatch Data Analysis; or
(d) Average OM.
The methodology of choice should be Dispatch Data Analysis, however, as prescribed and allowed inthe methodology the Simple OM has been selected for the following reasons:
1. The National Transmission & Dispatch Company (NTDC) of Pakistan operates the nationaldispatch centre but detailed hourly dispatch data is not available in the public domain.
2. Low cost must run resources constitute less than 50% of the total grid generation in average of the five most recent years.
The Simple OM emission factor (EFOM,simple,y) is calculated as the generation-weighted averageemissions per electricity unit (tCO2/MWh) of all generating sources serving the system, not includinglow-operating cost and must-run power plants:
Where:
Fi,j, y is the amount of fuel i (in a mass or volume unit) consumed by relevant power sources j in year(s)y;
j refers to the power sources delivering electricity to the grid, not including low-operating cost andmust-run power plants, and including imports to the grid;

7/14/2019 Bong Escape Hydropower Project
http://slidepdf.com/reader/full/bong-escape-hydropower-project 29/60
PROJECT DESIGN DOCUMENT FORM (CDM PDD) - Version 03.1.
CDM – Executive Board page 29
This template shall not be altered. It shall be completed without modifying/adding headings or logo, format or font.
COEFi,j y is the CO2 emission coefficient of fuel i (tCO2 / mass or volume unit of the fuel), taking intoaccount the carbon content of the fuels used by relevant power sources j and the percent oxidation of the fuel in year(s) y; and
GENj,y is the electricity (MWh) delivered to the grid by source j.
The CO2 emission coefficient COEFi is obtained as
And where:
NCVi is the net calorific value (energy content) per mass or volume unit of a fuel i,
OXIDi is the oxidation factor of the fuel,
EFCO2,i is the CO2 emission factor per unit of energy of the fuel i.
The information has been utilized as follows:
The consolidated grid system generation and energy statistics (Pakistan Energy Yearbook) have beenavailable in Pakistan for several years and such reliable official data is available to compute therequired factors. Pakistan comprises two distinct grids (a) the national grid; and (b) the KarachiElectricity Supply Company (KESC) grid. Each grid has its own independent despatch centre,generation and distribution system. Though interconnected for occasional supply from the national gridto KESC which ranges from 400-600 MW, there are no material interdependencies between the twogrids. The generating plants for each grid are clearly identifiable and data for each grid is available. Byseparating KESC generation the emission factors for the national grid are broadly reduced, providing acorrect and conservative estimate of the impact of the new plant on emissions.
(a) Grid system statistics have been analyzed for five years to provide evidence for under 50% of thesystem being must run-least cost generation and justify use of the Simple OM method;
(b) Grid system statistics have been analyzed for the most recent three years to compute thefollowing:
(i) Total generation and analysis by type by fuel used;
(ii) Calorific values of the fuel based on official data duly adjusted to give LHV;
(iii) Total heat value of fuel;
(iv) Emissions and oxidation factors and computation of CEF
Based on these the analysis and official information available for the Pakistan Power System for 2003,2004 and 2005, the value for the Operating Margin Emissions Factor (OM) is 0.62790.
STEP 2 – Calculate the Build Margin Emission Factor (EFBM, y)
The BM is the generation-weighted average emission factor (tCO2/MWh) of a sample of power plantsm as follows:

7/14/2019 Bong Escape Hydropower Project
http://slidepdf.com/reader/full/bong-escape-hydropower-project 30/60
PROJECT DESIGN DOCUMENT FORM (CDM PDD) - Version 03.1.
CDM – Executive Board page 30
This template shall not be altered. It shall be completed without modifying/adding headings or logo, format or font.
The Methodology prescribes that one of two options following options may be selected with theproviso that once selected the Methodology cannot be changed during the crediting period:
(a) Option 1: EF BM, y ex ante based on the most recent information of plants already built; or
(b) Option 2: EF BM, y updated annually in the first crediting period for actual projectemissions and associated emissions reductions and ex-ante thereafter.
Option 1, EF BM, y ex ante, has been selected.
The sample group m consists of the higher in terms of generation of:
(i) The five power plants that have been built most recently; or
(ii) The power plant capacity additions in the electricity system that comprise 20% of the systemgeneration (MWh) and that have been built most recently.
To determine sample group m the five most recent additions to the system were compared with theadditions to the electricity system that comprise 20% of the system generation and that have been builtmost recently. It was found that the power plant capacity additions in the electricity system thatcomprise 20% of the system generation and that have been built most recently provided the largerannual generation and were therefore selected as the prescribed method as stipulated in theMethodology.
In determining 20% of the capacity in terms of generation (MWh) of the most recent plants built thequery submission by DNV and recommendation of the Meth Panel dated 11/01/2006- 03/02/2006 hasbeen considered and used as follows “If 20% falls on part capacity of a plant, that plant is fullyincluded in the calculation”
The methodology results are as follows:
(a) The five power plants that have been built most recently contribute 12,231,000 MWh to the grid;
(b) The most recent published total electricity generation in 2005 was 74,413,000 MWh and 20% of
system generation comes to 14,883,000 MWh.
Thus (b) above would be selected and the Build Margin emission factor would be computed based onthe sample of the power plants capacity additions in the electricity system that comprises 20% of thesystem generation (in MWh) and that have been built most recently.
The calculations show that the BM is 0.30397
It may be noted that the BM is effected by a large hydropower project, which took over 10 years tocomplete but came on stream during the Methodology computation period.
STEP 3 – Calculate the Baseline Emission Factor (EFy)
The Baseline Emission Factor is the weighted average of the OM emission factor (EFOM, y) and the BM
Emission Factor (EFBM, y).
EFy= wOM * EFOM,y + wBM * EFBM,y

7/14/2019 Bong Escape Hydropower Project
http://slidepdf.com/reader/full/bong-escape-hydropower-project 31/60
PROJECT DESIGN DOCUMENT FORM (CDM PDD) - Version 03.1.
CDM – Executive Board page 31
This template shall not be altered. It shall be completed without modifying/adding headings or logo, format or font.
The default weight of the wOM and wBM are 50% (i.e. wOM = wBM =50%) and EFOM,y and EFBM,y are
calculated in Steps 1 and 2 above and are expressed in tCO2 /MWh.
It is proposed to use the default weights as there appears little justification to use alternative weightsafter a study of the (i) timing of project output; (b) predictability of project output; or (c) suppresseddemand.
Thus the default weights will be used will be wOM = 0.50 and wBM = 0.50
The baseline emissions factor EFy= wOM * EFOM,y + wBM * EFBM,y c is determined as follows:
= (0.5 * 0.62790) + (0.5 * 0.30397) =0.46593 tCO2 / MWh.
B.6.2. Data and parameters that are available at validation:
>>
Data / Parameter: Fi,j,y
Data unit: Metric tons for oil; mmcft for gasDescription: Amount of fuelSource of data used: Pakistan Energy Yearbook, Ministry of Minerals & Natural ResourcesValue applied: Values used for 2005,2004 & 2003 (See Annex 3)Justification of the choiceof data or description of measurement methods andprocedures actuallyapplied :
The Methodology requires use of published/official data; the required data hasbeen extracted and collated from such official sources;.
Any comment: None
Data / Parameter: NCViData unit: GJDescription: Net calorific value of the fuel; per ton/per mmcft Source of data used: Pakistan Energy Yearbook, Ministry of Minerals & Natural ResourcesValue applied: Gas: 930.51 (gross 1033.9 × 90%)
Furnace Oil: 40.85 (gross 43.0 × 95%)Diesel: 44.18 (gross 46.5 × 95%)Coal: 27.75 (gross 29.1 × 95%)
Source: Pakistan Energy Yearbook
Justification of the choiceof data or description of
measurement methods andprocedures actuallyapplied :
The Methodology requires use of published/official data; the required data hasbeen extracted and collated from such official sources;.
Any comment: None
Data / Parameter: GENj,y
Data unit: MWh
Description: Electricity generated

7/14/2019 Bong Escape Hydropower Project
http://slidepdf.com/reader/full/bong-escape-hydropower-project 32/60
PROJECT DESIGN DOCUMENT FORM (CDM PDD) - Version 03.1.
CDM – Executive Board page 32
This template shall not be altered. It shall be completed without modifying/adding headings or logo, format or font.
Source of data used: Pakistan Energy Yearbook, Ministry of Minerals & Natural Resources
Value applied: Values used for 2005,2004 & 2003 (See Annex 3)Justification of the choiceof data or description of measurement methods and
procedures actuallyapplied :
The Methodology requires use of published/official data; the required data hasbeen extracted and collated from such official sources;.
Any comment: None
Data / Parameter: COEFi,j y Data unit: tCO2
Description: Carbon Emission coefficient for each type of fuel
Source of data used: IPCC default valuesValue applied: Gas: 15.3
Furnace Oil: 21.1Diesel: 20.2Coal: 25.8
Justification of the choiceof data or description of measurement methods andprocedures actuallyapplied :
IPCC default values have been used as no reliable national values are available
Any comment: None
Data / Parameter: OXIDi
Data unit: ConstantDescription: Oxidation factor of the fuel Source of data used: IPCC default valuesValue applied: Gas: 0.995
Oil: 0.99Diesel: 0.99Coal: 0.98
Justification of the choiceof data or description of measurement methods andprocedures actuallyapplied :
IPCC default values have been used as no reliable national values are available
Any comment: None
B.6.3. Ex-ante calculation of emission reductions:
>>
The project activity reduces carbon dioxide through substitution of grid electricity, based on fossil fired
power plants, with renewable electricity. The emission reduction ERy by the project activity during a
given year y is the difference between the baseline emissions (BEy), project emissions (PE y) and
emissions due to leakage (Ly) as follows:
ERy = BE y - PE y - L y
For the project activity PEy and L y = 0 and ERy the emissions reduction is equal to BEy in tCO2

7/14/2019 Bong Escape Hydropower Project
http://slidepdf.com/reader/full/bong-escape-hydropower-project 33/60
PROJECT DESIGN DOCUMENT FORM (CDM PDD) - Version 03.1.
CDM – Executive Board page 33
This template shall not be altered. It shall be completed without modifying/adding headings or logo, format or font.
As computed in the preceding section the combined margin EFy= wOM * EFOM,y + wBM * EFBM,y is EFy=(0.5 * 0.62790) +( 0.5 * 0.30397)=0.46593 CO2 / MWh.
The electricity supplied by the project activity to the grid EGy in MWh and the emissions reductions
can be measured as ERy (tCO2) = EFy * EG y .
Thus ERy = 0.46593 * 470,000 = 218,988 tCO2
B.6.4. Summary of the ex-ante estimation of emission reductions:
>>
Year Estimation
of
project
activity
emissions (tonnes of
CO2e)
Estimation of
baseline emissions
(tonnes of CO2e)
Estimation
of
leakage
(tonnes of
CO2e)
Estimation of
overall emission
reductions (tonnes of CO2e)
(Period/Year ended
June 30)
2010-2011(01/10/2010 to30/06/2011) – 9 months
0 164,241 0 164,241
2011-2012 0 218,988 0 218,988
2012-2013 0 218,988 0 218,988
2013-2014 0 218,988 0 218,988
2014-2015 0 218,988 0 218,988
2015-2016 0 218,988 0 218,988
2016-2017 0 218,988 0 218,9882017-2018(01/07/2017 to30/09/2017) – 3 months (1st crediting period)
0 54,747 0 54,747
Total (tonnes of
CO2e)
0 1,532,916 0 1,532,916
Note:Split-years are computed on a pro-rata basis with annual CER’s.
B.7. Application of the monitoring methodology and description of the monitoring plan:
>>
B.7.1. Data and parameters monitored:
>>A) Monitoring of project activity

7/14/2019 Bong Escape Hydropower Project
http://slidepdf.com/reader/full/bong-escape-hydropower-project 34/60
PROJECT DESIGN DOCUMENT FORM (CDM PDD) - Version 03.1.
CDM – Executive Board page 34
This template shall not be altered. It shall be completed without modifying/adding headings or logo, format or font.
Generation:
Data / Parameter: EG y Data unit: GWhDescription: Electricity delivered by the project activity to the national grid under
the power purchase agreement (PPA).Source of data to be used: (a) Measured by the metering system in accordance with a transparent
and strict procedure as agreed in the PPA; (b) confirmed by officiallypublished generation data provided in the Pakistan Energy Yearbook;and (c) direct confirmation form the power purchaser.
Value of data applied for thepurpose of calculating expectedemission reductions inSection B.5
The annual generation of the hydropower complex of 470,000 MWh isthe basis for computation of emissions through application of theCombined Margin. The given generation is based on average historichydrology agreed with the power purchaser; the estimate of hydrologyand generation may be subject to year to year variation but is expectedto equal the historic average hydrology/generation over the term.
Description of measurement
methods and procedures to beapplied:
All requirements for metering will be in accordance with the PPA and
a summary extracted from the PPA is as follows:1) There will be installed a metering system and a back-up metering
system; in addition there will be magnetic media and a sequentialevent recorder;
2) Testing of the metering system will be part of the complexcommissioning procedures;
3) Inaccuracy of the metering system to be not greater than 0.2%;4) Joint sealing of metering system after any inspection/examination;5) Reading and recording thereof at the beginning of each day;6) Joint reading with power purchaser’s representative on the last
business day of each month.
QA/QC procedures to beapplied:
In accordance with QA/QC procedures:
1) The metering system and the back-up metering system will beunder continuous surveillance and in the event of greater thanspecified inaccuracy recalibration is specified;
2) Seals will be checked regularly3) Cross checking between the different metering system.
Any comment: Meter tampering is a company event of default and may lead totermination by the power purchaser
B) Monitoring of Baseline Emissions and supporting data/computations
The baseline methodology once selected cannot be changed during the crediting period accordingly
there is no requirement to further compute or monitor any of the baseline data or computations.
C) Monitoring of Sustainable Development Indicators
The CDM directorate as narrated in Serial B.7.2 below will function to monitor the sustainabledevelopment benefits as indicated in this document for the project. Standard procedures developed anddesigned to carry out the monitoring of sustainable development and its verification by the DNA are asfollows:

7/14/2019 Bong Escape Hydropower Project
http://slidepdf.com/reader/full/bong-escape-hydropower-project 35/60
PROJECT DESIGN DOCUMENT FORM (CDM PDD) - Version 03.1.
CDM – Executive Board page 35
This template shall not be altered. It shall be completed without modifying/adding headings or logo, format or font.
The CDM directorate will compare the project’s actual sustainable development performance asmeasured by the indicators in the Table C.1 with the set target values and determine whether the targetshave been achieved.
As long as the monitoring process shows that the project’s performance meets these targets, the projectis considered to be in compliance with sustainable development objectives.
Table C.1: Monitoring Requirements for Sustainable Development Indicators
Performance
Indicators/Criteria
Objective Acceptable Monitoring
Procedure (Reports)
Job Creation Incremental number of jobs atthe project
Monitoring of monthlyemployment records of theproject.
Comparison of unemployment
ratio of the project area afterand before the construction of project
Income Generation Incremental wage increasecompared to alternativeopportunities available
- Regular monitoring of average monthly wages of theproject workers comparedwith alternatives.
- Follow up record foraverage annual employment(days/year)
Business Opportunities Incremental income for thelocal small traders providinggoods and services around theproject site area
- Monitoring of procurementrecords of the project.
- Feed-back meetings with thelocal suppliers and traders.
Technical know-how for thenew technology
Participation in conference,symposium, events to presentthe best available technologyfor run-of-the-riverhydropower projectsconstruction and operation
- Number of conferences,symposium and events.
- Number of participants tomake maximum use of suchconferences, symposiums andevents.
Improvement of Skills forlocal Inhabitants
Incremental jobs for localinhabitants
Monthly review of humanresource data.
Medical Clinic Better health facilities for thelocal inhabitants
- Monitoring of monthly visitrecord of patients and patientmonths.
- Feed-back meetings with thelocal inhabitants
Improvement of existing localSchool Facility
Better Schooling in thelocality
- Monthly review of performance.
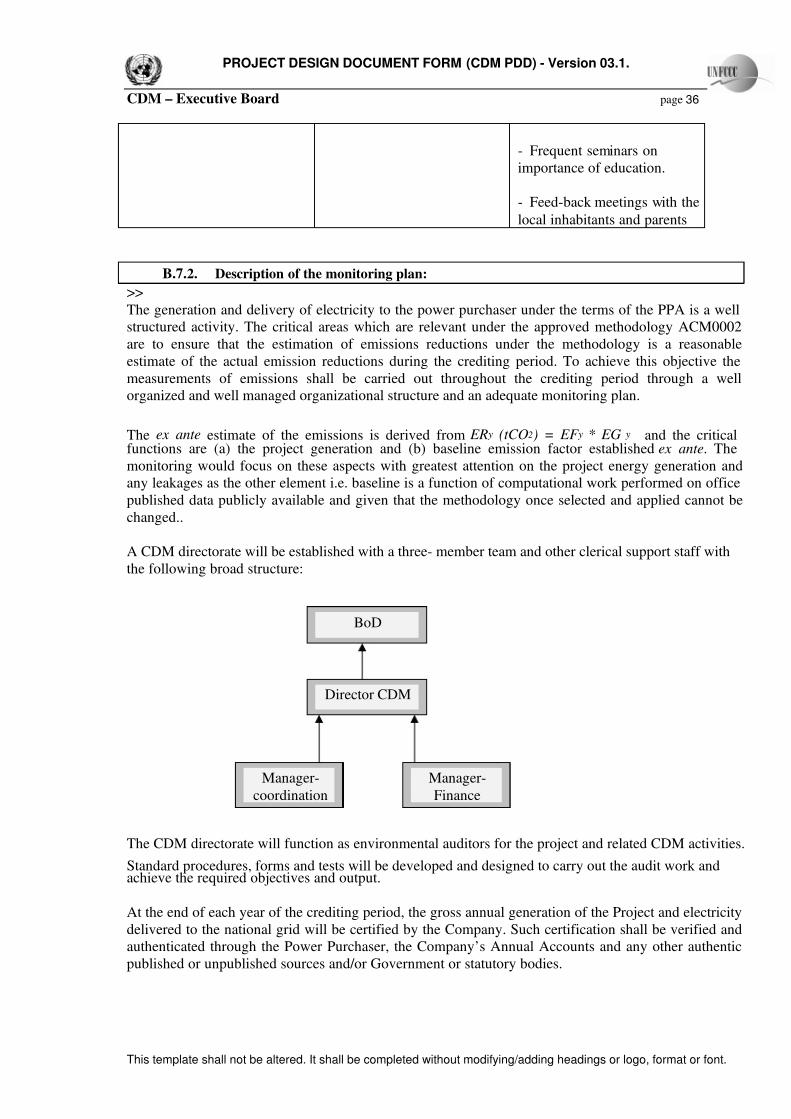
7/14/2019 Bong Escape Hydropower Project
http://slidepdf.com/reader/full/bong-escape-hydropower-project 36/60
PROJECT DESIGN DOCUMENT FORM (CDM PDD) - Version 03.1.
CDM – Executive Board page 36
This template shall not be altered. It shall be completed without modifying/adding headings or logo, format or font.
- Frequent seminars onimportance of education.
- Feed-back meetings with the
local inhabitants and parents
B.7.2. Description of the monitoring plan:
>>The generation and delivery of electricity to the power purchaser under the terms of the PPA is a wellstructured activity. The critical areas which are relevant under the approved methodology ACM0002are to ensure that the estimation of emissions reductions under the methodology is a reasonableestimate of the actual emission reductions during the crediting period. To achieve this objective themeasurements of emissions shall be carried out throughout the crediting period through a wellorganized and well managed organizational structure and an adequate monitoring plan.
The ex ante estimate of the emissions is derived from ER y (tCO2) = EF y * EG y and the criticalfunctions are (a) the project generation and (b) baseline emission factor established ex ante. Themonitoring would focus on these aspects with greatest attention on the project energy generation andany leakages as the other element i.e. baseline is a function of computational work performed on officepublished data publicly available and given that the methodology once selected and applied cannot bechanged..
A CDM directorate will be established with a three- member team and other clerical support staff withthe following broad structure:
The CDM directorate will function as environmental auditors for the project and related CDM activities.
Standard procedures, forms and tests will be developed and designed to carry out the audit work andachieve the required objectives and output.
At the end of each year of the crediting period, the gross annual generation of the Project and electricitydelivered to the national grid will be certified by the Company. Such certification shall be verified andauthenticated through the Power Purchaser, the Company’s Annual Accounts and any other authenticpublished or unpublished sources and/or Government or statutory bodies.
Director CDM
Manager-Finance
Manager-coordination
BoD

7/14/2019 Bong Escape Hydropower Project
http://slidepdf.com/reader/full/bong-escape-hydropower-project 37/60
PROJECT DESIGN DOCUMENT FORM (CDM PDD) - Version 03.1.
CDM – Executive Board page 37
This template shall not be altered. It shall be completed without modifying/adding headings or logo, format or font.
Such information shall be used to compute the Avoided emissions of CO2 by the Project, using theCombined Margin and Project’s actual generation for the year, applying the formulae and methodologyas described in section B.2.1 of this PDD.
The project is a run-of-the-river hydropower project with well defined project ‘boundaries’, withoutany significant ‘leakage’ and with a good quality of official published data relating to generation andfuel consumption covering all projects in the national grid. The baseline will be subject to revalidationfor each crediting period based on such reliable data. The only critical task is the independent andreliable verification of project metering and generation and for hydropower projects this is a relativelysimple task. It is considered that no special training for such monitoring would be required;professionals either with a finance or management background are considered to be of sufficient calibreto undertake this basic task which would be dealt with as normal procedures and operations within theproject management plans.
Procedures and preparedness for dealing with emergencies which could cause unintended emissions aremost relevant and significant for CDM projects dealing with thermal/combustion technologies e.g.condensate flare gas generation, agricultural waste based generation, methane recovery and
combustion, landfill gas based generation etc. The hydropower project is a run-of-the river low headscheme. The horizontal Kaplan turbines operate at a lazy speed of 100 rpm compared with gas turbinesworking at a speed in several thousand rpm. Other than minor accidental fire in an office environmentwhich may result in insignificant unintended emissions it is not envisaged that any of the emergenciesenvisaged for a hydropower project of this type would entail emergencies that would or could result inemissions. The emergencies that effect hydropower projects (but without any associated emission) areadequately covered in the PPA under ‘Emergency Set-up and Curtailment Plans’ which specifies thatthe Company shall cooperate with the power purchaser in developing ‘emergency procedures for thecomplex’ including without limitation ‘recovery from local or widespread electrical blackout andvoltage reduction in order to effect load curtailment’. In addition responsibility has been allocated tothe O&M operator to develop emergency procedures under Section 4.7 and 4.10 of the O&M contract.
The data monitored and required for verification and issuance will be archived and maintained for twoyears after the end of the crediting period or the last issuance of CERs for this project activity,whichever occurs later.
The CDM directorate will also function to monitor the sustainable development benefits as indicated inthis document for the project.
B.8. Date of completion of the application of the baseline study and monitoring methodology and
the name of the responsible person(s)/entity(ies)
>>
Date of completion of the application of the methodology to the projectactivity study:
31/10/2006
Name of responsible person:
Organization Environmental Solutions (Pvt.) Limited
Street/P.O.Box: G8-Markaz
Building: 12-B/1
City: Islamabad
State/Region: Islamabad

7/14/2019 Bong Escape Hydropower Project
http://slidepdf.com/reader/full/bong-escape-hydropower-project 38/60
PROJECT DESIGN DOCUMENT FORM (CDM PDD) - Version 03.1.
CDM – Executive Board page 38
This template shall not be altered. It shall be completed without modifying/adding headings or logo, format or font.
Postfix/ZIP: 44000
Country: Pakistan
Telephone: 0092-03005001633
FAX: 0092 2854795
E-Mail: [email protected] URL: N/A
Represented by Mr. Sultan Ahmad
Title: Senior Consultant
Salutation: N/A
Last Name: Ahmad
Middle Name: N/A
First Name: Sultan
Department: CDM
Mobile: 0092 3005001633
Direct FAX: 0092 512854795
Direct tel: 0092 512251932
Personal E-Mail: [email protected]
The person(s)/entity(ies) responsible for the application of the baseline and monitoring methodology to theproject activity is not a project participant

7/14/2019 Bong Escape Hydropower Project
http://slidepdf.com/reader/full/bong-escape-hydropower-project 39/60
PROJECT DESIGN DOCUMENT FORM (CDM PDD) - Version 03.1.
CDM – Executive Board page 39
This template shall not be altered. It shall be completed without modifying/adding headings or logo, format or font.
SECTION C. Duration of the project activity / Crediting period
C.1 Duration of the project activity:
C.1.1. Starting date of the project activity: >>30/06/2007 (Execution of Finance Documents)
C.1.2. Expected operational lifetime of the project activity:
>>The term of 25 years as agreed and incorporated in the power purchase agreement.,
C.2 Choice of the crediting period and related information:
>>
C.2.1. Renewable crediting period
>>
C.2.1.1. Starting date of the first crediting period:
>>
01/10/2010
C.2.1.2. Length of the first crediting period:
>>
Seven (7) years
C.2.2. Fixed crediting period:
>>
Not applicable
C.2.2.1. Starting date:
>>Not applicable
C.2.2.2. Length:
>>Not applicable
SECTION D. Environmental impacts
D.1. Documentation on the analysis of the environmental impacts, including transboundary
impacts:
>>Key extracts from Summary Initial Environmental Assessment (IEE) approved by the ADB are asfollows:
I. Introduction

7/14/2019 Bong Escape Hydropower Project
http://slidepdf.com/reader/full/bong-escape-hydropower-project 40/60
PROJECT DESIGN DOCUMENT FORM (CDM PDD) - Version 03.1.
CDM – Executive Board page 40
This template shall not be altered. It shall be completed without modifying/adding headings or logo, format or font.
The Project is classified as category B. There are no people residing in the Project site and there are noindigenous peoples in the surrounding area. Therefore, relocation and indigenous people developmentare not issues. An IEE was carried out by the Project Sponsor during October-November 2004 to updateand reconfirm the previous findings on the environmental and social soundness of the Project and asummary IEE was prepared as a stand-alone document for public disclosure.
II. Description of the Environment
2.1 Natural Environment
The Project site is vacant land with shrubs and few trees and no archaeological sites, graveyards ormosques. The Project area is a part of the Jhelum valley and is in an active seismic area. Consequently,the earthquake return period of 1,000 years will be adopted in the design of the powerhouse and majorProject facilities.
The Jhelum River is the principal water resource in the Project area with a mean annual flow of about28,371 million cubic meters. Its flow is perennial and is characterized by a great fluctuation in its
discharge, with large flows during monsoons. The Jhelum River drains into the Mangla Dam Reservoir.The water in the reservoir is used to generate electricity in the Mangla Power House with a totalgeneration capacity of 1,000 MW. The water from the Mangla Dam Power House is discharged into atailrace channel, a man-made canal named Bong Canal. Part of the flows of the Bong Canal are fed intothe Upper Jhelum Canal to meet irrigation requirements and the remaining flow is discharged into theJhelum River through a man-made structure named the New Bong Escape.
During low flows, the Jhelum River downstream of the Mangla Dam meanders in several channelsthrough a very broad flood plain, several kilometers wide in some locations. The Jhelum Riverfloodplain adjacent to the Project site is more than 1,800 m in width. One of the channels of the JhelumRiver, adjacent to the Project site, called the Hari Channel, will be used as tailrace channel. Thischannel represents only a very small portion of the entire broad floodplain.
As the Project area is not densely populated and has no major industries, ambient air quality and waterquality in the Jhelum River are still high.
The Project area has no ecological or biologically sensitive areas as it has been subjected to humaninterventions for decades. Because of the degraded habitat conditions of the Project site and itssurroundings do not support any flora and faunal resources of ecological or economic significance.
2.2 Socioeconomic Environment
There are 21 communities within a 5 km radius of the Project site. Only two communities, Lehri andFerozabad, adjacent to the Project site could be impacted by the Project. Some families in these twovillages use parts of the Project site without authorization from GOAJK, for fodder cultivation and
animal grazing. The Project will need to discontinue their use of the Project site.
Lehri village has about 150 households, of which around a dozen households are involved inunauthorized use of parts of the Project site. An overwhelming majority of the households arefinancially supported by relatives living in foreign countries, especially the United Kingdom. Localtrade and government and private employment is their secondary source of income. Agriculture andlivestock are fringe economic activities, practiced at a level that is less than even self-subsistence.

7/14/2019 Bong Escape Hydropower Project
http://slidepdf.com/reader/full/bong-escape-hydropower-project 41/60
PROJECT DESIGN DOCUMENT FORM (CDM PDD) - Version 03.1.
CDM – Executive Board page 41
This template shall not be altered. It shall be completed without modifying/adding headings or logo, format or font.
Ferozabad village has only about 12 houses occupied by one extended local family and some smallfamilies which have come to the area after being displaced due to conflict in their native northeasternAJK. The primary source of livelihood for these families is employment in the government and privatesectors. Agriculture is a secondary economic activity. Young men from a couple of families areworking abroad and remit money from there.
The social infrastructure and public amenities in the two villages are poor as evidenced by unpavedroads and no schools or clinics. The Project intends to assist in improving social infrastructure andpublic amenities in these two villages.
III. Forecasting Environmental Impacts and Mitigation Measures
Impacts during Construction
The construction of Project facilities will invariably create environmental disturbances and impacts.But these environmental disturbances and impacts will be transient and will have no adverse ecologicalconsequences as the Project site is small and has no flora or fauna species of ecological importance.
Mitigation measures including physical measures and good environmental management practices willbe included in the EPC contract to ensure that the design and construction will minimize suchenvironmental problems as disposal of excavated materials, soil erosion and degradation, fugitive dust,noise, safety and public health hazards, waste disposal, water turbidity of the Jhelum River during theexcavation of the Hari Channel, and blocked access to houses and communal facilities.
In addition, the Project Sponsors will pay compensation to those families who have to discontinue theirunauthorized use of land in the Project site.
The Project will not induce population influx since there is a general trend of out-migration in the areato larger towns and cities. During the detailed design, the Project Sponsors will consult with the localadministration for advanced planning to ensure minimum adverse impacts from any population influx.
Although the Project will not have significant adverse social impacts, the Project Sponsors intend tohelp in building social facilities in collaboration with the local agencies concerned.
Impacts during Operation
The Project will have no adverse environmental and social impacts during the operation phase as it willnot affect water availability in the Upper Jhelum Canal, and will not reduce the flows in the JhelumRiver downstream of the New and Old Bong Escapes. However, after Project completion the NewBong Escape channel will receive water only in case of the shutdown of the Project powerhouse. This1,200 m man-made channel has no ecological significance, and is not used by the local communities.Therefore, its drying up will not have any significant environmental or social impacts.
To ensure harmony of the Project with the environment the Project Sponsor will implement soundenvironmental management practices to effectively handle the basic environmental issues, including:
• Waste management of residential complex and offices, particularly sewage treatment to the
required standard and reuse of the treated effluents for gardening.
• Waste management of warehouse, workshops and motor pools
• Landscaping and plantation

7/14/2019 Bong Escape Hydropower Project
http://slidepdf.com/reader/full/bong-escape-hydropower-project 42/60
PROJECT DESIGN DOCUMENT FORM (CDM PDD) - Version 03.1.
CDM – Executive Board page 42
This template shall not be altered. It shall be completed without modifying/adding headings or logo, format or font.
• Environmentally responsible conduct of personnel, such as hunting and tree cutting
• Noise and other public nuisance abatement.
The above practices and conducts will be institutionalized in the environmental management system of
the Company.
IV. Institutional Requirements and Environmental Management Plan
Environmental Management Plan
A Project environmental management plan (EMP) was formulated and it clearly defines organizationalstructure, roles and responsibilities of the various entities concerned, an impact mitigation plan, anenvironmental monitoring plan, communication and documentation, and environmental training. TheEMP was prepared for both the construction phase and the operational phase.
As the mitigation measures are part of the construction, their costs are included in the contract cost andrepresent a small part of the Project cost. The cost of sewage treatment facilities for 50 operating
personnel is also low compared to the cost of houses.
The Project Sponsors will assume the overall responsibility for compliance with environmental andsocial management requirements of the provincial government and the lenders. The EPC contractor willassume the overall responsibility for environmental performance of all the subcontractors, i.e. to ensurethat the subcontractors will effectively implement all environmental management measures stipulated inthe EMP and in the contracts. The Project Manager, representing the Project Sponsors, will dischargethe Project company’s environmental and social responsibility as part of the Project implementationmanagement. Director CDM will assist the Project Manager and provide policy support on allenvironmentally and socially-related matters. The Company will coordinate with relevant governmentdepartments and other stakeholders through its ESI.
The EPC contractor will appoint an environmental and social supervisor (ESS) to assist its ProjectManager in overseeing and monitoring environmental performance of all the subcontractors. Eachsubcontractor will appoint an environmental and social officer (ESO) to assist its resident engineer inimplementing EMP specific to its contract.
The mitigation plan for the construction phase is prepared and presented in the IEE. It contains:
• A comprehensive listing of mitigation measures (actions)
• The person(s) responsible for ensuring the full implementation of the action
• The persons responsible for monitoring the action
• A timescale for the implementation of the action to ensure that the objectives of mitigation
are fully met.
The identified mitigation measures will be translated into environmental requirements andspecifications for the detailed design and construction, with legal binding effect.
Environmental and social management tasks during the operational phase will be minimal and becomeroutine activities as part of the overall management of the powerhouse. Management of wastes fromresidential quarters and offices will be the only main task.
7/14/2019 Bong Escape Hydropower Project
http://slidepdf.com/reader/full/bong-escape-hydropower-project 43/60
PROJECT DESIGN DOCUMENT FORM (CDM PDD) - Version 03.1.
CDM – Executive Board page 43
This template shall not be altered. It shall be completed without modifying/adding headings or logo, format or font.
Monitoring Plan
During the construction phase, environmental performance of all subcontractors will be closelymonitored by the EPC contractor under the oversight of the Project Sponsor. The monitoring will coverboth compliance monitoring and effects monitoring in line with the requirements in the mitigation plan
focusing on soil erosion, water quality, air quality, noise, and socioeconomic aspects. A detailedmonitoring plan will be developed during the detailed design phase of the Project, when specificinformation on field activities will be known. The monitoring schedule will be linked to theconstruction schedule.
An effective mechanism for storing and communicating environmental information will be established.The data and information will be systematically filed and stored in a central location. Periodic meetingswill be held involving all parties concerned, to review the results of implementation of the EMP andmonitoring results, and resolve any identified problems. The EPC contractor will produce periodicmonitoring and evaluation reports. At the end of the construction phase, the EPC contractor willprepare a final monitoring and evaluation report to be a part of a Project completion report.
In addition, the EPC contractor will establish at the Project site a social complaint register to documentall complaints received from local communities. The register will also record the measures taken tomitigate these concerns. All community complaints received will be sent to the Company’s DirectorCDM and Project Manager for their information and further action.
The EPC contractor will provide training to the Project Sponsor staff, the sub contractors, and otherstaff engaged for the Project. The training will cover the requirements of the IEE and the EMP, withspecial emphasis on sensitizing the Project staff to the environmental and social aspects of the Project.A training program will be prepared before the commencement of the Project during the detailed designphase.
V. Findings, Conclusions and Recommendations
The IEE findings confirm that the Project, being a run-of the river hydropower project, is unlikely tocause any significant, lasting environmental and social impacts. Environmental disturbances normallyassociated with construction activities will be minimized through implementation of the EMP and closemonitoring of the EMP implementation. Sound environmental management practices and effectivemitigation measures will be prescribed as part of the EPC contract for detailed design and construction.
It is concluded that the IEE is adequate to justify environmental and social clearance of the Project. It isrecommended that the IEE is considered adequate for environmental and social assessment of theProject.
D.2. If environmental impacts are considered significant by the project participants or the
host Party, please provide conclusions and all references to support documentation of an
environmental impact assessment undertaken in accordance with the procedures as required bythe host Party:
>>As mentioned above the IEE found that the project, being a run of the river hydropower project, isunlikely to cause any significant, lasting environmental and social impacts. The conclusion of the IEEwas “It is concluded that the IEE is adequate to justify environmental and social clearance of theproject. There is no need for further analysis and the environmental and social justification for theproject is complete”

7/14/2019 Bong Escape Hydropower Project
http://slidepdf.com/reader/full/bong-escape-hydropower-project 44/60
PROJECT DESIGN DOCUMENT FORM (CDM PDD) - Version 03.1.
CDM – Executive Board page 44
This template shall not be altered. It shall be completed without modifying/adding headings or logo, format or font.
The environmental NOC has however requires that (a) proper disposal arrangements should be madefor sewerage disposal from the housing colony; (b) all design changes should be intimated; and (c)while the IEE requires (i) the development of an environment management plan; (ii) development of acompensation plan for villagers; (iii) environmental policy; and (iv) environmental stipulations for the
EPC Contractor
SECTION E. Stakeholders’ comments
>>
E.1. Brief description how comments by local stakeholders have been invited and compiled:
>>
Extracts from the Initial Environmental Examination:
VI Public Consultation and Information Disclosure
A Consultations with representatives of Government Agencies Concerned
A consultation was held on 30/10/2004 with representatives of government agencies, includingWAPDA, the Irrigation Department of the Government of Punjab, and the revenue department of theGovernment of AJ&K. All the representatives expressed their support for the project and theirwillingness to cooperate.
B Consultations with Villagers of the Two Communities
Two rounds of public consultation were held with villagers in the two adjacent communities.
E.2. Summary of the comments received: >>
A summary of the comments extracted from the IEE is shown below:
1. Ferozabad
In Ferozabad, house to house visits were carried out. On 01/11/ 2004, the public consultation teamvisited seven houses whose residents had been using the project site. The team explained the projectlayout, scope and requirements as well as the impacts, particularly on the unauthorized grazing andoccasional cultivation on the project site practiced by some families. The villager’s reactions weresought in a semi-structured discussion and they showed no concerns about environmental disturbances.It was noted that villagers had had similar experiences with much larger projects in the past. Theaffected households expressed their willingness to discontinue their unauthorized use of the project
land, but they said that they would expect some compensation.
2 Lehri
A group consultation was held on 02/11/ 2004 with representatives of the houses situated in the upperreaches of the western bank of the New Bong Escape. About 16 household representativesparticipated. The results were similar to those of Ferozabad.
7/14/2019 Bong Escape Hydropower Project
http://slidepdf.com/reader/full/bong-escape-hydropower-project 45/60
PROJECT DESIGN DOCUMENT FORM (CDM PDD) - Version 03.1.
CDM – Executive Board page 45
This template shall not be altered. It shall be completed without modifying/adding headings or logo, format or font.
Following consultation it was concluded that the project would have no significant social impacts. Theextent of unauthorized cultivation and grazing did not significantly contribute to the income of theresidents of the Lehri and Ferozabad villages. The grazing activity could be conveniently moved toadjacent areas.
Details of the IEE were posted on the ADB web site, in October 2005 over a year ago, and have notinvited any negative comments.
E.3. Report on how due account was taken of any comments received:
>>
No negative comments were received; however, the company has committed the following:
• to modernize/expand the local school and clinic;
• to build a new recreational facility and park;
• to compensate any effected persons who were traditional users of government land;
•
to compensate any persons for any standing crops;• to arrange the construction activities to minimize and mitigate negative impact.

7/14/2019 Bong Escape Hydropower Project
http://slidepdf.com/reader/full/bong-escape-hydropower-project 46/60
PROJECT DESIGN DOCUMENT FORM (CDM PDD) - Version 03.1.
CDM – Executive Board page 46
This template shall not be altered. It shall be completed without modifying/adding headings or logo, format or font.
ANNEX 1
CONTACT INFORMATION ON PARTICIPANTS IN THE PROJECT ACTIVITY
Organization: Laraib Energy Limited
Street/P.O.Box: G8 Markaz
Building: B/1
City: Islamabad
State/Region: Federal capital city Islamabad
Postfix/ZIP: -
Country: Pakistan
Telephone: 00 92 51 2255431/2
FAX: 00 92 51 2251485
E-Mail: [email protected]
URL: www.laraibenergy.com
Represented by: Khalid Faizi
Title: Chief executive officer
Salutation: -
Last Name: Faizi
Middle Name: -
First Name: Khalid
Department: -
Mobile: 00923005001633
Direct FAX: -
Direct tel: 0092 2251463
Personal E-Mail: [email protected]

7/14/2019 Bong Escape Hydropower Project
http://slidepdf.com/reader/full/bong-escape-hydropower-project 47/60
PROJECT DESIGN DOCUMENT FORM (CDM PDD) - Version 03.1.
CDM – Executive Board page 47
This template shall not be altered. It shall be completed without modifying/adding headings or logo, format or font.
ANNEX 2
INFORMATION REGARDING PUBLIC FUNDING
>>
There is no public funding involved in financing of the Project; and no Official DevelopmentAssistance funding is involved.
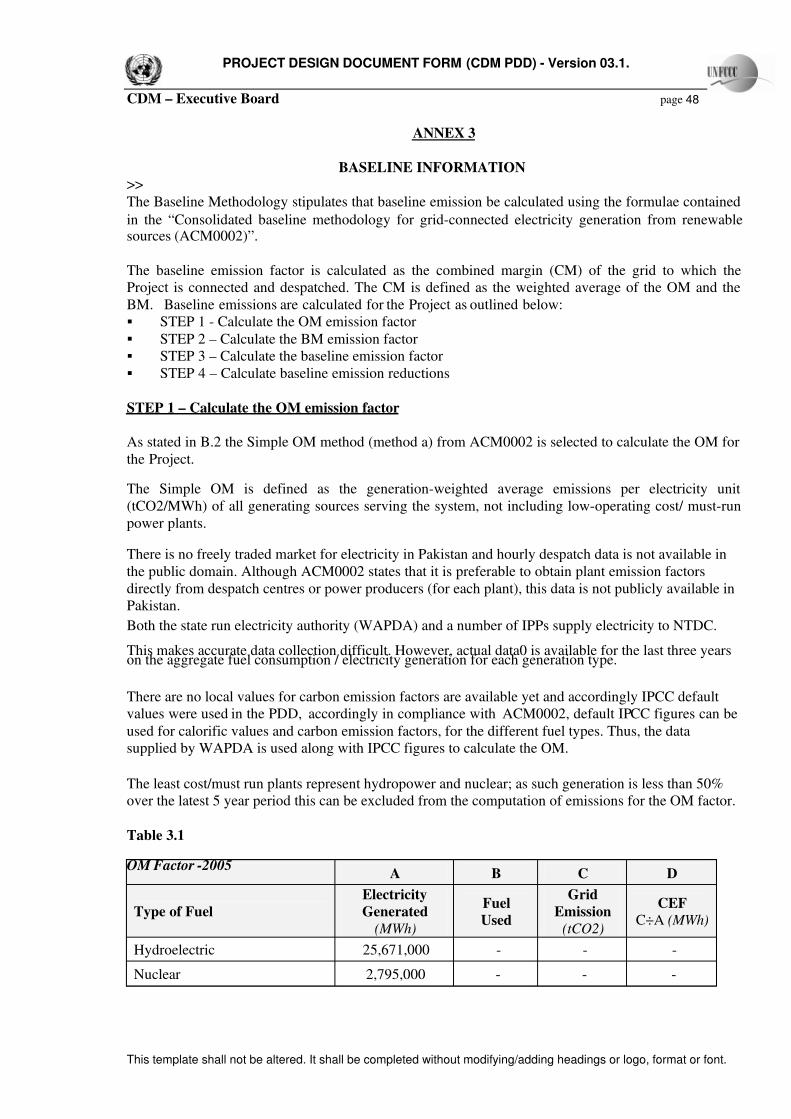
7/14/2019 Bong Escape Hydropower Project
http://slidepdf.com/reader/full/bong-escape-hydropower-project 48/60
PROJECT DESIGN DOCUMENT FORM (CDM PDD) - Version 03.1.
CDM – Executive Board page 48
This template shall not be altered. It shall be completed without modifying/adding headings or logo, format or font.
ANNEX 3
BASELINE INFORMATION
>>The Baseline Methodology stipulates that baseline emission be calculated using the formulae contained
in the “Consolidated baseline methodology for grid-connected electricity generation from renewablesources (ACM0002)”.
The baseline emission factor is calculated as the combined margin (CM) of the grid to which theProject is connected and despatched. The CM is defined as the weighted average of the OM and theBM. Baseline emissions are calculated for the Project as outlined below: STEP 1 - Calculate the OM emission factor STEP 2 – Calculate the BM emission factor STEP 3 – Calculate the baseline emission factor STEP 4 – Calculate baseline emission reductions
STEP 1 – Calculate the OM emission factor
As stated in B.2 the Simple OM method (method a) from ACM0002 is selected to calculate the OM forthe Project.
The Simple OM is defined as the generation-weighted average emissions per electricity unit(tCO2/MWh) of all generating sources serving the system, not including low-operating cost/ must-runpower plants.
There is no freely traded market for electricity in Pakistan and hourly despatch data is not available inthe public domain. Although ACM0002 states that it is preferable to obtain plant emission factorsdirectly from despatch centres or power producers (for each plant), this data is not publicly available inPakistan.
Both the state run electricity authority (WAPDA) and a number of IPPs supply electricity to NTDC.
This makes accurate data collection difficult. However, actual data0 is available for the last three yearson the aggregate fuel consumption / electricity generation for each generation type.
There are no local values for carbon emission factors are available yet and accordingly IPCC defaultvalues were used in the PDD, accordingly in compliance with ACM0002, default IPCC figures can beused for calorific values and carbon emission factors, for the different fuel types. Thus, the datasupplied by WAPDA is used along with IPCC figures to calculate the OM.
The least cost/must run plants represent hydropower and nuclear; as such generation is less than 50%over the latest 5 year period this can be excluded from the computation of emissions for the OM factor.
Table 3.1
OM Factor -2005A B C D
Type of Fuel
Electricity
Generated
(MWh)
Fuel
Used
Grid
Emission
(tCO2)
CEF
C÷A (MWh)
Hydroelectric 25,671,000 - - -
Nuclear 2,795,000 - - -
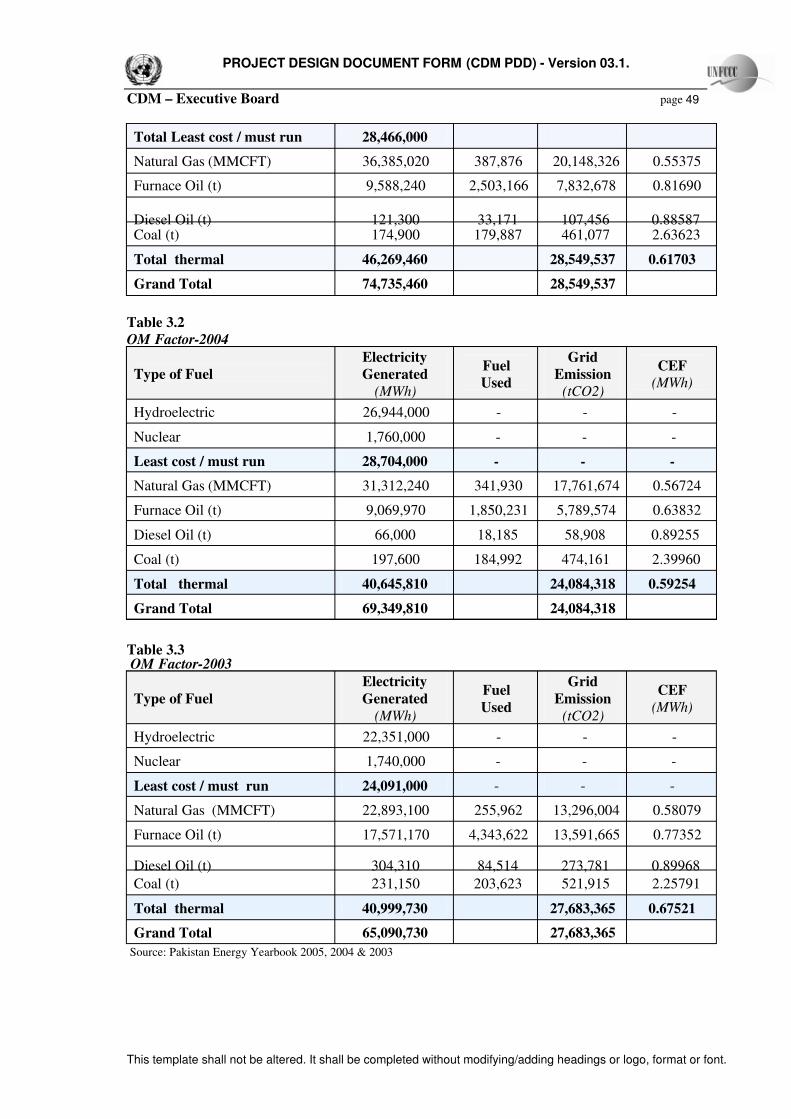
7/14/2019 Bong Escape Hydropower Project
http://slidepdf.com/reader/full/bong-escape-hydropower-project 49/60
PROJECT DESIGN DOCUMENT FORM (CDM PDD) - Version 03.1.
CDM – Executive Board page 49
This template shall not be altered. It shall be completed without modifying/adding headings or logo, format or font.
Total Least cost / must run 28,466,000
Natural Gas (MMCFT) 36,385,020 387,876 20,148,326 0.55375
Furnace Oil (t) 9,588,240 2,503,166 7,832,678 0.81690
Diesel Oil (t) 121,300 33,171 107,456 0.88587Coal (t) 174,900 179,887 461,077 2.63623
Total thermal 46,269,460 28,549,537 0.61703
Grand Total 74,735,460 28,549,537
Table 3.2
OM Factor-2004
Type of Fuel
Electricity
Generated
(MWh)
Fuel
Used
Grid
Emission
(tCO2)
CEF
(MWh)
Hydroelectric 26,944,000 - - -
Nuclear 1,760,000 - - -
Least cost / must run 28,704,000 - - -
Natural Gas (MMCFT) 31,312,240 341,930 17,761,674 0.56724
Furnace Oil (t) 9,069,970 1,850,231 5,789,574 0.63832
Diesel Oil (t) 66,000 18,185 58,908 0.89255
Coal (t) 197,600 184,992 474,161 2.39960
Total thermal 40,645,810 24,084,318 0.59254
Grand Total 69,349,810 24,084,318
Table 3.3 OM Factor-2003
Type of Fuel
Electricity
Generated
(MWh)
Fuel
Used
Grid
Emission
(tCO2)
CEF
(MWh)
Hydroelectric 22,351,000 - - -
Nuclear 1,740,000 - - -
Least cost / must run 24,091,000 - - -
Natural Gas (MMCFT) 22,893,100 255,962 13,296,004 0.58079
Furnace Oil (t) 17,571,170 4,343,622 13,591,665 0.77352
Diesel Oil (t) 304,310 84,514 273,781 0.89968
Coal (t) 231,150 203,623 521,915 2.25791
Total thermal 40,999,730 27,683,365 0.67521
Grand Total 65,090,730 27,683,365
Source: Pakistan Energy Yearbook 2005, 2004 & 2003

7/14/2019 Bong Escape Hydropower Project
http://slidepdf.com/reader/full/bong-escape-hydropower-project 50/60
PROJECT DESIGN DOCUMENT FORM (CDM PDD) - Version 03.1.
CDM – Executive Board page 50
This template shall not be altered. It shall be completed without modifying/adding headings or logo, format or font.
Table 3.4
OM Summary
Year
Electricity
Generated
(MWh)
Grid
Emission
(tCO2)
CEF(MWh)
2005 46,269,460 28,549,537 0.61703
2004 40,645,810 24,084,318 0.59254
2003 40,999,730 27,683,365 0.67521
Grand Total 127,915,000 80,317,220 0.62790
STEP 2 – Calculate the BM emission factor
According to the Methodology, the Build Margin is defined as the generation-weighted averageemission factor of either five most recent or the most recent 20% of power plants built (in terms of generation), whichever groups annual generation is greater. Both lists of plants exclude CDM-statusplants.
Table 3.5
Total system generation and least cost / must operate plants (GWh
Pakistan Grid System statistics 2001-2005
The methodology to compute the BM requires that the greater of the following be selected:
(c) The generation in MWh of the five most recent generating plants built; and
(d) 20% of the total of most recent generating plants built in the system (average of three mostrecent years) provided, however, that the average of the least cost/must run plants for the five mostrecent years has been less than 50% of the total system generation in MWh.
The required parameters were examined and computations made which showed:
Year 2005 2004 2003 2002 2001
Hydroelectric 25,671 26,944 22,351 18,941 17,194
Nuclear 2,795 1,760 1,740 2,291 1,997
Total least cost / must run 28,466 28,704 24,091 21,232 19,191
% 33.24% 35.51% 31.83% 29.32% 28.17 %
Gas 43,472 39,213 27,006 24,855 21,780
Oil 13,516 12,711 24,353 26,034 26,904
Coal 175 198 231 285 241
Total Thermal 57,163 52,122 51,590 51,174 48,925
% 66.76 % 64.49% 68.17 % 70.68% 71.83%
Total System 85,629 80,826 75,681 72,406 68,116
% 100% 100% 100% 100% 100%

7/14/2019 Bong Escape Hydropower Project
http://slidepdf.com/reader/full/bong-escape-hydropower-project 51/60
PROJECT DESIGN DOCUMENT FORM (CDM PDD) - Version 03.1.
CDM – Executive Board page 51
This template shall not be altered. It shall be completed without modifying/adding headings or logo, format or font.
• The five power plants that have been built most recently contribute 12,231,000 MWh to the grid;
• The most recent published total electricity generation in 2005 was 74,413,000 MWh and 20% of system generation comes to 14,883,000 MWh; and less than 50% of total system generation comprised
least cost/must run plants in the five years from 2001 to 2005.
As 20% of the most recent published generation in the system (2005) is greater than the generation of the five most recent plants built and the condition of least cost/must run over the past five years issatisfied, this was selected and it was decided to consider the BM based on the most recent 20% of power plants built.
Table-3.7
Build Margin
ProjectCommissioned
InFuel Technology
2005
Generation
MWh
Emission
CO2 t
Total system at 30/06/ 2005 74,413,260
20% of system 14,882,652
Ghazi Apr-04 HydroHydroturbine
6,337,980
Liberty Sep-01 Gas CCGT 1,293,600 590,792
Altern Jun-01 Gas Engines 9,600 5,077
Uch Oct-00 Gas CCGT 4,193,370 2,106,655
Japan Mar-00 FO Engines 396,060 287,361
Saba Dec-99 FO ST 595,170 468,839
Rousch Dec-99 FO/Gas CCGT 2,880,000 1,315,31620% of most
recent plants15,705,780 4,774,043
Build Margin 0.30397
Note:
a) If 20% falls on part capacity of a plant, that plant is fully included in the calculation
b) The BM is effected by a large hydropower project commissioned recently which takes up more than 40% of the most
recent generation; the restated BM excluding the hydropower generation would be 0.51
STEP 3 – Calculate the baseline emission factor
The Baseline Emission Factor was calculated as combined margin (CM), consisting of simple average
of both the resulting OM and the resulting BM. All margins expressed in tCO2 / MWh.
The baseline emissions factor EFy= wOM * EFOM,y + wBM * EFBM,y
= (0.5 * 0.62790) + (0.5 * 0.30397) = 0.46593 tCO2 / MWh.
STEP 4 – Calculate baseline emission reductions

7/14/2019 Bong Escape Hydropower Project
http://slidepdf.com/reader/full/bong-escape-hydropower-project 52/60
PROJECT DESIGN DOCUMENT FORM (CDM PDD) - Version 03.1.
CDM – Executive Board page 52
This template shall not be altered. It shall be completed without modifying/adding headings or logo, format or font.
The electricity supplied by the project activity to the grid EGy in MWh will be 470,000 MWh
and the emissions reductions can be measured as ERy (tCO2) = EFy * EG y .
Thus ERy = 0.46593 * 470,000 = 218,988 tCO2
The computation of 218,988 tCO2 represents the most conservative estimate of the emissions reductionsthat would arise from the project activity and would be the applicable emissions reductions for thecrediting period
TABLE 3.8 Combined Margin
Segment Margin WeightageCombined
Margin
OM 0.62790 0.5 0.31395
BM 0.30397 0.5 0.15198
CM 0.46593
GENERATION 470,000 MWh
CERs 218,988 MT
Major Risks to Baseline and mitigation thereof:
The baseline for a CDM project activity is the scenario that reasonably represents the anthropogenicemissions by sources of greenhouse gases (GHG) that would occur in the absence of the proposedproject activity; it represents the level from which the reduction is occurring. The additionality in termsof emission reductions arises from the difference between Baseline Scenario emissions and ProjectScenario emissions and accordingly the proper and accurate determination of the Baseline emissions isvery important to reduce the risk of overstatement of CER’s.
The risks to Baseline Emissions may arise due to the following:
(a) Risk of misstatement of emissions in the baseline scenario;(b) Changes in environmental policy result in baseline becoming irrelevant and requiring to be
updated and CER’s issued based on reduced baseline;(c) Change in validity of Baseline at beginning of a new crediting period
For the project these risks have been mitigated and marginalized through the following factors:
1. There is a high and reliable quality of data used, data source and assumptions;
2. The project activity is a hydropower project with a well defined boundary and negligibleleakage;
3. The baseline study has been rigorous, based on authentic and reliable data with stress onaccuracy and conservative assumptions/estimates
4. The technology being used is robust, mature and tested with a long life and developed localoperating know-how
5. The project activity is highly beneficial for the local environment and economic well being andsustainable development and now enjoys support of key stakeholders and is supported by the

7/14/2019 Bong Escape Hydropower Project
http://slidepdf.com/reader/full/bong-escape-hydropower-project 53/60
PROJECT DESIGN DOCUMENT FORM (CDM PDD) - Version 03.1.
CDM – Executive Board page 53
This template shall not be altered. It shall be completed without modifying/adding headings or logo, format or font.
local community as it provides employment and economic benefits in a backward andunderdeveloped area;
6. the government is supporting hydropower to enable energy security and a low cost sustainableenergy based on local resources and substituting expensive imported oil and reducing the costof electricity in the grid
7. The monitoring plan constitutes the basis of future verification and should provide theconfidence that the emissions reductions and other project objectives are being achieved andshould be able to monitor risks inherent to the baseline and project emissions. Monitoring planis required for verification and issuance of CER’s and should be planned by projectparticipants and provides for:
• collection and archiving data necessary for calculating emissions within project boundary
• collection and archiving data necessary for determining baseline
• Collection, documentation and archiving of all steps involved in calculations of emissionreductions and leakages during lifetime of project
• collection and archiving data necessary for calculating leakages reasonably attributable tothe project activity during the crediting period
• collection and archiving data and information relevant to assess environmental impacts of the project
• QA/QC for the Monitoring process
• Procedures for periodic calculation of reduction of emissions by sources by the project ,and leakages
8. The monitoring plan will provide detailed information related to collection and archiving allrelevant data necessary to:
• Fuel consumption
• Activity levels
• Emission factors
•
Heat produced and replaced• Electricity produced and replaced
• Grid losses
• Fuel prices/subsides/taxes
• Estimate of emissions occurring within project boundaries
• Determination baseline emissions
• Determination leakage
9. The risk when selecting a 7 year period is that the original baseline is not valid after the end of the crediting period 7-year period. The project has selected a renewable credit period whichrequires that at time of each renewal determination will done of whether the original projectbaseline methodology is still valid or not for the next crediting period; if it is considered that
the original methodology is not valid, only the data used in setting the baseline shall be updatedto establish a revised baseline, since the baseline methodology cannot be changed.

7/14/2019 Bong Escape Hydropower Project
http://slidepdf.com/reader/full/bong-escape-hydropower-project 54/60
PROJECT DESIGN DOCUMENT FORM (CDM PDD) - Version 03.1.
CDM – Executive Board page 54
This template shall not be altered. It shall be completed without modifying/adding headings or logo, format or font.
ANNEX 4
MONITORING INFORMATION
>>The directorate established by the Company will prepare and submit monthly reports and institute
procedures to monitor:
(a) daily electricity readings of the metering system, the back up metering system, the magnetic mediaand the sequential event recorder;
(b) attendance and monitoring of the monthly meter reading on the last business day of the month;
(c) maintaining a log showing comparison of the data readings from each source and investigatingdiscrepancies, if any
(d) maintaining a log of meter efficiencies and calibrations;
(e) receiving, tabulating and comparing billing data for energy generation and comparing with meterdata;
(f) extracting data from official published sources and comparing with cumulative meter reading data;
(g) extracting data from audited accounts and comparing with meter reading data;
(h) extracting and maintaining log of water meter readings and computing energy for overallreasonability estimates; receiving and collating official published system data to compute andprepare analysis of baseline emission factors;
(i) computing emissions in tCO2 on a monthly basis from all data and estimates collected and compare
with ex ante estimates which for the basis for CERs during the crediting period.
(j) Development of a reporting structure with monthly, quarterly and annual reports;
(k) Benefits of sustainable development including; i) improvement of local economy, (ii) improvementof skills for local inhabitants (capacity building), (iii) reduction of poverty, and (iv) socialinfrastructure by medical clinic and improving existing school.

7/14/2019 Bong Escape Hydropower Project
http://slidepdf.com/reader/full/bong-escape-hydropower-project 55/60
PROJECT DESIGN DOCUMENT FORM (CDM PDD) - Version 03.1.
CDM – Executive Board page 55
This template shall not be altered. It shall be completed without modifying/adding headings or logo, format or font.
ANNEX 5
Assumptions and Financial Analysis for Year 2001

7/14/2019 Bong Escape Hydropower Project
http://slidepdf.com/reader/full/bong-escape-hydropower-project 56/60
PROJECT DESIGN DOCUMENT FORM (CDM PDD) - Version 03.1.
CDM – Executive Board page 56
This template shall not be altered. It shall be completed without modifying/adding headings or logo, format or font.
NEW BONG ESCAPE HYDROPOWER PROJECT - TARIFF
Variable
O&M Fixed O&M ROE Total Esc Non Escal Total
US cents/KWh US cents/KWh US cents/KWh US cents/KWh US cents/KWh US cents/KWh
1 0.150 0.260 0.858 1.268 3.257 4.524
2 0.150 0.260 0.858 1.268 3.110 4.378
3 0.150 0.260 0.858 1.268 2.964 4.231
4 0.150 0.260 0.858 1.268 2.817 4.085
5 0.150 0.260 0.858 1.268 2.671 3.939
6 0.150 0.260 0.858 1.268 2.525 3.792
7 0.150 0.260 0.858 1.268 2.378 3.646
8 0.150 0.260 0.858 1.268 2.232 3.500
9 0.150 0.260 0.858 1.268 2.086 3.353
10 0.150 0.260 0.858 1.268 1.939 3.207
11 0.150 0.260 0.858 1.268 0.000 1.268
12 0.150 0.260 0.858 1.268 0.000 1.268
13 0.150 0.260 0.858 1.268 0.000 1.268
14 0.150 0.260 0.858 1.268 0.000 1.268
15 0.150 0.260 0.858 1.268 0.000 1.268
16 0.150 0.260 0.858 1.268 0.000 1.268
17 0.150 0.260 0.858 1.268 0.000 1.26818 0.150 0.260 0.858 1.268 0.000 1.268
19 0.150 0.260 0.858 1.268 0.000 1.268
20 0.150 0.260 0.858 1.268 0.000 1.268
21 0.150 0.260 0.858 1.268 0.000 1.268
22 0.150 0.260 0.858 1.268 0.000 1.268
23 0.150 0.260 0.858 1.268 0.000 1.268
24 0.150 0.260 0.858 1.268 0.000 1.268
25 0.150 0.260 0.858 1.268 0.000 1.268
Year
Levelized Tariff
ariable
O&M Fixed O&M ROE Total Esc Non Escal Total
S cents/KWh S cents/KWh S cents/KWh S cents/KWh S cents/KWh S cents/KWh
1 0.150 0.260 0.858 1.268 3.257 4.524
2 0.150 0.260 0.858 1.268 3.110 4.378
3 0.150 0.260 0.858 1.268 2.964 4.231
4 0.150 0.260 0.858 1.268 2.817 4.085
5 0.150 0.260 0.858 1.268 2.671 3.939
6 0.150 0.260 0.858 1.268 2.525 3.792
7 0.150 0.260 0.858 1.268 2.378 3.646
8 0.150 0.260 0.858 1.268 2.232 3.500
9 0.150 0.260 0.858 1.268 2.086 3.353
10 0.150 0.260 0.858 1.268 1.939 3.207
11 0.150 0.260 0.858 1.268 0.000 1.268
12 0.150 0.260 0.858 1.268 0.000 1.268
13 0.150 0.260 0.858 1.268 0.000 1.268
14 0.150 0.260 0.858 1.268 0.000 1.268
15 0.150 0.260 0.858 1.268 0.000 1.268
16 0.150 0.260 0.858 1.268 0.000 1.268
17 0.150 0.260 0.858 1.268 0.000 1.268
18 0.150 0.260 0.858 1.268 0.000 1.268
19 0.150 0.260 0.858 1.268 0.000 1.268
20 0.150 0.260 0.858 1.268 0.000 1.268
21 0.150 0.260 0.858 1.268 0.000 1.268
22 0.150 0.260 0.858 1.268 0.000 1.268
23 0.150 0.260 0.858 1.268 0.000 1.268
24 0.150 0.260 0.858 1.268 0.000 1.268
25 0.150 0.260 0.858 1.268 0.000 1.268
Year
Indexed Tariff (With CPI Indexation)

7/14/2019 Bong Escape Hydropower Project
http://slidepdf.com/reader/full/bong-escape-hydropower-project 57/60
PROJECT DESIGN DOCUMENT FORM (CDM PDD) - Version 03.1.
CDM – Executive Board page 57
This template shall not be altered. It shall be completed without modifying/adding headings or logo, format or font.
NEW BONG ESCAPE HYDROPOWER PROJECT – CASH FLOW (WITHOUT CDM REVENUE)
NEW
BONG ESCAPE HYDROPOWER PROJECT – CASH FLOW (WITH CDM REVENUE)
Elec. Revenue
Carbon
Credits Total
Variab le
O&M Exp O&M Exp
Debt
Servicing Total
US$ mln US$ mln US$ mln US$ mln US$ mln US$ mln US$ mln US$ mln
1 19.273 2.662 21.935 0.639 1.108 13.87 15.620 6.315
2 18.650 2.742 21.391 0.639 1.108 13.25 14.996 6.395
3 18.026 2.824 20.850 0.639 1.108 12.63 14.373 6.477
4 17.403 2.909 20.311 0.639 1.108 12.00 13.749 6.562
5 16.779 2.996 19.775 0.639 1.108 11.38 13.126 6.649
6 16.156 3.086 19.241 0.639 1.108 10.76 12.502 6.739
7 15.532 3.178 18.710 0.639 1.108 10.13 11.879 6.832
8 14.909 3.274 18.182 0.639 1.108 9.51 11.255 6.927
9 14.285 3.372 17.657 0.639 1.108 8.88 10.632 7.025
10 13.661 3.473 17.134 0.639 1.108 8.26 10.008 7.126
11 5.400 3.577 8.977 0.639 1.108 - 1.747 7.231
12 5.400 3.684 9.084 0.639 1.108 - 1.747 7.338
13 5.400 3.795 9.195 0.639 1.108 - 1.747 7.448
14 5.400 3.909 9.309 0.639 1.108 - 1.747 7.562
15 5.400 4.026 9.426 0.639 1.108 - 1.747 7.680
16 5.400 4.147 9.547 0.639 1.108 - 1.747 7.800
17 5.400 4.271 9.671 0.639 1.108 - 1.747 7.92518 5.400 4.399 9.799 0.639 1.108 - 1.747 8.053
19 5.400 4.531 9.931 0.639 1.108 - 1.747 8.185
20 5.400 4.667 10.067 0.639 1.108 - 1.747 8.321
21 5.400 4.807 10.207 0.639 1.108 - 1.747 8.461
22 5.400 4.952 10.352 0.639 1.108 - 1.747 8.605
23 5.400 5.100 10.500 0.639 1.108 - 1.747 8.754
24 5.400 5.253 10.653 0.639 1.108 - 1.747 8.907
25 5.400 5.411 10.811 0.639 1.108 - 1.747 9.064
Gross Revenue
Ne t
Revenue
Expenses
Year
Elec. Revenue
Carbon
Credits Total
Variable
O&M Exp O&M Exp
Debt
Servicing Total
US$ mln US$ mln US$ mln US$ mln US$ mln US$ mln US$ mln US$ mln
1 19.273 0.000 19.273 0.639 1.108 13.87 15.620 3.653
2 18.650 0.000 18.650 0.639 1.108 13.25 14.996 3.653
3 18.026 0.000 18.026 0.639 1.108 12.63 14.373 3.653
4 17.403 0.000 17.403 0.639 1.108 12.00 13.749 3.653
5 16.779 0.000 16.779 0.639 1.108 11.38 13.126 3.653
6 16.156 0.000 16.156 0.639 1.108 10.76 12.502 3.653
7 15.532 0.000 15.532 0.639 1.108 10.13 11.879 3.653
8 14.909 0.000 14.909 0.639 1.108 9.51 11.255 3.653
9 14.285 0.000 14.285 0.639 1.108 8.88 10.632 3.653
10 13.661 0.000 13.661 0.639 1.108 8.26 10.008 3.653
11 5.400 0.000 5.400 0.639 1.108 - 1.747 3.653
12 5.400 0.000 5.400 0.639 1.108 - 1.747 3.653
13 5.400 0.000 5.400 0.639 1.108 - 1.747 3.653
14 5.400 0.000 5.400 0.639 1.108 - 1.747 3.653
15 5.400 0.000 5.400 0.639 1.108 - 1.747 3.653
16 5.400 0.000 5.400 0.639 1.108 - 1.747 3.653
17 5.400 0.000 5.400 0.639 1.108 - 1.747 3.65318 5.400 0.000 5.400 0.639 1.108 - 1.747 3.653
19 5.400 0.000 5.400 0.639 1.108 - 1.747 3.653
20 5.400 0.000 5.400 0.639 1.108 - 1.747 3.653
21 5.400 0.000 5.400 0.639 1.108 - 1.747 3.653
22 5.400 0.000 5.400 0.639 1.108 - 1.747 3.653
23 5.400 0.000 5.400 0.639 1.108 - 1.747 3.653
24 5.400 0.000 5.400 0.639 1.108 - 1.747 3.653
25 5.400 0.000 5.400 0.639 1.108 - 1.747 3.653
Net
Revenue
Expenses
Year
Gross Revenue

7/14/2019 Bong Escape Hydropower Project
http://slidepdf.com/reader/full/bong-escape-hydropower-project 58/60
PROJECT DESIGN DOCUMENT FORM (CDM PDD) - Version 03.1.
CDM – Executive Board page 58
This template shall not be altered. It shall be completed without modifying/adding headings or logo, format or font.
ANNEX 6
Assumptions and Financial Analysis for Year 2007
NEW BONG ESCAPE HYDROPOWER PROJECT
ASSUMPTIONS
No. Plant Parameters
1 Plant Capacity (MW) 84
2 Plant Factor 63.91%
3 NEO (GWh)/Annum 470.00
No. Capital Structure
4 Debt:Equity 75% 25%
Financeirs ADB IDB Local
5 Financing Percentage w.r.t. total debt 32.56% 32.56% 34.88%
6 Financing Amount (US $ M) 37.30 37.30 39.95
7 Financing Percentage w.r.t. total cost 24.42% 24.42% 26.16%
8 Reference KIBOR rate - - 2.81%
9 Reference LIBOR rate 1.23% 1.23% -
10 Spread 3.00% 3.00% 3.25%11 Interest Rate Post COD 4.23% 4.23% 6.06%
12 Grace Period (Half Year) 7 7 7
13 Repayment Period (Half Years) 23 23 18
No. Project Cost
14 Total Project Cost (US $ M) 152.74
15 IDC (US $ M) 10.16
16 Base Project Cost (US $ M) 142.58
17 Debt Component (US $ M) 114.55
18 Equity Component (US $ M) (38.18)
19. Reference Exchange Rate
Exchange Rate US$/PKR 60.00
20. US CPI Indexation 1
Indexation Rate 2.50%
21. CER Indexation 1
Indexation Rate 3.00%
22. Income on Short Term Investment 1
Rate of Interest 4.00%
23. Fixed and Variable O&M Indexation 1
Indexation Rate 2.50%
24. Levelized Tariff Levelized Tariff without WUC (US Cents/KWh) 4.4670
Levelized Tariff with WUC (US Cents/KWh) 4.7000
25. Standard Tariff Components
Variable O&M Component (per KWh) 0.0930
Fixed O&M Component (per KWh) 0.6400
Water Use Charges(per KWh) 0.2330
Yes
Yes
Yes
Yes

7/14/2019 Bong Escape Hydropower Project
http://slidepdf.com/reader/full/bong-escape-hydropower-project 59/60
PROJECT DESIGN DOCUMENT FORM (CDM PDD) - Version 03.1.
CDM – Executive Board page 59
This template shall not be altered. It shall be completed without modifying/adding headings or logo, format or font.
NEW BONG ESCAPE HYDROPOWER PROJECT - TARIFF
Variable
O&M Fixed O&M ROE Total Esc Non Escal Total
US cents/KWh US cents/KWh US cents/KWh US cents/KWh US cents/KWh US cents/KWh
1 0.093 0.640 1.627 2.360 3.482 5.841872 0.093 0.640 1.627 2.360 3.366 5.726
3 0.093 0.640 1.627 2.360 3.251 5.611
4 0.093 0.640 1.627 2.360 3.135 5.495
5 0.093 0.640 1.627 2.360 3.019 5.380
6 0.093 0.640 1.627 2.360 2.904 5.264
7 0.093 0.640 1.627 2.360 2.788 5.149
8 0.093 0.640 1.627 2.360 2.673 5.033
9 0.093 0.640 1.627 2.360 2.557 4.917
10 0.093 0.640 1.627 2.360 1.511 3.872
11 0.093 0.640 1.627 2.360 1.453 3.813
12 0.093 0.640 1.627 2.360 0.705 3.065
13 0.093 0.640 1.627 2.360 0.000 2.360
14 0.093 0.640 1.627 2.360 0.000 2.360
15 0.093 0.640 1.627 2.360 0.000 2.360
16 0.093 0.640 1.627 2.360 0.000 2.360
17 0.093 0.640 1.627 2.360 0.000 2.360
18 0.093 0.640 1.627 2.360 0.000 2.360
19 0.093 0.640 1.627 2.360 0.000 2.360
20 0.093 0.640 1.627 2.360 0.000 2.360
21 0.093 0.640 1.627 2.360 0.000 2.360
22 0.093 0.640 1.627 2.360 0.000 2.360
23 0.093 0.640 1.627 2.360 0.000 2.360
24 0.093 0.640 1.627 2.360 0.000 2.360
25 0.093 0.640 1.627 2.360 0.000 2.360
Year
Reference Tariff
Variable
O&M Fixed O&M ROE Total Esc Non Escal Total
US cents/KWh US cents/KWh US cents/KWh US cents/KWh US cents/KWh US cents/KWh
1 0.103 0.706 1.796 2.605 3.482 6.087
2 0.105 0.724 1.841 2.670 3.366 6.036
3 0.108 0.742 1.887 2.737 3.251 5.9884 0.111 0.761 1.934 2.806 3.135 5.941
5 0.113 0.780 1.983 2.876 3.019 5.895
6 0.116 0.799 2.032 2.948 2.904 5.851
7 0.119 0.819 2.083 3.021 2.788 5.810
8 0.122 0.840 2.135 3.097 2.673 5.770
9 0.125 0.861 2.188 3.174 2.557 5.731
10 0.128 0.882 2.243 3.254 1.511 4.765
11 0.131 0.904 2.299 3.335 1.453 4.788
12 0.135 0.927 2.357 3.418 0.705 4.123
13 0.138 0.950 2.416 3.504 0.000 3.504
14 0.142 0.974 2.476 3.591 0.000 3.591
15 0.145 0.998 2.538 3.681 0.000 3.681
16 0.149 1.023 2.601 3.773 0.000 3.773
17 0.152 1.049 2.666 3.868 0.000 3.868
18 0.156 1.075 2.733 3.964 0.000 3.964
19 0.160 1.102 2.801 4.063 0.000 4.063
20 0.164 1.129 2.871 4.165 0.000 4.165
21 0.168 1.158 2.943 4.269 0.000 4.269
22 0.172 1.187 3.017 4.376 0.000 4.376
23 0.177 1.216 3.092 4.485 0.000 4.485
24 0.181 1.247 3.170 4.597 0.000 4.597
25 0.186 1.278 3.249 4.712 0.000 4.712
Year
Indexed Tariff (With CPI Indexation)
NEW BONG ESCAPE HYDROPOWER PROJECT – CASH FLOW (WITHOUT CDM REVENUE)

7/14/2019 Bong Escape Hydropower Project
http://slidepdf.com/reader/full/bong-escape-hydropower-project 60/60
PROJECT DESIGN DOCUMENT FORM (CDM PDD) - Version 03.1.
CDM – Executive Board page 60
Elec.
Revenue
Income
on STI
Carbon
Credits Total
Variable
O&M Exp O&M Exp
Debt
Servicing Total
US$ mln US$ mln US$ mln US$ mln US$ mln US$ mln US$ mln US$ mln US$ mln US$ mln US$ mln US$ mln
1 28.608 0.218 0.000 28.82593 0.482 3.311 16.36 20.158 8.668 0.5660 8.1024 8.102
2 28.371 0.218 0.000 28.589 0.495 3.394 15.82 19.709 8.880 0.5798 8.3000 8.300
3 28.142 0.218 0.000 28.360 0.507 3.479 15.28 19.263 9.097 0.5940 8.5027 8.503
4 27.921 0.218 0.000 28.139 0.520 3.566 14.73 18.820 9.319 0.6085 8.7105 8.711
5 27.707 0.219 0.000 27.926 0.533 3.655 14.19 18.379 9.547 0.6234 8.9236 8.924
6 27.502 0.219 0.000 27.721 0.546 3.747 13.65 17.941 9.781 0.6386 9.1421 9.142
7 27.305 0.220 0.000 27.525 0.560 3.840 13.11 17.505 10.020 0.6543 9.3661 9.366
8 27.117 0.221 0.000 27.338 0.574 3.936 12.56 17.072 10.266 0.6703 9.5958 9.596
9 26.938 0.222 0.000 27.159 0.588 4.035 12.02 16.641 10.518 0.6868 9.8313 9.831
10 22.396 0.198 0.000 22.594 0.603 4.136 7.10 11.842 10.752 0.7021 10.0503 10.050
11 22.504 0.201 0.000 22.705 0.618 4.239 6.83 11.686 11.019 0.7195 10.2992 10.299
12 19.378 0.186 0.000 19.564 0.633 4.345 3.31 8.290 11.274 0.7361 10.5378 10.538
13 16.468 0.172 0.000 16.639 0.649 4.454 - 5.102 11.537 0.7533 10.7838 10.784
14 16.880 0.176 0.000 17.055 0.665 4.565 - 5.230 11.826 0.7722 11.0534 11.053
15 17.302 0.180 0.000 17.482 0.682 4.679 - 5.361 12.121 0.7915 11.3297 11.330
16 17.734 0.185 0.000 17.919 0.699 4.796 - 5.495 12.424 0.8112 11.6129 11.613
17 18.177 0.189 0.000 18.367 0.716 4.916 - 5.632 12.735 0.8315 11.9033 11.903
18 18.632 0.194 0.000 18.826 0.734 5.039 - 5.773 13.053 0.8523 12.2008 12.201
19 19.098 0.199 0.000 19.297 0.752 5.165 - 5.917 13.379 0.8736 12.5059 12.506
20 19.575 0.204 0.000 19.779 0.771 5.294 - 6.065 13.714 0.8955 12.8185 12.819
21 20.064 0.209 0.000 20.274 0.791 5.426 - 6.217 14.057 0.9178 13.1390 13.139
22 20.566 0.214 0.000 20.780 0.810 5.562 - 6.372 14.408 0.9408 13.4674 13.467
23 21.080 0.220 0.000 21.300 0.831 5.701 - 6.531 14.768 0.9643 13.8041 13.804
24 21.607 0.225 0.000 21.832 0.851 5.843 - 6.695 15.138 0.9884 14.1492 14.149
25 22.147 0.231 0.000 22.378 0.873 5.989 - 6.862 15.516 1.013 14.5030 14.503
Revenue
forEquity
IRR
Withhold
Tax
Post Tax
Revenue
Net
Revenue
Expenses
Year
Gross Revenue
NEW BONG ESCAPE HYDROPOWER PROJECT – CASH FLOW (WITH CDM REVENUE)
Elec.
Revenue
Income
on STI
Carbon
Credits Total
Variable
O&M Exp O&M Exp
Debt
Servicing Total
US$ mln US$ mln US$ mln US$ mln US$ mln US$ mln US$ mln US$ mln US$ mln US$ mln US$ mln US$ mln
1 28.608 0.266 3.383 32.25738 0.482 3.311 16.36 20.158 12.100 0.8253 11.2745 11.274
2 28.371 0.267 3.485 32.124 0.495 3.394 15.82 19.709 12.414 0.8468 11.5675 11.567
3 28.142 0.269 3.589 32.001 0.507 3.479 15.28 19.263 12.737 0.8688 11.8683 11.868
4 27.921 0.271 3.697 31.889 0.520 3.566 14.73 18.820 13.069 0.8914 12.1772 12.177
5 27.707 0.273 3.808 31.788 0.533 3.655 14.19 18.379 13.409 0.9146 12.4945 12.494
6 27.502 0.275 3.922 31.699 0.546 3.747 13.65 17.941 13.759 0.9385 12.8202 12.8207 27.305 0.278 4.040 31.623 0.560 3.840 13.11 17.505 14.118 0.9630 13.1547 13.155
8 27.117 0.280 4.161 31.558 0.574 3.936 12.56 17.072 14.486 0.9881 13.4982 13.498
9 26.938 0.283 4.286 31.506 0.588 4.035 12.02 16.641 14.865 1.0139 13.8510 13.851
10 22.396 0.261 4.414 27.071 0.603 4.136 7.10 11.842 15.230 1.0388 14.1908 14.191
11 22.504 0.266 4.547 27.316 0.618 4.239 6.83 11.686 15.630 1.0661 14.5641 14.564
12 19.378 0.253 4.683 24.314 0.633 4.345 3.31 8.290 16.024 1.0930 14.9308 14.931
13 16.468 0.241 4.824 21.532 0.649 4.454 - 5.102 16.430 1.1207 15.3088 15.309
14 16.880 0.247 4.968 22.095 0.665 4.565 - 5.230 16.865 1.1503 15.7144 15.714
15 17.302 0.253 5.117 22.672 0.682 4.679 - 5.361 17.312 1.1808 16.1307 16.131
16 17.734 0.260 5.271 23.265 0.699 4.796 - 5.495 17.770 1.2121 16.5581 16.558
17 18.177 0.267 5.429 23.873 0.716 4.916 - 5.632 18.241 1.2442 16.9970 16.997
18 18.632 0.274 5.592 24.498 0.734 5.039 - 5.773 18.725 1.2772 17.4476 17.448
19 19.098 0.281 5.760 25.139 0.752 5.165 - 5.917 19.221 1.3111 17.9102 17.910
20 19.575 0.289 5.932 25.796 0.771 5.294 - 6.065 19.731 1.3459 18.3852 18.385
21 20.064 0.296 6.110 26.471 0.791 5.426 - 6.217 20.254 1.3816 18.8728 18.873
22 20.566 0.304 6.294 27.164 0.810 5.562 - 6.372 20.792 1.4182 19.3735 19.374
23 21.080 0.312 6.482 27.875 0.831 5.701 - 6.531 21.343 1.4558 19.8876 19.888
24 21.607 0.321 6.677 28.605 0.851 5.843 - 6.695 21.910 1.4945 20.4154 20.41525 22.147 0.329 6.877 29.354 0.873 5.989 - 6.862 22.492 1.534 20.9574 20.957
Revenue
forEquity
IRR
Withhold
Tax
Post Tax
Revenue
Net
Revenue
Expenses
Year
Gross Revenue