board of intermediate & secondary education, sylhet · board of intermediate & secondary...
TRANSCRIPT
DISTRICTTOTAL INST.
TOTAL PASS
% OF PASS
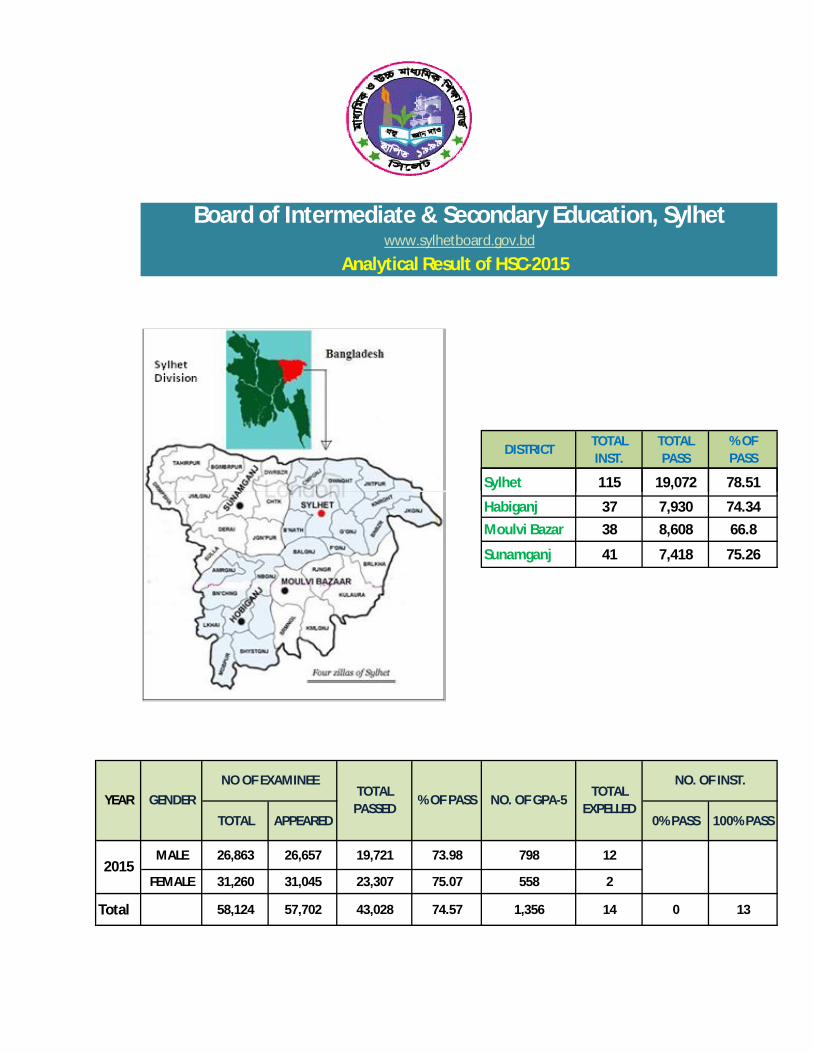
Sylhet 115 19,072 78.51
Board of Intermediate & Secondary Education, Sylhetwww.sylhetboard.gov.bd
Analytical Result of HSC-2015
Sylhet 115 19,072 78.51
Habiganj 37 7,930 74.34
Moulvi Bazar 38 8,608 66.8
Sunamganj 41 7,418 75.26
TOTAL APPEARED 0% PASS 100% PASS
MALE 26,863 26,657 19,721 73.98 798 12
FEMALE 31,260 31,045 23,307 75.07 558 2
Total 58,124 57,702 43,028 74.57 1,356 14 0 13
NO OF EXAMINEE NO. OF INST.
% OF PASS NO. OF GPA-5TOTAL
EXPELLEDTOTAL
PASSEDGENDERYEAR
2015
YEAR PASSED FAILED
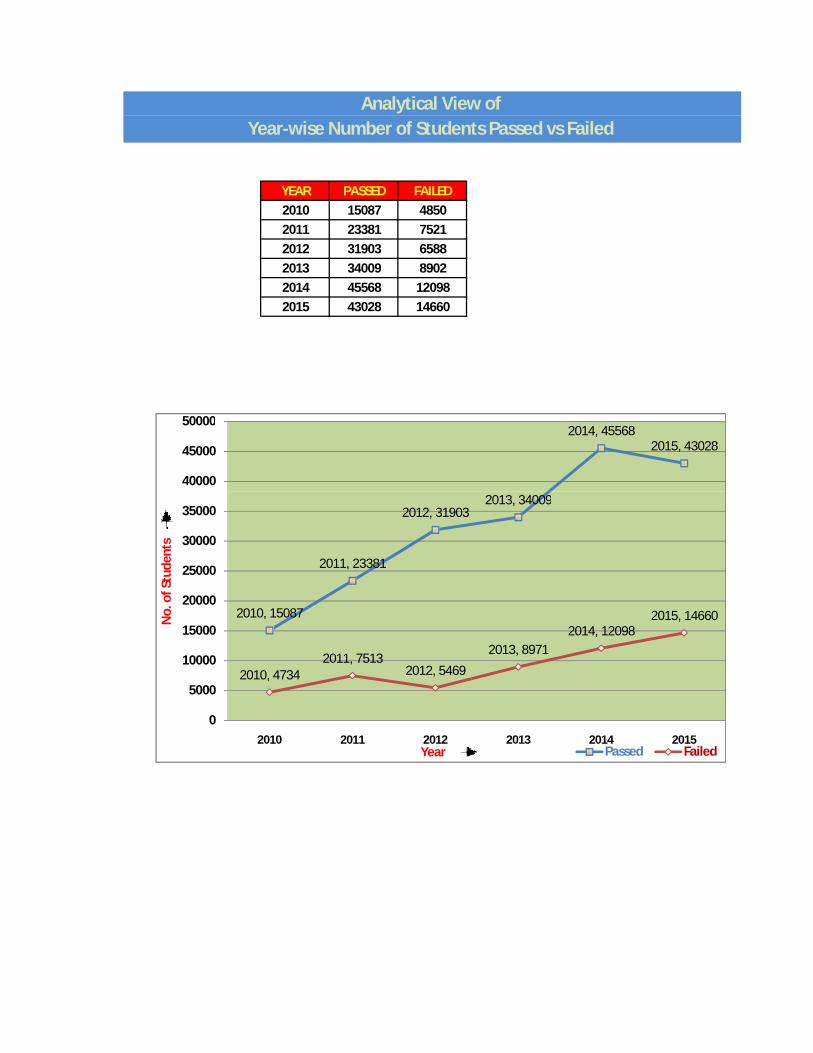
2010 15087 4850
2011 23381 7521
2012 31903 6588
2013 34009 8902
2014 45568 12098
2015 43028 14660
Analytical View of Year-wise Number of Students Passed vs Failed
2013, 34009
2014, 455682015, 43028
40000
45000
50000
2010, 15087
2011, 23381
2012, 319032013, 34009
2010, 47342011, 7513
2012, 5469
2013, 89712014, 12098
2015, 14660
0
5000
10000
15000
20000
25000
30000
35000
2010 2011 2012 2013 2014 2015
No.
of S
tude
nts
Year Passed Failed
YEAR APPEARED PASSED
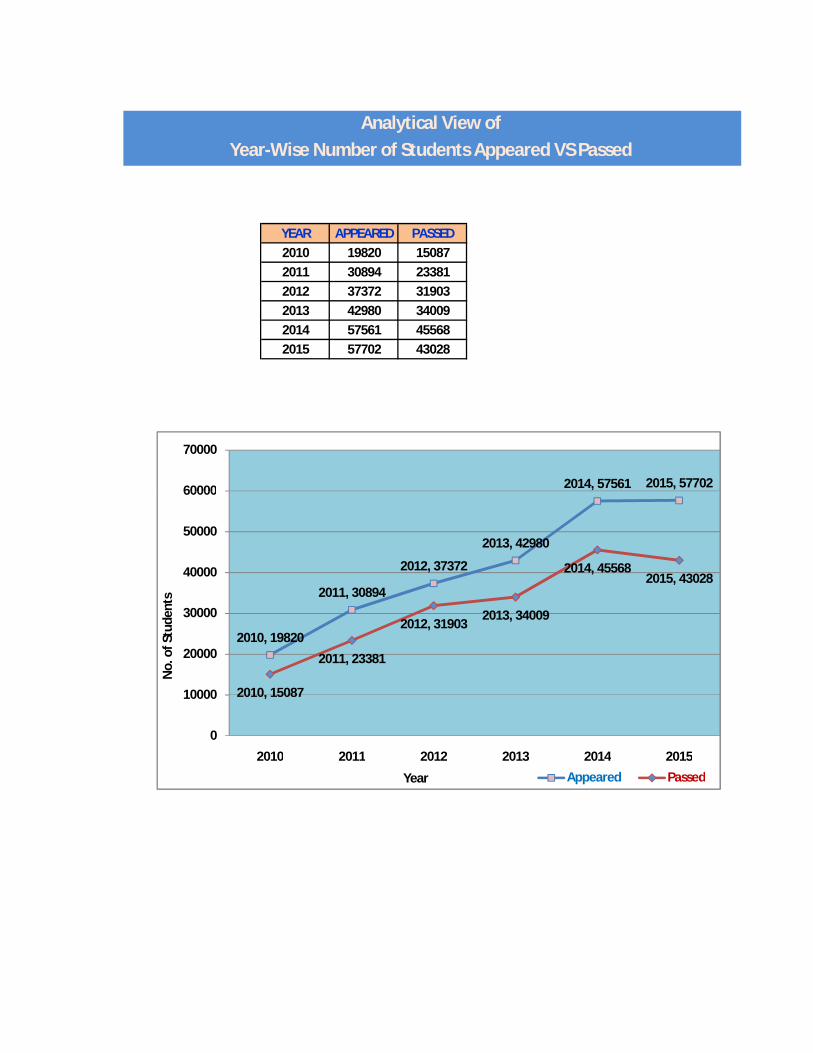
2010 19820 15087
2011 30894 23381
2012 37372 31903
2013 42980 34009
2014 57561 45568
2015 57702 43028
Analytical View of
Year-Wise Number of Students Appeared VS Passed
2014, 57561 2015, 5770260000
70000
2010, 19820
2011, 30894
2012, 37372
2013, 42980
2010, 15087
2011, 23381
2012, 319032013, 34009
2014, 455682015, 43028
0
10000
20000
30000
40000
50000
60000
2010 2011 2012 2013 2014 2015
No.
of S
tude
nts
Year Appeared Passed

Analytical View of
HABIGANJ 3651 4279
PASSED(FEMALE)
9975
HSC-15 Number of Students Passed by District and Gender
9097
SUNAMGANJ 3420 3998
MOULVI BAZAR 3553 5055
DISTRICT PASSED(MALE)
SYLHET
7000
8000
9000
10000
MALE FEMALE
Passed Male / Female Students
0
1000
2000
3000
4000
5000
6000
7000
SYLHET HABIGANJ MOULVI BAZAR SUNAMGANJ
Analytical View of
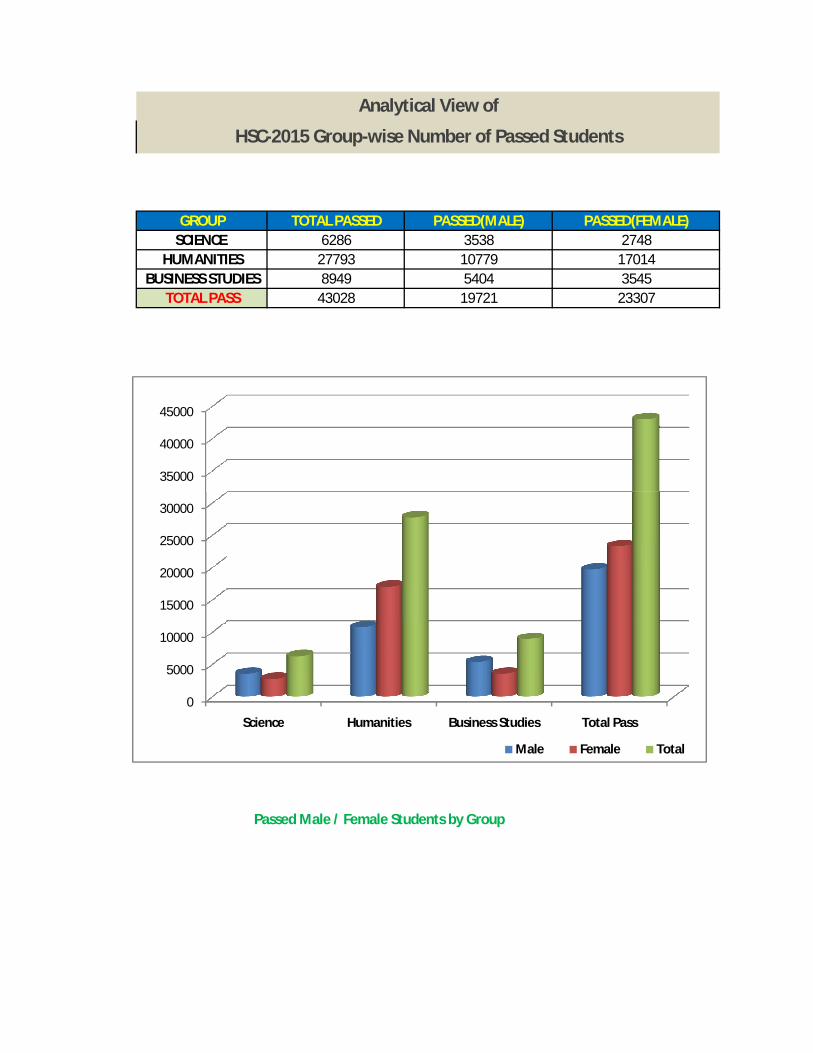
19721
107795404
TOTAL PASSED PASSED(MALE)GROUP3538
8949
HSC-2015 Group-wise Number of Passed Students
PASSED(FEMALE)6286
43028
SCIENCE HUMANITIES
BUSINESS STUDIES
2748170143545
23307TOTAL PASS
27793
35000
40000
45000
Passed Male / Female Students by Group
0
5000
10000
15000
20000
25000
30000
Science Humanities Business Studies Total Pass
Male Female Total
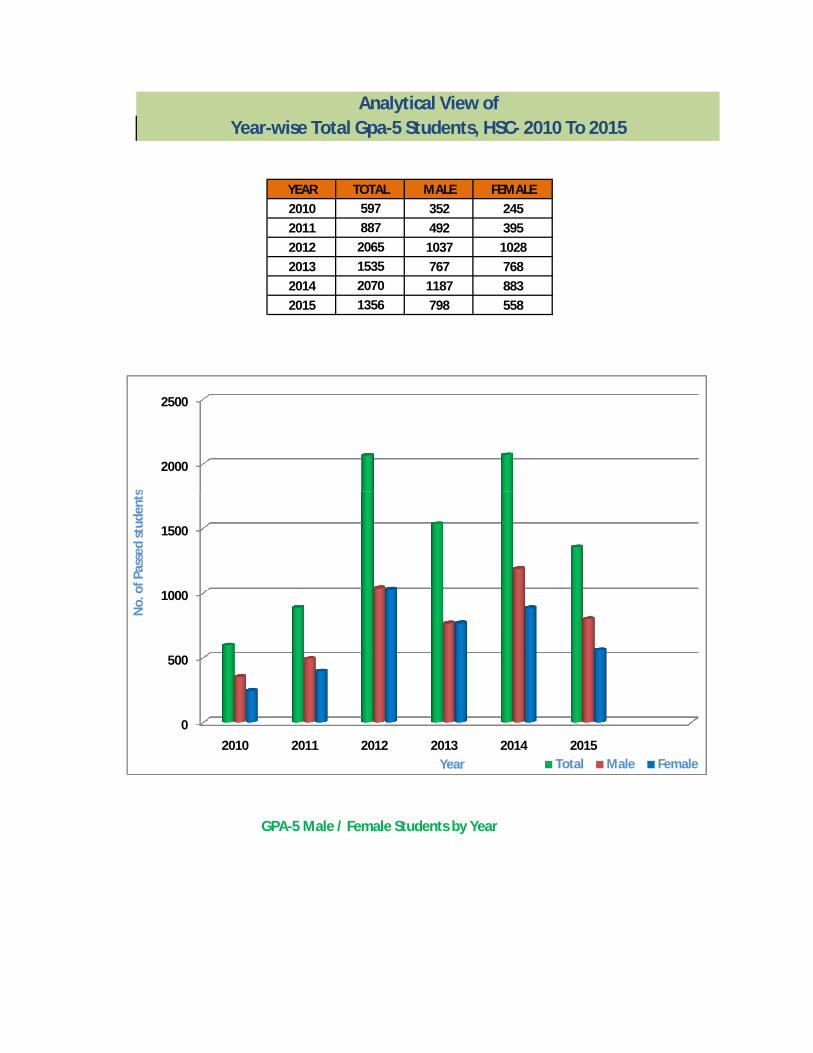
YEAR TOTAL MALE FEMALE
2010 597 352 245
2011 887 492 395
2012 2065 1037 1028
2013 1535 767 768
2014 2070 1187 883
2015 1356 798 558
Year-wise Total Gpa-5 Students, HSC- 2010 To 2015Analytical View of
2000
2500
No.
of P
asse
d st
uden
ts
GPA-5 Male / Female Students by Year
0
500
1000
1500
2010 2011 2012 2013 2014 2015
No.
of P
asse
d st
uden
ts
Year Total Male Female
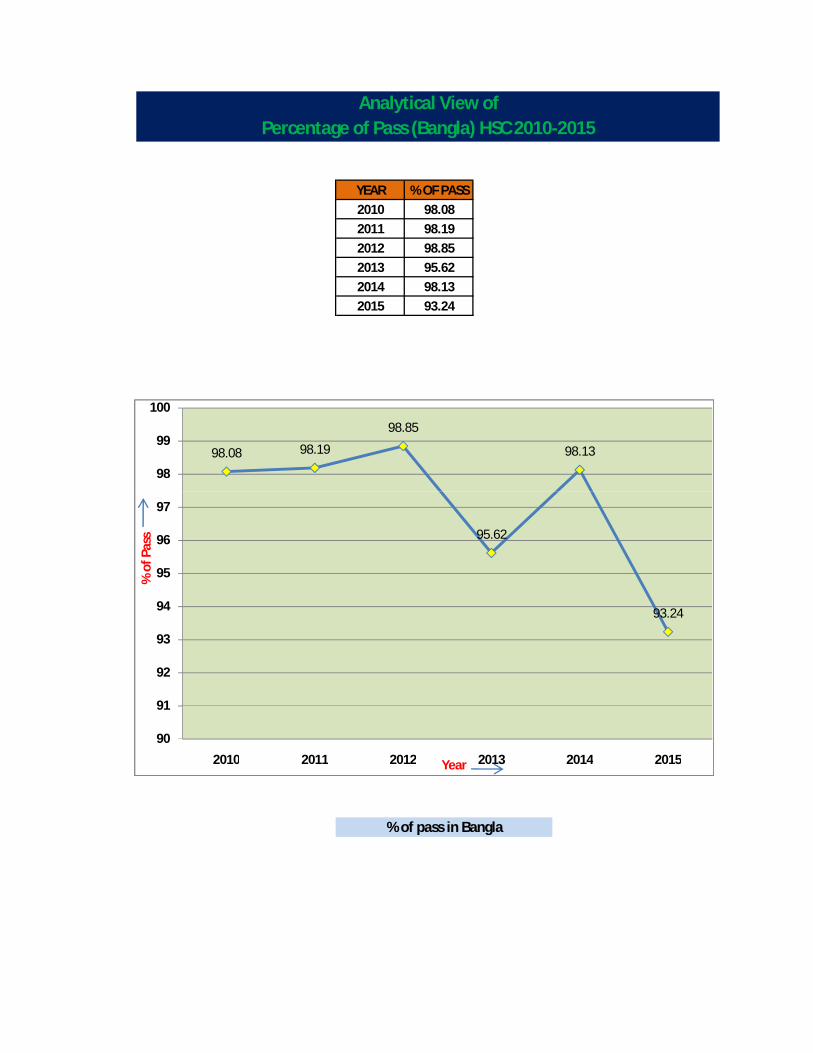
YEAR % OF PASS
2010 98.08
2011 98.19
2012 98.85
2013 95.62
2014 98.13
2015 93.24
Analytical View ofPercentage of Pass (Bangla) HSC 2010-2015
98.08 98.19
98.85
98.13
98
99
100
% of pass in Bangla
95.62
93.24
90
91
92
93
94
95
96
97
2010 2011 2012 2013 2014 2015
% o
f Pas
s
Year
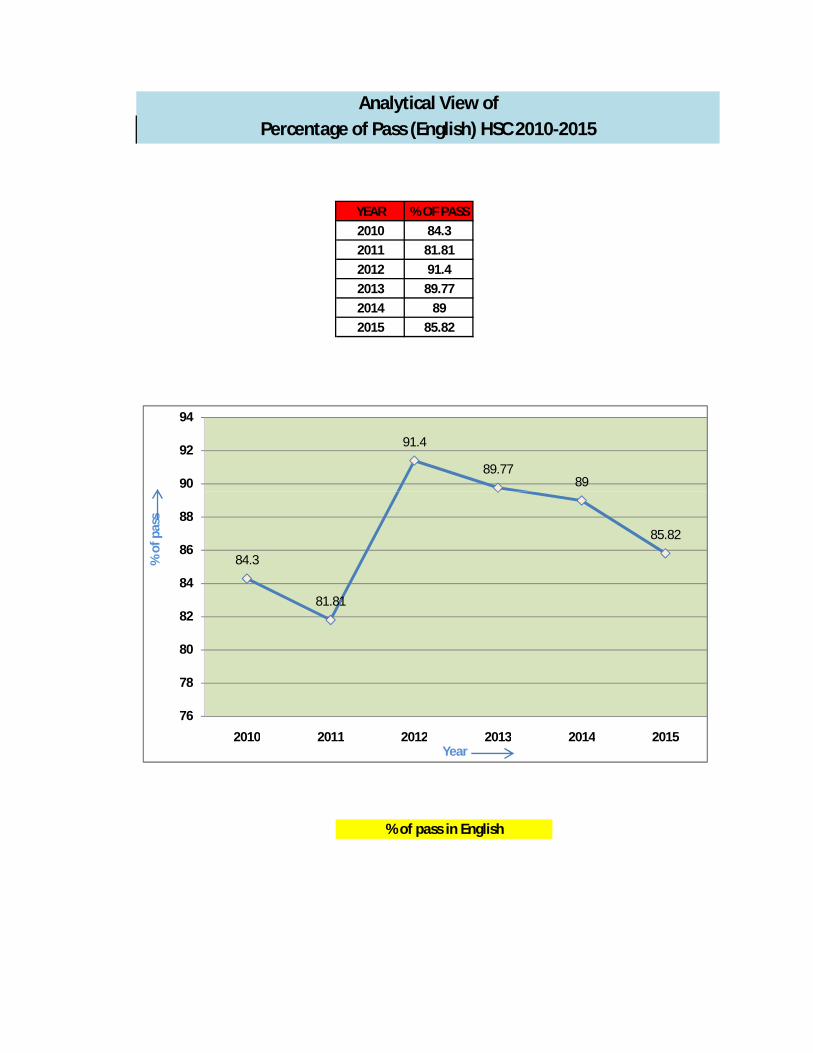
YEAR % OF PASS
2010 84.3
2011 81.81
2012 91.4
2013 89.77
2014 89
2015 85.82
Percentage of Pass (English) HSC 2010-2015Analytical View of
91.4
89.778990
92
94
% of pass in English
84.3
81.81
85.82
76
78
80
82
84
86
88
2010 2011 2012 2013 2014 2015
% o
f pas
s
Year

YEAR % OF PASS
2010 75.62
2011 84.05
2012 87.5
2013 84.55
2014 91.03
2015 92.5
Analytical View ofPercentage of Pass (Physics) HSC 2010-2015
75.62
84.0587.5
84.55
91.03 92.5
70
80
90
100
% of pass in Physics
0
10
20
30
40
50
60
70
2010 2011 2012 2013 2014 2015
% o
f pas
s
Year
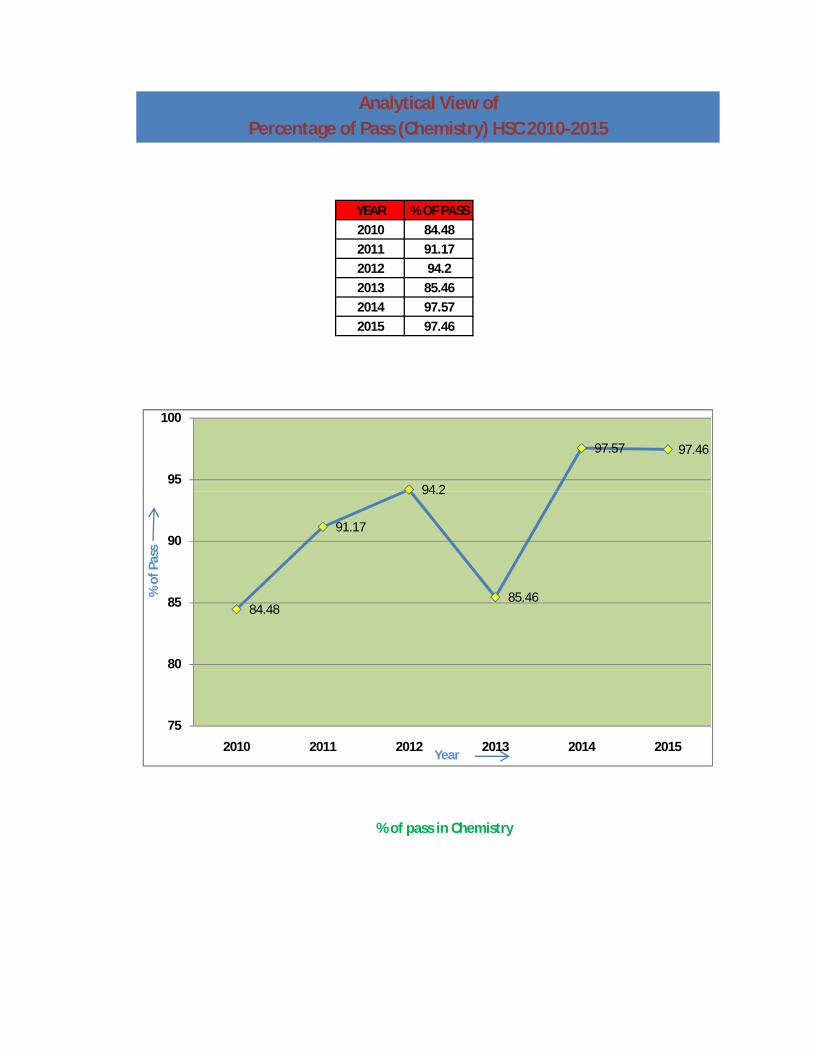
YEAR % OF PASS
2010 84.48
2011 91.17
2012 94.2
2013 85.46
2014 97.57
2015 97.46
Analytical View ofPercentage of Pass (Chemistry) HSC 2010-2015
94.2
97.57 97.46
95
100
% of pass in Chemistry
84.48
91.17
94.2
85.46
75
80
85
90
2010 2011 2012 2013 2014 2015
% o
f Pas
s
Year

Comparative Group-wise and Total % of PassAnalytical View of
Science; 6286
Humanities; 27793
Business Studies; 8949
HSC-2015
Science; 6615
Humanities; 29186
Business Studies; 9789
HSC-2014
Science; 4644
Humanities; 21539
Business Studies; 7836
HSC-2013
2779329186
68
70
72
74
76
78
80
82
84
86
88
2010 2011 2012 2013 2014 2015
% O
F PA
SS
YEAR

No. OF GPA
Gpa-5 1356Gpa 4 to <5 6898
Gpa 3.5 to <4 7673Gpa 3 to <3.5 9922Gpa 2 to <3 15251Gpa 1 to <2 1928
Comparative Graph of Gpa HSC-2015Analytical View of
Gpa-53%
Gpa 1 to <2 1%
COMPARATIVE GRAPH OF GPA, HSC-2015
Gpa 4 to <516%
Gpa 3.5 to <418%
Gpa 3 to <3.523%
Gpa 2 to <335%
1%