bmc proactivenet performance management - emc … · all other bmc trademarks, service marks, ......
TRANSCRIPT

User Documentation July 2012
BMC ProactiveNetPerformance Management -EMC Storage Monitoring
Version 3.1.00

Table of Contents 2
Version 3.1.00
BMC ProactiveNet Performance Management - EMC Storage Monitoring
Table of Contents...........................................................................................................................4Support Information
...........................................................................................................................5Legal Notices
...........................................................................................................................6Key Concepts
...........................................................................................................................6User Goals and Features
...........................................................................................................................6Business Value
...........................................................................................................................7Supported Platforms
...........................................................................................................................8Planning
...........................................................................................................................8Adding Central Monitoring Administration Tags
...........................................................................................................................9Installing
...........................................................................................................................9Preparing for Installation
...........................................................................................................................9Creating a Component Installation Package
...........................................................................................................................11Editing a Component Installation Package
...........................................................................................................................11Downloading and Installing an Installation Package
...........................................................................................................................13Configuring After Installation
...........................................................................................................................13Configuring General Settings
..................................................................................................................14Managing Policies
...........................................................................................................................15Configuring Monitor Settings
..................................................................................................................17Enabling the Debug Mode
..................................................................................................................19Configuring the Discovery Interval
..................................................................................................................20Filtering Volumes to Monitor
..................................................................................................................22Setting Advanced Configuration Variables
..................................................................................................................24Scheduling Automatic Reports
...........................................................................................................................25Configuring Thresholds
...........................................................................................................................28Using BMC ProactiveNet Performance Management - EMC Storage Monitoring
...........................................................................................................................28Navigating the BMC ProactiveNet Operations Console
...........................................................................................................................31Adding attributes to the graph
...........................................................................................................................32Viewing and manipulating attribute graphs
...........................................................................................................................32Viewing monitors for a device
...........................................................................................................................33Changing thresholds
...........................................................................................................................34Managing Baselines and Key Performance Indicators
...........................................................................................................................36Reference Guide
...........................................................................................................................37EMC Disk Array

Table of Contents 3
Version 3.1.00
BMC ProactiveNet Performance Management - EMC Storage Monitoring
...........................................................................................................................38EMC Controller
...........................................................................................................................39EMC Disk Group
...........................................................................................................................40EMC Fiber Port
...........................................................................................................................41EMC Physical Disk
...........................................................................................................................42EMC SMI-S Provider
...........................................................................................................................43EMC Storage Pool
...........................................................................................................................44EMC Volume
...........................................................................................................................45Advanced Configuration Variables

4Support Information
Version 3.1.00
BMC ProactiveNet Performance Management - EMC Storage Monitoring
Support Information
This section contains information about how to contact Customer Support and the levels of supportoffered for this and other releases.
If you have problems with or questions about a BMC product, or for the latest support policies, see theCustomer Support website at http://www.bmc.com/support. You can also access product documentsand search the Knowledge Base for help with an issue at http://www.SentrySoftware.com . If you donot have access to the web and you are in the United States or Canada, contact Customer Support at800 537 1813. Outside the United States or Canada, contact your local BMC office or agent.

5Support Information
Version 3.1.00
BMC ProactiveNet Performance Management - EMC Storage Monitoring
Legal Notices
© Copyright 2011 BMC Software, Inc.
BMC, BMC Software, and the BMC Software logo are the exclusive properties of BMC Software, Inc., areregistered with the U.S. Patent and Trademark Office, and may be registered or pending registration inother countries. All other BMC trademarks, service marks, and logos may be registered or pendingregistration in the U.S. or in other countries. All other trademarks or registered trademarks are theproperty of their respective owners.
Linux is the registered trademark of Linus Torvalds.
Oracle and Java are registered trademarks of Oracle and/or its affiliates. Other names may betrademarks of their respective owners.
UNIX is the registered trademark of The Open Group in the US and other countries.
The information included in this documentation is the proprietary and confidential information of BMCSoftware, Inc., its affiliates, or licensors. Your use of this information is subject to the terms andconditions of the applicable End User License agreement for the product and to the proprietary andrestricted rights notices included in the product documentation.
BM C Softwa re Inc.2101 City W e st Blv d, Houston TX 77042-2827, USA713 918 8800Custom e r Support: 800 537 1813 (Unite d Sta te s a nd Ca na da ) or conta ct y our loca l support ce nte r

6Legal Notices
Version 3.1.00
BMC ProactiveNet Performance Management - EMC Storage Monitoring
Key Concepts
The pages in this section provide a high-level overview of the product.
User Goals and Features
Business Value
Supported Platforms
Note that for convenience and brev ity , re ference to BMC Proactiv eNet Performance Management - EMC StorageMonitoring, may a lso be made as BPPM EMC Storage Monitoring.
User Goals and FeaturesBMC ProactiveNet Performance Management - EMC Storage Monitoring product allows you to view,monitor, and manage your entire EMC storage environment by viewing the current and historicalinformation through a centralized console. You can view detailed system metrics on all parts of yourenvironment.
BMC ProactiveNet Performance Management - EMC Storage Monitoring enables you to manage thefollowing in your environment:
Disk Arrays: overall capacity, available space, overall traffic, available spare disks…
Controllers: CPU utilization, data traffic, cache statistics, response time…
Disk Groups: Consumed Capacity,Read Byte Rate, Subscribed Capacity ...
Fiber Ports: Transfer Byte Rate...
Physical Disks: data traffic, disk time utilization, response time…
Storage Pools: size and capacity, consumed and subscribed capacity, oversubscription problemsdetection (thin provisioning) …
Volumes: data traffic, disk time utilization, response time, mapping, consumed capacity…
Business ValueBMC ProactiveNet Performance Management - EMC Storage Monitoring provides current and historicalinformation through a centralized console so you can easily view and manage your entire EMCenvironment. The product collects and brings critical performance data and useful metrics into the BMCProactiveNet Performance Management environment and enables SAN Administrators to be warnwhenever a problem occurs in their EMC environment.
BMC ProactiveNet Performance Management - EMC Storage Monitoring:
collects storage performance and metrics to keep total control of your SAN environment
identifies performance bottlenecks (physical disks, controllers, fiber links, etc.)
manages and helps rationalize disk space consumption
detects oversubscription situations (thin provisioning)
pinpoints unused disk capacity
analyzes overall traffic and in-depth I/Os, etc

7Key Concepts
Version 3.1.00
BMC ProactiveNet Performance Management - EMC Storage Monitoring
Supported PlatformsBMC ProactiveNet Performance Management - EMC Storage Monitoring supports the following storagedevices:
Supported EMC Symmetrix Systems
Symmetrix DMX™Series (DMX-4, DMX-3, DMX-2)
Symmetrix V-Max Series
Supported EMC CLARiiON Systems
CX4 Series, CX3 Series, CX Series
Supported EMC VNX Systems
EMC VNX series

8Key Concepts
Version 3.1.00
BMC ProactiveNet Performance Management - EMC Storage Monitoring
Planning
Adding Central Monitoring Administration TagsAdding Central Monitoring Administration tags should be taken into consideration before installation.
A policy specifies a set of actions to be taken when a specific condition on the BMC PATROL Agent isfulfilled. A policy enables you to perform the following actions:
Apply specific configuration to one or more BMC PATROL Agents
Configure thresholds and set baselines on BMC ProactiveNet Child Servers
Each policy is assigned a BMC ProactiveNet Central Monitoring Administration tag and each BMC PATROLAgent can have one or more tags assigned to it. When you assign a tag to a BMC PATROL Agent theassociated policy is applied to the PATROL Agent. You can assign the tag value of a policy to a PATROLAgent in the following ways:
You can add a PATROL Agent and set the tag as part of the configuration process that you performfrom Central Monitoring Administration. For details, see Managing downloads in Central MonitoringAdministration.
If the PATROL Agent has already been installed, use PATROL Configuration Manager to set thefollowing ruleset that provides the tags:/AgentSetup/Identification/Tags/TAG/tagName =tagDescription
For example if the tag which has to be applied is oracleTag, the ruleset is as follows/AgentSetup/Identification/Tags/TAG/oracleTag= “ORACLE MONITORING”
In BMC Proactiv eNet version 9.0, the tag descript ion is ignored, and only the tag name is used to eva luate the policy .

9Planning
Version 3.1.00
BMC ProactiveNet Performance Management - EMC Storage Monitoring
Installing
The creation of BMC ProactiveNet Performance Management - EMC Storage Monitoring installationpackage is performed directly from BMC ProactiveNet Central Monitoring Administration. An installationpackage for a component such as EMC Storage can be downloaded and installed on several servers.The component installation package can be edited and saved under a new name.
With Central Monitoring Administration, administrators select monitor installation components, such asthe BMC PATROL Agent and monitoring solutions, from a repository to create an installation package.The components can then be installed together using the installation package. Administrators can reusethe installation packages, or deploy the packages to multiple computers.
Preparing for InstallationThe BMC ProactiveNet Central Monitoring Repository is a requirement on the BMC ProactiveNet CentralServer where Central Monitoring Administration is enabled. The Central Monitoring Repository includesthe current versions of BMC components that you can use with BMC ProactiveNet.
After creating a component installation package, administrators can save the package to the MonitoringInstallation Packages list for future use, or download the package on the current host without saving thepackage. For saved packages, administrators can download and install the package on any host, or edita package.
For supported 64-bit Linux versions, you must insta ll the Linux runtime package, glibc. i686, v ersion 2.3.4 or la ter.W ithout the Linux runtime package, BMC Proactiv eNet component insta lla t ions might fa il.
For further deta ils regarding the BMC Proactiv eNet Centra l Monitoring Administrat ion, please refer to the BMCdocumentation.
Creating a Component Installation PackageIf you want to import the entire repository, first download Central Monitoring Repository files from theBMC Electronic Product Distribution (EPD) facility, or copy the files from your installation kit, to the BMCProactiveNet Central Server file system.
To import a single or custom solution1. In the navigation pane of Central Monitoring Administration, click the Repository drawer and
select Manage Repository.
2. Click Import.
3. In the Import a New Solution dialog box, select Single solution or Custom solution.
4. Browse to a source file in one of the following formats: zip, tar, or tar.gz.The solution must be located on the local computer from which you are running the Central

10Installing
Version 3.1.00
BMC ProactiveNet Performance Management - EMC Storage Monitoring
Monitoring Administration web-based console.
5. (Custom solution, only) provide the following details:
Custom solutions name: The name of the custom solution, as it will be displayed in CentralMonitoring Administration.
Custom solution version: The version number for the custom solution. Values in the first twoversion boxes are required.
6. Click Import.
The selected archive file is imported to the repository and extracted. You can close the window duringthe import process.
To create a component installation package1. In the navigation pane of Central Monitoring Administration, click the Repository drawer and
select Monitoring Repository.
2. Click Add .
3. Select the operating system for which you want to create a package, and then select a platform onwhich you want to install the package.The list of components in the repository that are supported on the specified operating system andplatform is displayed.
4. From the Available components list, select components that you want to include in the package.
5. From the Version list, select the version of the component that you want to include in the package.You can select a specific version or you can select latest, which automatically updates the packagewith the latest versions of the components when new versions of those components are added tothe Central Monitoring Repository. By default, the appropriate BMC PATROL Agent for the operating system and platform that youchose is included in the Selected components list.
6. Click the right arrow button to move the selected components into the Selected components list,and then click Next.The installation wizards for the products that you selected are displayed. They'll vary depending onthe products or components that you selected to include in the package. Go through the wizards tocomplete the installation.
7. The Installation Package Details is displayed. Verify that the operating system and platform arecorrect for the type of package that you want to create. Also verify that the components that youwant to include are listed in the Included Components list. Provide the following information:
Name: Enter a unique name for the package.
(Optional) Description: Enter a description of the package.The description is displayed in the Monitoring Installation Packages list on the MonitoringRepository window.
Format: Select a file compression format for the package.
8. Perform one or both of the following actions:
To save the package for future installation on the current host or other hosts, click SaveInstallation Package.The package is available in the Monitoring Installation Packages list.
To download the package immediately, click Download.
If y ou click Download and do not click Save Insta lla t ion Package, the package is not saved in the MonitoringInsta lla t ion Packages list for la ter use or edit ing.
9. When you are finished, click Close.

11Installing
Version 3.1.00
BMC ProactiveNet Performance Management - EMC Storage Monitoring
Editing a Component Installation PackageYou can edit any part of an existing component installation package except the operating system andplatform.
1. In the navigation pane of Central Monitoring Administration, click the Repository drawer and select Monitoring Repository.
2. (Optional) To filter the list of packages, select an operating system from the Filter by OperatingSystem list.
3. Select the row for a package and click Edit .
4. From the Available components list, add or remove components, and click Next.
5. Perform one or more of the following actions, depending on your requirements:
Edit the installation details of existing components.
Add installation details for new components.
Click Finish Update to skip to the Installation Package Details window.
If y ou add a component to the package, you must complete the conf iguration process. The F inish Update buttonshows an explanatory toolt ip and does not skip to the Insta lla t ion Package Deta ils window.
6. In the Installation Package Details window, modify the following information as needed:
Name: To save your changes to the same package, do not change the name. To save thepackage under a unique name, change the name.
(Optional) Description: Enter a description of the package.The description is displayed in the Monitoring Installation Packages list on the MonitoringRepository window.
Format: Select a file compression format for the installation package.
7. Perform one or both of the following actions:
To save the package for future installation on the current host or other hosts, click SaveInstallation Package.The package is available through the Monitoring Installation Packages list.
To download the installation package immediately, click Download.
If y ou click Download and do not click Save Insta lla t ion Package, the changes are not saved in the MonitoringInsta lla t ion Packages list for la ter use or edit ing.
8. When you are finished, click Close.
Downloading and Installing an InstallationPackageYou can download an installation package and install the components on one or more hosts. Theinstallation runs silently with the information entered during package creation.
RecommendationIf you defined the BMC ProactiveNet Integration Service variable for PATROL Agents in theinstallation package, ensure the agents are started in phases. Do not start newly deployed agents all

12Installing
Version 3.1.00
BMC ProactiveNet Performance Management - EMC Storage Monitoring
at once. Start and configure monitoring for the agents in planned phases to reduce the performanceimpact on the Integration Service nodes and on the BMC ProactiveNet Server associated with theautomatic workflow process.
To download and install an installation package1. From the computer on which you want to install the package, log on to BMC ProactiveNet
Central Monitoring Administration.
2. (Optional) To filter the list of installation packages, select an operating system from the Filter byOperating System list.
3. Click the link for the installation package that you want to download.
4. Through the browser's download dialog box, save the installation package.
5. Extract the installation package as appropriate for your operating system. The package is extractedto the bmc_products directory on the current host.
6. From the bmc_products directory, run the installation utility for your operating system:
(UNIX or Linux) RunSilentInstall.sh
(Microsoft Windows) RunSilentInstall.exe
The package is installed on the current host. If the package includes a BMC PATROL Agent, the agentsends a configuration request by passing its tags to BMC ProactiveNet Central Monitoring Administration,via the Integration Service. Central Monitoring Administration evaluates policies that match the tags,determines the final configuration to be applied, and sends the configuration information back to theagent. Monitoring is based on the configuration information received by the agent.
If no policy matches the tags associated with the agent, the agent does not receive configurationinformation. The agent does not begin monitoring until a matching policy is created.
For further information regarding the Repository management, please refer to the BMC Proactiv eNet Centra lMonitoring Administrat ion documentation.

13Installing
Version 3.1.00
BMC ProactiveNet Performance Management - EMC Storage Monitoring
Configuring After Installation
You configure monitoring of BMC ProactiveNet Performance Management - EMC Storage Monitoringwhen you create a policy. A policy is a template containing the configuration of a PATROL Agent. Apolicy can be assigned to one or more PATROL Agents using a unique tag (Central MonitoringAdministration tag), and a PATROL Agent can be assigned one or more policies with different priorities.
If you have not already added the Central Monitoring Administration tag to your PATROL Agents duringthe solution installation, then you must manually assign the tag after you have configured the policy. Fordetails, see Adding Central Monitoring Administration Tags.
Configuring General SettingsThrough the General tab of the Add Policy dialog, you can create a new policy. A policy specifies a setof actions to be taken when a specific condition on the PATROL Agent is fulfilled. First and foremost,actions include monitor configuration. Once a monitor is configured, policies can also specify thresholdcreation and the setting of baselines. A policy can also include intelligent server-side thresholds so thatIT administrators can immediately be alerted on potential problems.
Field Instructions
Name Enter a policy name. Policy names must be unique. In an environment with tenants, policy names must be unique for a single tenant
Tenant(For environments withtenants)
Select a tenant name. See Policies and tenants for details.
Global indicates a policy applicable to all tenants.
Provider indicates a policy applicable to the cloud service provider
Enable policy Select this option to enable the policy, or clear the option to disable the policy. The option isselected by default. If you clear the option, the policy and its associations remain intact, butthe policy configuration is not applied until the policy is enabled again.
Precedence Enter a number from 0 to 999.
Description (Optional) Enter a policy description.
Tag Enter a Central Monitoring Administration tag.Policies are applied to BMC PATROL Agents with matching tags.Tags are case sensitive and cannot contain spaces or any of the following characters: /, \,{, }, <, >, ‘, “, &.
Policy precedence
When more than one policy is applied to a BMC PATROL Agent and BMC ProactiveNet Child Server,configuration is a union of every attribute defined the policies. If a conflict arises (that is, two policiesconfigure the same attributes), it is resolved in one of the following ways:
Policies with the same tag: If conflicting policies have the same tag, the precedence valuedetermines the order the policies are applied. The policy with the lower number value forprecedence is the policy from which the final configuration is applied.
Policies with different tags: If conflicting policies have different tags, then the policies are

14Configuring After Installation
Version 3.1.00
BMC ProactiveNet Performance Management - EMC Storage Monitoring
applied according to the order they are listed on the BMC PATROL Agent. The policy listed last onthe agent is the policy from which the final configuration is applied.
Managing PoliciesThis topic provides general instructions for the following policy management tasks: editing, deleting,enabling and disabling.
Before you begin
Enable Central Monitoring Administration and log on to Central Monitoring Administration. Enabling andconfiguring Central Monitoring Administration for details.
Policies with only threshold conf iguration or server side conf iguration are applicable only a f ter a policy with monitorconf iguration is applied.
To edit a monitoring policy1. In the navigation pane of Central Monitoring Administration, click the Policies drawer and select a
policy view.
2. Select a policy and click Edit .
3. Edit the Configuring general settings of the policy.
4. Edit information on one or more of the following tabs:
Configuring monitor settings.
Configuring threshold settings.
5. Click Update.
To delete a monitoring policy
Deleting a policy deletes all monitor instances and most settings configured through the policy.Devices remain in the User Groups to which they have been added.
1. In the navigation pane of Central Monitoring Administration, click the Policies drawer and select apolicy view.
2. Select one or more policies and click Delete .
3. Click Yes in confirm deletion.
To enable or disable a monitoring policy
Enable or disable policies for maintenance and troubleshooting. When a policy is disabled, the policy andits associations remain intact, but the policy configuration is not applied until the policy is enabled again.
1. In the navigation pane of Central Monitoring Administration, click the Policies drawer and select apolicy view.
2. Select one or more policies and click Enable or Disable.
15Configuring After Installation
Version 3.1.00
BMC ProactiveNet Performance Management - EMC Storage Monitoring
Configuring Monitor SettingsWhen you create or edit a policy, you can add and configure monitor types. The Add Monitor Typesdialog box presents configuration fields for compatible BMC PATROL monitoring solutions that arelocated in the Central Monitoring Repository. For a list of monitoring solutions that you can configurethrough Central Monitoring Administration, see Monitoring solutions configurable through CentralMonitoring Administration.
For configuration details for a specific monitor type, see the monitor documentation. To configurecustom monitoring solutions through Central Monitoring Administration, ensure the solution is structuredcorrectly; for details, see Building a PATROL Knowledge Module Developers Guide from BMC Supportwebsite.
To configure the Monitor Type settings using the AddMonitor Types dialog box1. In the navigation pane of Central Monitoring Administration, click the Policies drawer and select a
policy view.
2. Click Add to display the Add Policy dialog box.
3. Click the Monitor Configuration tab.
4. Click Add.
5. From the Solution menu, select EMC Storage.
6. From the Version menu, select the required version.
7. From the Monitor Type menu, select the Monitor Type for which you want to add a policy, that isEMC Disk Arrays.
8. Enter the Connection Settings to the EMC SMI-S Provider:

16Configuring After Installation
Version 3.1.00
BMC ProactiveNet Performance Management - EMC Storage Monitoring
EM C Stora ge Configura t ion - Globa l Se tt ings
Hostname: hostname of the system where the EMC SMI-S Provider is running
Port Number: By default, the EMC SMI-S Provider runs on port 5989 when the encryption optionis enabled, or on port 5988 when the encryption is disabled.
Encryption: Select this option to encrypt the connection.

17Configuring After Installation
Version 3.1.00
BMC ProactiveNet Performance Management - EMC Storage Monitoring
9. Enter the WBEM Credentials that will be used to connect to the EMC SMI-S Provider.
10. Click Add to List to save the new connection to the EMC SMI-S Provider.
Enabling the Debug ModeWhen you encounter an issue and wish to report it to Sentry Software, you will be asked to enable theDebug Mode and provide the debug output to the Sentry Software support team.
To enable the debug mode1. In the navigation pane of Central Monitoring Administration, click the Policies drawer and select a
policy view.
2. Click Edit to display the Add/Edit Policy dialog box.
3. Select the policy that applies to the PATROL Agent for which you need to enable the debug mode,and click Edit.
4. Click the Monitor Configuration tab.
5. Click the Advanced button.

18Configuring After Installation
Version 3.1.00
BMC ProactiveNet Performance Management - EMC Storage Monitoring
Ena bling the De but M ode
6. Check the Enable Debug Mode option. The solution will store debug information in a log file. Bydefault debug files are stored in the %PATROL_HOME%/log folder
7. In the Debug End Time field, enter the date and time at which the system must stop logging debuginformation.
8. Click Close to save your settings.
For the debug mode to be enabled, the Enable Debug Mode must be checked and the Debug End Time must beproperly set to a date and t ime in the future.

19Configuring After Installation
Version 3.1.00
BMC ProactiveNet Performance Management - EMC Storage Monitoring
Configuring the Discovery Interval
BMC ProactiveNet Performance Management - EMC Storage Monitoring periodically performs discoveriesto detect new components in your monitored environment. By default, the solution runs a discoveryevery hour, but you can customize this interval to match your specific needs.
To configure the discovery interval1. In the navigation pane of Central Monitoring Administration, click the Policies drawer and select a
policy view.
2. Click Edit to display the Add/Edit Policy dialog box.
3. Select the policy that applies to the PATROL Agent for which you need to configure the discoveryinterval, and click Edit.
4. Click the Monitor Configuration tab.
5. Click the Advanced button.

20Configuring After Installation
Version 3.1.00
BMC ProactiveNet Performance Management - EMC Storage Monitoring
Configuring the Discov e ry Inte rv a l
6. Enter the frequency of the discovery process. Use the spin button to enter the appropriate numberof minutes.
7. Click Close to save your settings.
Filtering Volumes to MonitorBy default, the solution discovers and monitors all volumes in the storage systems. There may be a verylarge number of volumes to monitor and this may represent a important workload to the agents and theBPPM servers. Also, the monitoring of some of these volumes may be irrelevant for various reasons.
You can filter the volumes that will be monitored by the solution. You can either exclude volumes fromthe monitoring or keep only certain volumes.

21Configuring After Installation
Version 3.1.00
BMC ProactiveNet Performance Management - EMC Storage Monitoring
To filter volumes to monitor1. In the navigation pane of Central Monitoring Administration, click the Policies drawer and select a
policy view.
2. Click Edit to display the Add/Edit Policy dialog box.
3. Select the policy that applies to the PATROL Agent monitoring the volumes you need to exclude orkeep in the monitoring process, and click Edit.
4. Click the Monitor Configuration tab.
5. Click the Advanced button.
Se le ct ing Volum e s to m onitor
6. If you specify a regular expression in the Exclude Volumes field, all volumes whose name matcheswith the specified regular expression will be excluded. If you specify a regular expression in the Keep Only Volumes field, only the volumes whose name

22Configuring After Installation
Version 3.1.00
BMC ProactiveNet Performance Management - EMC Storage Monitoring
matches with the specified regular expression will be monitored..
7. Click Close to save your settings.
Setting Advanced Configuration VariablesAdvanced configuration variables are used to manually set variables that are normally not availablethrough the standard interface.These variables should only be set when instructed so by Sentry Software Support.
To configure a variable1. In the navigation pane of Central Monitoring Administration, click the Policies drawer and select a
policy view.
2. Click Edit to display the Add/Edit Policy dialog box.
3. Select the policy that applies to the PATROL Agent for which you need to configure variables, andclick Edit.
4. Click the Monitor Configuration tab.
5. Click the Advanced button.

23Configuring After Installation
Version 3.1.00
BMC ProactiveNet Performance Management - EMC Storage Monitoring
Configuring v a ria ble s
6. In the Configuration Variables section, enter the configuration variables you need to configureand enter the value to be set.
7. Click Add to List.
8. Click Close to save your settings.
You can easily modify or remove a variable by selecting it in the list and clicking either the ModifySelection or the Remove from list buttons.

24Configuring After Installation
Version 3.1.00
BMC ProactiveNet Performance Management - EMC Storage Monitoring
Scheduling Automatic Reports
BMC ProactiveNet Performance Management - EMC Storage Monitoring can automatically produce textreports about the monitored storage systems.
To schedule automatic reports1. In the navigation pane of Central Monitoring Administration, click the Policies drawer and select a
policy view.
2. Click Edit to display the Add/Edit Policy dialog box.
3. Select the policy that applies to the PATROL Agent for which you need to configure the schedulingof automatic reports, and click Edit.
4. Click the Monitor Configuration tab.
5. Click the Schedule button.
Sche duling a utom a tic re ports
6. In the Schedule section, the time at which the report(s) must be generated.
7. Check the Activity report type to automatically generate the following reports:
Disk Array Activity: Reports on Read and Write Bytes for all monitored disk arrays
Controller Activity: Reports on Transfer Bytes for all monitored controllers
Fiber Port Activity: Reports on Transfer Bytes for all monitored fiber ports
Storage Pool Activity: Reports on Read and Write Bytes for all monitored storage pools
Volume Activity: Reports on Read and Write Bytes for all monitored volumes
Disk Group Activity: Reports on Read and Write Bytes for all monitored disk groups
Disk Activity: Reports on Read and Write Bytes for all monitored disk
8. Check LUNs Mapping Table to automatically generate a text report of the LUNs-to-hosts mappingtable.
9. Click Close to save your settings.
The history retention period can be set f rom the PATROL Console or f rom the PATROL Agent using a conf igurationvariable . The default collect ion (retention) period is one day . W henever a stored parameter va lue ex ceeds itsretention period, it is automatica lly de leted f rom the parameter history f ile . Refer to BMC documentation for deta ils.

25Configuring After Installation
Version 3.1.00
BMC ProactiveNet Performance Management - EMC Storage Monitoring
Configuring ThresholdsWhen you are creating or editing a policy, you can add and configure monitor thresholds. The AddThresholds dialog box presents threshold configuration fields for BMC ProactiveNet monitors that areconfigured through Central Monitoring Administration.
For details about baselines and Key Performance Indicators (KPI), see BMC ProactiveNet CentralMonitoring Administration or BMC ProactiveNet documentation or refer to the Managing Baselines andKey Performance Indicators section. For details about the monitored attributes, refer to the specificmonitor type in the Reference Guide section.
Before you begin
Ensure that monitor configuration is complete before thresholds are applied. Thresholds cannot beapplied to monitors that are not configured through Central Monitoring Administration. If you have notdone so already, define general policy details.
To add and configure monitor thresholds1. Open the Add Policy dialog box. Click for steps:
1. In the navigation pane of Central Monitoring Administration, click the Policies drawer and selecta policy view.
2. Click Add , or select an existing policy and click Edit .
2. Select the Threshold Configuration tab and click Add.
A dding a Thre shold
3. In the Add Thresholds dialog box, select an item from each of the following lists: Solution, Version,and Monitor Type. Configuration fields are displayed.
4. In the Scope list, the Instance option is automatically selected. Type an Instance Name string orregular expression to apply threshold configuration to instances with matching patterns. Select

26Configuring After Installation
Version 3.1.00
BMC ProactiveNet Performance Management - EMC Storage Monitoring
Match Device Name to include the associated device and use the entire<deviceName>\<instanceName> string for pattern matching. Instance thresholds are applied to thematched monitor instance names or instance names patterns.You can use the following regular expression patterns for the instance name: ?, +, *, ( ), |, [ ], { },^, $, .If the instance name contains one of the pattern characters (except for *), use a backslash ( \ )before the pattern character. For example, to enter the instance name Storage1 (1), enterStorage1 \(1\).
5. From the Attribute list, select a monitor attribute.
In the A ttribute list, some attributes are designated as key performance indicators (KPIs). Depending on themonitored env ironment and version, the list of KPIs might appear dif ferently in the BMC Proactiv eNet OperationsConsole .
6. From the Type of Threshold list, select the threshold type.
7. Select and enter values for the threshold parameters.
8. To continue configuration, perform one or more of the following actions in the Add Thresholdsdialog box, and then select a different monitor type, version, or solution:
To add the configuration details for the threshold to the Threshold Configuration tab, click the Add button at the bottom of the window.
To return the settings in the current window to default values, click the Reset button at thebottom of the window. The values on the current window are reset. Be sure to click the Addbutton to save the configuration on the Threshold Configuration tab.
9. When you finish configuration, click Close. The configuration details are displayed in the table onthe Threshold Configuration tab.
10. When you finish configuring thresholds, click Save at the bottom of the Add Policy dialog box, orUpdate at the bottom of the Edit Policy dialog box.
After you save or update the policy, new threshold configurations are pushed to BMC PATROL Agentswith matching Central Monitoring Configuration tags.
To edit a threshold configuration1. On the Threshold Configuration tab, select a threshold definition, and click Edit.
2. Edit the configuration values and click Update.
3. When you finish editing the threshold configuration, click Close.
4. To save changes to the policy, click Update at the bottom of the Edit Policy dialog box.
After you update the policy, updated threshold configurations are pushed to BMC PATROL Agents withmatching Central Monitoring Configuration tags.
To delete a threshold configuration1. On the Threshold Configuration tab, select attributes, monitor types, versions, or solutions.
2. Click Delete.
3. After you delete one or more threshold configurations, click Close.
4. To save changes to the policy, click Update at the bottom of the Edit Policy dialog box.
After you update the policy, deleted threshold configurations are removed from BMC PATROL Agentswith matching Central Monitoring Configuration tags.

27Configuring After Installation
Version 3.1.00
BMC ProactiveNet Performance Management - EMC Storage Monitoring
Recommended Thresholds
Thresholds define acceptable high and/or low values for the data collected. Thresholds can be createdas part of a policy that can be applied to multiple monitors types on multiple BMC PATROL Agents. The Reference Guide provides a list of monitor types with their respective attributes and, when meaningful,a recommended threshold.

28Configuring After Installation
Version 3.1.00
BMC ProactiveNet Performance Management - EMC Storage Monitoring
Using BMC ProactiveNetPerformance Management - EMCStorage Monitoring
This section provides a brief overview of how to navigate and use the product in the BMC ProactiveNetOperations Console.
Navigating the BMC ProactiveNet Operations Console
Adding attributes to the graph
Viewing and manipulating attribute graphs
Viewing monitors for a device
Changing Thresholds
For more detailed information, see BMC ProactiveNet User Guide in the PDF product guides.
Navigating the BMC ProactiveNet OperationsConsoleThe BMC ProactiveNet Operations Console is a Web-based application that provides options to navigatethrough BMC ProactiveNet and view all of the information collected and computed by the BMCProactiveNet Server related to events, views, and graphs.
Navigation tree
The navigation tree shows an at-a-glance synopsis of events and views. Event and component foldersare displayed hierarchically and are divided into the following categories, or nodes.
Object Definition
Global node The Global node contains the following default collectors:All Event Collectors—displays the entire event collector hierarchyAll Abnormalities—displays all the abnormality eventsAll Services—displays all the servicesAll Groups—displays all the groupsAll Devices—displays all the devicesBased on permissions, users can create event and component folders under this node to organize theevent view.
My Foldernode
Based on permissions, users can create event and scomponent folders under this node to organize theevent view.
To further organize your display, beneath these top-level folders you can add event and componentfolders, including folders for Component Instances (CIs) associated with a service model. Your ability to

29Using BMC ProactiveNet PerformanceManagement - EMC Storage Monitoring
Version 3.1.00
BMC ProactiveNet Performance Management - EMC Storage Monitoring
add event and component folders depends on your permissions.
The severity icons for a collector dynamically change depending on the severity level of the events forthat collector.
For example, if there is a Critical event on one of the devices, the green icon changes to a red icon,indicating a Critical event. The icons enable you to see the status of devices on your systemimmediately.
For complete details, see the BMC ProactiveNet Getting Started Guide on the BMC Support website.
Navigation drawers
The navigation pane in the Operations Console contains a series of drawers that enable you to navigatethrough BMC ProactiveNet functions and views. You can select which drawers to display in thenavigation pane.
The following table describes the available drawers in the navigation pane and describes their functions.
Drawer Description
Main Provides access to event lists and displays event information and status.
Other cells Lists available remote cells connected to the BMC ProactiveNet Server and monitored by BMCProactiveNet.
Reports Enables you to generate and manage reports based on data collected by BMC ProactiveNet.Note: You must have permission to view this drawer.
Views & graphs Provides options for the management of views and graphs in the Operations Console
Bookmarks Enables you to view, rename, and delete bookmarks of objects and their related views that youcreate in the navigation tree.
Find CI Provides a search mechanism so that you can search for Component Instances that meet thespecified search criteria.Note: You must have permission to view this drawer.
Event and component folders
Event and component folders enable you to organize cells and collectors to make event displaysmeaningful for operators. For example, you might create an event folder for collectors that gatherdatabase warning events and allow only operators who are database administrators access to thatevent folder. You can drag components from one existing folder to another within the top-level folders inthe navigation tree. You also can drag and drop CIs from the Tile or Graph view to an existing folder inthe All Services folder.

30Using BMC ProactiveNet PerformanceManagement - EMC Storage Monitoring
Version 3.1.00
BMC ProactiveNet Performance Management - EMC Storage Monitoring
Event folders
An event folder is a grouping of collectors that shows the relationship of events or abnormalities throughthe hierarchy of the navigation tree. Administrators define event folders and associate them with one ormore collectors. Each level of the collector is shown as a node under the event folder. An event list isassociated with the lowest level nodes of an event folder. The parent level of an event folder representsall of the events or abnormalities associated with the collectors.
Event collectors
Event collectors gather events for display in an event list to provide operators with meaningful groups ofevents or abnormalities and to show relationship through the hierarchy of the nodes in the navigationtree. To access the event list for a collector, operators click the collector node in the navigation tree.Event collectors are dynamic or static. Nodes for dynamic collectors appear or disappear from thenavigation tree based on whether or not events are present that meet the criteria for those collectors.Nodes for static collectors remain in the navigation tree regardless of whether events are present ornot.
Component folders
A component folder is a grouping of groups, services, or devices from several different event lists(collectors) that shows the relationship of groups, services, or devices through the hierarchy of thenavigation tree. Administrators define component folders and associate them with one or more groups,services, or devices. Each level of the component folder is shown as a node under the parentcomponent folder. An event list is associated with the lowest level nodes of a component folder. Theparent level of a component folder represents all of the events associated with the groups, services, ordevices. Component folders are static or dynamic. You populate static component folders by selectingfrom a list of objects. You populate dynamic component folders by creating a query. Static foldersalways contain only the objects that you manually select. Dynamic folders contain the objects that matchthe query, so the contents of these folders can change without further editing.
Operations Console views
The following table shows the different views that are available, depending on what object you select inthe navigation tree. Each view is accessed by clicking the associated Console view icon. If a view is notavailable for the object that is selected in the navigation tree, the icon for that view is not displayed inthe toolbar.
View Description
Event The Event view displays all events in an event list. This is the default view for all objects. Use the Eventview to check the details of events and to address events that highlight incorrect state. Probable CauseAnalysis can help you to identify the cause of the event. An event could be assigned to other users, whocan acknowledge and take ownership of the event, fix the problem, and close the event. You can alsoaddress the incorrect condition by invoking remote actions, detailed diagnostics, and local actions. TheGraph view helps check the impacting service and you can cross-launch to Impact Model Designer, ServiceLevel Manager and Product Catalog in BMC Remedy IT Service Management (BMC Remedy ITSM).You can display an Event view for:

31Using BMC ProactiveNet PerformanceManagement - EMC Storage Monitoring
Version 3.1.00
BMC ProactiveNet Performance Management - EMC Storage Monitoring
View Description
Event collectors
Abnormalities
Services
Groups
Devices
Monitors
Title The Canvas view enables you to you create a graphical representation of the components that are beingmonitored in your environment. The components are represented by objects that you can place on abackground image. The objects can be graphics, such as images or connectors, or metrics informationrepresented in a tile.You can create and display a Canvas view for:
Event collectors
services
Groups
Devices
Tree/Graph
The Tree/Graph view displays information for a selected object as a tree that represents the hierarchy ofthe object. The Tree view is available for groups and services. You can use the Tree view to get a real-time,interactive visualization of the event status and other details of the selected group or service. In the Grouphyperbolic tree, the entire group hierarchy and devices are visible on a hyperbolic pane that is mapped to acircular display region. Service tree is applicable only for the selected service.If a service is selected in the navigation tree, this view displays a graphical representation of theconfiguration items in the service model and shows how those configuration items relate to each other. Usethe Graph view to monitor events for published service models that represent your business services.You can display a Tree/Graph view for:
Services
Groups
Grid Grid view displays information for the selected object in a tabular format. you can view the event status andother details of the selected object through hyperlinks to graphs, views,etc. You can display a Grid view for:
Abnormalities
Groups
Devices
For more detailed information, BMC ProactiveNet Getting Started Guide on the BMC Support website.
Adding attributes to the graphFollowing configuration, only one attribute is enabled for the graph of each monitor. You might want toadd additional attributes to the monitor graph.
1. In the BMC ProactiveNet Operations console, select the Navigation drawer.
2. Select Global > Devices.
3. Select the Grid view.All the monitored devices are displayed in table format.
4. Select a device from the displayed table.
5. Select a monitor.
6. Click Tools >Show Graph
7. Select the Attributes & Indicators tab.

32Using BMC ProactiveNet PerformanceManagement - EMC Storage Monitoring
Version 3.1.00
BMC ProactiveNet Performance Management - EMC Storage Monitoring
8. Select one or more attributes.Up to 12 attributes of a monitor can be displayed on a single graph. Though only two units ofmeasurement can be used.
Viewing and manipulating attribute graphsThe graph provides a visual display of the attributes of a monitor. Up to 12 attributes of a monitor canbe displayed son a single graph.
1. In the BMC ProactiveNet Operations console, select the Navigation drawer.
2. Select Global > Devices.
3. Select the Grid view. All the monitored devices are displayed in table format.
4. Select a device from the table.
5. Select a monitor.
6. Click Tools > Show Graph
If Collect Data is not enabled then no data is ava ilable .
The Graph Display window opens, displaying a graph displaying the values of the selected attributes forthis monitor.You can use the options available on this tab to manipulate the graph. For complete details, refer toBMC ProactiveNet User Guide on the BMC Support website.
Viewing monitors for a deviceThis section provides a brief overview of how to view the monitors for a selected device. For completedetails, refer to BMC ProactiveNet User Guide on the BMC Support website.
To view the Monitor types for a device1. In the BMC ProactiveNet Operations console, select the Navigation drawer.
2. Select Global > Devices.
3. Select the Grid view. All the monitored devices are displayed in table format.
4. Select a device from the table. A hierarchical tree listing the monitors for that device is displayed.You can click the + and - to expand and collapse nodes of the hierarchical tree.

33Using BMC ProactiveNet PerformanceManagement - EMC Storage Monitoring
Version 3.1.00
BMC ProactiveNet Performance Management - EMC Storage Monitoring
The following information is displayed:
Information
Description
Monitor Name Device name or process name, a device might appear more than once if it is monitored by severalPATROL Agents
Monitor Type Name of the monitor type.This will correspond to the element displayed in the Monitor Name column, specifying the type of deviceor process monitored
Source Agent ProactiveNet server where the PATROL Agent and integration service are running
Open Number of open alerts, a green globe is displayed if no alerts are open
Closed Number of closed alerts
Enabled Enabled if data is being collected
Changing thresholdsYou can adjust the thresholds for the attributes of a monitor type either globally or for a specific deviceinstance. In the BMC ProactiveNet Operations console, select the Navigation drawer.
1. Select Global > Devices.
2. Select the Grid view. All the monitored devices are displayed in table format.
3. Select a device from the table.
4. Select a monitor.
5. Select Tools > Thresholds. A menu containing the available thresholds is displayed.

34Using BMC ProactiveNet PerformanceManagement - EMC Storage Monitoring
Version 3.1.00
BMC ProactiveNet Performance Management - EMC Storage Monitoring
Globa l thresholds are applied to a ll monitor instances of the se lected monitor type. Instance thresholds are applied tothe se lected monitor instance.
6. Edit the Threshold settings
7. Click Apply.
Managing Baselines and Key PerformanceIndicatorsIn order to facilitate the detection of abnormalities on your monitored environment, BMC ProactiveNetcalculates baselines per attributes based on values collected over a specified period of time todetermine a normal operating range. When the collected values for these attributes are out of range, analert is triggered.
Some attributes are identified by default as Key Performance Indicators and therefore automaticallyincluded in the base lining calculation.
Managing baselines
The baseline is the expected normal operating range for a metric or attribute of a monitor.
The baseline is calculated by collecting the values for a monitor’s attributes and metrics over a specifiedtime period and establishing a low baseline value (consisting of the 10th percentile of all the values for agiven time period) and a high baseline value (consisting of the 90th percentile of all the values for agiven time period), taking a weighted average of these values over time. A higher weight is given to thelatest data being factored into the baseline average. The accuracy of the baseline improves over time.
Requirements for baseline generation
For baselines to be generated for an attribute, that abnormality threshold means that the thresholdexists and is not suppressed. Additionally, if the Key Performance Indicator (KPI) mode is active, only those attributes that have anactive abnormality threshold and are also KPI attributes will have baselines generated for them.
Absolute thresholds (with "outside base line") or signature thresholds do not satisfy these requirements.
Managing Key Performance Indicators
The KPI attribute of an attribute can be activated or deactivated manually through the BMC ProactiveNetAdministration Console. In this KM, some attributes have been designated as important indicators ofperformance (KPIs). We do not recommend that these default settings are modified.
However, advanced users may activate or deactivate KPIs from the BMC ProactiveNet Administration

35Using BMC ProactiveNet PerformanceManagement - EMC Storage Monitoring
Version 3.1.00
BMC ProactiveNet Performance Management - EMC Storage Monitoring
Console.
To add or remove Key Performance Indicator (KPI) attributes for amonitor type
1. In the Administration Console, from the menu bar, choose Tools > KPI Administration. TheKPI Administration dialog box is displayed.
2. From the Monitor Type list, choose the monitor type for which you want to add or remove KPIattributes. A list of attributes for the selected monitor type is displayed.
3. In the KPI column for the attributes that you want to add or remove as Key Performance Indicators:
select the KPI check box to add the corresponding attribute as a KPI
deselect the KPI check box to remove the corresponding attribute from the KPIs for that monitortype
For complete and deta iled information on this procedure, please refer to the BMC Proactiv eNet documentation ava ilablefrom BMC W eb site .
Attributes for which the system by default calculates baselines as well as attributes considered as KPIsare respectively identified by the following icons:
Baselining
KPI

36Using BMC ProactiveNet PerformanceManagement - EMC Storage Monitoring
Version 3.1.00
BMC ProactiveNet Performance Management - EMC Storage Monitoring
Reference Guide
Introduction
This chapter provides statistical information about resources, operating status, and performancesmanaged by the BMC ProactiveNet Performance Management - EMC Storage Monitoring. It containstables describing the attributes used in the KM, grouped by Monitor Types, and provides a briefdescription of each attribute and its default settings.
Monitor Types
EMC Disk Array
EMC Controller
EMC Disk Group
EMC Fiber Port
EMC Physical Disk
EMC SMI-S Provider
EMC Storage Pool
EMC Volume
Baselines and Key Performance Indicators
Some attributes are identified by default as Key Performance Indicators (KPIs) and thereforeautomatically included in the base lining calculation. To learn more about auto baselining and KPIs,please refer to the Managing Baselines and Key Performance Indicators chapter.
In this guide, attributes flagged as KPIs and included by default in the baseline calculation process arerespectively identified by the following icons:
KPI

37Reference Guide
Version 3.1.00
BMC ProactiveNet Performance Management - EMC Storage Monitoring
EMC Disk Array
Attributes
Name Description Units Recommended AlertConditions
BMCProactiveNetAttributeType
AvailableCapacity
Number of terabytes available in the array TB None Statistics
Read Byte Rate Amount of data read per second MB/s None Statistics
Spare Disk Count Number of spare disk available in the array disks None Statistics
Status Status of the disk array {0=OK; 1=Degraded;2 = Failed}
Warning = 1Alarm = 2
Availability
SubscribedCapacity
Number of terabytes reserved in the array TB None Statistics
Write Byte Rate Amount of data written per second MB/s None Statistics
For detailed information about K P I, see Managing Baselines and Key Performance Indicators.
38Reference Guide
Version 3.1.00
BMC ProactiveNet Performance Management - EMC Storage Monitoring
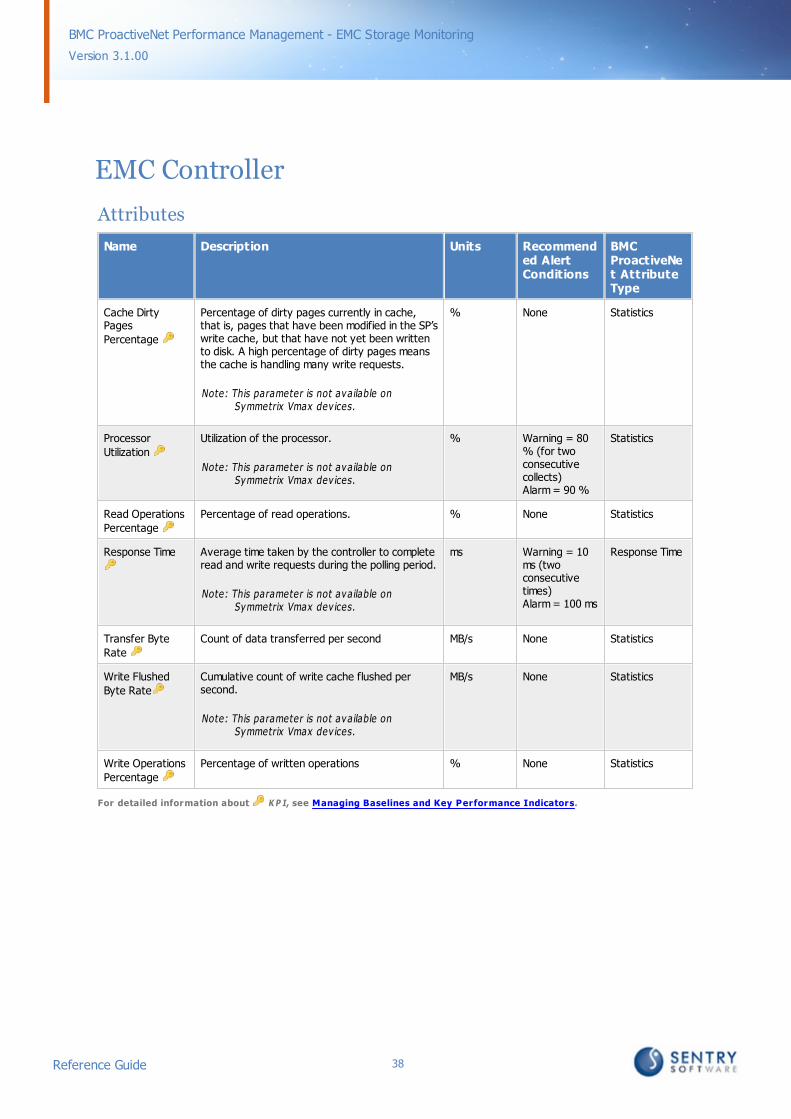
EMC Controller
Attributes
Name Description Units Recommended AlertConditions
BMCProactiveNet AttributeType
Cache DirtyPages
Percentage
Percentage of dirty pages currently in cache,that is, pages that have been modified in the SP’swrite cache, but that have not yet been writtento disk. A high percentage of dirty pages meansthe cache is handling many write requests.
Note: This parameter is not ava ilable onSymmetrix Vmax dev ices.
% None Statistics
Processor
Utilization
Utilization of the processor.
Note: This parameter is not ava ilable onSymmetrix Vmax dev ices.
% Warning = 80% (for twoconsecutivecollects)Alarm = 90 %
Statistics
Read Operations
Percentage
Percentage of read operations. % None Statistics
Response Time Average time taken by the controller to completeread and write requests during the polling period.
Note: This parameter is not ava ilable onSymmetrix Vmax dev ices.
ms Warning = 10ms (twoconsecutivetimes)Alarm = 100 ms
Response Time
Transfer Byte
Rate
Count of data transferred per second MB/s None Statistics
Write Flushed
Byte Rate
Cumulative count of write cache flushed persecond.
Note: This parameter is not ava ilable onSymmetrix Vmax dev ices.
MB/s None Statistics
Write Operations
Percentage
Percentage of written operations % None Statistics
For detailed information about K P I, see Managing Baselines and Key Performance Indicators.

39Reference Guide
Version 3.1.00
BMC ProactiveNet Performance Management - EMC Storage Monitoring
EMC Disk Group
Attributes
Name Description Units Recommended AlertConditions
BMCProactiveNetAttributeType
ConsumedCapacity
Total size of the space actually allocated orreserved
GB None Statistics
ConsumedCapacityPercentage
Percentage of the storage pool that is actuallyallocated or reserved
% None Statistics
Read Byte Rate Amount of data read per second MB/s None Statistics
SubscribedCapacity
Total host visible capacity GB None Statistics
SubscribedCapacityPercentage
Percentage of the disk group that is subscribed.
Note: This parameter can ex ceed 100 % for thinprov isioned storage pools.
% None Statistics
Write Byte Rate Amount of data written per second MB/s None Statistics
For detailed information about K P I, see Managing Baselines and Key Performance Indicators.

40Reference Guide
Version 3.1.00
BMC ProactiveNet Performance Management - EMC Storage Monitoring
EMC Fiber Port
Attributes
Name Description Units Recommended AlertConditions
BMCProactiveNetAttributeType
Transfer Byte
Rate
Count of data transferred per second.
Note: This parameter is not ava ilable onSymmetrix Vmax dev ices.
MB/s None Statistics
Volumes List of volumes available through the FC port (notavailable for back end ports).
n/a n/a n/a
For detailed information about K P I, see Managing Baselines and Key Performance Indicators.
41Reference Guide
Version 3.1.00
BMC ProactiveNet Performance Management - EMC Storage Monitoring
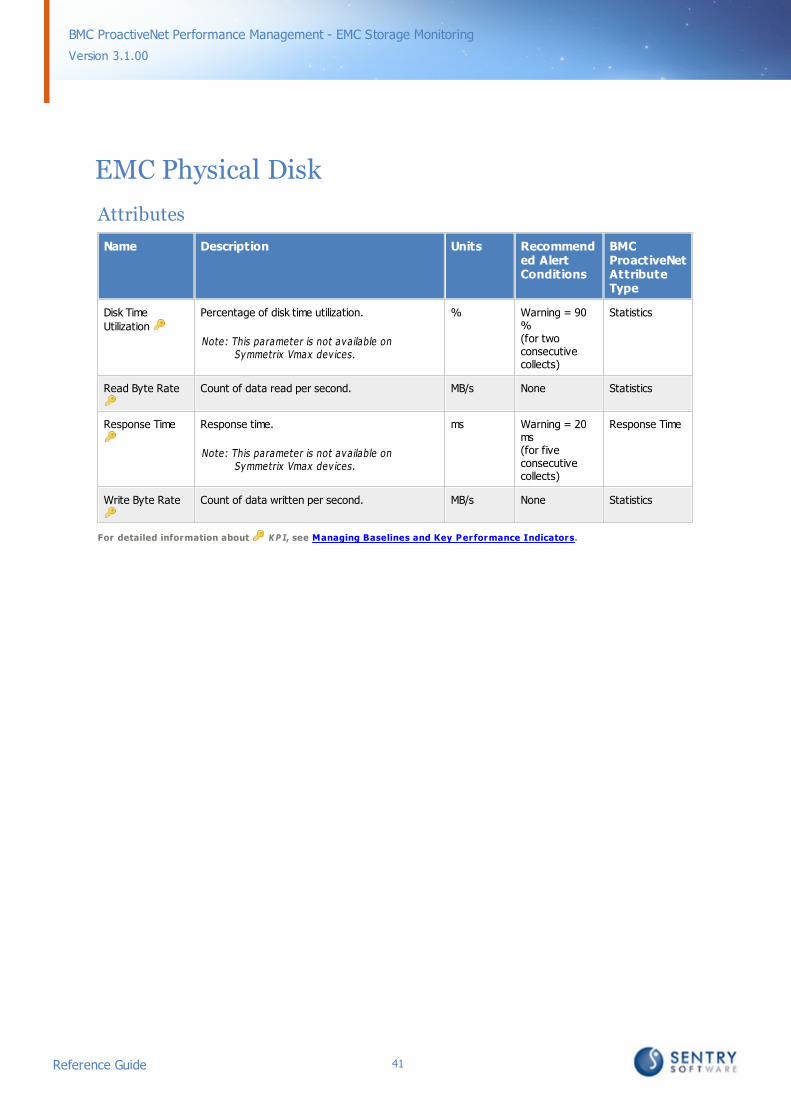
EMC Physical Disk
Attributes
Name Description Units Recommended AlertConditions
BMCProactiveNetAttributeType
Disk Time
Utilization
Percentage of disk time utilization.
Note: This parameter is not ava ilable onSymmetrix Vmax dev ices.
% Warning = 90%(for twoconsecutivecollects)
Statistics
Read Byte Rate Count of data read per second. MB/s None Statistics
Response Time Response time.
Note: This parameter is not ava ilable onSymmetrix Vmax dev ices.
ms Warning = 20ms(for fiveconsecutivecollects)
Response Time
Write Byte Rate Count of data written per second. MB/s None Statistics
For detailed information about K P I, see Managing Baselines and Key Performance Indicators.

42Reference Guide
Version 3.1.00
BMC ProactiveNet Performance Management - EMC Storage Monitoring
EMC SMI-S Provider
Attributes
Name Description Units Recommended AlertConditions
BMCProactiveNetAttributeType
secondaryCollector
Collects the following devices related information:
Paths on Volumes metrics on Symmetrix
Volumes on FC Port metrics that are not oftype "back-ends" on Symmetrix
n/a n/a --
Managed Arrays List of arrays managed by the SMI-S Provider n/a n/a --
Status Status of the SMI-S Provider {0=OK; 1=Degraded;2 = Failed}
Warning = 1Alarm = 2
CollectionStatus

43Reference Guide
Version 3.1.00
BMC ProactiveNet Performance Management - EMC Storage Monitoring
EMC Storage Pool
Attributes
Name Description Unit Recommended AlertConditions
BMCProactiveNetAttributeType
Consumed Capacity Total size of the space actually allocatedor reserved.
GB None Statistics
Consumed CapacityPercentage
Percentage of the storage pool that isactually allocated or reserved.
% None Statistics
Read Byte Rate Amount of data read from the storagepool.
MB/s None Statistics
Subscribed Capacity Total host visible capacity. GB None Statistics
Subscribed CapacityPercentage
Percentage of the storage pool that issubscribed.
Note: This parameter can ex ceed 100 %for thin prov isioned storage pools.
% None Statistics
WriteByteRate Amount of data written to the storagepool.
MB/s None Statistics
For detailed information about B a se lin ing and K P I, see Managing Baselines and Key Performance Indicators.

44Reference Guide
Version 3.1.00
BMC ProactiveNet Performance Management - EMC Storage Monitoring
EMC Volume
Attributes
Name Description Unit Recommended AlertConditions
BMCProactiveNet AttributeType
ConsumedCapacity
Total size of the space actually allocated orreserved
GB None Statistics
ConsumedCapacityPercentage
Percentage of the storage pool that is actuallyallocated or reserved
% None Statistics
Disk Time
Utilization
Percentage of disk time utilization.
Note: This parameter is not ava ilable onSymmetrix Vmax dev ices
% Warning = 80% (for twoconsecutivecollects)Alarm = 90%
Statistics
Hosts List of the Hosts to which the volume is attached. n/a n/a n/a
Host VisibleCapacity
Amount of space on the disk that is assigned tobound LUNs
GB None Statistics
Preferred OwnerStatus
Reports whether the volume is currently ownedby the configured preferred storage controller.
Note: This parameter is not available onSymmetrix Vmax devices.
{0 = Ownedby apreferredcontroller ;1 = NOTowned by apreferredcontroller}
None Availability
Read Byte Rate Count of data read per second MB/s None Statistics
Response Time Average time taken by the controller to completea read and write requests during the pollingperiod.
Note: This parameter is not ava ilable onSymmetrix Vmax dev ices
ms Warning = 10ms (for twoconsecutivecollects)Alarm = 100ms
Response Time
Paths List of the paths to the ports to which the volumeis attached.
Note: This parameter is not ava ilable on EMCC lariion dev ices
n/a n/a n/a
Time Since LastActivity
Number of days since any activity occurred on thevolume
Days None Statistics
Write Byte Rate Count of data written per second MB/s None Statistics
For detailed information about B a se lin ing and K P I, see Managing Baselines and Key Performance Indicators.

45Reference Guide
Version 3.1.00
BMC ProactiveNet Performance Management - EMC Storage Monitoring
Advanced Configuration VariablesThis section lists the advanced configuration variables that can be set in an EMC Storage policy.
Variables DefaultValue
Description
AlertActions n/a List of alert actions to be executed by BMC ProactiveNet Performance Management -EMC Storage Monitoring upon a problem with the managed EMC storage system.
collectorLockTimeout
18000seconds
Time during which the collect is locked and no other collect can be executed.
debugEndTime None Specifies when the debug mode will be disabled. Format required: YYYY/MM/DD HH:MM:SS
debugMode 0 =disabled
When set to '1', enables the debug mode of the KM.Default: Not set
defaultReinitializationOptions
None List of default options to be executed by BMC ProactiveNet PerformanceManagement - EMC Storage Monitoring on reinitialization.
resetThresholds
resetThresholdManagementMode
resetAlertActions
resetOtherAlertSettings
resetDebugMode
resetRemovedPausedObjectList
resetReport
resetSecuritySettings
resetJavaSettings
Insert a colon “;” between the variable and its value: “resetThresholds;1”; and if youenter multiple variables, they need to be separated by a carriage return.Example: “resetThresholds;1” will display the remove thresholds option selected bydefault in the Reinitialize KM wizard.
disableJavaInformationMessage
0 =activated
When set to "1", deactivates the pop-up information message displayed when theJava settings are modified.
disablePslExecuteBugWorkaround
0 =activated
When set to ‘1’, deactivates the workaround in the KM for a bug in the PslExecute()PSL function. If the KM detects that the version of the PATROL Agent is affected by thePslExecute() bug, it uses an alternate technique to create asynchronous threadswith the event_trigger() function and the RemPsl standard event. ThedisablePslExecuteBugWorkaround variable disables this workaround.
discoveryLockTimeout
18000seconds
Time during which the discovery is locked and no other discovery can be executed.
exportActivityReports
None When set to 1, the Activity*.csv report is automatically generated and stored in the%PATROL_HOME%/log folder.
exportLUNsMappingTable
None When set to 1, the LUNsMappingTable*.csv report is automatically generated andstored in the %PATROL_HOME%/log folder.
exportScheduling None When set to 1, enables to periodically generate reports.
forceClassicConfigMode
0 =disabled
When the KM is used with BMC ProactiveNet, all the KM configuration menus aredisabled in the PATROL Consoles. To enable them, set the forceClassicConfigModevariable to 1.

46Reference Guide
Version 3.1.00
BMC ProactiveNet Performance Management - EMC Storage Monitoring
Variables DefaultValue
Description
forceDiscoveryFromSMISProviderCollector
0 =disabled
Set to '1' to force a discovery when the status of an SMI-S Provider changes. Bydefault, no discovery is performed in such case.
nameSpace root/emc Specifies the name of the EMC SMI-S Provider.
pausedObjectList n/a List of the PATROL object path of the paused objects. (i.e. for which no collectionwill be performed).
pemMessages All Indicates how much internal information should be sent as PATROL events.
When set to ‘all’, all internal KM messages (problems and informational messages).
When set to ‘problems’, only errors and problems.
When set to ‘none’, no internal message at all.
This doesn’t affect the reporting of actual hardware problems.
psCommand n/a Command used on UNIX/Linux systems to retrieve the list of the currently runningprocesses.Note: This command is used for debug purpose.
removedObjectList List of instances that have been removed from the monitoring environment throughthe Remove KM Command.
sowMessages All How much internal information should be displayed in the System Output Window inthe PATROL Console.
When set to ‘all’, all internal KM messages (problems and informational messages).
When set to ‘problems’, only errors and problems.
When set to ‘none’, no internal message at all.
This doesn’t affect the reporting of actual hardware problems.
startupDelay 0 second To specify the number of seconds that BMC ProactiveNet Performance Management- EMC Storage Monitoring will wait before starting its discovery. This variable may beuseful on fast booting computers where the EMC SMI-S Provider starts after the KMand triggers an alert.
staticThresholdsParameterList
None Lists the parameters for which thresholds have been customized. Example: /class/PATROL Object ID/Parameter.
tableJoinTimeout 18000seconds
Timeout in seconds when performing a Table Join.
telnetConnectionMethod
Retrievedfrom the KMconfiguration
Default (Windows): Java (if configured in the KM).Note: If the PATROL agent version is 3.6.011 or later the connection method usedby the KM is 'sopen'; otherwise it is left blank.
ThresholdsManagementMode
Retrievedfrom the KMconfiguration
Specifies how the KM should manage the alert thresholds on parameters.Possible values:
'empty' (automatic detection of the suitable threshold management)
‘as’ (through PATROL for Event Management)
‘tuning’ (through the standard "Override parameter" mechanism)
‘none’ (No threshold is set by the KM)
unexpectedStatusInternalIssueNotification
0 =deactivated
When set to 1, the KM will inform you of any internal problems or of any specialoperations it may perform.
unexpectedStatusManagement
None Specifies the action to be performed when the product is unable to interpret a statusvalue.Format: <alarm type>;<internal issue notification>.
47Reference Guide
Version 3.1.00
BMC ProactiveNet Performance Management - EMC Storage Monitoring
Variables DefaultValue
Description
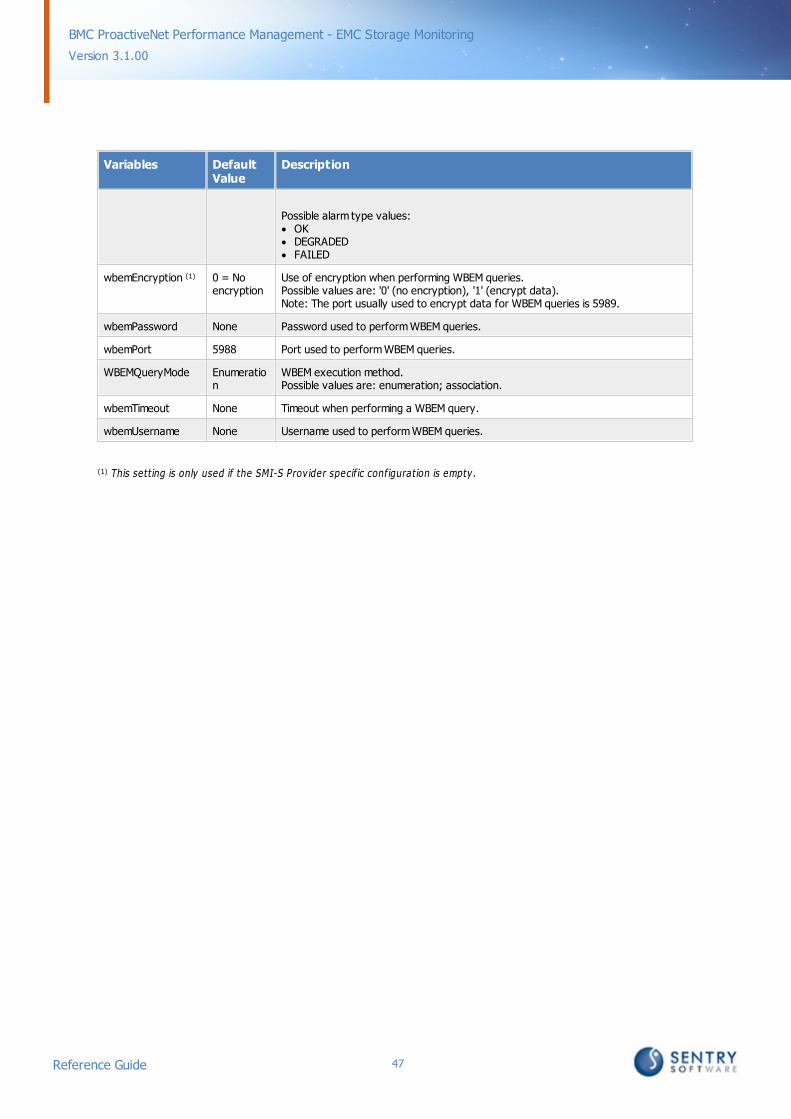
Possible alarm type values:OKDEGRADEDFAILED
wbemEncryption (1) 0 = Noencryption
Use of encryption when performing WBEM queries. Possible values are: '0' (no encryption), '1' (encrypt data).Note: The port usually used to encrypt data for WBEM queries is 5989.
wbemPassword None Password used to perform WBEM queries.
wbemPort 5988 Port used to perform WBEM queries.
WBEMQueryMode Enumeration
WBEM execution method.Possible values are: enumeration; association.
wbemTimeout None Timeout when performing a WBEM query.
wbemUsername None Username used to perform WBEM queries.
(1) This sett ing is only used if the SMI-S Prov ider specif ic conf iguration is empty .

Index 48
Version 3.1.00
BMC ProactiveNet Performance Management - EMC Storage Monitoring
Index
- A -Abnormalities 34
Add Monitor Types 15
Advanced Configuration Variables 22, 45
Attribute 31, 32
Attributes
AvailableCapacity 37
CacheDirtyPagesPercentage 38
ConsumedCapacity 39, 43, 44
ConsumedCapacityPercentage 39, 43, 44
DiskTimeUtilization 41, 44
Hosts 44
HostVisibleCapacity 44
ManagedArrays 42
Paths 44
PreferredOwnerStatus 44
ProcessorUtilization 38
ReadByteRate 37, 39, 41, 43, 44
ReadOperationsPercentage 38
ResponseTime 41, 44
SpareDiskCount 37
Status 37, 42
StatusInformation 37, 42
SubscribedCapacity 37, 39, 43
SubscribedCapacityPercentage 39, 43
TimeSinceLastActivity 44
TransferByteRate 38, 40
Volumes 40
WriteByteRate 37, 39, 41, 43, 44
WriteFlushedByteRate 38
WriteOperationsPercentage 38Automatic Reporting 24
- B -Baselines
BMC ProactiveNet Performance Management 34
Generation 34
Manage 34
Requirements 34BMC ProactiveNet Performance Management
Abnormalities 34
Baselines 34
Key Performance Indicators 34
KPI 34
- C -CLARiiON 7
Component
folders 28Component Installation package
creating 9
downloading 11
editing 11Configuration Variables 22
AlertActions 45
collectorLockTimeout 45
debugEndTime 45
debugMode 45
defaultReinitializationOptions 45
disableJavaInformationMessage 45
disablePslExecuteBugWorkaround 45
discoveryLockTimeout 45
EMCSMISProviderHostname 45
exportActivityReports 45
exportLUNsMappingTable 45
exportScheduling 45
forceClassicConfigMode 45
forceDiscoveryFromSMISProviderCollector 45
nameSpace 45
pausedObjectList 45
pemMessages 45
psCommand 45
removedObjectList 45
sowMessages 45
startupDelay 45
staticThresholdsParameterList 45
tableJoinTimeout 45
telnetConnectionMethod 45
ThresholdsManagementMode 45
unexpectedStatusInternalIssueNotification 45
unexpectedStatusManagement 45
wbemEncryption 45
wbemPassword 45
wbemPort 45
WBEMQueryMode 45

Index 49
Version 3.1.00
BMC ProactiveNet Performance Management - EMC Storage Monitoring
Configuration Variables 22
wbemTimeout 45
wbemUsername 45Configuring
discovery interval 19
monitor settings 15
thresholds 25
- D -Debug Mode
enabling 17Discovery Interval
configuring 19Downloading 11
- E -EMC
CLARiiON 7
Symmetrix 7
VNX 7Event
collectors 28
folders 28
- F -Features 6
- G -General Settings 13
configuring 13Generate
Baselines 34Goals 6
Graphs 31, 32
- I -Information
Closed 32
Enabled 32
Open 32
Source Agent 32Installation 9
configuring 13Installing 9
Preparation 9
- K -Key Concepts 6
Key Performance Indicators
BMC ProactiveNet Performance Management 34
Manage 34KPI
BMC ProactiveNet Performance Management 34
Manage 34
- M -Manage
Baselines 34
Key Performance Indicators 34
KPI 34Monitor
name 32
type 32Monitor Settings
configuring 15Monitor Types
EMC Controller 38
EMC Disk Array 37
EMC Disk Group 39
EMC Fiber Port 40
EMC Physical Disk 41
EMC SMI-S Provider 42
EMC Storage Pool 43
EMC Volume 44Monitoring
volumes 20
- N -Navigation
drawers 28
tree 28

Index 50
Version 3.1.00
BMC ProactiveNet Performance Management - EMC Storage Monitoring
- O -Operations Console views
Event 28
Grid 28
Title 28
Tree/Graph 28
- P -Package 9, 11
PATROL Configuration Manager 8
Platforms
EMC CLARiiON 7
EMC Symmetrix 7
EMC VNX 7
Supported 7Policies 14
Precedence 13
- R -Reference Guide 36
Reports
scheduling 24
- S -Scheduling
Reports 24Support 4
Symmetrix 7
- T -Tag 13
Tags 8
Tenant 13
Thresholds
adding 25
configuring 25
editing 25
modifications 33
recommended 25
- V -Variables 22, 45
VNX 7
Volumes
filtering 20

About BMC® SoftwareBMC Software, Inc. NYSE:BMC, is a leading provider of enterprise managementsolutions that empower companies to manage their IT infrastructure from abusiness perspective. Delivering Business Service Management, BMC Softwaresolutions span enterprise systems, applications, databases, and servicemanagement. Founded in 1980, BMC Software has offices worldwide and fiscal2004 revenues of more than $1.4 billion. For more information about BMC
Software, visit www.bmc.com.
About Sentry Software™Sentry Software, a strategic Technology Alliance Partner of BMC Software,provides key monitoring solutions specifically designed to expand thecapabilities of BMC Performance Manager, thus enabling up to 100% coverage ofany infrastructure. Sentry Software specializes in single solutions for multi-platform monitoring of hardware, custom applications or any IT component, andblackout windows. Sentry Software products are deployed in 45 countries acrossthe globe and lead the list of BMC Software’s third-party product sales. For more
information about Sentry Software, please visit www.sentrysoftware.net.