blueprint for implementing the strategic highway...
TRANSCRIPT

Blueprint for Implementing
the Strategic Highway
Safety Plan at the Local
Level43RD GOVERNOR’S CONFERENCE ON HIGHWAY SAFETY
AUGUST 22 – 24, 2017

Why are we here?
Understand and embrace the SHSP as a guiding document
Propose a methodology for data analysis, stake holder engagement and
task implementation
We don’t have the answers…
trying to empower locals to improve traffic safety in their community using
statewide and local tools

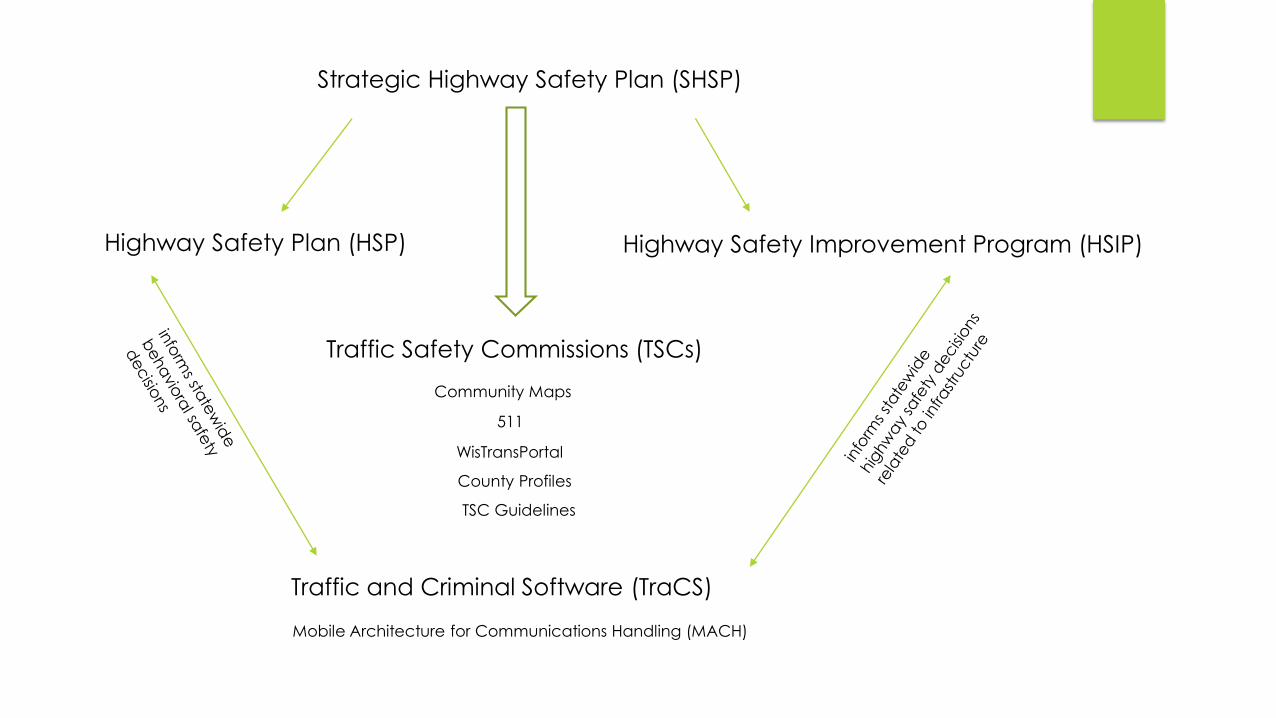
Strategic Highway Safety Plan (SHSP)
Highway Safety Plan (HSP) Highway Safety Improvement Program (HSIP)
Traffic Safety Commissions (TSCs)
Traffic and Criminal Software (TraCS)
Community Maps
511
WisTransPortal
Mobile Architecture for Communications Handling (MACH)
County Profiles
TSC Guidelines

Strategic Highway Safety Plan
3-year plan that articulates strategies for Wisconsin to address highway safety challenges
Identifies:
the foremost highway safety problems in the state
opportunities and processes to address those problems
determines the appropriate approaches and countermeasures
Requires the coordination of:
Local governments and state agencies
The private sector, community organizations, and individual citizens
Local implementation of this plan is a major priority.

Survey (over 1000 people)
Peer Exchange
Task Forces
Writing up the document

Top 10 Issue Areas
Reduce Driver Distraction/Improve Driver Alertness
Reduce Alcohol & Drug-Impaired Driving
Reduce the Incidence and Severity of Motorcycle Crashes
Improve Driver Performance (Teens, Older, Competent)
Improve Non Motorist Safety
Improve Safety of Intersections
Increase Occupant Protection
Curb Aggressive Driving/ Reduce Speed-Related Crashes
Reduce Lane Departure Crashes
Improve Safety Culture, Safety Data, Safety Technology

Active Work Groups
Reduce Driver Distraction/Improve Driver Alertness
Reduce Alcohol & Drug-Impaired Driving
Reduce the Incidence and Severity of Motorcycle Crashes
Increase Occupant Protection
Improve Safety Culture, Safety Data, Safety Technology
Strategic Highway Safety Plan (SHSP)
Highway Safety Improvement Program (HSIP)
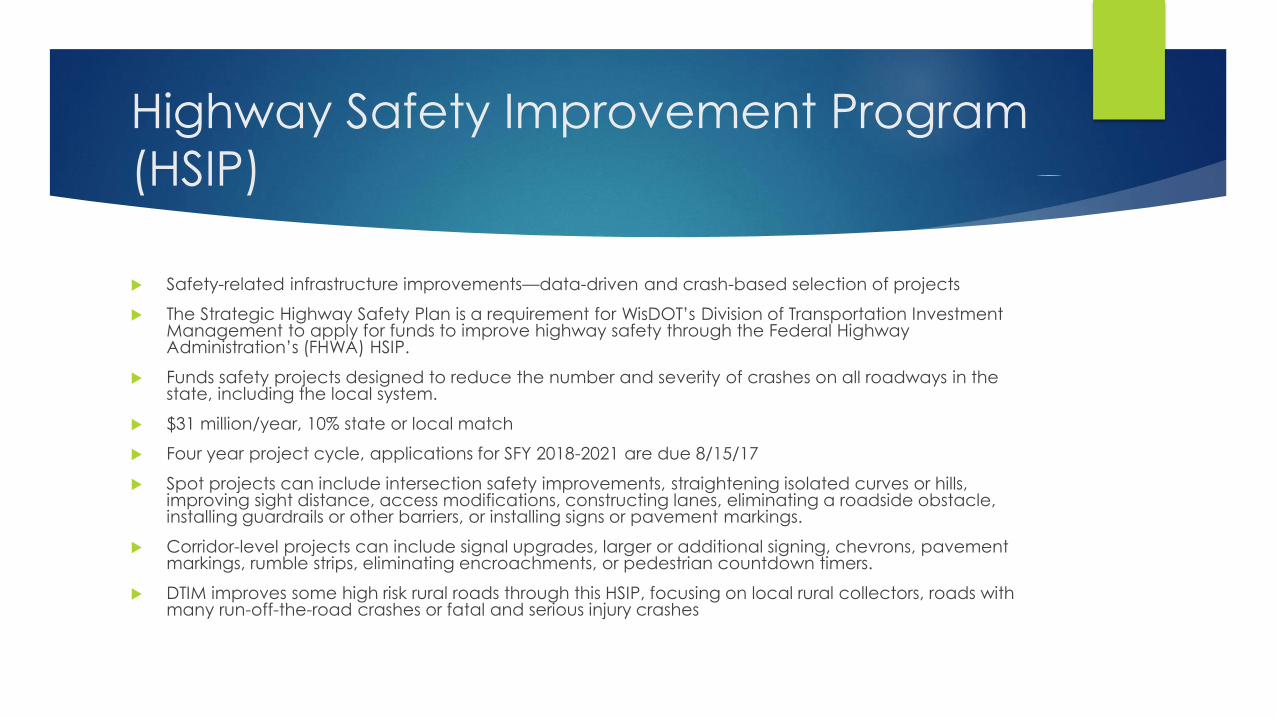
Highway Safety Improvement Program
(HSIP)
Safety-related infrastructure improvements—data-driven and crash-based selection of projects
The Strategic Highway Safety Plan is a requirement for WisDOT’s Division of Transportation Investment Management to apply for funds to improve highway safety through the Federal Highway Administration’s (FHWA) HSIP.
Funds safety projects designed to reduce the number and severity of crashes on all roadways in the state, including the local system.
$31 million/year, 10% state or local match
Four year project cycle, applications for SFY 2018-2021 are due 8/15/17
Spot projects can include intersection safety improvements, straightening isolated curves or hills, improving sight distance, access modifications, constructing lanes, eliminating a roadside obstacle, installing guardrails or other barriers, or installing signs or pavement markings.
Corridor-level projects can include signal upgrades, larger or additional signing, chevrons, pavement markings, rumble strips, eliminating encroachments, or pedestrian countdown timers.
DTIM improves some high risk rural roads through this HSIP, focusing on local rural collectors, roads with many run-off-the-road crashes or fatal and serious injury crashes

Strategic Highway Safety Plan (SHSP)
Highway Safety Plan (HSP) Highway Safety Improvement Program (HSIP)

Highway Safety Plan
$11.6 million annually for behavioral highway safety countermeasures
Annual plan and application for funding from BOTS to NHTSA
Major program areas include occupant protection, impaired driving,
police traffic, traffic records improvement, EMS improvement, motorcyclist
safety, pedestrian and bicyclist safety, community traffic safety, and
media and outreach.
Each major program area identifies countermeasures and projects to
address behavioral highway safety problems.
Strategic Highway Safety Plan (SHSP)
Highway Safety Plan (HSP) Highway Safety Improvement Program (HSIP)
Traffic Safety Commissions (TSCs)
Traffic and Criminal Software (TraCS)
Community Maps
511
WisTransPortal
Mobile Architecture for Communications Handling (MACH)
County Profiles
TSC Guidelines
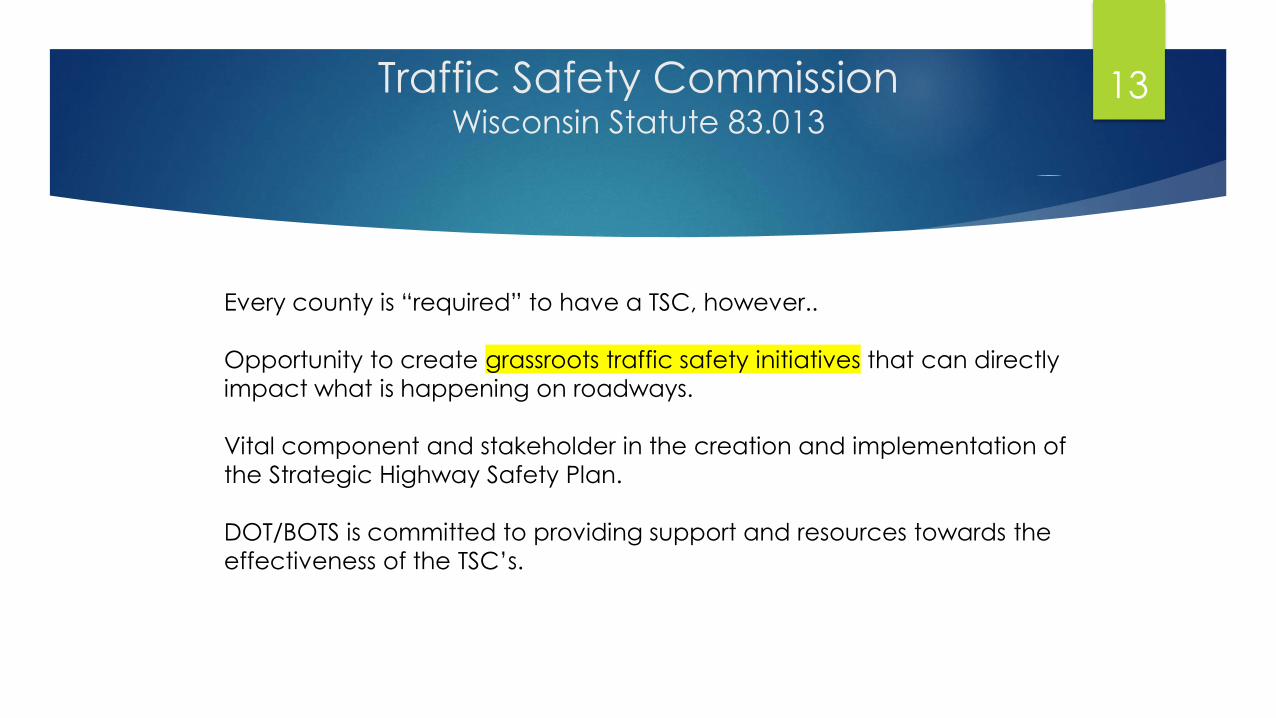
Traffic Safety CommissionWisconsin Statute 83.013
13
Every county is “required” to have a TSC, however..
Opportunity to create grassroots traffic safety initiatives that can directly
impact what is happening on roadways.
Vital component and stakeholder in the creation and implementation of
the Strategic Highway Safety Plan.
DOT/BOTS is committed to providing support and resources towards the
effectiveness of the TSC’s.
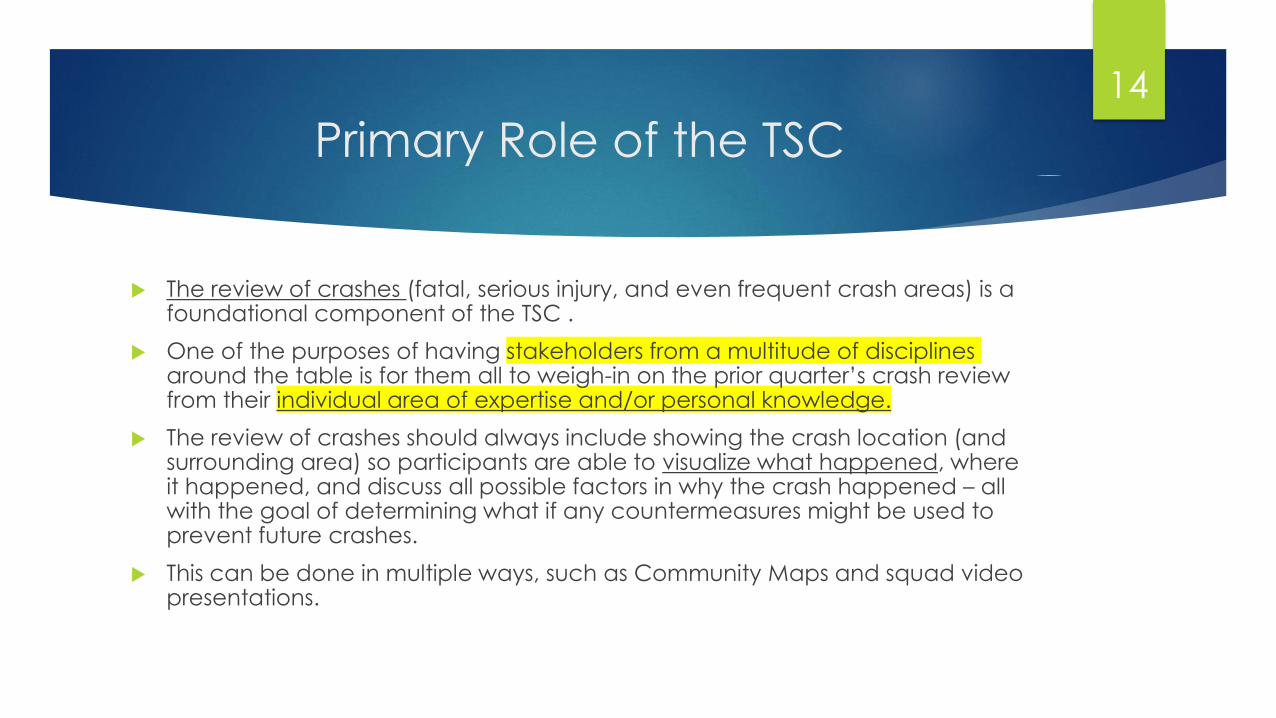
Primary Role of the TSC
The review of crashes (fatal, serious injury, and even frequent crash areas) is a foundational component of the TSC .
One of the purposes of having stakeholders from a multitude of disciplines around the table is for them all to weigh-in on the prior quarter’s crash review from their individual area of expertise and/or personal knowledge.
The review of crashes should always include showing the crash location (and surrounding area) so participants are able to visualize what happened, where it happened, and discuss all possible factors in why the crash happened – all with the goal of determining what if any countermeasures might be used to prevent future crashes.
This can be done in multiple ways, such as Community Maps and squad video presentations.
14

Figure 2: Contributing Factors to Traffic Fatalities

16

NHTSA / WisDOT / DSP / BOTS
Your Traffic Safety Partners (≤ not ≥ or even = )
Support, tools, resources
Potential solutions – not answers
BOTS Staff
Analysts
RPMs
LELs
Traffic Safety Commission Guidelines

County Profiles
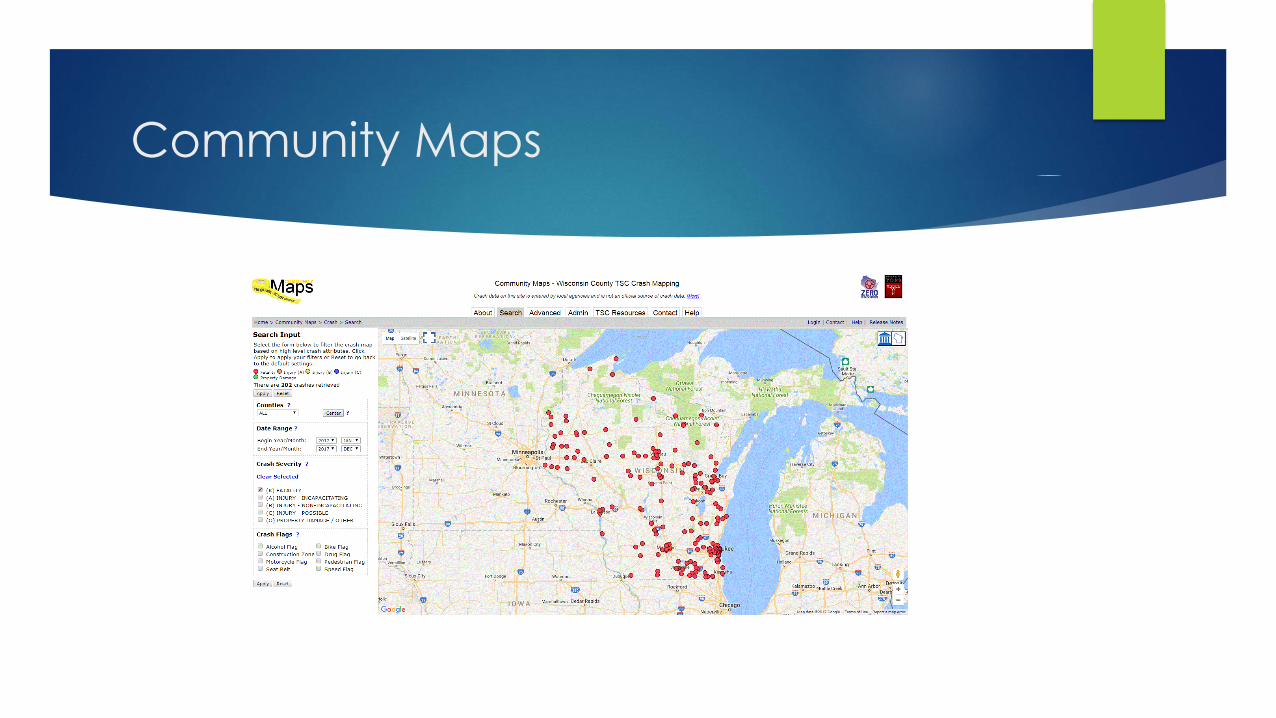
Community Maps
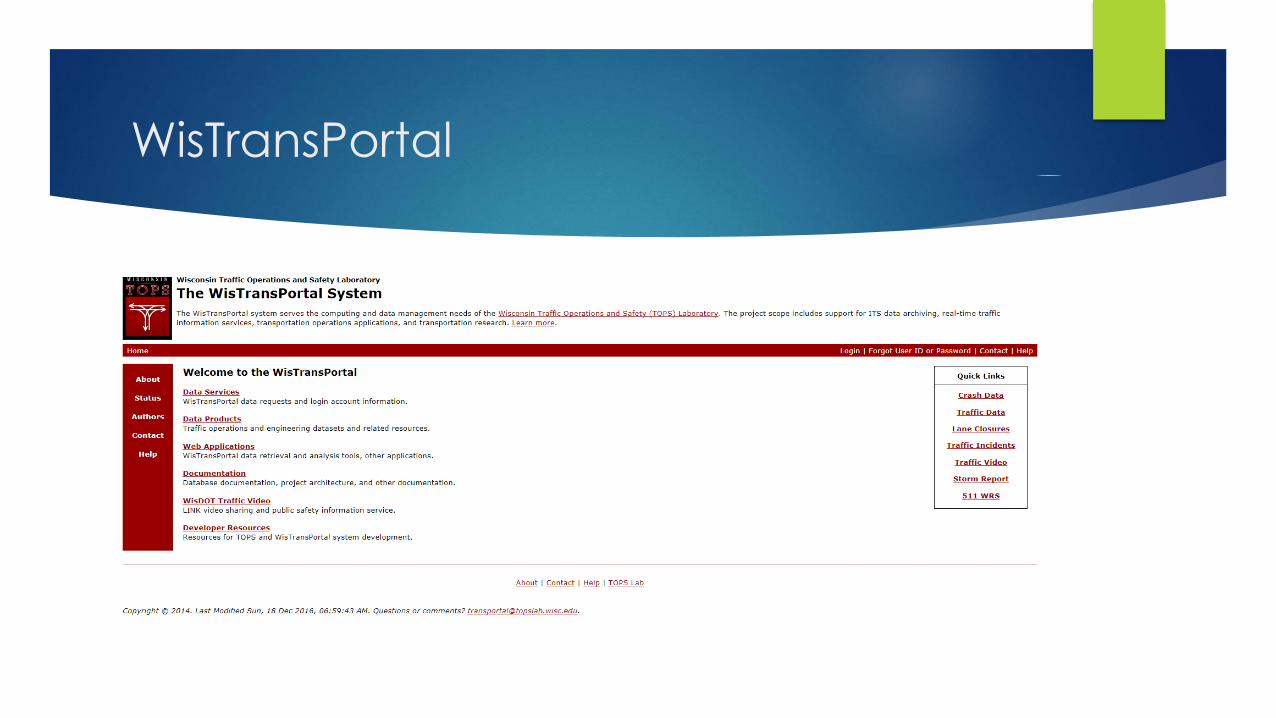
WisTransPortal
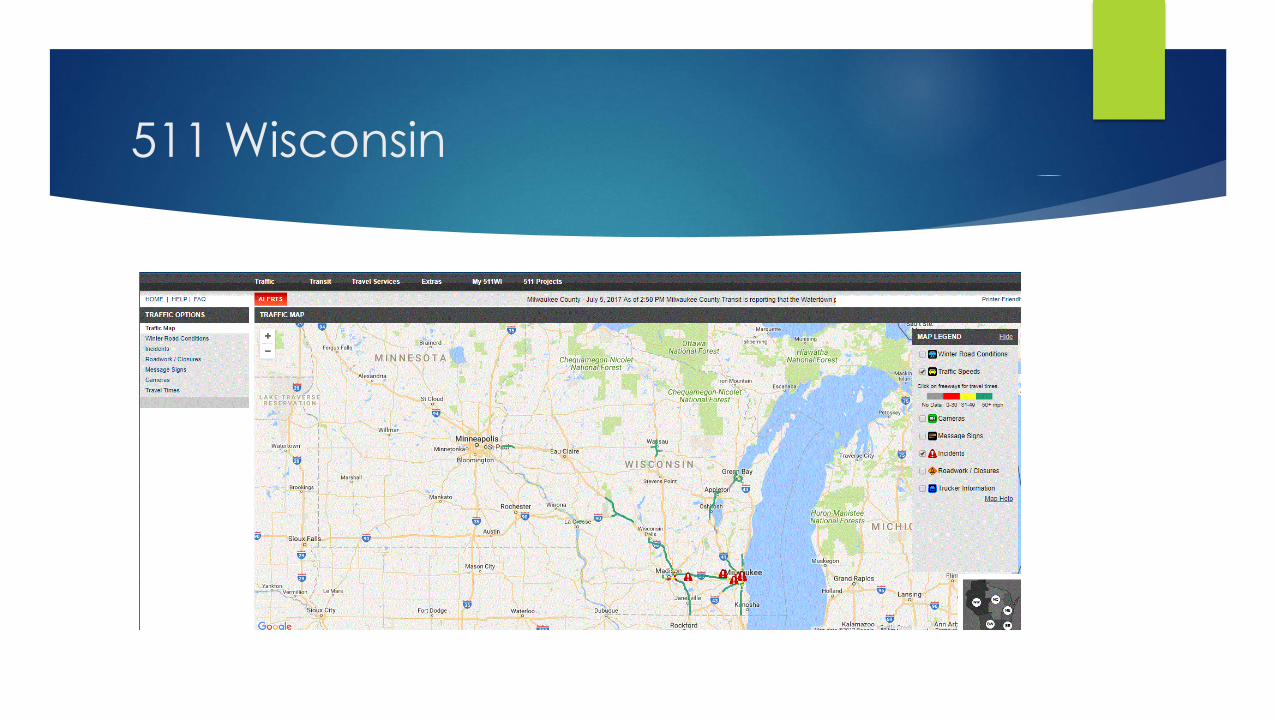
511 Wisconsin
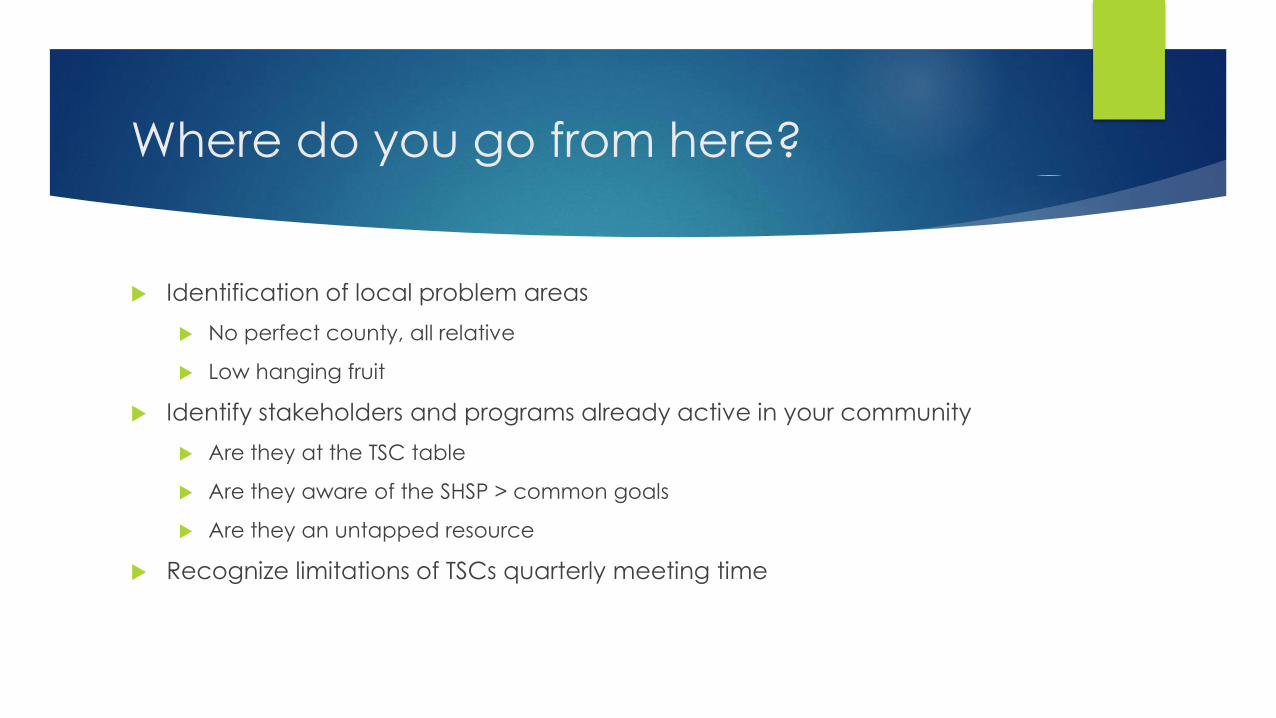
Where do you go from here?
Identification of local problem areas
No perfect county, all relative
Low hanging fruit
Identify stakeholders and programs already active in your community
Are they at the TSC table
Are they aware of the SHSP > common goals
Are they an untapped resource
Recognize limitations of TSCs quarterly meeting time

Starting a TSC Sub-Committee
Grab stakeholders first
Determine what data is available at the state level, but also at the local level.
Research possible countermeasures that the state recommends in the SHSP.
Compare and contrast with local efforts

Not limited to SHSP countermeasures
Create new pilot projects that respond to local concerns.
TSC sub-committees are encouraged to view pilot projects as an opportunity to identify
holes in the state traffic records system and to report back to the DOT on suggested
improvements.
Knowledge sharing with DOT and other TSCs

Building the Blueprint
Identify Problem-Look at
Data
Identify Stakeholders
Identify Action Items (Measurable
Tasks)
Implement
Measure and
Evaluation
Alcohol-RelatedFatality
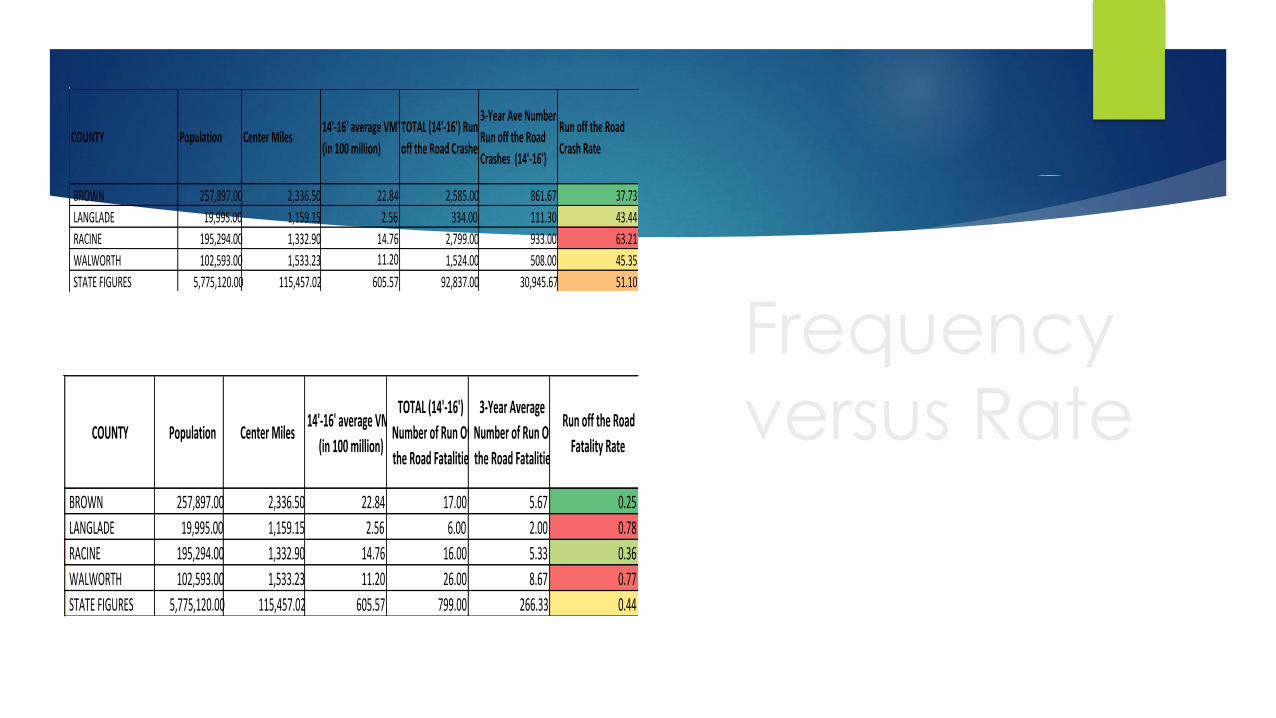
RateCOUNTY Population CenterMiles
14'-16'averageVMT
(in100million)
TOTAL(14'-16')Run
offtheRoadCrashes
3-YearAveNumberof
RunofftheRoad
Crashes(14'-16')
RunofftheRoad
CrashRate
0.20 BROWN 257,897.00 2,336.50 22.84 2,585.00 861.67 37.73
0.65 LANGLADE 19,995.00 1,159.15 2.56 334.00 111.30 43.44
0.45 RACINE 195,294.00 1,332.90 14.76 2,799.00 933.00 63.21
0.54 WALWORTH 102,593.00 1,533.23 11.20 1,524.00 508.00 45.35
0.27 STATEFIGURES 5,775,120.00 115,457.02 605.57 92,837.00 30,945.67 51.10
RunofftheRoad
CrashRateCOUNTY Population CenterMiles
14'-16'averageVMT
(in100million)
TOTAL(14'-16')
NumberofRunOff
theRoadFatalities
3-YearAverage
NumberofRunOff
theRoadFatalities
RunofftheRoad
FatalityRate
37.73 BROWN 257,897.00 2,336.50 22.84 17.00 5.67 0.25
43.44 LANGLADE 19,995.00 1,159.15 2.56 6.00 2.00 0.78
63.21 RACINE 195,294.00 1,332.90 14.76 16.00 5.33 0.36
45.35 WALWORTH 102,593.00 1,533.23 11.20 26.00 8.67 0.77
51.10 STATEFIGURES 5,775,120.00 115,457.02 605.57 799.00 266.33 0.44
Frequency
versus Rate

3 Years ROR Data
62%
0.9%
13%
1%1%
3.5%
22% Driver
Vehicle
Roadway


Lane Departure Tasks


COUNTY Population CenterMiles14'-16'average
VMT(in100million)
TOTAL(14'-
16')Alcohol-
Related
Crashes
3-YearAveofAlcohol-
RelatedCrashes(14'-16')
Alcohol-Related
CrashesCrash
Rate
BROWN 257,897.00 2,336.50 22.84 583.00 194.33 8.51
LANGLADE 19,995.00 1,159.15 2.56 48.00 16.00 6.20
RACINE 195,294.00 1,332.90 14.76 533.00 177.67 12.04
WALWORTH 102,593.00 1,533.23 11.20 316.00 105.30 9.4
STATEFIGURES 5,775,120.00 115,457.02 605.57 15,259.00 5,086.33 8.40
Alcohol-Related
CrashesCrash
Rate
COUNTY Population CenterMiles 14'-16'averageVMT(in100million)
TOTAL(14'-16')
Alcohol-Related
Fatalities
3-YearAverageof
AlcoholRelatedFatalities
(14'-16')
Alcohol-RelatedFatality
Rate
8.51 BROWN 257,897.00 2,336.50 22.84 14.00 4.67 0.20
6.20 LANGLADE 19,995.00 1,159.15 2.56 5.00 1.67 0.65
12.04 RACINE 195,294.00 1,332.90 14.76 20.00 6.67 0.45
9.4 WALWORTH 102,593.00 1,533.23 11.20 18.00 6.00 0.54
8.40 STATEFIGURES 5,775,120.00 115,457.02 605.57 495.00 165.00 0.27

Takeaways – Wrap Up
Proactive versus reactive – with a twist
Grassroot, local programs can be more effective than state/federal
programs
Better data/better knowledge
Not impossible to receive funding for locally grown programs
State doesn’t have all the answers
Who has extra time to do more?
Working smarter - together
Andi Bill
Program Director
608-890-3425
Randy Wiessinger
BOTS Law Enforcement Liaison
608-516-6767