blood volume regulation during hemodialysis robert willem.pdf · blood volume regulation during...
TRANSCRIPT
Blood Volume Regulation During Hemodialysis
Regulatie van bloedvolume tijdens hemodialyse

Blood Volume Regulation During Hemodialysis
Regulatie van bloedvolume tijdens hemodialyse
Proefschrift
Ter verkrijging van de graad van doctor aan
de Erasmus Universiteit Rotterdam
op gezag van de
Rector Magnificus
Prof.dr. S.W.J. Lamberts
en volgens besluit van het College voor promoties.
De openbare verdediging zal plaatsvinden op
woensdag 3 december 2003 om 11.45 uur.
door
Robert Willem Nette
geboren te Vlaardingen
Promotie-commissie
Promotor : Prof.dr. W. Weimar
Overige leden : Prof.dr. D.J.G. M. Duncker
Prof.dr. H.A.P. Pols
Prof.dr. P.M. ter Wee
Copromotor: Dr. R. Zietse
The work presented in this thesis was conducted at the Department of Internal Medicine of the
Erasmus MC, Rotterdam, the Netherlands. Part of the studies in this thesis was supported by a
grant of the Dutch Kidney Foundation (C 95-1514) and Fresenius Medical Care.
This thesis was printed by Haveka B.V., Alblasserdam. The cover of this thesis was designed
by Leendert Nette.

Aan mijn ouders
Contents
Chapter 1. General introduction 9
1.1 Principles of hemodialysis 10
1.2 Hemodialysis related hypotension 13
1.3 Blood and plasma volume during hemodialysis 13
1.4 Patient related factors affecting the blood pressure 14
response to hemodialysis
1.5 Dialysis related factors affecting the blood pressure
response to hemodialysis 16
1.6 Strategies to improve blood pressure stability during
hemodialysis 18
1.7 Aim of the thesis 20
Chapter 2. A Simulation study on the intercompartmental fluid shifts
during hemodialysis. 31
ASAIO J 2000;46:81-94
Chapter 3. Variability of Relative Blood Volume during hemodialysis. 71
Nephrol Dial Transplant 2000;15:673-679
Chapter 4. Increase in blood volume during dialysis without ultrafiltration. 85
Blood Purif 2001;19:33-38
Chapter 5. Specific effect of the infusion of glucose on blood volume
during hemodialysis. 99
Nephrol Dial Transplant 2002;17:1275-1280
Chapter 6. Hypotension during hemodialysis results from an impairment
of arteriolar tone and left ventricular function. 113
Clin Nephrol 2003 (Accepted for publication)
Chapter 7. Norepinephrine-induced vasoconstriction results in decreased
blood volume. 129
Submitted
Chapter 8. Hemodynamic response to Lower Body Negative Pressure
in hemodialysis patients. 143
Am J Kidney Dis 2003;41:807-813
Chapter 9. Summary and conclusions 157
List of publications
Chapter 10 Samenvatting 163
Curriculum vitae
Dankwoord

General Introduction
Chapter 1: General Introduction
9
Chapter 1
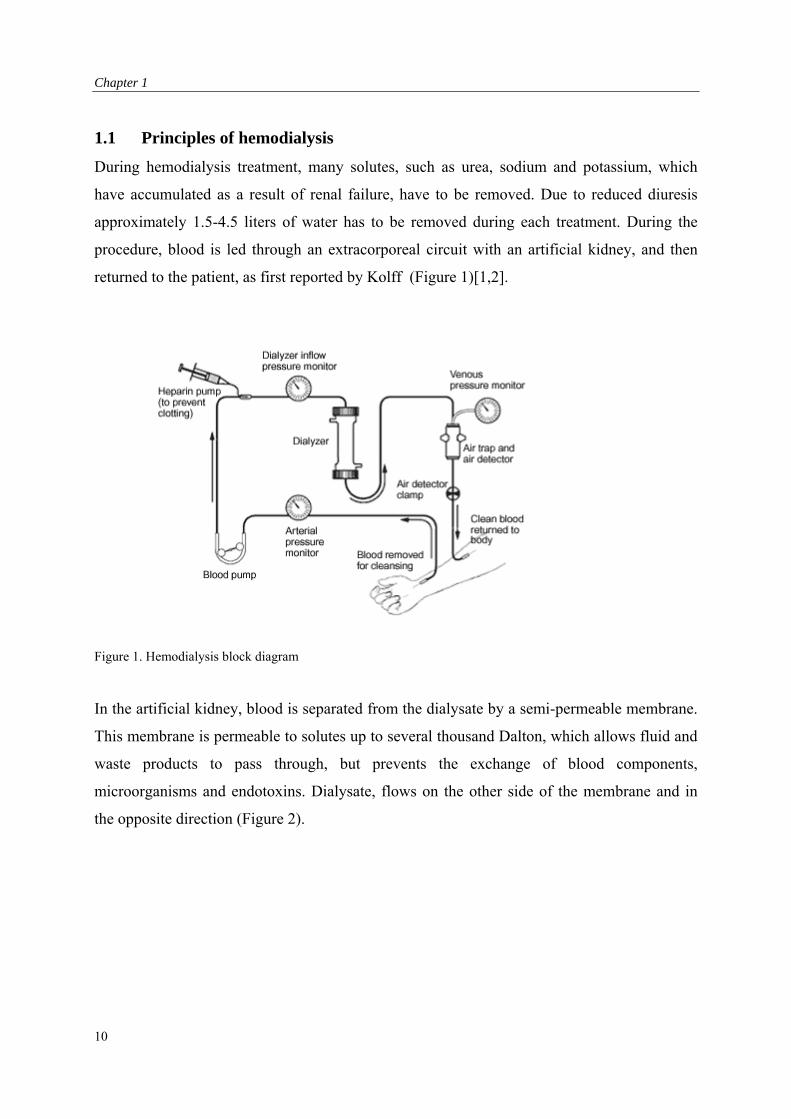
1.1 Principles of hemodialysis
During hemodialysis treatment, many solutes, such as urea, sodium and potassium, which
have accumulated as a result of renal failure, have to be removed. Due to reduced diuresis
approximately 1.5-4.5 liters of water has to be removed during each treatment. During the
procedure, blood is led through an extracorporeal circuit with an artificial kidney, and then
returned to the patient, as first reported by Kolff (Figure 1)[1,2].
Figure 1. Hemodialysis block diagram
In the artificial kidney, blood is separated from the dialysate by a semi-permeable membrane.
This membrane is permeable to solutes up to several thousand Dalton, which allows fluid and
waste products to pass through, but prevents the exchange of blood components,
microorganisms and endotoxins. Dialysate, flows on the other side of the membrane and in
the opposite direction (Figure 2).
10
General Introduction
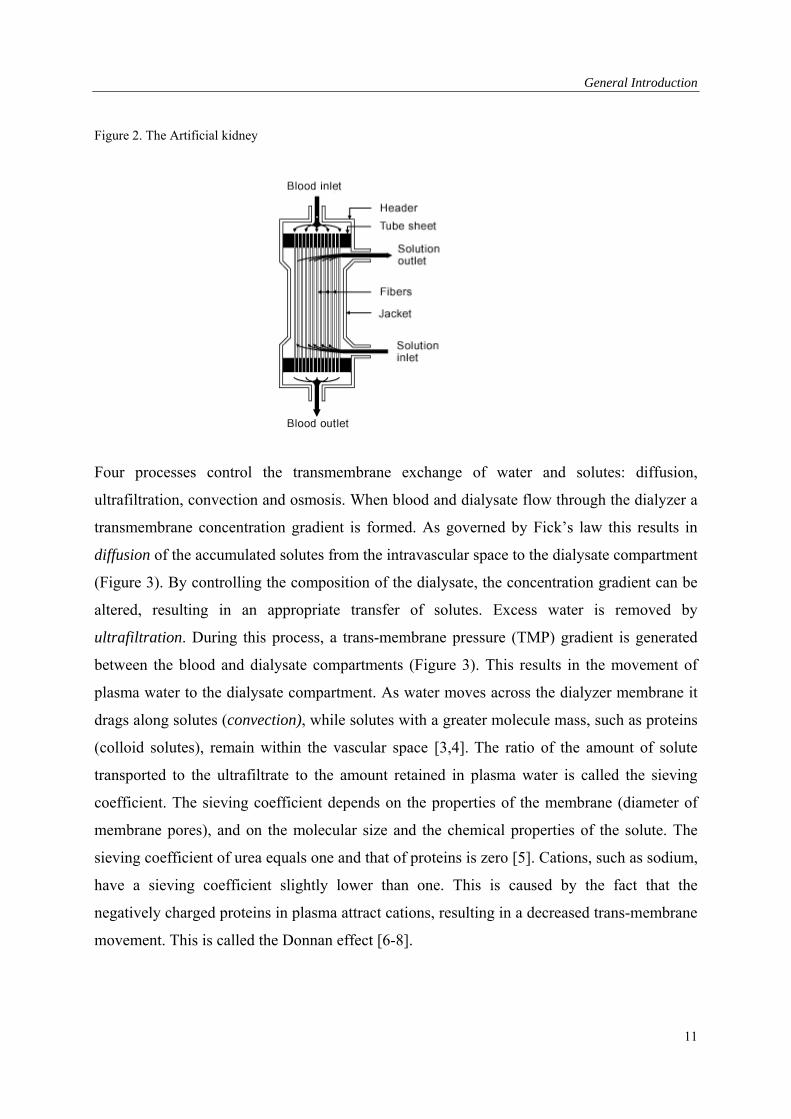
Figure 2. The Artificial kidney
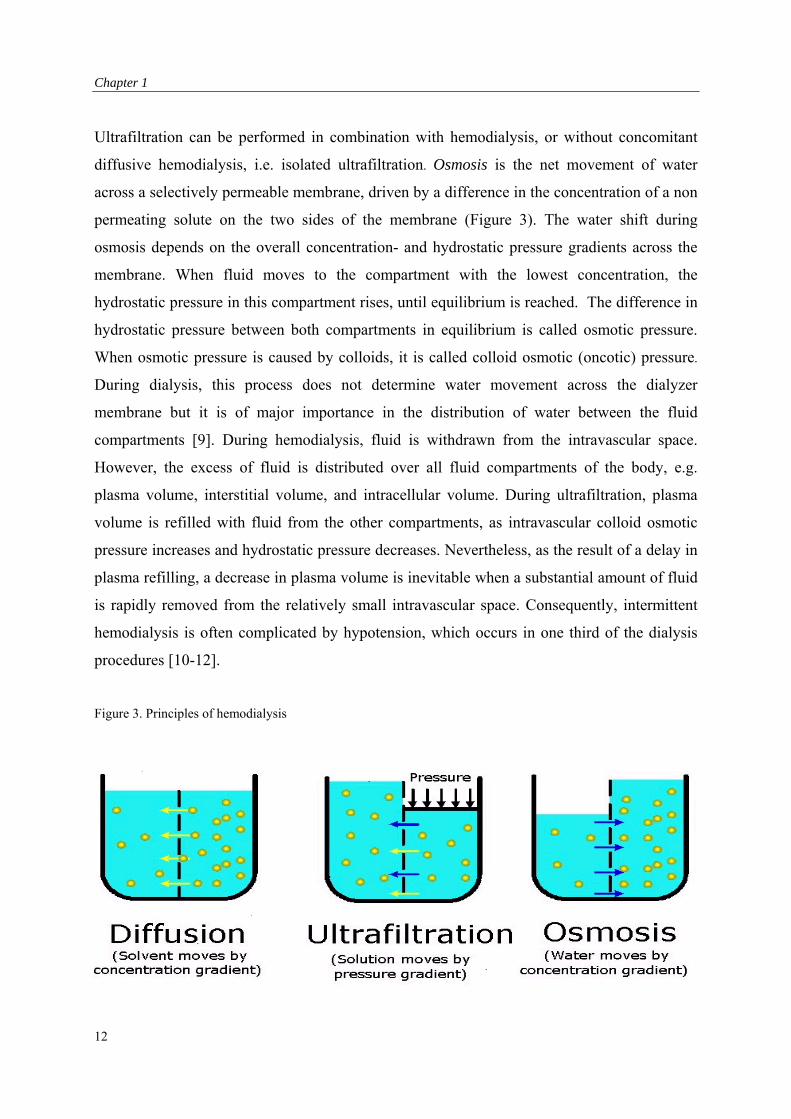
Four processes control the transmembrane exchange of water and solutes: diffusion,
ultrafiltration, convection and osmosis. When blood and dialysate flow through the dialyzer a
transmembrane concentration gradient is formed. As governed by Fick’s law this results in
diffusion of the accumulated solutes from the intravascular space to the dialysate compartment
(Figure 3). By controlling the composition of the dialysate, the concentration gradient can be
altered, resulting in an appropriate transfer of solutes. Excess water is removed by
ultrafiltration. During this process, a trans-membrane pressure (TMP) gradient is generated
between the blood and dialysate compartments (Figure 3). This results in the movement of
plasma water to the dialysate compartment. As water moves across the dialyzer membrane it
drags along solutes (convection), while solutes with a greater molecule mass, such as proteins
(colloid solutes), remain within the vascular space [3,4]. The ratio of the amount of solute
transported to the ultrafiltrate to the amount retained in plasma water is called the sieving
coefficient. The sieving coefficient depends on the properties of the membrane (diameter of
membrane pores), and on the molecular size and the chemical properties of the solute. The
sieving coefficient of urea equals one and that of proteins is zero [5]. Cations, such as sodium,
have a sieving coefficient slightly lower than one. This is caused by the fact that the
negatively charged proteins in plasma attract cations, resulting in a decreased trans-membrane
movement. This is called the Donnan effect [6-8].
11
Chapter 1
Ultrafiltration can be performed in combination with hemodialysis, or without concomitant
diffusive hemodialysis, i.e. isolated ultrafiltration. Osmosis is the net movement of water
across a selectively permeable membrane, driven by a difference in the concentration of a non
permeating solute on the two sides of the membrane (Figure 3). The water shift during
osmosis depends on the overall concentration- and hydrostatic pressure gradients across the
membrane. When fluid moves to the compartment with the lowest concentration, the
hydrostatic pressure in this compartment rises, until equilibrium is reached. The difference in
hydrostatic pressure between both compartments in equilibrium is called osmotic pressure.
When osmotic pressure is caused by colloids, it is called colloid osmotic (oncotic) pressure.
During dialysis, this process does not determine water movement across the dialyzer
membrane but it is of major importance in the distribution of water between the fluid
compartments [9]. During hemodialysis, fluid is withdrawn from the intravascular space.
However, the excess of fluid is distributed over all fluid compartments of the body, e.g.
plasma volume, interstitial volume, and intracellular volume. During ultrafiltration, plasma
volume is refilled with fluid from the other compartments, as intravascular colloid osmotic
pressure increases and hydrostatic pressure decreases. Nevertheless, as the result of a delay in
plasma refilling, a decrease in plasma volume is inevitable when a substantial amount of fluid
is rapidly removed from the relatively small intravascular space. Consequently, intermittent
hemodialysis is often complicated by hypotension, which occurs in one third of the dialysis
procedures [10-12].
Figure 3. Principles of hemodialysis
12
General Introduction
1.2 Hemodialysis related hypotension
Dialysis-induced hypotension has been defined as a decrease in systolic blood pressure (SBP)
to below 100 mmHg and/or a decrease in SBP of 25% or more during the dialysis session
[13]. Hypotension is a major cause of morbidity such as dizziness, vomiting and
lightheadedness [14], but also affects the prognosis of the patient through cardiac, cerebral
and mesenteric ischaemia [15-17]. The decrease in blood volume, caused by ultrafiltration
and delayed plasma refilling from the interstitial space plays a pivotal role in the pathogenesis
of dialysis related hypotension [18-21]. Moreover, compensatory mechanisms, such as
vasoconstriction, that mobilizes blood to the central active blood volume that participates in
maintaining blood pressure, may be inadequate during hemodialysis [22-25]. As it is desirable
to minimize the frequency of dialysis associated hypotension, the physiology of these
compensatory mechanisms during dialysis and ultrafiltration needs to be studied and
strategies to improve blood volume preservation and the cardiovascular response during
dialysis needs to be devised.
1.3 Blood and plasma volume during hemodialysis
Plasma Volume
During ultrafiltration, the driving forces for plasma refilling (J ref) are the decrease in
hydrostatic pressure and the increase in colloid osmotic pressure gradients over the capillary
membrane, as given by the formula of Starling:
J ref = Lp (- p) [26,27].
Thus, plasma refilling is determined by the water filtration coefficient (Lp), which depends on
the total membrane surface area and the permeability of the capillary membrane. The colloid
osmotic pressure gradient () and the hydrostatic pressure gradient (p) also determine
capillary refilling.
Active blood volume
During hypovolemia, the compensatory response to maintain Mean Arterial blood Pressure
(MAP) must act on total peripheral resistance (TPR) or on cardiac output (CO = Stroke
Volume (SV) x Heart Rate (HR)) as:
MAP = TPR x SV x HR
13
Chapter 1
A substantial percentage of the total blood volume is located in the venous system and its
capacity can change markedly. This blood volume is “inactive” and does not contribute to
blood pressure. During hypovolemic hypotension, venoconstriction mobilizes blood towards
the central circulation. This increases stroke volume and helps to maintain blood pressure
[28]. Both vasoactive hormones and the sympathetic nervous system regulate venous tone.
However, venous tone also interacts with arterial pressure by means of the de Jager Krogh
phenomenon. As arteriolar vasoconstriction decreases filling and reduces blood flow of the
vascular bed, venous recoil of the compliant venous system reduces venous capacity and
venous blood is translocated to the heart [29,30]. Arteriolar vasoconstriction, like venous
vasoconstriction, results from sympathetic activation. An afferent signal to the medulla
oblongata is given by the cardiopulmonary receptors (located in the atria and the pulmonary
veins) and the baropressor receptors (located in the aorta and in the carotid artery) [31].
Norepinephrine (NE) is then released by the efferent nerves and causes vasoconstriction [32].
During sympathetic activation cardiac contractility (systolic function) and heart rate are
increased [31,32]. However, from animal studies and studies using beta blockade and cardiac
denervation, it can be concluded that during hypovolemia cardiac output is predominantly
determined by cardiac filling [33,34]. Therefore, diastolic left ventricular function is of major
importance in maintaining adequate cardiac output during hypovolemia. Diastolic function is
the capacity of the ventricles to relax and to accept blood without a disproportionate change in
ventricular pressure. When diastolic function is inadequate, stroke volume decreases rapidly
during an ultrafiltration-induced reduction in cardiac filling [35].
1.4 Patient related factors affecting the blood pressure response to hemodialysis
The incidence of hypotension is not uniform in all patients on hemodialysis. Some patients
appear to be hypotension prone, whereas others are hypotension-resistant. In the hypotension
prone patients, not all dialysis sessions lead to hypotension.
Fluid status
In hypervolemic patients hydrostatic interstitial pressure is high. This will induce a rapid fluid
shift from the interstitial intravascular compartment during ultrafiltration. Conversely, when
14
General Introduction
the patient is near normovolemia, or at hypovolemia, refilling is diminished, as fluid in the
interstitial space is depleted and interstitial hydrostatic pressure is low [36-39].
It is important to determine the fluid status of the individual patient. Normovolemia is
difficult to determine and clinically normovolemia is defined as the lowest possible body
weight after dialysis (dry weight) without the occurrence of intradialytic symptoms. However,
as some patients need antihypertensive drugs to control interdialytic hypertension a more
objective measure of normovolemic weight is required. The diameter of the inferior caval
vein has been proposed as a more objective measure of dry weight. Underhydration is defined
as a vena cava diameter < 8 mm/m2 body surface area, and overhydration as an inferior caval
diameter >11.4 mm/m2 body surface area [40]. In some patients, increasing the target weight
to clearly hypervolemic levels may be the only way to provide a therapy without recurrent
dialysis hypotension. However, overhydration has unfavorable cardiovascular effects, such as
left ventricular hypertrophy leading to diastolic dysfunction.
Autonomic function
Renal failure often results from diabetes and/or hypertension, which lead to cardiovascular
abnormalities, such as heart failure [41,42]. Moreover, an increasing proportion of the
dialysis patients are elderly. In diabetics [43], in patients with congestive heart failure [44,45],
and the elderly [46,47] cardiopulmonary and pressoreflex function are often impaired, leading
to inadequate vasoconstriction and cardiac contractility. Renal failure per se could also lead to
autonomic insufficiency due to accumulation of metabolic waste products [48-51]. Impaired
vasoconstriction could directly affect plasma volume preservation by a change in hydraulic
pressure (p) the total surface area (Lp) in Starling’s formula. However, in most studies, a
causal relation between a diminished baroreceptor function and dialysis related hypotension
could not be shown [52-55].
Systolic and diastolic left ventricular function
The volume and pressure overload caused by overhydration, anemia and arterio-venous
shunts lead to arterial stiffness and left ventricular hypertrophy. Both will affect the
cardiovascular response during hypovolemia [56-59]. Structural abnormalities of the cardiac
wall such as left ventricular hypertrophy or coronary ischaemia could lead to impaired cardiac
15
Chapter 1
relaxation, which in turn results in a reduction of the compliance of the left ventricle (diastolic
dysfunction) [60-61]. In clinical studies it has been shown that dialysis patients with an
impaired left ventricular relaxation are particularly sensitive to hemodialysis induced
hypotension [62]. ACE inhibitors or calcium antagonists may improve diastolic function in
the long term, but these drugs may also induce hypotension. The most important strategy
remains the prevention of left ventricular hypertrophy through timely and adequate treatment
of hypertension, anemia and overhydration in the pre-dialysis phase.
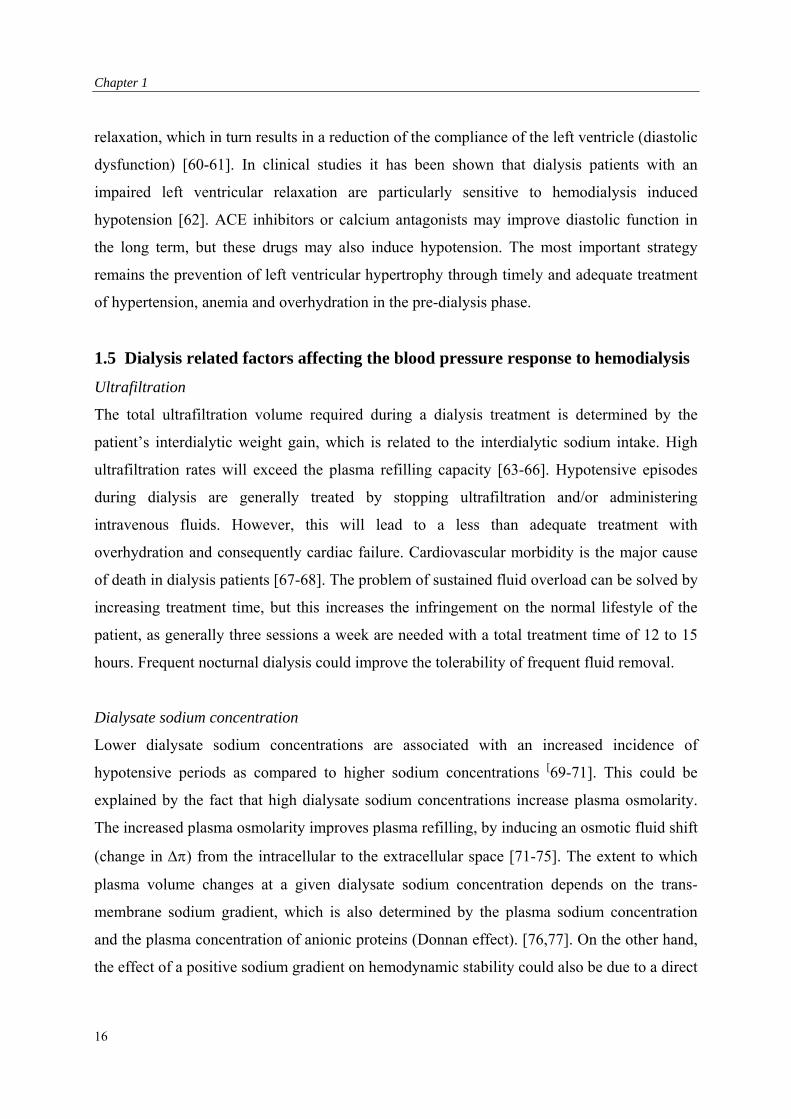
1.5 Dialysis related factors affecting the blood pressure response to hemodialysis
Ultrafiltration
The total ultrafiltration volume required during a dialysis treatment is determined by the
patient’s interdialytic weight gain, which is related to the interdialytic sodium intake. High
ultrafiltration rates will exceed the plasma refilling capacity [63-66]. Hypotensive episodes
during dialysis are generally treated by stopping ultrafiltration and/or administering
intravenous fluids. However, this will lead to a less than adequate treatment with
overhydration and consequently cardiac failure. Cardiovascular morbidity is the major cause
of death in dialysis patients [67-68]. The problem of sustained fluid overload can be solved by
increasing treatment time, but this increases the infringement on the normal lifestyle of the
patient, as generally three sessions a week are needed with a total treatment time of 12 to 15
hours. Frequent nocturnal dialysis could improve the tolerability of frequent fluid removal.
Dialysate sodium concentration
Lower dialysate sodium concentrations are associated with an increased incidence of
hypotensive periods as compared to higher sodium concentrations [69-71]. This could be
explained by the fact that high dialysate sodium concentrations increase plasma osmolarity.
The increased plasma osmolarity improves plasma refilling, by inducing an osmotic fluid shift
(change in ) from the intracellular to the extracellular space [71-75]. The extent to which
plasma volume changes at a given dialysate sodium concentration depends on the trans-
membrane sodium gradient, which is also determined by the plasma sodium concentration
and the plasma concentration of anionic proteins (Donnan effect). [76,77]. On the other hand,
the effect of a positive sodium gradient on hemodynamic stability could also be due to a direct
16
General Introduction
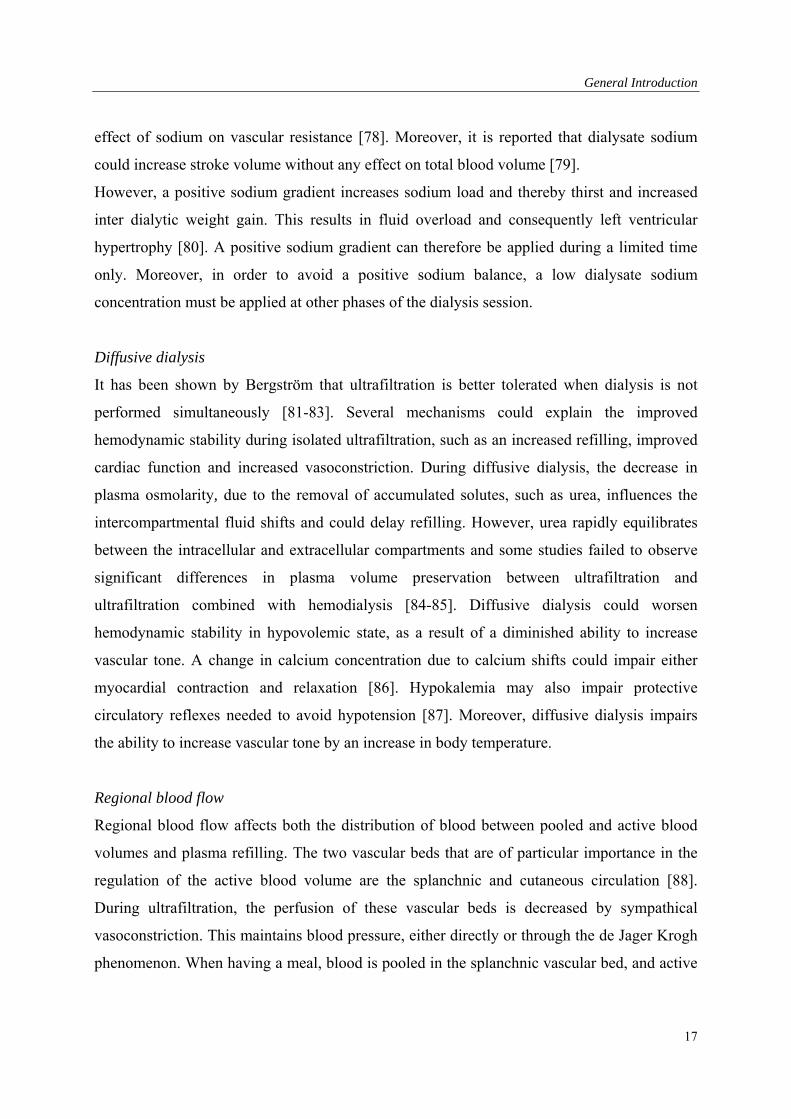
effect of sodium on vascular resistance [78]. Moreover, it is reported that dialysate sodium
could increase stroke volume without any effect on total blood volume [79].
However, a positive sodium gradient increases sodium load and thereby thirst and increased
inter dialytic weight gain. This results in fluid overload and consequently left ventricular
hypertrophy [80]. A positive sodium gradient can therefore be applied during a limited time
only. Moreover, in order to avoid a positive sodium balance, a low dialysate sodium
concentration must be applied at other phases of the dialysis session.
Diffusive dialysis
It has been shown by Bergström that ultrafiltration is better tolerated when dialysis is not
performed simultaneously [81-83]. Several mechanisms could explain the improved
hemodynamic stability during isolated ultrafiltration, such as an increased refilling, improved
cardiac function and increased vasoconstriction. During diffusive dialysis, the decrease in
plasma osmolarity, due to the removal of accumulated solutes, such as urea, influences the
intercompartmental fluid shifts and could delay refilling. However, urea rapidly equilibrates
between the intracellular and extracellular compartments and some studies failed to observe
significant differences in plasma volume preservation between ultrafiltration and
ultrafiltration combined with hemodialysis [84-85]. Diffusive dialysis could worsen
hemodynamic stability in hypovolemic state, as a result of a diminished ability to increase
vascular tone. A change in calcium concentration due to calcium shifts could impair either
myocardial contraction and relaxation [86]. Hypokalemia may also impair protective
circulatory reflexes needed to avoid hypotension [87]. Moreover, diffusive dialysis impairs
the ability to increase vascular tone by an increase in body temperature.
Regional blood flow
Regional blood flow affects both the distribution of blood between pooled and active blood
volumes and plasma refilling. The two vascular beds that are of particular importance in the
regulation of the active blood volume are the splanchnic and cutaneous circulation [88].
During ultrafiltration, the perfusion of these vascular beds is decreased by sympathical
vasoconstriction. This maintains blood pressure, either directly or through the de Jager Krogh
phenomenon. When having a meal, blood is pooled in the splanchnic vascular bed, and active
17
Chapter 1
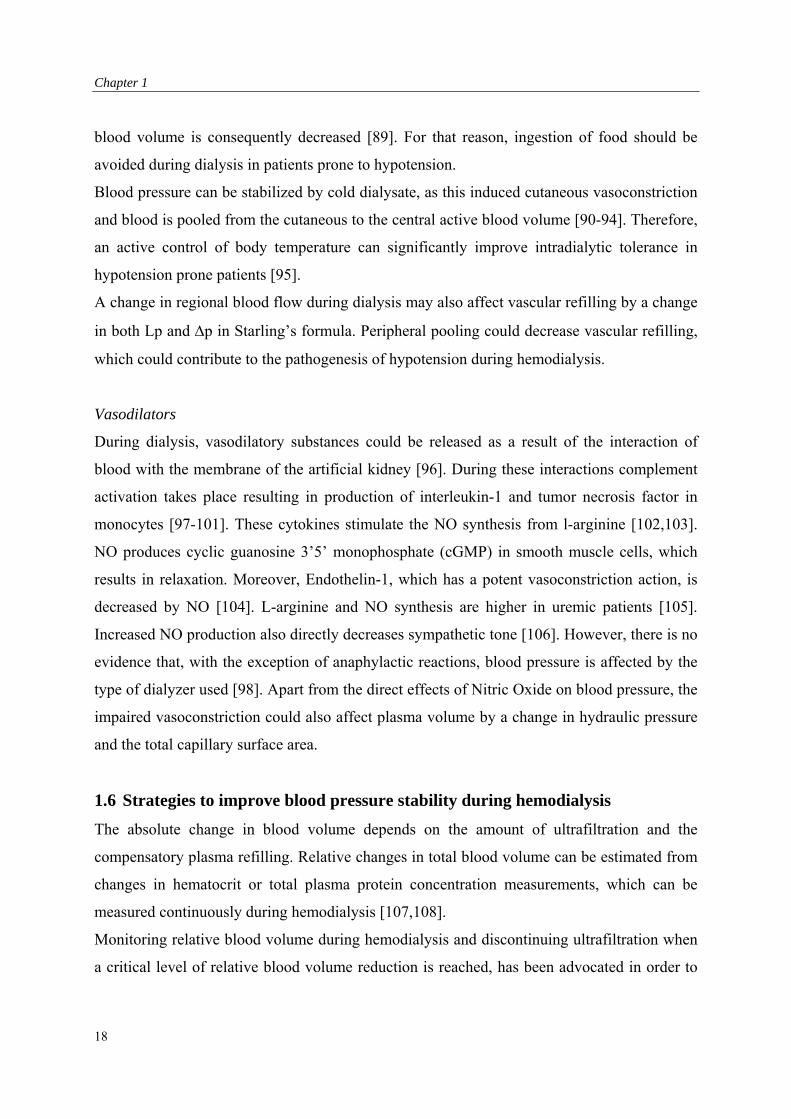
blood volume is consequently decreased [89]. For that reason, ingestion of food should be
avoided during dialysis in patients prone to hypotension.
Blood pressure can be stabilized by cold dialysate, as this induced cutaneous vasoconstriction
and blood is pooled from the cutaneous to the central active blood volume [90-94]. Therefore,
an active control of body temperature can significantly improve intradialytic tolerance in
hypotension prone patients [95].
A change in regional blood flow during dialysis may also affect vascular refilling by a change
in both Lp and p in Starling’s formula. Peripheral pooling could decrease vascular refilling,
which could contribute to the pathogenesis of hypotension during hemodialysis.
Vasodilators
During dialysis, vasodilatory substances could be released as a result of the interaction of
blood with the membrane of the artificial kidney [96]. During these interactions complement
activation takes place resulting in production of interleukin-1 and tumor necrosis factor in
monocytes [97-101]. These cytokines stimulate the NO synthesis from l-arginine [102,103].
NO produces cyclic guanosine 3’5’ monophosphate (cGMP) in smooth muscle cells, which
results in relaxation. Moreover, Endothelin-1, which has a potent vasoconstriction action, is
decreased by NO [104]. L-arginine and NO synthesis are higher in uremic patients [105].
Increased NO production also directly decreases sympathetic tone [106]. However, there is no
evidence that, with the exception of anaphylactic reactions, blood pressure is affected by the
type of dialyzer used [98]. Apart from the direct effects of Nitric Oxide on blood pressure, the
impaired vasoconstriction could also affect plasma volume by a change in hydraulic pressure
and the total capillary surface area.
1.6 Strategies to improve blood pressure stability during hemodialysis
The absolute change in blood volume depends on the amount of ultrafiltration and the
compensatory plasma refilling. Relative changes in total blood volume can be estimated from
changes in hematocrit or total plasma protein concentration measurements, which can be
measured continuously during hemodialysis [107,108].
Monitoring relative blood volume during hemodialysis and discontinuing ultrafiltration when
a critical level of relative blood volume reduction is reached, has been advocated in order to
18
General Introduction
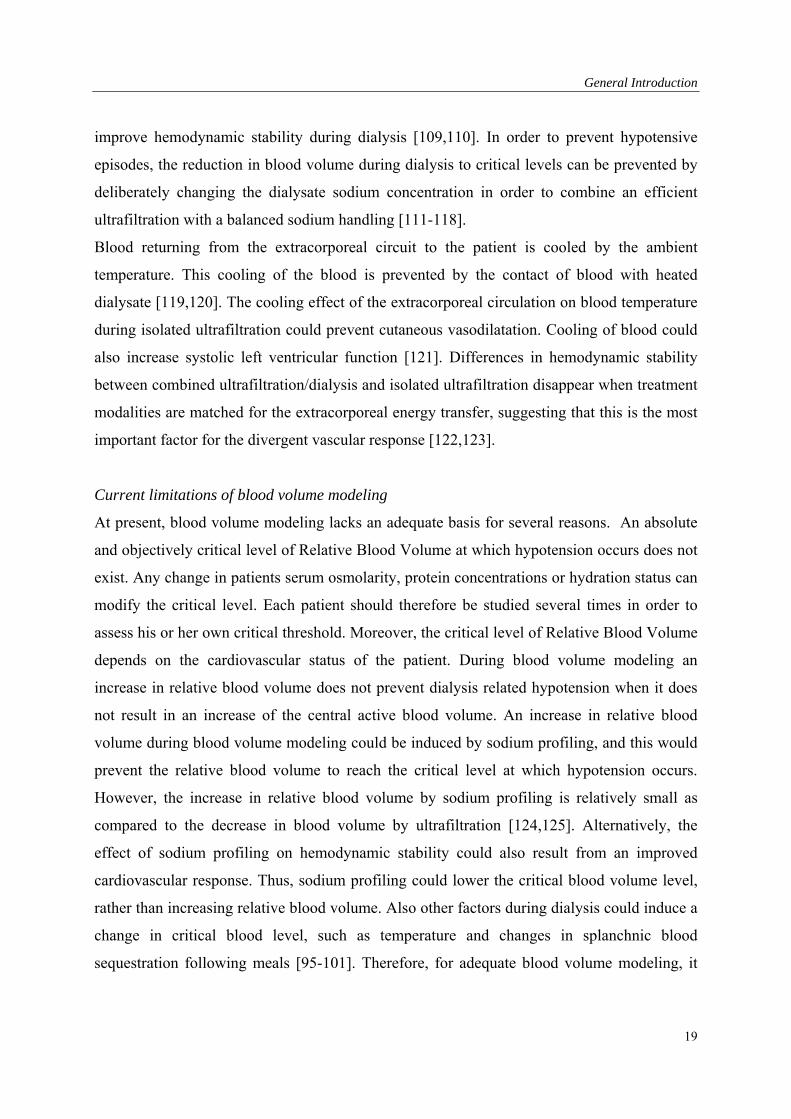
improve hemodynamic stability during dialysis [109,110]. In order to prevent hypotensive
episodes, the reduction in blood volume during dialysis to critical levels can be prevented by
deliberately changing the dialysate sodium concentration in order to combine an efficient
ultrafiltration with a balanced sodium handling [111-118].
Blood returning from the extracorporeal circuit to the patient is cooled by the ambient
temperature. This cooling of the blood is prevented by the contact of blood with heated
dialysate [119,120]. The cooling effect of the extracorporeal circulation on blood temperature
during isolated ultrafiltration could prevent cutaneous vasodilatation. Cooling of blood could
also increase systolic left ventricular function [121]. Differences in hemodynamic stability
between combined ultrafiltration/dialysis and isolated ultrafiltration disappear when treatment
modalities are matched for the extracorporeal energy transfer, suggesting that this is the most
important factor for the divergent vascular response [122,123].
Current limitations of blood volume modeling
At present, blood volume modeling lacks an adequate basis for several reasons. An absolute
and objectively critical level of Relative Blood Volume at which hypotension occurs does not
exist. Any change in patients serum osmolarity, protein concentrations or hydration status can
modify the critical level. Each patient should therefore be studied several times in order to
assess his or her own critical threshold. Moreover, the critical level of Relative Blood Volume
depends on the cardiovascular status of the patient. During blood volume modeling an
increase in relative blood volume does not prevent dialysis related hypotension when it does
not result in an increase of the central active blood volume. An increase in relative blood
volume during blood volume modeling could be induced by sodium profiling, and this would
prevent the relative blood volume to reach the critical level at which hypotension occurs.
However, the increase in relative blood volume by sodium profiling is relatively small as
compared to the decrease in blood volume by ultrafiltration [124,125]. Alternatively, the
effect of sodium profiling on hemodynamic stability could also result from an improved
cardiovascular response. Thus, sodium profiling could lower the critical blood volume level,
rather than increasing relative blood volume. Also other factors during dialysis could induce a
change in critical blood level, such as temperature and changes in splanchnic blood
sequestration following meals [95-101]. Therefore, for adequate blood volume modeling, it
19
Chapter 1
must be known in what way these factors affect both blood volume and the critical level of
relative blood volume at which hypotension occurs. Changes in vascular resistance could also
alter the whole body filtration coefficient, as well as the hydrostatic capillary pressure. The
direct relation between vasoconstriction and plasma refilling has previously received little
attention.
1.7 Aim of the thesis
The blood pressure response during dialysis depends on blood volume preservation and/on
changes in vascular tone. However, these two are not independent. In order to delineate the
role of blood volume profiling in the prevention of intradialytic hypotension, more
information is needed on the relationship between these physiological defense mechanisms.
Therefore, we performed several studies to clarify this relationship and to improve the
understanding of dialysis related hypotension. Such understanding is desperately needed
before preventive measures can be initiated.
In Chapter 2, a mathematical model is constructed that simulates the intercompartmental fluid
shifts during combined hemodialysis, diffusive hemodialysis, and isolated ultrafiltration. The
relative theoretical effect of hydration status, dialysate sodium concentration, initial plasma
concentrations of sodium and urea, and the tissue permeation capacity (change in regional
blood flow) on changes in relative blood volume are analyzed.
In Chapter 3, the reproducibility of the measurement of relative blood volume during standard
hemodialysis sessions, with a standard dialysate sodium concentration, and in which the
decrease in relative blood volume was corrected for the amount of ultrafiltration volume, is
analyzed. This study is unique in its setting, as both intra- and inter-individual differences are
studied. As it is essential for blood volume modeling that the critical level of reduction in
relative blood volume can be predicted in individual cases, the relationship between the
occurrence of hypotension and the decrease in relative blood volume is studied.
In Chapter 4, the change in relative blood volume during diffusive dialysis without
ultrafiltration is analyzed and compared with the predictions from the mathematical model. It
20
General Introduction
is unclear whether the negative effect of diffusive dialysis on hemodynamic stability results
from reduced blood volume preservation or from reduced vascular reactivity. The
mathematical model does not account for a decrease in vascular tone during diffusive dialysis.
In Chapter 5, the effect of isotonic saline (0.9 %), isotonic glucose (5%), hypertonic saline
(3%), mannitol (20%) and glucose (20%) on relative blood volume are compared. The effect
of changes in osmolarity on hemodynamic stability could be related to an effect on vascular
refilling and/or changes in cardiovascular reactivity.
In Chapter 6, the pathophysiology of hemodialysis related hypotension is studied.
Hypotension can be due to dialysis-related factors such as changes in osmolarity and diffusive
dialysis, but also to patient related factors such as diastolic and autonomic dysfunction. In
order to distinguish between dialysis related and patient related factors hypotensive dialysis
sessions are compared with Lower Body Negative Pressure experiments.
In Chapter 7, we study the relationship between changes total peripheral resistance, and
relative blood volume following pharmacological intervention. Some studies indicate that,
vasoconstriction can increase relative blood volume, whereas other studies suggest a decrease
in plasma volume during vasoconstriction.
In Chapter 8, we attempt to answer the question why some patients are hypotension prone in
hypovolemic state and why others are hypotension resistant. In order to study the isolated
effect of a reduction in cardiac filling, we compared the hemodynamic response to Lower
Body Negative Pressure (LBNP) in hypotensive prone and hypotensive resistant patients.
21
Chapter 1
References
1. Kolff WJ: New ways of treating uremia. Churchill Publ, London, 1947.
2. Kolff WJ, Watschinger B: Further development of a coil kidney: Disposable artificial kidney. J
Lab Clin Med 1956;47:969-977.
3. Nolph KD, Nothum RJ, Maher JF: Effects of ultrafiltration on dialysance in commercially
available coils. Kidney Int 1972;2:293-295.
4. Nolph KD, Nothum RJ, Maher JF: Ultrafiltration: A mechanism for removal of intermediate
molecular weight substances in coil dialyzers. Kidney Int 1974;6:55-60.
5. Sigdell JE: Calculation of diffusive and convective mass transfer. Int J Artif Organs
1982;5:361-372.
6. Donnan FG: Theorie der Membrangleichgewichte und membranpotentiale bei vorhandensein
nichtdialysierender electrolyte. Ein Beitrag zur physikalisch-chemishen physiologie. Zeitschrift
für elektrochemie 1911;17:572-581.
7. Donnan FG: The theory of membrane equilibria. Chemical Review 1924:1:73-90.
8. Stiller S, Mann H: The Donnan effect in artificial kidney therapy. Life Support Syst
1986;4:305-318.
9. Kimura G, van Stone JC, Bauer J: Model prediction of plasma volume change induced by
hemodialysis. J Lab Clin Med 1984;104:932-409.
10. Henrich WL: Hemodynamic instability during hemodialysis. Kidney Int 1986;30:605-612.
11. Zuccheli P, Santoro A: Dialysis induced hypotension: A fresh look at Pathophysiology. Blood
Purif 1993;11:85-98.
12. Cruz DN, Mahnensmith RL, Brickel HM, Perazella MA: Midodrine is effective and safe
ttherapy for intradialytic hypotension over 8 months of follow-up. Clin Nephrol 1998;50:101-
107.
13. Lim PS, Yang CC, Li HP, Lim YT, Yeh CH: Midodrine for the treatment of intradialytic
hypotension. Nephron 1997;77:279-283.
14. Kaufman AM, Polaschegg HD, Levin NW: Common clinical problems during hemodialysis, in
Nissenson AR, Fine RN (eds), Dialysis Therapy Philadelphia, Hanley and Belfus 1993;109-113.
15. Iseki K, Fukiyama K: Long-term prognosis and incidence of acute myocardial infarction in
patients on chronic hemodialysis. The Okinawa Dialysis Study Group. Am J Kidney Dis
2000;36:820-825.
16. Yoshimitsu T, Hirakata H, Fujii K, Kanai H, Hirakata E, Higashi H, Kubo M, Tanaka H,
Shinozaki M, Katafuchi R, Yokomizo Y, Oh Y, Tomooka S, Fujimi S, Fujishima M: Cerebral
22
General Introduction
ischaemia as a causative mechanism for rapid progression of brain atrophy in chronic
hemodialysis patients. Clin Nephrol 2000;53:445-51.
17. John AS, Tuerff SD, Kerstein MD: Nonocclusive mesenteric infarction in hemodialysis
patients. J Am Coll Surg 2000;190:84-88.
18. Kouw PM, De Vries PM, Oe PL: Interstitial correction of blood volume decrease during
hemodialysis. Int J of Artif Organs 1989;12:626-630.
19. Rodriquez M, Pederson JA, Llach F: Effect of dialysis and ultrafiltration on osmolality, colloid
osmotic pressure and vascular refilling rate. Kidney Int 1985;28:808-813.
20. Fauchald P: Effect of ultrafiltration on body fluid volumes and transcapillary colloid osmotic
gradient in hemodialysis patients. Contrib Nephrol 1989;74:170-175.
21. Mann H, Stiller S, Gladziwa U, Konigs F: Kinetic modeling and continuous on-line blood
volume monitoring during dialysis therapy failures. Nephrol Dial Transplant 1990;5:144-146.
22. Fox SD, Henderson LW: Cardiovascular response in hemodynamics during ultrafiltration and
bicarbonate dialysis. Kidney Int 1992;42:718-726.
23. Daugirdas JT: Pathophysiology of dialysis hypotension: an update. Am J of Kidney Dis
22001;38:11-17.
24. Rouby JJ, Rottembourg J, Durande JP, Basset JY, Degoulet P, Glaser P, Le Grain M:
Hemodynamic changes induced by regular hemodialysis and sequential ultrafiltration: A
comparative study. Kidney Int 1980;17:801-810.
25. Poldermans D, Man in’t Veld AJM, Rambaldi R, van den Meiracker AH, van den Dorpel MA,
Rocchi G, Boersma E, Bax JJ, Weimar W, Roelandt JR, Zietse R: Cardiac evaluation in
hypotension-prone and hypotension-resistant hemodialysis patients. Kidney Int 1999;56:1905-
1911.
26. Starling EH: in The fluids of the body, Keener WT, Chigaco:1909:181.
27. Schneditz D, Roob J, Oswald M, Pogglitsch H, Moser M, Kenner T, Binswanger U: Nature and
rate of vascular refilling during hemodialysis and ultrafiltration. Kidney Int 1992;42:1425-1433.
28. Rothe CF: Reflex control of veins and vascular capacitance. Physiol Rev 1983;63:1281-1283.
29. de Jager A: Experiments and considerations on hemodynamics. J Physiol 1886;7:130-214.
30. Krogh A: The regulation of the supply of blood to the right heart. Scand Arch Physiol
1912;27:227-248.
31. Schadt JC, Ludbrook J: Hemodynamic and neurohumoral responses to acute hypovolemia in
conscious mammals. Am J Physiol 1991;260:305-318.
23
Chapter 1
32. Lin YF, Wang JY, Shum AY, Jiang HK, Lai WY, Lu KC, Diang LK, Shieh SD: Role of
plasma catecholamines, autonomic, and left ventricular function in normotensive and
hypotension prone dialysis patients. ASAIO J 1993;39:946-53.
33. Ushioda E, Nuwayhid B, Kleinman G, Tabsh K, Brinkman CR, Assali NS: The contribution of
the beta adrenergic system to the cardiovascular response to hypovolemia.Am J Obstet G
Gynecol 1983;147:423-429.
34. Shen YT, Knight DR, Thomas JX, Vatner SF: Relative roles of cardiac receptors and arterial
baroreceptors during hemorrhage in conscious dogs. Circ Res 1990;66:397-405.
35. Cohen-Solal A: A Left ventricular diastolic dysfunction. Pathophysiology, diagnosis and
treatment. Nephrol Dial Transplant 1998;13:3-5.
36. Lopot F, Kotyk P, Blaha J, Foret J: Use of continuous blood monitoring for detecting
inadequately high dry weight. Int J Artif Organs 1996;19:411-414.
37. Bogaard H, de Vries JP, de Vries PM: Assessment of refill and hypovolemia by continuous
ssurveillance of blood volume of blood volume and extracellular blood volume. Nephrol Dial
Transplant 1994;9:1283-1287.
38. Koomans HA, Geers AB, Dorhout Mees EJ: Plasma volume recovery after ultrafiltration in
patients with chronic renal failure. Kidney Int 1984;26:848-854.
39. Leunissen KML, Noordzij TC, van Hooff JP: Pathophysiologic aspects of plasma volume
preservation during dialysis and ultrafiltration. Contrib Nephrol 1990;78:201-211.
40. Leunissen KML, Kouw P, Cheriex EC, de Vries PM, Donker AJ, van Hooff JP: New techniques
to determine fluid status in hemodialyzed patients. Kidney int 1993;41,50-56.
41. Grassi G, Giannnattasio C, Cleroux J, Cuspidi C, Sampieri L, Bolla GB, Mancia G:
Cardiopulmonary reflex before and after regression of left ventricular hypertrophy in essential
hypertension. Hypertension 1988;12:227-237.
42. Malik S, Winney RJ, Ewing DJ: Chronic renal failure and cardiovascular autonomic function.
Nephron 1986;43:191-195.
43. Bennet T, Hosking DJ, Hampton JR: Cardiovascular responses to lower body negative pressure
in normal subjects and in patients with diabetes mellitus. Cardiovasc Res 1979;13:31-38.
44. Ferguson DW, Abboud FM, Mark AL: Selective impairment of baroreflex mediated
vasoconstrictor responses in patients with ventricular dysfunction. Circulation 1984;69: 451-
460.
45. Mohanty PK, Arrowood FM Ellenbogen KA, Thames MD: Neurohumoral and hemodynamic
effects of lower body negative pressure in patients with congestive heart failure. Am Heart J
1989;118:78-85.
24
General Introduction
46. Cleroux J, Giannattasio C, Grassi G, Seravalle G, Sampieri L, Cuspidi C, Bolla G, Valsecchi M,
Mazzola C, Manica G: Effects of aging on the cardiopulmonary receptor reflex in normotensive
humans. J Hypertens 1988;6:141-144.
47. Jingu S, Takeshita A, Imaizumi TG, Sakai K, Nakamura M: Age related decreases in cardiac
receptor control of forearm vascular resistance in humans. Clin Exp Hypertens 1989;11:211-
216.
48. Kersch ES, Kronfeld SJ, Unger A, Popper RW, Cantor S, Cohn K: Autonomic insufficiency in
uremia as a cause of hemodialysis hypotension. New Engl J Med 1974;290:650-653.
49. Mitch WE, Wilcox CS: Disorders of body fluids, sodium and potassium in chronic renal failure.
Am J Med 1982;72:536-550.
50. Boero R, Pignataro A, Ferro M, Quarello F: Sympathetic nervous system and chronic renal
failure. Clin Exp Hypertens 2001;23:69-75.
51. Campese VM, Romoff MS, Levitan D, Lane K, Massry SG: Mechanisms of autonomic nervous
system dysfunction in uremia. Kidney Int 1981;20:246-253.
52. Nakashima Y, Fouad FM, Nakamoto S, Textor SC, Bravo EL, Tarazi RC: Localization of
autonomic nervous system dysfunction in dialysis patients. Am J Nephrol 1987;7:375-381.
53. Converse RL Jacobsen TN, Jost CMT, Toto RD, Grayburn PA, Obregon TM, Fouad-Tarazi F,
Victor RG: Paradoxical withdrawal of reflex vasoconstriction as a cause of hemodialysis
hypotension. J Clin Invest 1992;90:1657-1665.
54. Nies AS, Robertson D, Stone WJ: Hemodialysis hypotension is not the result of uremic
peripheral autonomic neuropathy. J Lab Clin Med 1979;94:395-402.
55. Ligtenberg G, Blankestijn PJ, Boomsma F, Koomans HA: No change in automatic function
ttests during uncomplicated hemodialysis. Nephrol Dial Transplant 1996;11:651-656.
56. Golf S, Lunde P, Abrahamsen AM, Ovri A. Effect of hydration state on cardiac function in
patients on chronic hemodialysis. Br Heart J 1983;49:1893-1896.
57. Neff MS, Kim KE, Persoff M, Onesti G, Swatrz C: Hemodynamics of uremic anemia.
Circulation 1971;43:876-883.
58. Dorhout Mees EJ, Ozbasli C, Akcicek F: Cardiovascular disturbances in hemodialysis patients.
The importance of volume overload. J of Nephrol 1995;8:71-78.
59. London GM: Left ventricular alterations and end-stage renal disease. Nephrol Dial Transplant
2002;17:29-36.
60. Parfey PS, Harnet JD, Foley RN: Left ventricular hypertrophy in dialysis patients. Sem Dial
1992;5:34-41.
25
Chapter 1
61. Wizemann V, Blank S, Kramer W: Diastolic dysfunction of the left ventricle in dialysis
patients. Contrib Nephrol 1994;106:106-109.
62. Kooman JP, Leunissen KML: Cardiovascular aspects in renal disease. Curr Op Nephrol Hypert
1993;2:791-797.
63. Van der Sande FM, Mulder AW, Hoorntje SJ, Peels KH, van Kuijk WH, Kooman JP, Leunissen
KML: The hemodynamic effect of different ultrafiltration rates in patients with cardiac failure
and patients without cardiac failure. Clin Nephrol 1998;50:301-308.
64. Ronco C, Fabris A, Chiaramonte S, De Dominicus E, Feriani M, Brendolan A, Braganti L,
Milan M, Dell Aquila R, La Greca G: Comparison of four different short dialysis techniques. Int
J Art Org 1988;11:169-174.
65. Keshaviah P, Shapiro FL: A critical examination of dialysis induced hypotension. Am J Kidney
Dis 1982;2:290-301.
66. Flemming SJ, Wilkinson JS, Aldridge C, Greenwood RN, Baker LRI, Cattell WR: Blood
volume changes during isolated ultrafiltration and combined ultrafiltration. Nephrol Dial
Transplant 1988;3:272-276.
67. Geerling W, Tufveson G, Brunner FP, Ehrich JHH, Fassbinder W, Landais P, Mallick N,
Margreiter R, Raine AEG, Rizzoni G, Selwood N: Combined report on regular dialysis and
transplantation in Europe. Nephrol Dial Transplant 1990;69:5-29.
68. Herzog CA, Ma JZ, Collins AJ: Poor long term survival after acute myocardial infarction in
patients with hemodialysis. Am J Kidney Dis 1924;24:1010-1018.
69. Ogden A: Double blind cross-over comparison of high and low sodium dialysis. Proc Clin Dial
Transplant Forum 1978:8:157-165.
70. Bijalhala S, Bell AJ, Bennete CA, Evans SM, Dawborn JK: Comparison of high and low
sodium bicarbonate and acetate dialysis in stable chronic hemodialysis patients. Clin Nephrol
1985;23:179-183.
71. Stewart WK, Fleming LW, Manuel MA: Benefits obtained by the use of high sodium
dialysateduring maintenance of hemodialysis. Eur Dial Transplant Assoc 1972;9:111-118.
72. Van Stone JC, Bauer J, Carey J: The effect of sodium concentration on body fluid distribution
during dialysis. Trans AM Soc Artif Intern Organs 1980;26:283-286.
73. Dheenan S, Henrich WL: Preventing dialysis hypotension: A comparison of usual protective
maneuvers. Kidney Int 2001;59:1175-1181.
74. Flanigan MJ, Quresh T, Khairullah, Lim VS: Dialysate sodium can alter chronic blood pressure
management. Am J of Kidney Diseases 1997;29:383-391.
26
General Introduction
75. Flemming SJ, Wilkinson JS, Greenwood RN, Aldridge C, Baker LR, Cattel WR: Effect of
dialysate composition on intercompartmental fluid shift. Kidney Int 1984;26:848-854.
76. Flanigan M: Role of sodium in hemodialysis Kidney Int 2000;58:72-78.
77. Flanigan M: Sodium flux and dialysate sodium in hemodialysis Semin Dial 1998;11:298-304.
78. Henrich WL, Woodard TD, Blachley JD, Gomez-Sanchez C, Pettinger W, Cronin RE: Role of
osmolality in blood pressure stability after dialysis and ultrafiltration. Kidney Int 1980;18:480-
488.
79. Straver B, de Vries PMJM, Donker AJM, ter Wee PM: The effect of profiled hemodialysis on
intradialytic hemodynamics when a proper sodium balance is applied. Blood Purif 2002;20:364-
369.
80. Wilkinson R, Barber SG, Robson V: Cramps, thirst, and hypertension in hemodialysis patients.
The influence of dialysate sodium concentration. Clin Nephrol 1977;7:101-105.
81. Bergström J: Changes in blood pressure and hemodynamics during ultrafiltration and dialysis.
Dialysis Transplant 1978;7:1087-1091.
82. Bergström J, Asaba H, Furst P, Oules R: Dialysis, ultrafiltration and blood pressure. Proc Eur
Dial Transplant Assoc 1976;13:293-305.
83. Asaba H, Bergström J, Furst P, Lindh K, Mion C, Oulus R, Shaldon S: Sequential ultrafiltration
and diffusion as alternative to convential hemodialysis. Proc Clin Dial Transpl Forum 1976;
6:129-134.
84. Wehle B, Asaba H, Castenfors J, Furst P, Gunnarrson B, Shaldon S, Bergstrom J:
Hemodynamic changes during sequential ultrafiltration and dialysis. Kidney Int 1979;15:411-
418.
85. Baldamus CA, Ernst W, Lysaght MJ, Shaldon S, Koch KM, Pierides A, Streicher E:
Hemodynamics in hemofiltration. Int J Artif Organs 1982;6:27-31.
86. Rozich JD, Smith B, Thomas JD, Zile MR, Kaiser J, Mann DL: Dialysis-induced alterations in
left ventricular filling: mechanisms and clinical significance. Am J Kidney Dis 1991;17:277-
285.
87. Fukuchi S, Hanata M, Takahashi H, Demura H, Goto K: The relationship between vascular
reactivity and extracellular potassium. Tohoku J Exp Med 1965;85:181-191.
88. Daugirdas JT: Dialysis hypotension A hemodynamic analysis Kidney Int 1991;39:233-246.
89. Shibagaki Y, Takaichi K: Significant reduction of the large-vessel blood volume by food intake
during hemodialysis. Clin Nephrol 1998;49:49-54.
90. Orofino L, Marcen R, Quera C, Villafruela JJ: Epidemiology of symptomatic hypotension in
hemodialysis: Is cool dialysate beneficial for all patients? Am J Nephrol 1990;10:177-180.
27
Chapter 1
91. Jost CMT, Agarawal R, Khair El Din T, Grayburn PA, Victor RG, Henrich W: Effects of cooler
temperature dialysate on hemodynamic stability in problem dialysis patients. Kidney Int
1993;44:606-612.
92. Maggiore Q, Pizzarelli F, Sisca S, Zocalli C, Parlongo S, Nicolo F, Creazzo G: Blood
temperature and vascular stability during hemodialysis and hemofiltration. Trans Am Soc Artif
Intern Organs 1982;28: 523-527.
93. Sherman RA, Rubin MP, Cody RP, Eisinger RP: Amelioration of hemodialysis associated
hypotension by the use of cool dialysate Am J Kidney Dis 1985;5:124-127.
94. Marcen E, Quereda C, Orofino L, Lamas S, Teruel JL, Matesanz R: Hemodialysis with low-
temperature dialysate: A long Term Experience. Nephron 1988;49:29-32.
95. Maggiore Q, Pizzarelli F, Santoro A, Panzetta G, Bonforte G, Hannedouche T, Alvarez de Lara
MA, Tsourras I, Loureiro A, Ponce P, Sulkova ,van Roost G, Brink H, Kwan JT: Am J Kidney
Dis 2002;40:280-290.
96. Borgdorff P, van den Bos G, Tangelder GT: Extracorporeal circulation can induce hypotension
by both blood material contact and pump platelet aggregation. J Thorac Cardiovasc Surg
2000;120:12-19.
97. Pertosa G, Grandaliano G, Gesualdo L, Schena FP: Clinical relevance of cytokine production
hemodialysis. Kidney Int 2000;76:104-111.
98. Daugirdas JT, Ing TS: Does the membrane matter? Semin Dial 1989;2:13-14.
99. Raj DSC, Vincent B, Simpson K, Sato E, Jones KL, Welbourne TC, Levi M, Shah V, Blandon
P, Zager P, Robbins RA: Hemodynamic changes during hemodialysis role of nitric oxide and
endothelin. Kidney Int 2002;61:697-704.
100. Odar-Cederlof I, Theodorson E, Eriksson CG, Hamberger B, Tidgren B, Kjellstrand CM:
Vasoactive agents and blood pressure in sequential ultrafiltration and hemodialysis. Int J Artif
Organs 1993;16:662-669.
101. Erkan E, Devarajan P, Kaskel F: Role of nitric oxide endothelin 1, and inflammatory cytokines
in blood pressure regulation in hemodialysis patients. Am J Kidney Dis 2002;40:76-81.
102. Beasley D, Brenner BM: Role of nitric oxide in hemodialysis hypotension. Kidney Int
1992;42:96-100.
103. Madore F, Prud homme L, Austin JS, Blaise G, Francoer M, Leville M, Prud homme M, Vinay
P: Impact of nitric oxide on blood pressure hemodialysis patients. Am J Kidney Dis
1997;30:665-671.
104. Dinarello CA: Interleukin-1 and tumor necrosis factor and their naturally occurring antagonists
during hemodialysis. Kidney Int 1992;42: S68-S77.
28
General Introduction
105. Noris M, Benigni A, Boccardo P, Aiello S, Gaspari F, Todeschini M, Figliuzzi M, Remuzzi G:
Enhanced nitric oxide synthesis in uremia: Implications for platelet dysfunction and dialysis
hypotension. Kidney Int 1993;44:445-450.
106. Yokokawa K, Mankus R, Salayen MG, Kohno M, Yasunari K, Minami M, Kano H, Horio T,
Takeda T, Mandel AK: Increased nitric oxide production in patients with hypotension during
hemodialysis. Annals of Int Med 1995,123:35-37.
107. Johner C, Chamney PW, Schneditz D, Kramer M: Evaluation of an ultrasonic blood volume
monitor. Nephrol Dial Transplant 1998;13:2098-2103.
108. Leypoldt Jk, Cheung AK, Steuer RR, Harris DH, Conis JM: Determination of the circulating
blood volume by continuously monitoring the hematocrit during hemodialysis. J Am Soc
Nephrol 1995;6:214-219.
109. Donauer J, Kolblin D, Bek M, Krause A, Bohler J: Ultrafiltration profiling and measurements of
relative blood volume as strategies to reduce hemodialysis related side effects. Am J Kidney Dis
2000;36:115-123.
110. Enzman G, Bianco F, Paolini F, Rossi M, Panzetta G: Continuous monitoring of blood volume
and plasma refilling during hemodialysis. A phenomenological analysis. Contrib Nephrol
1994;106,94-98.
111. Stefanidis I, Stiller S, Ikonomov V, Mann H: Sodium and body fluid homeostasis in profiling
hemodialysis treatment. Int J Artif Organs 2002;25:421-428.
112. Coli L, La Manna G, Dalmastri V: Evidence of profiled hemodialysis efficacy in the treatment
intradialytic hypotension. Int J artif Organs 1998;21:398-402.
113. Santoro A, Mancini P: Blood volume regulation during hemodialysis Am J Kidney Dis
1998;32:739-748.
114. Raj RM: Sodium profiling in elderly hemodialysis patients. Nephrol Dial Transplant 1996;11:
42-45.
115. Sang GLS, Kovithavongs C, Ulan R, Kjellstrand CM: Sodium ramping in hemodialysis: A
study of beneficial and adverse effects Am J Kidney Dis 1997;29:669-677.
116. Coli L, Bonomini M, La Manna G, Dalmastri V, Ursino M, Ivanovich P, Bonomini V: Clinical
use of profiled hemodialysis Artif Organs 1998;22:724-730.
117. Splendiani G, Costanzi S, Passalacqua S, Fulignati P, Sturniolo A: Sodium and fluid modulation
in dialysis. A new Approach. Nephron 2001;89:377-380.
118. Begin V, Deziel C, Madore F: Biofeed back regulation of ultrafiltratration and dialysate
Conductivity for the prevention of hemodialysis. ASAIO J 2002;48:312-315.
29
Chapter 1
30
119. Maggiore Q, Pizarelli F, Sisca S, Catalano C, Delfino D: Vascular stability and heat in dialysis
patients , in Jahn H, Massry SG, Ritz E, Weidmann P (eds) : Cardiocirculatory function in renal
disease. International workshop Strassbourg 1983. Contrib Nephrol, Basel, Karger1984; 41:398-
402.
120. Maggiore Q, Dattalo P, Piacenti M, Morales MA, Pelosi G, Pizzarelli F, Cerrai T: Thermal
balances and dialysis hypotension. Int J Artif Organs 1995;18:518-528.
121. Levy FL, Grayburn PA, Foulks CJ, Brickner ME, Henrich WL: Improved left ventricular
contractiliy with cool temperature hemodialysis. Kidney Int 1992;41:961-965.
122. van Kuyk WHM, Luik AJ, de Leeuw DW, van Hoof JP, Nieman FHM, Habets HML Leunissen
KML: Vascular reactivity during hemodialysis and isolated ultrafiltration: Thermal influences.
Nephrol Dial Transplant 1995;10:1852-1858.
123. van der Sande FM, Gladziwa U, Kooman JP, Bocker G, Leunissen KM: Energy transfer is the
single most important factor for the difference in vascular response between isolated
ultrafiltration and hemodialysis. J Am Soc Nephrol 2000;11:1512-517.
124. Santoro A. Mancini IE, Paolini F, Zucchelli P: Blood volume monitoring and control. Nephrol
Dial Transplant 1996;11:42-47.
125. Mann H, Stefanidis I, Reinhart B, Stiller S. Prevention of hemodynamic risks by continuous
blood volume measurement and control. Nephrol Dial Transplant 1996:11:48-51.
Mathematthical Study of Blood Volume Changes during Hemodialysis
Chapter 2: A Simulation Study on the Intercompartmental Fluid Shifts
during Hemodialysis.
31

Chapter 2
Abstract
Hypotension is the most frequent complication during hemodialysis. An important cause of
hypotension is the decrease in the intravascular volume. In addition, a decrease in plasma
osmolarity may be a contributing factor. Modeling of sodium and ultrafiltration (UF) may
help in the understanding of underlying relationships. We therefore simulated in a
mathematical model the intercompartmental fluid shifts during standard hemodialysis (SHD),
diffusive hemodialysis (DHD), and isolated ultrafiltration (IU). We analyzed the relative
theoretical effect of hydration status, dialysate sodium concentration, the initial plasma
concentrations of sodium and urea, and the tissue permeation to solutes on the magnitude and
direction of intracellular and intravascular volume changes.
This theoretical analysis show that the transcellular fluid shifts taking place during
hemodialysis treatment are for a great part due to an inhomogeneous distribution of regional
blood flow and tissue fluid volumes. During hemodialysis treatment, the cellular fluid shift in
tissue group with a relative high perfusion of blood and a small volume fraction occurs from
the intra- to the extracellular spaces. However, the fluid shift in the tissue group with a
relative low perfusion of blood and a great volume fraction takes place in the opposite
direction. The UF volume and rates, and the size of sodium (Na+) gradient between the
dialysate and blood side of the dialyzer membrane are the most important factors influencing
the fluid shifts. Higher UF volumes and flow rates cause an increasing decline in the plasma
volume in both SHD and IU. High dialysate sodium concentration (150 mEq L-1) helps
plasma refilling slightly when compared with a normal dialysate sodium concentration (140
mEq L-1). However, a high dialysate sodium concentration is associated with a high plasma
sodium rebound, which in turn lead to interdialytic water intake resulting from thirst and may
cause increased weight gain and hypertension.
32
Mathematthical Study of Blood Volume Changes during Hemodialysis
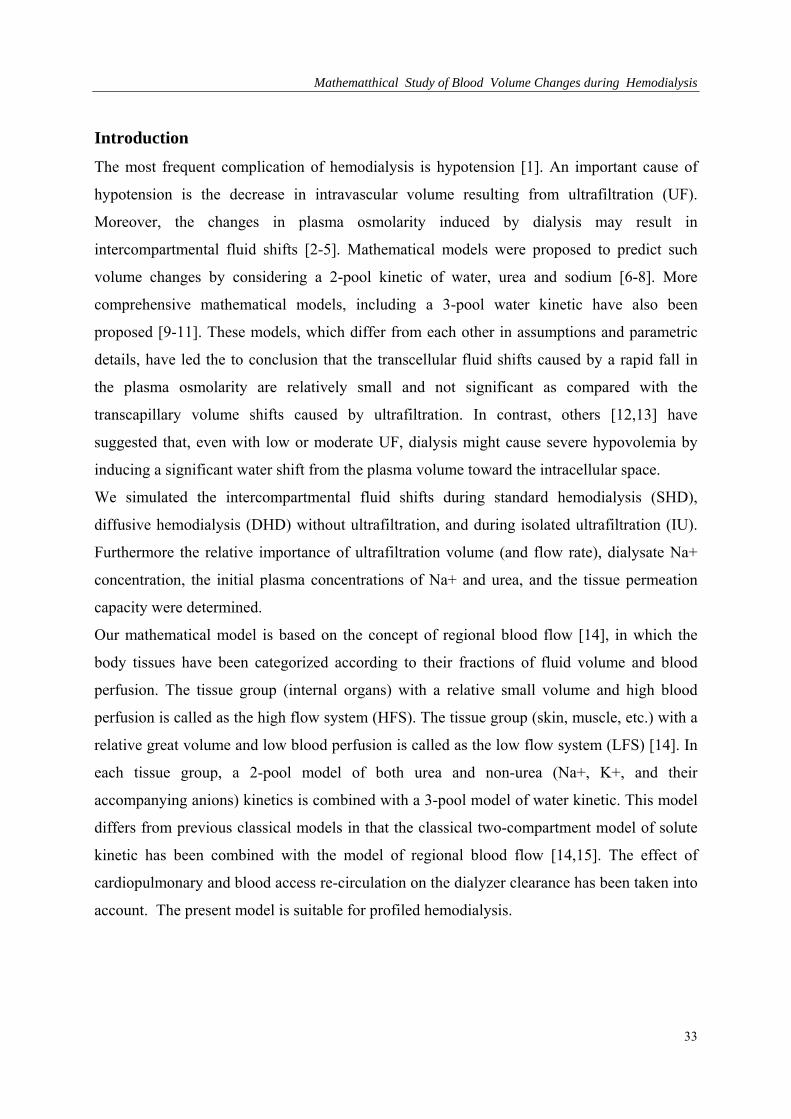
Introduction
The most frequent complication of hemodialysis is hypotension [1]. An important cause of
hypotension is the decrease in intravascular volume resulting from ultrafiltration (UF).
Moreover, the changes in plasma osmolarity induced by dialysis may result in
intercompartmental fluid shifts [2-5]. Mathematical models were proposed to predict such
volume changes by considering a 2-pool kinetic of water, urea and sodium [6-8]. More
comprehensive mathematical models, including a 3-pool water kinetic have also been
proposed [9-11]. These models, which differ from each other in assumptions and parametric
details, have led the to conclusion that the transcellular fluid shifts caused by a rapid fall in
the plasma osmolarity are relatively small and not significant as compared with the
transcapillary volume shifts caused by ultrafiltration. In contrast, others [12,13] have
suggested that, even with low or moderate UF, dialysis might cause severe hypovolemia by
inducing a significant water shift from the plasma volume toward the intracellular space.
We simulated the intercompartmental fluid shifts during standard hemodialysis (SHD),
diffusive hemodialysis (DHD) without ultrafiltration, and during isolated ultrafiltration (IU).
Furthermore the relative importance of ultrafiltration volume (and flow rate), dialysate Na+
concentration, the initial plasma concentrations of Na+ and urea, and the tissue permeation
capacity were determined.
Our mathematical model is based on the concept of regional blood flow [14], in which the
body tissues have been categorized according to their fractions of fluid volume and blood
perfusion. The tissue group (internal organs) with a relative small volume and high blood
perfusion is called as the high flow system (HFS). The tissue group (skin, muscle, etc.) with a
relative great volume and low blood perfusion is called as the low flow system (LFS) [14]. In
each tissue group, a 2-pool model of both urea and non-urea (Na+, K+, and their
accompanying anions) kinetics is combined with a 3-pool model of water kinetic. This model
differs from previous classical models in that the classical two-compartment model of solute
kinetic has been combined with the model of regional blood flow [14,15]. The effect of
cardiopulmonary and blood access re-circulation on the dialyzer clearance has been taken into
account. The present model is suitable for profiled hemodialysis.
33
Chapter 2
Mathematical Model
Model description and assumptions
The model incorporates differential equations describing solute and water kinetics as a
function of time (t) during hemodialysis. All symbols and units are summarized in the
Appendix. The model equations and the initial values of variables are based on the following
assumptions:
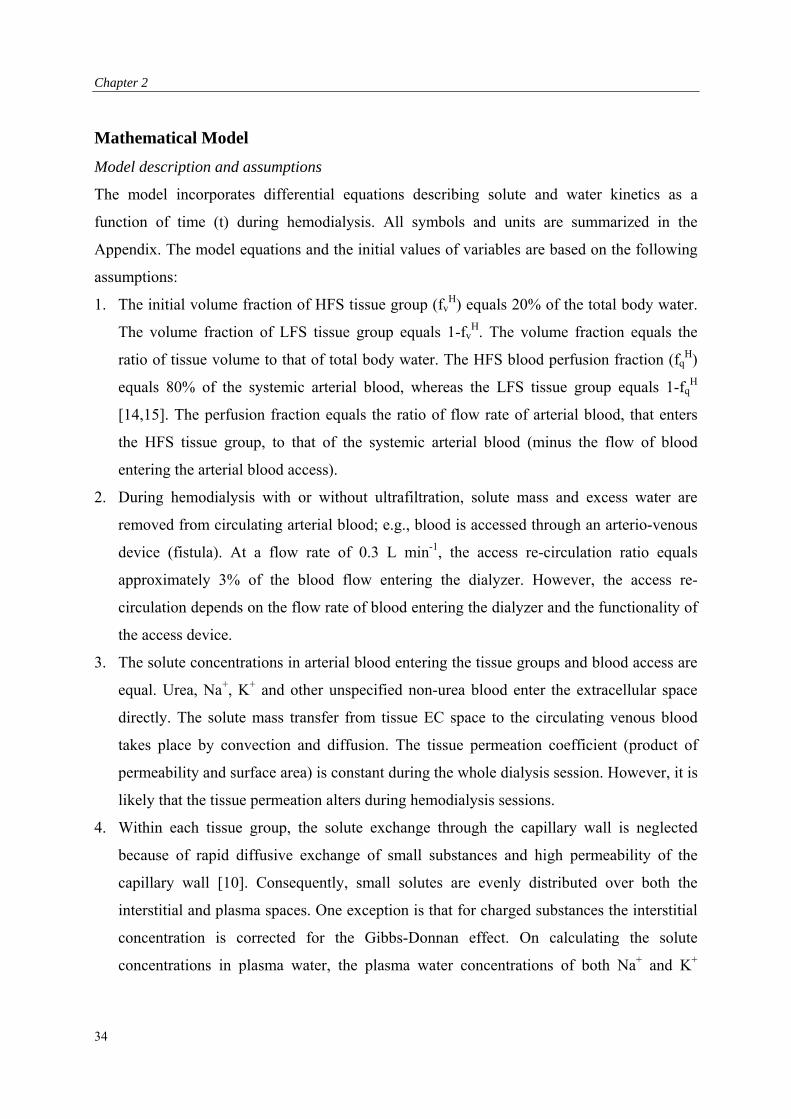
1. The initial volume fraction of HFS tissue group (fvH) equals 20% of the total body water.
The volume fraction of LFS tissue group equals 1-fvH. The volume fraction equals the
ratio of tissue volume to that of total body water. The HFS blood perfusion fraction (fqH)
equals 80% of the systemic arterial blood, whereas the LFS tissue group equals 1-fqH
[14,15]. The perfusion fraction equals the ratio of flow rate of arterial blood, that enters
the HFS tissue group, to that of the systemic arterial blood (minus the flow of blood
entering the arterial blood access).
2. During hemodialysis with or without ultrafiltration, solute mass and excess water are
removed from circulating arterial blood; e.g., blood is accessed through an arterio-venous
device (fistula). At a flow rate of 0.3 L min-1, the access re-circulation ratio equals
approximately 3% of the blood flow entering the dialyzer. However, the access re-
circulation depends on the flow rate of blood entering the dialyzer and the functionality of
the access device.
3. The solute concentrations in arterial blood entering the tissue groups and blood access are
equal. Urea, Na+, K+ and other unspecified non-urea blood enter the extracellular space
directly. The solute mass transfer from tissue EC space to the circulating venous blood
takes place by convection and diffusion. The tissue permeation coefficient (product of
permeability and surface area) is constant during the whole dialysis session. However, it is
likely that the tissue permeation alters during hemodialysis sessions.
4. Within each tissue group, the solute exchange through the capillary wall is neglected
because of rapid diffusive exchange of small substances and high permeability of the
capillary wall [10]. Consequently, small solutes are evenly distributed over both the
interstitial and plasma spaces. One exception is that for charged substances the interstitial
concentration is corrected for the Gibbs-Donnan effect. On calculating the solute
concentrations in plasma water, the plasma water concentrations of both Na+ and K+
34
Mathematthical Study of Blood Volume Changes during Hemodialysis
become very close to those in interstitial space. This is a result of the fact that the ratio of
Donnan factor to the free water fraction is very close to1. The only barrier to solute mass
exchange within each tissue group is the cell membrane. Therefore, the solute kinetic
within each tissue group is described by means of a 2-pool compartment model [11].
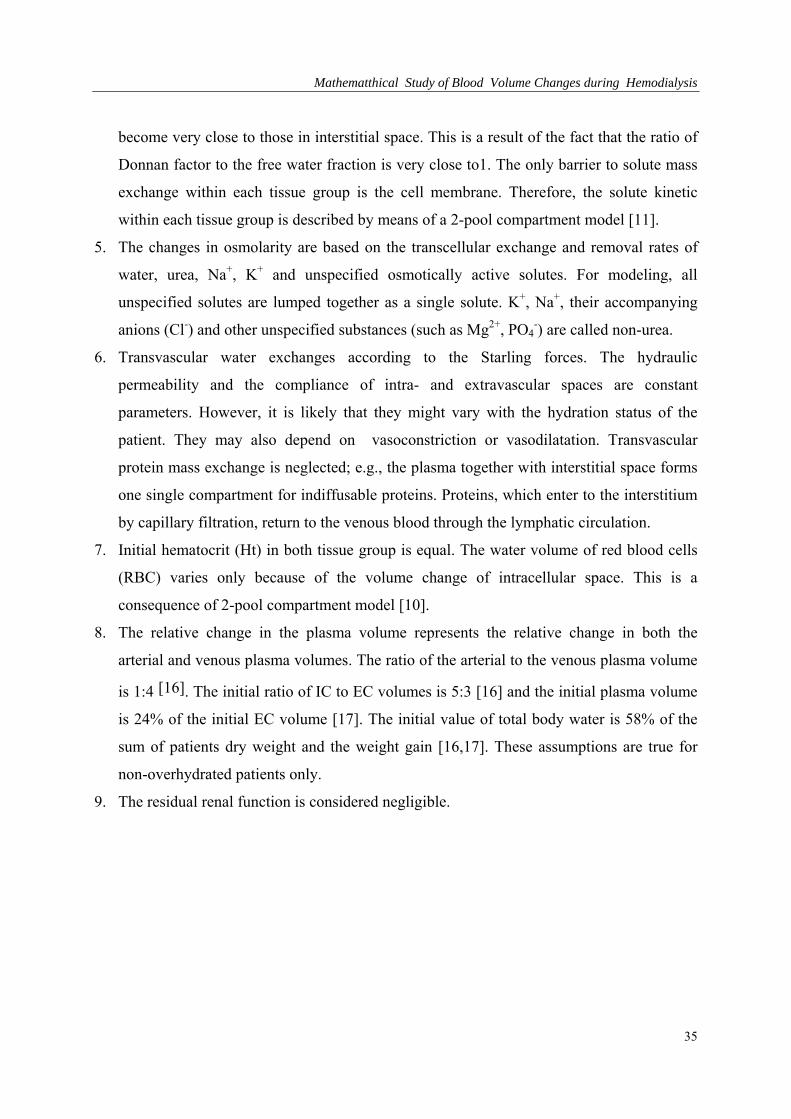
5. The changes in osmolarity are based on the transcellular exchange and removal rates of
water, urea, Na+, K+ and unspecified osmotically active solutes. For modeling, all
unspecified solutes are lumped together as a single solute. K+, Na+, their accompanying
anions (Cl-) and other unspecified substances (such as Mg2+, PO4-) are called non-urea.
6. Transvascular water exchanges according to the Starling forces. The hydraulic
permeability and the compliance of intra- and extravascular spaces are constant
parameters. However, it is likely that they might vary with the hydration status of the
patient. They may also depend on vasoconstriction or vasodilatation. Transvascular
protein mass exchange is neglected; e.g., the plasma together with interstitial space forms
one single compartment for indiffusable proteins. Proteins, which enter to the interstitium
by capillary filtration, return to the venous blood through the lymphatic circulation.
7. Initial hematocrit (Ht) in both tissue group is equal. The water volume of red blood cells
(RBC) varies only because of the volume change of intracellular space. This is a
consequence of 2-pool compartment model [10].
8. The relative change in the plasma volume represents the relative change in both the
arterial and venous plasma volumes. The ratio of the arterial to the venous plasma volume
is 1:4 [16]. The initial ratio of IC to EC volumes is 5:3 [16] and the initial plasma volume
is 24% of the initial EC volume [17]. The initial value of total body water is 58% of the
sum of patients dry weight and the weight gain [16,17]. These assumptions are true for
non-overhydrated patients only.
9. The residual renal function is considered negligible.
35
Chapter 2
Solute Kinetics
Intracellular solute kinetics
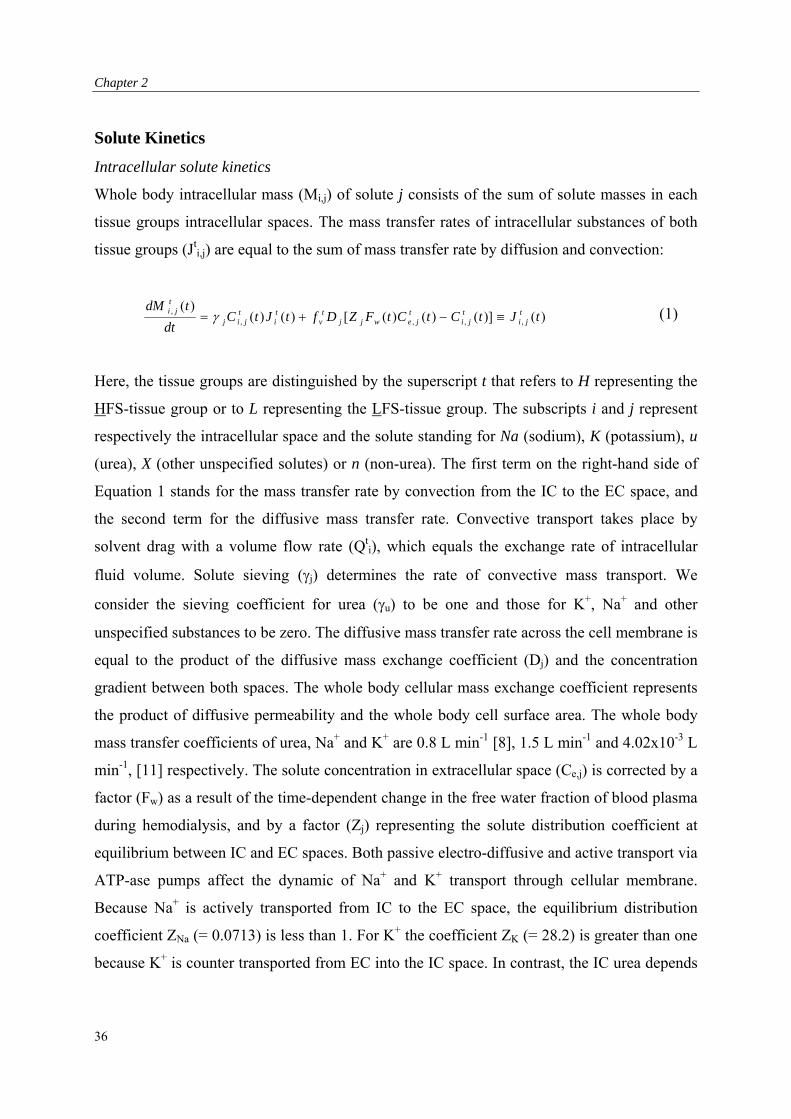
Whole body intracellular mass (Mi,j) of solute j consists of the sum of solute masses in each
tissue groups intracellular spaces. The mass transfer rates of intracellular substances of both
tissue groups (Jti,j) are equal to the sum of mass transfer rate by diffusion and convection:
)()]()()([)()()(
,,,,, tJtCtCtFZDftJtC
dt
tdMt
jit
jit
jewjjt
vti
tjij
tji (1)
Here, the tissue groups are distinguished by the superscript t that refers to H representing the
HFS-tissue group or to L representing the LFS-tissue group. The subscripts i and j represent
respectively the intracellular space and the solute standing for Na (sodium), K (potassium), u
(urea), X (other unspecified solutes) or n (non-urea). The first term on the right-hand side of
Equation 1 stands for the mass transfer rate by convection from the IC to the EC space, and
the second term for the diffusive mass transfer rate. Convective transport takes place by
solvent drag with a volume flow rate (Qti), which equals the exchange rate of intracellular
fluid volume. Solute sieving (j) determines the rate of convective mass transport. We
consider the sieving coefficient for urea (u) to be one and those for K+, Na+ and other
unspecified substances to be zero. The diffusive mass transfer rate across the cell membrane is
equal to the product of the diffusive mass exchange coefficient (Dj) and the concentration
gradient between both spaces. The whole body cellular mass exchange coefficient represents
the product of diffusive permeability and the whole body cell surface area. The whole body
mass transfer coefficients of urea, Na+ and K+ are 0.8 L min-1 [8], 1.5 L min-1 and 4.02x10⁻³ L
min-1, [11] respectively. The solute concentration in extracellular space (Ce,j) is corrected by a
factor (Fw) as a result of the time-dependent change in the free water fraction of blood plasma
during hemodialysis, and by a factor (Zj) representing the solute distribution coefficient at
equilibrium between IC and EC spaces. Both passive electro-diffusive and active transport via
ATP-ase pumps affect the dynamic of Na+ and K+ transport through cellular membrane.
Because Na+ is actively transported from IC to the EC space, the equilibrium distribution
coefficient ZNa (= 0.0713) is less than 1. For K+ the coefficient ZK (= 28.2) is greater than one
because K+ is counter transported from EC into the IC space. In contrast, the IC urea depends
36
Mathematthical Study of Blood Volume Changes during Hemodialysis
upon the passive transport by diffusion and convection and it is not affected by active
transport. At equilibrium, the IC urea concentration equals the EC urea concentration.
Therefore, the urea distribution coefficient (Zu) equals 1.
Extracellular solute kinetics
Whole body mass (Me,j) of solute j in EC space consists of the sum of solute masses in each
tissue group’s EC space. The solute concentration (Cte,j) in EC volume (Vt
e) is considered to
be distributed in blood plasma, in red blood cells, and in tissue interstitial spaces. The
interstitial solute concentration differs slightly from that in blood plasma (Ctp,j) because of the
Gibbs-Donnan ratio between plasma and interstitium, which is assumed 0.95 for Na+, K+, and
1.0 for urea and for other unspecified substance [11]. For the sake of simplicity, the RBC
concentration gradients of Na+, K+, urea, and other unspecified substances are considered 0.
Consequently, the EC solute mass is taken as the solute mass in blood plasma plus that in the
interstitium. During hemodialysis, the mass transfer rates of substances in the EC spaces (Jte,j)
of both tissue groups vary according to the following relationship:
)()()()()(
,,,, tJtGf tJtJ
dt
tdMt
jejt
vt
javt
ji
tje (2)
The first term on the right-hand side of Equation 2 represents the IC mass transfer (Jti,j), the
second term represents the mass transfer rate of solute from tissues’ extracellular space to the
venous blood (Jtav,j), and the third term is the rate of the generation or intake (Gj). In this
simulation work, we stipulate that urea is produced in the liver and directly enters the EC
space (the whole body Gu = 0.083 mmol min-1 [8]. Also is considered that neither sodium nor
potassium is taken (enteral or parenteral) in the EC space (GNa=GK=0 mEq min-1). The
following relationship gives the mass transfer rate of solute from tissue extracellular space to
the venous blood:
)()()()()( ,,, tQtCtQtCtJ tv
tjv
taja
tjav (3)
37
Chapter 2
Equation 3 expresses the rate of solute mass gain in venous blood from the tissues EC spaces.
The flow rate (Qtv) of blood leaving the tissue group equals the blood flow rate (Qt
a) entering
the tissue group increased by the ultrafiltration flow rate (Qf):
)()()( tQfQftQfQtQ ft
vat
qft
vta
tv (4)
The flow rate of systemic arterial blood (Qa) equals the cardiac output (CO) minus the flow
rate of blood entering the blood access (QaAC). The solute concentration in blood leaving the
tissue group (Ctv,j) is assumed to relate to the tissue EC solute concentration (Ct
e,j) according
to the following relationship [14]:
)()()])(
exp(1)[()( ,, tmtCtQ
PSftCtC
tj
tjet
v
jt
vtje
tjv, (5)
In Equation 5, the term mtj represents the coefficient of concentration equilibration between
arterial and venous sides of tissue bed. The mtj depends upon the Péclet number, which is the
ratio of the tissue permeation coefficient (PSj) to the flow rate of blood (Qtv) leaving the tissue
bed. PS stands for the product of permeability and tissue surface area. Solute transport from
tissue bed to the venous blood is flow limited if the mtj equals 1.0. The solute concentration in
arterial blood (Ca,j) follows from the overall mass balance:
)()()()()()( , tQtCQtCtQtCQtCACv
ACjv,
ACaja
t
tv
tjv,
t
taja, (6)
with QvAC and Cv
AC denoting respectively the flow rate of and the solute concentration in
blood that returns to the venous limb.
Solute kinetics in blood access and dialyzer
Solute mass in blood entering the arterio-venous access exchanges through the dialyzer
membrane with the solute mass in the dialysate compartment. The rate of mass transfer
between arterial and venous limbs of the blood access device equals the rate of solute mass
38
Mathematthical Study of Blood Volume Changes during Hemodialysis
exchange (Jdial,j) through the dialyzer membrane, which occurs by combined diffusion and
convection [7]:
)(])(
)()()()()([)()(
,
,,,,, tQ
tQ
tJtCtFtRtktJtJ f
jwi
jdifjawjD
CPjjdifjdial (7)
The second term on the right-hand side of Equation 7 stands for the mass transfer rate by
convection combined with diffusion, in which Qwi,j denotes the flow rate of blood water
entering the dialyzer. The solute concentration in blood entering the dialyzer is corrected for
the Gibbs-Donnan ratio (RD,j) for charged solutes between the blood and dialysate sides of the
dialyzer membrane, for the time-dependent change in the free water fraction of blood plasma
(Fw), and for the cardiopulmonary re-circulation (kjCP). The first term on the right-hand side
(Jdif,j) represents the rate of mass transfer through the dialyzer membrane by diffusion without
ultrafiltration (Qf = 0) as:
)]()()()()()[()( ,, tCtCtFtRtktCLtJ jd,ja,wjDCPjjjdif (8)
with CLj the solute dialysance by diffusion and Cd, j the solute concentration in the dialysate
fluid entering the dialysate compartment of the dialyzer.
Water Kinetics
During hemodialysis with ultrafiltration, the EC fluid volume of both tissue groups changes
because of isotonic volume loss (Vtuf) by ultrafiltration (UF) and the transcellular fluid shifts:
)()()()(
tQdt
tdV
dt
tdV
dt
tdV te
ti
tuf
te (9)
The second term on the right-hand side of Equation 9 stands for the exchange rate of the
intracellular volume (Qti) and the first term for the ultrafiltration flow rate (Qf):
39
Chapter 2
)()()(
)( tQfdt
tdVf
dt
tdVtQ f
tv
uftv
tuft
f (10)
The rate of change in the EC volume equals also the sum of rate of change in interstitial
volume (Vtis), in water volume of RBC (Vt
rc), and in plasma volume (Vtp):
dt
tdV
dt
tdV
dt
tdV
dt
tdV tis
trc
tp
te )()()()(
(11)
The first term on the right-hand side of Equation 11, representing the rate of change in the
plasma volume, depends upon both the rate of volume gain (Vtpr) from interstitial space and
the rate of volume loss by ultrafiltration:
)()()(
tQfdt
tdV
dt
tdVf
tv
tpr
tp (12)
The second term on the right-hand side of Equation 11, representing the rate of change in the
water volume of RBC, varies as a result of the change in the intracellular volume [10]:
)()(
)0(
)0()(tQ
dt
tdV
V
V
dt
tdV trc
ti
i
rct
rc (13)
Vi(0) and Vrc(0) stand, respectively, for the initial IC volume and the initial water volume of
red blood cells. The initial water volume of RBC is related to the initial plasma volume,
Vp(0), and the initial arterial hematocrit, Ht(0):
)0(1
)0()0()0(
Ht
VHtV p
rc (14)
40
Mathematthical Study of Blood Volume Changes during Hemodialysis
According to Equation 12, during dialysis with ultrafiltration the decline in plasma volume
resulting from the volume loss by ultrafiltration is partially compensated for by the volume
gain from the interstitial space.
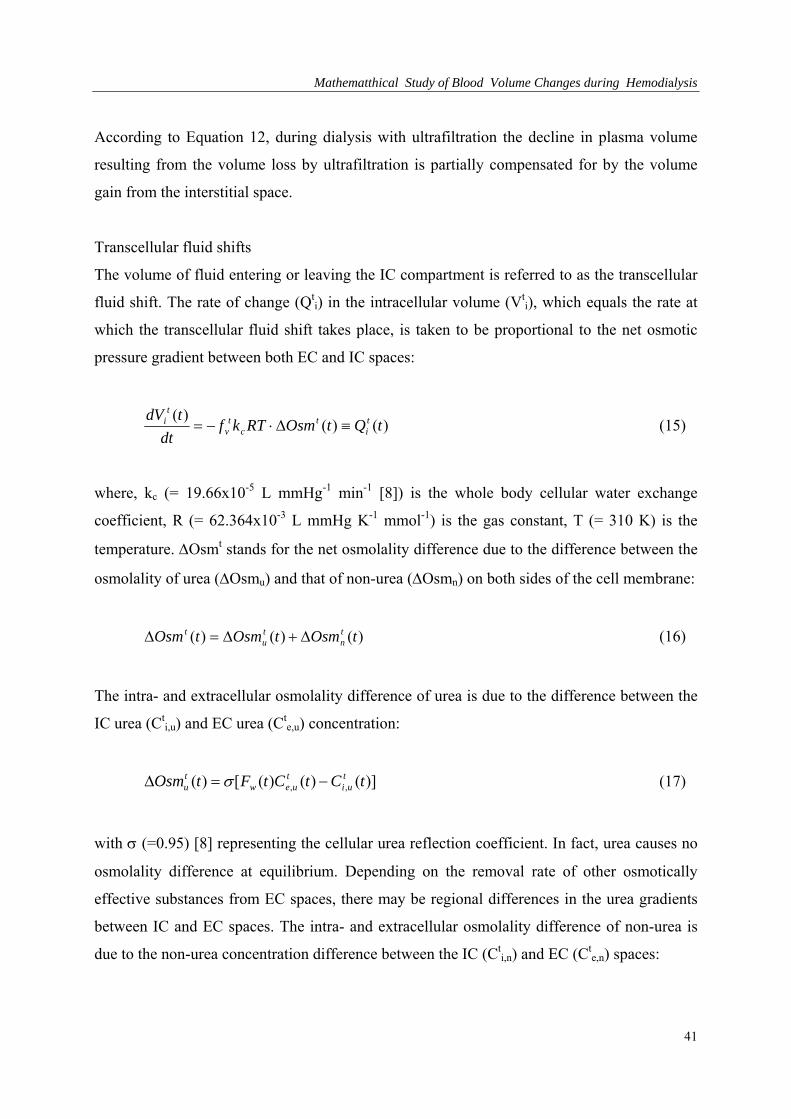
Transcellular fluid shifts
The volume of fluid entering or leaving the IC compartment is referred to as the transcellular
fluid shift. The rate of change (Qti) in the intracellular volume (Vt
i), which equals the rate at
which the transcellular fluid shift takes place, is taken to be proportional to the net osmotic
pressure gradient between both EC and IC spaces:
)()()(
tQtOsmRTkfdt
tdV ti
tc
tv
ti (15)
where, kc (= 19.66x10⁻⁵ L mmHg-1 min-1 [8]) is the whole body cellular water exchange
coefficient, R (= 62.364x10⁻³ L mmHg K-1 mmol-1) is the gas constant, T (= 310 K) is the
temperature. Osmt stands for the net osmolality difference due to the difference between the
osmolality of urea (Osmu) and that of non-urea (Osmn) on both sides of the cell membrane:
)()()( tOsmtOsmtOsm tn
tu
t (16)
The intra- and extracellular osmolality difference of urea is due to the difference between the
IC urea (Cti,u) and EC urea (Ct
e,u) concentration:
)]()()([)( ,, tCtCtFtOsm tui
tuew
tu (17)
with (=0.95) [8] representing the cellular urea reflection coefficient. In fact, urea causes no
osmolality difference at equilibrium. Depending on the removal rate of other osmotically
effective substances from EC spaces, there may be regional differences in the urea gradients
between IC and EC spaces. The intra- and extracellular osmolality difference of non-urea is
due to the non-urea concentration difference between the IC (Cti,n) and EC (Ct
e,n) spaces:
41
Chapter 2
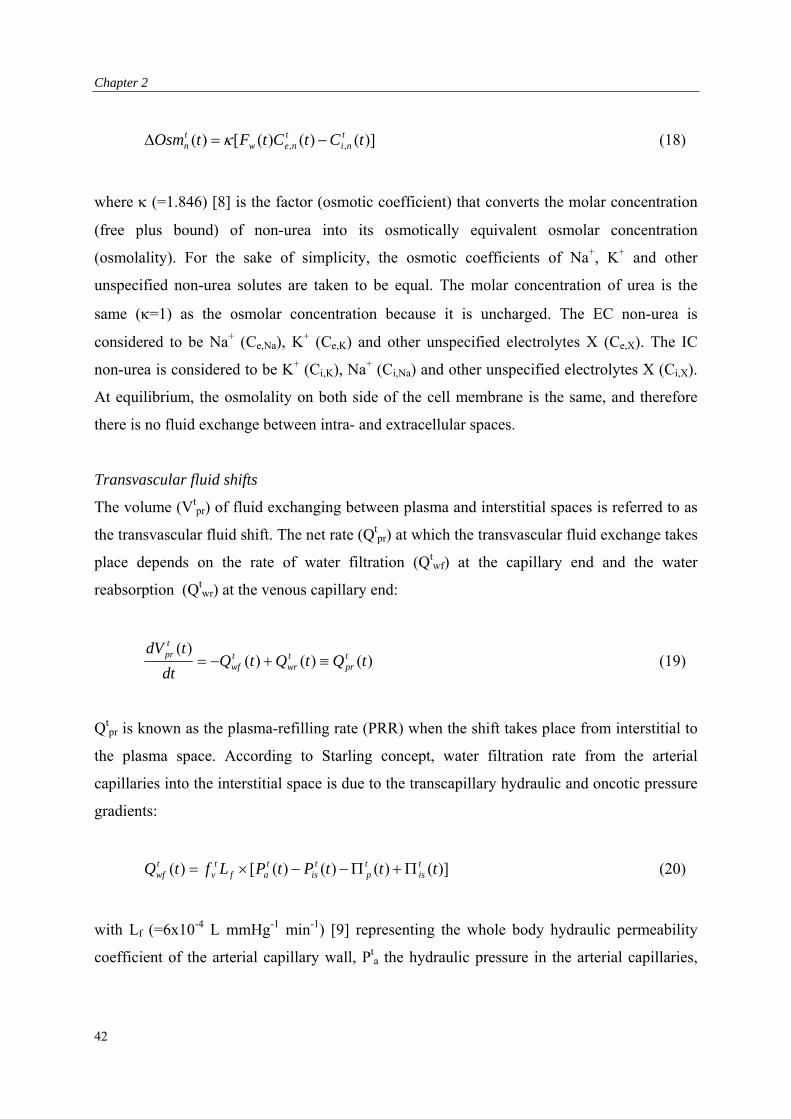
)]()()([)( ,, tCtCtFtOsm tni
tnew
tn (18)
where (=1.846) [8] is the factor (osmotic coefficient) that converts the molar concentration
(free plus bound) of non-urea into its osmotically equivalent osmolar concentration
(osmolality). For the sake of simplicity, the osmotic coefficients of Na+, K+ and other
unspecified non-urea solutes are taken to be equal. The molar concentration of urea is the
same (=1) as the osmolar concentration because it is uncharged. The EC non-urea is
considered to be Na+ (Ce,Na), K+ (Ce,K) and other unspecified electrolytes X (Ce,X). The IC
non-urea is considered to be K+ (Ci,K), Na+ (Ci,Na) and other unspecified electrolytes X (Ci,X).
At equilibrium, the osmolality on both side of the cell membrane is the same, and therefore
there is no fluid exchange between intra- and extracellular spaces.
Transvascular fluid shifts
The volume (Vtpr) of fluid exchanging between plasma and interstitial spaces is referred to as
the transvascular fluid shift. The net rate (Qtpr) at which the transvascular fluid exchange takes
place depends on the rate of water filtration (Qtwf) at the capillary end and the water
reabsorption (Qtwr) at the venous capillary end:
)()()()(
tQtQtQdt
tdVtpr
twr
twf
tpr (19)
Qtpr is known as the plasma-refilling rate (PRR) when the shift takes place from interstitial to
the plasma space. According to Starling concept, water filtration rate from the arterial
capillaries into the interstitial space is due to the transcapillary hydraulic and oncotic pressure
gradients:
)]()()()([)( tt tPtPLftQ tis
tp
tis
taf
tv
twf (20)
with Lf (=6x10⁻⁴ L mmHg-1 min-1) [9] representing the whole body hydraulic permeability
coefficient of the arterial capillary wall, Pta the hydraulic pressure in the arterial capillaries,
42
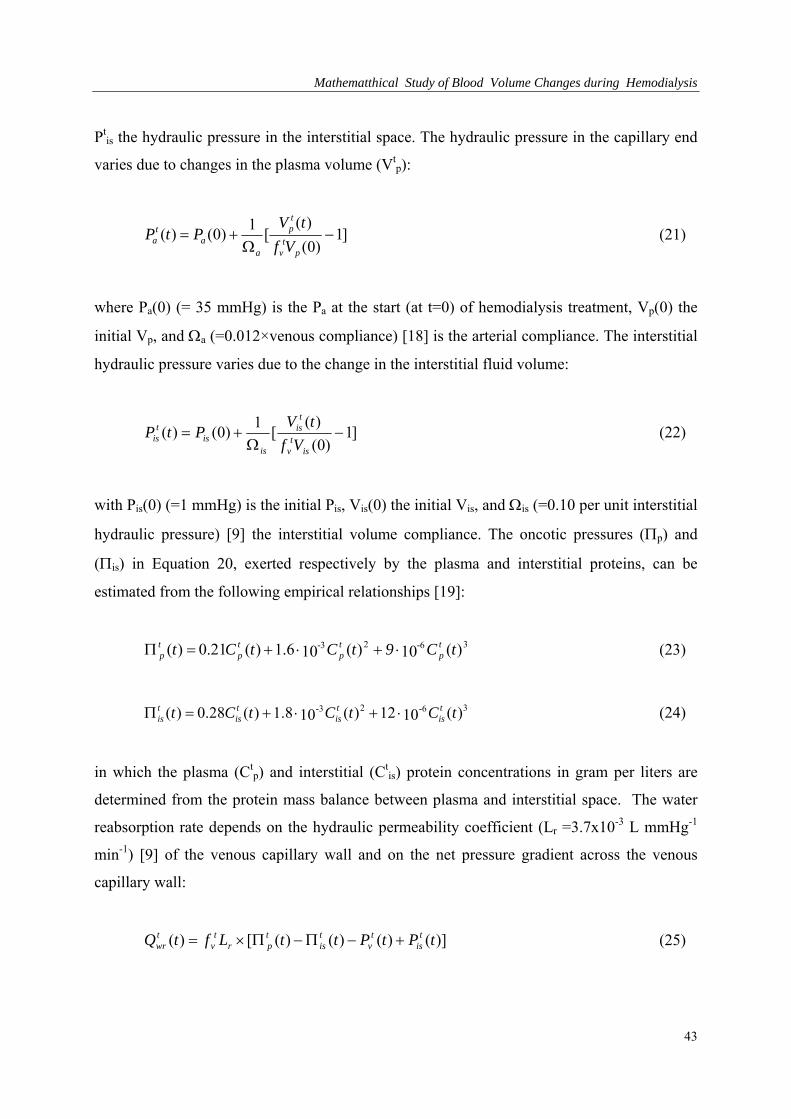
Mathematthical Study of Blood Volume Changes during Hemodialysis
Ptis the hydraulic pressure in the interstitial space. The hydraulic pressure in the capillary end
varies due to changes in the plasma volume (Vtp):
]1)0(
)([
1)0()(
pt
v
tp
aa
ta Vf
tVPtP (21)
where Pa(0) (= 35 mmHg) is the Pa at the start (at t=0) of hemodialysis treatment, Vp(0) the
initial Vp, and a (=0.012×venous compliance) [18] is the arterial compliance. The interstitial
hydraulic pressure varies due to the change in the interstitial fluid volume:
]1)0(
)([
1)0()(
ist
v
tis
isis
tis Vf
tVPtP (22)
with Pis(0) (=1 mmHg) is the initial Pis, Vis(0) the initial Vis, and is (=0.10 per unit interstitial
hydraulic pressure) [9] the interstitial volume compliance. The oncotic pressures (p) and
(is) in Equation 20, exerted respectively by the plasma and interstitial proteins, can be
estimated from the following empirical relationships [19]:
3623 )(10)(106.1)(21.0)( tC9tCtC t tp
-tp
-tp
tp (23)
3623 )(1012)(108.1)(28.0)( tCtCtC t tis
-tis
-tis
tis (24)
in which the plasma (Ctp) and interstitial (Ct
is) protein concentrations in gram per liters are
determined from the protein mass balance between plasma and interstitial space. The water
reabsorption rate depends on the hydraulic permeability coefficient (Lr =3.7x10⁻³ L mmHg-1
min-1) [9] of the venous capillary wall and on the net pressure gradient across the venous
capillary wall:
)]()()()([)( tPtPttLftQ tis
tv
tis
tpr
tv
twr (25)
43
Chapter 2
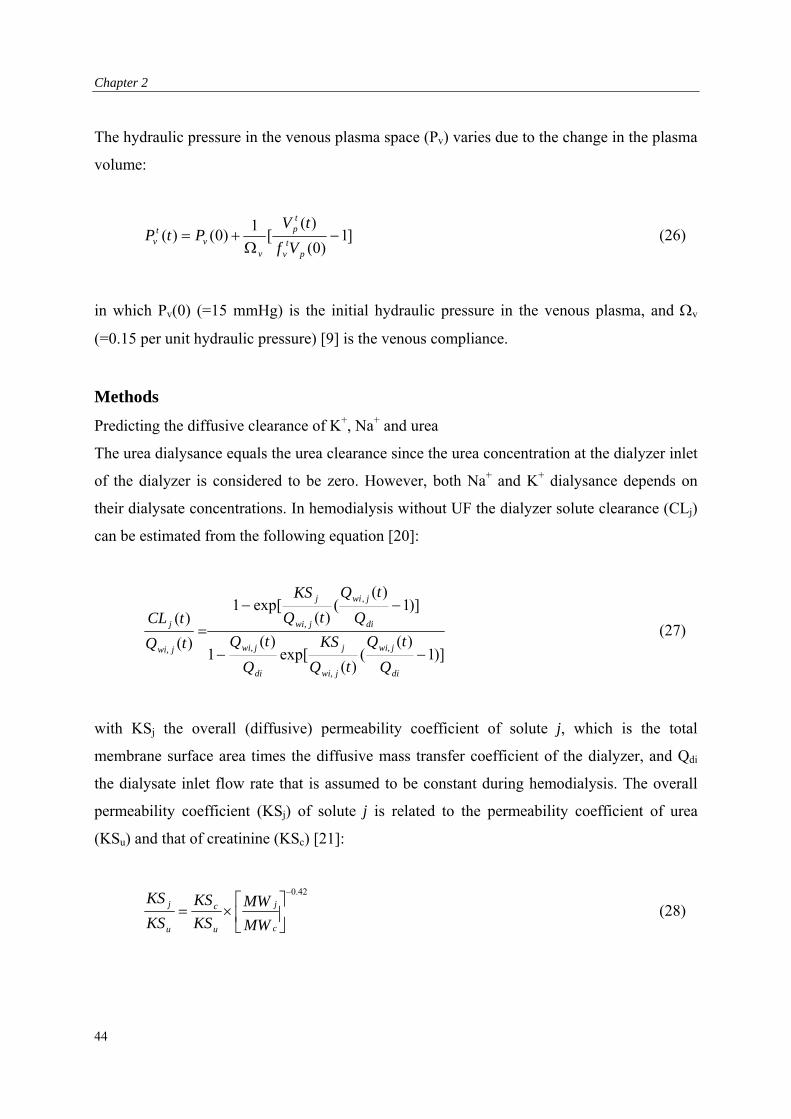
The hydraulic pressure in the venous plasma space (Pv) varies due to the change in the plasma
volume:
]1)0(
)([
1)0()(
pt
v
tp
vv
tv Vf
tVPtP (26)
in which Pv(0) (=15 mmHg) is the initial hydraulic pressure in the venous plasma, and v
(=0.15 per unit hydraulic pressure) [9] is the venous compliance.
Methods
Predicting the diffusive clearance of K+, Na+ and urea
The urea dialysance equals the urea clearance since the urea concentration at the dialyzer inlet
of the dialyzer is considered to be zero. However, both Na+ and K+ dialysance depends on
their dialysate concentrations. In hemodialysis without UF the dialyzer solute clearance (CLj)
can be estimated from the following equation [20]:
)]1)(
()(
exp[)(
1
)]1)(
()(
exp[1
)(
)(,
Q
tQ
tQ
KS
Q
tQ
Q
tQ
tQ
KS
tQ
tCL
di
jwi,
j wi,
j
di
jwi,
di
jwi
j wi,
j
j wi,
j (27)
with KSj the overall (diffusive) permeability coefficient of solute j, which is the total
membrane surface area times the diffusive mass transfer coefficient of the dialyzer, and Qdi
the dialysate inlet flow rate that is assumed to be constant during hemodialysis. The overall
permeability coefficient (KSj) of solute j is related to the permeability coefficient of urea
(KSu) and that of creatinine (KSc) [21]:
MW
MWKS
KS
KS
KS
c
j
u
c
u
j42.0
(28)
44
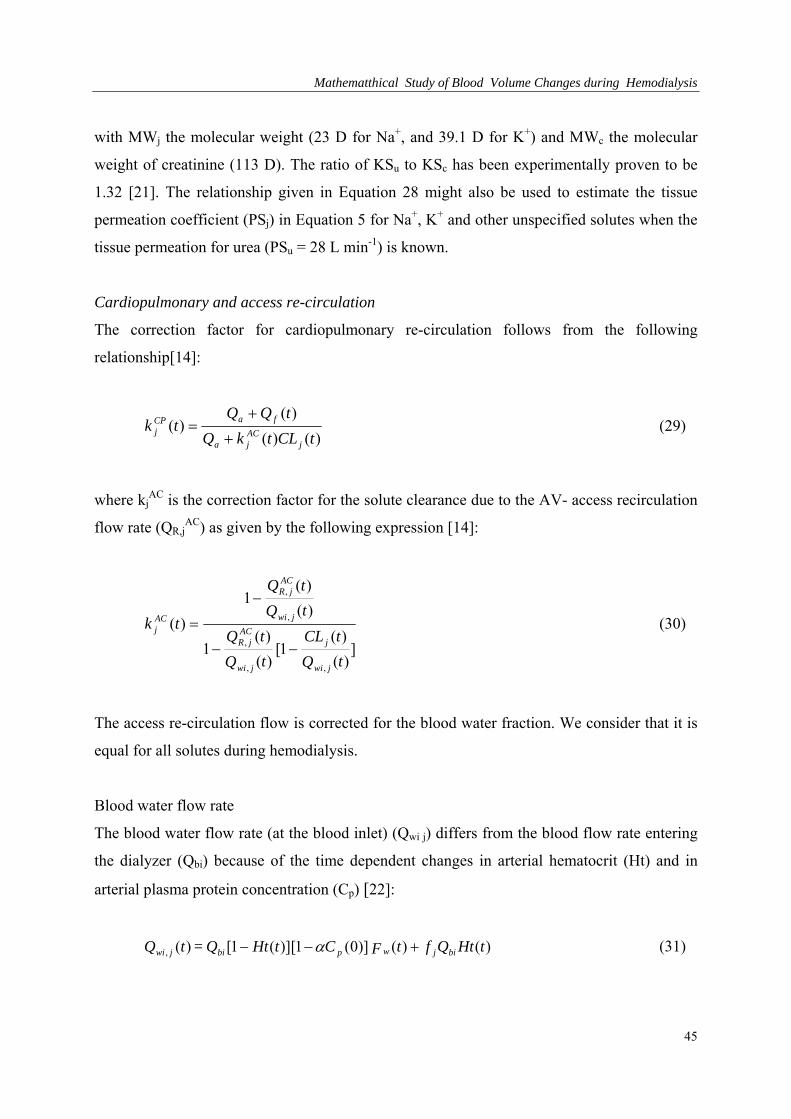
Mathematthical Study of Blood Volume Changes during Hemodialysis
with MWj the molecular weight (23 D for Na+, and 39.1 D for K+) and MWc the molecular
weight of creatinine (113 D). The ratio of KSu to KSc has been experimentally proven to be
1.32 [21]. The relationship given in Equation 28 might also be used to estimate the tissue
permeation coefficient (PSj) in Equation 5 for Na+, K+ and other unspecified solutes when the
tissue permeation for urea (PSu = 28 L min-1) is known.
Cardiopulmonary and access re-circulation
The correction factor for cardiopulmonary re-circulation follows from the following
relationship[14]:
)()(
)()(
tCLtkQ
tQQtk
jACja
faCPj
(29)
where kjAC is the correction factor for the solute clearance due to the AV- access recirculation
flow rate (QR,jAC) as given by the following expression [14]:
])(
)(1[
)(
)(1
)(
)(1
)(
,,
,
,
,
tQ
tCL
tQ
tQ
tQ
tQ
tk
jwi
j
jwi
ACjR
jwi
ACjR
ACj
(30)
The access re-circulation flow is corrected for the blood water fraction. We consider that it is
equal for all solutes during hemodialysis.
Blood water flow rate
The blood water flow rate (at the blood inlet) (Qwi j) differs from the blood flow rate entering
the dialyzer (Qbi) because of the time dependent changes in arterial hematocrit (Ht) and in
arterial plasma protein concentration (Cp) [22]:
)()()]0(1)][(1[)(, tHtQftF CtHtQ = tQ bijwpbijwi (31)
45
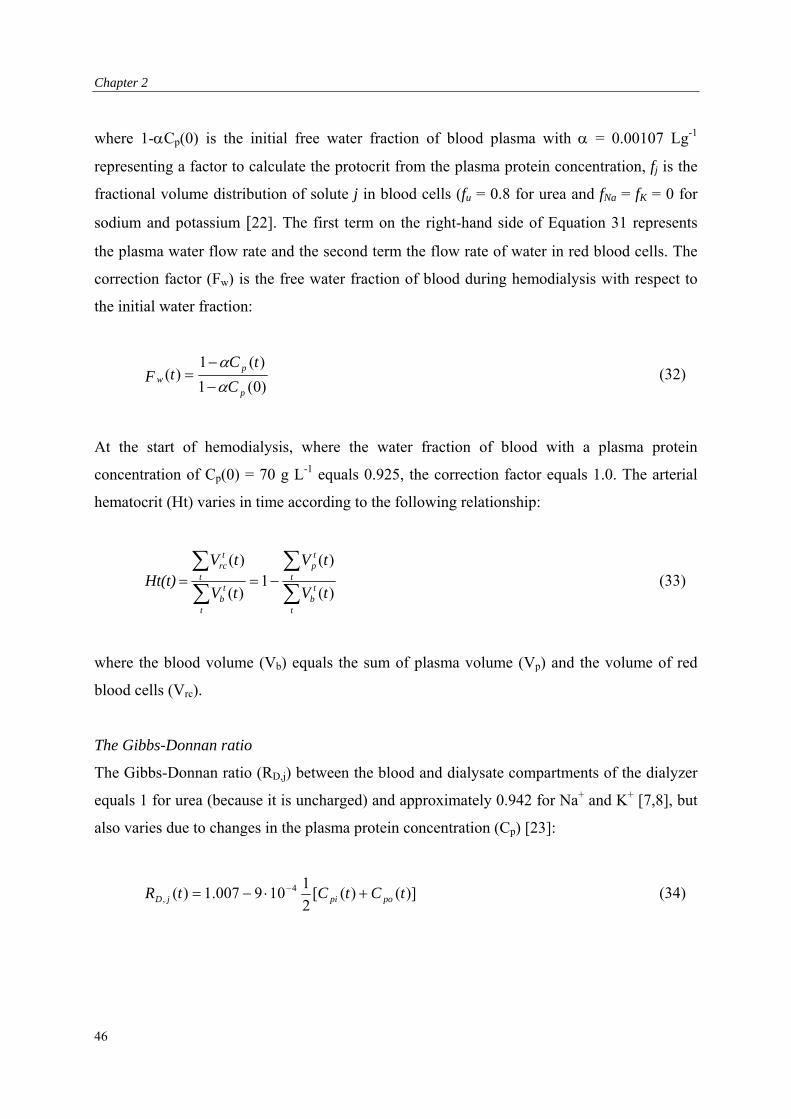
Chapter 2
where 1-Cp(0) is the initial free water fraction of blood plasma with = 0.00107 Lg-1
representing a factor to calculate the protocrit from the plasma protein concentration, fj is the
fractional volume distribution of solute j in blood cells (fu = 0.8 for urea and fNa = fK = 0 for
sodium and potassium [22]. The first term on the right-hand side of Equation 31 represents
the plasma water flow rate and the second term the flow rate of water in red blood cells. The
correction factor (Fw) is the free water fraction of blood during hemodialysis with respect to
the initial water fraction:
)0(1
)(1)(
p
pw
C
tCtF
(32)
At the start of hemodialysis, where the water fraction of blood with a plasma protein
concentration of Cp(0) = 70 g L-1 equals 0.925, the correction factor equals 1.0. The arterial
hematocrit (Ht) varies in time according to the following relationship:
t
tb
t
tp
t
tb
t
trc
tV
tV
tV
tV Ht(t)
)(
)(1
)(
)( (33)
where the blood volume (Vb) equals the sum of plasma volume (Vp) and the volume of red
blood cells (Vrc).
The Gibbs-Donnan ratio
The Gibbs-Donnan ratio (RD,j) between the blood and dialysate compartments of the dialyzer
equals 1 for urea (because it is uncharged) and approximately 0.942 for Na+ and K+ [7,8], but
also varies due to changes in the plasma protein concentration (Cp) [23]:
)]()([2
1109007.1)( 4
, tCtCtR popijD (34)
46
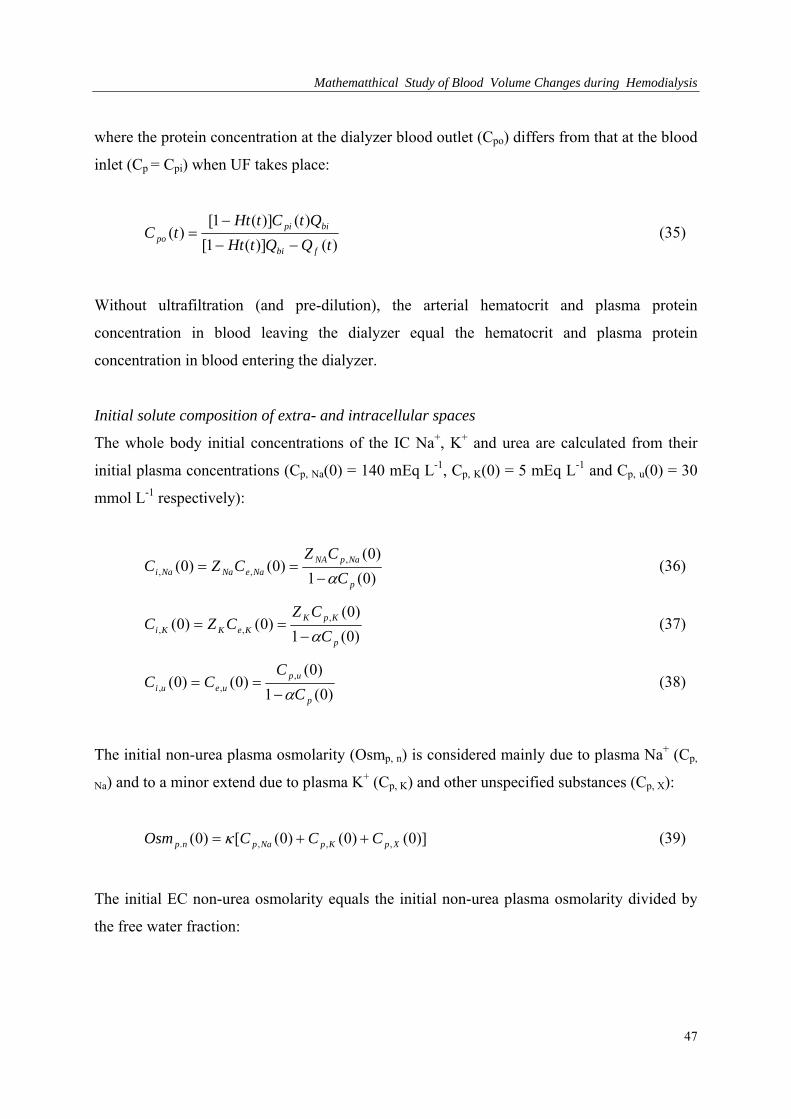
Mathematthical Study of Blood Volume Changes during Hemodialysis
where the protein concentration at the dialyzer blood outlet (Cpo) differs from that at the blood
inlet (Cp = Cpi) when UF takes place:
)()](1[
)()](1[)(
tQQtHt
QtCtHttC
fbi
bipipo
(35)
Without ultrafiltration (and pre-dilution), the arterial hematocrit and plasma protein
concentration in blood leaving the dialyzer equal the hematocrit and plasma protein
concentration in blood entering the dialyzer.
Initial solute composition of extra- and intracellular spaces
The whole body initial concentrations of the IC Na+, K+ and urea are calculated from their
initial plasma concentrations (Cp, Na(0) = 140 mEq L-1, Cp, K(0) = 5 mEq L-1 and Cp, u(0) = 30
mmol L-1 respectively):
)0(1
)0()0()0( ,
,,p
NapNANaeNaNai C
CZCZC
(36)
)0(1
)0()0()0( ,
,,p
KpKKeKKi C
CZCZC
(37)
)0(1
)0()0()0( ,
,,p
upueui C
C CC
(38)
The initial non-urea plasma osmolarity (Osmp, n) is considered mainly due to plasma Na+ (Cp,
Na) and to a minor extend due to plasma K+ (Cp, K) and other unspecified substances (Cp, X):
)]0()0()0([)0( ,,,. XpKpNapnp CCCOsm (39)
The initial EC non-urea osmolarity equals the initial non-urea plasma osmolarity divided by
the free water fraction:
47
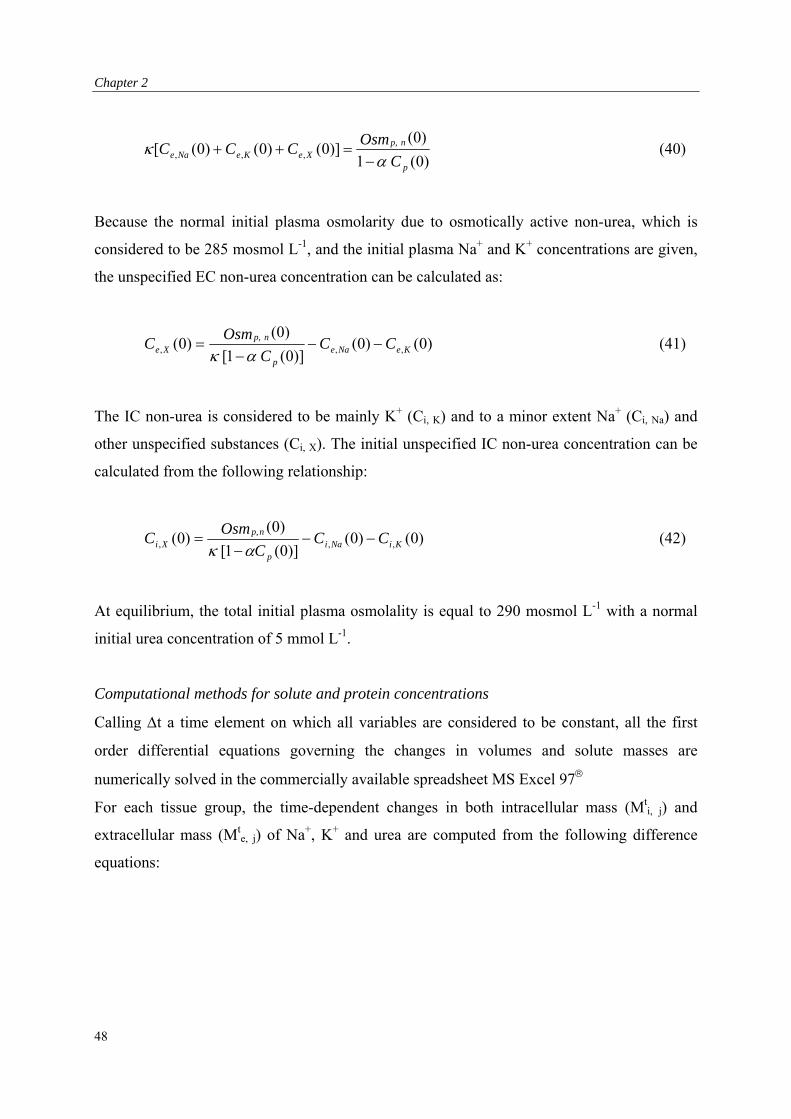
Chapter 2
)0(1
)0()]0()0()0([ ,,,
p
n p,XeKeNae C
OsmCCC
(40)
Because the normal initial plasma osmolarity due to osmotically active non-urea, which is
considered to be 285 mosmol L-1, and the initial plasma Na+ and K+ concentrations are given,
the unspecified EC non-urea concentration can be calculated as:
)0()0()]0(1[
)0()0( ,,, KeNae
p
n p,Xe CC
C Osm
C
(41)
The IC non-urea is considered to be mainly K+ (Ci, K) and to a minor extent Na+ (Ci, Na) and
other unspecified substances (Ci, X). The initial unspecified IC non-urea concentration can be
calculated from the following relationship:
)0()0()]0(1[
)0()0( ,,, KiNai
p
n p,Xi CC
C Osm
C
(42)
At equilibrium, the total initial plasma osmolality is equal to 290 mosmol L-1 with a normal
initial urea concentration of 5 mmol L-1.
Computational methods for solute and protein concentrations
Calling t a time element on which all variables are considered to be constant, all the first
order differential equations governing the changes in volumes and solute masses are
numerically solved in the commercially available spreadsheet MS Excel 97
For each tissue group, the time-dependent changes in both intracellular mass (Mti, j) and
extracellular mass (Mte, j) of Na+, K+ and urea are computed from the following difference
equations:
48
Mathematthical Study of Blood Volume Changes during Hemodialysis
t tJ tMt tM tji
tji
tji )()()( ,,, (43)
t tJ tMt tM tje
tje
tje )()()( ,,, (44)
The initial value of Mti, j equals ft
vVi(0)Ci, j(0) and that of Mte, j equals ft
vVe(0)Ce, j(0). Jti,j and
Jte,j are given by Equation 1 and Equation 2 respectively. Given the exchange rate of
intracellular fluid (Qti) as in Equation 15 and the exchange rate of intracellular fluid (Qt
e) as in
Equation 9, the time-dependent changes in both intra- and extracellular volumes can be
computed from the following difference equations:
t tQtVt tV ti
ti
ti )()()( (45)
t tQtVt tV te
te
te )()()( (46)
The initial values of Vti and Vt
e equal ftvVi(0) and ft
vVe(0) respectively. The time-dependent
change in the transcellular fluid shift is calculated as Vti(t)=Vt
i(0)-Vti(t). The starting value
of whole body Vi (Ve) is estimated as 5/8 (3/8) times the sum of the total body water and the
weight gain (excess water volume).
The total body water volume is estimated as 58% of the dry body weight. The time-dependent
changes in plasma volume (Vtp) are calculated as the difference between the plasma refilling
rate (Qtpr) from Equation 19 and the cumulative volume loss (Vt
uf) by UF:
ttQftQtVttV ft
vtpr
tp
tp )]()([)()( (47)
The initial plasma volume, Vtp(0) = ft
vVp(0), is estimated as 24% of the initial EC volume.
The cumulative volume gain by plasma refilling from the interstitial space and the volume
loss from the plasma volume by ultrafiltration are computed as follows:
t tQtVt tV tpr
tpr
tpr )()()( (48)
t tQftVt tV ft
vt
uft
uf )()()( (49)
49
Chapter 2
The initial values of Vtpr and Vt
uf equal zero. At the end of dialysis session (t=Td), Equation 48
results in the total plasma water volume gain (loss) from (to) the interstitial space. At t=Td,
Equation 49 results in the total volume loss by ultrafiltration that equals the initially
determined weight gain (excess water volume). The ultrafiltration flow rate can be profiled as
desired. In this simulation work, we utilize a constant ultrafiltration flow rate during
hemodialysis and calculate it by dividing the excess water volume by the duration of dialysis
session. We calculate the relative time-dependent change in the plasma volume as RVtp (t) =
[Vtp(t)/V
tp(0)] –1. The time-dependent changes in the water volume of RBC are calculated as:
t tQtVt tV trc
trc
trc )()()( (50)
where the initial value of Vtrc(0)=ft
vVrc(0), and Qtrc is calculated from Equation 13. The
interstitial volume is calculated as the EC volume minus the blood volume:
)]()([)()()()( tVtVtVtVtVtV trc
tp
te
tb
te
tis (51)
On dividing the solute mass by the volume, the intra- and extracellular concentrations of Na+,
K+ and urea are calculated:
)(
)()(
)(
)()( ,
,,
, tV
tM tC
tV
tM tC
te
tjet
jeti
tjit
ji (52)
The unspecified substances are not removed across the dialyzer membrane. Consequently,
their time-dependent changes in both intra- and extracellular spaces are due to changes in
volumes:
50
Mathematthical Study of Blood Volume Changes during Hemodialysis
)()(
)0()0()(
)(
)0()0()( ,
,,
, tVtF
CVtC
tV
CV tC
tew
tXe
tet
Xeti
tXi
tit
Xi (53)
Total plasma protein and interstitial protein concentrations can be computed as:
t
tis
is
is
is
t
tp
p
p
p
tV
V
C
tC
tV
V
C
tC
)(
)0(
)0(
)(
)(
)0(
)0(
)( (54)
in which the initial plasma and interstitial protein concentration are considered respectively as
Cp(0) = 70 g L-1 and Cis(0) = 19.2 g L-1 to obtain a zero plasma refilling rate at t = 0.
Adequacy of dialysis treatment
To evaluate the adequacy of hemodialysis sessions we calculate the dialysis dose (Dd), which
is known as KT/V-value in the literature [24]. An adequate dialysis treatment for urea is
achieved if the total urea clearance per treatment is higher than the post-dialysis volume of
urea distribution (Vi+Ve) in patients who have negligible residual renal function. This
statement is characterized by dialysis dose. We calculate the cumulative dialysis dose during
hemodialysis by making use of Equation 7:
t
te
tiuaw
CPu
udial
tVtVtCtFtk
ttJ tDdt tDd
)]()([)()()(
)()()(
,
, (55)
At t=0 the dialysis dose equals zero. At t=Td (the end of dialysis session), Equation 55 results
in the value of dialysis dose. In general, a dialysis dose of 1.2 to 1.4 achieved at the end of a
dialysis session lasting Td = 4 hours on a trice weekly basis has been shown to be associated
with decreased mortality [24].
51
Chapter 2
Results
Simulations
We simulated diffusive hemodialysis (DHD) session with zero UF rate (Qf = 0) to correct
uremia with a dialysis dose of 1.2, isolated ultrafiltration (IU) treatment (CLu = CLNa = CLK =
0) to correct excess water, and standard hemodialysis (SHD) session to correct uremia with a
dialysis dose of 1.25 and to withdraw excess water simultaneously. All simulated sessions,
each lasting 4 hr, were calculated for an adult of 72 Kg dry-weight with an excess water
volume of 3.2 L, and with an initial plasma urea concentration of 30 mmol L-1 indicating the
initial uremic state. The dialysate Na+ and K+ concentrations were 140 and 2 mEq L-1
respectively. The initial diffusive clearance values of urea, Na+ and K+ were calculated as
0.225, 0.19 and 0.186 L min-1 respectively from Qbi = 0.3 L min-1, Qdi = 0.5 L min-1 and SKu =
0.72 L min-1. The tissue permeation coefficients of Na+ and K+ were calculated from that of
urea (PSu = 28 L min-1) according to Equation 28. The cardiac output and the arterial blood
access flow rate were 6.3 and 0.8 L min-1 respectively. The access flow recirculation ratio was
assumed 0.03. The fractions of tissue volume and blood perfusion were fHv = 0.2, fH
q = 0.8,
for HFS, and fLv = 0.8, fL
q = 0.2 for the LFS, corresponding to mH = 0.98 and mL = 0.64 for
urea.
Transcellular fluid shifts
Figure 1 shows time courses (bold thick lines) of the exchange rates of IC fluid (Qi) and the
resulting fluid shifts (Vi) in HFS, LFS and HFS+LFS during DHD. Both tissue groups are
assumed to have equal fractions of volumes (fLv = fH
v = 0.5) and equal fractions of blood
perfusion (fLq = fH
q = 0.5), corresponding to mL = mH = 0.92. During early hours of DHD, the
sum of transcellular osmolar gradients in both tissue groups due to changes in urea and non-
urea concentrations result in a negative net osmolar gradient (Qi <0). This causes a fluid shift
from the EC to the IC space. Note that the magnitude of fluid shift equals the area under the
net Qi-curve. After that an equilibrium state (Qi = 0) is reached, the net osmolar gradients
become positive (Qi >0) and increase gradually to the end of treatment, causing a decrease in
the fluid shift from EC to the IC spaces. The osmolar gradients in both tissue groups develop
equally.
52
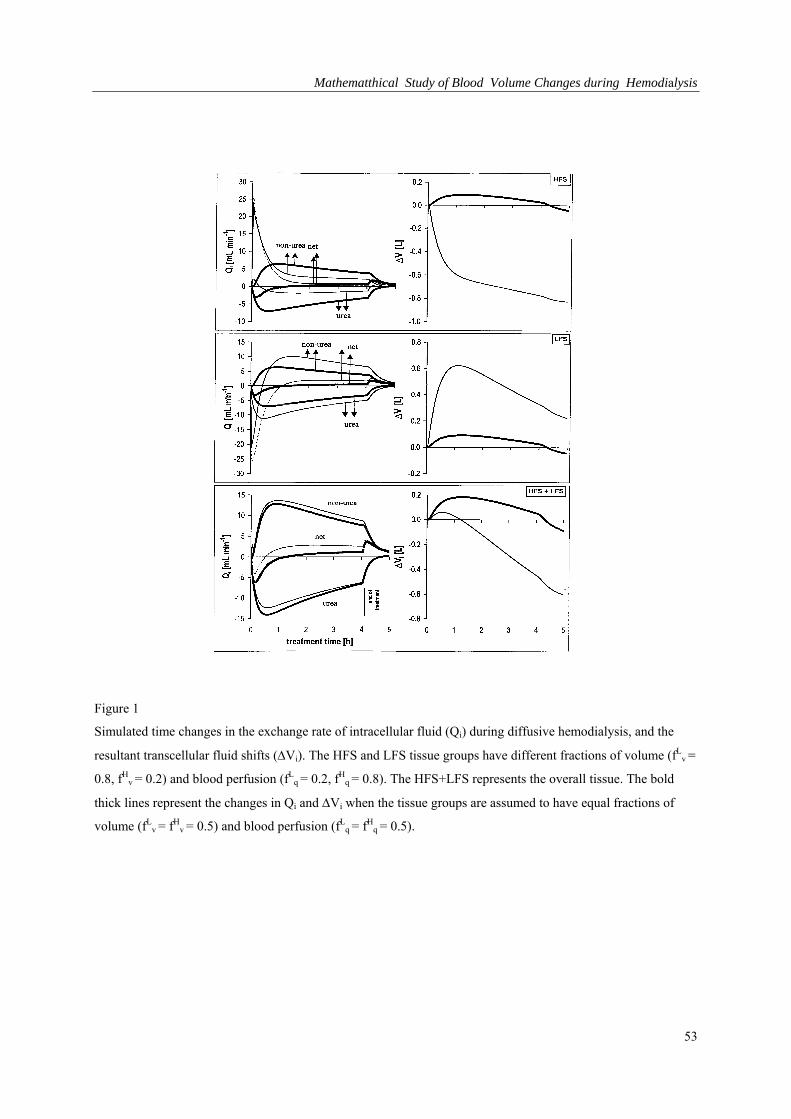
Mathematthical Study of Blood Volume Changes during Hemodialysis
Figure 1
Simulated time changes in the exchange rate of intracellular fluid (Qi) during diffusive hemodialysis, and the
resultant transcellular fluid shifts (Vi). The HFS and LFS tissue groups have different fractions of volume (fLv =
0.8, fHv = 0.2) and blood perfusion (fL
q = 0.2, fHq = 0.8). The HFS+LFS represents the overall tissue. The bold
thick lines represent the changes in Qi and Vi when the tissue groups are assumed to have equal fractions of
volume (fLv = fH
v = 0.5) and blood perfusion (fLq = fH
q = 0.5).
53
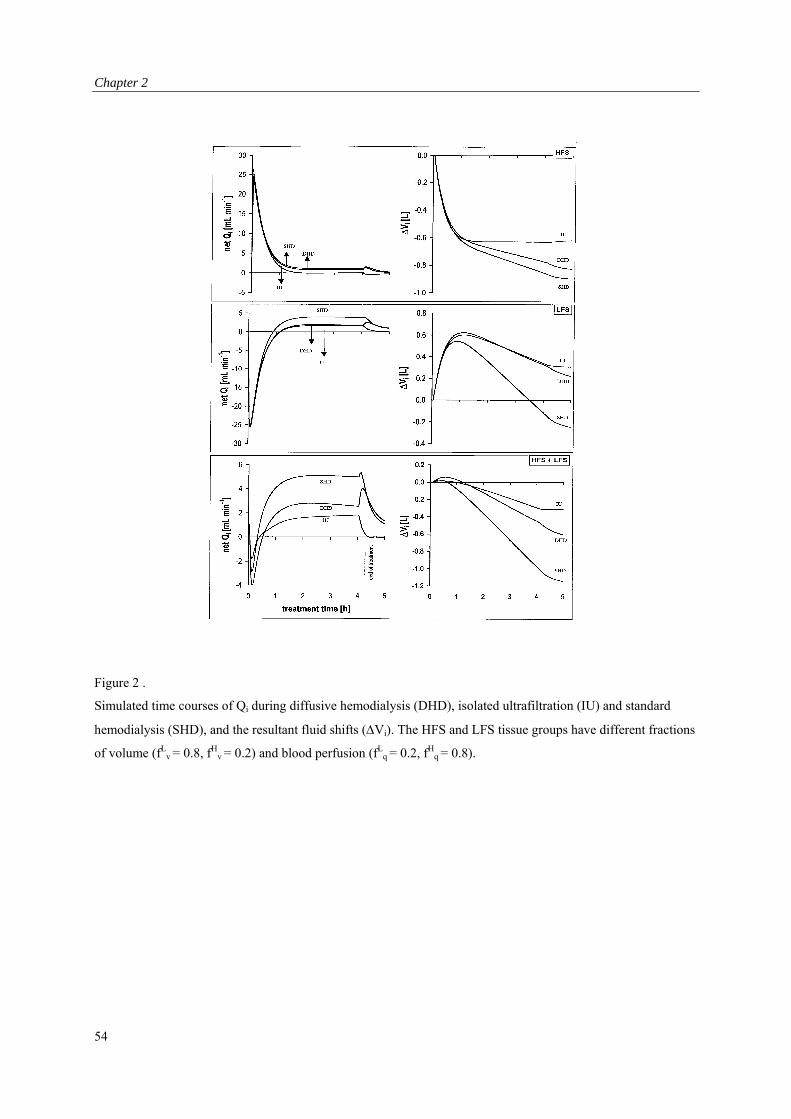
Chapter 2
Figure 2 .
Simulated time courses of Qi during diffusive hemodialysis (DHD), isolated ultrafiltration (IU) and standard
hemodialysis (SHD), and the resultant fluid shifts (Vi). The HFS and LFS tissue groups have different fractions
of volume (fLv = 0.8, fH
v = 0.2) and blood perfusion (fLq = 0.2, fH
q = 0.8).
54
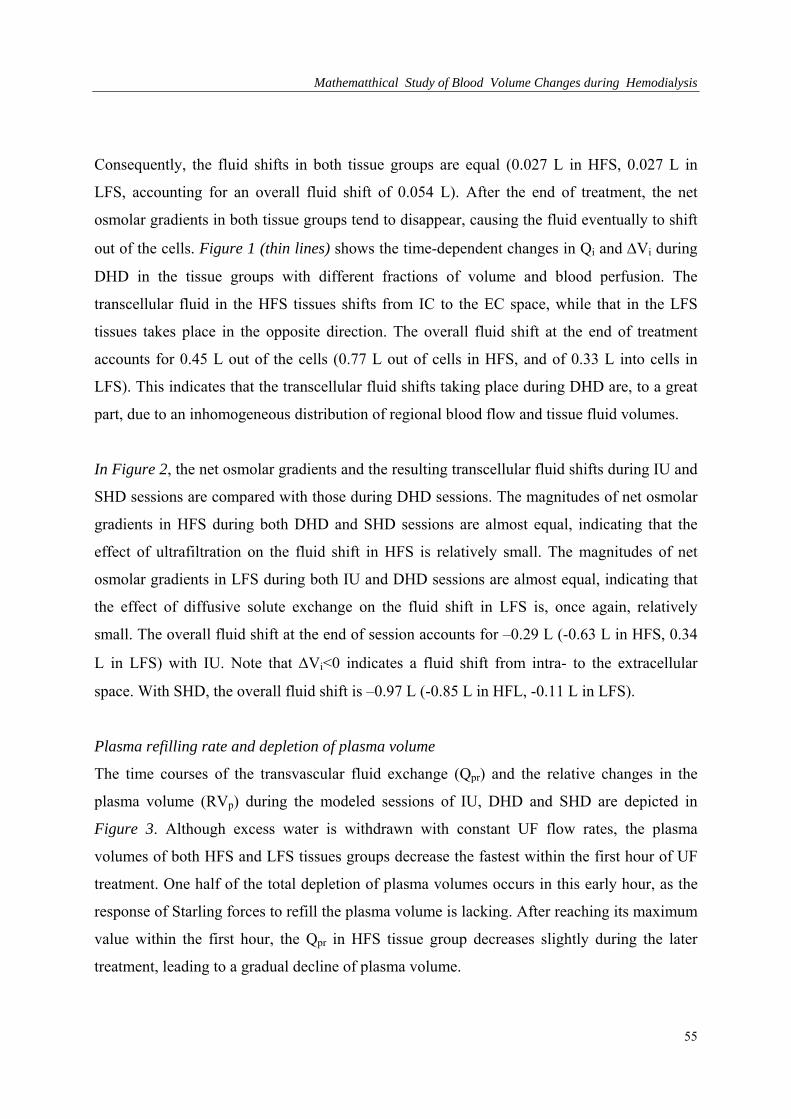
Mathematthical Study of Blood Volume Changes during Hemodialysis
Consequently, the fluid shifts in both tissue groups are equal (0.027 L in HFS, 0.027 L in
LFS, accounting for an overall fluid shift of 0.054 L). After the end of treatment, the net
osmolar gradients in both tissue groups tend to disappear, causing the fluid eventually to shift
out of the cells. Figure 1 (thin lines) shows the time-dependent changes in Qi and Vi during
DHD in the tissue groups with different fractions of volume and blood perfusion. The
transcellular fluid in the HFS tissues shifts from IC to the EC space, while that in the LFS
tissues takes place in the opposite direction. The overall fluid shift at the end of treatment
accounts for 0.45 L out of the cells (0.77 L out of cells in HFS, and of 0.33 L into cells in
LFS). This indicates that the transcellular fluid shifts taking place during DHD are, to a great
part, due to an inhomogeneous distribution of regional blood flow and tissue fluid volumes.
In Figure 2, the net osmolar gradients and the resulting transcellular fluid shifts during IU and
SHD sessions are compared with those during DHD sessions. The magnitudes of net osmolar
gradients in HFS during both DHD and SHD sessions are almost equal, indicating that the
effect of ultrafiltration on the fluid shift in HFS is relatively small. The magnitudes of net
osmolar gradients in LFS during both IU and DHD sessions are almost equal, indicating that
the effect of diffusive solute exchange on the fluid shift in LFS is, once again, relatively
small. The overall fluid shift at the end of session accounts for –0.29 L (-0.63 L in HFS, 0.34
L in LFS) with IU. Note that Vi<0 indicates a fluid shift from intra- to the extracellular
space. With SHD, the overall fluid shift is –0.97 L (-0.85 L in HFL, -0.11 L in LFS).
Plasma refilling rate and depletion of plasma volume
The time courses of the transvascular fluid exchange (Qpr) and the relative changes in the
plasma volume (RVp) during the modeled sessions of IU, DHD and SHD are depicted in
Figure 3. Although excess water is withdrawn with constant UF flow rates, the plasma
volumes of both HFS and LFS tissues groups decrease the fastest within the first hour of UF
treatment. One half of the total depletion of plasma volumes occurs in this early hour, as the
response of Starling forces to refill the plasma volume is lacking. After reaching its maximum
value within the first hour, the Qpr in HFS tissue group decreases slightly during the later
treatment, leading to a gradual decline of plasma volume.
55
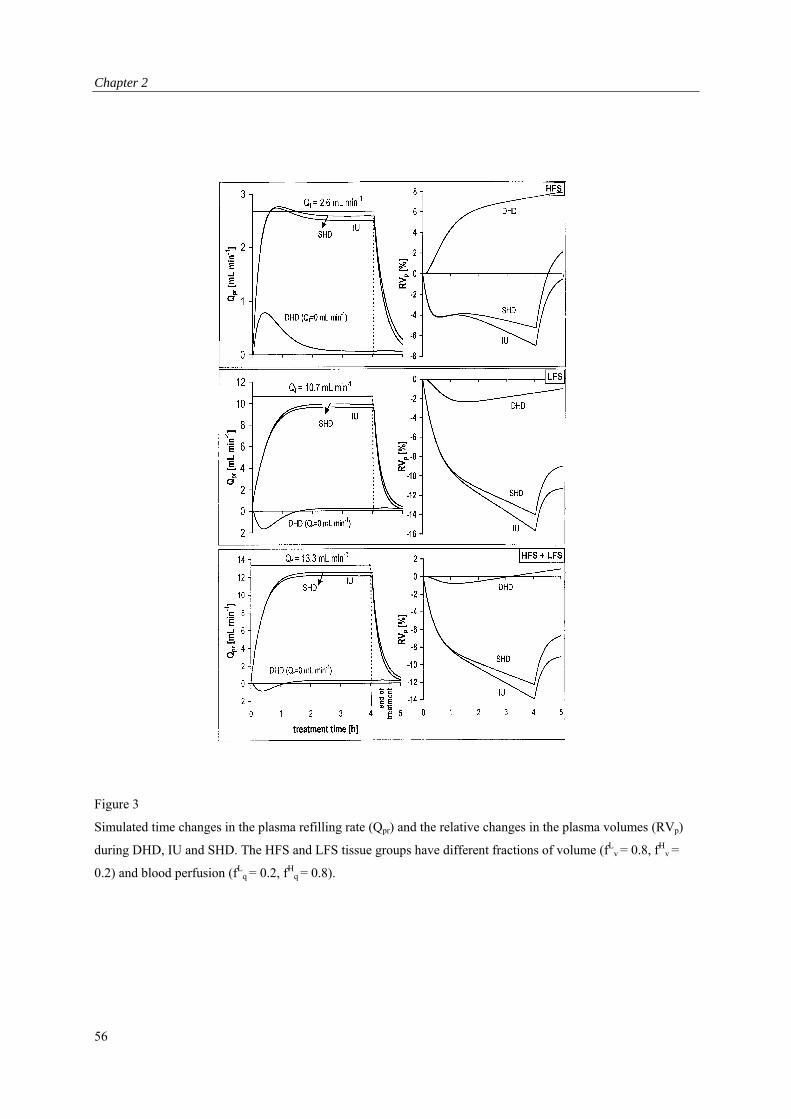
Chapter 2
Figure 3
Simulated time changes in the plasma refilling rate (Qpr) and the relative changes in the plasma volumes (RVp)
during DHD, IU and SHD. The HFS and LFS tissue groups have different fractions of volume (fLv = 0.8, fH
v =
0.2) and blood perfusion (fLq = 0.2, fH
q = 0.8).
56
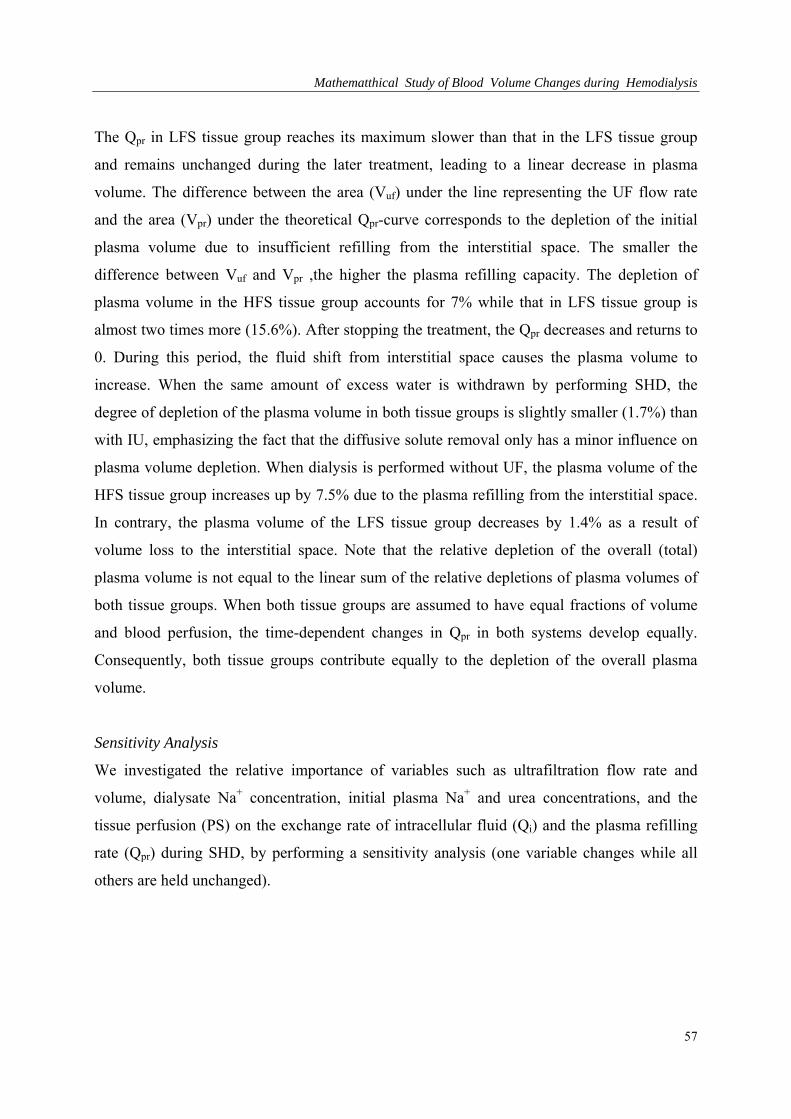
Mathematthical Study of Blood Volume Changes during Hemodialysis
The Qpr in LFS tissue group reaches its maximum slower than that in the LFS tissue group
and remains unchanged during the later treatment, leading to a linear decrease in plasma
volume. The difference between the area (Vuf) under the line representing the UF flow rate
and the area (Vpr) under the theoretical Qpr-curve corresponds to the depletion of the initial
plasma volume due to insufficient refilling from the interstitial space. The smaller the
difference between Vuf and Vpr ,the higher the plasma refilling capacity. The depletion of
plasma volume in the HFS tissue group accounts for 7% while that in LFS tissue group is
almost two times more (15.6%). After stopping the treatment, the Qpr decreases and returns to
0. During this period, the fluid shift from interstitial space causes the plasma volume to
increase. When the same amount of excess water is withdrawn by performing SHD, the
degree of depletion of the plasma volume in both tissue groups is slightly smaller (1.7%) than
with IU, emphasizing the fact that the diffusive solute removal only has a minor influence on
plasma volume depletion. When dialysis is performed without UF, the plasma volume of the
HFS tissue group increases up by 7.5% due to the plasma refilling from the interstitial space.
In contrary, the plasma volume of the LFS tissue group decreases by 1.4% as a result of
volume loss to the interstitial space. Note that the relative depletion of the overall (total)
plasma volume is not equal to the linear sum of the relative depletions of plasma volumes of
both tissue groups. When both tissue groups are assumed to have equal fractions of volume
and blood perfusion, the time-dependent changes in Qpr in both systems develop equally.
Consequently, both tissue groups contribute equally to the depletion of the overall plasma
volume.
Sensitivity Analysis
We investigated the relative importance of variables such as ultrafiltration flow rate and
volume, dialysate Na+ concentration, initial plasma Na+ and urea concentrations, and the
tissue perfusion (PS) on the exchange rate of intracellular fluid (Qi) and the plasma refilling
rate (Qpr) during SHD, by performing a sensitivity analysis (one variable changes while all
others are held unchanged).
57
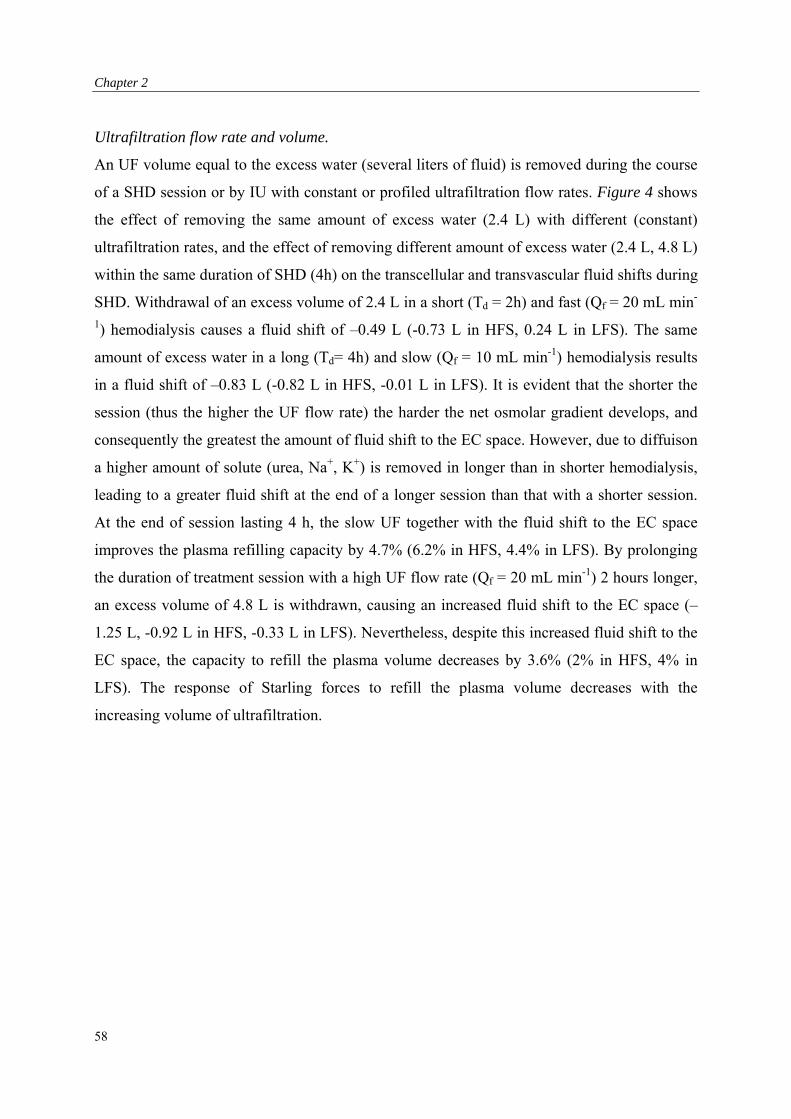
Chapter 2
Ultrafiltration flow rate and volume.
An UF volume equal to the excess water (several liters of fluid) is removed during the course
of a SHD session or by IU with constant or profiled ultrafiltration flow rates. Figure 4 shows
the effect of removing the same amount of excess water (2.4 L) with different (constant)
ultrafiltration rates, and the effect of removing different amount of excess water (2.4 L, 4.8 L)
within the same duration of SHD (4h) on the transcellular and transvascular fluid shifts during
SHD. Withdrawal of an excess volume of 2.4 L in a short (Td = 2h) and fast (Qf = 20 mL min-
1) hemodialysis causes a fluid shift of –0.49 L (-0.73 L in HFS, 0.24 L in LFS). The same
amount of excess water in a long (Td= 4h) and slow (Qf = 10 mL min-1) hemodialysis results
in a fluid shift of –0.83 L (-0.82 L in HFS, -0.01 L in LFS). It is evident that the shorter the
session (thus the higher the UF flow rate) the harder the net osmolar gradient develops, and
consequently the greatest the amount of fluid shift to the EC space. However, due to diffuison
a higher amount of solute (urea, Na+, K+) is removed in longer than in shorter hemodialysis,
leading to a greater fluid shift at the end of a longer session than that with a shorter session.
At the end of session lasting 4 h, the slow UF together with the fluid shift to the EC space
improves the plasma refilling capacity by 4.7% (6.2% in HFS, 4.4% in LFS). By prolonging
the duration of treatment session with a high UF flow rate (Qf = 20 mL min-1) 2 hours longer,
an excess volume of 4.8 L is withdrawn, causing an increased fluid shift to the EC space (–
1.25 L, -0.92 L in HFS, -0.33 L in LFS). Nevertheless, despite this increased fluid shift to the
EC space, the capacity to refill the plasma volume decreases by 3.6% (2% in HFS, 4% in
LFS). The response of Starling forces to refill the plasma volume decreases with the
increasing volume of ultrafiltration.
58
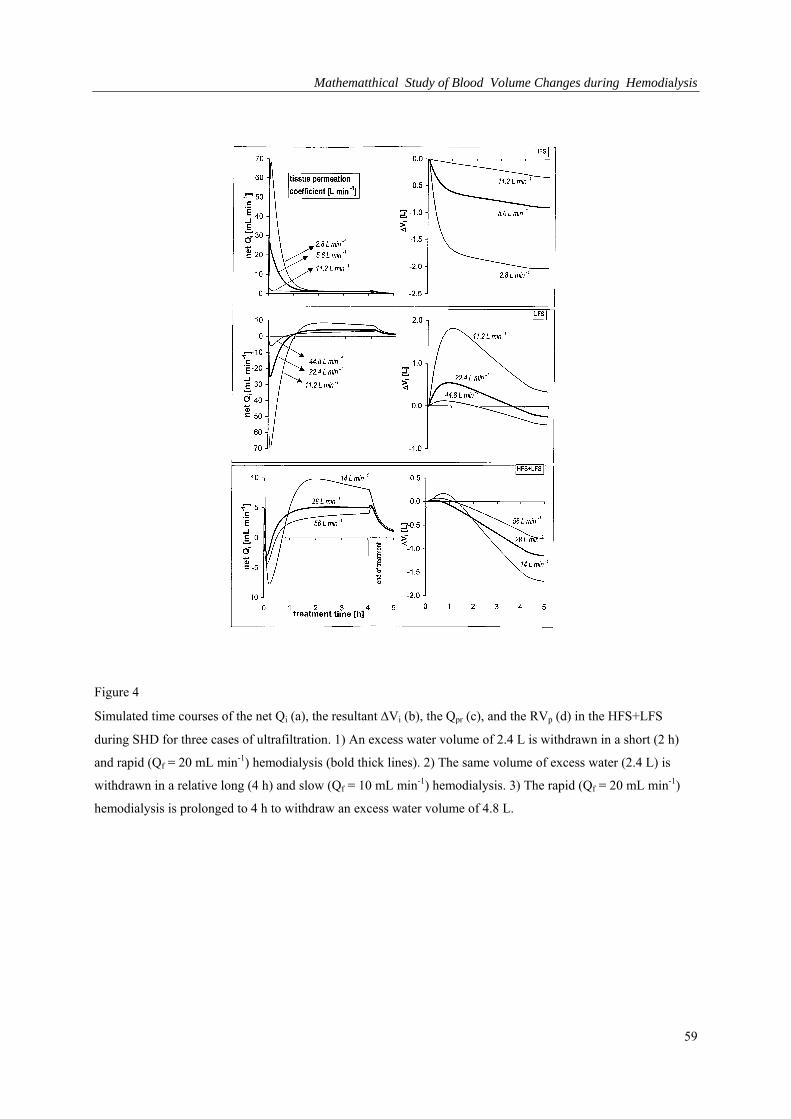
Mathematthical Study of Blood Volume Changes during Hemodialysis
Figure 4
Simulated time courses of the net Qi (a), the resultant Vi (b), the Qpr (c), and the RVp (d) in the HFS+LFS
during SHD for three cases of ultrafiltration. 1) An excess water volume of 2.4 L is withdrawn in a short (2 h)
and rapid (Qf = 20 mL min-1) hemodialysis (bold thick lines). 2) The same volume of excess water (2.4 L) is
withdrawn in a relative long (4 h) and slow (Qf = 10 mL min-1) hemodialysis. 3) The rapid (Qf = 20 mL min-1)
hemodialysis is prolonged to 4 h to withdraw an excess water volume of 4.8 L.
59
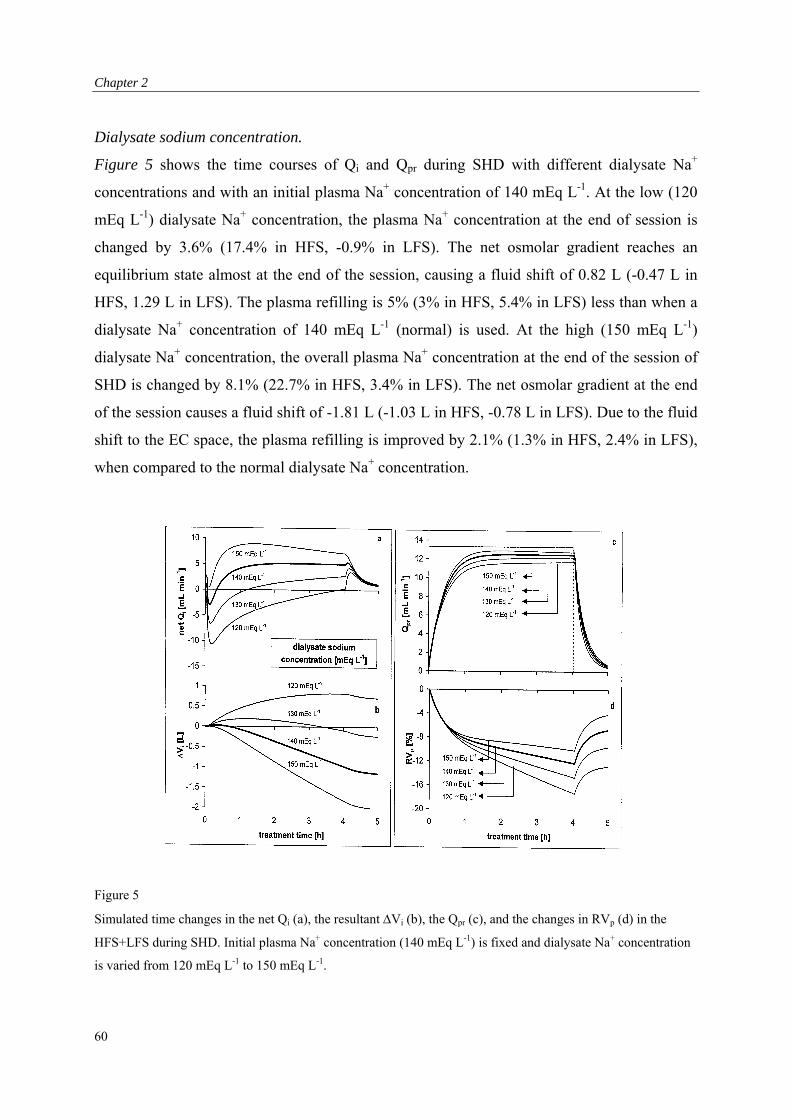
Chapter 2
Dialysate sodium concentration.
Figure 5 shows the time courses of Qi and Qpr during SHD with different dialysate Na+
concentrations and with an initial plasma Na+ concentration of 140 mEq L-1. At the low (120
mEq L-1) dialysate Na+ concentration, the plasma Na+ concentration at the end of session is
changed by 3.6% (17.4% in HFS, -0.9% in LFS). The net osmolar gradient reaches an
equilibrium state almost at the end of the session, causing a fluid shift of 0.82 L (-0.47 L in
HFS, 1.29 L in LFS). The plasma refilling is 5% (3% in HFS, 5.4% in LFS) less than when a
dialysate Na+ concentration of 140 mEq L-1 (normal) is used. At the high (150 mEq L-1)
dialysate Na+ concentration, the overall plasma Na+ concentration at the end of the session of
SHD is changed by 8.1% (22.7% in HFS, 3.4% in LFS). The net osmolar gradient at the end
of the session causes a fluid shift of -1.81 L (-1.03 L in HFS, -0.78 L in LFS). Due to the fluid
shift to the EC space, the plasma refilling is improved by 2.1% (1.3% in HFS, 2.4% in LFS),
when compared to the normal dialysate Na+ concentration.
Figure 5
Simulated time changes in the net Qi (a), the resultant Vi (b), the Qpr (c), and the changes in RVp (d) in the
HFS+LFS during SHD. Initial plasma Na+ concentration (140 mEq L-1) is fixed and dialysate Na+ concentration
is varied from 120 mEq L-1 to 150 mEq L-1.
60
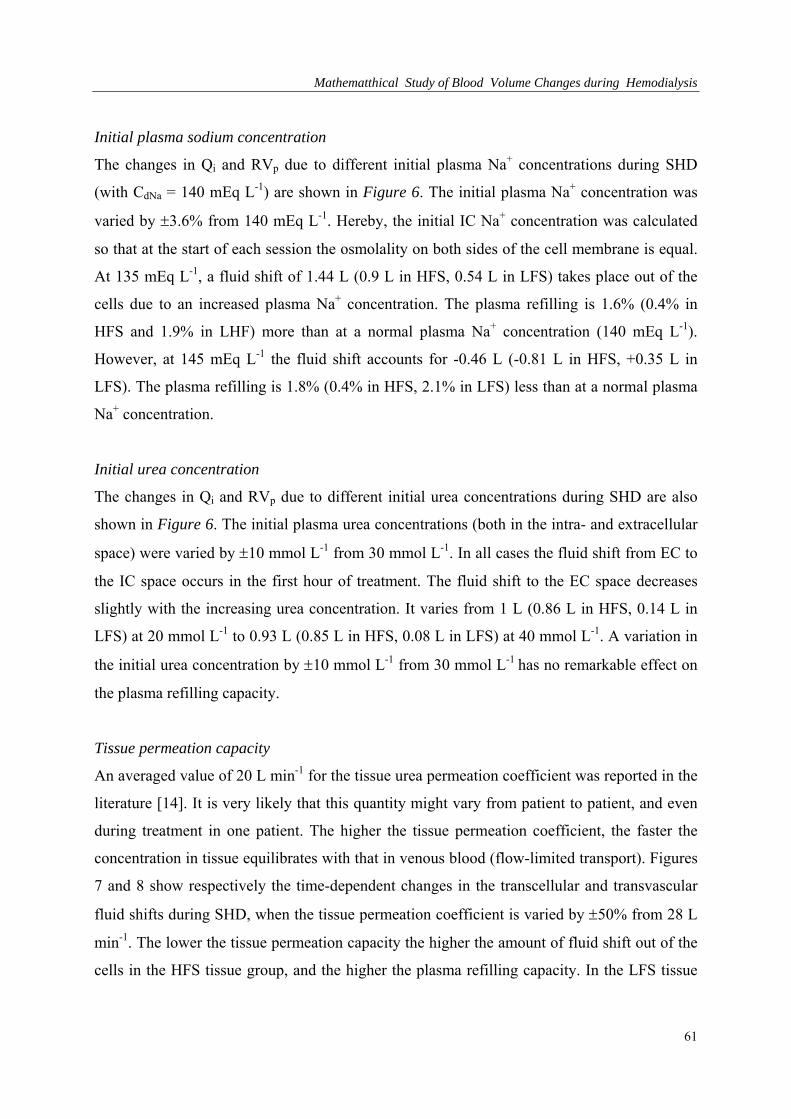
Mathematthical Study of Blood Volume Changes during Hemodialysis
Initial plasma sodium concentration
The changes in Qi and RVp due to different initial plasma Na+ concentrations during SHD
(with CdNa = 140 mEq L-1) are shown in Figure 6. The initial plasma Na+ concentration was
varied by 3.6% from 140 mEq L-1. Hereby, the initial IC Na+ concentration was calculated
so that at the start of each session the osmolality on both sides of the cell membrane is equal.
At 135 mEq L-1, a fluid shift of 1.44 L (0.9 L in HFS, 0.54 L in LFS) takes place out of the
cells due to an increased plasma Na+ concentration. The plasma refilling is 1.6% (0.4% in
HFS and 1.9% in LHF) more than at a normal plasma Na+ concentration (140 mEq L-1).
However, at 145 mEq L-1 the fluid shift accounts for -0.46 L (-0.81 L in HFS, +0.35 L in
LFS). The plasma refilling is 1.8% (0.4% in HFS, 2.1% in LFS) less than at a normal plasma
Na+ concentration.
Initial urea concentration
The changes in Qi and RVp due to different initial urea concentrations during SHD are also
shown in Figure 6. The initial plasma urea concentrations (both in the intra- and extracellular
space) were varied by 10 mmol L-1 from 30 mmol L-1. In all cases the fluid shift from EC to
the IC space occurs in the first hour of treatment. The fluid shift to the EC space decreases
slightly with the increasing urea concentration. It varies from 1 L (0.86 L in HFS, 0.14 L in
LFS) at 20 mmol L-1 to 0.93 L (0.85 L in HFS, 0.08 L in LFS) at 40 mmol L-1. A variation in
the initial urea concentration by 10 mmol L-1 from 30 mmol L-1 has no remarkable effect on
the plasma refilling capacity.
Tissue permeation capacity
An averaged value of 20 L min-1 for the tissue urea permeation coefficient was reported in the
literature [14]. It is very likely that this quantity might vary from patient to patient, and even
during treatment in one patient. The higher the tissue permeation coefficient, the faster the
concentration in tissue equilibrates with that in venous blood (flow-limited transport). Figures
7 and 8 show respectively the time-dependent changes in the transcellular and transvascular
fluid shifts during SHD, when the tissue permeation coefficient is varied by 50% from 28 L
min-1. The lower the tissue permeation capacity the higher the amount of fluid shift out of the
cells in the HFS tissue group, and the higher the plasma refilling capacity. In the LFS tissue
61
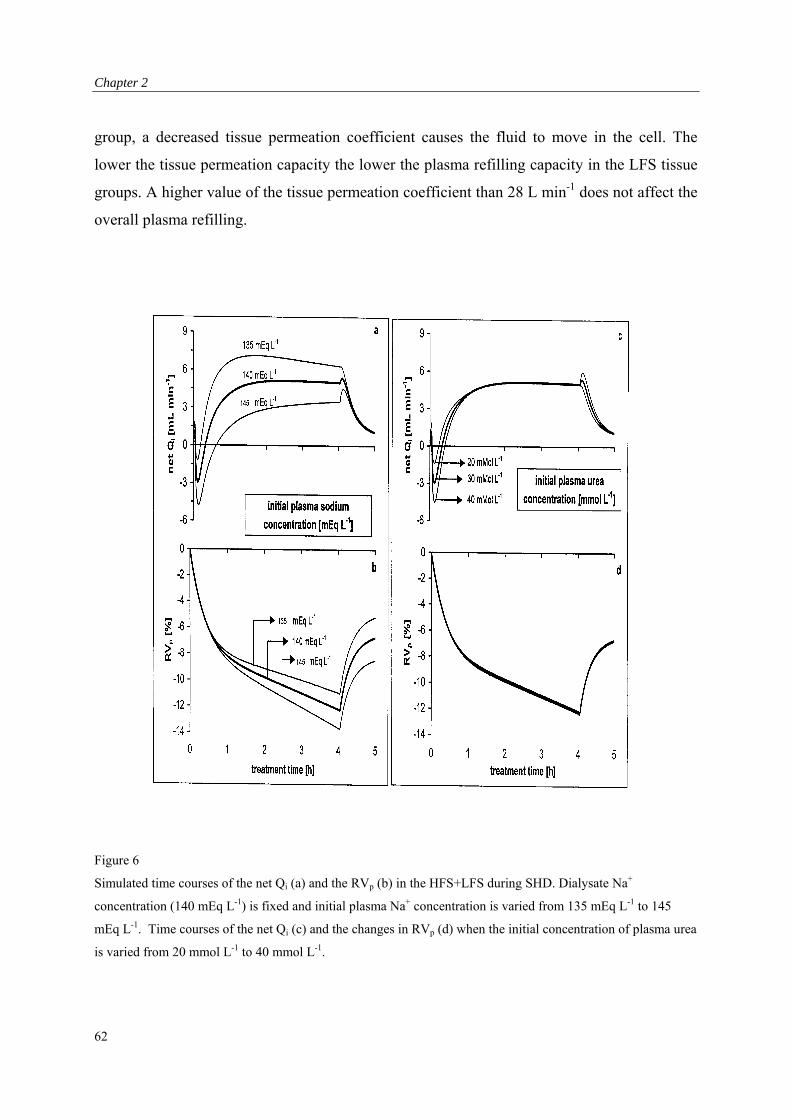
Chapter 2
group, a decreased tissue permeation coefficient causes the fluid to move in the cell. The
lower the tissue permeation capacity the lower the plasma refilling capacity in the LFS tissue
groups. A higher value of the tissue permeation coefficient than 28 L min-1 does not affect the
overall plasma refilling.
Figure 6
Simulated time courses of the net Qi (a) and the RVp (b) in the HFS+LFS during SHD. Dialysate Na+
concentration (140 mEq L-1) is fixed and initial plasma Na+ concentration is varied from 135 mEq L-1 to 145
mEq L-1. Time courses of the net Qi (c) and the changes in RVp (d) when the initial concentration of plasma urea
is varied from 20 mmol L-1 to 40 mmol L-1.
62
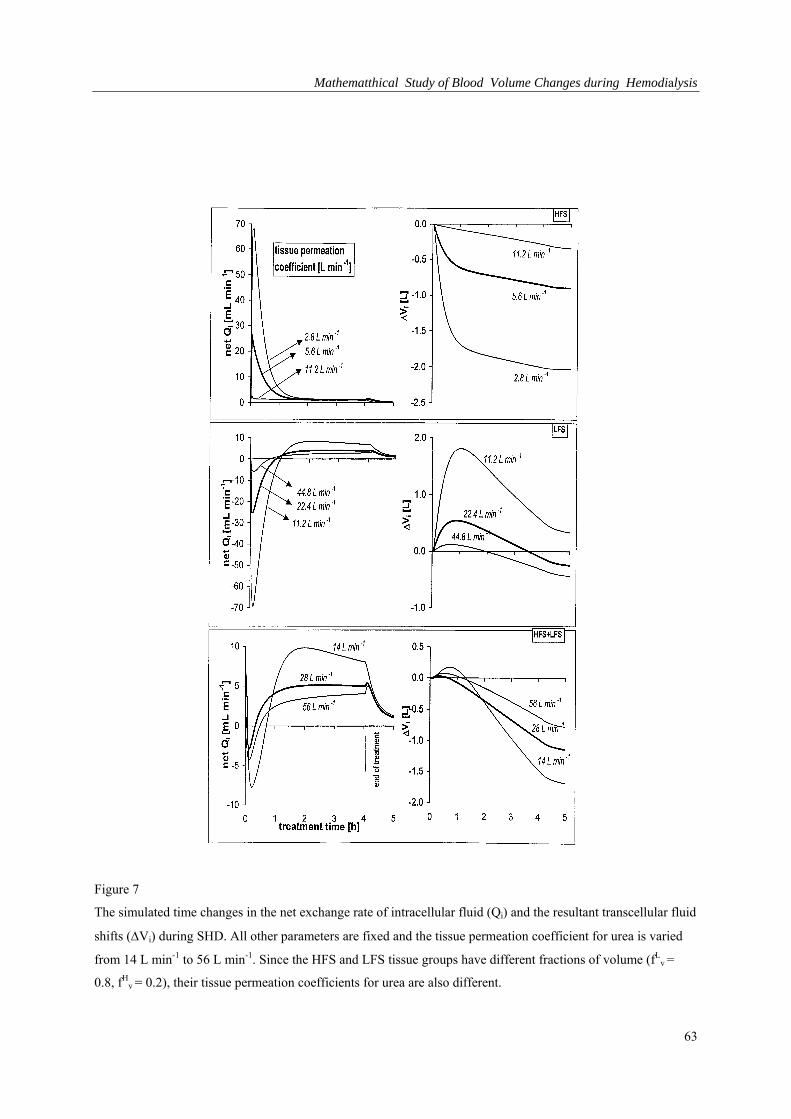
Mathematthical Study of Blood Volume Changes during Hemodialysis
Figure 7
The simulated time changes in the net exchange rate of intracellular fluid (Qi) and the resultant transcellular fluid
shifts (Vi) during SHD. All other parameters are fixed and the tissue permeation coefficient for urea is varied
from 14 L min-1 to 56 L min-1. Since the HFS and LFS tissue groups have different fractions of volume (fLv =
0.8, fHv = 0.2), their tissue permeation coefficients for urea are also different.
63
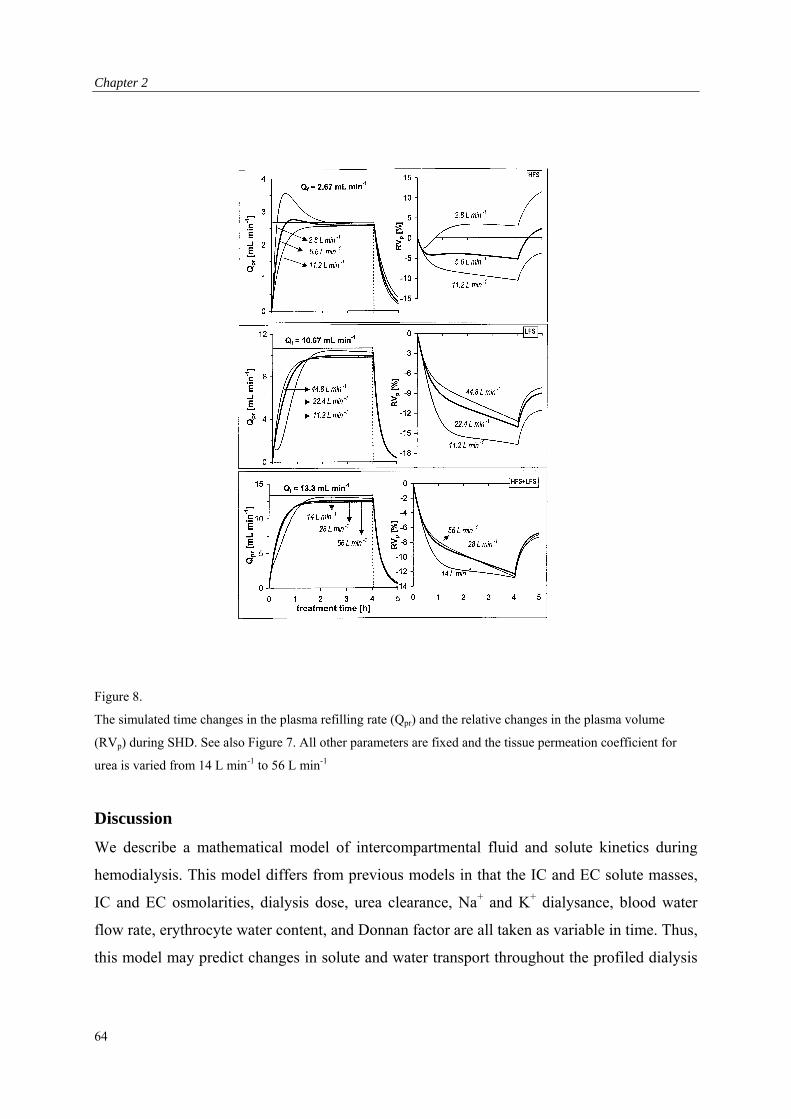
Chapter 2
Figure 8.
The simulated time changes in the plasma refilling rate (Qpr) and the relative changes in the plasma volume
(RVp) during SHD. See also Figure 7. All other parameters are fixed and the tissue permeation coefficient for
urea is varied from 14 L min-1 to 56 L min-1
Discussion
We describe a mathematical model of intercompartmental fluid and solute kinetics during
hemodialysis. This model differs from previous models in that the IC and EC solute masses,
IC and EC osmolarities, dialysis dose, urea clearance, Na+ and K+ dialysance, blood water
flow rate, erythrocyte water content, and Donnan factor are all taken as variable in time. Thus,
this model may predict changes in solute and water transport throughout the profiled dialysis
64
Mathematthical Study of Blood Volume Changes during Hemodialysis
session. Further, a regional blood flow model is combined with the classical two-compartment
model. Correction factors for the dialyzer performance due to cardiopulmonary and access
recirculation, are included. Using a sensitivity analysis we assessed the relative importance of
ultrafiltration flow rate and volume, dialysate Na+ concentration, initial plasma Na+
concentration and initial urea concentrations, and the tissue permeation capacity on dialysis
induced intercompartmental fluid shifts in both HFS and LFS tissue groups.
The greater the amount of UF the greater the amount of fluid shift to the EC space. This fluid
shift to the EC space is not sufficient to refill the plasma volume loss by ultrafiltration. In
addition, the higher the rates of ultrafiltration flow, the higher the decline of plasma volume.
High dialysate Na+ concentration (150 mEq L-1) causes the cellular fluid (1.8 L) to move to
the EC space, enhances the plasma refilling (2.2%) and, therefore, helps the plasma volume
preservation during standard hemodialysis when performed with a normal (140 mEq L-1)
dialysate Na+ concentration. A variation in the initial plasma Na+ concentration by 5 mEq L-
1 from normal plasma Na+ concentration causes a variation of 0.45 L in the fluid shift. A
variation in the initial plasma urea concentration by 10 mmol L-1 from 30 mmol L-1 causes a
variation of 0.03 L in the fluid shift, and it has no remarkable effect on the refilling rate
capacity. Low tissue permeation in the LFS tissue group leads to an increase of the fluid shift
in the cells, especially in the early hour of treatment, causing a delay in the plasma refilling.
In the HFS tissue group, this has a contrary effect on the plasma refilling due to the increased
fluid shift from intra- to the extracellular space.
Other factors influencing the transcellular and transvascular fluid shifts, such as solute and
fluid distributions, transvascular protein transport, volume compliance, the solute and fluid
permeation coefficients, which we cannot measure directly, are given at the start of treatment
as parameters. Some factors such as flow rates, dialysate Na+ and K+ concentrations, length of
dialysis session, and urea clearance are either given at the start of treatment or can be
measured directly. However, some other parameters such as the permeability coefficients,
compliance and initial ratios of different volume compartments were taken from literature, are
likely to change during dialysis therapy, and can only be estimated in vivo. However,
differences between this mathematical model and the in vivo situation enable us to compare
the changes in the fluid and electrolyte fluxes that are predicted, to those observed during
actual treatment. This is bound to improve our understanding of such variables, which is
65
Chapter 2
especially relevant, as we must assume that the dialysis treatment itself induces changes in
these variables.
We conclude that the magnitudes and direction of fluid shifts induced by hemodialysis
treatment are not equal in tissue groups with different fractions of volumes and blood
perfusion. The UF volume and flow rate, and the size of Na+ gradient between the dialysate
and blood (EC) side of the dialyzer membrane are the most important factors influencing the
magnitude (up to 1.8 L) and direction of transcellular fluid shifts. High dialysate Na+
concentration helps plasma refilling (by 2.5%). However, a high dialysate Na+ concentration
is associated with a high EC Na+ rebound, which in turn may lead to interdialytic water intake
resulting from thirst and may cause increased weight gain and hypertension.
66
Mathematthical Study of Blood Volume Changes during Hemodialysis
References
1. Daugirdas JT: Dialysis hypotension: a hemodynamic analysis. Kidney Int 1991;39:233-46.
2. Sherman RA: The pathophysiological basis for hemodialysis-related hypotension. Seminars in
dialysis 1988;1:136-42.
3. de Vries PM, Kouw PM, Olthof CG, Solf A, Scheunemann B, Oe LP, Quellhorst E, Donker AJ:
The influence of dialysate sodium and variable ultrafiltration on fluid balance during
hemodialysis. ASAIO Trans 1990;36:821-824.
4. Henrich WL, Woodard TD, Blachley JD, Gomez-Sanchez C, Pettinger W, Cronin RE: Role of
osmolarity in blood pressure stability after dialysis and ultrafiltration. Kidney Int 1980;18:480-
488.
5. Rodriguez M, Pederson JA, Llach F: Effect of dialysis and ultrafiltration on osmolarity, colloid
osmotic pressure, and vascular refilling rate. Kidney Int 1985;28:808-813.
6. Kimura G, Van Stone JC, Bauer JH, Keshaviah PR: A simulation study on transcellular fluid
shifts induced by hemodialysis. Kidney Int 1983;24:542-548.
7. Sargent JA, Gotch FH: Principles and biophysics of dialysis, in Maher JF (ed), Replacement of
Renal Function by Dialysis, Dordrecht, Boston, Lancaster, Kluwer Academic Publishers, 1989,
87-143.
8. Pastan S, Colton C: Transcellular urea gradients cause minimal depletion of extracellular
volume during hemodialysis. ASAIO Trans 1989;35:247-250.
9. Kimura G, Van Stone JC, Bauer JH: Model prediction of plasma volume change induced by
hemodialysis. J Lab Clin Med 1984;104:932-938.
10. Scharfetter H, Wirnsberger G, Hutten H, Holzer H: Development and critical evaluation of an
improved comprehensive multicompartment model for the exchange processes during
hemodialysis. Biomed Tech (Berl) 1995;40:54-63.
11. Ursino M, Innocenti M: Modeling arterial hypotension during hemodialysis. Artif Organs
1997;21: 873-890.
12. Leunissen KM, Noordzij TC, van Hooff JP: Pathophysiologic aspects of plasma volume
preservation during dialysis and ultrafiltration. Contrib Nephrol 1990;78:201-211.
13. van Kuijk WH, Wirtz JJ, Grave W, de Heer F, Menheere PP, van Hooff JK. Leunissen KML:
Vascular reactivity during combined ultrafiltration-hemodialysis: influence of dialysate sodium.
Nephrol Dial Transplant 1996;11:323-328.
14. Schneditz D, Daugirdas JT: Formal analytical solution to a regional blood flow and diffusion
based urea kinetic model. ASAIO J 1994;40: M667-73.
67
Chapter 2
15. Schneditz D, Van Stone JC, Daugirdas JT: A regional blood circulation alternative to in-series
two compartment urea kinetic modeling. ASAIO J 1993;39:M573-577.
16. Guyton AC (ed): Textbook of Medical Physiology. Philadelphia, W.B. Saunders Co, 1991.
17. Finberg L, Kravath RE, Hellerstein S (ed): Water and electrolytes in pediatrics, physiology,
pathology and treatment. Philadelphia, W.B. Saunders Co,1993.
18. Isogai Y, Nose H, Miki K, and Morimoto T: Dynamics of fluid movement between
intravascular and interstitial spaces. J. Theor. Biol. 1983;100:305-317.
19. Landis EM, Pappenheimer JR: Exchange of substances through capillary wall, in Hamilton WF,
Dow P (ed), Handbook of Physiology, Washington, D.C.,1963:962-1034.
20. Michaels AS: Operating parameters and performance criteria for hemodialyzers and other
membrane-separation devices. Trans Am Soc Artif Intern Organs 1966;12:387-392.
21. Vincent HH, Vos MC, Akcahuseyin E, Goessens WH, van Duyl WA, Schalekamp MA: Drug
clearance by continuous hemodiafiltration. Analysis of sieving coefficients and mass transfer
coefficients of diffusion. Blood Purif 1993;11:99-107.
22. Henderson LW, Colton CK, Ford CA: Kinetics of hemodiafiltration. II. Clinical characterization
of a new blood cleansing modality. J Lab Clin Med 1975;85:372-391.
23. Shaldon S, Baldamus CA, Beau MC, Koch KM, Mion CM, Lysaght MJ: Acute and chronic
studies of the relationship between sodium flux in hemodialysis and hemofiltration. Trans Am
Soc Artif Intern Organs 1983;29:641-644.
24. Depner TA: Quantifying hemodialysis. Am J Nephrol 1996;16:17-28.
68
Mathematthical Study of Blood Volume Changes during Hemodialysis
Appendix: list of symbols and units
Symbol Explanation [units]
<ga> a factor to calculate protocrit from plasma protein concentration [Lg-1]
j <gg> solute cellular sieving coefficient
Osm magnitude of the net transcellular osmolar driving force [mosmol L-1]
Osmn magnitude of osmolar gradient due to non-urea [mosmol L-1]
Osmu magnitude of osmolar gradient due to urea [mosmol L-1]
t a discrete time interval [min(utes)]
Vi magnitude of transcellular fluid shift [L(iters)]
<gk> conversion factor from molar to equivalent osmolar concentration
is, p <gP> oncotic pressure in intersitial and plasma compartment [mmHg]
u <gs> transcellular urea reflection coefficient
a, v, is compliance of arterial, venous plasma and interstitial space [% mmHg-1]
Cd, j inlet dialysate solute concentration [mEq L-1]
Ce, j, Ci, j, Cp, j EC, IC and plasma solute concentration [mEq L-1, mmol L-1]
Ca, j, Cv, j arterial and venous concentration of solute j [mEq L-1, mmol L-1]
Cis, Cp interstitial and plasma protein concentration [g L-1]
CLj solute clearance or dialysance by diffusion [L min-1 or Lh-1]
CO cardiac output [L min-1]
Dd dialysis dose
Dj whole body cellular diffusion coefficient of solute [L min-1]
fj volume distribution of solute in red blood cell volume
fvt volume fraction of tissue group t
fqt blood perfusion fraction of tissue group t
Fw correction factor for the free water fraction of EC space
Gj generation or intake rate [mEq min-1, mmol min-1]
Ht hematocrit
Jdial,j, Jdif,j total and diffusive transport rate through dialyzer [mEq min-1, mmol min-1]
Ji, j, Je, j mass exchange rate of IC and EC solute [mEq min-1, mmol min-1]
Jav,j mass transfer rate from tissue to venous blood [mEq min-1, mmol min-1]
kc transcellular whole body water exchange coefficient [L min-1 mmHg-1]
kCP correction factor for cardiopulmonary recirculation
69
Chapter 2
70
kAC correction factor for arterial access blood recirculation
Lf, Lr arterial and venous capillary hydraulic permeability [L mmHg-1 min-1]
mt concentration equilibration coefficient in tissue group t
Mi, j, Me, j IC and EC solute mass [mEq, mmol]
MWj molecular weight of solute j [Dalton]
Osmp, n plasma non-urea osmolality [mosmol L-1]
Pa, Pv, Pis hydraulic pressure in arterial, venous plasma, interstitium [mmHg]
PSj whole body tissue permeation coefficient for solute j [L min-1]
Qa systemic arterial blood flow rate [L min-1]
QaAC, Qv
AC flow rate of blood entering and leaving the dialyzer [L min-1]
Qat, Qv
t flow rate of blood entering and leaving the tissue group t [L min-1]
Qbi, Qwi, j flow rate of blood and blood water that enters the dialyzer [L min-1]
Qdi, Qf dialysate inlet and ultrafiltration flow rates [L min-1]
Qwf, Qwr vascular water filtration and reabsorption rate [L min-1]
Qi, Qpr, Qrc exchange rate of IC, transvascular and red blood cell volume [L min-1]
QRAC access recirculation blood (water) flow rate [L min-1]
R gas constant [L mmHg K-1 mmol-1]
RcD, RD,j capillary wall and dialyzer membrane Gibbs-Donnan ratio
RVp relative change in plasma volume with respect to its initial value [%]
SKj dialyzer membrane solute permeation coefficient [L min-1]
T, Td temperature [K(elvin)], duration of treatment session [min, hour]
Ve, Vi, Vis volume of EC, IC and interstitial compartment [L]
Vp, Vb plasma, blood volume [L]
Vuf excess water (weight gain) or ultrafiltration volume [L]
Vrc,Vpr volume of red blood cells and plasma refilling [L]
Zj solute distribution coefficient between EC and IC space at equilibrium
Variability of Relative Blood Volume during Hemodialysis
Chapter 3: Variability of Relative Blood Volume during Hemodialysis
71
Chapter 3
Abstract
A decrease in blood volume is thought to play a role in dialysis-related hypotension. Changes
in relative blood volume (RBV) can be assessed by means of continuous haematocrit
measurement. We studied the variability of RBV changes, and the relation between RBV and
ultrafiltration volume (UV), blood pressure, heart rate, and inferior caval vein (ICV) diameter.
In 10 patients on chronic hemodialysis, RBV measurement was performed during a total of
one hundred 4-h hemodialysis sessions. Blood pressure and heart rate were measured at 5-min
intervals. ICV diameter was assessed at the start and at the end of dialysis using
ultrasonography.
The changes in RBV showed considerable inter-individual variability. The average change in
RBV ranged from -0.5 to -8.2% at 60 min and from -3.7 to -14.5% at 240 min (coefficient of
variation (CV) 0.66 and 0.35 respectively). Intra-individual variability was also high (CV at
60 min 0.93; CV at 240 min 0.33). Inter-individual as well as intra-individual variability
showed only minor improvement when RBV was corrected for UV. We found a significant
correlation between RBV and UV at 60 (r= -0.69; P<0.001) and at 240 min (r= -0.63;
P<0.001). There was a significant correlation between RBV and heart rate (r= -0.39;
P<0.001), but not between RBV or UV and blood pressure. The level of RBV reduction at
which hypotension occurred was also highly variable. ICV diameter decreased from 10.3±1.7
mm/m2 to 7.3±1.5 mm/m2. There was only a slight, although significant, correlation between
ICV diameter and RBV (r= -0.23; P<0.05). The change in ICV-diameter showed a wide
variation.
RBV changes during hemodialysis showed a considerable intra- and inter-individual
variability that could not be explained by differences in UV. No correlation was observed
between UV or changes in RBV and either blood pressure or the incidence of hypotension.
Heart rate, however, was significantly correlated with RBV. Moreover, IVC diameter was
only poorly correlated with RBV, suggesting a redistribution of blood towards the central
venous compartment. These data indicate that RBV monitoring is of limited use in the
prevention of dialysis-related hypotension, and that the critical level of reduction in RBV at
which hypotension occurs depends on cardiovascular defense mechanisms such as
sympathetic drive.
72
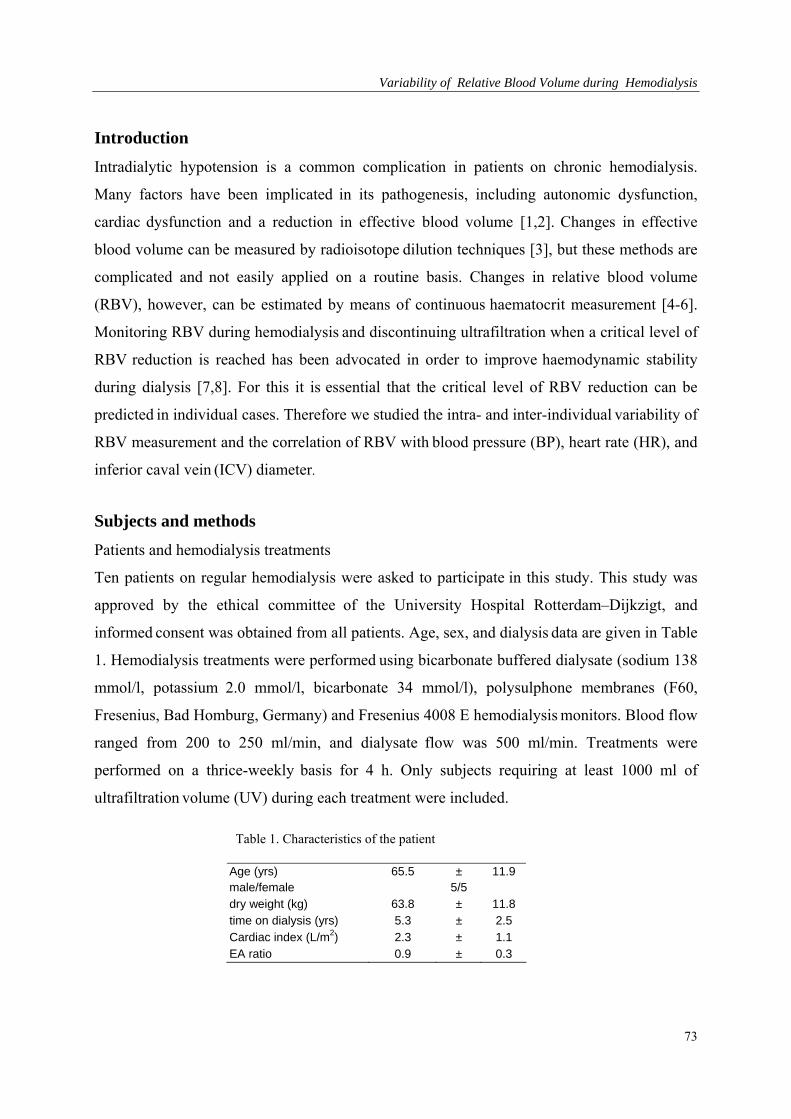
Variability of Relative Blood Volume during Hemodialysis
Introduction
Intradialytic hypotension is a common complication in patients on chronic hemodialysis.
Many factors have been implicated in its pathogenesis, including autonomic dysfunction,
cardiac dysfunction and a reduction in effective blood volume [1,2]. Changes in effective
blood volume can be measured by radioisotope dilution techniques [3], but these methods are
complicated and not easily applied on a routine basis. Changes in relative blood volume
(RBV), however, can be estimated by means of continuous haematocrit measurement [4-6].
Monitoring RBV during hemodialysis and discontinuing ultrafiltration when a critical level of
RBV reduction is reached has been advocated in order to improve haemodynamic stability
during dialysis [7,8]. For this it is essential that the critical level of RBV reduction can be
predicted in individual cases. Therefore we studied the intra- and inter-individual variability of
RBV measurement and the correlation of RBV with blood pressure (BP), heart rate (HR), and
inferior caval vein (ICV) diameter.
Subjects and methods
Patients and hemodialysis treatments
Ten patients on regular hemodialysis were asked to participate in this study. This study was
approved by the ethical committee of the University Hospital Rotterdam–Dijkzigt, and
informed consent was obtained from all patients. Age, sex, and dialysis data are given in Table
1. Hemodialysis treatments were performed using bicarbonate buffered dialysate (sodium 138
mmol/l, potassium 2.0 mmol/l, bicarbonate 34 mmol/l), polysulphone membranes (F60,
Fresenius, Bad Homburg, Germany) and Fresenius 4008 E hemodialysis monitors. Blood flow
ranged from 200 to 250 ml/min, and dialysate flow was 500 ml/min. Treatments were
performed on a thrice-weekly basis for 4 h. Only subjects requiring at least 1000 ml of
ultrafiltration volume (UV) during each treatment were included.
Table 1. Characteristics of the patient
Age (yrs) 65.5 ± 11.9 male/female 5/5 dry weight (kg) 63.8 ± 11.8 time on dialysis (yrs) 5.3 ± 2.5 Cardiac index (L/m2) 2.3 ± 1.1 EA ratio 0.9 ± 0.3
73
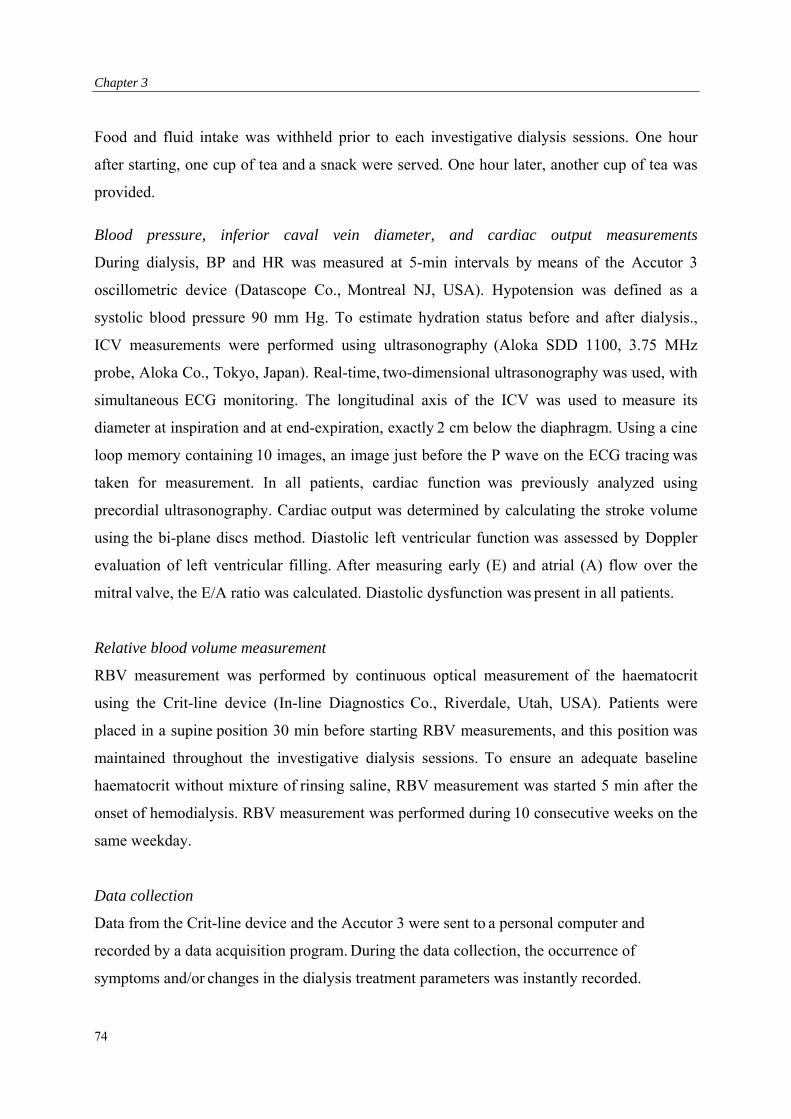
Chapter 3
Food and fluid intake was withheld prior to each investigative dialysis sessions. One hour
after starting, one cup of tea and a snack were served. One hour later, another cup of tea was
provided.
Blood pressure, inferior caval vein diameter, and cardiac output measurements
During dialysis, BP and HR was measured at 5-min intervals by means of the Accutor 3
oscillometric device (Datascope Co., Montreal NJ, USA). Hypotension was defined as a
systolic blood pressure 90 mm Hg. To estimate hydration status before and after dialysis.,
ICV measurements were performed using ultrasonography (Aloka SDD 1100, 3.75 MHz
probe, Aloka Co., Tokyo, Japan). Real-time, two-dimensional ultrasonography was used, with
simultaneous ECG monitoring. The longitudinal axis of the ICV was used to measure its
diameter at inspiration and at end-expiration, exactly 2 cm below the diaphragm. Using a cine
loop memory containing 10 images, an image just before the P wave on the ECG tracing was
taken for measurement. In all patients, cardiac function was previously analyzed using
precordial ultrasonography. Cardiac output was determined by calculating the stroke volume
using the bi-plane discs method. Diastolic left ventricular function was assessed by Doppler
evaluation of left ventricular filling. After measuring early (E) and atrial (A) flow over the
mitral valve, the E/A ratio was calculated. Diastolic dysfunction was present in all patients.
Relative blood volume measurement
RBV measurement was performed by continuous optical measurement of the haematocrit
using the Crit-line device (In-line Diagnostics Co., Riverdale, Utah, USA). Patients were
placed in a supine position 30 min before starting RBV measurements, and this position was
maintained throughout the investigative dialysis sessions. To ensure an adequate baseline
haematocrit without mixture of rinsing saline, RBV measurement was started 5 min after the
onset of hemodialysis. RBV measurement was performed during 10 consecutive weeks on the
same weekday.
Data collection
Data from the Crit-line device and the Accutor 3 were sent to a personal computer and
recorded by a data acquisition program. During the data collection, the occurrence of
symptoms and/or changes in the dialysis treatment parameters was instantly recorded.
74
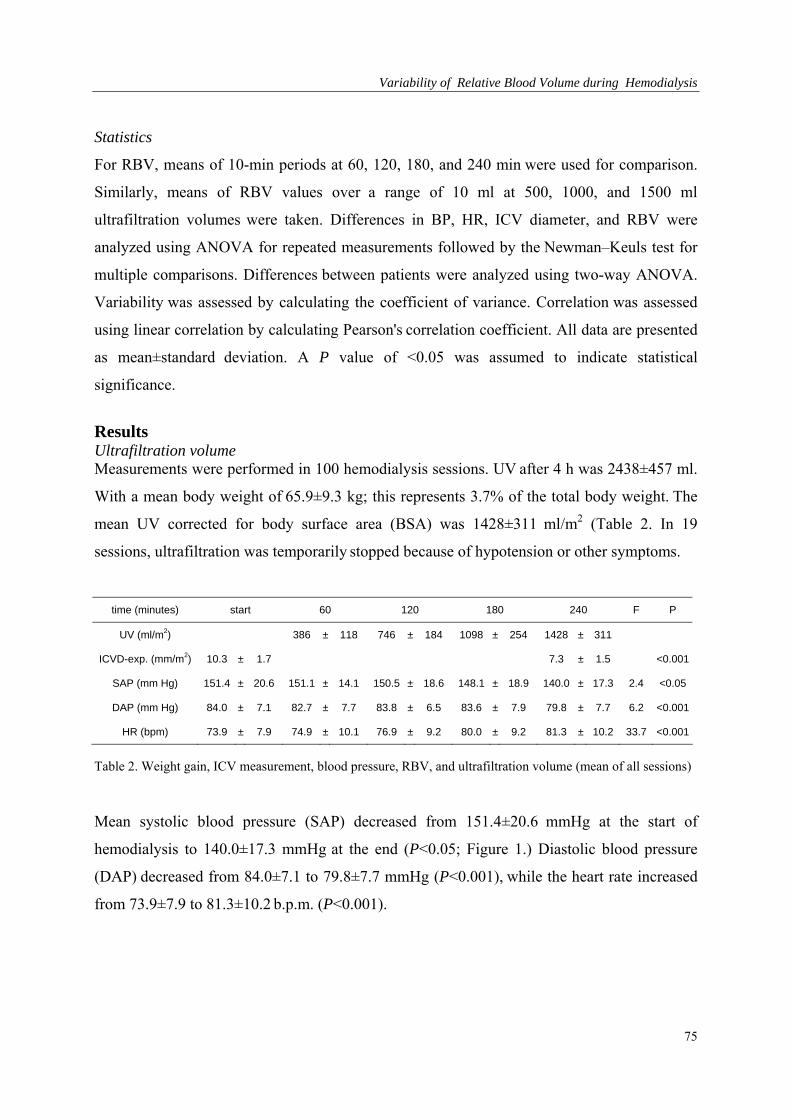
Variability of Relative Blood Volume during Hemodialysis
Statistics
For RBV, means of 10-min periods at 60, 120, 180, and 240 min were used for comparison.
Similarly, means of RBV values over a range of 10 ml at 500, 1000, and 1500 ml
ultrafiltration volumes were taken. Differences in BP, HR, ICV diameter, and RBV were
analyzed using ANOVA for repeated measurements followed by the Newman–Keuls test for
multiple comparisons. Differences between patients were analyzed using two-way ANOVA.
Variability was assessed by calculating the coefficient of variance. Correlation was assessed
using linear correlation by calculating Pearson's correlation coefficient. All data are presented
as mean±standard deviation. A P value of <0.05 was assumed to indicate statistical
significance.
Results Ultrafiltration volume Measurements were performed in 100 hemodialysis sessions. UV after 4 h was 2438±457 ml.
With a mean body weight of 65.9±9.3 kg; this represents 3.7% of the total body weight. The
mean UV corrected for body surface area (BSA) was 1428±311 ml/m2 (Table 2. In 19
sessions, ultrafiltration was temporarily stopped because of hypotension or other symptoms.
time (minutes) start 60 120 180 240 F P
UV (ml/m2) 386 ± 118 746 ± 184 1098 ± 254 1428 ± 311
ICVD-exp. (mm/m2) 10.3 ± 1.7 7.3 ± 1.5 <0.001
SAP (mm Hg) 151.4 ± 20.6 151.1 ± 14.1 150.5 ± 18.6 148.1 ± 18.9 140.0 ± 17.3 2.4 <0.05
DAP (mm Hg) 84.0 ± 7.1 82.7 ± 7.7 83.8 ± 6.5 83.6 ± 7.9 79.8 ± 7.7 6.2 <0.001
HR (bpm) 73.9 ± 7.9 74.9 ± 10.1 76.9 ± 9.2 80.0 ± 9.2 81.3 ± 10.2 33.7 <0.001
Table 2. Weight gain, ICV measurement, blood pressure, RBV, and ultrafiltration volume (mean of all sessions)
Mean systolic blood pressure (SAP) decreased from 151.4±20.6 mmHg at the start of
hemodialysis to 140.0±17.3 mmHg at the end (P<0.05; Figure 1.) Diastolic blood pressure
(DAP) decreased from 84.0±7.1 to 79.8±7.7 mmHg (P<0.001), while the heart rate increased
from 73.9±7.9 to 81.3±10.2 b.p.m. (P<0.001).
75
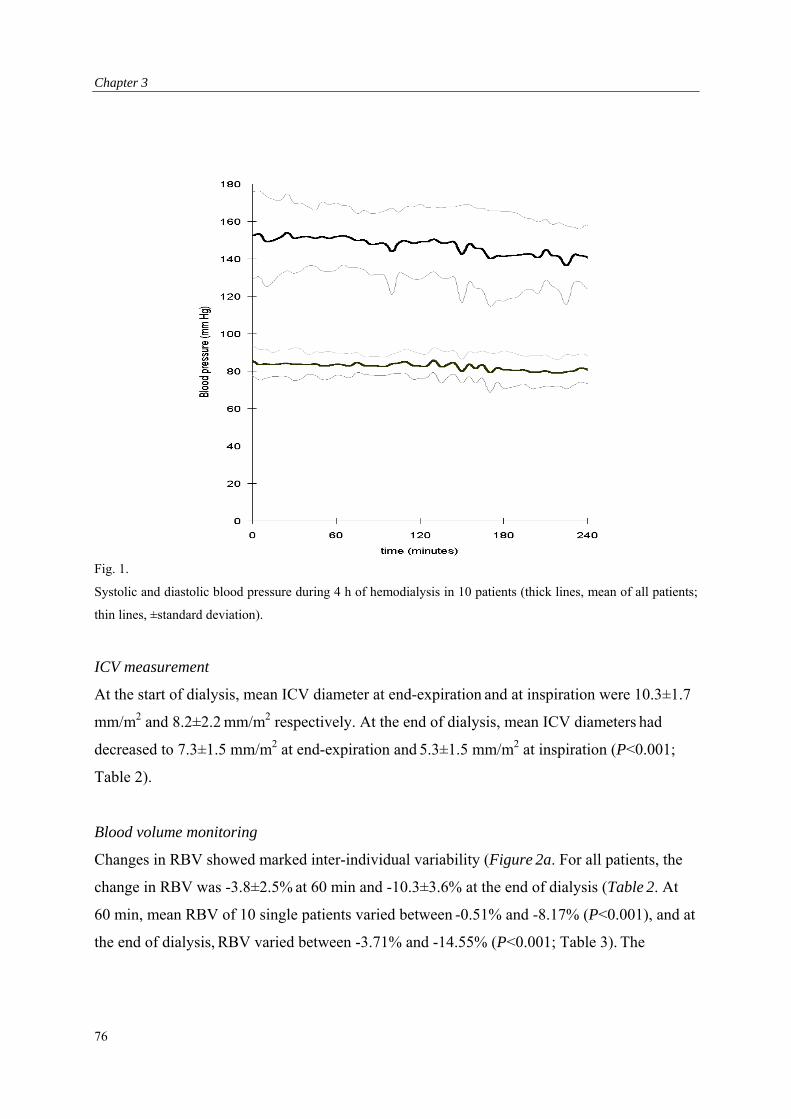
Chapter 3
Fig. 1.
Systolic and diastolic blood pressure during 4 h of hemodialysis in 10 patients (thick lines, mean of all patients;
thin lines, ±standard deviation).
ICV measurement
At the start of dialysis, mean ICV diameter at end-expiration and at inspiration were 10.3±1.7
mm/m2 and 8.2±2.2 mm/m2 respectively. At the end of dialysis, mean ICV diameters had
decreased to 7.3±1.5 mm/m2 at end-expiration and 5.3±1.5 mm/m2 at inspiration (P<0.001;
Table 2).
Blood volume monitoring
Changes in RBV showed marked inter-individual variability (Figure 2a. For all patients, the
change in RBV was -3.8±2.5% at 60 min and -10.3±3.6% at the end of dialysis (Table 2. At
60 min, mean RBV of 10 single patients varied between -0.51% and -8.17% (P<0.001), and at
the end of dialysis, RBV varied between -3.71% and -14.55% (P<0.001; Table 3). The
76
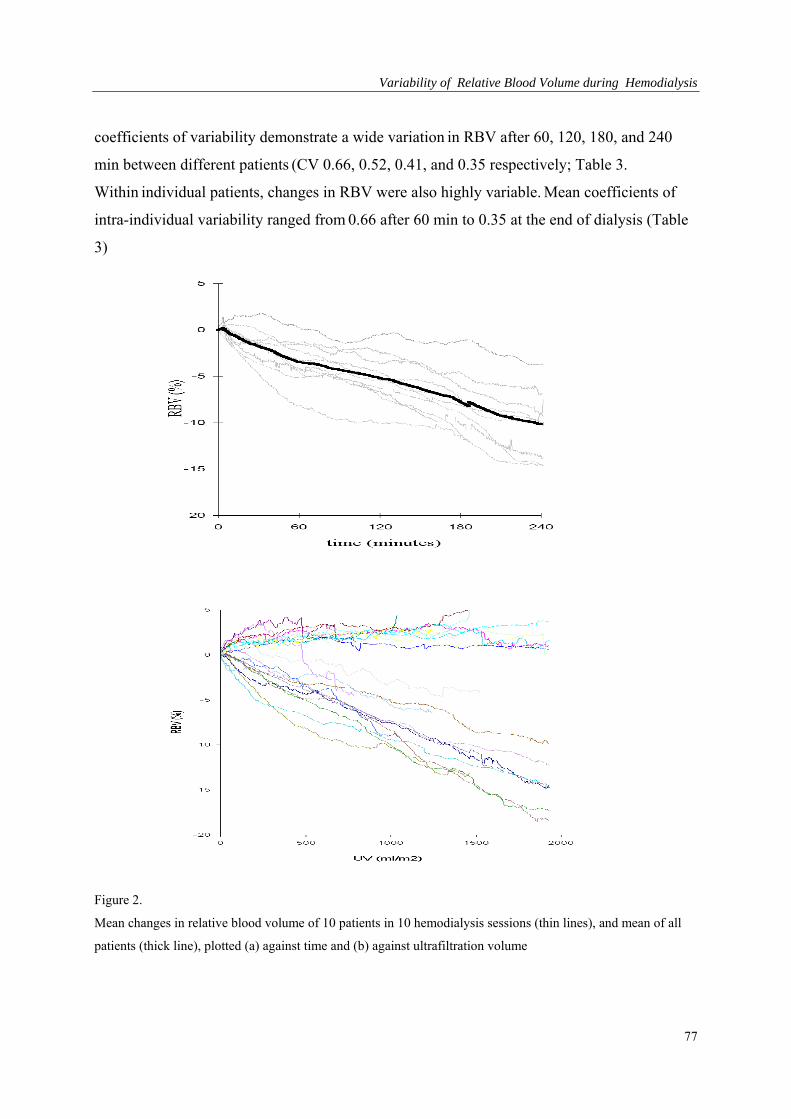
Variability of Relative Blood Volume during Hemodialysis
coefficients of variability demonstrate a wide variation in RBV after 60, 120, 180, and 240
min between different patients (CV 0.66, 0.52, 0.41, and 0.35 respectively; Table 3.
Within individual patients, changes in RBV were also highly variable. Mean coefficients of
intra-individual variability ranged from 0.66 after 60 min to 0.35 at the end of dialysis (Table
3)
Figure 2.
Mean changes in relative blood volume of 10 patients in 10 hemodialysis sessions (thin lines), and mean of all
patients (thick line), plotted (a) against time and (b) against ultrafiltration volume
77
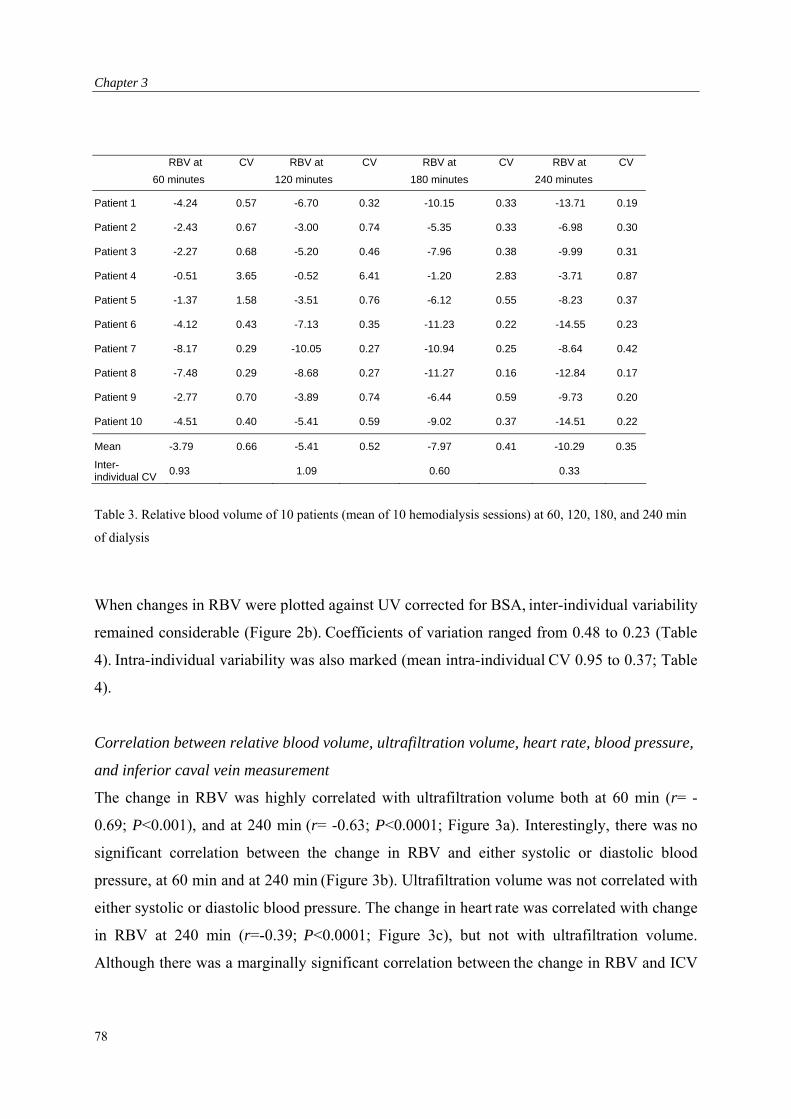
Chapter 3
RBV at CV RBV at CV RBV at CV RBV at CV
60 minutes 120 minutes 180 minutes 240 minutes
Patient 1 -4.24 0.57 -6.70 0.32 -10.15 0.33 -13.71 0.19
Patient 2 -2.43 0.67 -3.00 0.74 -5.35 0.33 -6.98 0.30
Patient 3 -2.27 0.68 -5.20 0.46 -7.96 0.38 -9.99 0.31
Patient 4 -0.51 3.65 -0.52 6.41 -1.20 2.83 -3.71 0.87
Patient 5 -1.37 1.58 -3.51 0.76 -6.12 0.55 -8.23 0.37
Patient 6 -4.12 0.43 -7.13 0.35 -11.23 0.22 -14.55 0.23
Patient 7 -8.17 0.29 -10.05 0.27 -10.94 0.25 -8.64 0.42
Patient 8 -7.48 0.29 -8.68 0.27 -11.27 0.16 -12.84 0.17
Patient 9 -2.77 0.70 -3.89 0.74 -6.44 0.59 -9.73 0.20
Patient 10 -4.51 0.40 -5.41 0.59 -9.02 0.37 -14.51 0.22
Mean -3.79 0.66 -5.41 0.52 -7.97 0.41 -10.29 0.35
Inter- individual CV
0.93 1.09 0.60 0.33
Table 3. Relative blood volume of 10 patients (mean of 10 hemodialysis sessions) at 60, 120, 180, and 240 min
of dialysis
When changes in RBV were plotted against UV corrected for BSA, inter-individual variability
remained considerable (Figure 2b). Coefficients of variation ranged from 0.48 to 0.23 (Table
4). Intra-individual variability was also marked (mean intra-individual CV 0.95 to 0.37; Table
4).
Correlation between relative blood volume, ultrafiltration volume, heart rate, blood pressure,
and inferior caval vein measurement
The change in RBV was highly correlated with ultrafiltration volume both at 60 min (r= -
0.69; P<0.001), and at 240 min (r= -0.63; P<0.0001; Figure 3a). Interestingly, there was no
significant correlation between the change in RBV and either systolic or diastolic blood
pressure, at 60 min and at 240 min (Figure 3b). Ultrafiltration volume was not correlated with
either systolic or diastolic blood pressure. The change in heart rate was correlated with change
in RBV at 240 min (r=-0.39; P<0.0001; Figure 3c), but not with ultrafiltration volume.
Although there was a marginally significant correlation between the change in RBV and ICV
78
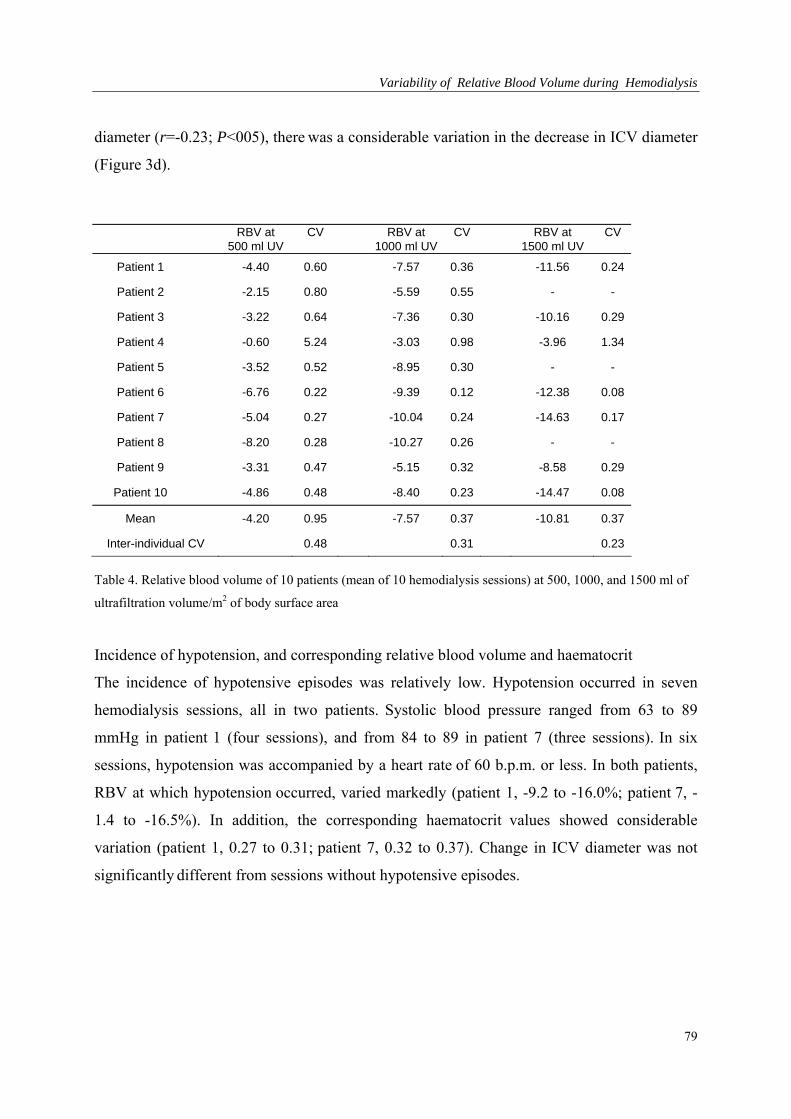
Variability of Relative Blood Volume during Hemodialysis
diameter (r=-0.23; P<005), there was a considerable variation in the decrease in ICV diameter
(Figure 3d).
RBV at CV RBV at CV RBV at CV 500 ml UV 1000 ml UV 1500 ml UV
Patient 1 -4.40 0.60 -7.57 0.36 -11.56 0.24
Patient 2 -2.15 0.80 -5.59 0.55 - -
Patient 3 -3.22 0.64 -7.36 0.30 -10.16 0.29
Patient 4 -0.60 5.24 -3.03 0.98 -3.96 1.34
Patient 5 -3.52 0.52 -8.95 0.30 - -
Patient 6 -6.76 0.22 -9.39 0.12 -12.38 0.08
Patient 7 -5.04 0.27 -10.04 0.24 -14.63 0.17
Patient 8 -8.20 0.28 -10.27 0.26 - -
Patient 9 -3.31 0.47 -5.15 0.32 -8.58 0.29
Patient 10 -4.86 0.48 -8.40 0.23 -14.47 0.08
Mean -4.20 0.95 -7.57 0.37 -10.81 0.37
Inter-individual CV 0.48 0.31 0.23
Table 4. Relative blood volume of 10 patients (mean of 10 hemodialysis sessions) at 500, 1000, and 1500 ml of
ultrafiltration volume/m2 of body surface area
Incidence of hypotension, and corresponding relative blood volume and haematocrit
The incidence of hypotensive episodes was relatively low. Hypotension occurred in seven
hemodialysis sessions, all in two patients. Systolic blood pressure ranged from 63 to 89
mmHg in patient 1 (four sessions), and from 84 to 89 in patient 7 (three sessions). In six
sessions, hypotension was accompanied by a heart rate of 60 b.p.m. or less. In both patients,
RBV at which hypotension occurred, varied markedly (patient 1, -9.2 to -16.0%; patient 7, -
1.4 to -16.5%). In addition, the corresponding haematocrit values showed considerable
variation (patient 1, 0.27 to 0.31; patient 7, 0.32 to 0.37). Change in ICV diameter was not
significantly different from sessions without hypotensive episodes.
79
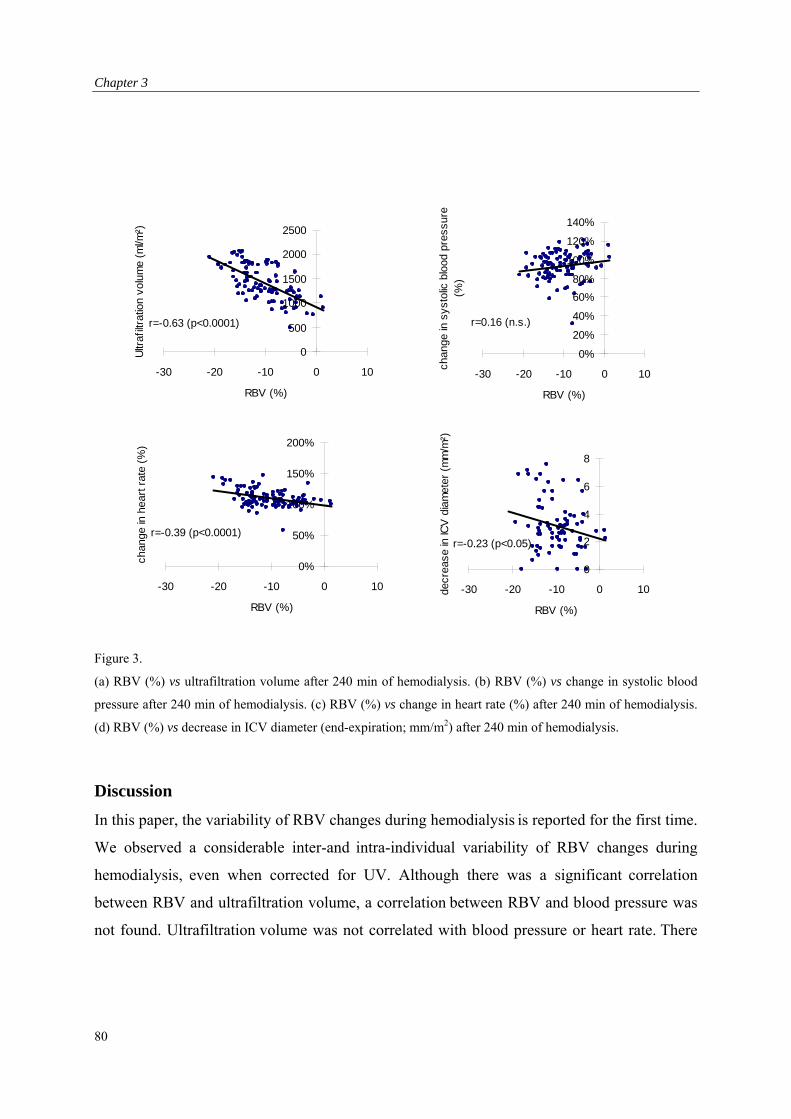
Chapter 3
0%
20%
40%
60%
80%
100%
120%
140%
-30 -20 -10 0 10
RBV (%)
chan
ge in
sys
tolic
blo
od p
ress
ure
(%)
r=0.16 (n.s.)
0
500
1000
1500
2000
2500
-30 -20 -10 0 10
RBV (%)
Ultr
afilt
ratio
n vo
lum
e (m
l/m²)
r=-0.63 (p<0.0001)
0%
50%
100%
150%
200%
-30 -20 -10 0 10
RBV (%)
chan
ge in
hea
rt r
ate
(%)
r=-0.39 (p<0.0001)
0
2
4
6
8
-30 -20 -10 0 10
RBV (%)
decr
ease
in IC
V d
iam
eter
(m
m/m
²)
r=-0.23 (p<0.05)
Figure 3.
(a) RBV (%) vs ultrafiltration volume after 240 min of hemodialysis. (b) RBV (%) vs change in systolic blood
pressure after 240 min of hemodialysis. (c) RBV (%) vs change in heart rate (%) after 240 min of hemodialysis.
(d) RBV (%) vs decrease in ICV diameter (end-expiration; mm/m2) after 240 min of hemodialysis.
Discussion
In this paper, the variability of RBV changes during hemodialysis is reported for the first time.
We observed a considerable inter-and intra-individual variability of RBV changes during
hemodialysis, even when corrected for UV. Although there was a significant correlation
between RBV and ultrafiltration volume, a correlation between RBV and blood pressure was
not found. Ultrafiltration volume was not correlated with blood pressure or heart rate. There
80
Variability of Relative Blood Volume during Hemodialysis
was, however, a significant correlation between RBV and heart rate, and a slight correlation
between RBV and ICV-diameter.
It is not surprising that we observed high inter-individual variability of RBV changes as
differences in body composition, hydration state, and the cardiovascular status are known to
affect the course of RBV during dialysis [1,2,9]. However, we found that the intra-individual
variability was equally high. In our study, this variability could not be explained by
differences in food and fluid intake during dialysis, as these were restricted according to a
standardized time and quantity schedule. Also, medication was not changed during the 10-
week trial period, and intercurrent changes in the cardiovascular status such as the occurrence
of myocardial ischaemia or systemic infection were not observed.
It is tempting to assume that the observed intra-individual variability in RBV changes was
caused by differences in ultrafiltration volume, as there was a significant correlation between
UV and RBV. However, when the RBV curves were plotted against UV instead of time, we
found only a minor improvement of the variation coefficients. Thus, differences in
ultrafiltration rate are unlikely to account for the day-to-day variation of the blood volume
response to hemodialysis, and other factors must be involved.
There was no correlation between RBV and blood pressure, which is contrary to other
observations [6,10,11]. However, a discrepancy between blood pressure and blood volume has
been reported before [12]. Blood pressure was also not dependent on UV. There was,
however, a significant correlation between RBV and heart rate. This suggests that a reduction
in RBV, through ultrafiltration, stimulates the autonomic nervous system, which prevents a
decrease in blood pressure by an increase in heart rate. In patients who did develop
hypotension during dialysis, we were unable to determine a critical level of RBV reduction.
Moreover, in six out of seven hypotensive dialysis sessions, patients were bradycardic instead
of tachycardic, indicating that in these patients hypotension was caused rather by a failing
cardiovascular response than by critical level of blood volume reduction.
In our study, ICV diameter decreased significantly during dialysis. However, when we studied
the relation between the change in ICV diameter and the change in RBV during dialysis, the
correlation proved to be poor. This means that filling of the central venous compartment,
which is assumed to be represented by the ICV diameter [13], does not change in parallel to
changes in RBV. Therefore a redistribution of blood within the vascular compartment must be
81
Chapter 3
assumed. This most probably results from cardiovascular defense mechanisms such as
peripheral and/or venous vasoconstriction, or a change in cardiac output.
We conclude that RBV changes have a considerable intra- and inter-individual variability, not
only in time but also when plotted against UV. No correlation was observed between UV or
changes in RBV and either blood pressure or the incidence of hypotension. Heart rate,
however, was significantly correlated with RBV. Moreover, IVC diameter was only poorly
correlated with RBV, suggesting a redistribution of blood towards the central venous
compartment. These data indicate that RBV monitoring is of limited use in the prevention of
dialysis-associated hypotension. The critical level of reduction in RBV at which hypotension
occurs may depend more on cardiovascular defense mechanisms such as sympathetic drive,
than on the reduction in RBV.
82
Variability of Relative Blood Volume during Hemodialysis
References 1. Daugirdas JT. Dialysis hypotension: a hemodynamic analysis. Kidney Int1991;39:233–246.
2. Raine AEG. The susceptible patient. Nephrol Dial Transplant 1996;11:6–10.
3. Veillon C, Patterson KY, Nagy DA, Tehan AM. Measurement of blood volume with an
enriched stable isotope of chromium (53Cr) and isotope dilution by combined gas
chromatography-mass spectrometry. Clin Chem 1994;40:71–73.
4. McMahon MP, Campbell SB, Shannon GF, Wilkinson JS, Fleming SJ. A non-invasive
continuous method of measuring blood volume during hemodialysis using optical techniques.
Med Eng Phys 1996;18:105–109.
5. Vries de JP, Olthof CG, Visser V, Kouw PM, van Es A, Donker JM, de Vries PM: Continuous
measurement of blood volume during hemodialysis by an optical method. ASAIO J
1992;38:M181–185.
6. Steuer RR, Harris DH, Conis JM. A new optical technique for monitoring hematocrit and
circulating blood volume: its application in renal dialysis. Dial Transplant 1993;22:260–265.
7. Santoro A. Mancine IE, Paolini F, Zucchelli P. Blood volume monitoring and control. Nephrol
Dial Transplant 1996;11[Suppl 2]:42–47 .
8. Mann H, Stelanitis I, Reinhart B, Stiller S. Prevention of haemodynamic risks by continuous
blood volume measurement and control. Nephrol Dial Transplant 1996;11:48–51.
9. Dorhout Mees EJ, Özbasli Ç, Akçiçek F. Cardiovascular disturbances in hemodialysis patients:
the importance of volume overload. J Nephrol 1995;8:71–78.
10. Lins LE, Hedenborg G, Jacobson SH, Samuelson K, Tedner B, Zetterholm UB, Ljungqvist O:
Blood pressure reduction during hemodialysis correlates to intradialytic changes in plasma
volume. Clin Nephrol 1992; 37:308–313.
11. Stiller S, Wirtz D, Waterbär F, Gladziwa U, Dakshinamurty KV, Mann H. Less symptomatic
hypotension using blood volume controlled ultrafiltration. ASAIO Trans 1991;37:M139–141.
12. Pizzarelli F, Dattolo P, Piacenti M, Morales MA, Cerrai T, MagiorreQ; Non-invasive
monitoring of hemodynamic parameters during hemodialysis. Int J Artif Organs 1995;18:499–
503.
13. Leunissen KML, Kouw P, Kooman JP, Cheriex EC, de Vries PM, Donker AJ, van Hooff JP:.
New techniques to determine fluid status in hemodialyzed patients. Kidney Int 1993;43:S50–
S55.
83

Chapter 3
84
Relative Blood Volume during Hemodialysis Without Ultrafiltration
Chapter 4: Increase in Blood Volume during Dialysis without Ultrafiltration.
85
Chapter 4
Abstract
Combined dialysis and ultrafiltration leads to more frequent episodes of hypotension than
isolated ultrafiltration. It has been suggested that decreased plasma volume preservation could
be responsible for this phenomenon. The present study evaluates the effects of diffusive
dialysis on the changes in relative blood volume. Six stable hemodialysis patients, without the
need for ultrafiltration, were studied during ten sessions of diffusive dialysis (bicarbonate)
lasting four hours. Relative blood volume (RBV) was monitored continuously by
measurement of hematocrit. During the first and second hour RBV increased by 2.4 ± 1.4 and
2.5 ± 0.8 % respectively, returning to baseline levels at the end of dialysis. No changes in
blood pressure or heart rate were noted. We conclude that during diffusive dialysis without
ultrafiltration relative blood volume is increased. A decrease in vascular resistance, or
changes in regional blood distribution could explain the findings.
Introduction
Hypotension is a major complication of hemodialysis, which occurs in approximately one
third of the patients [1]. It has been shown that isolated ultrafiltration without simultaneous
dialysis is better-tolerated [2]. This could suggest that the hemodynamic instability that occurs
during dialysis results from changes in osmolality [3-5]. Using kinetic modelling, the rapid
fall in the urea concentration of the extracellular compartment, is predicted to induce a
volume shift from the extracellular to the intracellular compartment [6,7,8]. On the other
hand, some studies failed to observe differences in plasma volume preservation between
ultrafiltration and ultrafiltration combined with hemodialysis [9,10,11]. However, differences
between blood volume decrement during isolated ultrafiltration and ultrafiltration combined
with dialysis could be masked in these studies, as there is an intra-individual variability in
change of blood volume during ultrafiltration, which is relatively large as compared to the
expected change in blood volume during diffusive dialysis [12,13]. To avoid these problems,
the effect of blood volume can best be studied during dialysis without net ultrafiltration
(diffusive dialysis). The effect of diffusive dialysis on changes in blood volume has been only
reported by Fleming et al. [14]. However, this study was set up to investigate the effect of
different dialysate sodium concentrations on blood volume, rather than the effect of diffusive
86
Relative Blood Volume during Hemodialysis Without Ultrafiltration
dialysis on blood volume. At present, it is therefore unclear whether the negative effect of
diffusive dialysis on hemodynamic stability results from reduced blood volume preservation
or from altered vascular reactivity. The present study evaluates the effects of diffusive dialysis
on blood volume preservation by continuously measuring the change in relative blood
volume. In order to correct for intra-individual variability, all subjects were studied during ten
dialysis treatments.
Subjects and Methods
Patients
We studied 6 patients, 4 men and 2 women, requiring chronic hemodialysis (time on dialysis
2 months - 5 years) with such a residual diuresis (900ml - 2000 ml/24 hr) that ultrafiltration is
not necessary. None of these patients suffered from diabetes mellitus. As there were no
further exclusion criteria all six patients were studied. Mean age of the subjects was 59 20
years. Their mean weight was 72 16 kg. The local ethics committee approved the study and
informed consent was obtained in all subjects. Medication was changed during the
experiments.
Dialysis prescription
In this study we examined 10 sessions for each patient. All dialysis sessions were performed
on the same day of the week. Dialysis was performed three times a week for four hours using
bicarbonate dialysate. Dialysate contained a sodium concentration of 138 mEq/L. Fresenius F-
60 high-flux dialyzers (Fresenius AG, Bad Homburg, Germany) and Fresenius 4008E
hemodialysis monitors were used to perform the treatments. Patients were connected to the
circuit after the priming volume of saline was discarded. Blood and dialysate flow rates were
200-300 ml/min and 500 ml/min respectively. Delivered Kt/V ranged between 1.1 and 1.3 on
a trice weekly basis, including residual renal function. All patients remained supine starting
from 30 minutes before being connected to the dialysis circuit till the end of the treatment. No
intravenous infusions were given during the treatment and the intake of fluids and food was
withheld during the treatment.
87
Chapter 4
Measurements
Blood volume was measured optically by means of the CRIT-LINE device (In-line
Diagnostics Co., Riverdale Utah). Before dialysis a sterile plastic disposable blood chamber
was placed between arterial bloodline and the dialyzer. The CRIT-LINE uses a transmissive
photometric technique to determine the hematocrit with a 95 % confidence interval from +
2.32 to – 2.31 hematocrit % and a repeatability 95 % interval from + 0.56 to - 0.55 hematocrit
% [15]. The CRIT-LINE device calculates relative blood volumes (RBV) from initial
hematocrit and the subsequent changes in wavelength as the erythrocytes pass the through the
blood chamber. For each patient, we calculated a mean relative blood volume and standard
deviation at 60, 120, and 180 minutes, and at the end of treatment. From all the mean relative
blood volumes of each patient, we calculated a grand mean relative blood volume. Blood
pressure was measured by means of an oscillometric device (Accutor 3, Datascope Co.,
Montreal, NY) at 5-minute intervals. Blood pressure and heart rate were calculated as the
average of three consecutive measurements. Hypotension was defined as decrease in systolic
blood pressure (SBP) of more than 30%. Blood samples were taken before and after the
dialysis session for measurement of the sodium and urea concentrations and for the mean
corpuscular volume (MCV) of the erythrocytes. We used the ionometric method for
determination of the sodium concentrations, because this method refers to the activity of the
sodium capable of crossing the membranes of the dialyzer [16].
Statistical analysis
All data are presented as mean standard deviation (SD). For changes in relative blood
volume 95 % confidence intervals were calculated. Differences between study periods were
assessed by means of ANOVA with repeated measures. All calculations were performed
using the SPSS statistical software package.
88
Relative Blood Volume during Hemodialysis Without Ultrafiltration
Results
Relative blood volume
RBV increased significantly during the first (+ 2.4 1.4 %; p< 0.05) and second hour (+2.5
0.8 %; p< 0.05) of the treatment (fig 1.). After reaching a plateau, RBV tended to decrease at
the end of the treatment. We observed no correlation between the changes in RBV and plasma
urea or sodium concentrations prior to dialysis (table 1). The observed increase in RBV did
not result from a change in MCV (91 ± 3.7 vs. 92 ± 2.8 fL). There was a similar pattern of
increase in all patients studied. However, there were considerable inter- and intra- individual
differences (table 2).
Patient AHT* [Na] SD [Urea] SD RBV120 SD BP120 ± SD
1 A, C, E 142 1 27.4 0.3 0.51 2.71 1 12
2 None 138 2 28.5 3.6 4.35 4.2 10 ± 12
3 B, D 142 1 26.5 0.7 6.90 1.74 -9 ± 28
4 None 141 2 26.4 14 3.70 0.35 2 ± 10
5 D 140 1 31.5 0.7 1.90 0.99 0 ± 9
6 None 134 2 32.1 0.2 0.73 2.16 5 ± 11
Mean 140 3 28.4 3 2.45 1.62 0.55 ± 15.4
Table 1. Relationship between the use of anti-hypertensive drugs, osmolarity, blood pressure and blood volume
Abbreviations are : aHT = antihypertensive drugs, [Na] = mean plasma sodium concentration (mmol/l) , [Urea]
= mean plasma urea concentration (mmol/l), SD = standard deviation, BP120 = % increase in systolic blood
pressure in the first two hours, RBV120 = % increase in relative blood volume in the first two hours.
A = Nitates, B = blocker, C = Calcium antagonist, D = ACE inhibitor, E = 1 blocker
Figure 1. Relative Blood Volume Changes in 6 patients during diffusive dialysis. Each curve represents the
avarage of 10 dialysis sessions. The bold curve represents the avarage of all 6 patients.
89
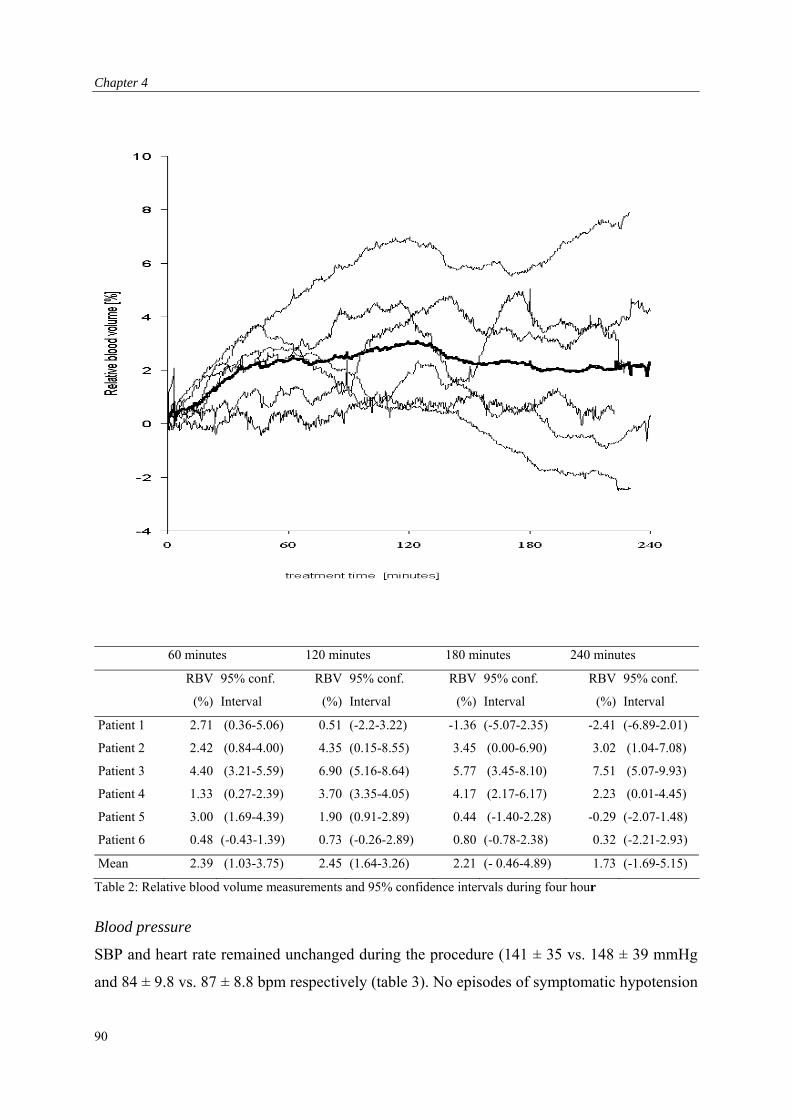
Chapter 4
60 minutes 120 minutes 180 minutes 240 minutes
RBV
(%)
95% conf.
Interval
RBV
(%)
95% conf.
Interval
RBV
(%)
95% conf.
Interval
RBV
(%)
95% conf.
Interval
Patient 1 2.71 (0.36-5.06) 0.51 (-2.2-3.22) -1.36 (-5.07-2.35) -2.41 (-6.89-2.01)
Patient 2 2.42 (0.84-4.00) 4.35 (0.15-8.55) 3.45 (0.00-6.90) 3.02 (1.04-7.08)
Patient 3 4.40 (3.21-5.59) 6.90 (5.16-8.64) 5.77 (3.45-8.10) 7.51 (5.07-9.93)
Patient 4 1.33 (0.27-2.39) 3.70 (3.35-4.05) 4.17 (2.17-6.17) 2.23 (0.01-4.45)
Patient 5 3.00 (1.69-4.39) 1.90 (0.91-2.89) 0.44 (-1.40-2.28) -0.29 (-2.07-1.48)
Patient 6 0.48 (-0.43-1.39) 0.73 (-0.26-2.89) 0.80 (-0.78-2.38) 0.32 (-2.21-2.93)
Mean 2.39 (1.03-3.75) 2.45 (1.64-3.26) 2.21 (- 0.46-4.89) 1.73 (-1.69-5.15)
Table 2: Relative blood volume measurements and 95% confidence intervals during four hour
Blood pressure
SBP and heart rate remained unchanged during the procedure (141 ± 35 vs. 148 ± 39 mmHg
and 84 ± 9.8 vs. 87 ± 8.8 bpm respectively (table 3). No episodes of symptomatic hypotension
90
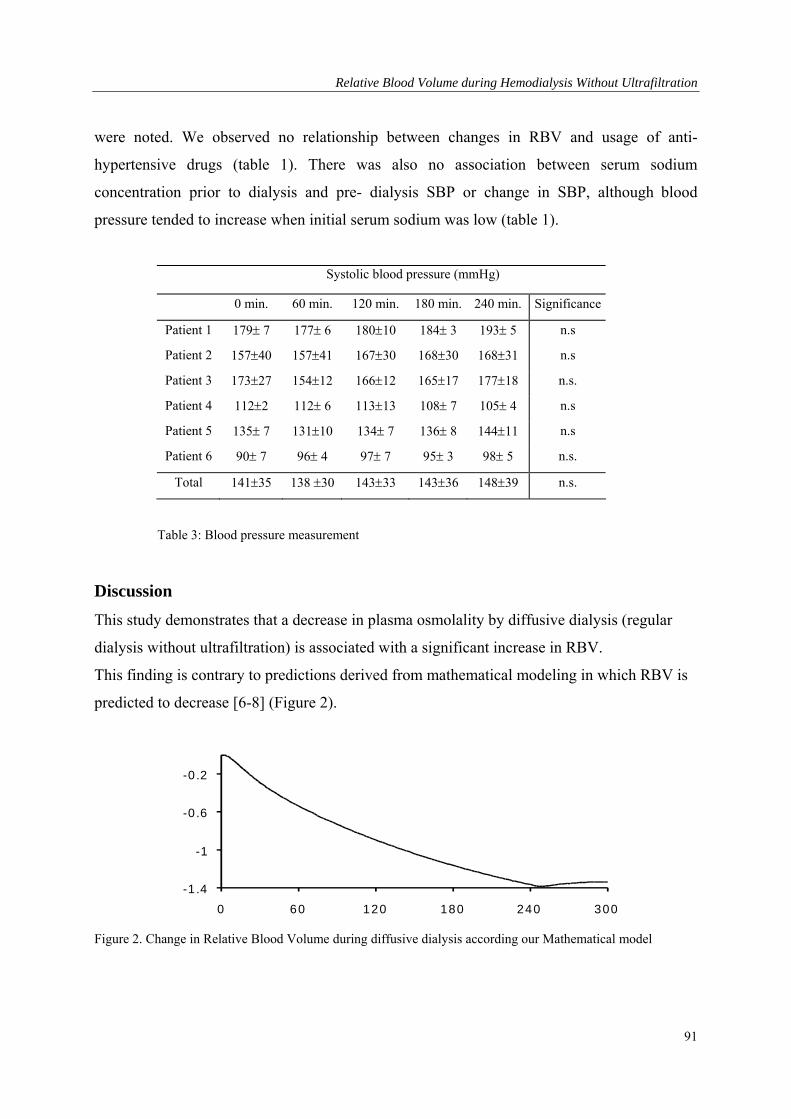
Relative Blood Volume during Hemodialysis Without Ultrafiltration
were noted. We observed no relationship between changes in RBV and usage of anti-
hypertensive drugs (table 1). There was also no association between serum sodium
concentration prior to dialysis and pre- dialysis SBP or change in SBP, although blood
pressure tended to increase when initial serum sodium was low (table 1).
Systolic blood pressure (mmHg)
0 min. 60 min. 120 min. 180 min. 240 min. Significance
Patient 1 179 7 177 6 18010 184 3 193 5 n.s
Patient 2 15740 15741 16730 16830 16831 n.s
Patient 3 17327 15412 16612 16517 17718 n.s.
Patient 4 1122 112 6 11313 108 7 105 4 n.s
Patient 5 135 7 13110 134 7 136 8 14411 n.s
Patient 6 90 7 96 4 97 7 95 3 98 5 n.s.
Total 14135 138 30 14333 n.s. 14336 14839
Table 3: Blood pressure measurement
Discussion
This study demonstrates that a decrease in plasma osmolality by diffusive dialysis (regular
dialysis without ultrafiltration) is associated with a significant increase in RBV.
This finding is contrary to predictions derived from mathematical modeling in which RBV is
predicted to decrease [6-8] (Figure 2).
-1 .4
-1
-0 .6
-0 .2
0 60 120 180 240 300
Figure 2. Change in Relative Blood Volume during diffusive dialysis according our Mathematical model
91
Chapter 4
Diffusive dialysis leads to a decreased extracellular osmolarity, as there is an efflux of urea
from the extracellular space. Theoretically, such a decrease in extracellular osmolarity would
lead to a decreased tonicity of the extracellular space, and this would result in an osmotic fluid
shift towards the intracellular space. This fluid shift would in turn lead to a decrease in blood
volume [6-8]. As we find an increase in blood volume, the decrease in osmolarity by
decreased plasma urea concentrations does not result in a volume shift towards the
intracellular compartment. These findings are in accordance with those of Fleming et al, who
previously observed that changes in blood volume are not correlated with urea efflux [14].
However, in this study there was a positive correlation between changes in blood volume and
the extra cellular sodium concentration. As sodium penetrates the cells much less rapidly than
urea it has a far greater impact on tonicity. A small increase in the extracellular sodium
concentration during dialysis would thus favor an increase in plasma volume, even when a
concomitant efflux of urea exists, that leads to a net decrease in osmolarity.
In our study, the average effective sodium concentration in the blood compartment of the
dialyzer accounting for both plasma-water concentration and the Donnan-Gibbs ratio, was
145 mmol/l [7,8]. Using a dialysate sodium concentration of 138 mmol/l would therefore
result in a sodium transport towards the dialysate compartment, even if backfiltration were to
occur. The observed changes in blood volume can therefore not result from sodium kinetics.
Several other mechanisms could explain the observed blood volume patterns by such as: an
increase in the volume of the erythrocytes, an increase in the total amount of intravascular
protein, and changes in vascular resistance, especially when the patients are overhydrated.
Blood volume measurements by CRIT-LINE assume the constancy of erythrocyte mass and
volume. In theory, the observed decrease in hematocrit could be explained by a fluid shift
from the erythrocyte to the intravascular space, thereby reducing erythrocyte volume.
However, we observed no differences between MCV measured before and after dialysis,
findings that are similar to previous reports [17,18]. Moreover, such a fluid shift from the
erythrocyte to the intravascular space is unlikely to occur under these circumstances as the
changes in osmolality during dialysis favor a water flux towards the intracellular compartment
[8,18].
92
Relative Blood Volume during Hemodialysis Without Ultrafiltration
An increase in the total amount of protein in the intravascular space would also result in an
increase in plasma volume. As the total fluid shift between intra- and extra-vascular
compartments is determined by the transmural oncotic pressure gradient. The interstitial fluid
pressure determines lymph drainage, which increases the back-flow of proteins. However,
during dialysis there is a decrease in osmolality in the interstitial space. As this will decrease
rather than increase the interstitial volume, it is unlikely that such a backflow of protein would
occur.
According to Starlings law, the fluid shift between the vascular and interstitial compartments
depends on changes in hydrostatic and oncotic capillary pressure and on the filtration
coefficient of the capillary basement membrane [19]. This filtration coefficient varies
considerably from one tissue to the other. The whole body filtration coefficient represents the
mean value of filtration coefficients of all segments of the regional micro-vascular system,
each segment weighted for its fraction in capillary surface area. A change in vascular
resistance will alter the blood flow distribution to different sections of the micro-vascular
system and could therefore influence the whole body filtration coefficient, as well as
hydrostatic capillary pressure. This would result in a different Starling equilibrium between
the interstitial and intravascular space.
Wehle et al. [20] observed that diffusive dialysis, using acetate buffered dialysate reduces
peripheral resistance. Moreover, several other investigators observed that the increase in
peripheral resistance and venous tone during isolated ultrafiltration was significantly reduced
by concurrent diffusive bicarbonate dialysis [21, 22]. These results suggest that bicarbonate
dialysis reduces peripheral resistance. Wehle et al also observed that, when a dialysate sodium
concentration of 140 mmol/L is used, the observed decrease in peripheral resistance during
diffusive dialysis is counterbalanced by an increase in cardiac output [23]. This is in
accordance with our results that showed no change in blood pressure during diffusive dialysis.
Moreover, Wehle et al. found that at a low dialysate sodium concentration, which decreases
extracellular sodium concentration, the increase in stroke volume was much smaller and blood
pressure dropped [23]. Indeed, in those patients that had a low baseline serum sodium
concentration (2 and 6) and hence a relatively high dialysate concentration, we observed a
tendency for an increase in blood pressure as compared to the other patients.
93
Chapter 4
When diffusive dialysis without ultrafiltration is performed in overhydrated patients, the
decrease in vascular resistance would induce an even greater increase in RBV than in
normohydrated patients. It has been shown that during ultrafiltration in overhydrated patients
plasma volume preservation is better than in normohydrated patients [24, 25]. As the
compliance of the interstitium is high in overhydrated patients a decrease in intra-vascular
hydrostatic pressure resulting from ultrafiltration will not lead to a decreased interstitial
pressure hence reabsorption of fluid into the capillaries. In our study ultrafiltration was not
performed, but a decrease in vascular resistance could also result in a decreased intravascular
hydrostatic pressure. Consequently, the high compliance of the interstitial space in
overhydrated persons will thus lead to increased absorption of fluid from the capillaries and a
greater increase in RBV. Despite the considerable diuresis in our patient group, some patients
might have been fluid overloaded, as two patients had elevated systolic blood pressure and
several patients used anti-hypertensive medication. In our study, we found no correlation
between initial blood pressure or usage of anti hypertensive drugs and RBV during dialysis.
However, this does not exclude a relationship between initial fluid overload and the observed
increase in RBV.
The relationship between vascular tone and plasma volume expansion was directly assessed
by several investigators, who found a plasma volume expansion, following the administration
of a vasodilator agent [26,27,28]. Many factors could alter vascular tone during diffusive
dialysis, such as induction of cytokine production in the presence of dialysate-derived
contaminants or a change in body temperature [29,30]. Cold dialysis results in a greater
decrease in relative blood volume, compared to standard treatment [31]. We did not measure
body temperature. However, others have shown that body temperature rises during diffusive
dialysis and ultrafiltration with a dialysate temperature of 37 C [32].
The changes in blood volume in this study are small compared to those measured during
routine hemodialysis with substantial ultrafiltration rates. Previous studies, in which RBV was
studied during dialysis with ultrafiltration and during isolated ultrafiltration showed a
tendency for a less pronounced fall in RBV during ultrafiltration combined with dialysis,
although this difference was not significant [7,8,9]. However, the relatively large decrement
in RBV during ultrafiltration could easily mask the relatively small increase in RBV during
diffusive dialysis, as there is a considerable intra-individual variability in RBV during
94
Relative Blood Volume during Hemodialysis Without Ultrafiltration
ultrafiltration [12]. This could explain why these previous studies failed to observe significant
differences. Fleming et al [14] studied blood volume changes during diffusive dialysis, and
found no significant change in blood volume. However, in this study only twelve sessions
with standard sodium concentration were studied, and only 1 or 2 (17 in total) blood volume
measurements were done, while in our experiment relative blood volume was measured
continuously during 60 sessions.
We conclude that during diffusive dialysis without ultrafiltration relative blood volume is
increased. A decrease in vascular resistance or changes in regional blood distribution could
explain these findings.
95
Chapter 4
References
1. Henrich WL: Hemodynamic instability during hemodialysis: Kidney Int 1986;30:605-61.
2. Bergström J, Asaba H, Furst P, Oules R: Dialysis, ultrafiltration and blood pressure: Proc Eur
Dial Transplant Assoc 1976;13:293-305.
3. Asaba H, Bergstrom J, Furst P, Lindh K, Mion C, Oules R, Shaldon S: Sequential ultrafiltration
and diffusion as alternative to convential hemodialysis: Proc Clin Dial Transpl Forum
1976;6:129-134.
4. Bergström J: Changes in blood pressure and hemodynamics during ultrafiltration and dialysis:
Dialysis Transplant 1978;7:1087-1091.
5. Henrich WL, Woodard TD, Blachley JD, Gomez-sanchez C, Pettinger W, Cronin RE: Role of
osmolality in blood pressure stability after dialysis and ultrafiltration: Kidney Int 1980;18:480-
488.
6. Kimura G, van Stone JC, Bauer JH, Keshaviah PR: A simulation study on transcellular fluid
shifts induced by hemodialysis: Kidney Int 1983;24:542-548.
7. Ursino M, Innocenti M: Modelling arterial hypotension during hemodialysis: Artif Organs
1997;21:873-890.
8. Akcahuseyin E, Nette RW, Vincent HH, van Duyl WA, Krepel H, Weimar W, Zietse R:
Simulation study of the intercompartmental fluid shifts during hemodialysis: ASAIO J
2000;46:81-93.
9. Rodriquez M, Pederson JA, Llach F: Effect of dialysis and ultrafiltration on osmolality, colloid
osmotic pressure, and vascular refilling rate: Kidney Int 1985;28:808-813.
10. van der Sande FM, Mulder AW, Hoorntje SJ, Peels KH, van Kuijk WH, Kooman JP, Leunissen
KM: The hemodynamic effect of different ultrafiltration rates in patients with cardiac failure
and patients without cardiac failure: comparison between isolated ultrafiltration and
ultrafiltration with dialysis: Clin Neprol 1998;50:301-308.
11. Fleming SJ, Wilkinson JS, Aldridge C, Greenwood RN, Baker LRI, Cattell WR: Blood volume
changes during isolated ultrafiltration and combined ultrafiltration-dialysis: Nephrol Dial
Transplant 1988;3:272-276.
12. Krepel HP, Nette RW, Akcahuseyin E, Weimar W, Zietse R: Variability of relative blood
volum during hemodialysis: Nephrol Dial Transplant 2000;15:673-679.
13. Santoro A, Mancini E, Paolini F, Zuccheli P: Blood volume monitoring and control: Nephrol
Dial Transplant 1996;11:42-47.
14. Fleming SJ, Wilkinson JS, Greenwood RN, Aldridge C Baker LRI, Catttell WR : Influence of
dialysate on intercompartmental fluid shifts: Kidney Int 1987;32:267-273.
96
Relative Blood Volume during Hemodialysis Without Ultrafiltration
15. Leypoldt JK, Cheung AK, Steuer RR, Harris DH, Conis JM: Determination of the circulating
blood volume by continuously monitoring hematocrit during hemodialysis: J Am Soc Nephrol
1995;6: 214-219.
16. Di Filipo S, Corti M, Andrulli S, Manzoni C, Locatelli F: Determinig the adequacy of sodium
balance in hemodialysis using a kinetic model: Blood Purif 1996;14:431-436.
17. de Vries PM, Kouw PM, Meijer JH, Oe LP, Schneider H, Donker AJ: Changes in blood
parameters during hemodialysis as determined by conductivity measurements: ASAIO Trans
1988;34:623-626.
18. Fleming SJ, Wilkinson JS, Aldridge C, Greenwood RN, Muggleston SD, Baker LR, Cattell
WR: Dialysis induced change in erythrocyte volume: effect on change in blood volume
calculated from packed cell volume: Clin Nephrol 1988;29:63-68.
19. Schneditz D, Roob J, Oswald M, Pogglitsch H, Moser M, Kenner T, Binswanger U: Nature and
rate of vascular refilling during hemodialysis and ultrafiltration: Kidney Int 1992;42:1425-1433.
20. Wehle B, Castenfors J, Furst P, Gunnarson B, Shaldon S, Bergstrom J: Hemodynamic changes
during sequential ultrafiltration and dialysis: Kidney Int 1979;15:411-418.
21. Kooman JP, Gladziwa U, Bocker G,, van Bortel LMAB, van Hoof JP, Leunissen KML: Role of
the venous system in hemodynamics during ultrafiltration and bicarbonate dialysis: Kidney
Int 1992;42:718-726.
22. Bradley JR, Evans B, Cowley AJ: Comparison of vascular tone during combined hemodialysis
with ultrafiltration and during ultrafiltration followed by hemodialysis: a possible mechanism
for dialysis hypotension: Br Med J 1990;300:1312-1313.
23. Wehle B, Asaba H, Castenfors J, Gunnarson B, Bergström J: Influence of dialysate
composition on cardiovascular function in isovolemic hemodialysis: Proc EDTA 1981;18:153-
159.
24. Wizemann V, Leibinger K, Mueller K, Nilson A: Influence of hydration state on plasma
volume changes during ultrafiltration: Artif Organs 1995;19:416-419.
25. Mann H, Stiller S, Gladziwa U, Konigs F: Kinetic modelling and continuous on-line blood
volume measurement during dialysis therapy: Nephrol Dial Transplant 1990;5S1:144-146.
26. Weil JV, Chidsey CA: Plasma volume expansion resulting from interference with adrenergic
function in normal man: Circulation 1968;37:54-61.
27. Skillmann JJ, Eltringham WK, Zollinger RM Jr, Lauler DP, Moore FD: Phenoxybenzamine-
induced vasodiltation: A stimulus to increased plasma volume with reduced central venous
pressure and aldosterone hypersecretion in man: Surgery 1968;64:368-80.
97
Chapter 4
98
28. Wysocki M, Andersson OK, Persson B, Bagge U, Braide M: Hemorheologic effects of
vasodilatation in essential hypertension: Angiology 1996;47:869-877.
29. Daugirdas JT: Dialysis hypotension: A hemodynamic analysis: Kidney Int 1991;39:233-46.
30. Maggiore Q, Dattolo P, Piacenti M, Morales MA, Pelosi G, Pizzarelli F, Cerrai T: Thermal
balance and dialysis hypotension: Int J Artif Organs 1995;18:518-525.
31. Schneditz D, Martin K, Kramer T, Skrabal F: Effect of controlled extracorporeal blood cooling
on ultrafiltration-induced blood volume changes during hemodialysis: J Am Soc Nephrol
1997;8:956-964.
32. Maggiore Q, Pizzarelli F, Sisca S, Catalano C, Delfino D: Vascular stability and heat in dialysis
patients: Contrib Nephrol 1984;41:398-402.
Effect of Infusions on Relative Blood Volume
Chapter 5 : Specific Effect of the Infusion of Glucose on Blood Volume
during Hemodialysis.
99
Chapter 5
Abstract
Intradialytic morbid events, such as hypotension and cramps during hemodialysis are
generally treated by infusion of iso-or hyper-tonic solutions. However, differences may exist
between solutions with respect to plasma refilling and vascular reactivity.
We compared the effect of no infusion (NI), with iso-volumetric infusion of isotonic saline
0.9% (IS), saline 3% (HS), isotonic glucose 5% (IG), glucose 20% (HG) and mannitol 20%
(HM), in 6 patients during the first hour of 6 standardized hemodialysis sessions with
ultrafiltration. Relative blood volume was monitored continuously by measurement of the
intravascular amount of protein. Blood pressure was measured by an oscillometric method,
while cardiac output was measured by a thoracic impedance technique.
At baseline no differences in serum urea, sodium, potassium, glucose and osmolarity were
found between the various infusion experiments. The maximum increase in relative blood
volume directly after infusion was significantly greater with HG (5.1±0.7%) than with all
other infusions (p 0.05). Stroke volume increased (21.019.2 %, p 0.05) and total
peripheral resistance decreased significantly (15.4 16.4 %, p 0.05) after HG infusions.
Infusion of hypertonic glucose during dialysis results in a greater increase in relative blood
volume than equal volumes of other solutions. As mannitol has the same osmolarity, molecule
mass and charge, the greater increase in RBV following hypertonic glucose appears to be a
specific effect, possibly related to a decline in vascular tone. It is therefore uncertain whether
the observed increase in plasma volume during hypertonic glucose infusions will be of
clinical benefit.
Introduction
Hemodialysis is frequently accompanied by acute symptoms or complications, such as
hypotension, severe muscle cramps, dizziness, and lightheadedness [1]. An important
contributing factor for these intradialytic morbid events (IME) is hypovolemia due to removal
of fluid from the intravascular space by ultrafiltration and inadequate refilling from the
extravascular compartment [2]. Inadequate constriction of both arterial and venous vascular
beds may also be of importance in the pathogenesis of IME, especially during hypotension
[3]. Infusion of fluids to increase blood volume has been advocated to prevent IME.
Increasing plasma osmolarity during dialysis has also been shown to reduce IME [4]. The
100
Effect of Infusions on Relative Blood Volume
reduction of symptoms may result from improved refill of the intravascular compartment by
the induction of an osmotic gradient between the vascular and the extravascular compartment
[4,5], but may also be related to a direct effect of osmolarity on cardiovascular reactivity [6].
In clinical practice isotonic saline (0.9 %) or hypertonic (3%) saline infusions are most
frequently used in order to prevent IME. However, increasing the sodium load during dialysis
has been shown to increase interdialytic thirst and weight gain [7]. Alternatively, glucose or
mannitol solutions can be given. The acute and specific effects of these solutions and their
osmolarities on vascular refilling and reactivity are largely unknown. Clear insight into the
exact effects of the solutions on hemodynamics and osmolarity is pivotal for the
determination which solution should be given during dialysis associated morbidity. We
therefore compared the effects of saline 0.9 and 3 %, glucose 5 and 20 %, and mannitol 20 %
on vascular refilling and vascular reactivity during combined hemodialysis and ultrafiltration
(HD+UF). In order to obtain optimal reproducibility, the dialysis sessions as well as the
infusions were standardized. Moreover, the infusions were given during the first hour of the
treatment, when variability in blood volume decrement between dialysis sessions is relatively
low [8].
Subjects and Methods
Patients
Six clinically stable patients, 3 men and 3 women, requiring chronic hemodialysis were
studied. The patients had a mean age of 48 5.9 years and time on hemodialysis averaged
18.5 ± 12.5 months. Renal failure resulted from polycystic kidney disease (2), nephrosclerosis
(2), renal artery stenosis (1) and antiglomerular basement membrane nephritis (1). Exclusion
criteria were acute infectious diseases, diabetes, severe coronary or valvular heart disease and
compromised left ventricular function. The patients did not use anti-hypertensive drugs,
except for one patient who used nifedipine. This drug was stopped one week prior to entry in
the study. The local ethics committee approved the study and informed consent was obtained
from each patient. Dry weight was considered when patients remained without symptoms of
dyspnea or edema during the interdialytic period. Moreover, inferior caval vein diameter
(VCD) measurements were performed at intervals of three weeks. Overhydration was defined
101
Chapter 5
as a VCD of more than 11.4 and underhydration was defined as a VCD of less than 8 mm/m2
body surface area [9].
Dialysis prescription
Dialysis was performed three times a week with the procedure normally used at our
institution, using bicarbonate dialysate (32 meq/L). Dialysate further contained sodium 138
mmol/L, potassium 2 mmol/L, calcium 1.75mmol/L, glucose 5.5 mmol/L with a total
osmolarity of 292 mosm/L, a conductivity of 11.7 mS/cm (Fresenius SK-F213, Fresenius AG,
Bad Homburg, Germany) and a temperature of 37 ºC. Fresenius F-60 high flux dialyzers and
Fresenius 4008E hemodialysis monitors were used to perform the treatments. Blood and
dialysate flow rates were 200-300 ml/min and 500 ml/min respectively. Delivered Kt/V
ranged between 1.1 and 1.3, including residual renal function. Patients were connected to the
circuit after the priming volume of saline was discarded.
Study protocol
All sessions were performed on the same day of the week during six consecutive weeks. The
patients remained supine throughout the experiments and no food or beverages were provided.
The investigations were performed during the first hour of six hemodialysis sessions. The
ultrafiltration rate was standardized at 20 ml/kg/hr. The study was started after the patients
had had a supine rest for 30 min, after which the needles were inserted (t=0). After exactly 10
minutes of UF one of the test solutions was infused by an infusion pump for ten minutes (t=10
to t=20) at the same rate as the ultrafiltration rate (20 ml/kg/hr), so that no net fluid was
extracted from the body during the infusion period. In each patient, the effects of no infusion
(NI), isotonic saline 0.9% (IS), hypertonic saline 3% (HS), isotonic glucose 5% (IG),
hypertonic glucose 20% (HG), and mannitol 20% (HM) (Baxter BV, Utrecht, The
Netherlands) were compared. The order in which the solutions were infused was random. The
osmolarity of HS (900 mOsmol/L) was roughly comparable to the HM and HG solutions. The
HM and HG solutions were iso-osmolar (both 1098 mOsmol/L).
102
Effect of Infusions on Relative Blood Volume
Measurements
Relative Blood Volume (RBV) was measured by means of a blood volume monitor (BVM,
Fresenius, Bad Homburg, Germany), which measures the total protein concentration, the sum
of hemoglobin and plasma proteins in the vascular space. Changes in total protein
concentration during dialysis are used to estimate changes in plasma volume. This method has
a very good agreement with a standard reference method involving calculation of RBV from
serial measurements of hemoglobin levels (SD 1.7%, r > 0.96) and allows precise and reliable
measurement of RBV [10]. Moreover, these measurements showed no sensitivity to changes
in blood components such as sodium and glucose. Systolic, diastolic and mean arterial blood
pressures (SAP, DAP, MAP) and heart rate (HR) were measured in triplicate at 10-minute
intervals by means of an oscillometric device (Accutor 3, Datascope Co., Paramus, NJ). The
average of three consecutive measurements was used for analysis. Stroke volume (SV) was
measured every 10 minutes using electrical impedance cardiography (Cardioscreen Medis,
Ilmenau, Germany). Impedance cardiography is based on the fact that when blood is pumped
into the aorta from the electrically well isolated heart, the electrical impedance of the thorax
changes. SV can be subsequently calculated on the basis of this pulse synchronous change in
impedance. This method has proven to give reliable information about the changes in stroke
volume during hemodialysis [11]. Moreover, the results of impedance cardiography are highly
reproducible (SD 0.36 l/min) [12]. One pair of electrodes was placed on each side of the
neck. A third and fourth pair were placed on the lateral thorax at the xiphisternal level. Of
each pair one electrode was placed exactly 5 cm above the other. The upper neck and lower
xiphisternal electrodes were stimulated by a 60 kHz sinusoidal current and the resulting
voltage was monitored from the inner recording electrodes. Two separate electrodes were
placed in order to obtain the ECG signal. Stroke volume was calculated with the equation of
Bernstein [13]:
SV= VEPT x LVET x (dZ/dtmax)/TFI (ml), where VEPT is the volume of electrically
participating tissue, which depends on height and weight of the patient. The weight of the
patient at the moment of the measurement was considered as the predialysis weight minus the
weight of the net ultrafiltrationvolume. LVET is the left ventricular ejection time (ms),
dZ/dtmax (Ώ /ms) is the magnitude of the peak value of the impedance derivative and TFI (Ώ)
is the thoracic fluid index, which is given by the basic impedance. At 10- minute intervals the
103
Chapter 5
patients were asked to keep perfectly still and during 20 heart cycles in the course of the
examination the impedance curves were transported into a cardioscreen trend
softwarepackage (version 3.1) and recorded on a PC screen. A mean impedance curve was
calculated by the software program and the curves that varied more than 5% from average
were discarded manually. When no more than five curves were discarded stroke volume was
calculated from the remaining heart cycles. Total peripheral resistance (TPR) was calculated
from, SV, HR and MAP using the following formula: TPR = (MAP/(SV x HR)) x 80 (dyn/sec
/cm-5 ). Before (t=0) and after one hour of treatment (t=60) blood samples were taken for the
determination of urea, sodium, potassium, glucose, and osmolarity.
Sodium concentration was measured by ionometry. Osmolalarity was measured by determing
the crystallizing temperature of the sample by freezing point depression then using the
temperature and calibration curve to determine the osmotic pressure.
Statistical analysis
All data and values are presented as mean ± standard deviation.
Differences in body weight, hemodynamic parameters and laboratory between the procedures
were analyzed by one way ANOVA with the post hoc LSD test using the SPSS statistical
software package (SPSS version 8.0). Changes in hemodynamic and laboratory parameters
compared to baseline were analyzed with a paired t-test.
Results
Body Weight
The average dry weight was 53.8 13.5 kg, while the mean interdialytic weight gain was 4.6
2.0 % of body weight (Table 1). During the 6 weeks period dry weight remained stable in
all patients. The average interdialytic weight gain was comparable for all infusion
experiments.
104
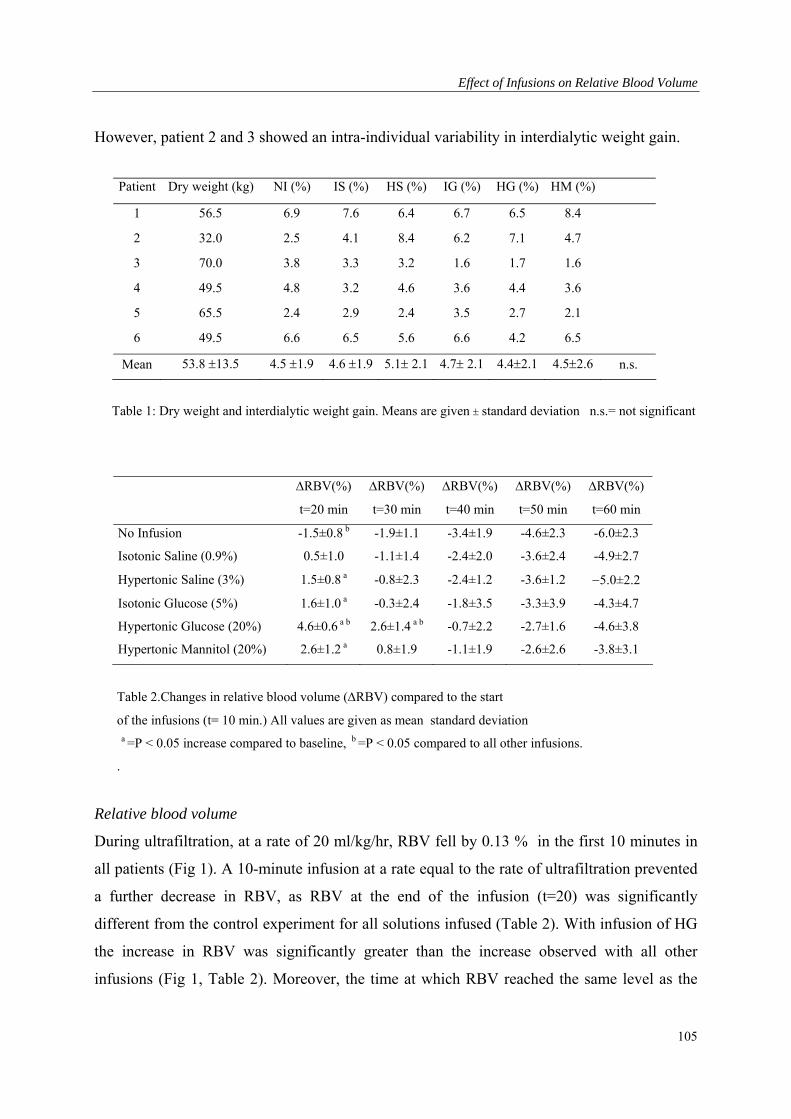
Effect of Infusions on Relative Blood Volume
However, patient 2 and 3 showed an intra-individual variability in interdialytic weight gain.
Patient Dry weight (kg) NI (%) IS (%) HS (%) IG (%) HG (%) HM (%)
1 56.5 6.9 7.6 6.4 6.7 6.5 8.4
2 32.0 2.5 4.1 8.4 6.2 7.1 4.7
3 70.0 3.8 3.3 3.2 1.6 1.7 1.6
4 49.5 4.8 3.2 4.6 3.6 4.4 3.6
5 65.5 2.4 2.9 2.4 3.5 2.7 2.1
6 49.5 6.6 6.5 5.6 6.6 4.2 6.5
Mean 53.8 13.5 4.5 1.9 4.6 1.9 5.1 2.1 4.7 2.1 4.42.1 4.52.6 n.s.
Table 1: Dry weight and interdialytic weight gain. Means are given standard deviation n.s.= not significant
RBV(%)
t=20 min
RBV(%)
t=30 min
RBV(%)
t=40 min
RBV(%)
t=50 min
RBV(%)
t=60 min
No Infusion -1.5±0.8 b -1.9±1.1 -3.4±1.9 -4.6±2.3 -6.0±2.3
Isotonic Saline (0.9%) 0.5±1.0 -1.1±1.4 -2.4±2.0 -3.6±2.4 -4.9±2.7
Hypertonic Saline (3%) 1.5±0.8 a -0.8±2.3 -2.4±1.2 -3.6±1.2 5.0±2.2
Isotonic Glucose (5%) 1.6±1.0 a -0.3±2.4 -1.8±3.5 -3.3±3.9 -4.3±4.7
Hypertonic Glucose (20%) 4.6±0.6 a b 2.6±1.4 a b -0.7±2.2 -2.7±1.6 -4.6±3.8
Hypertonic Mannitol (20%) 2.6±1.2 a 0.8±1.9 -1.1±1.9 -2.6±2.6 -3.8±3.1
Table 2.Changes in relative blood volume (RBV) compared to the start
of the infusions (t= 10 min.) All values are given as mean standard deviation a =P < 0.05 increase compared to baseline, b =P < 0.05 compared to all other infusions.
.
Relative blood volume
During ultrafiltration, at a rate of 20 ml/kg/hr, RBV fell by 0.13 % in the first 10 minutes in
all patients (Fig 1). A 10-minute infusion at a rate equal to the rate of ultrafiltration prevented
a further decrease in RBV, as RBV at the end of the infusion (t=20) was significantly
different from the control experiment for all solutions infused (Table 2). With infusion of HG
the increase in RBV was significantly greater than the increase observed with all other
infusions (Fig 1, Table 2). Moreover, the time at which RBV reached the same level as the
105
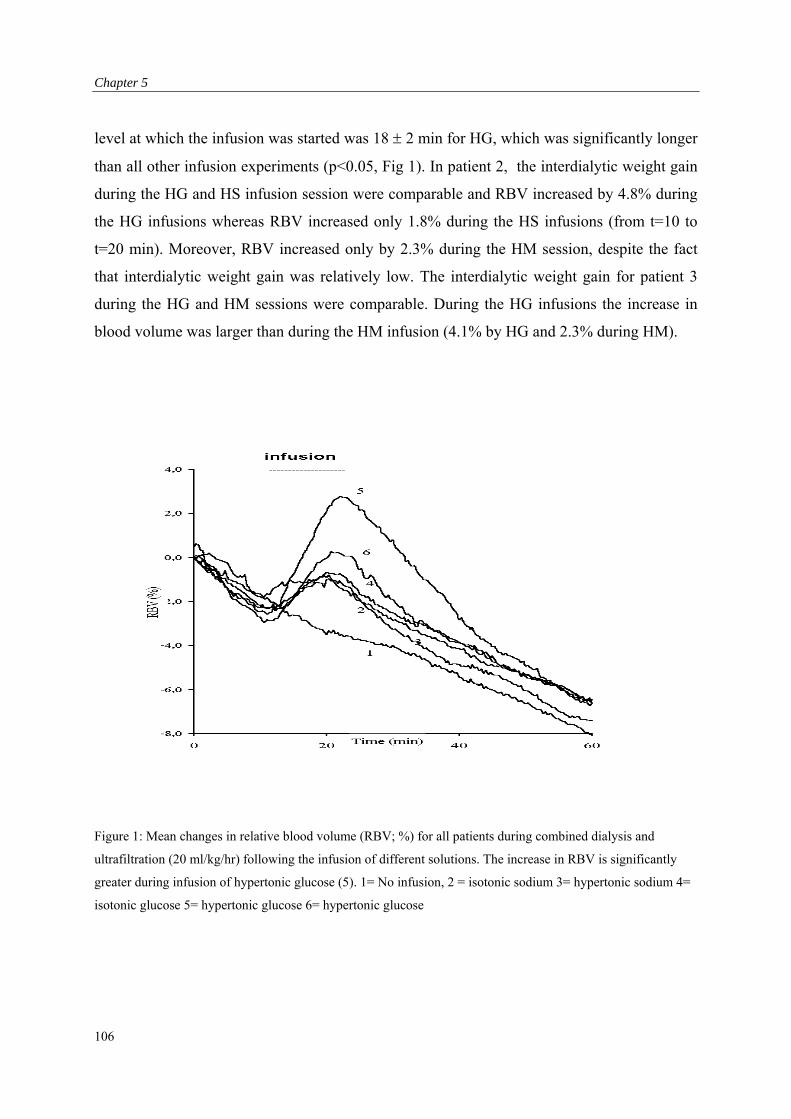
Chapter 5
level at which the infusion was started was 18 2 min for HG, which was significantly longer
than all other infusion experiments (p<0.05, Fig 1). In patient 2, the interdialytic weight gain
during the HG and HS infusion session were comparable and RBV increased by 4.8% during
the HG infusions whereas RBV increased only 1.8% during the HS infusions (from t=10 to
t=20 min). Moreover, RBV increased only by 2.3% during the HM session, despite the fact
that interdialytic weight gain was relatively low. The interdialytic weight gain for patient 3
during the HG and HM sessions were comparable. During the HG infusions the increase in
blood volume was larger than during the HM infusion (4.1% by HG and 2.3% during HM).
Figure 1: Mean changes in relative blood volume (RBV; %) for all patients during combined dialysis and
ultrafiltration (20 ml/kg/hr) following the infusion of different solutions. The increase in RBV is significantly
greater during infusion of hypertonic glucose (5). 1= No infusion, 2 = isotonic sodium 3= hypertonic sodium 4=
isotonic glucose 5= hypertonic glucose 6= hypertonic glucose
106
Effect of Infusions on Relative Blood Volume
Blood pressure, heart rate and stroke volume.
Blood pressure and heart rate remained unchanged during all experiments (Table 3). No IME
events were noted. After infusion of HG blood pressure tended to increase but these changes
did not show statistical significance. No episodes of symptomatic hypotension were noted.
Stroke volume increased and TPR decreased significantly after the HG infusion.
SAP (%) HR (%) SV (%) TPR (%)
No Infusion -0.3 5.0 +2.2 5.6 -6.8 10.6 +9.7 12.6
Isotonic Saline (0.9%) -1.0 3.6 -1.6 3.7 +4.2 13.4 -1.4 14.6
Hypertonic Saline (3%) -0.5 4.8 0.0 2.3 +6.0 23.6 0.0 27.0
Isotonic Glucose (5 %) -1.0 8.1 +3.0 5.0 +6.9 18.4 -1.2 18.2
Hypertonic Glucose (20%) +7.4 10.8 0.4 5.4 +21.0 19.2 a b -15.4 16.4 ab
Hypertonic Mannitol (20%) +1.3 4.5 -3.8 4.1 +9.3 18.0 -6.1 17.6
Table 3: Changes in systolic arterial pressure (SAP, %) heart rate (HR, %), stroke volume (SV, %), and
total peripheral resistance (TPR, %) between beginning (t=10) and end (t=20) of the infusion period. All
values are given as mean ± standard deviation. a =P < 0.05 compared to baseline. b =P < 0.05 compared to no
infusions
Laboratory parameters
At baseline no differences in serum urea, glucose, sodium, potassium, and osmolarity were
found between the various infusion experiments (27.9 6.8 mmol/l, 6.7 1.7 mmol/l, 137
2.9 meq/l, 5.370.72 meq/l, and 3078 mOsmol/l respectively). After one hour of dialysis,
serum urea concentration was decreased by a similar extent in all experiments (Table 4). Not
surprisingly, serum sodium increased significantly after HS (from 137 ± 2.9 to 140.3 ± 3.0
meq/L; p<0.05) and sodium decreased after the HM compared to the most other solutes (136
±2.5 to 135 ±2.0 meq/l). Serum potassium was lowered significantly during all experiments.
The decrease was significantly greater after HG compared to NI, HM and IS experiments (5.4
± 0.7 to 4.1 ± 0.6 meq/l; p<0.05). Glucose increased significantly after HG infusion only
(6.3± 0.9 to 8.2 ±1.2 mmol/L; p<0.05). Plasma osmolarity decreased during NI and IG and
tended to decrease in all infusion experiments, but this decrease did not reach statistical
significance.
107
Chapter 5
Urea Na+ K+ Glucose Osmol
(mmol/l) (mmol/l) (mmol/l) (mmol/l) (mosmol/l)
No Infusion -11.9 6.5 a 2.53.2 -0.85 0.29 a -1.35 2.02 -10.4 5.8 a
Isotonic Saline (0.9%) -11.5 7.9 a 2.84.8 -0.83 0.41 a -1.12 1.31 -3.8 9.5
Hypertonic Saline (3%) -11.0 5.3 a 3.0 1.1 a -0.95 0.11 a -1.07 0.83 a -5.8 7.0
Isotonic Glucose (5%) -9.4 2.4 a 1.32.0 -0.98 0.26 a -0.13 1.18 b -8.2 7.2 a
Hypertonic Glucose (20%) -10.1 3.4 a 0.51.8 -1.30 0.57 abce 1.93 1.22 a f -6.9 7.4
Hypertonic Mannitol (20%) -7.7 1.4 a -1.21.5 bcd -0.86 0.40 a -0.17 1.18 -2.2 5.0
Table 4: Changes in laboratory parameters between the start of the dialysis session (t=0) and one hour of dialysis
(t=60). All values are given as mean ± standard deviation. a =P < 0.05 compared to baseline
b =P < 0.05 compared to no infusions c =P < 0.05 compared to isotonic saline, d =P < 0.05 compared to
hypertonic saline e =P < 0.05 compared to mannitol, f =P < 0.05 compared to all other infusions.
Discussion:
The results of our study demonstrate that during hemodialysis with ultrafiltration, infusion of
hypertonic glucose solution (20%) results in a greater preservation of RBV than isovolumetric
infusions of either normotonic or hypertonic saline or mannitol. Compared to the other
infusion experiments, the increased RBV during hypertonic glucose infusion was associated
with an increase in stroke volume and a decrease in vascular resistance. In our study, the
finding that infusion of hypertonic glucose is more effective in increasing RBV than infusion
of mannitol 20% is remarkable. Van der Sande et al. [14] compared colloids, such as albumin
and or hydroxyethylstarch (HES) with saline and found a much greater increase in blood
volume and blood pressure after the infusion of colloids. These differences were attributed to
an increase in oncotic pressure during the colloid infusions. However, comparing the osmotic
agents used in our study, mannitol closely resembles glucose in that it has the same molecular
mass and charge and both solutions do not increase the oncotic pressure. Unlike glucose,
which is rapidly transported from the extracellular to the intracellular space by insulin,
mannitol is slowly eliminated from plasma [15,16]. Thus compared to infusion of mannitol,
infusion of glucose is associated with a shorter lasting increase in plasma osmolarity. Indeed,
in the present study, osmolarity, 40 minutes after infusions were discontinued, tended to be
108
Effect of Infusions on Relative Blood Volume
slightly higher after administration of mannitol than after administration of glucose. As
changes in osmolarity, hence oncotic pressure, do not provide an explanation for the greater
increase in RBV after infusion of hypertonic glucose, it is tempting to speculate that glucose-
induced vasodilatation accounts for the observed increase in RBV. Compared to other
infusions or no infusion at all, infusion of hypertonic glucose was associated with a
vasodilator response reflected by a decrease in vascular resistance and an increase in stroke
volume. One could argue that the changes in electrolyte composition of the plasma induced by
the sudden infusion of hypertonic salt or water directly affect impedance and might cause
errors in the estimation of stroke volume and the subsequent calculation of vascular
resistance. However, this change will not alter the magnitude of the peak value, as a
correction for the baseline impedance is made. Therefore we don’t expect problems with the
adequacy of the impedance cardiography. Moreover, hypertonic glucose infusion will give a
much higher electrical resistance than the infusion of hypertonic saline, which is an
electrically active compound. As electrical resistance is inversely related to impedance and
stroke volume, changes in stroke volume during hypertonic glucose infusion would be
underestimated and those during saline would be overestimated. It has been shown that
infusion of hypertonic glucose, but not of normotonic glucose or hypertonic mannitol into the
brachial artery, is associated with a forearm vasodilator response [17]. A Study using
vasodilator agents demonstrated that vasodilatation is associated with an increase in plasma
volume without a concomitant increase in body weight, indicating that redistribution of the
extracellular volume between the intravascular and extravascular compartments underlies this
increase in plasma volume [18]. Recruitment of capillaries leading to an expansion of the
vascular area could explain the vasodilatation- induced increase in RBV. Such a mechanism
would be especially favorable for the action of glucose, as it can increase the disposal of
glucose to the intracellular compartment [19].
It is uncertain whether the observed increase in RBV is of clinical benefit, as a change in
peripheral resistance could induce a change in the critical value of blood volume at which
IME occurs. The relatively small increase in blood volume during hypertonic sodium infusion
could therefore lead to a more effective RBV and cardiac filling pressure. Previous studies
showed that hypertonic saline infusion during hypotension is effective in raising blood
pressure and cardiac filling pressure [5.6]. A dissociation between blood volume and vascular
109
Chapter 5
tone would also change the algorithms for those clinical settings, in which RBV
measurements are performed with a feed back control in order to prevent IME
We conclude that infusion of hypertonic glucose during dialysis results in a greater increase in
RBV than equal volumes of other solutions. As mannitol has the same osmolarity, molecule
mass and charge, the greater increase in RBV following hypertonic glucose appears to be a
specific effect, possibly related to a decline in vascular tone. It is therefore uncertain whether
the observed increase in RBV will be of clinical benefit during IME.
110
Effect of Infusions on Relative Blood Volume
References
1. Daugirdas JT. Dialysis hypotension: A hemodynamic analysis. Kidney Int 1991;39:233-246.
2. Steuer RR, Leypoldt JK, Cheung AK, Harris DH, Conis JM. Hematocrit as an indicator of
blood volume and a predictor of intradialytic morbid events. ASAIO J 1994; 40:M691-696.
3. Kooman JP, Gladziwa U, Bőcker G, van Bortel LMAB, van Hooff JP, Leunissen KML. Roleof
the venous system in hemodynamics during ultrafiltration and bicarbonate dialysis. Kidney Int
1992; 42:718-726.
4. Kouw PM, Olthof CG, Gruteke P, et al. Influence of high and low sodium dialysis on blood
volume preservation. Nephrol Dial Transplant 1991;6:876-80.
5. Kinet JP, Balland N, Soyeur D, Collignon P, Godon JP. Pathophysiology and treatment of acute
hypotension occurring during hemodialysis. Néphrologie 1981;2:77-80.
6. Gong R, Lindberg J, Abrams J, Whitaker WR, Wade CE, Gouge S. Comparison of
hypertonicsaline solutions and dextran in dialysis induced hypotension. J Am Soc Nephrol
1993;3:1808-1812
7. Wilkinson R, Barber SG, Robson V. Cramps, thirst and hypertension in hemodialysis patients.
The influence of dialyzate sodium concentration. Clin Nephrol 1977;7:101-10.
8. Krepel HP, Nette RW, Akçahüseyin E, Weimar W, Zietse R. Variability of relative blood
volume during hemodialysis. Nephrol Dial Transplant 2000; 15:673-679
9. Cherieux EC, Leunissen KML, Kouw P, Kooman JP, et al. New techniques to determine fluid
status in hemodialyzed patients. Kidney Int 1993;43: S50-56.
10. Johner C, Chamney PW, Schneditz D, Kramer M. Evaluation of an ultrasonic blood volume
monitor. Nephrol Dial Transplant 1998;13:2098-2103.
11. Handt A, Farber MO, Szwed JJ. Intradialytic measurement of cardiac output by thermodilution
and impedance cardiography. Clin Nephrol 1977;7:61-64.
12. Mehlsen J, Bonde J, Stadeager C, Rehling M, Tango M, Trap Jensen J. Reliability of impedance
cardiography in measuring central hemodynamics. Clin Physiol 1991;11:579-588.
13. Bernstein DP. A new stroke volume equation for thoracic electrical bioimpedance: Theory and
rationale. Crit Care Med 1986;14:904-909.
14. Van der Sande FM, Kooman JP, Barendregt JNM, Nieman FHM, Leunissen KML. Effect of
intravenous saline, albumin or hydroxyethylstarch on blood volume during combined
ultrafiltration and hemodialysis. J Am Soc Nephrol 1999;10:1303-1308.
15. Nau R. Osmotherapy for elevated intracranial pressure: a critical reappraisal. Clin
Pharmacokinet 2000;38:23-40.
111
Chapter 5
112
16. Khalaf AN, Kerp L, Petersen KG: Osmotic stress due to changes in plasma glucose and its
regulation in IDDM. Horm Metab Res 1992;24:375-378.
17. Van Veen S, Frolich M, Chang PC. Acute hyperglycemia in the forearm induces vasodilatation
that is not modified by hyperinsulinemia. J of Human Hypertension 1999;13:263-268.
18. Wysocki M, Andersson OK, Persson B, Bagge U, Braide M. Hemorheologic effects of
vasodilatation in essential hypertension. Angiology 1996;42:869-878.
19. Baron AD, Steinberg H, Brechtel G, Johnson A. Skeletal muscle blood flow independently
modulates insulin-mediated glucose uptake. Am J Physiol 1994;266:E248-E25.
Pathophysiology of Hemodialysis-Related Hypotension
Chapter 6: Hypotension during Hemodialysis Results From an Impairment of
Arteriolar Tone and Left Ventricular Function.
113
Chapter 6
Abstract
Hypotensive episodes are a major complication of hemodialysis. Hypotension during dialysis
could be directly related to a reduction in blood volume or to a decrease in cardiovascular
activation as a response to decreased cardiac filling. A decreased cardiovascular activation
could be due to patient-related or to dialysis-related factors. In order to study the isolated
effect of a reduction in filling pressure, lower body negative pressure (LBNP) causes
activation of the cardiovascular reactivity with a decrease in cardiac filling, but without the
influence of the dialysis procedure that could affect cardiovascular reactivity.
We studied the relationship between Relative Blood Volume (RBV), Central Venous Pressure
(CVP), Systolic Arterial Pressure, Heart Rate, Stroke volume Index (SI), and Total Peripheral
Resistance Index (TPRI) during a combined dialysis/ ultrafiltration and during LBNP to –40
mmHg in 21 hemodialysis patients with a high incidence of hypotension. Systolic arterial
pressure, heart rate, SI, and TPRI were measured by Finapres. CVP was measured after
cannulation of the jugular vein. During dialysis RBV was measured by a blood volume
monitor (BVM). In order to study the conditions in which hypotension occurred after the
dialysis, we divided the patients into two groups: Hypotensive (H) and non-Hypotensive (NH)
during dialysis.
Baseline levels did not show any significant differences. During dialysis systolic arterial
pressure declined gradually in the H group from 30 minutes before the onset of hypotension.
There was a similar decrease of RBV and increase of heart rate in both groups with a large
inter-individual variation. At hypotension, H patients showed a significantly smaller increase
in TPRI, as compared to NH patients. The reduction in SI tended to be greater at hypotension,
while CVP decreased to a similar extent in both groups.
Moreover, during LBNP, a similar reduction in CVP resulted in a much smaller decrease in
SI.
Systolic arterial pressure was only slightly lowered due to a much greater increase in TPRI.
We conclude that dialysis related hypotension in our patient group did not result from an
inability to maintain blood volume or from decreased cardiac filling. Hypotension appeared to
result from the inability to adequately increase arteriolar tone and a reduction in left
ventricular function.
114
Pathophysiology of Hemodialysis-Related Hypotension
Both vascular tone and left ventricular function appeared to be impaired by the dialysis
procedure.
Introduction
Hypotensive episodes are a major complication of hemodialysis [1]. Hypovolemia resulting in
a decrease in preload has been implicated as a major causative factor. Hypovolemia results
from fluid withdrawal from the intravascular space during ultrafiltration and inadequate
refilling from the extravascular space [2]. Whether hypovolemia leads to hypotension is
dependent on the increase in systemic vascular resistance and maintenance of cardiac output.
In response to the decrease in filling pressure adequate cardiac filling and stroke volume (SV)
will especially depend on the diastolic function of the left ventricle (LV). Dialysis related
hypotension is generally believed to have a multifactorial genesis, involving patient related
factors such as sympathetic responsiveness [3], cardiac function [4], age [5] as well as dialysis
associated factors such as body heating, [6,7], release of vasodilator agents [8,9], osmolar [10]
and electrolyte changes [11].
We studied the relationship between Relative Blood Volume (RBV), Central Venous Pressure
(CVP), Stroke volume Index (SI), Heart Rate, Systolic Arterial Pressure, and Total Peripheral
Resistance Index (TPRI) during combined dialysis/ ultrafiltration in 21 hemodialysis patients
with a high incidence of hypotension. Depending on the blood pressure response during the
dialysis session after the dialysis the patients were divided into two groups; those that became
hypotensive during dialysis (H) and those that did not (non-hypotensive; NH). However,
given the multifactorial genesis, it is difficult to study the contribution of separate factors
within the setting of hemodialysis.
The application of negative pressure to the lower part of the body can be used to decrease
venous return, thereby simulating hypovolemia. In order to study the isolated effect of a
reduction in filling pressure, we compared the hemodynamic circumstances under which
hypotension occurred during dialysis with the response to Lower Body Negative Pressure
(LBNP) in H patients. During LBNP, we measured the same parameters except for relative
blood volume. Moreover, LBNP was performed under identical conditions at the same
hydration status.
115
Chapter 6
Methods
Twenty-one patients on chronic hemodialysis with a high incidence of hypotension during
dialysis (i.e more than 30 % of their sessions) were studied during a combined
dialysis/ultrafiltration session and a LBNP session. The LBNP sessions were performed on
the same day as the dialysis session. Following LBNP, patients were allowed to rest for 60
minutes but refrained from fluid intake before the start of dialysis. The ethical committee of
the Erasmus Medical Centre Rotterdam had approved the study, and all participants had given
written informed consent.
Dialysis procedure
The dialysis procedure was performed with the procedure generally used at our institution,
using bicarbonate dialysate (32 mmol/L) and a sodium concentration of 138 mmol/L
(Fresenius SK-F213, Fresenius AG, Bad Homburg, Germany) and a temperature of of 37 ºC.
The dialysate contained lesser than 50 CFU/ml water and the limulus amoebycyte lysate test
was negative. Fresenius 4008H hemodialysis monitors and biocompatible hemophane (MA-
12; Kawasumi, Tokyo, Japan) or polysulphone (F-60S; Fresenius MC, Bad Homburg,
Germany) hemodialyzers were used to perform the treatments. Blood and dialysate flow rates
were 200 ml/min and 500 ml/min respectively. All patients were ultrafiltrated with a constant
ultrafiltration rate until dry weight in a 4-hour session. Inferior caval vein measurements were
done at intervals of one month and dry weight was adjusted accordingly. Dry weight was
considered optimal when patients remained without symptoms of dyspnea or edema during
the interdialytic period. Overhydration was defined as a caval vein diameter of more than 11.4
and underhydration as a caval vein diameter of less than 8-mm/m2 body surface area [12,13].
All patients remained supine starting 30 minutes before being connected to the dialysis circuit
until the end of the treatment. No intravenous infusions were given during the treatment and
intake of fluids and food was withheld during treatment, unless hypotension occurred.
Hypotension was defined as a decline in systolic arterial blood pressure by more than 30 %.
116
Pathophysiology of Hemodialysis-Related Hypotension
LBNP procedure
During the LBNP procedure, the patients were placed in a box up to the iliac crest, and an
airtight connection was attached to the patient’s waist. Evacuating air from the box created a
lower body negative pressure. After an equilibration period, LBNP of –20 mmHg was applied
for 15 minutes. LBNP was subsequently increased to –40 mmHg for 15 minutes.
Measurements were taken at the end of each 15 minutes of LBNP.
Measurements
During the LBNP and combined dialysis/ultrafiltration sessions systolic arterial pressure and
heart rate were measured continuously by the Finapres device (Ohmeda 2300, Englewood,
CO), using the middle finger of the nonfistula arm. This apparatus measures the blood volume
under an infrared plethysmograph. When blood volume is kept constant at a set point value by
controlling the cuff pressure, Systolic arterial pressure and heart rate can be calculated from
these changes in cuff pressure. This method has been validated in many studies against
invasive blood pressure measurements [14]. Changes in stroke volume and total peripheral
resistance were derived on a beat-to-beat basis from the pulse pressure curve of the Finapres
and computed by the Modelflow program (TNO, Amsterdam, the Netherlands) [15]. These
parameters have been validated even in patients with shock [16]. However, for highest
accuracy and precision a calibration of the model parameters is required [14]. Therefore,
before the Finapres measurements were started, all patients underwent an echocardiographic
measurement of stroke volume to calibrate the model. The volume of the left ventricle was
calculated from the apical two- and four chamber views using a modification of Simpson’s
rule [17]. The principle of Simpson’s rule is to divide the left ventricle into known slices of
thickness. The volume of the ventricle is then equal to the sum of the volume of the slices.
The endocardial borders of these views were digitally traced at end diastole and end systole.
Stroke volume was calculated as the difference between end-diastolic and end-systolic
volume. Measurement of CVP was performed continuously with a small bore catheter with a
diameter of 0.6 mm, which was inserted in the right jugular vein using the Seldinger
technique.
117
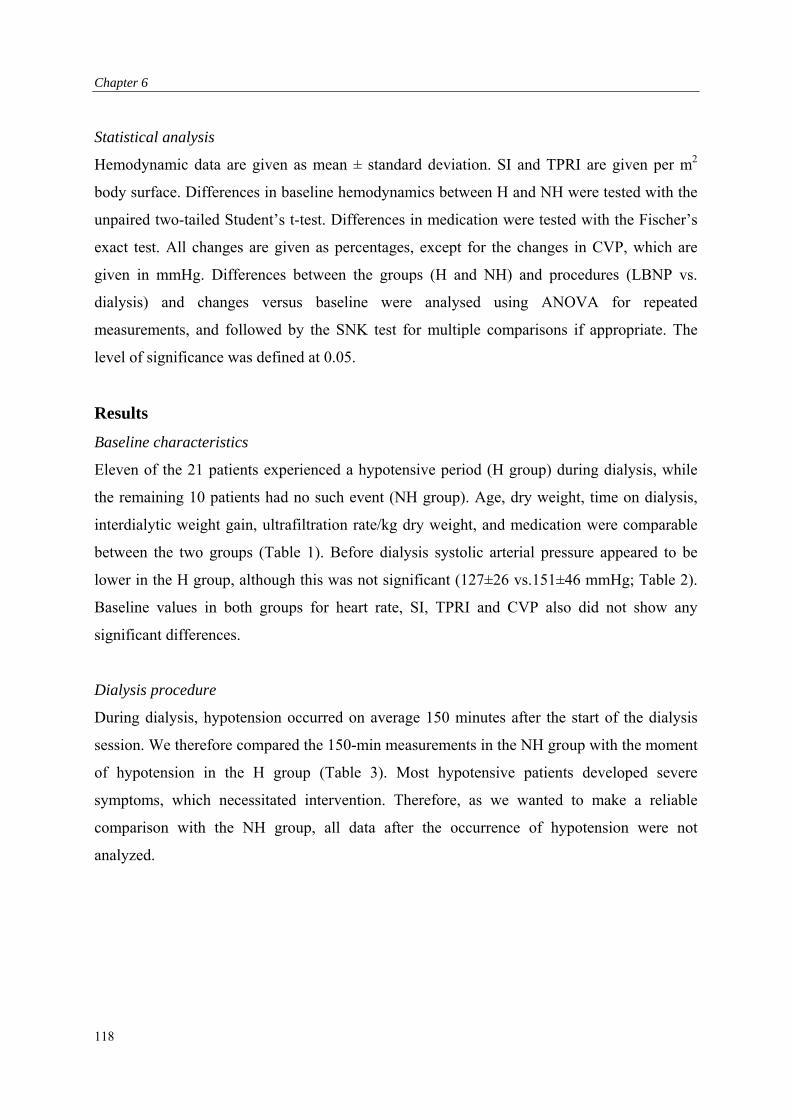
Chapter 6
Statistical analysis
Hemodynamic data are given as mean ± standard deviation. SI and TPRI are given per m2
body surface. Differences in baseline hemodynamics between H and NH were tested with the
unpaired two-tailed Student’s t-test. Differences in medication were tested with the Fischer’s
exact test. All changes are given as percentages, except for the changes in CVP, which are
given in mmHg. Differences between the groups (H and NH) and procedures (LBNP vs.
dialysis) and changes versus baseline were analysed using ANOVA for repeated
measurements, and followed by the SNK test for multiple comparisons if appropriate. The
level of significance was defined at 0.05.
Results
Baseline characteristics
Eleven of the 21 patients experienced a hypotensive period (H group) during dialysis, while
the remaining 10 patients had no such event (NH group). Age, dry weight, time on dialysis,
interdialytic weight gain, ultrafiltration rate/kg dry weight, and medication were comparable
between the two groups (Table 1). Before dialysis systolic arterial pressure appeared to be
lower in the H group, although this was not significant (127±26 vs.151±46 mmHg; Table 2).
Baseline values in both groups for heart rate, SI, TPRI and CVP also did not show any
significant differences.
Dialysis procedure
During dialysis, hypotension occurred on average 150 minutes after the start of the dialysis
session. We therefore compared the 150-min measurements in the NH group with the moment
of hypotension in the H group (Table 3). Most hypotensive patients developed severe
symptoms, which necessitated intervention. Therefore, as we wanted to make a reliable
comparison with the NH group, all data after the occurrence of hypotension were not
analyzed.
118
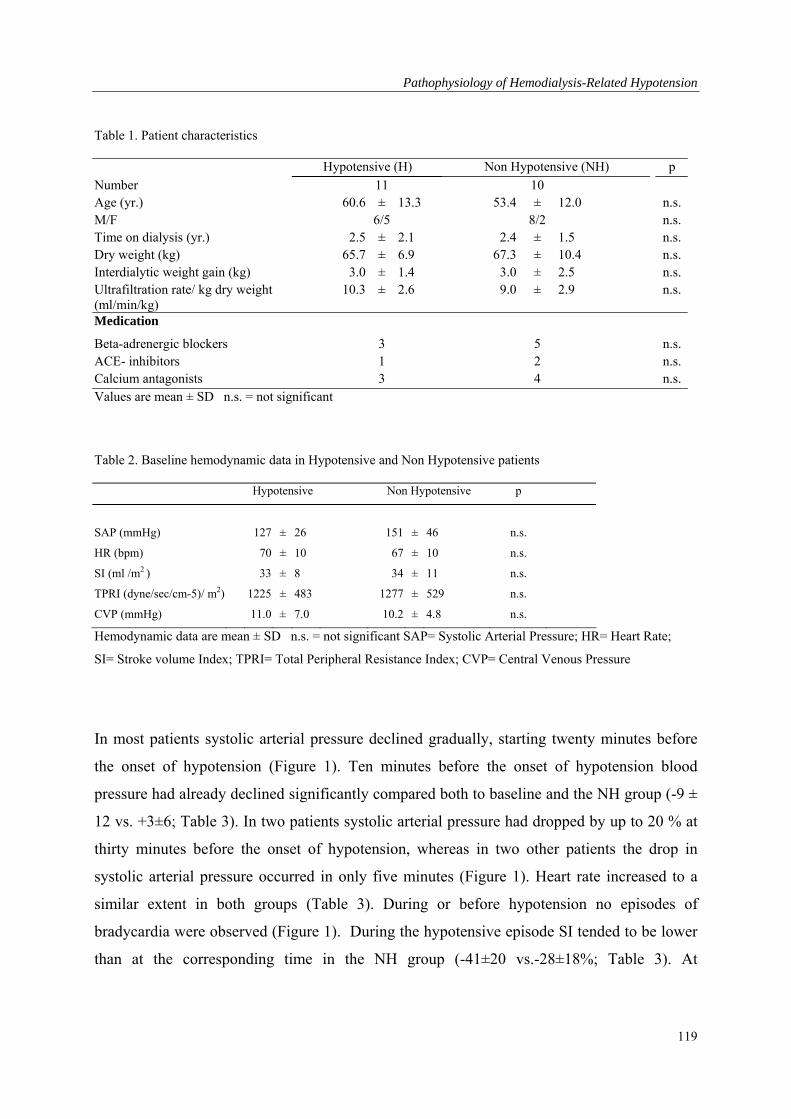
Pathophysiology of Hemodialysis-Related Hypotension
Table 1. Patient characteristics
Hypotensive (H) Non Hypotensive (NH) p
Number 11 10 Age (yr.) 60.6 ± 13.3 53.4 ± 12.0 n.s. M/F 6/5 8/2 n.s. Time on dialysis (yr.) 2.5 ± 2.1 2.4 ± 1.5 n.s. Dry weight (kg) 65.7 ± 6.9 67.3 ± 10.4 n.s. Interdialytic weight gain (kg) 3.0 ± 1.4 3.0 ± 2.5 n.s. Ultrafiltration rate/ kg dry weight (ml/min/kg)
10.3 ± 2.6 9.0 ± 2.9 n.s.
Medication
Beta-adrenergic blockers 3 5 n.s. ACE- inhibitors 1 2 n.s. Calcium antagonists 3 4 n.s. Values are mean ± SD n.s. = not significant
Table 2. Baseline hemodynamic data in Hypotensive and Non Hypotensive patients
Hypotensive Non Hypotensive p
SAP (mmHg) 127 ± 26 151 ± 46 n.s.
HR (bpm) 70 ± 10 67 ± 10 n.s.
SI (ml /m2 ) 33 ± 8 34 ± 11 n.s.
TPRI (dyne/sec/cm-5)/ m2) 1225 ± 483 1277 ± 529 n.s.
CVP (mmHg) 11.0 ± 7.0 10.2 ± 4.8 n.s.
Hemodynamic data are mean ± SD n.s. = not significant SAP= Systolic Arterial Pressure; HR= Heart Rate;
SI= Stroke volume Index; TPRI= Total Peripheral Resistance Index; CVP= Central Venous Pressure
In most patients systolic arterial pressure declined gradually, starting twenty minutes before
the onset of hypotension (Figure 1). Ten minutes before the onset of hypotension blood
pressure had already declined significantly compared both to baseline and the NH group (-9 ±
12 vs. +3±6; Table 3). In two patients systolic arterial pressure had dropped by up to 20 % at
thirty minutes before the onset of hypotension, whereas in two other patients the drop in
systolic arterial pressure occurred in only five minutes (Figure 1). Heart rate increased to a
similar extent in both groups (Table 3). During or before hypotension no episodes of
bradycardia were observed (Figure 1). During the hypotensive episode SI tended to be lower
than at the corresponding time in the NH group (-41±20 vs.-28±18%; Table 3). At
119
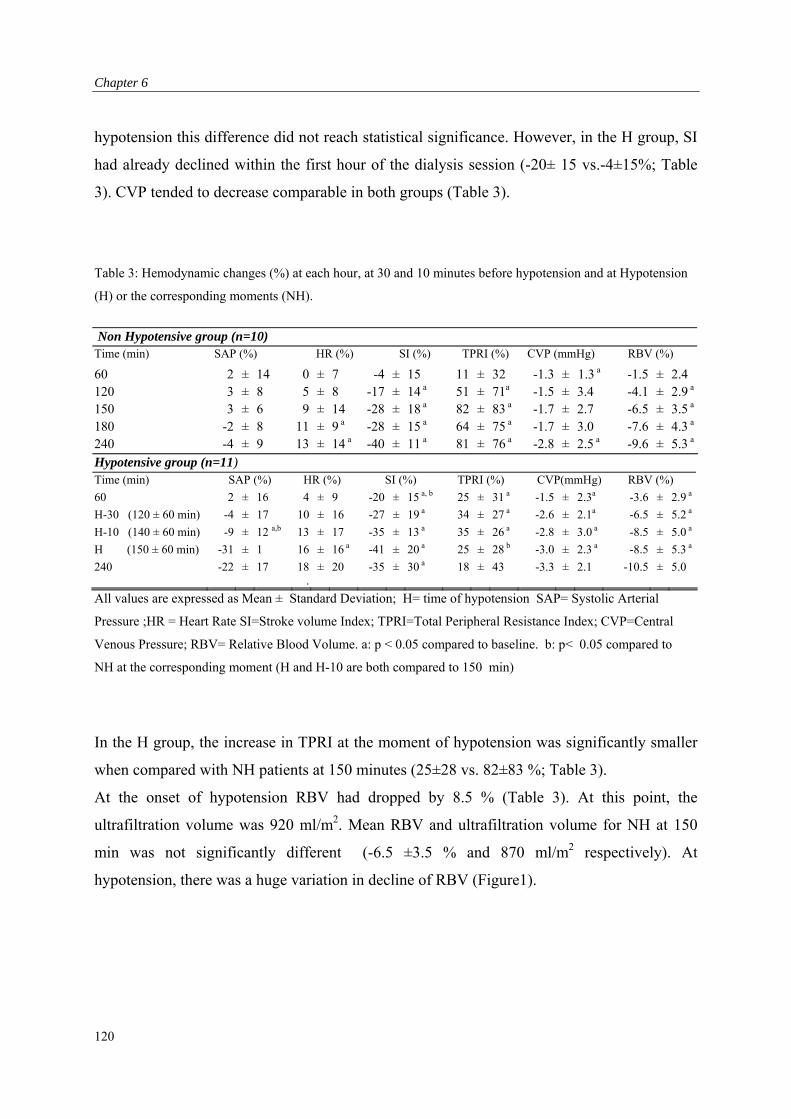
Chapter 6
hypotension this difference did not reach statistical significance. However, in the H group, SI
had already declined within the first hour of the dialysis session (-20± 15 vs.-4±15%; Table
3). CVP tended to decrease comparable in both groups (Table 3).
Table 3: Hemodynamic changes (%) at each hour, at 30 and 10 minutes before hypotension and at Hypotension
(H) or the corresponding moments (NH).
Non Hypotensive group (n=10) Time (min) SAP (%) HR (%) SI (%) TPRI (%) CVP (mmHg) RBV (%)
60 2 ± 14 0 ± 7 -4 ± 15 11 ± 32 -1.3 ± 1.3 a -1.5 ± 2.4 120 3 ± 8 5 ± 8 -17 ± 14 a 51 ± 71a -1.5 ± 3.4 -4.1 ± 2.9 a
150 3 ± 6 9 ± 14 -28 ± 18 a 82 ± 83 a -1.7 ± 2.7 -6.5 ± 3.5 a
180 -2 ± 8 11 ± 9 a -28 ± 15 a 64 ± 75 a -1.7 ± 3.0 -7.6 ± 4.3 a
240 -4 ± 9 13 ± 14 a -40 ± 11 a 81 ± 76 a -2.8 ± 2.5 a -9.6 ± 5.3 a
Hypotensive group (n=11)
Time (min) SAP (%) HR (%) SI (%) TPRI (%) CVP(mmHg) RBV (%)
60 2 ± 16 4 ± 9 -20 ± 15 a, b 25 ± 31 a -1.5 ± 2.3a -3.6 ± 2.9 a
H-30 (120 ± 60 min) -4 ± 17 10 ± 16 -27 ± 19 a 34 ± 27 a -2.6 ± 2.1a -6.5 ± 5.2 a
H-10 (140 ± 60 min) -9 ± 12 a,b 13 ± 17 -35 ± 13 a 35 ± 26 a -2.8 ± 3.0 a -8.5 ± 5.0 a
H (150 ± 60 min) -31 ± 1 16 ± 16 a -41 ± 20 a 25 ± 28 b -3.0 ± 2.3 a -8.5 ± 5.3 a
240 -22 ± 17 18.
± 20 -35 ± 30 a 18 ± 43 -3.3 ± 2.1 -10.5 ± 5.0
All values are expressed as Mean ± Standard Deviation; H= time of hypotension SAP= Systolic Arterial
Pressure ;HR = Heart Rate SI=Stroke volume Index; TPRI=Total Peripheral Resistance Index; CVP=Central
Venous Pressure; RBV= Relative Blood Volume. a: p < 0.05 compared to baseline. b: p< 0.05 compared to
NH at the corresponding moment (H and H-10 are both compared to 150 min)
In the H group, the increase in TPRI at the moment of hypotension was significantly smaller
when compared with NH patients at 150 minutes (25±28 vs. 82±83 %; Table 3).
At the onset of hypotension RBV had dropped by 8.5 % (Table 3). At this point, the
ultrafiltration volume was 920 ml/m2. Mean RBV and ultrafiltration volume for NH at 150
min was not significantly different (-6.5 ±3.5 % and 870 ml/m2 respectively). At
hypotension, there was a huge variation in decline of RBV (Figure1).
120
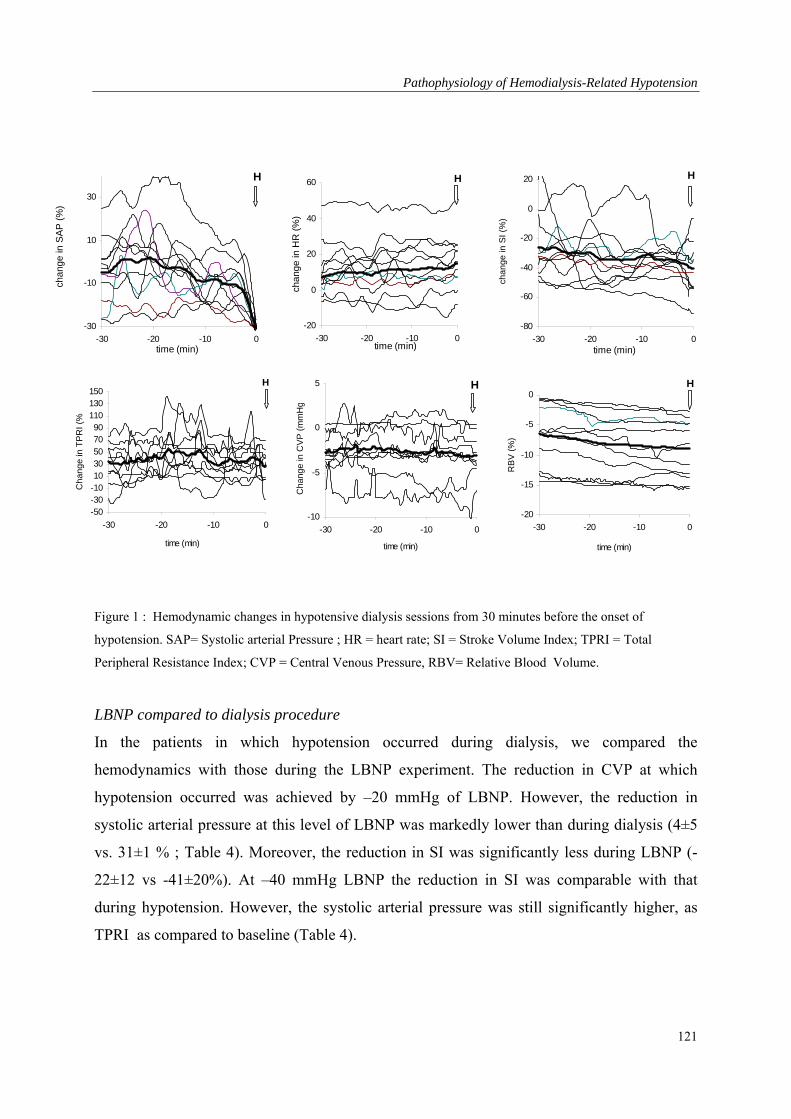
Pathophysiology of Hemodialysis-Related Hypotension
-30
-10
10
30
-30 -20 -10 0time (min)
chan
ge in
SA
P (
%)
H
-20
0
20
40
60
-30 -20 -10 0time (min)
chan
ge in
HR
(%
)
H
-80
-60
-40
-20
0
20
-30 -20 -10 0time (min)
cha
ng
e in
SI
(%)
H
-50-30-101030507090
110130150
-30 -20 -10 0
time (min)
Ch
an
ge
in T
PR
I (%
H
-10
-5
0
5
-30 -20 -10 0
time (min)
Ch
an
ge
in C
VP
(m
mH
g
H
-20
-15
-10
-5
0
-30 -20 -10 0
time (min)
RB
V (
%)
H
Figure 1 : Hemodynamic changes in hypotensive dialysis sessions from 30 minutes before the onset of
hypotension. SAP= Systolic arterial Pressure ; HR = heart rate; SI = Stroke Volume Index; TPRI = Total
Peripheral Resistance Index; CVP = Central Venous Pressure, RBV= Relative Blood Volume.
LBNP compared to dialysis procedure
In the patients in which hypotension occurred during dialysis, we compared the
hemodynamics with those during the LBNP experiment. The reduction in CVP at which
hypotension occurred was achieved by –20 mmHg of LBNP. However, the reduction in
systolic arterial pressure at this level of LBNP was markedly lower than during dialysis (4±5
vs. 31±1 % ; Table 4). Moreover, the reduction in SI was significantly less during LBNP (-
22±12 vs -41±20%). At –40 mmHg LBNP the reduction in SI was comparable with that
during hypotension. However, the systolic arterial pressure was still significantly higher, as
TPRI as compared to baseline (Table 4).
121
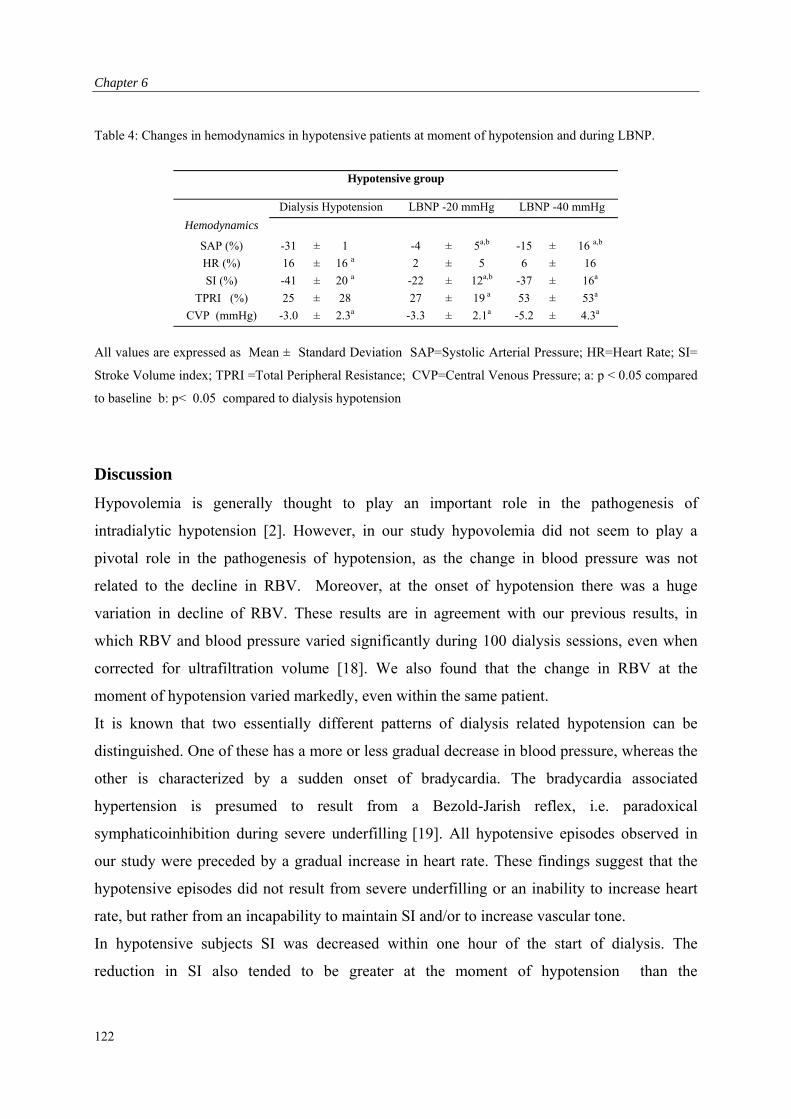
Chapter 6
Table 4: Changes in hemodynamics in hypotensive patients at moment of hypotension and during LBNP.
Hypotensive group
Dialysis Hypotension LBNP -20 mmHg LBNP -40 mmHg
Hemodynamics
SAP (%) -31 ± 1 -4 ± 5a,b -15 ± 16 a,b
HR (%) 16 ± 16 a 2 ± 5 6 ± 16
SI (%) -41 ± 20 a -22 ± 12a,b -37 ± 16a
TPRI (%) 25 ± 28 27 ± 19 a 53 ± 53a
CVP (mmHg) -3.0 ± 2.3a -3.3 ± 2.1a -5.2 ± 4.3a
All values are expressed as Mean ± Standard Deviation SAP=Systolic Arterial Pressure; HR=Heart Rate; SI=
Stroke Volume index; TPRI =Total Peripheral Resistance; CVP=Central Venous Pressure; a: p < 0.05 compared
to baseline b: p< 0.05 compared to dialysis hypotension
Discussion
Hypovolemia is generally thought to play an important role in the pathogenesis of
intradialytic hypotension [2]. However, in our study hypovolemia did not seem to play a
pivotal role in the pathogenesis of hypotension, as the change in blood pressure was not
related to the decline in RBV. Moreover, at the onset of hypotension there was a huge
variation in decline of RBV. These results are in agreement with our previous results, in
which RBV and blood pressure varied significantly during 100 dialysis sessions, even when
corrected for ultrafiltration volume [18]. We also found that the change in RBV at the
moment of hypotension varied markedly, even within the same patient.
It is known that two essentially different patterns of dialysis related hypotension can be
distinguished. One of these has a more or less gradual decrease in blood pressure, whereas the
other is characterized by a sudden onset of bradycardia. The bradycardia associated
hypertension is presumed to result from a Bezold-Jarish reflex, i.e. paradoxical
symphaticoinhibition during severe underfilling [19]. All hypotensive episodes observed in
our study were preceded by a gradual increase in heart rate. These findings suggest that the
hypotensive episodes did not result from severe underfilling or an inability to increase heart
rate, but rather from an incapability to maintain SI and/or to increase vascular tone.
In hypotensive subjects SI was decreased within one hour of the start of dialysis. The
reduction in SI also tended to be greater at the moment of hypotension than the
122
Pathophysiology of Hemodialysis-Related Hypotension
corresponding moment in the non-hypotensive patients. This reduction in SI occurred at a
similar reduction in filling pressure, as estimated by CVP. Moreover, when the hypotensive
patients were subjected to LBNP, a similar reduction in CVP resulted in a much smaller
decrease in SI. Thus the inability to maintain cardiac output appears to be related to the
dialysis procedure.
Dialysis may impair either systolic or diastolic left ventricular function. We previously
observed a decreased myocardial contractile reserve in hypotension prone patients [20].
Further, previous studies have shown that the dialysis procedure appears to interfere with the
systolic left ventricular function [10,11]. However, there is evidence to suggest that increases
in cardiac inotropy are not very important during hypovolemic conditions [21,22].
Alternatively diastolic function, can be reduced by the reduction in filling pressure, as a
decreased pressure difference between left atrium and ventricle results into a reduced early
left ventricular filling [23]. Moreover, diastolic dysfunction during dialysis has been
suggested to result from shifts in ionized calcium [24]. Decreased availability of calcium to
the myocardium could impair both myocardial contraction and relaxation. Diastolic
dysfunction is a complex process that may also be influenced by ventricular interaction.
The observed episodes of hypotension may also have resulted from the inability to adequately
increase vascular tone. The increase in vascular resistance at hypotension in the H group, was
smaller than the corresponding time in the NH group. During LBNP, the hypotensive subjects
were able to increase arteriolar tone and thereby maintain blood pressure despite a similar fall
in SI. Therefore, the dialysis procedure appears to interfere with arteriolar tone.
An inadequate increase in arteriolar tone during dialysis is either due to decreased
sympathetic activation or to decreased vascular responsiveness. Many previous studies
showed that dialysis normally stimulates sympathetic nerve activity during gradual
hypotension [25, 26]. On the other hand, it has also been suggested that sympathetic function
detoriates during dialysis as plasma norepinephrine levels do not rise appropriately. [27].
Analysis with heart rate variability with spectral analysis also failed to show an increase in
sympathetic tone during hemodialysis in hypotensive patients [3,28].
The dialysis sessions in our study lasted for four hours. It is possible that prolonging the
dialysis session, as described in the Tassin study, would have resulted in an improved blood
pressure profiles during hemodialysis [29].
123
Chapter 6
A decreased vascular response during dialysis could result from a positive thermal balance,
due to an inability to dissipate the excess of heat [6,7]. Further, a change in the Nitric Oxide–
Endothelin–1 balance as a result of mechanical and chemical stimuli may also be involved in
the pathogenesis of dialysis induced hypotension [8,9]. Other dialysis related factors that
could cause an impaired vascular response include changes in plasma sodium, potassium, acid
base composition and use of anti hypertensive drugs [21].
As the decrease in CVP was comparable in both groups, a decrease in venous tone was
unlikely responsible for the occurrence of the hypotensive episodes in our study. This is in
agreement with previous study that showed a decreased venoconstriction in stable sessions as
well [30,31].
We conclude that dialysis related hypotension in our patient group did not result from an
inability to maintain blood volume or from decreased cardiac filling. Hypotension appeared to
result from the inability to adequately increase arteriolar tone and a reduction in left
ventricular function. Both vascular tone and left ventricular function appeared to be impaired
by the dialysis procedure.
124
Pathophysiology of Hemodialysis-Related Hypotension
References
1. Henrich WL: Hemodynamic instability during hemodialysis. Kidney Int 1986;30:605-612.
2. Mitra S, Chamney P, Greenwood R, Farrington K: Linear decay in relative blood volume during
ultrafiltration predicts hemodynamic instability. Am J Kidney Dis 2002;40:556-565.
3. Pelosi G, Emdin M, Carpeggiani C, Morales MA, Piacenti M, Dattolo P, Cerrai T, Macerata
AL, Abbate A, Maggiore Q: Impaired sympathetic response before intra dialytic hypotension: a
study based on spectral analysis of heart rate and pressure variability. Cli Sci 1999;96:23-31.
4. London GM: Left ventricular alterations and end-stage renal disease. Nephrol Dial Transplant
2002;17:S29-36.
5. Tisler A, Akocsi K, Harshegyi I, Varga G, Ferenczi S, Grosz M, Kulcsar I, Locsey L, Samik J,
Solt I, Szegedi J, Toth E, Wagner G, Kiss I. Comparison of dialysis and clinical characteristics
of patients with frequent and occasional hemodialysis-associated hypotension. Kidney Blood
Press Res 2002;25:97-102.
6. Leunissen KML, Kooman JP, van der Sande FM, van Kuijk WHM: Hypotension and
ultrafiltration physiology in dialysis. Blood Purif 2000;18:251-254.
7. Maggiore Q, Pizzarelli F, Sisca S, Zocalli C, Parlongo S, Nicolo F, Creazzo G: Blood
temperature and vascular stability during hemodialysis and hemofiltration. Trans Am Soc Artif
Organs 1982;28:523-527.
8. Erkan E , Devarajan P, Kaskel F: Role of nitric oxide, endothelin –1, and inflammatory
cytokines in blood pressure regulation in hemodialysis patients. Am J Kidney Dis 2002:40:76-
81.
9. Raj DSC, Vincent B, Simpson K, Sato E, Jones KL, Welbourne TC, Levi M, Shah V, Blandon
P, Zager P, Robbins RA: Hemodynamic changes during hemodialysis: Role of nitric oxide and
endothelin. Kidney Int 2002;61:697-704.
10. Henrich WL, Woodard TD, Blachely JD, Gomez-sanchez C, Pettinger W, Cronin RE: Role of
osmolarity in blood pressure stability after dialysis and ultrafiltration. Kidney Int 1980;18:480-
488.
11. van Kuijk WHM, Mulder AW, Peels CH, Harff GA, Leunissen KML: Influences of changes in
ionized calcium on cardiovascular reactivity during hemodialysis. Clin Nephrol 1997;47:190-
196.
12. Cheriex EC, Leunissen KML, Janssen JH, Mooy JM, van Hooff JP: Echocardiography of the
inferior vena cava is a simple and reliable tool for estimation dry weight in haemodialysis
patients. Nephrol Dial Transplant 1989;4:563-568.
125
Chapter 6
13. Leunissen KML, Kouw P, Kooman JP, Cheriex EC, de Vries PM, Donker AJ, van Hooff JP
New techniques to determine fluid status in hemodialyzed patients. Kidney Int 1993;43:50-56.
14. Bos JWJ, Imholz BPM, van Goudoever J, Wesseling KH, van Montfrans GA: The reliability of
non invasive continuous finger blood pressure measurement in patients with both hypertension
and vascular disease. Am J Hypertens 1995;5:529-535.
15. Toorop GP, Westerhof N, Elzinga G: Beat to beat estimation of peripheral resistance and
arterial compliance during pressure transients. Am J physiol 1987;252:H1275-H1283.
16. Jellema WT, Wesseling KH, Groeneveld ABJ, Stoutenbeek CP, Thijs LG, van Lieshout JJ:
Continuous cardiac output in septic shock by simulating a model of the aortic input impedance.
Anesthesiology 1999;90:1317-1328.
17. Schiller NB, Shah PM, Crawford M, DeMaria A, Devereux R, Feigenbaum H, Gutgesell H,
Reichek N, Sahn D, Schnittger I: Recommendations for quantitation of left ventricle by two-
dimensional echocardiography. J Am Soc Echocardiogr 1989;2:58-362.
18. Krepel HP, Nette RW, Akcahuseyin E, Weimar W, Zietse R: Variability of relative blood
volume during hemodialysis. Nephrol Dial Transplant 2000;15:673-679.
19. Zocalli C, Tripepi G, Mallamaci F, Pannucio V: The heart rate response pattern to dialysis
hypotension in hemodialysis patients. Nephrol Dial Transplant 1997;12:519-523.
20. Poldermans D, Man in’t Veld AJ, AJM, Rambaldi R, Bax JJ, Roelandt J, Weimar W, Zietse
R: Cardiac evaluation in hypotension prone and hypotension resistant hemodialysis patients.
Kidney Int 1999;56:1905-1911.
21. Daugirdas JT: Dialysis hypotension: a hemodynamic analysis. Kidney Int 1991;39:233-246.
22. Daugirdas JT: Pathophysiology of Dialysis hypotension: an update Am J Kidney Dis 2001;38
:S11-S17.
23. Choong CY, Herrmann HC Weyman AE, Fifer MA: Preload dependence of doppler derived
indexes of left ventricular diastolic function in humans. J Am Coll Cardiol 1987;10:800-808.
24. Rozich JD, Smith B, Thomas JD, Zile MR, Kaiser J, Mann DL: Dialysis induced alterations in
left ventricular filling: mechanisms and clinical significance Am J Kid Dis 1991;17:277-285.
25. Barnas MGW, Boer WH, Koomans HA: Hemodynamic patterns and spectral analysis of heart
rate variability during dialysis hypotension. JASN 1999;10:577-2584.
26. Ligtenberg G, Blankestijn PJ, Boomsma F, Koomans HA: No change in autonomic function
tests during uncomplicated haemodialysis. Nephrol Dial Transplant 1996;11:651-656.
27. Baldamus CA, Ernst W, Frei U, Koch KM: Sympathetic and hemodynamic response to Volume
removal during different forms of renal replacement therapy. Nephron 1982;31:324-332.
126
Pathophysiology of Hemodialysis-Related Hypotension
28. Enzmann G, Bianco F, Paolini F, Panzetta G: Autonomic nervous function and blood volume
monitoring during hemodialysis. Int J Artif Organs 1995;18:504-508.
29. Katzarski KS, Charra B, Luik AJ, NisellJ, Divino Filho JC, Leypoldt JK, Leunissen KML,
Laurent G, Bergstrom J: Fluid state and blood pressure control in patients treated with long and
short haemodialysis. Nephrol Dial Transplant 1999;14:369-375.
30. Kooman JP, Gladziwa U, Bocker G, van Bortell LMAB, van Hooff JP, Leunissen KML: Role
of the venous system in hemodynamics during ultrafiltration and bicarbonate dialysis. Kidney
Int 1992;42:718-726.
31. Bradley JR Evans DB, Gore SM, Cowley AJ: Is dialysis hypotension caused by an abnormality
of venous tone? BMJ 1988;296:1634-1637.
127

Chapter 6
128
Effect of Vasoconstriction on Relative Blood Volume
Chapter 7: Norepinephrine-Induced Vasoconstriction Results in Decreased
Blood Volume.
129
Chapter 7
Abstract
Hypotension during hemodialysis is due to an inadequate cardiovascular response to
ultrafiltration induced hypovolemia. In some studies, it is suggested that plasma volume
could decrease by vasoconstriction, whereas several other studies in non dialysis patients
observed a decrease in plasma volume. We studied the effect of norepinephrine induced
vasoconstriction, compared to no infusion, on Relative Blood Volume in six dialysis patients.
During the infusion we measured RBV, blood pressure, Stroke Volume Index, Ejection
Fraction , Heart Rate, and body temperature.
At baseline, both groups were comparable. At the end of infusion or at the comparable
moment, no significant change in SI (-4 ± 21 vs 0 ± 8 %), HR (-5 ± 19 vs –4 ± 5%), EF (7 ±
14 versus –2 ± 10%) and CI (-10 ± 21 versus –3 ± 6%), and T body (0 ± 2 versus –1 ± 1 %)
were observed. However, a significant increase in SAP (27 ± 12 vs 0 ± 8 %; p<0.01) and
TPRI (47 ± 47 versus 4 ± 17%; p<0.01) was found. This decrease was concomitant with a
significant decrease in RBV (-9±.3 vs. 0±1 % p<0.01).
We conclude that a norepinephrine induced increase in total peripheral resistance results in a
decrease in RBV. This indicates that the improved hemodynamic stability during
hemodialysis through vasoconstriction can be accompanied by a decrease in RBV, and part of
the variability in blood volume may be due to changes in arterial tone.
Introduction
Hypotension is a major complication during hemodialysis (HD) [1]. Decreased plasma
volume preservation, due to the fluid withdrawal from the intravascular space and a delay in
plasma refilling by ultrafiltration, combined with inadequate compensatory vasoconstriction
are directly responsible for this phenomenon [2,3]. The Relative Blood Volume (RBV) can be
derived from the measured percentual changes in total protein concentration. Blood volume
monitoring (BVM) enables us to measure the relative changes in blood volume (RBV)
continuously during hemodialysis in the arterial bloodline [4]. It has been thought that an
increase in peripheral arterial resistance during dialysis can increase venous return by means
of the DeJagher-Krogh phenomenon [5,6,7]. This implies that when arterial resistance is
increased, flow and intra-capillary pressure are reduced and vascular refilling is increased.
Moreover, due to passive recoil, venous capacity is decreased and sequestered blood is
130
Effect of Vasoconstriction on Relative Blood Volume
translocated back to the heart. Consequently it is suggested that arterial vasoconstriction
increases RBV [8-10].
However, evidence for a positive correlation between changes in plasma volume and
peripheral resistance has never been found. Evenmore, there is evidence suggesting an
inverse relationship. In non-dialysis patients plasma volume decreased as a result of an
adrenergically induced vasoconstriction. [11-14]. Moreover, both during diffusive dialysis
and glucose infusion, procedures in which vascular resistance is decreased, we observed a
concomitant increase in RBV [15,16]. Dialysis, using a lower dialysate temperature, increases
peripheral resistance but decreases RBV [17].
In order to clarify the relationship between vascular resistance and plasma volume, we studied
the effect of norepinephrine induced vasoconstriction, compared to no infusion, on RBV in
six dialysis patients. During the infusion we measured RBV, Blood Pressure, Stroke Volume
Index, Ejection Fraction , Heart Rate, and Body Temperature.
Material and methods
Patients
We studied six patients requiring chronic hemodialysis. None of the patients had severe
valvular heart disease, heart failure (>NYHA class I) or arrhythmia’s. All medication was
stopped on the day of the investigation. In the patients using ß blockers, this medication was
withdrawn the day before the experiment. The ethical review committee of our hospital
approved the study and written informed consent was obtained from all patients.
Study design
Each patient was studied during two dialysis sessions, which were performed on the same day
of the week. On arrival, the patients were weighted and were placed in a dialysis chair, where
they rested for 30 min (t= -30). During the study, the patients remained supine and no food or
beverages were provided throughout the experiment. The patients were connected to the
extracorporeal circuit (Fresenius 4008H machines with Fresenius F60-S polysulphone
artificial kidneys and BVM/BTM arterial and venous lines; Fresenius MC Bad Homburg;
Germany). During connection to the dialysis circuit, the priming volume of saline was
discarded. At the start of this procedure blood was drawn from the access for laboratory
131
Chapter 7
measurements. Blood flow was set at 250 ml/min. Neither diffusive dialysis nor ultrafiltration
was performed throughout the investigation. After being connected to the dialysis circuit
RBV, Systolic, diastolic and mean arterial blood pressures (SAP, DAP, MAP) and heart rate
(HR) were measured continuously throughout the experiment. At the start of the experiment
(t=0), echocardiography was performed to obtain Stroke Volume, and Ejection Fraction.
Directly after these measurements (t=0 min), either Norepinephrine (Nor) was infused or a
control experiment was performed in which no infusion was given (Cont). Nor was given at
an initial dose of 0.02 g/kg/min I.V. This was increased with 0.03 g/kg/min each 5 minutes
until after 20 minutes a maximum dose of 0.14 g/kg/min was reached or until systolic blood
pressure was raised by more than 30%. The infusions and control experiments were
performed in random order and the patient was blinded to the infusion. Ten and thirty minutes
(t=10 and t=30) after the start of the Nor, or at the comparable moments for the Cont
experiments, a second and a third echographic measuments were done. Moreover,
temperature measurements were performed. After these measurements the study was ended.
For safety reasons dialysis was started at least 10 minutes after the infusion was discontinued.
Measurements
RBV was measured continuously throughout the experiment by means of a blood volume
monitor (BVM, Fresenius, Bad Homburg, Germany). The blood volume monitor measures
the total protein concentration in the arterial bloodline, which is the sum of hemoglobin and
plasma proteins in the vascular space. Changes in total protein concentration during dialysis
are used to estimate changes in plasma volume. This method has a very good agreement with
a standard reference method involving calculation of RBV from serial measurements of
hemoglobin levels (SD 1.7%, r > 0.96) and allows precise and reliable measurement of RBV
[4]. Systolic, diastolic and mean arterial blood pressures (SAP, DAP, MAP) and heart rate
(HR) were measured continuously throughout the experiment by the Finapres device
(Ohmeda 2300, Englewood, CO), using the middle finger of the nonfistula arm. This
apparatus measures the blood volume under an infrared plethysmograph. When blood volume
is kept constant at a set point value by controlling the cuff pressure, SAP and HR can be
calculated from these changes in cuff pressure. This method has been validated in many
studies against invasive blood pressure measurements [18]. Echocardiograms were obtained
132
Effect of Vasoconstriction on Relative Blood Volume
using a ultrasound machine (Sonos 5500, Hewlett Packard Medical products, Boston, MA).
The volume of the left ventricle was calculated from a two dimensional parasternal view.
Endocardial borders of these views were digitally traced at the end of systole and diastole and
their volume was calculated. Stroke volume was calculated as the difference between end-
diastolic and end-systolic volume. A mean stroke volume of five consecutive beats was taken.
Stroke Volume Index (SI) was calculated from stroke volume and body surface area, which
was calculated from length and height, according the Dubois formula [19]. Directly after each
ultrasonography, SAP, DAP and MAP were also measured by an oscillometric device
(Accutor 3, Datascope Co., Paramus, NJ). Body Temperature (Tbody) was measured by an ear
thermometer after each ultrasonography. Total peripheral resistance index (TPRI) was
calculated from MAP, measured by datascope, and cardiac index (CI).
Statistical analysis
Hemodynamic data are given as mean ± standard deviation. Differences during the
experiments and between groups were tested with the Analysis of Variance with repeated
measurements. If significant multiple comparisons were made using the Student Neuman
Keuls test. The Graphpad Prism software program was used to perform these calculations. A
p-value of less than 0.05 was assumed to indicate statistical significance.
Results
Patients
Six hemodialysis patients, five male and one female participated in the study (Median time on
dialysis 2.6 years, range 1.5- 4 years; Table 1). The median age of the subjects was 53 11
years (range; 35-62 years: Table 1). Median residual diuresis was 252 mL/ 24 hr (range 0-950
mL/ 24 hr ml; Table 1). Three patients had a residual diuresis of less than 5 mL/day, while the
other three had a rest diuresis of 500 mL/liter or more. One patient with diabetes was
included, and two patients were hypertensive. Mean dry weight was 70.6 ± 12.9 kg and
interdialytic weight gain was comparable in the two sessions (3.6 ± 1.4 kg versus 3.6 ± 2.3 kg;
n.s.; Table 1).
133
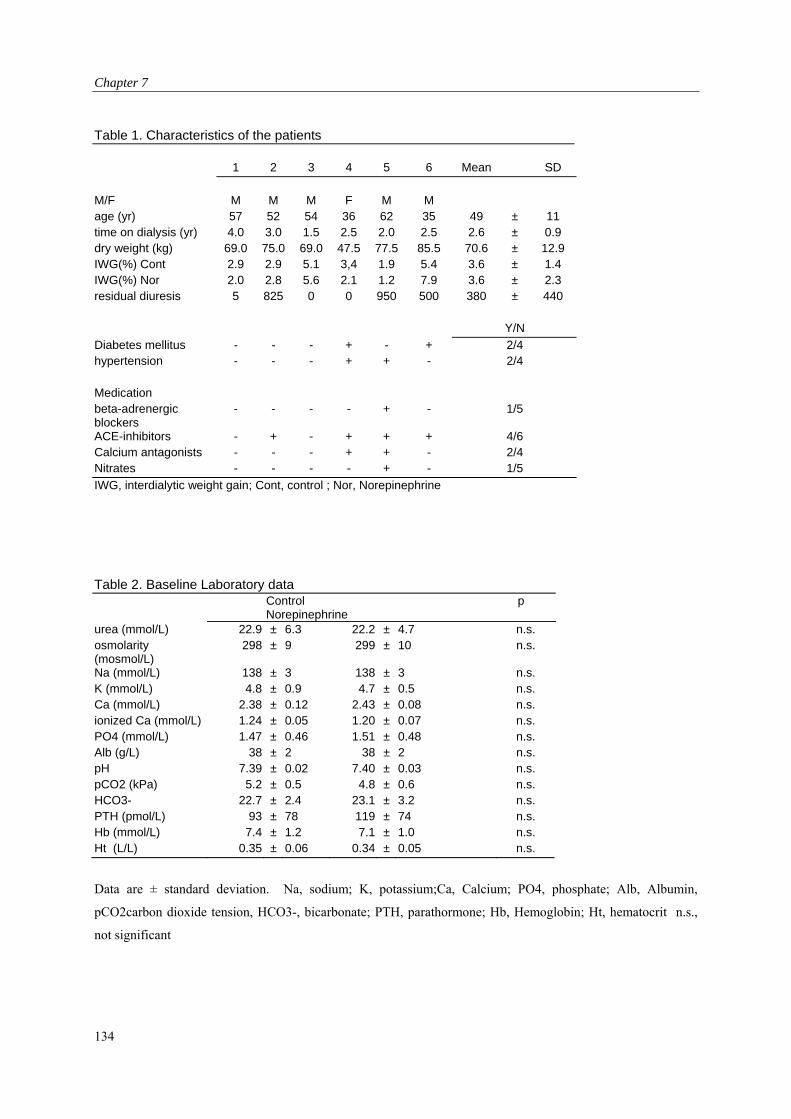
Chapter 7
Table 1. Characteristics of the patients
1 2 3 4 5 6 Mean SD
M/F M M M F M M age (yr) 57 52 54 36 62 35 49 ± 11 time on dialysis (yr) 4.0 3.0 1.5 2.5 2.0 2.5 2.6 ± 0.9 dry weight (kg) 69.0 75.0 69.0 47.5 77.5 85.5 70.6 ± 12.9 IWG(%) Cont 2.9 2.9 5.1 3,4 1.9 5.4 3.6 ± 1.4 IWG(%) Nor 2.0 2.8 5.6 2.1 1.2 7.9 3.6 ± 2.3 residual diuresis 5 825 0 0 950 500 380 ± 440 Y/N
Diabetes mellitus - - - + - + 2/4 hypertension - - - + + - 2/4 Medication beta-adrenergic blockers
- - - - + - 1/5
ACE-inhibitors - + - + + + 4/6 Calcium antagonists - - - + + - 2/4 Nitrates - - - - + - 1/5
IWG, interdialytic weight gain; Cont, control ; Nor, Norepinephrine
Table 2. Baseline Laboratory data
Control Norepinephrine
p
urea (mmol/L) 22.9 ± 6.3 22.2 ± 4.7 n.s. osmolarity (mosmol/L)
298 ± 9 299 ± 10 n.s.
Na (mmol/L) 138 ± 3 138 ± 3 n.s. K (mmol/L) 4.8 ± 0.9 4.7 ± 0.5 n.s. Ca (mmol/L) 2.38 ± 0.12 2.43 ± 0.08 n.s. ionized Ca (mmol/L) 1.24 ± 0.05 1.20 ± 0.07 n.s. PO4 (mmol/L) 1.47 ± 0.46 1.51 ± 0.48 n.s. Alb (g/L) 38 ± 2 38 ± 2 n.s. pH 7.39 ± 0.02 7.40 ± 0.03 n.s. pCO2 (kPa) 5.2 ± 0.5 4.8 ± 0.6 n.s. HCO3- 22.7 ± 2.4 23.1 ± 3.2 n.s. PTH (pmol/L) 93 ± 78 119 ± 74 n.s. Hb (mmol/L) 7.4 ± 1.2 7.1 ± 1.0 n.s. Ht (L/L) 0.35 ± 0.06 0.34 ± 0.05 n.s.
Data are ± standard deviation. Na, sodium; K, potassium;Ca, Calcium; PO4, phosphate; Alb, Albumin,
pCO2carbon dioxide tension, HCO3-, bicarbonate; PTH, parathormone; Hb, Hemoglobin; Ht, hematocrit n.s.,
not significant
134
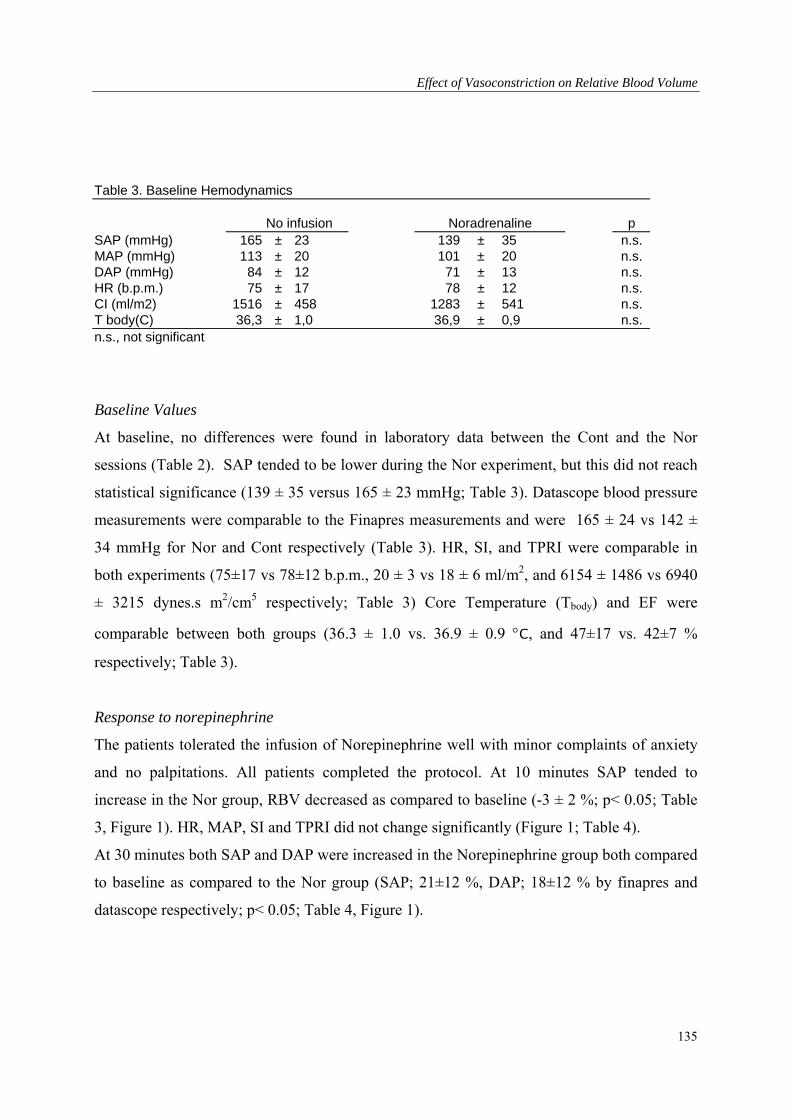
Effect of Vasoconstriction on Relative Blood Volume
Table 3. Baseline Hemodynamics
No infusion Noradrenaline p SAP (mmHg) 165 ± 23 139 ± 35 n.s. MAP (mmHg) 113 ± 20 101 ± 20 n.s. DAP (mmHg) 84 ± 12 71 ± 13 n.s. HR (b.p.m.) 75 ± 17 78 ± 12 n.s. CI (ml/m2) 1516 ± 458 1283 ± 541 n.s. T body(C) 36,3 ± 1,0 36,9 ± 0,9 n.s. n.s., not significant
Baseline Values
At baseline, no differences were found in laboratory data between the Cont and the Nor
sessions (Table 2). SAP tended to be lower during the Nor experiment, but this did not reach
statistical significance (139 ± 35 versus 165 ± 23 mmHg; Table 3). Datascope blood pressure
measurements were comparable to the Finapres measurements and were 165 ± 24 vs 142 ±
34 mmHg for Nor and Cont respectively (Table 3). HR, SI, and TPRI were comparable in
both experiments (75±17 vs 78±12 b.p.m., 20 ± 3 vs 18 ± 6 ml/m2, and 6154 ± 1486 vs 6940
± 3215 dynes.s m2/cm5 respectively; Table 3) Core Temperature (Tbody) and EF were
comparable between both groups (36.3 ± 1.0 vs. 36.9 ± 0.9 C, and 47±17 vs. 42±7 %
respectively; Table 3).
Response to norepinephrine
The patients tolerated the infusion of Norepinephrine well with minor complaints of anxiety
and no palpitations. All patients completed the protocol. At 10 minutes SAP tended to
increase in the Nor group, RBV decreased as compared to baseline (-3 ± 2 %; p< 0.05; Table
3, Figure 1). HR, MAP, SI and TPRI did not change significantly (Figure 1; Table 4).
At 30 minutes both SAP and DAP were increased in the Norepinephrine group both compared
to baseline as compared to the Nor group (SAP; 21±12 %, DAP; 18±12 % by finapres and
datascope respectively; p< 0.05; Table 4, Figure 1).
135
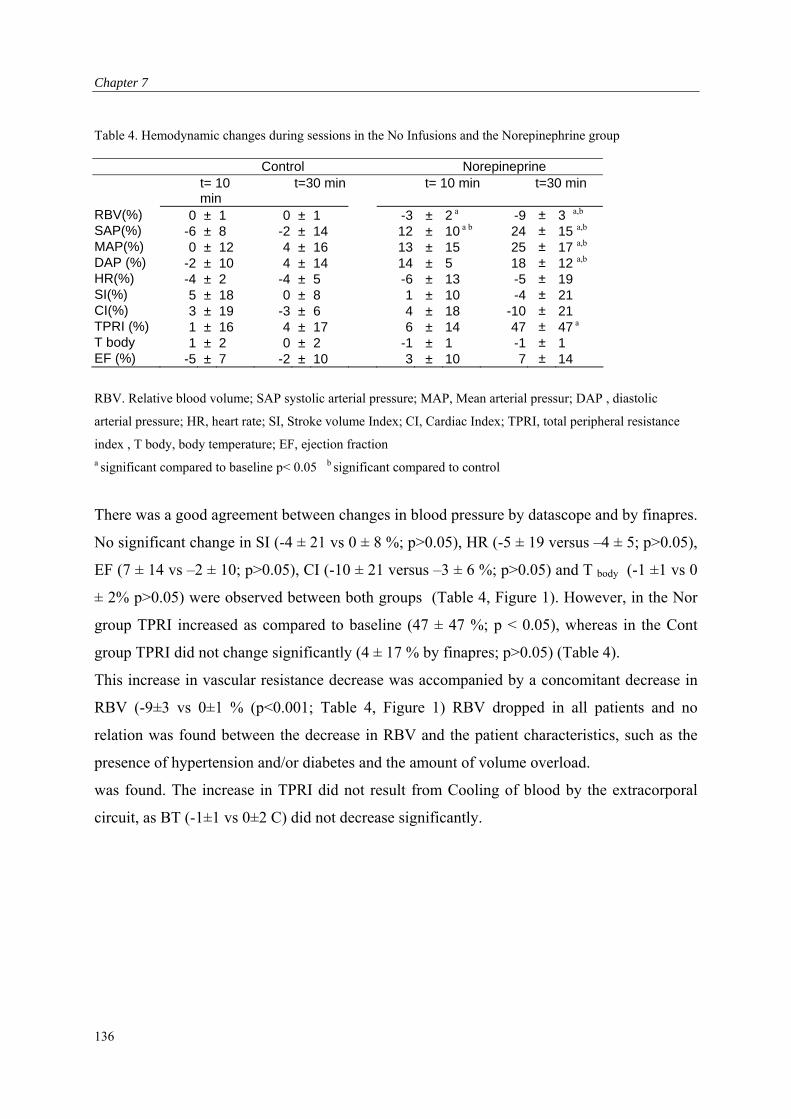
Chapter 7
Table 4. Hemodynamic changes during sessions in the No Infusions and the Norepinephrine group
Control Norepineprine t= 10
min t=30 min t= 10 min t=30 min
RBV(%) 0 ± 1 0 ± 1 -3 ± 2 a -9 ± 3 a,b SAP(%) -6 ± 8 -2 ± 14 12 ± 10 a b 24 ± 15 a,b MAP(%) 0 ± 12 4 ± 16 13 ± 15 25 ± 17 a,b DAP (%) -2 ± 10 4 ± 14 14 ± 5 18 ± 12 a,b HR(%) -4 ± 2 -4 ± 5 -6 ± 13 -5 ± 19 SI(%) 5 ± 18 0 ± 8 1 ± 10 -4 ± 21 CI(%) 3 ± 19 -3 ± 6 4 ± 18 -10 ± 21 TPRI (%) 1 ± 16 4 ± 17 6 ± 14 47 ± 47 a T body 1 ± 2 0 ± 2 -1 ± 1 -1 ± 1 EF (%) -5 ± 7 -2 ± 10 3 ± 10 7 ± 14
RBV. Relative blood volume; SAP systolic arterial pressure; MAP, Mean arterial pressur; DAP , diastolic
arterial pressure; HR, heart rate; SI, Stroke volume Index; CI, Cardiac Index; TPRI, total peripheral resistance
index , T body, body temperature; EF, ejection fraction
a significant compared to baseline p< 0.05 b significant compared to control
There was a good agreement between changes in blood pressure by datascope and by finapres.
No significant change in SI (-4 ± 21 vs 0 ± 8 %; p>0.05), HR (-5 ± 19 versus –4 ± 5; p>0.05),
EF (7 ± 14 vs –2 ± 10; p>0.05), CI (-10 ± 21 versus –3 ± 6 %; p>0.05) and T body (-1 ±1 vs 0
± 2% p>0.05) were observed between both groups (Table 4, Figure 1). However, in the Nor
group TPRI increased as compared to baseline (47 ± 47 %; p < 0.05), whereas in the Cont
group TPRI did not change significantly (4 ± 17 % by finapres; p>0.05) (Table 4).
This increase in vascular resistance decrease was accompanied by a concomitant decrease in
RBV (-9±3 vs 0±1 % (p<0.001; Table 4, Figure 1) RBV dropped in all patients and no
relation was found between the decrease in RBV and the patient characteristics, such as the
presence of hypertension and/or diabetes and the amount of volume overload.
was found. The increase in TPRI did not result from Cooling of blood by the extracorporal
circuit, as BT (-1±1 vs 0±2 C) did not decrease significantly.
136
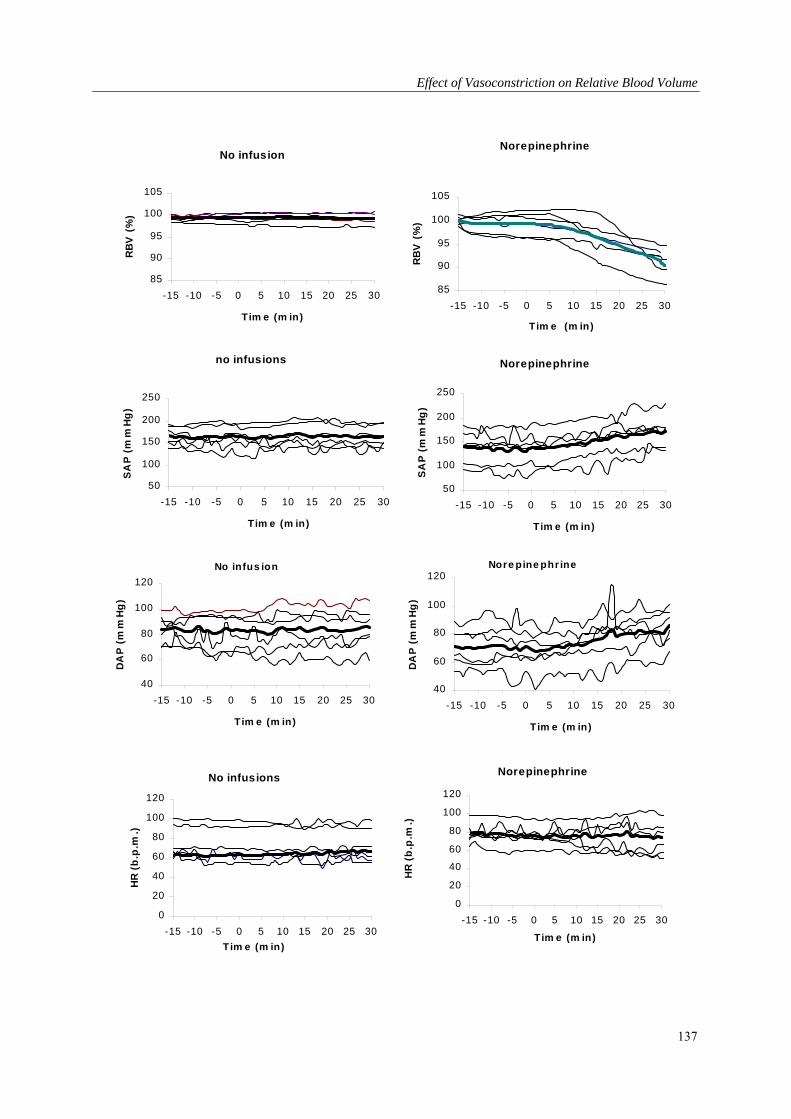
Effect of Vasoconstriction on Relative Blood Volume
No infus ion
40
60
80
100
120
-15 -10 -5 0 5 10 15 20 25 30
Tim e (m in)
DA
P (
mm
Hg
)
Nore pine phr ine
40
60
80
100
120
-15 -10 -5 0 5 10 15 20 25 30
Tim e (m in)
DA
P (
mm
Hg
)
No infusion
85
90
95
100
105
-15 -10 -5 0 5 10 15 20 25 30
Tim e (m in)
RB
V (
%)
Norepinephrine
85
90
95
100
105
-15 -10 -5 0 5 10 15 20 25 30
Tim e (m in)
RB
V (
%)
no infusions
50
100
150
200
250
-15 -10 -5 0 5 10 15 20 25 30
Tim e (m in)
SA
P (
mm
Hg
)
Norepinephrine
50
100
150
200
250
-15 -10 -5 0 5 10 15 20 25 30
Tim e (m in)
SA
P (
mm
Hg
)
No infusions
0
20
40
60
80
100
120
-15 -10 -5 0 5 10 15 20 25 30
Tim e (m in)
HR
(b
.p.m
.)
Norepinephrine
0
20
40
60
80
100
120
-15 -10 -5 0 5 10 15 20 25 30
Tim e (m in)
HR
(b
.p.m
.)
137
Chapter 7
Discussion
This study demonstrates that infusion of norepinephrine in patients on dialysis results in a
direct and substantial decrease in RBV.
The observed decrease in RBV during the norepinephrine infusions can be either due to a
relative increase in the erythrocyte cell mass or to a decrease in the total amount of plasma
fluid.
Erythrocyte cell mass could change during vasocontriction, as the erythrocyte cell mass is not
uniformly mixed and the hematocrit of the peripheral vascular beds is much lower than that of
the large vessels [20,21]. However, it is unlikely that this mechanism could explain the
observed decrease in RBV, as during vasoconstriction, blood with a relatively low eryhrocyte
content is shifted to the large vessels and arterial bloodline, in which RBV is measured. This
would result in an increase in RBV, rather than a decrease.
Erythrocyte cell mass could also be increased by splenic contraction. However, previous
studies showed, that in humans, the spleen does not serve as an important reservoir for red
blood cells over splenic constraction, could only account for an increase of 1-2% [22,23].
Changes in plasma volume can be explained by Starlings law, which determines the fluid shift
between the vascular and the interstitial compartments and depends on changes in hydrostatic
and oncotic capillary pressure and on the filtration coefficient of the capillary basement
membrane [24]. Reduced perfusion of capillary beds during arteriolar constriction leading to a
decrease of the vascular surface area could explain the norepinephrine-induced decline in
RBV. A decrease in perfused vascular beds could also increase hydrostatic capillary pressure
in the remaining vascular beds. This could in turn lead to a decreased vascular refilling and
hence blood volume. However, there is only a slight relation between the change in peripheral
resistance and RBV. This can be explained by the fact that total peripheral resistance is
calculated from blood pressure and cardiac out put. Each of these measurements varies, and
their summed contribution can lead to considerable variability in the calculated TPR. On the
other hand, the constriction of the veins could also contribute to the decrease in RBV. When
vasoconstriction is more pronounced at the venular than at the arteriolar end of the capillaries,
intracapillary hydrostatic pressure will rise, thereby promoting a shift of fluid from the
intravasular to the interstitial compartment [25]. Many previous studies lend evidence that
blood volume increases after a decrease in total peripheral resistance by arterial vasodilatation
138
Effect of Vasoconstriction on Relative Blood Volume
[26-28]. Moreover, the increase in plasma volume after vasodilatation induced by infusion of
an alpha-receptor antagonist, was found to be inversely related to the change in CVP [30].
The results of our study are in accordance with most previous studies in which the effect of
norepinephrine on plasma volume was studied in non dialysis patients or animals [11-14].
In one study, erythrocyte cell mass increased. However, this study was done in dogs in which
the spleen is a far more important red blood cell reservoir [11].
In another study, a norepinephrine-induced increase in peripheral resistance showed no
significant change in plasma volume, although hematocrit was increased in three out of four
patients [13]. This experiment differs from ours in the fact that norepinephrine was given for
six hours, while in our experiment norepinephrine was given for only twenty minutes. It is
known that in response to prolonged norepinephrine infusions the cardiac output increases
and consequently peripheral resistance decreases, due to the release of endogenous
epinephrine [29]. This could diminish the increase in RBV.
The results of our study have major implications for the interpretation of measurements and
the applications of a biofeed back control systems in order to prevent dialysis related
hypotension. When performing maneuvers to improve vascular stability during dialysis, such
as isolated ultrafiltration, or lowering dialysate temperature, RBV decreases and the critical
RBV, at which hypotension occurs, will be lowered [17,30]. This can explain the findings of
Schneditz et al. who describe improved hemodynamic stability, in spite of a greater reduction
in RBV during cold dialysis. Differences in arteriolar tone may also explain the observed
variabilility in RBV during hemodialysis and the difficulties to observe a critical value, at
which hypotension occurs [31]. Conversely, an increase in RBV does not always lead to an
increase in effective plasma volume and cardiac filling pressure. Hypertonic glucose infusions
during dialysis result in a greater increase in RBV than equal volumes of mannitol, which has
the same osmolarity, molecule mass and charge [16].
These difference could be related to a decline in vascular tone during the glucose infusion.
Moreover, during diffusive dialysis, a procedure in which vascular resistance is decreased, we
observed an increase in RBV [15].
We conclude that a norepinephrine induced increase in total peripheral resistance results in a
decrease in RBV. This indicates that the improved hemodynamic stability during
hemodialysis through vasoconstriction can be accompanied by a decrease when n RBV, and
139
Chapter 7
part of the variability in blood volume may be due to changes in arterial tone. Such changes
must be taken into account of RBV measurements are used to improve the hemodynamic
tolerance of dialysis
140
Effect of Vasoconstriction on Relative Blood Volume
References
1. Henrich WL: Hemodynamic instability during hemodialysis. Kidney Int 1986;30: 605-612.
2. Zuchelli P, Santoro A: Dialysis induced hypotension: A fresh look at pathophysiology. Blood
Purif 1993;11:85-98.
3. Fox SD, Henderson LW: Cardiovascular response in hemodynamics during ultrafiltration and
bicarbonate dialysis. Kidney Int 1992;42:718-726.
4. Johner C, Chamney PW, Schneditz D, Kramer M: Evaluation of an ultrasonic blood volume
monitor. Nephrol Dial Transplant 1998;13:2098-2103.
5. de Jager A: Experiments and considerations on hemodynamics. J Physiol 1886;7:130-214.
6. Krogh A: The regulation of the supply of blood to the right heart. Scand Arch Physiol 1912;27:
227-248.
7. Rothe CF: Reflex control of veins and vascular capacitance. Physiol Rev 1983;63:1281-1342.
8. Daugirdas JT: Dialysis hypotension: A hemodynamic analysis. Kidney Int 1991;39:233-246.
9. Daugirdas JT: Pathophysiology of dialysis hypotension: An update. Am J Kidney Dis
2001;38:S11-S17.
10. Straver B, Roggekamp MC, de Vries PMJM, ter Wee PM: Systemic vascular resistance in
intradialytic hypotension determined by means of impedance cardiography. Blood Purif
1998;16:281-289.
11. Weisse AB, Hilmi KI, Regan TJ: Circulatory effects of norepinephrine infusions in intact and
splenectomized dogs. Am J of Physiol 1968; 214: 421-426.
12. Hilsted J, Christensen NJ, Larsen S: Effect of catecholamines and insulin on plasma volume and
intravascular mass of albumin in man. Clin Sci 1989;77: 149-155.
13. Werner M, Bock KD, Brandenburger J, Sack H: Effect of angiotensin and norepinephrine
infusions on total plasma volume and extracellular fluid space in man. Clin Pharmacol Ther
1968;9:162-167.
14. Finnerty FA, Buchholz JH, Guillaudeu RL: The blood volumes and plasma protein during
levaterenol-induced hypertension. J Clin Invest 1958;37: 425-429.
15. Nette RW, Akcahuseyin E, Krepel HP, Weimar W, Zietse R: Increase in blood volume during
ultrafiltration. Blood Purif 2001;19:33-38.
16. Nette RW, Krepel HP, Akcahuseyin E, Weimar W, Zietse R: Specific effect of glucose on
blood volume during haemodialysis. Neprol Dial Transplant 2002;17:1275-1280.
141
Chapter 7
142
17. Schneditz D, Martin K, Kramer T, Skrabal F: Effect of controlled extracorporeal blood cooling
on ultrafiltration induced blood volume changes during hemodialysis. J Am Soc Nephrol
1997;8:956-964.
18. Bos WJW, Imholz BPM, van Goudoever J, Wesseling KH, van Montfrans GA: The reliability
of non invasive continuous finger blood pressure measurement in patients with both
hypertension and vascular disease. Am J Hypertens 1995;5:529-535.
19. Dubois EF: Basal metabolism in health and disease, Philadelphia : Lea and Febiger, 1936
20. Button LN, John G, Gibson I, Walter CW: Simultaneous determination of the volume of red
cells and plasma for survival studies of stored blood. Transfusion 1965;5:143-148.
21. Klitzman B, Duling BR: Microvascular hematocrit and red cell flow in resting and contractile
muscle. Am J Physiol 1979;237:H481-H490.
22. Guyton AC: Textbook of medical physiology 7 th ed. Ch 29: 343, 1986.
23. Kaltreider NL, Meneely GR, Allen JR: The effect of epinephrine on the volume of the blood. J
Clin Invest 1942;21:339-345.
24. Schneditz D, Roob J, Oswald M, Pogglitsch H, Moser M, Kenner T, Binswanger U: Nature and
rate of vascular refilling during hemodialysis and ultrafiltration. Kidney Int 1992; 42:1425-
1433.
25. Cohn JN: Relationship of plasma volume changes to resistance and capacitance of
sympathicomimetic amines and angiotensin in man. Cli Science 1966;30:267.
26. Wysocki M, Andersson OK, Persson B, Bagge U, Braide M: Hemorheologic effects of
vasodilatation in essential hypertension. Angiology 1996;42:869-878.
27. Weil JV, Chidsey CA: Plasma volume expansion resulting from interference with adrenergic
function in normal man. Circulation 1968;37:54-61.
28. Skillmann JJ, Eltringham WK, Zollinger RM Jr, Lauler DP, Moore FD: Phenoxybenzamine-
induced vasodilatation: A stimulus to increased plasma volume with reduced central venous
pressure and aldosterone hypersecretion in man. Surgery 1968;64:368-380.
29. Goldenberg M, Pines KL, Baldwin , Greenne DG, Roh CE: The hemodynamic response of man
to norepinephrine and epinephrine and its relation to the problem of hypertension. Am J of
Medicine 1948;5:792-805.
30. Maggiore Q, Pizzarelli F, Sisca S, Zocalli C, Parlongo S, Nicolo F, Creazzo G: Blood
temperature and vascular stability during hemodialysis and hemofiltration. Trans Am Soc Artif
Organs 1982;28:523-527.
31. Krepel HP, Nette RW, Akcahususeyin E, Weimar W, Zietse R: Variability in Relative blood
volume during hemodialysis. Nephrol Dial Transplant 2000;15:673-679.
LBNP in Hemodialysis Patients
Chapter 8: Hemodynamic response to lower body negative pressure in
hemodialysis patients.
143
Chapter 8
Abstract
Hypovolemia is thought to play an important role in the pathogenesis of dialysis-related
hypotension. We studied the effect of hypovolemia simulated by lower body negative
pressure (LBNP) in 11 hypotension prone (HP) and 11 hypotension resistant (HR)
hemodialysis patients. LBNP was applied step-wise from 0, to -20 to -40 mmHg. Systolic
arterial pressure, heart rate and central venous pressure (CVP) were recorded continuously
after canulation of the right jugular vein. Stroke Volume Index (SI) was measured at each step
echocardiographically. At the end of each level of LBNP, blood samples were taken for
norepinephrine (NE), epinephrine (E) and atrial natriuretic peptide (ANP) levels. At baseline,
CVP (12±5 and 16±7 mmHg), heart rate (72±9 and 70±13 bpm), Cardiac index (2.3±0.6 and
2.5±0.9 l/min), NE (median ,341 pg/mL [range, 198 to 789 pg/mL], and 365 pg/mL [range,
177 to 675 pg./mL] or 2.02 nmol/L [range, 1.17 to 4.66 nmol/L] and 2.16 nmol/L [range,
1.05-4.00 nmol/L]), E (median, 46 pg/mL [range, 18 to 339 pg/mL] and 58 pg/mL [range, 21-
122 pg/mL] or 251 pmol/L [range, 98-1951 pmol/L] and 317 pmol/L [range, 115-666
pmol/L]) were similar, whereas systolic arterial pressure (141±26 vs164±22 mmHg) and ANP
(441 (152-1330) vs. 804 (517-3560) pg./ml or ng/L) were lower (p<0.05) in HP patients. In
response to LBNP (-40 mmHg) CVP decreased by 6.5±4.0 mmHg in the HP-group and by
4.9±4.9 mmHg in the HR-group. In HP patients, this decrease was associated with a greater
fall in SI (37 ± 16% versus 27 ± 16%) and systolic arterial pressure (19±21% versus 4±14%)
than HR patients. Plasma ANP levels did not change, whereas the rise in NE and E was
similar in HP and HR patients. We conclude that patients which frequently experience
episodes of hypotension during dialysis are also prone to develop hypotension during LBNP,
which results from reduced myocardial contractile reserve and/or inadequate sympathetic
tone.
Introduction
Hypotension is an important cause of morbidity during hemodialysis treatment and occurs in
approximately 30% of the dialysis sessions. Factors that may contribute to the occurrence of
hemodialysis-induced hypotension include the reduction in blood volume and the osmotic
shifts that occur during dialysis [1]. Failure of the heart and/or the autonomous nervous
144
LBNP in Hemodialysis Patients
system to respond to the hypovolemia induced by hemodialysis may also result in decreased
blood pressure preservation [2,3]. The degree in which hypovolemia occurs during dialysis is
highly variable. We have demonstrated that both intra- and inter-individual variability of
blood volume changes during dialysis is high and cannot be explained by differences in
ultrafiltration rate [4]. As these factors may all interact, it is difficult to establish the relative
importance of each factor during hemodialysis.
Applying lower body negative pressure (LBNP) allows the isolated manipulation of venous
return to the heart [5], thereby mimicking controlled hypovolemia. In healthy volunteers,
LBNP causes a reduction in central venous pressure (CVP) starting at –20 mmHg LBNP
followed by a reduction in stroke volume index (SI) and cardiac index at higher levels. Blood
pressure usually remains unchanged due to an increase in total peripheral resistance and heart
rate, but hypotension may occur at levels of -40 mmHg and higher [5-9]. In healthy
volunteers, hypovolemia increases the risk for hypotension [8].
In order to determine the importance of hypovolemia in the pathogenesis of dialysis related
hypotension, we studied the cardiovascular response to LBNP in hypotension prone and
hypotension resistant hemodialysis patients.
Patients and Methods
Patients
Twenty-two patients on chronic hemodialysis, 11 hypotension-prone (HP) and 11
hypotension-resistant (HR), were studied. The ethical committee of the University Hospital
Rotterdam-Dijkzigt approved the study, and all participants gave written informed consent.
Criteria for classification as hypotension-prone were: decrease of systolic arterial pressure to
less then 100 mmHg accompanied by symptoms of hypotension (dizziness and/or syncope)
occurring in at least one third of dialysis sessions during the last three months prior to
inclusion in the study. Patients with diabetes mellitus were excluded from the study.
Age and sex distribution was not different in both groups (Table 1). Time on dialysis was also
not significantly different in HP and HR patients. The average number of antihypertensive
drugs was 1.0 in HP patients vs. 1.6 in HR patients (n.s.). All dialysis treatments were
performed on a trice-weekly basis, using bicarbonate buffered dialysate and biocompatible
membranes (Hemophane or Polysulphone). Dry weight was considered optimal when patients
145
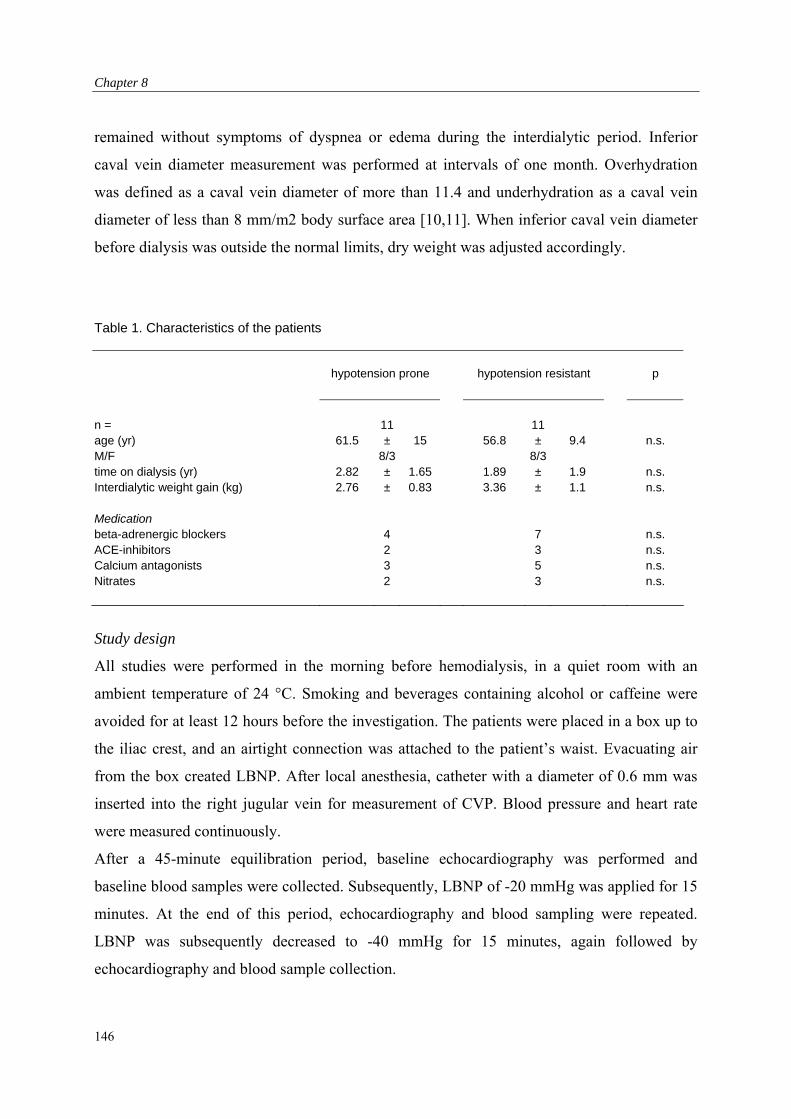
Chapter 8
remained without symptoms of dyspnea or edema during the interdialytic period. Inferior
caval vein diameter measurement was performed at intervals of one month. Overhydration
was defined as a caval vein diameter of more than 11.4 and underhydration as a caval vein
diameter of less than 8 mm/m2 body surface area [10,11]. When inferior caval vein diameter
before dialysis was outside the normal limits, dry weight was adjusted accordingly.
Table 1. Characteristics of the patients
hypotension prone hypotension resistant p
n = 11 11 age (yr) 61.5 ± 15 56.8 ± 9.4 n.s. M/F 8/3 8/3 time on dialysis (yr) 2.82 ± 1.65 1.89 ± 1.9 n.s. Interdialytic weight gain (kg) 2.76 ± 0.83 3.36 ± 1.1 n.s.
Medication beta-adrenergic blockers 4 7 n.s. ACE-inhibitors 2 3 n.s. Calcium antagonists 3 5 n.s. Nitrates 2 3 n.s.
Study design
All studies were performed in the morning before hemodialysis, in a quiet room with an
ambient temperature of 24 °C. Smoking and beverages containing alcohol or caffeine were
avoided for at least 12 hours before the investigation. The patients were placed in a box up to
the iliac crest, and an airtight connection was attached to the patient’s waist. Evacuating air
from the box created LBNP. After local anesthesia, catheter with a diameter of 0.6 mm was
inserted into the right jugular vein for measurement of CVP. Blood pressure and heart rate
were measured continuously.
After a 45-minute equilibration period, baseline echocardiography was performed and
baseline blood samples were collected. Subsequently, LBNP of -20 mmHg was applied for 15
minutes. At the end of this period, echocardiography and blood sampling were repeated.
LBNP was subsequently decreased to -40 mmHg for 15 minutes, again followed by
echocardiography and blood sample collection.
146
LBNP in Hemodialysis Patients
Measurements
Blood pressure and heart rate were registered continuously through finger blood pressure
measurement by the Finapres device (Ohmeda 2300, Englewood CO, USA). CVP was
measured continuously using a pressure transducer (Ohmeda single transducer kit) positioned
at heart level, and a monitor (HP 1290A, Hewlett Packard, California, USA). The average of
all blood pressure, heart rate and CVP measurements during a one-minute period at the end of
equilibration, -20 mmHg and -40 mmHg LBNP, were used for analysis. Left ventricular end-
diastolic volume, Stroke volume and cardiac output were assessed in triplicate by
echocardiography, using the bi-plane discs method. The volume of the ventricle was
calculated from the apical two- and four chamber views using a modification of Simpson’s
rule[12]. The principle of Simpson’s rule is to divide the left ventricle into known slices of
thickness. The volume of the ventricle is then equal to the sum of the volume of the slices.
Two and four chamber apical views were recorded and stored. The endocardial borders of
these views were digitally traced at end diastole and end systole. Each projection was divided
in 20 sections along the long axis. Then the volumes were computed. Stroke volume was
calculated as the difference between end-diastolic and end-systolic volume. Diastolic left
ventricular function was assessed by pulse wave Doppler evaluation of left ventricular filling.
The pulse wave Doppler studies were recorded from the apical four chamber view, with the
doppler sampler positioned just within the inflow portion of the left ventricle, midway
between the annular margins of the mitral valve. Mitral velocity profiles were digitized from
the modal velocity of the Doppler tracings. After measuring early (E) and atrial (A) flow over
the mitral valve, the E/A ratio was calculated. Total peripheral resistance was calculated from
mean arterial pressure and cardiac output. Concentrations of plasma epinephrine (E; normal
limit: < 120 pg/ml (< 655 pmol/L) and norepinephrine (NE; normal limits: 100-600 pg/ml
(0.59-3.55 nmol/L) were measured by fluorometric detection after high-performance liquid
chromatography as described previously [13]. Plasma atrial natriuretic peptide levels (ANP;
normal limits: 60-120ng/L) were measured by means of a commercially available
radioimmunoassay (Nichols institute, Wijchen, The Netherlands) [14].
147
Chapter 8
Statistics
Hemodynamic data are given as mean ± standard deviation. Stroke volume, cardiac output,
and total peripheral resistance are expressed per m2 body surface area and are mentioned SI,
Cardiac index, and total peripheral resistance index respectively . Differences in the baseline
data were tested with the unpaired two-tailed Student’s t-test. Changes during LBNP were
analyzed using Analysis of Variance for repeated measurements, in the case of a significant F-
ratio followed by the Student Neuman Keuls test for multiple comparisons.
Plasma concentrations of vasoactive hormones are given as median values and range.
Baseline data were tested with Mann-Whitney’s non-parametric test. Changes during LBNP
were tested with Friedman P-test, when significant, followed by the Dunn test for multiple
comparisons.
Of all parameters, changes at –20 and –40 mmHg LBNP are given as percentages of change
compared to baseline. However, the changes in CVP are given as absolute values.
Correlations were assessed by calculating Pearson’s correlation coefficient, in the case of
vasoactive hormones after log-transformation. A p-value of less than 0.05 was assumed to
indicate statistical significance.
Results
Baseline values
At baseline, CVP tended to be lower in HP patients, but this difference was not significant
(Table 2). Baseline SAP was significantly lower in the HP-group than in the HR-group. Heart
rate, SI, cardiac index and total peripheral resistance index were all similar in both groups.
Diastolic dysfunction (E/A ratio <1.0) was present in 19 out of 22 subjects, with no
significant differences between both groups. Median values of NE and E were within normal
limits and were not different in the two groups. However, all patients in both groups had
elevated ANP-levels. In HR-patients, ANP levels were significantly higher than in HP-
patients.
148
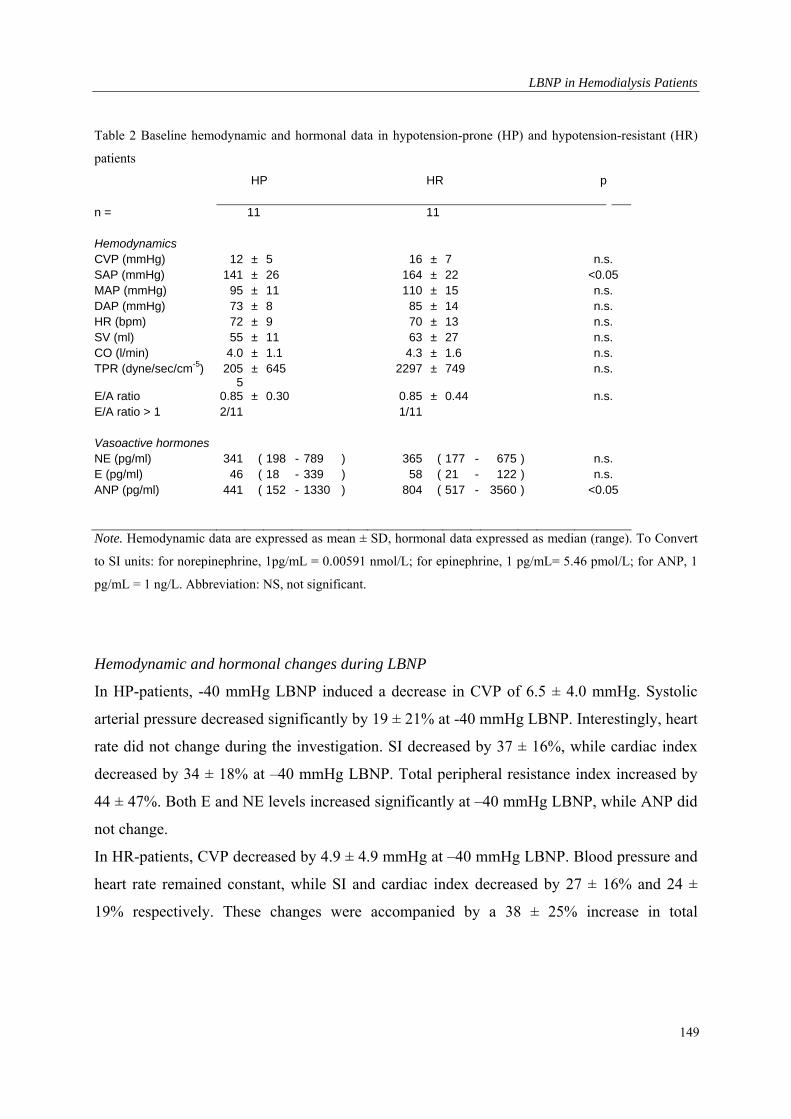
LBNP in Hemodialysis Patients
149
Table 2 Baseline hemodynamic and hormonal data in hypotension-prone (HP) and hypotension-resistant (HR)
patients
HP HR p
n = 11 11
Hemodynamics CVP (mmHg) 12 ± 5 16 ± 7 n.s. SAP (mmHg) 141 ± 26 164 ± 22 <0.05 MAP (mmHg) 95 ± 11 110 ± 15 n.s. DAP (mmHg) 73 ± 8 85 ± 14 n.s. HR (bpm) 72 ± 9 70 ± 13 n.s. SV (ml) 55 ± 11 63 ± 27 n.s. CO (l/min) 4.0 ± 1.1 4.3 ± 1.6 n.s. TPR (dyne/sec/cm-5) 205
5± 645 2297 ± 749 n.s.
E/A ratio 0.85 ± 0.30 0.85 ± 0.44 n.s. E/A ratio > 1 2/11 1/11
Vasoactive hormones NE (pg/ml) 341 ( 198 - 789 ) 365 ( 177 - 675 ) n.s. E (pg/ml) 46 ( 18 - 339 ) 58 ( 21 - 122 ) n.s. ANP (pg/ml) 441 ( 152 - 1330 ) 804 ( 517 - 3560 ) <0.05
Note. Hemodynamic data are expressed as mean ± SD, hormonal data expressed as median (range). To Convert
to SI units: for norepinephrine, 1pg/mL = 0.00591 nmol/L; for epinephrine, 1 pg/mL= 5.46 pmol/L; for ANP, 1
pg/mL = 1 ng/L. Abbreviation: NS, not significant.
Hemodynamic and hormonal changes during LBNP
In HP-patients, -40 mmHg LBNP induced a decrease in CVP of 6.5 ± 4.0 mmHg. Systolic
arterial pressure decreased significantly by 19 ± 21% at -40 mmHg LBNP. Interestingly, heart
rate did not change during the investigation. SI decreased by 37 ± 16%, while cardiac index
decreased by 34 ± 18% at –40 mmHg LBNP. Total peripheral resistance index increased by
44 ± 47%. Both E and NE levels increased significantly at –40 mmHg LBNP, while ANP did
not change.
In HR-patients, CVP decreased by 4.9 ± 4.9 mmHg at –40 mmHg LBNP. Blood pressure and
heart rate remained constant, while SI and cardiac index decreased by 27 ± 16% and 24 ±
19% respectively. These changes were accompanied by a 38 ± 25% increase in total
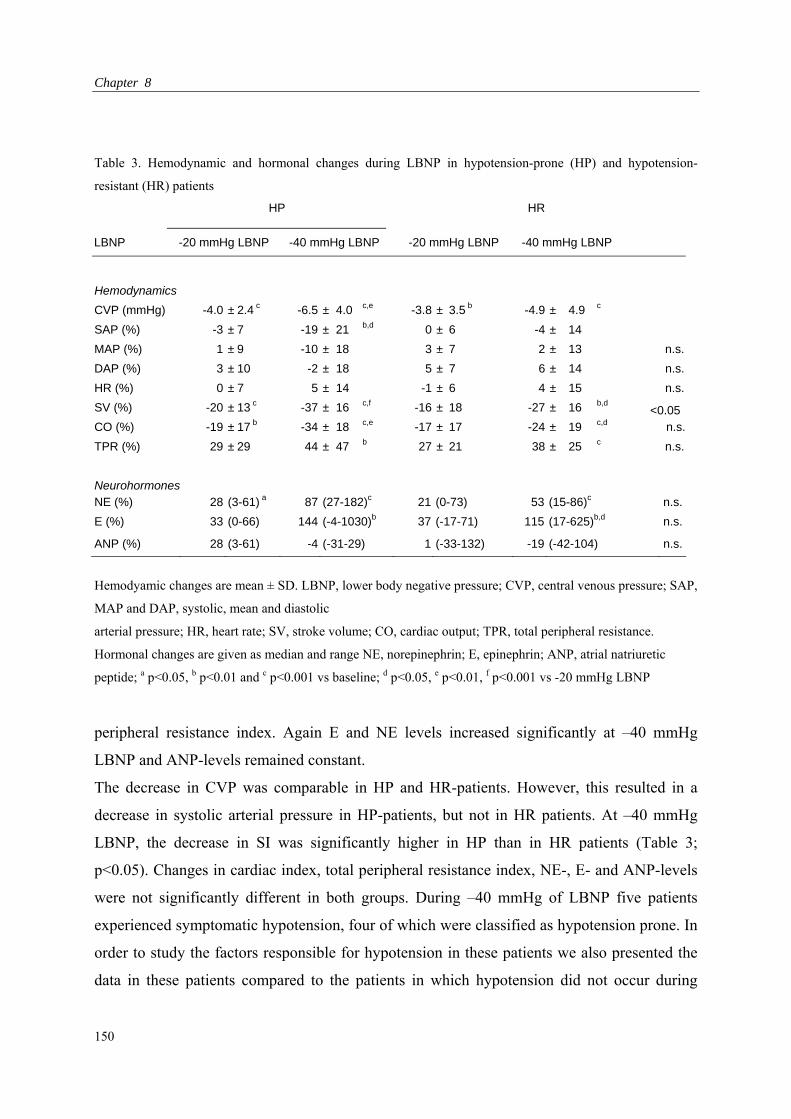
Chapter 8
Table 3. Hemodynamic and hormonal changes during LBNP in hypotension-prone (HP) and hypotension-
resistant (HR) patients
HP HR
LBNP -20 mmHg LBNP -40 mmHg LBNP -20 mmHg LBNP -40 mmHg LBNP
Hemodynamics
CVP (mmHg) -4.0 ± 2.4 c -6.5 ± 4.0 c,e -3.8 ± 3.5 b -4.9 ± 4.9 c
SAP (%) -3 ± 7 -19 ± 21 b,d 0 ± 6 -4 ± 14
MAP (%) 1 ± 9 -10 ± 18 3 ± 7 2 ± 13 n.s.
DAP (%) 3 ± 10 -2 ± 18 5 ± 7 6 ± 14 n.s.
HR (%) 0 ± 7 5 ± 14 -1 ± 6 4 ± 15 n.s.
SV (%) -20 ± 13 c -37 ± 16 c,f -16 ± 18 -27 ± 16 b,d <0.05 CO (%) -19 ± 17 b -34 ± 18 c,e -17 ± 17 -24 ± 19 c,d n.s.
TPR (%) 29 ± 29 44 ± 47 b 27 ± 21 38 ± 25 c n.s.
Neurohormones NE (%) 28 (3-61) a 87 (27-182)c 21 (0-73) 53 (15-86)c n.s.
E (%) 33 (0-66) 144 (-4-1030)b 37 (-17-71) 115 (17-625)b,d n.s.
ANP (%) 28 (3-61) -4 (-31-29) 1 (-33-132) -19 (-42-104) n.s.
Hemodyamic changes are mean ± SD. LBNP, lower body negative pressure; CVP, central venous pressure; SAP,
MAP and DAP, systolic, mean and diastolic
arterial pressure; HR, heart rate; SV, stroke volume; CO, cardiac output; TPR, total peripheral resistance.
Hormonal changes are given as median and range NE, norepinephrin; E, epinephrin; ANP, atrial natriuretic
peptide; a p<0.05, b p<0.01 and c p<0.001 vs baseline; d p<0.05, e p<0.01, f p<0.001 vs -20 mmHg LBNP
peripheral resistance index. Again E and NE levels increased significantly at –40 mmHg
LBNP and ANP-levels remained constant.
The decrease in CVP was comparable in HP and HR-patients. However, this resulted in a
decrease in systolic arterial pressure in HP-patients, but not in HR patients. At –40 mmHg
LBNP, the decrease in SI was significantly higher in HP than in HR patients (Table 3;
p<0.05). Changes in cardiac index, total peripheral resistance index, NE-, E- and ANP-levels
were not significantly different in both groups. During –40 mmHg of LBNP five patients
experienced symptomatic hypotension, four of which were classified as hypotension prone. In
order to study the factors responsible for hypotension in these patients we also presented the
data in these patients compared to the patients in which hypotension did not occur during
150
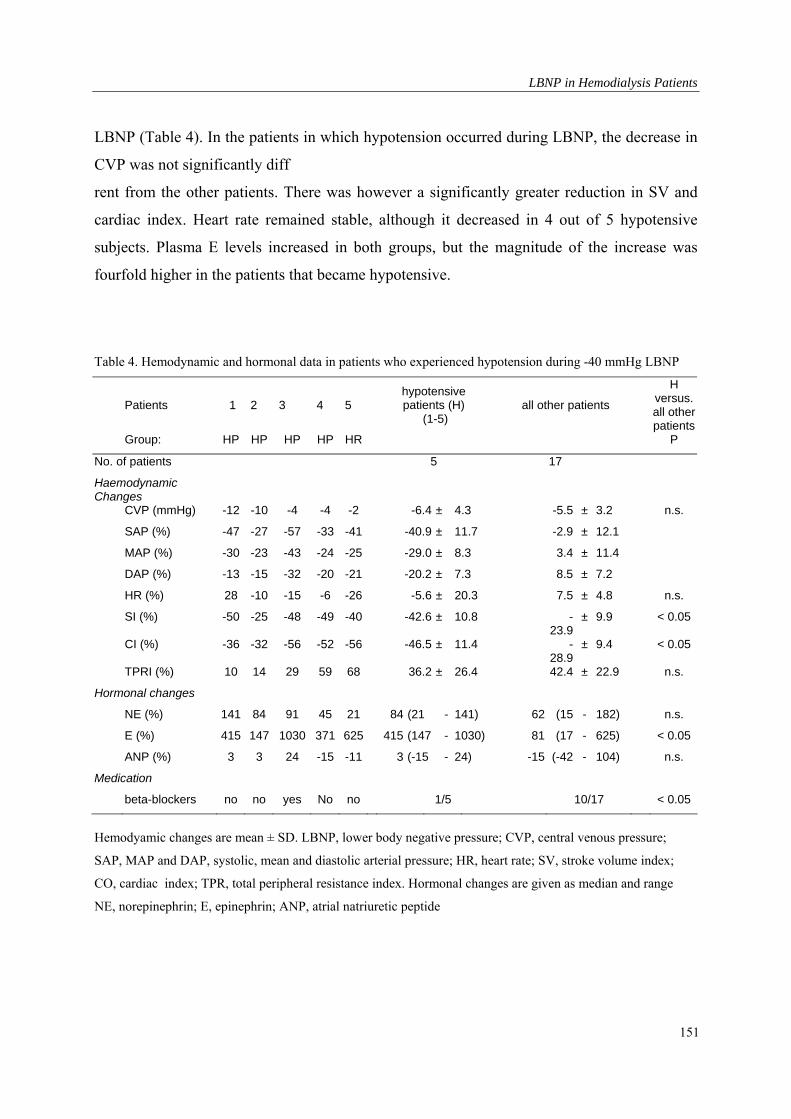
LBNP in Hemodialysis Patients
LBNP (Table 4). In the patients in which hypotension occurred during LBNP, the decrease in
CVP was not significantly diff
rent from the other patients. There was however a significantly greater reduction in SV and
cardiac index. Heart rate remained stable, although it decreased in 4 out of 5 hypotensive
subjects. Plasma E levels increased in both groups, but the magnitude of the increase was
fourfold higher in the patients that became hypotensive.
Table 4. Hemodynamic and hormonal data in patients who experienced hypotension during -40 mmHg LBNP
Patients 1 2 3 4 5
hypotensive patients (H)
(1-5) all other patients
H versus. all other patients
Group: HP HP HP HP HR P
No. of patients 5
Haemodynamic Changes
17
CVP (mmHg) -12 -10 -4 -4 -2 -6.4 ± 4.3 -5.5 ± 3.2 n.s.
SAP (%) -47 -27 -57 -33 -41 -40.9 ± 11.7 -2.9 ± 12.1
MAP (%) -30 -23 -43 -24 -25 -29.0 ± 8.3 3.4 ± 11.4
DAP (%) -13 -15 -32 -20 -21 -20.2 ± 7.3 8.5 ± 7.2
HR (%) 28 -10 -15 -6 -26 -5.6 ± 20.3 7.5 ± 4.8 n.s.
SI (%) -50 -25 -48 -49 -40 -42.6 ± 10.8 -23.9
± 9.9 < 0.05
CI (%) -36 -32 -56 -52 -56 -46.5 ± 11.4 -28.9
± 9.4 < 0.05
TPRI (%) 10 14 29 59 68 36.2 ± 26.4 42.4 ± 22.9 n.s.
Hormonal changes
NE (%) 141 84 91 45 21 84 (21 - 141) 62 (15 - 182) n.s.
E (%) 415 147 1030 371 625 415 (147 - 1030) 81 (17 - 625) < 0.05
ANP (%) 3 3 24 -15 -11 3 (-15 - 24) -15 (-42 - 104) n.s.
Medication
beta-blockers no no yes No no 1/5 10/17 < 0.05
Hemodyamic changes are mean ± SD. LBNP, lower body negative pressure; CVP, central venous pressure;
SAP, MAP and DAP, systolic, mean and diastolic arterial pressure; HR, heart rate; SV, stroke volume index;
CO, cardiac index; TPR, total peripheral resistance index. Hormonal changes are given as median and range
NE, norepinephrin; E, epinephrin; ANP, atrial natriuretic peptide
151
Chapter 8
Discussion
In the present study we assessed whether the hemodynamic and neurohumoral responses to
LBNP in HP and HR hemodialysis patients are different. Our findings showed that a
comparable LBNP-induced decrease in CVP is associated with a greater fall in SI and systolic
blood pressure in HP than in HR patients, whereas the neurohumoral responses between the
two groups of patients did not differ. These findings could imply a greater dependency of SI
on cardiac filling pressure in HP resulting from reduced diastolic function, inadequate
sympathetic tone or impaired cardiac contractility.
Baseline values of CVP and ANP were elevated in both groups of patients. Compared to HR
patients, baseline values of ANP were lower and baseline values of CVP tended to be lower in
HP patients. These findings strongly suggest that overhydration was less pronounced in the
HP patients. This contention is supported by the finding that interdialytic weight gain (Table
1) was lower in HP than in HR patients.
An explanation why LBNP was associated with a greater decrease in SI in HP than in HR
patients is not easy to provide. Echocardiographic examination did not reveal the presence of
valvular, pericardial or pulmonary abnormalities that could cause a decrease in cardiac inflow
in either HP or HR patients. Left ventricular hypertrophy and uremic myocardial fibrosis are
commonly observed in hemodialysis patients[15]. These abnormalities impair ventricular
relaxation and diastolic function, resulting in a decrease in SI when cardiac-filling pressure is
lowered. Diastolic dysfunction can be diagnosed by considering the ratio of the mitral flow
velocities of early ventricular filling to atrial assisted ventricular filling (E/A ratio), as
measured by pulse wave Doppler Echocardiography [16]. An E/A ration below 1.0 indicates
the presence of diastolic dysfunction. Of the patients participating in the present study almost
all (19/22) had diastolic dysfunction. No difference in E/A ratios was observed between the
HP and HR. A caveat for using the E/A ratio as a measure for diastolic function is the
dependency of this parameter on volume status [17]. Unfortunately E/A ratio’s in the present
study were only determined before application of LBNP and before hemodialysis. It is
therefore possible that a difference in the diastolic properties of the left ventricle between the
groups of subjects has been missed.
Differences in blood pressure behavior during LBNP could be due changes in sympathetic
tone and/or systolic function. Of the 22 patients studied five (four of the HP and one of the
152
LBNP in Hemodialysis Patients
HR group) developed hypotension during –40 mmHg of LBNP. In all five subjects the
hypotension was caused by a decrease in cardiac index. Although the decrease in cardiac
index was predominantly due to a fall in SI, heart rate in all but one of the subjects decreased
as well.
A reduction in heart rate during episodes of hypotension has been described by Converse et
al, who ascribed this response to a paradoxical withdrawal of sympathetic activity [18]. This
phenomenon, also known as the Bezold-Jarisch reflex, is thought to result from increased
activity of left ventricular mechanoreceptors as a consequence of a decrease in stroke volume
and increased cardiac contractility. This form of bradycardia-associated hypotension occurs as
a result from marked hypovolemia [19].
However, the results concerning the heart rate response have to be interpreted with care, as
fluctuations in heart rate normally occur. Mean heart rate remained stable in the HP and a
severe bradycardia occurred only in one patient, in the HR group. Therefore heart rate was of
minor importance in the pathogenesis of hypotension during LBNP, although no increase in
the baroreceptor mediated heart rate response was found. Beta blockade was not likely to be
responsible for the impairment in the baroreceptor mediated heart rate response, as these were
mainly used in non hypotensive patients. It is known that bradycardia can exist independently
of defects in the autonomic nervous system [20]
Although plasma norepinephrine almost doubled, we found no differences in norepinephrine
levels between hypotensive and non-hypotensive subjects. In view of the hypotensive
response, the increase in plasma norepinephrine concentration in these subjects can be
considered inappropriate. This would suggest the presence of sympathetic inhibition.
In patients experiencing hypotension plasma epinephrine concentration was markedly
increased. As hypotension is a powerful stimulus of epinephrine secretion by the adrenal
gland and epinephrine concentrations were measured several minutes after the hypotensive
episode, this could be considered a secondary phenomenon.
SI was decreased in HP despite comparable filling pressures and sympathetic tone. This
suggests a reduced sensitivity of adrenoreceptors.
The seemingly comparable level of sympathetic drive could also suggest an incapability to
maintain sympatic tone. The pivotal role of the heart in patients prone to develop hypotension
during dialysis can be demonstrated by infusion of dobutamine, a -adrenergic receptor
153
Chapter 8
agonist. In this group patients, prone to develop hypotension during dialysis, we observed
impaired myocardial contractile reserve in response to sympathetic stress [21]. These findings
support the hypothesis of impaired myocardial contractile reserve in the pathogenesis of
dialysis-induced hypotension. An impaired myocardial contractile reserve could be partly due
to the fact that patients were by mean five years older and had spent by mean one year more
on dialysis.
We conclude that patients that frequently experience episodes of hypotension during dialysis
are also prone to develop hypotension during LBNP. The hypotension during LBNP results
from reduced myocardial contractile reserve and/or inadequate sympathetic tone.
154
LBNP in Hemodialysis Patients
References
1. Daugirdas JT: Dialysis hypotension: A hemodynamic analysis. Kidney Int 1991, 39:233 246.
2. Enzmann G, Bianco F, Paolini F, Panzetta G: Autonomic nervous function and blood volume
monitoring during hemodialysis. Int J Art Org 1995,18:504-508.
3. Lin YF, Wang JY, Shum AYC, et al.: Role of plasma catecholamines, autonomic, and left
ventricular function in normotensive and hypotension prone dialysis patients. ASAIO J 1993,
39:946-953.
4. Krepel HP, Nette RW, Akcahuseyin E, Weimar W, Zietse R: Variability of relative blood
volume during haemodialysis. Nephrol Dial Transplant 2000,15:673-679.
5. Murray RH, Thompson LJ, Bowers JA, Albright CD: Hemodynamic effects of graded
hypovolemia and vasodepressor syncope induced by lower body negative pressure Am Heart J
1968, 76: 799-811.
6. Chang CM, Cassuto Y, Pendergast DR, Farhi LE : Cardiorespiratory response to lower body
negative pressure. Aviat Space Environ Med 1994, 65:615-620.
7. Prasad AS, Hedge KS, Mathew L: Cardiovascular responses to application of lower body
negative pressure of male volunteers in seated position. Indian J Physiol
Pharmacol1998,42:239-244.
8. Ligtenberg G, Blankestijn PJ, Koomans HA: Haemodynamic response during lower body
negative pressure: role of volume status. J Am Soc Nephrol 1998, 9:105-113.
9. Convertino VA: Endurance exercise training: conditions of enhanced hemodynamic responses
and tolerance to LBNP. Med Sci Sports Exerc 1993, 25:705-712.
10. Cheriex EC, Leunissen KML, Janssen JHA, Mooy JM, van Hooff JP: Echocardiography of the
inferior vena cava is a simple and reliable tool for estimation dry weight in haemodialysis
patients. Nephrol Dial Transplant 1989, 4:563-568.
11. Leunissen KML, Kouw P, Kooman JP et al.: New techniques to determine fluid status in
hemodialyzed patients. Kidney Int 1993, 41:S50-56.
12. Schiller NB, Shah PM, Crawford M.et al.: Recommendations for quantitation of the left
ventricle by two dimensional echo cardiography. J Am Soc Echocardiogr 1989, 2:358 362.
13. Van der Hoorn FAJ, Boomsma F, Man in’t Veld AJ, Schalekamp MADH: Determination of
plasma catecholamines in human plasma by high performance liquid chromatography:
comparison between a new method with fluorescence detection and an established method with
electrochemical detection. J Chromatogr 1989, 487:17-27.
155
Chapter 8
156
14. Rosmalen FMA, Tan ACITL, Tan HS, Benraad TJ: A sensitive radioimmunoassay of a trial
natriuretic peptide in human plasma, using a tracer with an immobilized glyouril agent. Clin
Chim Acta 1987, 165:331-340.
15. Amann K, Rychlik I, Miltenberger-Milteny G, Ritz E: Left ventricular hypertrophy in renal
failure. Kidney Int 1998, 54 (Suppl 68):S78-85.
16. Vitarelli A, Gheorghiade M: Diastolic heart failure: standard doppler approach and beyond Am
J Card 1998, 81(12A):115G-121G.
17. Choong CY, Herrmann HC, Weyman AE, Fifer MA: Preload dependence of Doppler derived
indexes of left ventricular diastolic function in humans. J Am Coll Cardiol 1987,10:800-808.
18. Converse RL, Jacobsen TN, Jost CMT, et al.: Paradoxical withdrawal of reflex vasoconstriction
as a cause of hemodialysis-induced hypotension. J Clin Invest 1992, 90:1657-65.
19. Barnas MG, Boer WH, Koomans HA: Hemodynamic patterns and spectral analysis of heart
rate variability during dialysis hypotension. J Am Soc Nephrol 1999, 10:2577-2584.
20. Poldermans D, Man in’t Veld AJM, Rambaldi R, et al.: Cardiac evaluation in hypo
tension-prone and hypotension-resistant hemodialysis patients. Kidney Int 56:1905-
1911,1999
Summary and Conclusions
Chapter 9 : Summary and Conclusions
157
Chapter 9
Summary and Conclusions
Chapter 1 is a brief introduction is to the physical principles and the technical procedure of
hemodialysis. Factors that can contribute to the occurrence of dialysis related hypotension are
discussed. We concluded from the available literature that for most factors it is unknown
whether the most detrimental effect on effective blood volume during hemodialysis is due to a
decreased plasma refilling or to an inadequate cardiovascular response. Moreover, we
hypothesized that both mechanisms can affect each other. We concluded that more knowledge
concerning this relationship is essential before blood volume monitoring and modeling, in
order to prevent of dialysis related hypotension, can be applied clinically.
In chapter 2, we constructed a mathemathical model of the intercompartmental fluid shifts
during combined hemodialysis, diffusive hemodialysis, and isolated ultrafiltration (IU). We
analyzed the relative importance of the factors that govern plasma refilling. We concluded
that the ultrafiltration rate, the size of sodium gradient between the dialysate and blood side of
the dialyzer membrane, and the change in regional blood flow are the most important factors
influencing the magnitude of plasma refilling.
In chapter 3, we analyzed the reproducibility of the decrease in relative blood volume during
hemodialysis, as it is essential for the application of blood volume modelling that a critical
level of reduction in relative blood volume can be determined. However, we observed a
considerable intra- and inter-individual variability and no correlation was observed between
changes in relative blood volume and either blood pressure or the incidence of hypotension.
We concluded that the critical level of reduction in relative blood volume, at which
hypotension occurs, depend more on cardiovascular defence mechanisms, such as
sympathetic drive.
In chapter 4, we evaluated the effects of diffusive dialysis on the changes in relative blood
volume during diffusive dialysis without ultrafilitration. During the first and second hour,
relative blood volume was paradoxically increased. Thus, the detrimental effect of diffusive
158
Summary and Conclusions
dialysis may be caused by a decrease in vascular resistance, rather than by reduced plasma
volume preservation.
In chapter 5, we have compared the effect of isotonic saline (0.9 %), glucose (5%),
hypertonic (3%) saline, mannitol (20%) and glucose (20%) on RBV, as these infusions are
most frequently used in order to prevent hemodynamic instability during dialysis. We
observed that hypertonic glucose during dialysis results in a greater increase in relative blood
volume than equal volumes of other solutions. As mannitol has the same osmolarity, molecule
mass and charge, the greater increase in RBV following hypertonic glucose appears to be a
specific effect, possibly related to a decline in vascular tone.
In chapter 6, we studied the pathophysiology of hemodialysis related hypotension. In order to
distinguish between dialysis related and patient related factors hypotensive dialysis sessions
were compared with Lower Body Negative Pressure experiments. We observed that dialysis
related hypotension did not result from an inability to maintain blood volume or from
decreased cardiac filling. Hypotension appeared to result from the inability to increase
arteriolar tone adequately and from a reduction in left ventricular function. Both vascular tone
and left ventricular function appeared to be impaired by the dialysis procedure.
In chapter 7, we observed that an increase in total peripheral resistance resulted in a decrease
in relative blood volume. This indicates that the improved hemodynamic stability during
hemodialysis through vasoconstriction can be accompanied by a decrease in relative blood
volume. Part of the variability in blood volume as described in chapter 4 may be due to
changes in arterial tone. A diminished vasoconstriction during diffusive dialysis could also
explain the observed increase in relative blood volume, as observed in chapter 5. Moreover, it
can be concluded that glucose, which increases relative blood volume more than equal
amounts of mannitol or sodium, is paradoxically of less benefit in the prevention of dialysis
hypotension. Therefore, during sodium profiling, the cardiovascular effect of sodium during
on plasma refilling should be taken into account.
159
Chapter 9
160
In chapter 8 we observed that patients that frequently experience episodes of hypotension
during dialysis are also prone to develop hypotension during Lower Body Negative Pressure,
which results from reduced myocardial contractile reserve and/or inadequate sympathetic
tone.
Summary and Conclusions
List of Publications
1. Miltenburg-van Zijl AJM, Bossuyt PM, Nette RW, Simoons ML, Taylor TR. Cardiologists’
use of clinical information for management decisions for patients with unstable angina: a
policy analysis. Med Decis Making 17:292-297, 1997.
2. Akcahuseyin E, Nette RW, Vincent HH, van Duyl WA, Krepel HP, Weimar W, Zietse R A
Simulation study on the intercompartmental fluid shifts during hemodialysis. ASAIO J 46:81-
94, 2000.
3. Krepel HP, Nette RW, Akcahuseyin E, Weimar W, Zietse R. Variability of relative blood
volume during hemodialysis. Nephrol Dial Transplant 15:673-679, 2000
4. Akcahuseyin E, Nette RW, van Duyl WA, Weimar W, Zietse R. Regulatieaspecten van
bloedvolumeveranderingen tijdens hemodialyse. Klinische Fysica 4: 4-8, 2000.
5. Nette RW, Akcahuseyin E, Krepel HP, Weimar W, Zietse R. Increase in blood volume during
dialysis without ultrafiltration. Blood Purif 19:33-38, 2001.
6. Nette RW, Krepel HP, van den Meiracker AH, Weimar W, Zietse R. Specific effect of the
Infusion of glucose on blood volume during hemodialysis.Nephrol Dial Transplant
2002;17:1275-1280.
7. Nette RW, Krepel HP, van den Dorpel MA, van den Meiracker AH, Rambaldi R, Poldermans
D, Boomsma F, Weimar W, Zietse R. Different response to lower body negative pressure in
Hypotension-prone and not hypotension prone patients. Kidney Int Am J Kidney Dis
2003;41:807-813.
8. Nette RW, van den Dorpel MA, Krepel HP, Ie EHY, Weimar W, Zietse R.. Hypotension
during hemodialysis results from an impairment of arteriolar tone and left ventricular function.
Clin Nephrol 2003 (Accepted for publication)
9. Nette RW, Ie EHY, Vletter W, Krams R, Weimar W, Zietse R. Norepinephrine-induced
vasoconstriction results in decreased blood volume. (Submitted)
10. Nette RW, Akcahuseyin E, Weimar W, Zietse R : Sodium transport through the dialyzer
membrane (Submitted).
11. Ie EH, Vletter WB, ten Cate FJ, Nette RW, Weimar W, Roelandt JR,Zietse R. Preload
dependence of new Doppler techniques limits their utility for left ventricular diastolic function
assessment in hemodialysis patients. J Am Soc Nephrol. 2003; 14:1858-1862.
161

Chapter 9
162
Samenvatting en Conclusies
163
Chapter 10 : Samenvatting en Conclusies
Chapter 10
Samenvatting en Conclusies
Hoofdstuk 1 is een beknopte inleiding tot de physische aspecten en de technische uitvoering
van hemodialyse. Factoren die kunnen bijdragen aan bloeddrukverlaging (hypotensie) in
samenhang tot hemodialyse worden besproken. Uit de beschikbare literatuur konden wij
vaststellen dat het voor de meeste factoren onbekend is of deze de bloeddruk tijdens
hemodialyse verlagen via een verminderde vulling vanuit de extravasculaire ruimtes (plasma
refilling) of door een ontoereikende reactie van het hartvaatstelsel op de door ultrafiltratie
ontstane hypovolemie. Wij veronderstellen echter dat beide mechanismen elkaar kunnen
beïnvloeden. Wij kwamen tot de conclusie dat meer kennis betreffende deze relatie absoluut
noodzakelijk is voordat het kritisch volgen en bewaken van het bloedvolume, ter voorkoming
van aan dialyse gerelateerde bloeddrukverlaging, klinisch kan worden toegepast.
In hoofdstuk 2 hebben we een rekenkundig model ontworpen van de vloeistofstromen binnen
de verschillende compartimenten tijdens gecombineerde hemodialyse, hemodialyse zonder
ultrafiltratie en geïsoleerde ultrafiltratie. Hiermee analyseerden we de relatieve waarde van de
factoren op de plasma refilling. We kwamen tot de conclusie dat de snelheid van ultrafiltratie,
de grootte van het natrium gradiënt over de dialyse membraan en de verandering van de
bloedstroom ter plaatse, de belangrijkste factoren zijn die in hoge mate de plasma refilling
beïnvloeden.
In hoofdstuk 3 is de reproduceerbaarheid bepaald met betrekking tot de verlaging van het
relatieve bloedvolume gedurende de hemodialyse sessie. Dit is van wezenlijk belang voor de
toepassing van bloedvolume regulering, omdat dan bij een eventueel kritisch niveau van de
verlaging van het relatief bloedvolume de hypotensieve episode kan worden voorspeld. We
hebben echter aanzienlijke intra-en interindividuele afwijkingen waargenomen. Er is ook geen
correlatie gevonden tussen veranderingen in het relatieve bloedvolume en bloeddruk of het
ontstaan van hypotensie. We zijn tot de conclusie gekomen dat het kritisch niveau van
verlaging in bloedvolume, waarbij hypotensie ontstaat met name afhangt van de reactie van
het hartvaatstelsel op de door ultrafiltratie ontstane hypovolemie.
164
Samenvatting en Conclusies
In hoofdstuk 4 hebben we de effecten geëvalueerd van hemodialyse zonder ultrafiltratie op de
veranderingen in relatief bloedvolume. Tijdens het eerste en tweede uur was het relatieve
bloedvolume paradoxaal verhoogd. Dus, het schadelijke effect van diffunderende dialyse zou
eerder veroorzaakt worden door een verlaging van de vasculaire bescherming dan door het in
stand houden van een gereduceerd plasma volume.
In hoofdstuk 5 hebben we het effect vergeleken tussen fysiologische zoutoplossing (0,9%),
glucose (5%), hypertone zoutoplossing (3%), mannitol (20%) en glucose (20%) op het
relatieve bloedvolume (RBV) omdat deze infusievloeistoffen het meest worden gebruikt om
hemodynamische instabiliteit tijdens de dialyse te voorkomen. We hebben waargenomen dat
hypertonisch glucose tijdens de dialyse in een grotere toename van het relatieve bloedvolume
resulteerde dan een gelijk volume van de andere oplossingen. Alhoewel mannitol dezelfde
osmolariteit, molecuul massa en elektrische lading heeft, blijkt de toename van het RBV met
hypertone glucose groter te zijn, welke mogelijkerwijs gerelateerd is aan de verminderde
capaciteit van glucose om de vaatweerstand te verhogen.
In hoofdstuk 6 wordt de pathosfysiologie van hemodialyse gerelateerde hypotensie
bestudeerd. Om een onderscheid te maken tussen hemodialyse gerelateerde en patiënt
gerelateerde factoren, werden hypotensieve dialyse sessies vergeleken met experimentele
situaties waarbij kunstmatig een hypovolemie werd gecreëerd zonder dat dialyse plaatsvond
(Lower Body Negative Pressure). Hypotensie bleek met name te worden veroorzaakt door
het onvermogen om de arteriële vaatweerstand toereikend te verhogen en door een afname in
de linker ventrikel functie.
In hoofdstuk 7 hebben we waargenomen dat een verhoging van de totale perifere
vaatweerstand resulteerde in een verlaging van het relatieve bloedvolume. Dit geeft aan dat de
verbeterde hemodynamische stabiliteit tijdens de hemodialyse, door vasoconstrictie, gepaard
kan gaan met een verlaging van het relatieve bloedvolume. Deels kan dus de variatie in
bloedvolume, zoals beschreven in hoofdstuk 3, veroorzaakt worden door veranderingen in de
arteriële vaattonus. Een verminderde vasoconstrictie tijdens dialyse zonder ultrafiltratie zou
ook de waargenomen verhoging in relatieve bloedvolume kunnen verklaren, zoals aangegeven
165
Chapter 10
166
in hoofdstuk 5. Bovendien kan worden vastgesteld dat glucose, dat het relatieve bloedvolume
meer verhoogd dan gelijke delen mannitol of natrium, paradoxaal minder voordeel laat zien
ter voorkoming van dialyse hypotensie. Om deze reden zou, tijdens Natrium-profiling
rekening moeten worden gehouden met het cardiovasculair effect van natrium tijdens de
plasma refilling.
In hoofdstuk 8 hebben we vastgesteld dat patiënten die regelmatig perioden doormaken van
hypotensie tijdens de dialyse, tevens neigen naar het ontwikkelen van hypotensie tijdens
Lower Body Negative Pressure.
Curriculum Vitae
Robert Willem Nette werd op 7 september 1967 geboren te Vlaardingen.In 1986 behaalde hij
het diploma Atheneum-B aan de christelijke scholengemeenschap "Groen van Prinsterer" te
Vlaardingen. In hetzelfde jaar begon hij met de studie Geneeskunde aan de Erasmus
Universiteit Rotterdam. Na een afstudeeronderzoek over onstabiele angina pectoris op de
afdelingen Cardiologie en Klinische Besliskunde haalde hij in 1991 zijn doctoraal examen
geneeskunde, gevolgd door zijn arts examen in 1993. In november van hetzelfde jaar werd hij
opgeroepen voor zijn militaire dienstplicht die hij vervulde als eerste luitenant-arts in de regio
Harderwijk-Ermelo als kazerne arts.
Na de militaire diensttijd werd in 1995 begonnen als AGNIO neurologie in het Erasmus MC
te Rotterdam. Van 1996 tot 1998 in de funktie van AGNIO Inwendige Geneeskunde in het
Leyenburg Ziekenhuis in Den Haag. Vanaf 1998 begon hij als arts-onderzoeker bij de
afdeling Inwendige Geneeskunde van het Erasmus MC te Rotterdam o.l.v.Dr.R.Zietse. Sinds
2001 is hij in opleiding tot Internist bij de afdeling Inwendige Geneeskunde van het Erasmus
MC(2001-2003) o.l.v. Prof.dr.H.A.P. Pols en bij de Reinier de Graaf Groep,locatie Delft o.l.v.
Dr.E.Maartense (vanaf 2003 tot heden).
167
Nawoord
De laatste pagina's van een proefschrift zijn altijd voor een dankwoord. Vroeger vond ik dat
bij het lezen van een proefschrift een beetje onzin, mede door het feit dat het een soort
formaliteit geworden is, zoals ook de bedankjes bij de oscaruitreiking mij nooit kunnen
boeien. Nu ik bij het maken van het dankwoord het proefschrift nog eens aanschouw, zie ik
echter dat ik veel mensen oprecht veel dank verschuldigd ben. Het zijn er zelfs zoveel dat ik
niet iedereen persoonlijk kan bedanken en daarom beperk ik me tot de meest betrokkenen.
Als eerste bedank ik mijn promotor, Willem Weimar, met name voor het gestelde
vertrouwen Verder waren zijn commentaren altijd waardevol, waardoor het proefschrift
significant verbeterd kon worden.
Natuurlijk bedank ik mijn begeleider, Bob Zietse. Ik heb vooral geleerd dat het doen
van goed onderzoek korte en scherpe vragen en antwoorden vereist. Dit lijkt heel simpel,
maar het is datgene wat onderzoek juist zo moeilijk, maar ook uitdagend maakt. De in jou
gewaardeerde scherpe humor zal dan ook niet snel overtroffen worden. Ik wil je echter vooral
bedanken, omdat je bergen werk verzet hebt en je een sociaal bewogen man bent waarmee het
plezierig is om mee te werken. Ik ben er trots op de eerste te zijn die onder jouw begeleiding
promoveert. Het is ook verheugend te noemen dat de onderzoeksactiviteiten naar de
hemodynamische stabiliteit van de patiënt tijdens de hemodialyse behandeling in onze
hemodialyse research unit (HRU) zeker gecontinueerd gaan worden. Hierbij wil ik dan ook
mijn collega's van de HRU bedanken die mede aan mijn proefschrift gewerkt hebben.
Harmen Krepel, toen ik in 1998 aan het onderzoek begon was het best eenzaam en verder had
ik geen idee waar ik moest beginnen. Gelukkig was jij daar op dat moment, jij had al
onderzoekservaring en was al bijna nefroloog. Jij hebt belangeloos alle energie in mij
gestoken, en je was mijn mentor op de HRU. Verder hebben we heel wat afgelachen, zeker
toen Han-Yo Ie onze HRU kwam versterken.
Han-Yo, ik heb veel steun aan je gehad. Jij weet als geen ander dat promoveren op een dialyse
onderwerp doorzettingsvermogen vereist, zeker gezien het feit dat uit het grootste deel van
onze inspanning weinig tot niets concreets is gekomen. Niettemin is mijn proefschrift af en
168
schrijf jij nu wel hele mooie artikelen voor jou onderzoek. Het feit dat jij er altijd in geloofde,
stimuleerde mij en ik wil je daar heel erg voor bedanken.
Rene van den Dorpel wil ik natuurlijk ook bedanken, met name voor hoofdstuk zes en acht,
waarvan een groot deel zijn inspanning is.
Verder bedank ik Emin Akcahuseyin, onze klinisch fysicus, voor het doornemen van de vele
mathematische formules. Je hebt me bijgebracht je door formules niet te laten afschrikken; ze
helpen juist de huidige inzichten te verduidelijken. Dat is in dit proefschrift ook wel gebleken.
De leden van de promotiecommissie bedank ik voor hun snelle commentaar op dit
proefschrift.
Verder wil ik de dialyseverpleging bedanken, die al die jaren mij hebben geholpen met
bepaalde dialyseopstellingen en metingen, ook buiten hun werktijd.
Veel dank ben ik verschuldigd aan de dialysepatiënten, die aan dit onderzoek hebben
meegewerkt. Niet alle onderzoeken waren voor hen even leuk. Niettemin meldden de
patiënten zich weer spontaan voor een nieuw onderzoek. Zonder hun bereidheid was dit
onderzoek natuurlijk nooit tot stand gekomen. Tijdens die vijf jaar heb ik een aantal patiënten
dan ook beter leren kennen en heb van hen veel geleerd hoe het is om chronisch ziek te zijn.
Een les die voor een dokter van onschatbare waarde is.
Als laatste wil ik natuurlijk mijn ouders bedanken. Met hun onvoorwaardelijke steun is het
begonnen. Jullie hebben in mij geloofd vanaf het moment dat ik de cito toets op de lagere
school moest doen. Een vak kiezen wat je leuk lijkt en doorzetten dan lukt het wel, was altijd
jullie devies. Jullie hebben gelijk gehad, maar zonder jullie steun was dit nooit gelukt.
Bedankt
Robert Nette
169

170