bln udgi i on dei as udgi i on hungary, szombathely: haladás sports complex, soccer stadium...
TRANSCRIPT

swietelsky.comswietelsky.com
ww
w.fr
edm
ansk
y.at
SW
IET
EL
SK
Y C
ON
SO
LID
AT
ED
FIN
AN
CIA
L S
TAT
EM
EN
TS
FO
R 2
017/
18
Hungary, Szombathely: Haladás sports complex, soccer stadium
CONSOLIDATED FINANCIAL STATEMENTS FOR 2017/18
SWIETELSKY Baugesellschaft m.b.H.
Edlbacherstraße 104020 Linz · AustriaT: 0043 732 6971-0F: 0043 732 6971-7410E: offi [email protected]
IDEAS
BUILDING
ON

Hungary, Szombathely: Haladás sports complex, soccer stadium

CONTENTS
Core market
Other countries
FOREWORD BY THE MANAGEMENT
as of 31 March 2018 3
RANGE OF SERVICES
Road and bridge construction 6
Railway construction 10
Building construction 14
Civil engineering 18
Tunnel construction 22
Vision 26
FINANCIAL STATEMENTS FOR 2017/18
Consolidated income statement 32for the fi nancial year 2017/18
Statement of comprehensive income 33for the fi nancial year 2017/18
Consolidated balance sheet as of 31 March 2018 34
Consolidated cash fl ow statement 36for the fi nancial year 2017/18
Development of equity 2017/18 38
Notes for the fi nancial year 2017/18 40
Group management report 102for the fi nancial year 2017/18
AUDITOR‘S REPORT
Report on the consolidated fi nancial statements 122
IMPRINT
Media owner and publisher:Swietelsky Baugesellschaft m.b.H.Edlbacherstraße 10, 4020 LinzTelephone: +43 (0) 732 6971-0Telefax: +43 (0) 732 6971-7410E-Mail: offi [email protected]: www.swietelsky.comFN: 83175 t, ATU 232 40 400Commercial register Linz
Graphical concept and design:Fredmansky GmbH, Linz
Photos: Swietelsky, Getty Images
Technical conversion online: E-Conomix GmbH, Wels
Production Print: Estermann GmbH, Aurolzmünster
Publication:31 July 2018

CONSTRUCTION OUTPUT: EUR 2,376 million (+17.44% YEAR-ON-YEAR)
EBT: EUR 78 million (+13.78% YEAR-ON-YEAR)
ORDER BACKLOG: EUR 3,117 million (+56.60% YEAR-ON-YEAR)
Management from left to right:Dipl.-Ing. Walter Pertl · Adolf Scheuchenpflug · Dipl.-Ing. Karl Weidlinger · Peter Gal

Dear Madam or Sir!
The financial year 2017/18 was one of the best in the history of our company. Amidst a good economic climate, SWIETELSKY continued its successful economic progress. Growth was consequently achieved in all important mar-kets and the construction output could be increased by 17.44% year-on-year. The order backlog rose by 56.6% to EUR 3.12 billion, achieving an all-time high despite the on-schedule execution of large long-term projects. Although there was a sharp rise in the balance sheet total attributable to cash and cash equivalents, the equity ratio remained at a very good level of 27.3%.
We were especially pleased with the increases in profitability. Earnings before tax (EBT) grew by 13.78%. With an EBIT margin of 3.7%, we were able to show a very good performance for the industry. We continue to pay great attention to our capital structure and the economical use of our financial resources. Furthermore, the financial year was characterised by high investments in property, plant and equipment. As before, we are focusing on our diversification strategy as well as our management approach to promote the entrepreneurial skills of our employees. Anticipating future challenges, digitisation is another topic we want to increasingly tackle. In the current financial year 2018/19, we can expect a further percentage increase in the double-digits in construction output as well as profitability of at least 3% based on the EBIT margin.
TWOTHOUSANDEIGHTEEN FOREWORD BY THE MANAGEMENT
Foreword by the management 0003

RANGE OFSERVICES
OVERVIEW
CIVIL ENGINEERINGROAD AND BRIDGE CONSTRUCTION
RAILWAY CONSTRUCTION
BUILDING CONSTRUCTION
TUNNEL CONSTRUCTION
VISION

Czech Republic, Podivín/Lednice: road 422
SWIETELSKY BUILDS ON COHESIVE KNOWLEDGE
ROAD ANDBRIDGECONSTRUCTION

0008 Financial Statements for 2017/18
Modern road and bridge construction today requires high-tech expertise in all project phases. The mobility of people and the growing urban zones represent major challenges for planners. The ever-growing need for optimised infrastructure solutions in the city and count-ryside can be fulfilled with rapid design and implementation. SWIETELSKY expertly plans and converts public areas and meets the demanding list of requirements in road and air traffic.
ROAD / MOTORWAY / AIRPORT / AGRICULTURAL ROAD / CAR PARK DESIGN / TOWN SQUARE DESIGN / ELEVATED HIGHWAY CONSTRUCTION / BRIDGE CONSTRUCTION AND REPAIR
We have been shaping the development in road and bridge construction for more than 80 years and are creating an optimised urban and rural infrastruc-ture implementing our know-how.
Austria, Linz: Vöest bridge

0009
Czech Republic, Hvězdonice/ Ostředek: D1 modernisation - section 03
Czech Republic, Podivín/Lednice: road 422 Germany, Ornautal: motorway A94, Ornautal Bridge
Range of Services

Austria, Vienna/St. Pölten/Wagram: railway construction
SWIETELSKY PUTS INFRASTRUCTURE ON RAILS
RAILWAYCONSTRUCTION

0012 Financial Statements for 2017/18
PLATFORM CONSTRUCTION / PLATFORM CONVERSION / GROUND REHABILITATION / FIXED RAILS / UNDERGROUND TUNNEL / TRAM LINE CONSTRUCTION
Rail traffic represents an energy-efficient and environmentally-friendly way of transporting major loads quickly and cost-effectively. In the future, logistics and public traffic will still rely on the railway to quickly transport people and goods from one place to another in comfort and safety. As a specialist in railway construction, SWIETELSKY realises the infrastructure of modern railway and civil engineering projects in Europe and Australia with its wealth of experience, its own rail transportation company and the latest equipment.
Austria, Linz: railway construction

0013
Austria, Vienna: track constructionEngland, Liverpool: track relaying
With the expansion of theurban and rural rail network, we will be providing for envi-ronmentally conscious and cost-efficient transportation of people and goods.
Australia, Hunter Valley: tamping operations
Range of Services

Hungary, Szeged: ELI-ALPS Research Institute
BUILDINGCONSTRUCTIONSWIETELSKY BUILDS WITH VISION

Solid foundations are a crucial element for realising construction projects of all scales. Reliability, absolute professionalism and economic resilience are attributes that customers value in the work of SWIETELSKY and on which we have been building for years. The diversity of our projects requires flexibility in finding solutions, a skill that allows us to carry out our work to the utmost satisfaction of our customers. From airport terminals to housing and residential developments, we plan, build, renovate and sell a wide range of construction projects as a main contractor at agreed prices and on agreed dates.
CONSTRUCTION / CONVERSION / REPAIRS / SINGLE-FAMILY HOMES / HOTELS / OFFICE BUILDINGS / HOUSING AND RESIDENTIAL DEVELOPMENT / INDUSTRIAL CONSTRUCTION / CIVIL ENGINEERING / DEVELOPER PROJECTS / MAIN CONTRACTOR CONSTRUCTION
Czech Republic, Česká Lípa: Docter Optics, new constructionAustria, Feldkirch: residential building
Building construction in-cludes planning, building and renovating buildings of all sizes and for a wide variety of requirements, from residential buildings to industrial operations.
Austria, Linz: Promenadengalerien
0016 Financial Statements for 2017/18
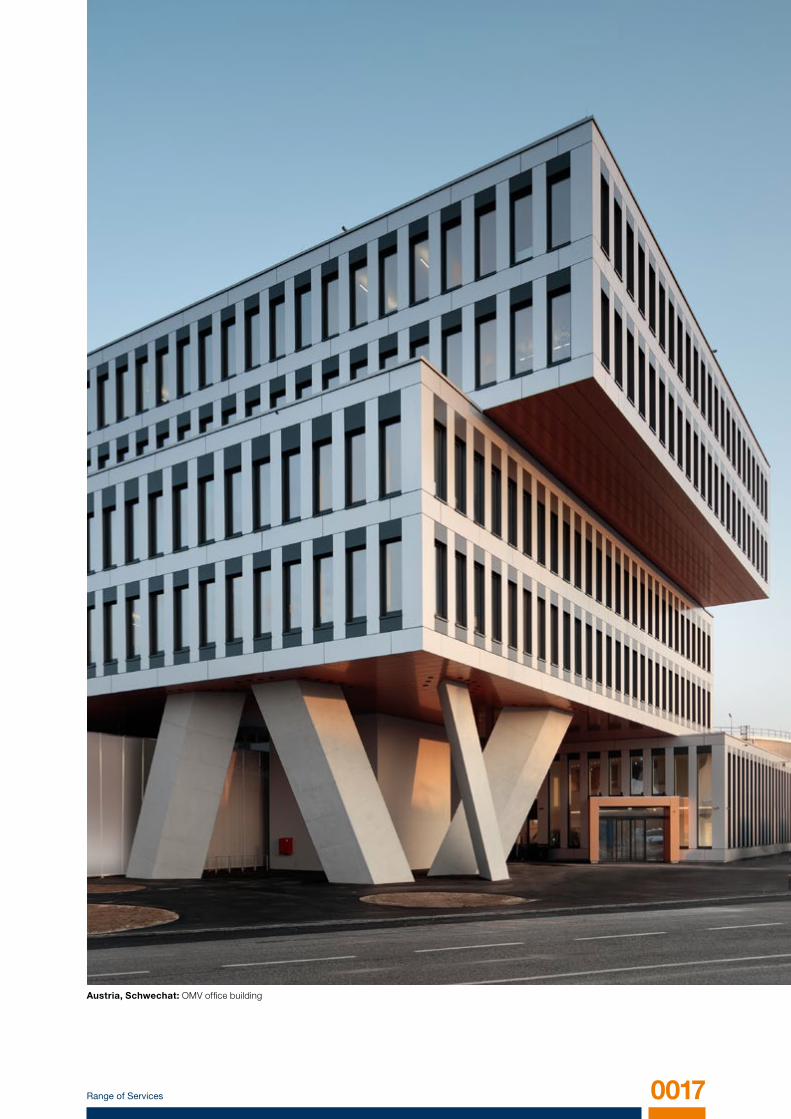
Austria, Schwechat: OMV office building
Range of Services 0017

Austria, Ischgl: Palinkopf valley station
CIVILENGINEERINGSWIETELSKY DRAWS ON PROFOUND TECHNICAL KNOW-HOW

Croatia, Omiš: construction of rockfall protection and rock networking
0020 Financial Statements for 2017/18

SWIETELSKY strives to use resources carefully in all construction projects. In addition to the health and safety of our employees, the environment is ultimately the most precious thing to be considered and preserved as a priority in a building project. Even in the complex field of civil engineering, SWIETELSKY ensures the best possible use of space and the environment with the latest technology. Both below ground and in mountainous areas, we use our cross-sector knowledge to produce innovative, economical and ecological solutions.
DEMOLITION / BLASTING OPERATIONS / EARTHMOVING / SLOPE STABILISATION / TEST DRILLING AND BORING / PIPING / SEWER CONSTRUCTION AND REHABILITATION / LANDFILL / UNDER-GROUND CABLE NETWORK ENGINEERING / HYDRAULIC ENGINEERING / SEWAGE PLANT CONST-RUCTION / POWER PLANT CONSTRUCTION / SPECIAL CIVIL AND UNDERGROUND CONSTRUCTION
Austria, Bad Aussee-Obertraun: check damAustria, Steyregg: clearing and slope stabilisation
Germany, Aiging bei Traunstein: gravel pit
In civil engineering we manage innovative and economical projects which make optimal use of the environment and space in underground or in the mountains.
Range of Services 0021

Germany, Stuttgart: Alb ascent
TUNNELCONSTRUCTIONSWIETELSKY UNDERSTANDS BUILDING PROJECTS

SWIETELSKY is a specialist in all types of civil engineering projects. Railway and road tunnels do not just shorten routes and enable more effective mobility, they also increase the value of alpine areas as living space by reducing noise pollution and shifting traffic underground. Underground tunnels enable environ-mentally-friendly and cost-efficient mobility in urban areas. Thanks to many years‘ experience implementing projects, we bring efficient solutions to fruition in all areas of tunnel construction and where needed ensure the restoration of plant functionality.
RAILWAY TUNNEL / ROAD TUNNEL / UNDERGROUND TUNNEL / GALLERIES, CAVERNS AND SHAFTS / REPAIRS
Germany, Stuttgart: Alb ascent, rail project
Austria, Semmering: Semmering Base Tunnel, propulsionAustria, Semmering: Semmering Base Tunnel, shaft construction
0024 Financial Statements for 2017/18

Germany, Stuttgart: Alb ascent, restoration vehicle
In tunnel construction, we bring rail and road traffic underground and ensure shorter distances and better quality of life through noise protection.
Range of Services 0025

Germany, Rappbodetal: Pedestrian suspension bridge over Rappbode Dam
SWIETELSKY ACTS RESPONSIBLY
VISION

Germany, Rappbodetal: Pedestrian suspension bridge over Rappbode Dam
Austria, Vienna: new villas XIX, surroundings
Austria, Zwettl: B38 bypass
0028 Financial Statements for 2017/18

The construction sector is by nature an energy- and resource-intensive terrain. SWIETELSKY implements conservation, recycling and waste management concepts across all project phases to ensure the use of ecologi-cally-compatible methods and environmentally-friendly equipment. We strive to ensure a continuously growing awareness of the environment and quality on the part of our employees. We regard their independent thinking and acting as the key to success. Constant expansion of our range of services and the willingness of our staff to adapt and further develop skills are responsible for the positive development of the company. Their efficiency, motivation and health is the goal we set ourselves in all decisions.
ECOLOGY AND RESOURCE CONVERSATION / EMPLOYEES / PARTNERSHIP / SUSTAINABILITY
Austria, Tyrol: transportation in the mountains
Personal responsibility and environmental and quality awareness shape our corporate culture and are the key to our success.
Range of Services 0029

FINANCIALSTATEMENTS FOR 2017/18

0032 Consolidated income statement
FIGURES IN THOUSAND EUR Notes 2017/18 2016/17
Revenue (1) 2,213,417 1,904,973
Changes in inventories 22,252 9,645
Own work capitalised 5,739 6,233
Other operating income (2) 15,638 17,213
Expenses for material and other purchased construction services (3) -1,454,727 -1,204,481
Employee benefits expenses (4) -543,444 -503,421
Other operating expenses (6) -149,458 -144,769
Share of results of associates (7) 16,890 17,991
Net income from investments (8) 226 11,552
Earnings before interest, tax, depreciation and amortisation (EBITDA) 126,533 114,936
Depreciation and amortisation (5) -45,693 -42,096
Earnings before interest and taxes (EBIT) 80,840 72,840
Interest and similar income 1,786 1,862
Interest and similar expenses -4,559 -7,197
Interest income -2,773 -5,335
Other financial result 0 1,106
Earnings before tax (EBT) 78,067 68,611
Income tax (9) -23,503 -12,469
Earnings after tax 54,564 56,142
Attributable to: hybrid captial owners 1,323 1,330
Attributable to: shareholders of the parent company 53,241 54,812
CONSOLIDATED INCOME STATEMENTFOR THE FINANCIAL YEAR 2017/18

0033Statement of comprehensive income
FIGURES IN THOUSAND EUR 2017/18 2016/17
Earnings after tax 54,564 56,142
Items that cannot be reclassified in the income statement:
Changes in Revaluation reserves 290 159
Changes in actuarial gains and losses -1,286 -1,795
Deferred taxes on neutral changes in equity 353 477
-643 -1,159
Items that can be reclassified in the income statement:
Differences arising from currency translation 588 207
Changes to IAS 39 - Financial Instruments 187 -1,139
Deferred taxes on neutral changes in equity -46 285
729 -647
Other income 86 -1,806
Total comprehensive income 54,650 54,336
Attributable to: hybrid captial owners 1,323 1,330
Attributable to: shareholders of the parent company 53,327 53,006
STATEMENT OF COMPREHENSIVE INCOMEFOR THE FINANCIAL YEAR 2017/18

0034 Financial Statements for 2017/18
FIGURES IN THOUSAND EUR Notes 31/3/2018 31/3/2017
Non-current assets
Intangible fixed assets (10) 10,627 11,386
Property, plant and equipment (10) 295,952 263,015
Investments in associates (11) 11,384 11,938
Other financial assets (11) 18,853 17,638
Trade receivables (13) 2,323 6,775
Other receivables and assets (13) 5,384 1,525
Deferred taxes (15) 7,055 7,369
351,578 319,646
Current assets
Inventories (12) 84,073 69,208
Trade receivables (13) 352,534 273,506
Other receivables and assets (13) 49,152 50,480
Cash and cash equivalents (14) 507,767 317,251
993,526 710,445
1,345,104 1,030,091
ASSETS
CONSOLIDATED BALANCE SHEETAS OF 31 MARCH 2018

Austria, Vienna: Schönbrunn Zoo, Giraffe House
0035
FIGURES IN THOUSAND EUR Notes 31/3/2018 31/3/2017
Equity
Registered capital 7,705 7,705
Capital reserves 58,269 58,269
Hybrid capital 30,462 30,462
Revaluation reserves 10,422 10,151
Revenue reserves 260,751 217,695
(16) 367,609 324,282
Non-current liabilities
Provisions (17) 22,875 22,005
Financial liabilities (18) 78,817 137,534
Trade payables (18) 26,681 23,792
Other liabilities (18) 9,377 9,220
Deferred taxes (15) 18,264 10,367
156,014 202,918
Current liabilities
Provisions (17) 90,873 74,326
Financial liabilities (18) 2,602 2,490
Trade payables (18) 630,454 329,876
Other liabilities (18) 97,552 96,199
821,481 502,891
1,345,104 1,030,091
Consolidated Balance Sheet
EQUITY AND LIABILITIES

0036 Financial Statements for 2017/18
FIGURES IN THOUSAND EUR 2017/18 2016/17
Earnings after tax 54,564 56,142
Deferred taxes 8,667 4,366
Non-cash effective results:
From associates 554 930
From initial consolidations 0 357
Depreciation/reversals of write-downs 45,925 42,528
Change in non-current provisions -416 -231
Gains/losses on disposal of non-current assets -2,192 -3,145
Consolidated cash flow from results 107,102 100,947
Changes to the items:
Inventories -14,918 -2,246
Trade receivables, receivables from construction contracts and project consortiums -73,804 12,895
Intra-group receivables and receivables from other non-currentinvestees and investors
2,758 4,005
Other receivables and assets -3,159 4,861
Current provisions 16,136 -6,339
Trade payables, construction contracts and project consortiums 302,671 38,720
Intra-group liabilities and liabilities to other non-current investees and investors
1,641 -326
Other liabilities -556 -1,047
Consolidated cash flow from operating activities 337,871 151,470
CONSOLIDATED CASH FLOW STATEMENTFOR THE FINANCIAL YEAR 2017/18

0037
FIGURES IN THOUSAND EUR Notes 2017/18 2016/17
Investments -84,777 -82,782
Gains/losses on disposal of non-current assets 2,192 3,145
Disposals of non-current assets (carrying value) 6,178 9,863
Changes in scope of consolidation 0 -1,851
Consolidated cash flow from investing activities -76,407 -71,625
Changes in bonded debts -55,536 59
Changes in liabilities to banks -1,225 -7,464
Changes in liabilities from finance leases -989 -868
Changes in group financing -6,625 2,575
Paid hybrid coupon -1,323 -1,330
Distributions -10,000 -35,000
Consolidated cash flow from financing activities -75,698 -42,028
Consolidated cash flow from operating activities 337,871 151,470
Consolidated cash flow from investing activities -76,407 -71,625
Consolidated cash flow from financing activities -75,698 -42,028
Net change in liquid funds 185,766 37,817
Liquid funds at the beginning of the period 315,329 275,821
Currency translation adjustment relating to liquid funds -174 1,691
Liquid funds at the end of the period (19) 500,921 315,329
Germany, Stuttgart: Alb ascent, excavation of the tunnel floor
Consolidated Cash Flow Statement

0038 Financial Statements for 2017/18
FIGURES IN THOUSAND EURRegistered
capitalCapital
reservesHybrid capital
Revaluationreserves
Revenuereserves
Currencytranslation
Groupequity
Non-controllinginterests Total
As of 1 April 2016 7,705 58,269 30,462 9,894 204,105 -4,159 306,276 0 306,276
Earnings after tax 0 0 0 0 56,142 0 56,142 0 56,142
Differences arising from currency translation 0 0 0 69 0 138 207 0 207
Changes in revaluation reserves 0 0 0 159 0 0 159 0 159
Changes to IAS 39 - Financial Instruments 0 0 0 0 -1,139 0 -1,139 0 -1,139
Changes in actuarial gains and losses 0 0 0 0 -1,795 0 -1,795 0 -1,795
Deferred taxes on neutral changes in equity 0 0 0 29 733 0 762 0 762
Total comprehensive income 0 0 0 257 53,941 138 54,336 0 54,336
Paid hybrid coupon 0 0 0 0 -1,330 0 -1,330 0 -1,330
Distributions 0 0 0 0 -35,000 0 -35,000 0 -35,000
Status on 31 March 2017 = Status on 1 April 2017 7,705 58,269 30,462 10,151 221,716 -4,021 324,282 0 324,282
Earnings after tax 0 0 0 0 54,564 0 54,564 0 54,564
Differences arising from currency translation 0 0 0 -51 0 639 588 0 588
Changes in revaluation reserves 0 0 0 290 0 0 290 0 290
Changes to IAS 39 - Financial Instruments 0 0 0 0 187 0 187 0 187
Changes in actuarial gains and losses 0 0 0 0 -1,286 0 -1,286 0 -1,286
Deferred taxes on neutral changes in equity 0 0 0 32 275 0 307 0 307
Total comprehensive income 0 0 0 271 53,740 639 54,650 0 54,650
Paid hybrid coupon 0 0 0 0 -1,323 0 -1,323 0 -1,323
Distributions 0 0 0 0 -10,000 0 -10,000 0 -10,000
As of 31 March 2018 7,705 58,269 30,462 10,422 264,133 -3,382 367,609 0 367,609
DEVELOPMENT OF EQUITYFROM 1 APRIL 2016 TO 31 MARCH 2018

Austria, Weinviertel: S3 Weinviertler Schnellstraße, bridge construction
0039
FIGURES IN THOUSAND EURRegistered
capitalCapital
reservesHybrid capital
Revaluationreserves
Revenuereserves
Currencytranslation
Groupequity
Non-controllinginterests Total
As of 1 April 2016 7,705 58,269 30,462 9,894 204,105 -4,159 306,276 0 306,276
Earnings after tax 0 0 0 0 56,142 0 56,142 0 56,142
Differences arising from currency translation 0 0 0 69 0 138 207 0 207
Changes in revaluation reserves 0 0 0 159 0 0 159 0 159
Changes to IAS 39 - Financial Instruments 0 0 0 0 -1,139 0 -1,139 0 -1,139
Changes in actuarial gains and losses 0 0 0 0 -1,795 0 -1,795 0 -1,795
Deferred taxes on neutral changes in equity 0 0 0 29 733 0 762 0 762
Total comprehensive income 0 0 0 257 53,941 138 54,336 0 54,336
Paid hybrid coupon 0 0 0 0 -1,330 0 -1,330 0 -1,330
Distributions 0 0 0 0 -35,000 0 -35,000 0 -35,000
Status on 31 March 2017 = Status on 1 April 2017 7,705 58,269 30,462 10,151 221,716 -4,021 324,282 0 324,282
Earnings after tax 0 0 0 0 54,564 0 54,564 0 54,564
Differences arising from currency translation 0 0 0 -51 0 639 588 0 588
Changes in revaluation reserves 0 0 0 290 0 0 290 0 290
Changes to IAS 39 - Financial Instruments 0 0 0 0 187 0 187 0 187
Changes in actuarial gains and losses 0 0 0 0 -1,286 0 -1,286 0 -1,286
Deferred taxes on neutral changes in equity 0 0 0 32 275 0 307 0 307
Total comprehensive income 0 0 0 271 53,740 639 54,650 0 54,650
Paid hybrid coupon 0 0 0 0 -1,323 0 -1,323 0 -1,323
Distributions 0 0 0 0 -10,000 0 -10,000 0 -10,000
As of 31 March 2018 7,705 58,269 30,462 10,422 264,133 -3,382 367,609 0 367,609
Development of equity

0040 Financial Statements for 2017/18
General principles
SWIETELSKY Baugesellschaft m.b.H., based in 4020 Linz, Edlbacherstraße 10, is the parent company of an international construction group whose business activities are split into five segments: Austria, Germany, Hungary, the Czech Republic and other countries.
Pursuant to Section 245a (2) of the Austrian Business Enterprise Code (UGB), the consolidated financial statements of SWIETELSKY Baugesellschaft m.b.H., Linz, of 31/3/2018 were generated in line with the mandatory provisions of the International Financial Reporting Stan-dards (IFRS) issued by the International Accounting Stan-dards Board (IASB), including the interpretations of the International Financial Reporting Interpretations Committee (IFRIC) as applicable in the European Union. Additionally, the further duties of disclosure set out in Section 245a (1) UGB have been fulfilled.
In addition to the statement of comprehensive income and the balance sheet, a cash flow statement has been gener-ated in line with IAS 7 and a statement of changes in equity has been prepared (IAS 1). The notes also contain a disclosure of business segments in line with IFRS 8.
In order to improve the clarity of the disclosures, various items in the balance sheet and income statement have been condensed. These items are broken down and ex-plained in more detail in the notes. The income statement has been prepared using the total cost method (nature of expense format).
If not stated otherwise, the consolidated financial state-ments are set out in thousands of euros (kEUR), which can result in rounding differences. The term employee in the financial statements refers collectively to both male and female employees. Any other gender-specific designations should otherwise also be understood as referring to both sexes.
Amendments to the accounting standards
SWIETELSKY has implemented all mandatory financial reporting standards adopted by the EU. The relevant financial reporting standards to be used for the first time with the start of the financial year on 1 April 2017 have no significant impact on the representation of the assets, finances and results of operations as at 31 March 2018, as the changes were only applicable in isolated cases. There were no changes to the accounting and valuation methods.
Standards / Interpretationen Applicationdate IASB
Applicationdate EU
IAS 7 Statement of cash flows: Disclosure initiative 1/1/2017 1/1/2017
IAS 12 Income taxes: Recognition of Deferred Tax Assets for unrealised Losses 1/1/2017 1/1/2017
NOTESFOR THE FINANCIAL YEAR 2017/18

0041Notes
The following new or modified standards and interpretations already published by the IASB were not yet mandatory for financial years that started on or before 1 April 2017:
Standards / Interpretationen Applicationdate IASB
Applicationdate EU
IFRS 9 Financial instruments 1/1/2018 1/1/2018
IFRS 15Revenue from contracts with customers(and amendment)
1/1/2018 1/1/2018
IFRS 2Classification and measurementof share-based payment transactions
1/1/2018 1/1/2018
IFRS 4 Insurance contracts 1/1/2018 1/1/2018
IAS 40 Transfers of investment property 1/1/2018 1/1/2018
IFRIC 22 Foreign currency transactionsand advance consideration 1/1/2018 1/1/2018
Various Annual improvements to IFRS 2014-2016 1/1/2018 1/1/2018
IFRS 9 Amendments to financial instruments 1/1/2019 1/1/2019
IFRS 16 Leases 1/1/2019 1/1/2019
IFRS 14 Regulatory deferral accounts 1/1/2016 na
IFRIC 23 Uncertainty over income tax treatments 1/1/2019 na
IAS 28Long-term interests in associates and joint ventures
1/1/2019 na
Various Annual improvements to IFRS 2015-2017 1/1/2019 na
IAS 19 Plan amendment, curtailment or settlement 1/1/2019 na
Conceptual framework 1/1/2020 na
IFRS 17 Insurance contracts 1/1/2021 na
IFRS 10, IAS 28 Sale or contribution of assets between aninvestor and its associate or joint venture na na
FUTURE AMENDMENTS TO THE ACCOUNTING STANDARDS

0042 Financial Statements for 2017/18
The application of the following standards and interpre-tations in particular is expected to have an effect on the consolidated financial statements:
IFRS 15 specifies how and when an IFRS reporter will recognise revenue. Preparers are also required to provide users of financial statements with more informative, relevant disclosures than in the past. The standard provides a single, principles-based five-step model to be applied to all contracts with customers. This replaces the regulations of IAS 11, IAS 18, IFRIC 13, IFRIC 15, IFRIC 18 and SIC-31.
SWIETELSKY expects only a minimal impact on revenue recognition and balance sheet recognition from the first-time adoption of IFRS 15. The revenue recognition of construction contracts over time will continue to be appli-cable. The project development activity results in changes in the time of realisation of profit. IFRS 15 now requires proportionate profit recognition for developer projects that have already been sold but not yet completed. Due to the first application as of April 1, 2018, according to the modified retrospective method, equity will increase by around kEUR 5,000, excluding deferred taxes.
IFRS 9 takes a new approach to the categorisation and measurement of financial assets and now only distinguishes between two measurement categories (fair value or amortised cost), based on the business model of the entity or on the characteristics of the contractual cash flows of the financial asset. Impairments are to be measured using a holistic method.
The financial assets of SWIETELSKY are mainly trade receivables, loans, cash and cash equivalents and securities. Because a large portion of trade receivables attrib uted to ongoing construction projects and for the most part not yet due, the general default risk is classified as low due to the broad diversification of the client base and with the public sector as an important customer group. When measuring on a collective basis (simplified approach) the respective country risk and creditworthi-ness are used. Non-current financial assets are regarded on a case-by-case basis under consideration of the country risk and the debtor’s creditworthiness.
Investments in subsidiaries, joint ventures and associated companies that are not included in the consolidated financial statements and which do not fall under the scope of IFRS 9 will continue to be measured at amor-tised cost, because they are not material.
Due to the first-time adoption of the aforementioned changes, the equity as of 1 April 2018, excluding deferred taxes, will diminish by a total of less than kEUR 500.
IFRS 16 results in changes in accounting for leases and replaces the previous standard IAS 17 and the related interpretations in accounting for leases (IFRIC 4, SIC-15 and SIC-27). In future, for an asset from a lease, the leasee shall classify a usage right as an asset. Classify the lease as a liability and to continue both values. There is relief for terms under 12 months and for low-value assets. The accounting remains virtually unchanged for the lessor.
As the SWIETELSKY group companies act as lessees for leases, the application of IFRS 16 will have an impact on the consolidated financial statement as described above. At this point, no exact quantitative details can be stated as to the current project status (complete survey of the existing rental contracts in the group).
Due to the application of other new standards and inter-pretations, it is expected to have only a minor impact on the consolidated financial statements in the future. Early application of the new standards and interpretations is not planned.

0043Notes
Basis of consolidation
Besides SWIETELSKY Baugesellschaft m.b.H., all major domestic and foreign subsidiaries controlled by the parent company have been included in the consolidated financial statements of 31/3/2018.
For control, the following criteria must be met:
The parent company has power over the investee. The returns of the investment are variable. The parent company has the ability to use its power
over the investee to affect the amount of its returns. If there are indicators that at least one of these criteria
has changed with regard to the investee, the parent company must reassess whether or not it has control.
Regardless of the majority of voting rights, power – and therefore control over an investee – can be acquired through other rights and contractual agreements which give the parent company the opportunity to influence the activities that affect the investee's returns.
The basis of consolidation does not include 29 (previous year: 29) companies whose influence on the financial position, cash flows and results of operations of the group are of lesser significance. The volume of turnover of the subsidiaries not included in the basis of consolidation is approximately 1.3%, of the group's revenue.
Companies currently included in the consolidated financial statements can be found in the list of investments. The balance sheet date for all fully consolidated companies is 31 March 2018.
In the 2017/18 financial year, the basis of consolidation developed as follows:
Full consolidation
Equity measurement
As of 1/4/2017 51 3
of which foreign companies 23 2
Initial consolidations 1 0
As of 31/3/2018 52 3
of which foreign companies 24 2
BASIS OF CONSOLIDATION
Additions to scope of consolidation
In these consolidated financial statements, the following companies were fully consolidated for the first time:
No significant assets and liabilities were included in the initial consolidation. The company included for the first time in the 2017/18 financial year has contributed kEUR 590 to the group revenue and kEUR 146 to the comprehensive income.
COMPANY NAMEDirectshare
Date offoundation
Swietelsky Rail Danmark ApS 100% 6/11/2017

0044 Financial Statements for 2017/18
Consolidation methods
The financial statements of the domestic and foreign companies included in the basis of consolidation have been generated using standard accounting and valuation methods. The financial statements of the domestic and foreign group companies have been adapted accordingly; negligible deviations have not been changed.
The capital consolidation was carried out using the acqui-sition method in accordance with the provisions of IFRS 3. The consideration transferred during the purchase and the identifiable net assets received have been measured at fair value. The resulting goodwill is subjected to an annual impairment test. The income from an acquisition at a price lower than the market value is recognised directly as profit or loss.
With regard to the other non-current equity investments included using the equity method, the same principles are used for capital consolidation as for fully consolidated companies, whereby the last available financial state-ments are used as the basis of the equity consolidation. Amendments to the IFRS accounting standards are made on the principle of materiality.
As part of the consolidation of debt, trade receivables, loans and other receivables are offset against the corres-ponding liabilities and provisions between the subsidiaries included in the consolidated financial statements.
Expenses and income from intra-group trade are elimina-ted. Intercompany profit and loss in the fixed and current assets resulting from intra-group trade is eliminated unless it is of lesser significance. The necessary taxes are deferred for consolidation measures recognised in net profit or loss.
Currency translation
The currency of the group is the euro. Financial state-ments of foreign companies are translated into euros in line with the concept of functional currency. For all companies this is the currency of the country as the companies run their business independently in financial, economic and organisational terms.
The translation of all balance sheet headings, with the exception of those of the equity, is carried out on the basis of the exchange rate on the balance sheet date. Income and expense items are translated using the average annual exchange rate. Goodwill from the capital consolidation is recognised as assets in the local currency and is also translated using the exchange rate on the balance sheet date.
In the financial year, currency translation differences of kEUR 588 (previous year: kEUR 207) were recorded in other comprehensive income as part of the capital consolidation and reported in the currency translation provision in the equity. Differences resulting from currency translation between the exchange rate on the balance sheet date within the balance sheet and the average exchange rate used in the income statement were also recognised in other comprehensive income and offset against the currency translation provision in the equity.
Revaluations under IAS 29 (Financial Reporting in Hyper-inflationary Economies) were not carried out.

0045Accounting and valuation methods
ACCOUNTING AND VALUATIONMETHODSOF SWIETELSKY BAUGESELLSCHAFT M.B.H., LINZ
Intangible fixed assets and tangible fixed assets
The goodwill resulting from mergers is subjected to an annual impairment test. In this test, the recoverable amount of a cash-generating unit is compared to the corresponding carrying amount. The cash-generating unit is the acquired legal entity and legal entities that benefit from the potential synergy of the merger, respectively.
As there are not normally market prices for individual en-tities, the present value of the net cash inflows is used to calculate the fair value less costs of disposal. It is calcu-lated on the basis of current forecasts in internal reports which in turn are based on past experience and expec-tations in connection with future market developments. The detailed planning period is three years; planning years further in the future will be more heavily weighted. The discount rate for the future cash flows corresponds to the weighted average cost of capital (WACC) after taxes, which is calculated on the basis of a peer group. The costs of capital ranged from 6% to 10%.
Intangible fixed assets and tangible fixed assets are initi-ally recognised at historical cost. The cost model is used for subsequent measurement: Acquisition or production costs less scheduled depreciation and impairment. The revaluation model is used for the land, land rights and buildings asset group, including buildings on third-party land. The comparative approach was used to calculate the fair values. Differences resulting from the revaluation, minus deferred taxes, are offset directly against equity.
Lease contracts on the basis of which the company faces essentially all opportunities and risks associated with the assets are treated as finance leases. They are capitalised
at the lower of the fair value of the asset or the present value of the minimum lease payments. Depreciation occurs as scheduled over the foreseeable useful life or contractual term, whichever is shorter.
Payment obligations from future leasing rates are classi-fied as liabilities. In this regard, the present value of the minimum lease payments must be used. In the following years, lease rates are split into interest and amortisation components in order that the lease obligation constantly bears interest. The interest component is recognised in net profit or loss. Expenses for operating lease contracts are recognised on a linear basis in the income statement across the terms of the contracts in question.
The depreciation of limited-life asset is linear across the asset's foreseeable useful life. If, in connection with assets, indications of impairments arise and if the present values of future cash flows are lower than the carrying amounts, the assets will be written down to the lower fair value under IAS 36.
Expenses for repairs and maintenance work which do not significantly extend the planned useful life of an asset are recognised as expenses in the period in which they arose.

Czech Republic, Mezina: road reconstruction
0046 Financial Statements for 2017/18
Intangible fixed assets:
Software and licences 2 – 4 years
Tangible fixed assets:
Buildings 10 – 50 years
Technical equipment and machinery 2 – 20 years
Other equipment, operating and office equipment 2 – 20 years
The following assumed useful lifes were used when calculating the depreciation rates:

0047Accounting and valuation methods
Financial instruments
A financial instrument is a contract which results in the simultaneous creation of a financial asset for one company and a financial liability or equity instrument for another company. They are first recognised in the balance sheet on the settlement date.
In the SWIETELSKY Group, financial assets include cash and cash equivalents, trade receivables, securities, loans and other financial receivables in particular. Financial liabilities include bonds, liabilities to banks, trade payables, liabilities from finance leases and other financial liabilities in particular.
Non-current financial assets include investments in equity instruments classified as available for sale and interest- bearing loans classified as loans and receivables.
Trade receivables and the financial instruments recognised under other receivables and fixed assets are classified as loans and receivables.
Cash and cash equivalents include all soon-to-be-liquid assets that are due in less than three months as of the date of acquisition or investment. Cash and cash equivalents are measured at their amortised cost. Securities recognised under cash and cash equivalents are classified as available for sale, and cash-in-hand and bank credit are classified as loans and receivables. Financial assets classified as available for sale are measured at fair value on the date of their addition and, as far as a fair value can be reliably determined, at their current fair value in later periods.
The changes in value are recognised in other compre-hensive income and are only recognised in the income statement once they crystallise as a result of the disposal of the security. Permanent impairments of securities that were classified as available for sale are recognised in the income statement in other financial results. For debt instruments, reversals of write-downs are recognised in net profit or loss under other financial results and for equity instruments; they are recognised in other comprehensive income and have no effect on net profit or loss. Results from disposal are recognised in the other financial results.
Shares in subsidiaries and investments that are not consolidated or accounted for at equity were measured at historical cost, minus impairments if necessary, as their fair values could not be reliably calculated. These areunquoted equity instruments which are not intended to be
sold. Impairments and results from disposal are recognised in income from non-current investments. A reversal of write-downs is not permissible.
Financial assets classified as loans and receivables are measured at fair value on the date of their addition and at amortised cost in later periods. In so far as they are signifi-cant, non-interest-bearing or low-interest-bearing loans are discounted to present value.
In order to account for general credit risks to receivables from customers, valuation allowances tiered by risk groups have been formed. Individual financial assets are written down if the carrying amount of the financial asset is higher than the present value of the future discounted cash flow. Financial difficulties, insolvency, breach of contract and major delays in payment on the part of the customer are indicators for individual valuation allowances. Additionally, valuation allowances categorised by risk groups are carried out in order to account for general credit risks.
Financial liabilities are classified as financial liabilities at amortised cost and include financial liabilities, trade payab-les and other financial liabilities. Financial liabilities classified as financial liabilities at amortised cost are recognised at fair value minus transaction costs on the date of disbursement. The subsequent measurement is at amortised cost. Any difference between the amount received and the redemp-tion amount is spread over the term using the effective interest method and recognised in other financial results. Non-interest-bearing liabilities, especially those from finance leases, are accounted for using the present value of the repayment obligation.
Foreign currency liabilities are measured using the exchange rate on the balance sheet date.
In the SWIETELSKY Group, derivative financial instruments are used to reduce interest rate risks and foreign currency risks. Under IAS 39, the derivative financial instruments are measured at fair value; attributable transaction costs are recognised in profit or loss.
As part of the subsequent measurement, derivatives are measured at fair value. The resulting changes are recognis-ed in profit or loss. Derivatives are recognised under other receivables or other liabilities. In so far as the requirements for the use of hedge accounting can be met, regulations on accounting for hedging relationships under IAS 39 (hedge accounting) are applied.

0048 Financial Statements for 2017/18
Inventories
Inventories are measured at historical cost or at their lower net realisable value.
The historical costs include all direct costs and reason-able portions of the overheads accrued during produc-tion/acquisition. Sales costs and the costs of general management are not included in the historical costs. In accordance with IAS 23, the attributable borrowing costs have been capitalised for inventories classified as qualifying assets.
Receivables from construction contracts
For receivables from construction contracts, an estimation of outcome is carried out using the percentage of com-pletion method set out in IAS 11. The services actually rendered by the balance sheet date serve to define the stage of completion. Expected losses from the later stages of construction are taken into account in full by corresponding devaluations.
If the measured service rendered as part of a construction contract should exceed the prepayments received, it will be recognised as an asset under receivables from construction contracts. If the opposite should happen, the service will be recognised as a liability under trade payables.
The outcomes of construction contracts being carried out in project consortiums are estimated using the percent- age of completion method on the basis of the services actually rendered by the balance sheet date. Expected losses from the later stages of construction are taken into account in full by corresponding devaluations and provi-sions. The receivables and liabilities from and to project consortiums contain capital contributions, cash receipts, cash payments, charges resulting from services and the proportional profit or loss from the contract.
Deferred taxes
The balance sheet liability method is used to calculate the tax accrual for all temporary differences between the carrying amounts of the balance sheet headings in the IFRS consolidated financial statements and the existing tax
values in the various companies. Furthermore, the expec-ted tax benefit from existing loss carryforwards is included in the calculation. Exceptions from this comprehensive tax accrual are differences from non-tax-deductible goodwill as well as temporary differences relating to investments in subsidiaries and associates, as long as the group is able to control the reversal of these differences, yet does not intend to do so.
Deferred tax assets are only accounted for if it is likely that the tax benefit they contain can be realised. The calculation of deferred tax is based on the standard income tax rate in the country in question on the date of the probable reversal of the value difference.
Provisions
Due to the statutory provisions, provisions for severance payments have been made in Austria. Provisions for severance payments are calculated based on actuarial evaluations. In this regard, the probable entitlement over the term of employment of an employee is collected with consideration for salary increases in the future. The pre-sent value of the partial entitlement earned by the balance sheet date is accounted for as a provision.
Pension provisions are calculated using the projected unit credit method. In the projected unit credit method, the discounted pension entitlement acquired by the balance sheet date is calculated.
Due to the applicability of IAS 19 (2011), changes to the calculation parameters (actuarial gains and losses) are recognised directly in other comprehensive income, minus deferred taxes.
The other provisions cover all identifiable risks and liabili-ties whose amounts or grounds are unknown. Essentially, these are provisions for guarantees, expected losses, remaining and subsequent work and process costs. Each is accounted for at the amount judged to be necessary on the balance sheet date in order to cover future payment obligations of the group. In each case, the amount proving to be the most probable after a careful examination of the matter is accounted for.
Unless they are of lesser significance, non-current provisions are recognised at their discounted settlement

0049Accounting and valuation methods
value on the balance sheet date. The settlement value also includes the cost increases to be taken into account on the balance sheet date.
Contingent liabilities
Contingent liabilities are potential or existing liabilities for which an outflow of resources is not probable. They are not recognised in the balance sheet. The obligations disclosed under contingent liabilities correspond to the liabilities that exist on the balance sheet date.
Revenue recognition
Revenues from the completion of contracts are conti-nuously recognised using the percentage of completion method. Services actually rendered by the balance sheet date serve to define the stage of completion. Addenda in the sense of construction contracts are services which cannot be billed due to the contractual agreements, as an agreement is yet to be reached with the client in con-nection with their chargeability and acknowledgement. Whereas costs are immediately recognised in net profit or loss when they are accrued, revenue from addendais generally only realised after the client provides his written acknowledgement or with payment, if the payment is received before the written acknowledgement.
Revenue from the sale of development projects, trade, services for project consortiums, other services and resul-ting from the sale of construction materials is recognised upon the transfer of power of disposal and the associated opportunities and risks, or upon the performance of the service.
Estimates and assumptions
Estimates and assumptions concerning the amount and recognition of assets and liabilities on the balance sheet, income and expenses and the disclosure of contingent liabilities are necessary when generating the consolidated financial statements in accordance with IFRS and essen-tially concern the assessment of construction projects until the end of construction, especially the amount of realised profits, the recognition and measurement of provisions and impairment tests on assets.
For future-based assumptions and estimates on the balance sheet date, prevailing circumstances on the date of the generation of the consolidated financial statements and the realistic future development of global and indust-ry-specific environments are taken into consideration with regard to the expected levels of business in the future.Changes to these general conditions that deviate from assumptions can cause the amounts actually generated to differ from estimated values. In the event of such a development, assumptions and, if necessary, the carrying amounts of the assets and liabilities in question will be adjusted in light of the new knowledge. On the date of the generation of the consolidated financial statements, there are no indications to imply that major changes to fundamental assumptions and estimates are necessary.

0050 Financial Statements for 2017/18
Austria, Dornbirn: residential building, Mühlegasse

0051Consolidated income statement
FIGURES IN THOUSAND EUR 2017/18 2016/17
Cost of materials -501,706 -434,945
Cost of purchased services -953,021 -769,536
-1,454,727 -1,204,481
(1) Revenue
The revenue of kEUR 2,213,417 (previous year: kEUR 1,904,973) is attributed to revenue from construc-tion contracts, revenue from developer projects, trade to and services for project consortia, as well as other services. The revenue is also broken down by region in the segment report.
(3) Expenses for material and other purchased construction output
The cost of purchased services concerns subcontractors and tradesmen in particular, as well as planning services, equipment rentals and other third-party services:
FIGURES IN THOUSAND EUR 2017/18 2016/17
Profits from the sale of tangible fixed assets 2,192 3,145
Insurance refunds 5,431 3,535
Currency translation gains 1,553 1,785
Furtherances 1,043 3,994
Others under kEUR 1,000 5,419 4,754
15,638 17,213
(2) Other operating income
The revenue from the completion of contracts, which contain the partial profits recognised over a given period based on the degree of completion of each contract (the percentage of completion method), are kEUR 2,159,060 (previous year: kEUR 1,836,435).
Revenue provides only an incomplete picture of the cons-truction output generated in the financial year. Additionally, therefore, the segment report illustrates the full output of the group which also contains the proportional services of the project consortiums, unconsolidated companies and companies recognised at equity.
CONSOLIDATED INCOME STATEMENTNOTES ON THE ITEMS

0052 Financial Statements for 2017/18
(4) Employee benefits expenses
FIGURES IN THOUSAND EUR 2017/18 2016/17
Wages -231,154 -220,769
Salaries -188,896 -179,104
Expenses for severance payments andpayments into employee welfare funds
-9,783 -8,875
Post-employment benefit costs -452 -659
Expenses for mandatory social security contributionsand income-based contributions and compulsory contributions
-105,843 -88,077
Voluntary social security expenses -7,316 -5,937
-543,444 -503,421
Average number ofblue-collar worker 6,151 / white-collar worker 3,324
Average number ofblue-collar worker 5,822 / white-collar worker 3,135
2017/18 2016/17
9,475PERSONNEL
8,957PERSONNEL
(5) Depreciation and amortisation
Scheduled depreciation and write-downs of intangible fixed assets and tangible fixed assets are set out in the statement of changes in fixed assets. In the financial year, no unscheduled impairments to tangible fixed assets of
were made (previous year: kEUR 1,169). Impairments of goodwill of kEUR 1,126 were recognised (previous year: kEUR 0).
Expenses for severance payments and payments into employee welfare and pension funds contain service costs and interest component of the addition to the provision. The expenses from defined pension schemes are kEUR 8,277 (previous year: kEUR 7,664).
The average number of employees is as follows:

Hungary, Budapest: renovation Castle Garden Bazaar
0053Consolidated income statement
Expenses for research and development result from a number of specific technical proposals, real projects on the market and the introduction of construction methods and products to the market, and were therefore recognis-ed as expenses in their entirety.
(6) Other operating expenses
The expenses accrued for the financial year for the group auditor KPMG Austria GmbH Wirtschaftsprüfungs- und Steuerberatungsgesellschaft total kEUR 333, of which kEUR 299 results from the audit of the consolidated financial statements (including the financial statements of various affiliated companies) and kEUR 34 results from other services.
FIGURES IN THOUSAND EUR 2017/18 2016/17
Operating taxes -4,111 -3,427
Rentals and leases -35,714 -36,595
Maintenance and service -14,066 -12,161
Insurance expenses -15,181 -14,054
Projects, planning, monitoring -7,800 -15,051
Vehicle expenses, fleet -9,499 -8,398
Travel expenses -10,478 -8,897
Advertising, public relations -14,752 -9,662
Legal and tax advice, audits -6,461 -8,020
Currency translation losses -1,778 -1,743
Other provisions -1,154 -1,076
Others under kEUR 1,000 -28,464 -25,685
-149,458 -144,769

0054 Financial Statements for 2017/18
FIGURES IN THOUSAND EUR 2017/18 2016/17
Income from associated companies 2,946 2,195
Profit from project consortiums 14,888 16,478
Losses from project consortiums -944 -682
16,890 17,991
FIGURES IN THOUSAND EUR 2017/18 2016/17
Income from non-current equity investments 4,175 12,953
Losses from non-current equity investments -3,949 -1,401
226 11,552
FIGURES IN THOUSAND EUR 2017/18 2016/17
Changes to IAS 39 – Financial Instruments -46 285
Changes in actuarial gains and losses IAS 19 321 449
Changes to revaluation reserves 32 28
307 762
FIGURES IN THOUSAND EUR 2017/18 2016/17
Actual taxes -14,408 -7,671
Deferred taxes -9,095 -4,798
-23,503 -12,469
(7) Share of results of associates
(8) Net income from investments
(9) Income tax
Both the taxes on income and deferred taxes paid or owed by the various companies are recognised as taxes on income:
The following tax components are recognised directly in equity in the statement of comprehensive income:

Croatia, Ploče: motorway
0055Consolidated income statement
The causes of the difference between the Austrian group tax rate of 25% and the recognised group tax rate are as follows:
FIGURES IN THOUSAND EUR 2017/18 2016/17
Earnings before tax 78,067 68,611
Theoretical tax expenditure of 25% 19,517 17,153
Differences to foreign tax rates -2,456 -2,162
Tax-neutral expenses and income 3,208 -76
Changes in tax rates 0 417
Tax-free investment income / equity measurement of associated companies -1,760 -2,127
Changes to estimates of deferred taxes 741 -86
Aperiodic effects and other non-temporary differences 4,253 -650
Recognised income tax expense 23,503 12,469

0056 Financial Statements for 2017/18
Austria, Altmannsdorf: residential building

0057
(10) Intangible fixed assets and tangible fixed assets
The composition and development of the intangible fixed assets, goodwill and tangible fixed assets are set out in the consolidated statement of changes in fixed assets.
No borrowing costs were capitalised in the financial year as no major qualifying assets were acquired or produced.
Goodwill
The goodwill on the balance sheet date results from the following mergers:
The comparison between the carrying amounts and the recoverable amounts of the cash-generating units as part of the annual impairment test resulted in a goodwill impairment of kEUR 1,126 (previous year: kEUR 0). The recoverable amount of the impaired cash-generating unit amounts to kEUR 3,654.
FIGURES IN THOUSAND EUR 31/3/2018 31/3/2017
CELL-BahnBau Danubia Kft. 4,458 4,458
Bahnbau Petri Hoch- und Tiefbau Gesellschaft m.b.H. 2,244 2,244
Metallbau Wastler GmbH & Co. KG 701 1,827
SWIETELSKY stavebni s.r.o. 1,157 1,157
Swietelsky Baugesellschaft m.b.H., Traunstein 565 565
9,125 10,251
Consolidated balance sheet
CONSOLIDATEDBALANCE SHEETNOTES ON THE ITEMS
0058 Financial Statements for 2017/18
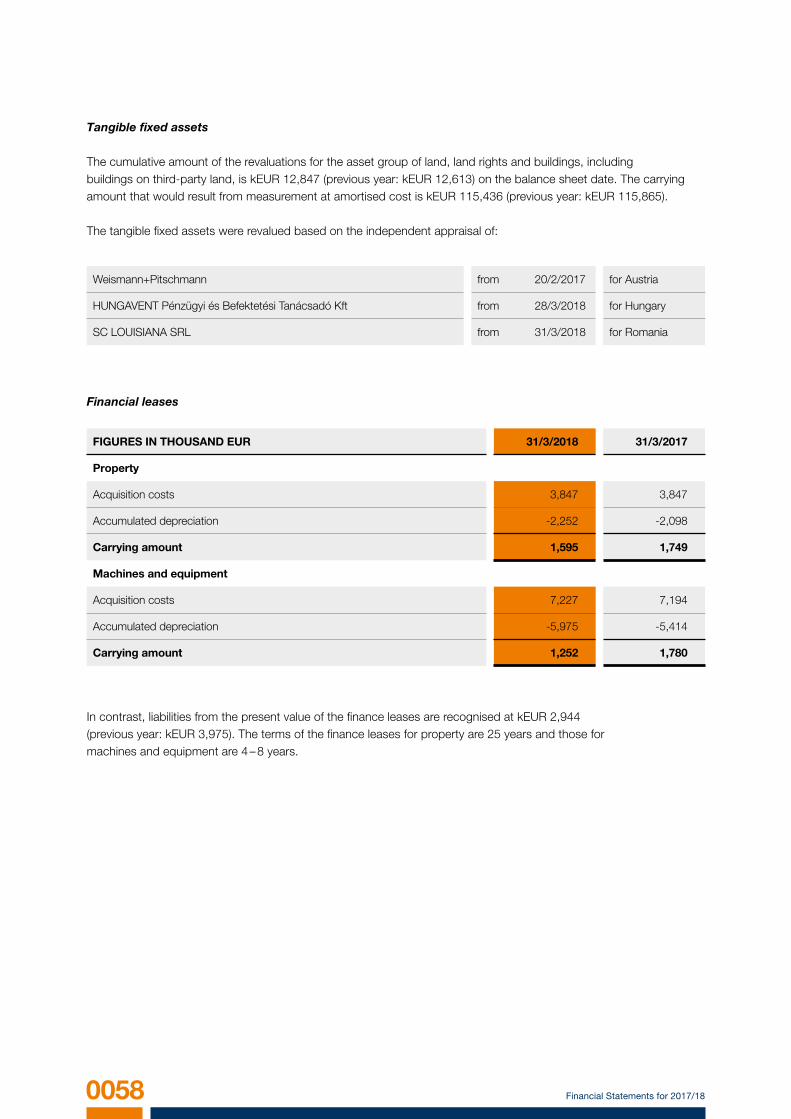
Tangible fixed assets
The cumulative amount of the revaluations for the asset group of land, land rights and buildings, includingbuildings on third-party land, is kEUR 12,847 (previous year: kEUR 12,613) on the balance sheet date. The carrying amount that would result from measurement at amortised cost is kEUR 115,436 (previous year: kEUR 115,865).
The tangible fixed assets were revalued based on the independent appraisal of:
Financial leases
In contrast, liabilities from the present value of the finance leases are recognised at kEUR 2,944 (previous year: kEUR 3,975). The terms of the finance leases for property are 25 years and those for machines and equipment are 4 – 8 years.
Weismann+Pitschmann from 20/2/2017 for Austria
HUNGAVENT Pénzügyi és Befektetési Tanácsadó Kft from 28/3/2018 for Hungary
SC LOUISIANA SRL from 31/3/2018 for Romania
FIGURES IN THOUSAND EUR 31/3/2018 31/3/2017
Property
Acquisition costs 3,847 3,847
Accumulated depreciation -2,252 -2,098
Carrying amount 1,595 1,749
Machines and equipment
Acquisition costs 7,227 7,194
Accumulated depreciation -5,975 -5,414
Carrying amount 1,252 1,780

Austria, Tyrol: Kitzbühel railway station
0059Consolidated balance sheet
The reconciliation of minimum leasing payments on the liabilities set to 31 March from finance leases are as follows:
The following liabilities will result from these lease contracts in coming financial years:
FIGURES IN THOUSAND EUR 31/3/2018 31/3/2017
Minimum lease payments 3,139 4,502
Interest -195 -527
Lease obligation 2,944 3,975
Present values Minimum lease payment
FIGURES IN THOUSAND EUR 31/3/2018 31/3/2017 31/3/2018 31/3/2017
Term up to one year 1,318 1,050 1,368 1,138
Term between one and five years 500 1,703 521 1,877
Term over five years 1,127 1,222 1,250 1,487
2,944 3,975 3,139 4,502

Austria, Linz: Promenadengalerien
0060 Financial Statements for 2017/18
Operating leases
Besides the financial lease contracts, operating lease contracts exist for the use of technical equipment and machinery and operating and office equipment. The ex-penses from these contracts are recognised in net profit or loss. The payments made in the financial year totalled
Restrictions on disposition/purchase obligations
No restrictions on disposition or material obligations in connection with the acquisition of tangible fixed assets that are not already accounted for in the consolidated financial statements exist as of the balance sheet date.
kEUR 17,775 (previous year: kEUR 19,642). The following liabilities will result from these operating lease contracts in coming financial years:
FIGURES IN THOUSAND EUR 31/3/2018 31/3/2017
Term up to one year 18,397 19,193
Term between one and five years 34,673 35,645
Term over five years 8,451 11,850
61,521 66,687

Czech Republic, Ondřejov: road and bridge construction
0061Consolidated balance sheet
(11) Non-current financial assets and investments in associates
More detailed information on the group's investments (with shareholdings of over 20%) can be found in the list of investments.
Disclosures on associated companies
Associated companies are not listed on the stock exchange; the summarised financial information (100%) is as follows:
FIGURES IN THOUSAND EUR 31/3/2018 31/3/2017
Revenue 98,315 98,464
Earnings after tax 7,095 4,136
Other income 1,424 -2,335
Total comprehensive income 8,519 1,801
Non-current fixed assets 89,341 28,245
Current fixed assets 24,894 70,156
Non-current liabilities -71,328 -39,634
Current liabilities -23,837 -41,216
Net assets 19,070 17,551

0062 Financial Statements for 2017/18
From the aforementioned project consortiums in the 2017/18 financial year, kEUR 7,348 was recognised under share of results of associates as results from project consortiums.
FIGURES IN THOUSAND EUR RevenueNon-current fixed assets
Current fixed assets
of which liquid capital
Non-currentliabilities
Current liabilities
ATA 158,779 1,282 89,527 28,219 0 90,809
ATCOST 158,443 6,430 289,201 13,212 0 295,631
ATF 72,036 44,130 61,640 3,824 0 105,770
Arena 15,352 46 4,086 2,724 0 4,132
UF Zwettl 12,724 0 3,806 3,718 0 3,806
Disclosures on project consortiums
Within the group, construction project consortiums are classified as joint ventures and their results are recognised under share of results of associates. The table below shows the largest project consortiums for the 2017/18 financial year.
100% of the financial information has been disclosed.
PROJECT CONSORTIUM (short) Share in %
Arge Tunnel Albaufstieg ATA 21.00
Arge ATCOST 21 ATCOST 15.00
Arge Tunnel Fröschnitzgraben ATF 50.00
Arge Generali Arena Arena 33.33
Arge Umfahrung Zwettl UF Zwettl 33.33

0063Consolidated balance sheet
FIGURES IN THOUSAND EUR 31/3/2018 31/3/2017
Services rendered 229,485 117,583
Services received 2,605 22,200
Receivables on 31 March 37,926 42,471
Liabilities on 31 March 21,161 11,692
From the aforementioned project consortiums in the 2016/17 financial year, kEUR 7,313 was recognised under share of results of associates as results from project consortiums.
Services of project consortiums were engaged as follows in the financial year:
FIGURES IN THOUSAND EUR RevenueNon-current fixed assets
Current fixed assets
of which liquid capital
Non-currentliabilities
Current liabilities
ATA 136,205 2,103 60,273 9,094 0 62,376
ATCOST 147,449 12,178 241,795 13,906 0 253,973
ATF 51,015 13,038 39,873 4,052 0 52,911
UF Zwettl 19,087 0 4,093 3,076 0 4,093
Pistensanierung 10,844 0 2,586 1,691 0 2,586
100% of the financial information has been disclosed.
PROJECT CONSORTIUM (short) Share in %
Arge Tunnel Albaufstieg ATA 21.00
Arge ATCOST 21 ATCOST 15.00
Arge Tunnel Fröschnitzgraben ATF 50.00
Arge Umfahrung Zwettl UF Zwettl 33.33
Arge Pistensanierung Pistensanierung 30.00
The table below shows the largest project consortiums for the 2016/17 financial year.

0064 Financial Statements for 2017/18
(12) Inventories
FIGURES IN THOUSAND EUR 31/3/2018 31/3/2017
Raw materials, consumables and supplies 34,077 27,299
Land for developer and construction projects 48,222 40,606
Finished products and goods 1,774 1,303
84,073 69,208
With regard to inventories, no notable valuation allowances were recognised in connection with the net realisable value in the financial year. Borrowing costs in the production of significant qualifying assets were not capitalised, as in the previous year.
Austria, Zwettl: B38 bypass

0065Consolidated balance sheet
FIGURES IN THOUSAND EUR 31/3/2018 31/3/2017
All contracts not billed by the balance sheet date:
Expenses accrued by the balance sheet date 1,523,482 1,162,640
Income generated by the balance sheet date 78,643 63,777
Accumulated losses -28,852 -21,086
Minus construction contracts with affiliated companies, project consortiums and other non-current investees and investors
-148,010 -50,904
Minus receivables recognised as liabilities -506,517 -309,573
Receivables from construction contracts 918,746 844,780
Receivables from construction contracts totalling kEUR 506,517 (previous year: kEUR 309,573) are recog-nised under liabilities, as the prepayments here exceeded the receivables.
As usual in the construction industry, the customer has the contractual right to retain part of the total amount of the invoice. As a rule these retentions are, however, redeemed by collateral bank or group guarantees.
(13) Trade receivables, other receivables and assets
Receivables from construction contracts are as follows:
FIGURES IN THOUSAND EUR 31/3/2018 31/3/2017
Total of whichcurrent
of whichnon-
currentTotal of which
current
of whichnon-
current
Receivables fromconstruction contracts 918,746 918,746 0 844,780 844,780 0
Advances received -760,771 -760,771 0 -720,090 -720,090 0
157,975 157,975 0 124,690 124,690 0
Other trade receivables 158,956 156,633 2,323 113,120 106,345 6,775
Receivables fromproject consortiums 37,926 37,926 0 42,471 42,471 0
Trade receivables 354,857 352,534 2,323 280,281 273,506 6,775
of which financial assets 354,857 352,534 2,323 280,281 273,506 6,775

0066 Financial Statements for 2017/18
FIGURES INTHOUSAND EUR
31/3/2018 31/3/2017
Total of whichcurrent
of whichnon-
currentTotal of which
current
of whichnon-
current
Receivables fromaffiliated companies
9,531 9,519 12 14,246 14,246 0
Receivables fromassociated companies
4,061 121 3,940 336 336 0
Receivables fromother non-currentinvestees and investors
14,330 14,330 0 9,326 9,326 0
Other receivables andprepaid expenses
26,614 25,182 1,432 28,097 26,572 1,525
Other receivables and assets
54,536 49,152 5,384 52,005 50,480 1,525
of which financial assets 40,916 35,557 5,359 33,924 32,420 1,504
of which non-financial assets 13,620 13,595 25 18,081 18,060 21
The valuation allowances on other trade receivables were as follows in the financial year:
The individual valuation allowances consist of numerous individual items, none of which is considered significant on its own. No significant valuation allowances existed for other financial receivables and other financial assets on the balance sheet date.
FIGURES IN THOUSAND EUR 31/3/2018 31/3/2017
As of 1 April 36,394 33,622
Currency translation 55 152
Addition/utilisation/release 947 2,620
As of 31 March 37,396 36,394
Other trade receivablesbefore valuation allowance
234,278 191,985
Valuation allowances -37,396 -36,394
Carrying amount on 31 March 196,882 155,591
0067
(14) Cash and cash equivalents
FIGURES IN THOUSAND EUR 31/3/2018 31/3/2017
Securities 66,846 1,922
Cash-in-hand, bank balances 440,921 315,329
507,767 317,251
(15) Deferred taxes
Due to the currently applicable tax provisions, it can be assumed that differences between the amount of the equity interest and the proportional equity of subsidiaries included in the consolidated financial statements resulting from accumulated profits will essentially remain tax-free. As there is also no intent to sell, under IAS 12.39 no tax deferral was carried out.
Deferred taxes on loss carryforwards were capitalised in so far as they can likely be offset against taxable profits in the future. Tax write-downs on investments must be spread over a period of seven years in accordance with the Austrian Corporation Tax Act (KStG). The deferred taxes on open depreciation (one-seventh) of kEUR 1,333 (previous year: kEUR 1,699) are reported in the deferred tax assets from reserves.
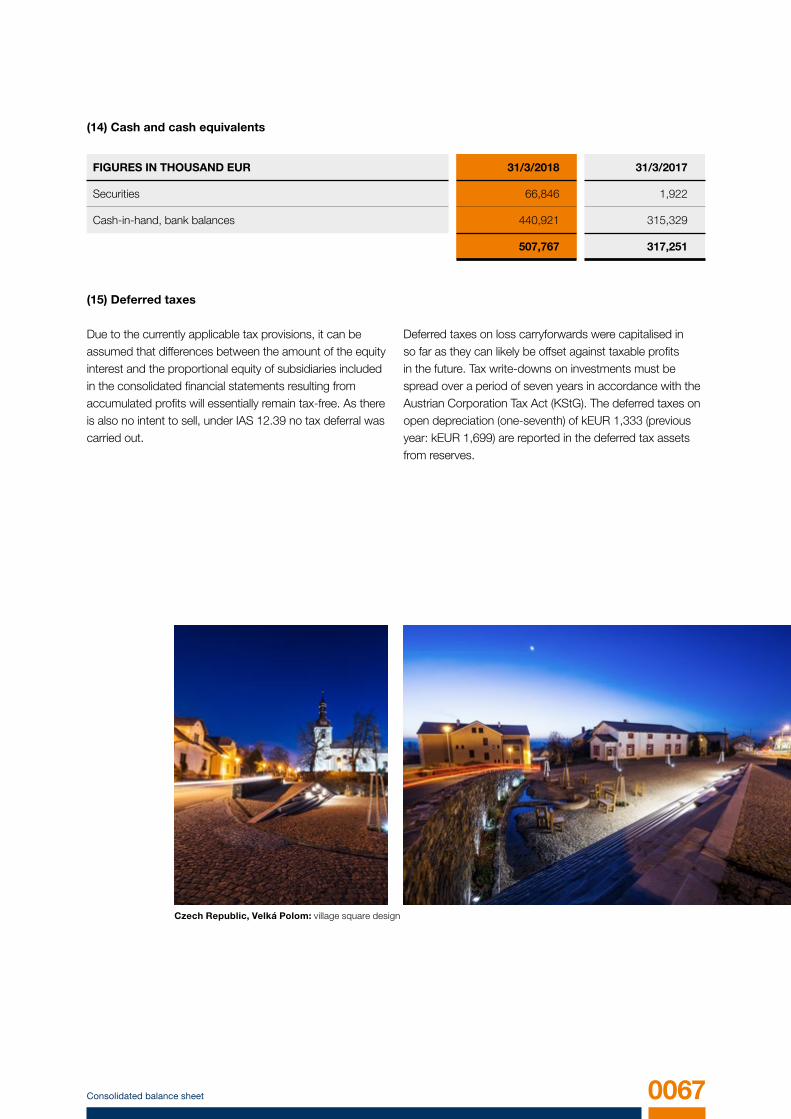
Czech Republic, Velká Polom: village square design
Consolidated balance sheet
0068 Financial Statements for 2017/18
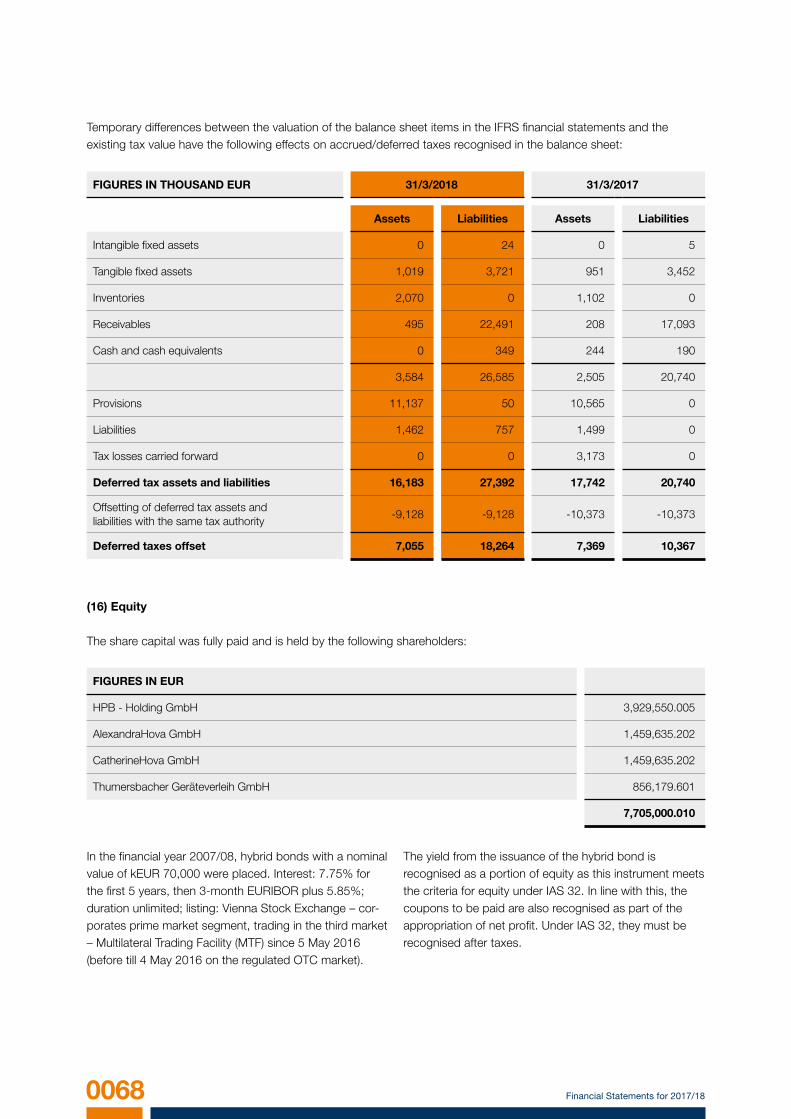
Temporary differences between the valuation of the balance sheet items in the IFRS financial statements and the existing tax value have the following effects on accrued/deferred taxes recognised in the balance sheet:
(16) Equity
The share capital was fully paid and is held by the following shareholders:
FIGURES IN THOUSAND EUR 31/3/2018 31/3/2017
Assets Liabilities Assets Liabilities
Intangible fixed assets 0 24 0 5
Tangible fixed assets 1,019 3,721 951 3,452
Inventories 2,070 0 1,102 0
Receivables 495 22,491 208 17,093
Cash and cash equivalents 0 349 244 190
3,584 26,585 2,505 20,740
Provisions 11,137 50 10,565 0
Liabilities 1,462 757 1,499 0
Tax losses carried forward 0 0 3,173 0
Deferred tax assets and liabilities 16,183 27,392 17,742 20,740
Offsetting of deferred tax assets andliabilities with the same tax authority
-9,128 -9,128 -10,373 -10,373
Deferred taxes offset 7,055 18,264 7,369 10,367
FIGURES IN EUR
HPB - Holding GmbH 3,929,550.005
AlexandraHova GmbH 1,459,635.202
CatherineHova GmbH 1,459,635.202
Thumersbacher Geräteverleih GmbH 856,179.601
7,705,000.010
In the financial year 2007/08, hybrid bonds with a nominal value of kEUR 70,000 were placed. Interest: 7.75% for the first 5 years, then 3-month EURIBOR plus 5.85%; duration unlimited; listing: Vienna Stock Exchange – cor-porates prime market segment, trading in the third market – Multilateral Trading Facility (MTF) since 5 May 2016 (before till 4 May 2016 on the regulated OTC market).
The yield from the issuance of the hybrid bond is recognised as a portion of equity as this instrument meets the criteria for equity under IAS 32. In line with this, the coupons to be paid are also recognised as part of the appropriation of net profit. Under IAS 32, they must be recognised after taxes.

0069Consolidated balance sheet
FIGURES IN THOUSAND EURBalance
as of 1/4/2017
Currencytranslation
Additions Reversal UtilisationBalance
as of 31/3/2018
Provision for:
Severance payments 21,730 0 2,419 0 1,553 22,596
Pensions 276 0 22 0 19 279
Non-current provisions 22,005 0 2,441 0 1,572 22,875
Taxes 6,258 7 8,911 0 3,799 11,377
Other:
Construction-related 61,718 329 32,501 5,296 26,995 62,256
Other 6,350 75 11,003 0 189 17,240
Current provisions 74,326 411 52,415 5,296 30,983 90,873
Total 96,331 411 54,856 5,296 32,555 113,748
(17) Provisions
Repurchases of the hybrid bond have been made in the nominal value of kEUR 38,594, so far. In accordance with IAS 32.33, the own repurchased equity instruments are deducted from the equity. Fees paid are recognised directly in the equity.
The various components of the equity and the changes they have undergone can be found in the statement of changes in equity.
Czech Republic, Rožnov pod Radhoštěm: reconstruction of the existing sports area

0070 Financial Statements for 2017/18
The amount of provisions for severance payments is cal-culated using actuarial methods on basis of the pension tables set out in AVOE 2008-P (employees). A discount rate of 2.00% (previous year: 1.85%) and a salary-related promise of salary increase of 2.50% (previous year: 2.00%) was used as the basis.
The development of provisions for pensions is shown below:
In the financial year 2017/18, all actuarial losses resulted from financial assumptions – none were caused by demographic assumptions. On the balance sheet date, severance payment obligations had a weighted duration of approximately 11 years (previous year: 11 years).
The development of the provisions for severance payments is shown below:
In the following sensitivity analysis, effects of changes in the essential parameters on the carrying amounts are described:
FIGURES IN THOUSAND EUR 31/3/2018 31/3/2017
Present value of the defined benefit obligation (DBO) as of 1 April 21,730 18,992
Changes to the basis of consolidation 0 1,039
Service cost 879 808
Interest expense 385 364
Severance payments -1,689 -1,253
Actuarial losses realised 1,291 1,780
Present value of the defined benefit obligation (DBO) as of 31 March 22,596 21,730
FIGURES IN THOUSAND EUR 31/3/2018 31/3/2017
Present value of the defined benefit obligation (DBO) as of 1 April 276 256
Service cost 15 14
Interest expense 5 5
Pension payments -12 -14
Actuarial losses realised -5 15
Present value of the defined benefit obligation (DBO) as of 31 March 279 276
CHANGES Parameters DBO
Interest rate -1.00% +1.00% +11.70% -9.90%
Salary increase -0.50% +0.50% -5.10% +5.50%

0071Consolidated balance sheet
CHANGES Parameters DBO
Interest rate -1.00% +1.00% +17.30% -13.80%
Pension increase -0.25% +0.25% -2.50% +2.60%
The amount of provisions for pensions is calculated using actuarial methods on the basis of the pension tables set out in AVOE 2008-P (employees). A discount rate of 2.00% (previous year: 1.85%) and an increase in the pension commitment of 1.00% (previous year: 1.00%) was used as the basis. In the 2017/18 financial year, all actuarial losses resulted from financial assumptions – none were caused by demographic assumptions. On the balance sheet date, the DBO had a weighted duration of approximately 16 years (previous year: 16 years).
The pension provision is formed for obligations from entitlements and ongoing payments to active and former employees and their survivors. Obligations mainly concern
Since May 2017, due to searches of the premises of more than 50 Austrian construction companies, we know that, among others, SWIETELSKY Baugesellschaft m.b.H. has been affected by proceedings carried out by the Austrian Federal Competition Authority and the Central Public Prosecutor's Office for Combating Economic Crimes and Corruption. The action is based on a reasonable suspicion that illegal anticompetitive horizontal agreements allegedly took place in a number of tender procedures between the affected companies.Based on the information currently available, the possi-bility cannot be ruled out that the suspicion established in the searches, including that relating to SWIETELSKY Baugesellschaft m.b.H., is justified in cases, which are not yet clearly defined. A conviction of SWIETELSKY Baugesellschaft m.b.H. for participation in horizontal pri-ce fixing could – if viewed abstractly – have the following consequences for the company: financial penalties in the event of breaches of the ban on cartels; compensation claims of any aggrieved clients on the basis of an anti-trust conviction; in the event of SWIETELSKY employees being convicted, corporate financial penalties on the basis of the Austrian Corporate Responsibility act.
Construction-related provisions essentially contain provisions for guarantee obligations, contingent losses, obligations from remaining and subsequent work and costs of litigation.
retirement pensions. Individual commitments are normally based on the length of service of the employee on the date of the commitment (including the employee's positi-on and remuneration). No new commitments have been entered into since 1993.
The company pension scheme consists of an unfunded defined-benefit pension system. Defined-benefit pension plans oblige the company to render promised services to active and former employees.
In the following sensitivity analysis, effects of changes in essential parameters on the carrying amounts are described:
The situation is extremely complex and still only starting to be clarified. Therefore, it is not possible to make any rough or indicative quantification of these breaches and any impending pecuniary consequences for SWIETELSKY Baugesellschaft m.b.H at the present state of knowledge.
In April 2018 another proceeding by the Central Public Prosecutor's Office for Combating Economic Crimes and Corruption became known. The subject of these investigations is primarily the suspicion that predominantly former employees of SWIETELSKY Baugesellschaft m.b.H. may have acted corruptly in connection with Romanian construction projects. Within the framework of the responsibility of legal entities, SWIETELSKY is accused of being associated with their employees’ criminal acts. This investigation is in its early stages and it is not possible to predict with reasonable certainty what the outcome of the investigation will be or to quantify – even only roughly or indicatively – the pecuniary consequences for SWIETELSKY at the present state of knowledge.
The estimated costs of legal representation for both proceedings have been considered in provisions.

0072 Financial Statements for 2017/18
(18) Liabilities and other liabilities
FIGURES IN THOUSAND EUR
31/3/2018 31/3/2017
Financial liabilities: Total of whichcurrent
of whichnon-
currentTotal of which
current
of whichnon-
current
Bonds 74,067 0 74,067 129,603 0 129,603
Liabilities to banks 4,408 1,285 3,123 6,446 1,441 5,005
Liabilities from financial leases 2,944 1,317 1,627 3,975 1,049 2,926
81,419 2,602 78,817 140,024 2,490 137,534
In the financial year 2010/11, bonds with a nominal value of kEUR 75,000 were placed. Interest of 5.375%; term from April 2010 to April 2017; listed at the Vienna Stock Exchange – corporates prime market segment, third market – Multi-lateral Trading Facility (MTF) since 5 May 2016 (before till 4 May 2016 on the regulated OTC market). In the financial year 2015/16, bonds were repurchased with a nominal value of kEUR 19,447 (valuated on 23 March 2016).
Another bond with a nominal value of kEUR 85,000 was issued in the 2012/13 financial year, interest of 4.625%; term from October 2012 to October 2019; listed at the Vienna Stock Exchange – corporates prime market segment, third market – Multilateral Trading Facility (MTF) since 5 May 2016 (before till 4 May 2016 on the regulated OTC market). In the financial year 2015/16, bonds were repurchased with a nominal value of kEUR 10,912 (valuated on 23 March 2016).
No physical securities were supplied in order to safeguard liabilities to banks.
Australia, Hunter Valley: tamping operations

0073Consolidated balance sheet
FIGURES IN THOUSAND EUR
31/3/2018 31/3/2017
Trade payables: Total of whichcurrent
of whichnon-
currentTotal of which
current
of whichnon-
current
Receivables fromconstruction contracts
-506,517 -506,517 0 -309,573 -309,573 0
Advances received 803,826 803,826 0 388,192 388,192 0
297,309 297,309 0 78,619 78,619 0
Other trade payables 338,665 311,984 26,681 263,357 239,565 23,792
Liabilities to project consortiums 21,161 21,161 0 11,692 11,692 0
657,135 630,454 26,681 353,668 329,876 23,792
of which financial liabilities 657,135 630,454 26,681 353,668 329,876 23,792
FIGURES IN THOUSAND EUR
31/3/2018 31/3/2017
Other liabilities: Total of whichcurrent
of whichnon-
currentTotal of which
current
of whichnon-
current
Liabilities toaffiliated companies
325 325 0 522 522 0
Liabilities toassociated companies
1,635 1,635 0 0 0 0
Liabilities toother non-currentinvestees and investors
848 848 0 641 641 0
Other liabilities 104,121 94,744 9,377 104,256 95,036 9,220
106,929 97,552 9,377 105,419 96,199 9,220
of which taxes 9,272 9,272 0 10,943 10,943 0
of which social security 3,717 3,709 8 3,847 3,838 9
of which liabilities and accruals in connection with personnel
79,168 70,302 8,866 73,030 65,315 7,715
of which financial liabilities 12,960 12,457 503 15,276 13,780 1,496
of which non-financial liabilities 93,969 85,095 8,874 90,143 82,419 7,724

0074 Financial Statements for 2017/18
Austria, Schwechat: OMV office building

0075
The cash flow statement was generated using the indirect method, and is separated into cash flows resulting from business, investment and financing activities. The effects of changes to the basis of consolidation have been eliminated and are recognised in the cash flow from investment activities.
(19) Cash and cash equivalents
FIGURES IN THOUSAND EUR 31/3/2018 31/3/2017
Securities (Bundesschatzscheine) 60,000 0
Cash-in-hand, bank balances 440,921 315,329
Liquid funds 500,921 315,329
Other Securities 6,846 1,922
Cash and cash equivalents 507,767 317,251
FIGURES IN THOUSAND EUR 31/3/2018 31/3/2017
Interest paid (including hybrid interest) 10,651 10,946
Interest received (including hybrid interest) 3,041 3,006
Tax paid 9,445 14,416
The cash flow from operating activities comprised the following items in the reporting year:
NOTES ON THE CASH FLOW STATEMENT
Notes on the cash flow statement
OF SWIETELSKY BAUGESELLSCHAFT M.B.H., LINZ

0076 Financial Statements for 2017/18
The SWIETELSKY Group holds primary financial instru-ments, essentially non-current financial assets, trade receivables, bank balances, financial liabilities and trade payables. The list of primary financial instruments can be found in the balance sheet.
(20) Financial instruments, financial risk and capital management
Financial assets and liabilities are classified and catego-rised as follows in accordance with IAS 39 and IAS 17:
ASSETS
FIGURES IN THOUSAND EUR Balance sheet itemCategory
under IAS 39
Carrying amount
31/3/2018
Carrying amount
31/3/2017
Assets not measured at fair value:
Shares in affiliated companies 1) AfS * 1,341 1,299
Loans to affiliated companies 1) AfS * 394 530
Other investments 1) AfS * 14,074 13,043
Other loans 1) LaR 3,043 2,766
Receivables from construction contracts 2) N/A 157,975 124,690
Trade receivables 2) LaR 196,882 155,591
Receivables from affiliated companies 3) LaR 9,531 14,246
Receivables from associated companies 3) LaR 4,062 336
Receivables from other non-current investees and investors 3) LaR 14,330 9,326
Other financial receivables 3) LaR 12,993 10,016
Cash-in-hand, bank balances 4) LaR 440,921 315,329
Assets measured at fair value:
Securities 4) AfS 66,846 1,922
Total financial assets (assets) 922,392 649,094
NOTES ON THE FINANCIAL INSTRUMENTS AND ON CAPITAL MANAGEMENTOF SWIETELSKY BAUGESELLSCHAFT M.B.H., LINZ
1) Other non-current financial assets2) Trade receivables3) Other receivables and fixed assets4) Cash and cash equivalents
AfS – Available for saleLaR – Loans and receivables
* As the equity instruments are unquoted and their fair value can thus not be calculated with a sufficient degree of reliability, they are measured at historical cost.

0077
LIABILITIES
FIGURES IN THOUSAND EUR Balance sheet itemCategory
under IAS 39
Carrying amount
31/3/2018
Carrying amount
31/3/2017
Liabilities not measured at fair value:
Bonds 1) FLaC 74,067 129,603
Liabilities to banks 1) FLaC 4,408 6,446
Liabilities from finance leases 1) N/A 2,944 3,975
Liabilities from construction contracts 2) N/A 297,309 78,619
Trade payables 2) FLaC 359,826 275,049
Liabilities to affiliated companies 3)
FLaC 325 522
Liabilities toassociated companies 3)
FLaC 1,635 0
Liabilities toother non-current investees and investors 3)
FLaC 848 641
Other financial liabilities 3) FLaC 10,152 14,113
Total financial obligations (liabilities) 751,514 508,968
Czech Republic: road reconstruction
Notes
1) Financial liabilities 2) Trade payables 3) Other liabilities
FLaC - Financial liabilities at amortised cost

0078 Financial Statements for 2017/18
2016/17
FIGURES IN THOUSAND EUR LaR AfS FLaC AtFVtP&L Sum
Interest and similar income/expenses 1,771 91 -7,197 0 -5,335
Reversals of write-downs/impairments 2,772 0 0 0 2,772
Fair value measurement 0 0 0 0 0
Results from disposal 0 1,106 0 0 1,106
Net result 4,543 1,197 -7,197 0 -1,457
2017/18
FIGURES IN THOUSAND EUR LaR AfS FLaC AtFVtP&L Sum
Interest and similar income/expenses 1,759 27 -4,559 0 -2,773
Reversals of write-downs/impairments 1,002 0 0 0 1,002
Fair value measurement 0 0 0 0 0
Results from disposal 0 0 0 0 0
Net result 2,761 27 -4,559 0 -1,771
The net result from financial instruments by class or IAS 39 category is as follows:
Dividends and expenses from investments recognised as investment income are not a component of the net result. Impairments, reversals of write-downs and results from disposal classed as loans and receivables and financial liabilities at amortised cost are recognised in other opera- ting income and other operating expenses.
Principles of financial risk management
The SWIETELSKY Group faces credit, market and liquidity risks in connection with its assets, liabilities and scheduled transactions. The goal of financial risk management is to control and limit these risks.
Principles of financial risk management are defined by the management and monitored by the supervisory board.
The group treasury and the decentralised treasury units are responsible for implementing financial risk manage-ment. Individual risks are minimised by means of deriva-tive financial instruments. The use of derivative financial instruments by the group is subject to corresponding approval and control procedures. On 31/3/2018, the balance sheet date, as in the previous year there were no open derivatives.
Interest rate risk
Essentially, interest rate risk results from bank balances and liabilities to banks which are subject to variable inte-rest rates. This is because the risk exists in rising interest costs or falling interest received resulting from an adverse change in market interest rates.
AfS - Available for Sale LaR - Loans and Receivables
FLaC - Financial Liabilities at amortised CostAtFVtP&L - At Fair Value through Profit or Loss

0079
FIGURES IN THOUSAND EURCarryingamount
31/3/2018
Averageinterest rate
2017/18
Carryingamount
31/3/2017
Averageinterest rate
2016/17
EUR 92,615 0.16% 152,182 0.05%
HUF 278,486 0.02% 102,493 0.00%
RON 26,080 0.01% 26,462 0.00%
CZK 23,122 0.01% 16,150 0.06%
GBP 4,812 0.10% 6,904 1.15%
PLN 9,396 0.33% 6,565 1.00%
HRK 2,702 0.01% 1,356 0.09%
Other 3,708 0.05% 3,217 0.07%
440,921 315,329
FIGURES IN THOUSAND EURCarryingamount
31/3/2018
Averageinterest rate
2017/18
Carryingamount
31/3/2017
Averageinterest rate
2016/17
AUD 4,373 3.96% 6,435 4.20%
Other 35 0.00% 11 0.00%
4,408 6,446
Bank balances subject to variable interest rates
Liabilities to banks subject to variable interest rates
If the market interest rate on 31/3/2018 were 50 basis points higher, the earnings after tax and equity would have been kEUR 1,637 (previous year: kEUR 1,158) higher. A drop in the market interest rate by 50 basis points would have caused an equal reduction in earnings after tax and equity.
Calculations were made on the basis of these financial assets and liabilities on the balance sheet date. In doing so, it was implied that the risk on the balance sheet date essentially represents the risk during the financial year. The group tax rate of 25% is used as the tax rate. In the analysis, all other variables – especially exchange rates – are assumed to be constant.
Notes

0080 Financial Statements for 2017/18
CURRENCY
Closingrate
31/3/20181 euro =
Average rateof exchange
2017/181 euro =
Closingrate
31/3/20171 euro =
Average rateof exchange
2016/171 euro =
HUF 312.0000 310.2383 308.2000 310.8658
CZK 25.3900 25.8858 27.0300 27.0355
GBP 0.8769 0.8816 0.8573 0.8430
RON 4.6570 4.6073 4.5515 4.5005
PLN 4.2100 4.2182 4.2220 4.3587
HRK 7.4330 7.4533 7.4370 7.4972
NOK 9.6500 9.5324 9.1810 9.1415
AUD 1.6008 1.5204 1.3985 1.4564
DKK 7.4547 7.4419 na na
Foreign exchange risk
Essentially, risk results from bank balances, liabilities to banks in foreign currencies and trade payables and receivables in euros in connection with subsidiaries whose functional currencies are not the euro. However, the decentralised structure of the group means that
A 10% appreciation or devaluation of the euro on 31/3/2018 would have resulted in a change in earnings after tax and equity of kEUR 2,658 (previous year: kEUR 5,681).
Calculations were carried out on the basis of the portfolio of financial assets and liabilities on the balance sheet date. Foreign exchange risks from euro items in subsidi-
Performance of the major group currencies
most foreign currency items are naturally closed because the majority of receivables and liabilities from business activities are recognised in the same currency. The credit financing and assessment of the group companies mainly took place in the currency of the country in question.
aries whose currencies are not the euro were attributed to the foreign exchange risk of the functional currency of each subsidiary. Differences caused by the translation of financial statements into the group currency as a result of the exchange rates have not been changed. The group tax rate of 25% is used as the tax rate. In the analysis, all other variables – especially interest rates – are assumed to be constant.

0081Notes
Other market price risks
Besides foreign exchange and interest rate risks, the SWIETELSKY Group is exposed to other price risks resul-ting from financial assets and liabilities, which are however of lesser significance to the group.
Credit risk
Due to the wide dispersion of and ongoing credit checks on our customers, credit risk of receivables from custo-mers can be classified as low. Likewise, the default risk for the other primary financial instruments recognised as assets is to be considered low as the financial partners of the group are all financial institutes with the highest levels of credit-worthiness. The carrying amounts of the financial assets classed as assets represent the maximum default risk.
Receivables from construction contracts of kEUR 157,975 (previous year: kEUR 124,690) and receivables from joint ventures amounting to
kEUR 37,926 (previous year: kEUR 42,471) relate to ongoing construction projects and are therefore largely not yet due. From the other receivables from deliveries and services in the amount of kEUR 158,956 (previous year: kEUR 113,120), only a negligible amount is overdue and not impaired.
Additionally, as is standard in the industry, project consortiums in which companies of the SWIETELSKY Group hold a stake are jointly and severally liable with the other partners and there are bank guarantees, mainly for tender, contractual fulfilment and guarantee obligations and advance payments.
Counter-liabilities for performance guarantees where an outflow of resources is improbable exist to the value of kEUR 80,386 (previous year: kEUR 57,106) on 31/3/2018.
Additionally, a derived credit risk of kEUR 4,917 (previous year: kEUR 2,565) resulting from the liabilities for associ-ated companies and other investments assumed through payment guarantees.
Germany, Ornautal: motorway A94, Ornautal Bridge
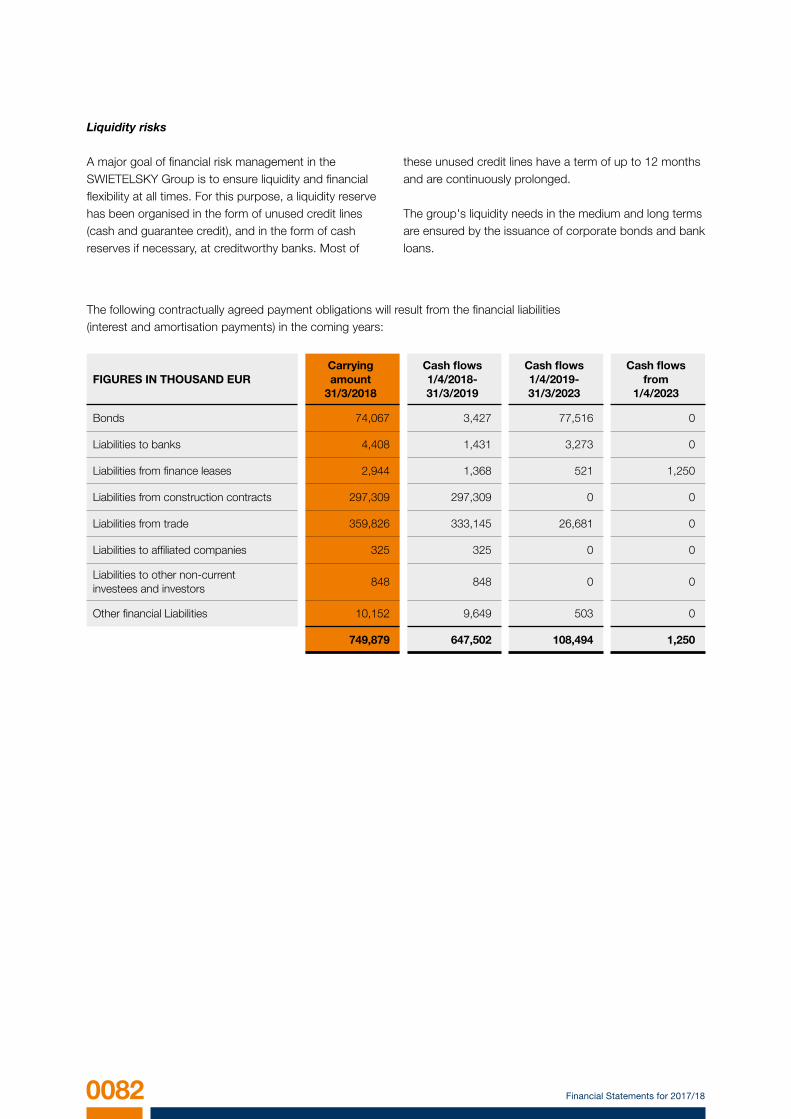
0082 Financial Statements for 2017/18
FIGURES IN THOUSAND EURCarryingamount
31/3/2018
Cash flows1/4/2018-31/3/2019
Cash flows1/4/2019-31/3/2023
Cash flowsfrom
1/4/2023
Bonds 74,067 3,427 77,516 0
Liabilities to banks 4,408 1,431 3,273 0
Liabilities from finance leases 2,944 1,368 521 1,250
Liabilities from construction contracts 297,309 297,309 0 0
Liabilities from trade 359,826 333,145 26,681 0
Liabilities to affiliated companies 325 325 0 0
Liabilities to other non-current investees and investors
848 848 0 0
Other financial Liabilities 10,152 9,649 503 0
749,879 647,502 108,494 1,250
Liquidity risks
A major goal of financial risk management in the SWIETELSKY Group is to ensure liquidity and financial flexibility at all times. For this purpose, a liquidity reserve has been organised in the form of unused credit lines (cash and guarantee credit), and in the form of cash reserves if necessary, at creditworthy banks. Most of
The following contractually agreed payment obligations will result from the financial liabilities (interest and amortisation payments) in the coming years:
these unused credit lines have a term of up to 12 months and are continuously prolonged.
The group's liquidity needs in the medium and long terms are ensured by the issuance of corporate bonds and bank loans.

0083Notes
FIGURES IN THOUSAND EURCarryingamount
31/3/2017
Cash flows1/4/2017-31/3/2018
Cash flows1/4/2018-31/3/2022
Cash flowsfrom
1/4/2022
Bonds 129,603 61,966 80,941 0
Liabilities to banks 6,446 1,679 5,365 0
Liabilities from finance leases 3,975 1,121 1,838 1,487
Liabilities from construction contracts 78,619 78,619 0 0
Liabilities from trade 275,049 251,257 23,792 0
Liabilities to affiliated companies 522 522 0 0
Liabilities to other non-current investees and investors
641 641 0 0
Other financial Liabilities 14,113 12,617 1,496 0
508,968 408,422 113,432 1,487
Interest payments were calculated on the basis of the most recently fixed interest rates on or before 31/3/2018 and 31/3/2017. Planned figures for new liabilities in the future are not included. Financial liabilities that can be repaid at any time are always allocated to the earliest maturity bucket.
Czech Republic, Prague: mobile noise barrier

0084 Financial Statements for 2017/18
Fair value hierarchy
The following tables list the financial assets and liabilities measured at fair value and the financial assets and liabili-ties not measured at fair value by their valuation methods in line with the three-level fair value hierarchy of the IFRS. The various levels reflect the significance of the input factors used for the measured and are defined as follows:
Level 1: Level 1 inputs are quoted prices in active mar-kets for identical assets or liabilities. The SWIETELSKY Group currently holds bonds, investment funds and (few) shares that are attributable to this Level and whose fair value matches the market or calculated value.
Level 2: Level 2 inputs are inputs other than quoted market prices included within Level 1 that are observable for the asset or liability, either directly (i.e. as a price) or indirectly (i.e. derived from prices). Liability insurance measured at the redemption value of the reserve on the balance sheet date is attributable to this level.
Carrying amounts, fair values and fair value hierarchy of the financial assets and financial liabilities measured at fair value
Level 3: Level 3 inputs are input factors for the asset or liability which are not based on observable market data (unobservable input factors). In so far as relevant, non-current financial assets, bonds, liabilities to banks and liabilities from finance leases are assigned to this level if no market prices are available. The fair values are calculated using the discounted cash flow method and therefore represent the present values of the associated payments with consideration for the current market parameters (especially interest rates, exchange rates, the creditworthiness of the counterparty in connection with receivables and the default risk in connection with liabilities).
If the input factors used to determine the fair value of a financial asset or financial liability can be assigned tovarious levels of the fair value hierarchy, the entire mea-surement at fair value will be assigned to the level of the fair value hierarchy corresponding to the lowest essential input factor for the measurement as a whole.
The group recognises reclassifications between the various levels of the fair value hierarchy at the end of the reporting period in which the change took place. No reclassifications between levels were carried out during the financial year.
FIGURES IN THOUSAND EUR 31/3/2018 Carrying amount Fair value Level 1 Level 2 Level 3
Assets measured at fair value:
Securities 66,846 66,846 66,563 283 0
FIGURES IN THOUSAND EUR 31/3/2017 Carrying amount Fair value Level 1 Level 2 Level 3
Assets measured at fair value:
Securities 1,922 1,922 1,639 283 0

0085Notes
Carrying amounts, fair values and fair value- hierarchy of the financial assets and financial liabilities not measured at fair value
The cash and cash equivalents, trade receivables, other financial receivables, trade payables and other financial liabilities have mostly short residual terms.
Offsetting of financial assets and financial liabilities
In the SWIETELSKY Group, financial assets and financial liabilities are not offset against one another in the balance sheet. Offsetting agreements only exist in connection with derivative financial instruments. However, there were no open derivative financial instruments on 31/3/2018 or 31/3/2017.
Liabilities to banks and liabilities from finance leases are subject to variable interest rates. Therefore, with these financial instruments the management assumes that the carrying amount is a reasonable approximation of the fair value. The fair values of these financial instruments are therefore not disclosed in the following table. Likewise, the fair values of instruments classified as available for sale (at cost) are not disclosed in the following table. The carrying amounts can be found in the table.
Capital management
The goal of capital management is to achieve a strong capital basis that continues to generate a rate of return for the shareholders that matches the risk situation of the company, supports the future development of the company and can be put to good use for other interest groups as well. The management exclusively considers the booked equity as capital in accordance with IFRS. The equity ratio on the balance sheet date was 27.3% (previous year: 31.5%).
The capital management strategy of the company aims for the group companies to have a large enough equity base to meet the local requirements. All external capital requirements were met in the reporting year.
FIGURES IN THOUSAND EUR 31/3/2018 Carrying amount Fair value Level 1 Level 2 Level 3
Assets not measured at fair value:
Bonds 74,067 78,348 78,348 0 0
Liabilities to banks 4,408 0 0 0 0
Liabilities from finance leases 2,944 0 0 0 0
81,419 78,348 78,348 0 0

0086 Financial Statements for 2017/18
(21) Disclosure of business segments
Division of segments
The segments are divided based on internal reporting (the management approach). As the construction market is highly region-based, SWIETELSKY is mainly run from a regional perspective. The group's internal organisational and management structures, and therefore also the internal reports, follow these regional divisions and are therefore reported to the chief operating decision maker.
Segment report
The disclosure of business segments takes place on the basis of internal reporting and is further reconciled to the revenue and EBT of the individual business segments.
External construction output are services rendered in the segment in question with no internal cost allocation. The segment investments contain additions to intangible fixed assets, tangible fixed assets and non-current financial
The operative business of the SWIETELSKY Group is split into 5 segments: Austria, Germany, Hungary, CzechRepublic and other countries. The segment entitled other countries contains Romania, Croatia, Slovakia, Poland, Great Britain, Italy, Norway, the Netherlands, Denmark and Australia. The segments are defined by the country in which the head-quarters of the company are located. The services within and between the segments are billed at market prices.
The following construction output were rendered in the segments:
assets. No segment assets have been disclosed as this is not a component of regular management reports.
Information on major customers
In the same way as last year, no external customer gene-rated more than 10% of the group's turnover.
Austria Germany Hungary Czech Republic Other countries
Road construction Road construction Road construction Road construction Road construction
Railway construction Railway construction Railway construction Railway construction Railway construction
Building construction Building construction Building construction Building construction Building construction
Civil engineering Civil engineering Civil engineering Civil engineering Civil engineering
Tunnel construction x x x x

0087Notes
FIGURES IN THOUSAND EUR Austria Germany HungaryCzech
RepublicOther
countriesConsoli-dation Group
External construction output 1,434,890 309,970 270,489 210,675 150,442 0 2,376,466
Reconciliation with IFRS financial statements
-163,049
Revenue 1,395,864 301,303 301,711 230,551 137,319 -153,331 2,213,417
Segment result 51,898 9,843 16,324 5,633 1,338 0 85,036
Included in the segment result:
Interest income 5,038 236 547 48 87
Interest expense -8,989 -285 -31 -84 -809
Depreciation and amortisation -27,009 -7,848 -1,970 -3,202 -4,326
Share of results of associates 16,245 2,105 0 1,542 0
Reconciliation with IFRS financial statements
-6,969
Earnings before tax (EBT) 39,144 13,953 16,312 8,814 844 -1,000 78,067
Investments 56,649 17,930 3,994 5,337 4,104 0 88,014
External order backlog 1,521,527 328,224 705,890 276,799 284,434 0 3,116,874
FIGURES IN THOUSAND EUR Austria Germany HungaryCzech
RepublicOther
countriesConsoli-dation Group
External construction output 1,277,850 247,418 194,398 187,266 116,588 0 2,023,520
Reconciliation with IFRS financial statements
-118,547
Revenue 1,272,610 246,652 201,064 203,706 104,804 -123,863 1,904,973
Segment result 41,301 10,731 23,423 4,562 -7,989 0 72,028
Included in the segment result:
Interest income 5,221 23 658 27 92
Interest expense -11,838 -428 -51 -73 -828
Depreciation and amortisation -25,346 -6,519 -2,070 -2,772 -4,151
Share of results of associates 16,599 1,862 0 1,317 -404
Reconciliation with IFRS financial statements
-3,417
Earnings before tax (EBT) 39,486 15,264 22,372 3,414 -6,788 -5,137 68,611
Investments 64,209 9,734 1,801 7,171 2,509 1,556 86,980
External order backlog 1,333,382 204,612 250,022 117,985 84,291 0 1,990,292
SEGMENT INFORMATION 2017/18
SEGMENT INFORMATION 2016/17

0088 Financial Statements for 2017/18
(22) Disclosures on affiliated companies
HPB – Holding GmbH is a shareholder of SWIETELSKY Baugesellschaft m.b.H. which provides consulting servi-ces for the Group at market conditions.
Thumersbacher Geräteverleih GmbH is a shareholder of SWIETELSKY Baugesellschaft m.b.H. which renders machine and equipment rental services and consultancy services for the group at standard market rates.
Dr. Günther Grassner (chairman of the supervisory board) is a partner of the office RECHTSANWÄLTE GRASSNER LENZ THEWANGER + PARTNER, Linz, which renders con-sultancy services for the group at standard market rates.
Dr. Norbert Nagele (vice-chairman of the supervisory board) is a partner of the office HASLINGER/NAGELE & PARTNER RECHTSANWÄLTE GMBH which renders con-sultancy services for the group at standard market rates.
Services rendered Receivables
FIGURES IN THOUSAND EUR 2017/18 2016/17 31/3/2018 31/3/2017
Thumersbacher Geräteverleih GmbH 139 95 82 8
RECHTSANWÄLTE GRASSNER LENZTHEWANGER + PARTNER
33 7 0 0
FIGURES IN THOUSAND EUR 2017/18 2016/17
Other non-current equity investments, project consortiums -129,865 -105,283
IFRS measurements -33,184 -13,264
Reconciliation -163,049 -118,547
FIGURES IN THOUSAND EUR 2017/18 2016/17
Investment income -6,671 -4,102
IFRS measurements -298 685
Reconciliation -6,969 -3,417
The major reconciliation items are the result of unconsolidated companies, project consortiums and IFRS measurements.
Reconciliation of the construction output with revenue:
Reconciliation of the segment result with earnings before tax (EBT):

0089Notes
The following affiliated persons subscribed to a subordinateddebenture (hybrid bond):
Additionally, the following affiliated persons subscribed to the bond issued in October 2012:
FIGURES IN THOUSAND EUR
Thumersbacher Geräteverleih GmbH (Shareholder) 8,330
HPB – Holding GmbH (Shareholder) 900
Andreas Brustmann (Shareholder) 245
Catherine Brustmann (Shareholder) 175
Dr. André Hovaguimian(Shareholder, member of the
supervisory board)450
Peter Gal (Managing Director) 5
Dipl.-Ing. Walter Pertl (Managing Director) 15
Adolf Scheuchenpflug (Managing Director) 20
FIGURES IN THOUSAND EUR
Thumersbacher Geräteverleih GmbH (Shareholder) 250
Dipl.-Ing. Walter Pertl (Managing Director) 25
Services received Liabilities
FIGURES IN THOUSAND EUR 2017/18 2016/17 31/3/2018 31/3/2017
HPB – Holding GmbH 180 180 0 0
Thumersbacher Geräteverleih GmbH 3 3 0 0
Dr. André Hovaguimian 180 180 0 0
RECHTSANWÄLTE GRASSNER LENZTHEWANGER + PARTNER 329 373 0 0
HASLINGER/NAGELE & PARTNERRECHTSANWÄLTE GMBH
7 12 2 0
As of the balance sheet date, the shareholders are not entitled or subject to any offsetting claims or obligations as a result of statutory dividends.

0090 Financial Statements for 2017/18
Austria, Zwettl: B38 bypass

0091Notes
PETER GAL DIPL.-ING. WALTER PERTL ADOLF SCHEUCHENPFLUG DIPL.-ING. KARL WEIDLINGER
(23) Disclosures on elements and employees
The following persons were active as Managing Directors in the financial year:
Peter GalDipl.-Ing. Walter Pertl Adolf Scheuchenpflug Dipl.-Ing. Karl Weidlinger
The following members were part of the supervisory board of the company in the financial year:
Dr. Günther Grassner Chairman (since 1/4/2018; before vice-chairman)Dr. Norbert Nagele Vice-chairman (since 1/4/2018; before chairman)Dipl.-Ing. Werner BaierDr. André HovaguimianIng. Franz Rohr Mag. Karl Schlögl Manuel Madurski Andrea SteinkellnerBruno Wyhs
The expenses for salaries contain the total earnings of the members of the management which amounted to kEUR 7,981 (previous year: kEUR 6,352). The expenses for severance payments of kEUR 971 (previous year: kEUR 378) relates to members of the management in key positions.
Remuneration of kEUR 363 (previous year: kEUR 357) was paid to the members of the supervisory board.
(24) Date of approval for publication
In Austria, the consolidated financial statements of limited liability companies (GmbH companies) are prepared by the management and approved by the supervisory board. The supervisory board of SWIETELSKY Baugesellschaft m.b.H. will convene on 23 July 2018 to approve the consolidated interim financial statements of 31/3/2018.
(25) Extraordinary events after the closing of the financial year
No extraordinary events took place after the closing of the financial year.
Linz, 13 July 2018
The management

0092 Financial Statements for 2017/18
Historical costs Cumulative depreciation Carrying amounts
FIGURES IN THOUSAND EUR As of 1/4/2017
Changes to the basis
of consoli-dation
Currency translation
Reclassifi-cations Additions Disposals As of
31/3/2018As of
1/4/2017
Changes to the basis
of consoli-dation
Currency translation
Reclassifi-cations Additions Disposals As of
31/3/2018As of
31/3/2018As of
31/3/2017
I. Intangible fixed assets:
1. Software and licences 9,384 0 1 156 966 104 10,403 8,249 0 1 0 754 103 8,901 1,502 1,135
2. Goodwill 10,251 0 0 0 0 0 10,251 0 0 0 0 1,126 0 1,126 9,125 10,251
19,635 0 1 156 966 104 20,654 8,249 0 1 0 1,880 103 10,027 10,627 11,386
II. Property, plant and equipment:
1. Land, land rights and buildings, including buildings on third-party land (basic value kEUR 42,243; previous year: kEUR 41,682)
172,023 0 544 4,285 2,232 3,789 175,295 43,545 0 204 0 4,505 1,242 47,012 128,283 128,478
2. Technical equipment and machinery
335,449 0 94 11,172 41,812 8,670 379,857 222,257 0 374 0 33,582 7,990 248,223 131,634 113,192
3. Other equipment, operating and office equipment
55,125 0 -34 1,169 8,424 2,720 61,964 39,844 0 -21 0 5,726 2,437 43,112 18,852 15,281
4. Assets under construction 6,064 0 20 -16,783 30,151 2,269 17,183 0 0 0 0 0 0 0 17,183 6,064
568,661 0 624 -156 82,619 17,448 634,298 305,646 0 557 0 43,813 11,670 338,347 295,952 263,015
588,296 0 625 0 83,585 17,552 654,953 313,895 0 558 0 45,693 11,773 348,373 306,579 274,401
CONSOLIDATED STATEMENT OF CHANGES INFIXED ASSETSAS OF 31 MARCH 2018

0093Consolidated statement of changes in fixed assets
Historical costs Cumulative depreciation Carrying amounts
FIGURES IN THOUSAND EUR As of 1/4/2017
Changes to the basis
of consoli-dation
Currency translation
Reclassifi-cations Additions Disposals As of
31/3/2018As of
1/4/2017
Changes to the basis
of consoli-dation
Currency translation
Reclassifi-cations Additions Disposals As of
31/3/2018As of
31/3/2018As of
31/3/2017
I. Intangible fixed assets:
1. Software and licences 9,384 0 1 156 966 104 10,403 8,249 0 1 0 754 103 8,901 1,502 1,135
2. Goodwill 10,251 0 0 0 0 0 10,251 0 0 0 0 1,126 0 1,126 9,125 10,251
19,635 0 1 156 966 104 20,654 8,249 0 1 0 1,880 103 10,027 10,627 11,386
II. Property, plant and equipment:
1. Land, land rights and buildings, including buildings on third-party land (basic value kEUR 42,243; previous year: kEUR 41,682)
172,023 0 544 4,285 2,232 3,789 175,295 43,545 0 204 0 4,505 1,242 47,012 128,283 128,478
2. Technical equipment and machinery
335,449 0 94 11,172 41,812 8,670 379,857 222,257 0 374 0 33,582 7,990 248,223 131,634 113,192
3. Other equipment, operating and office equipment
55,125 0 -34 1,169 8,424 2,720 61,964 39,844 0 -21 0 5,726 2,437 43,112 18,852 15,281
4. Assets under construction 6,064 0 20 -16,783 30,151 2,269 17,183 0 0 0 0 0 0 0 17,183 6,064
568,661 0 624 -156 82,619 17,448 634,298 305,646 0 557 0 43,813 11,670 338,347 295,952 263,015
588,296 0 625 0 83,585 17,552 654,953 313,895 0 558 0 45,693 11,773 348,373 306,579 274,401
Hungary, Budapest: metro line M5

0094 Financial Statements for 2017/18
CONSOLIDATED STATEMENT OF CHANGES INFIXED ASSETSAS OF 31 MARCH 2017
Historical costs Cumulative depreciation Carrying amounts
FIGURES IN THOUSAND EUR As of 1/4/2016
Changes to the basis
of consoli-dation
Currency translation
Reclassifi-cations Additions Disposals As of
31/3/2017As of
1/4/2016
Changes to the
basis ofconsoli-dation
Currency translation
Reclassifi-cations Additions Disposals As of
31/3/2017As of
31/3/2017As of
31/3/2016
I. Intangible fixed assets:
1. Software and licences 8,646 478 13 -7 655 401 9,384 7,730 225 13 -3 669 385 8,249 1,135 916
2. Goodwill 8,424 0 0 0 1,826 0 10,251 0 0 0 0 0 0 0 10,251 8,424
17,070 478 13 -7 2,482 401 19,635 7,730 225 13 -3 669 385 8,249 11,386 9,340
II. Property, plant and equipment:
1. Land, land rights and buildings, including buildings on third-party land (basic value kEUR 33,136; previous year: kEUR 32,550)
149,047 5,991 275 2,042 17,312 2,644 172,023 38,634 791 44 3 5,736 1,663 43,545 128,478 110,413
2. Technical equipment and machinery
294,632 1,351 402 2,148 49,137 12,221 335,447 200,731 1,067 29 0 30,814 10,384 222,257 113,192 93,901
3. Other equipment, operating and office equipment
48,601 1,335 79 452 6,940 2,282 55,125 35,782 1,178 64 0 4,877 2,057 39,844 15,281 12,819
4. Assets under construction 4,052 41 5 -4,635 6,797 196 6,064 0 0 0 0 0 0 0 6,064 4,052
496,332 8,718 761 7 80,186 17,343 568,661 275,147 3,036 137 3 41,427 14,104 305,646 263,015 221,185
513,402 9,196 774 0 82,668 17,744 588,296 282,877 3,262 150 0 42,096 14,489 313,895 274,401 230,526

0095Consolidated statement of changes in fixed assets
Historical costs Cumulative depreciation Carrying amounts
FIGURES IN THOUSAND EUR As of 1/4/2016
Changes to the basis
of consoli-dation
Currency translation
Reclassifi-cations Additions Disposals As of
31/3/2017As of
1/4/2016
Changes to the
basis ofconsoli-dation
Currency translation
Reclassifi-cations Additions Disposals As of
31/3/2017As of
31/3/2017As of
31/3/2016
I. Intangible fixed assets:
1. Software and licences 8,646 478 13 -7 655 401 9,384 7,730 225 13 -3 669 385 8,249 1,135 916
2. Goodwill 8,424 0 0 0 1,826 0 10,251 0 0 0 0 0 0 0 10,251 8,424
17,070 478 13 -7 2,482 401 19,635 7,730 225 13 -3 669 385 8,249 11,386 9,340
II. Property, plant and equipment:
1. Land, land rights and buildings, including buildings on third-party land (basic value kEUR 33,136; previous year: kEUR 32,550)
149,047 5,991 275 2,042 17,312 2,644 172,023 38,634 791 44 3 5,736 1,663 43,545 128,478 110,413
2. Technical equipment and machinery
294,632 1,351 402 2,148 49,137 12,221 335,447 200,731 1,067 29 0 30,814 10,384 222,257 113,192 93,901
3. Other equipment, operating and office equipment
48,601 1,335 79 452 6,940 2,282 55,125 35,782 1,178 64 0 4,877 2,057 39,844 15,281 12,819
4. Assets under construction 4,052 41 5 -4,635 6,797 196 6,064 0 0 0 0 0 0 0 6,064 4,052
496,332 8,718 761 7 80,186 17,343 568,661 275,147 3,036 137 3 41,427 14,104 305,646 263,015 221,185
513,402 9,196 774 0 82,668 17,744 588,296 282,877 3,262 150 0 42,096 14,489 313,895 274,401 230,526
Austria, Vienna: bridge construction, Südbahnhof

0096 Financial Statements for 2017/18
31/3/2018
Currency Registeredcapital
Group share
A.S.T. Baugesellschaft m.b.H. AT Innsbruck kEUR 35 100%
Bahnbau Petri Hoch- und Tiefbau Gesellschaft m.b.H AT Fischamend kEUR 40 100%
Baumeister Karl Sedlmayer Gesellschaft mit beschränkter Haftung
AT Grafenwörth kEUR 400 100%
C. Peters Baugesellschaft m.b.H. AT Linz kEUR 105 100%
Duswald Bau GmbH AT Neumarkt im Hausruckkreis
kEUR 37 100%
Georg Fessl GmbH AT Zwettl kEUR 150 100%
HN-CW Errichtungsgesellschaft mbH AT Vienna kEUR 35 100%
HTB Baugesellschaft m.b.H. AT Arzl im Pitztal kEUR 40 100%
Ing. Karl Voitl Gesellschaft m.b.H. AT Vienna kEUR 37 100%
Jos. Ertl GmbH AT Hörsching kEUR 105 100%
Kallinger Bau GmbH AT Fischamend kEUR 35 100%
Kontinentale Baugesellschaft m.b.H. AT Waidhofen an der Thaya
kEUR 75 100%
Romberger Fertigteile GmbH AT Gurten kEUR 900 100%
RTS Rail Transport Service GmbH AT Graz kEUR 100 100%
SWIETELSKY - INTERNATIONAL Baugesellschaft m.b.H.
AT Linz kEUR 730 100%
Swietelsky Bauträger Ges.m.b.H. AT Linz kEUR 85 100%
Swietelsky Developments GmbH AT Vienna kEUR 35 100%
Swietelsky Immobilien GmbH AT Vienna kEUR 40 100%
Swietelsky Liegenschaftsverwaltung Bauhof Asten GmbH
AT Linz kEUR 35 100%
Swietelsky Liegenschaftsverwaltung Klagenfurt GmbH AT Linz kEUR 10 100%
Swietelsky Liegenschaftsverwaltung Trumau GmbH AT Linz kEUR 10 100%
Swietelsky Tunnelbau GmbH AT Salzburg kEUR 35 100%
Swietelsky Tunnelbau GmbH & Co KG AT Salzburg kEUR 35 100%
Transportbeton und Asphaltgesellschaft m.b.H. AT Zams kEUR 73 100%
Fully consolidated companies
LIST OFINVESTMENTSOF SWIETELSKY BAUGESELLSCHAFT M.B.H., LINZ

0097List of investments
31/3/2018
Currency Registeredcapital
Group share
ERWA Beteiligungs GmbH AT Linz kEUR 36 80%
Metallbau Wastler GmbH AT Linz kEUR 40 80%
Metallbau Wastler GmbH & Co. KG AT Linz kEUR 73 80%
SWIETELSKY RAIL (AUSTRALIA) PTY LTD AU Surry Hills AUD 1 100%
SILMEX s.r.o. CZ České Budějovice kCZK 120 100%
Swietelsky Rail CZ s.r.o. CZ České Budějovice kCZK 200 100%
SWIETELSKY stavební s.r.o. CZ České Budějovice kCZK 250,000 100%
RTS Rail Transport Service Germany GmbH DE Munich kEUR 25 100%
Swietelsky Baugesellschaft mbH. DE Traunstein kEUR 1,600 100%
Wadle Bauunternehmung GmbH DE Essenbach kEUR 25 100%
Swietelsky Rail Danmark ApS DK Kopenhagen kDKK 700 100%
SWIETELSKY CONSTRUCTION COMPANY LTD. GB Reading kGBP 100 100%
Swietelsky d.o.o. HR Zagreb kHRK 5,812 100%
CELL-BahnBau Danubia Kft. HU Celldömölk kHUF 6,000 100%
DS VASÚT Kft. HU Celldömölk kHUF 17,000 100%
Nyugat-Magyarországi Vasutépítő Kft. HU Celldömölk kHUF 3,000 100%
SWIETELSKY Építő Kft. HU Budapest kHUF 5,001 100%
SWIETELSKY Magyarország Kft. HU Budapest kHUF 1,579,120 100%
Swietelsky Vasúttechnika Kft. HU Celldömölk kHUF 3,000 100%
Vasútgép Kft. HU Celldömölk kHUF 3,000 100%
Swietelsky Rail Benelux B.V. NL JR Oisterwijk kEUR 18 100%
Swietelsky Rail Norway AS NO Drammen kNOK 800 100%
Swietelsky Rail Polska Spolka Z o.o. PL Krakow kPLN 50 100%
Swietelsky Spolka Z o.o. PL Lublin kPLN 880 100%
Swietelsky Constructii SRL RO Bucharest kRON 699 100%
S.C. DRUMSERV SA RO Tirgu Mures kRON 7,082 100%
Swietelsky Slovakia spol.s.r.o SK Bratislava kEUR 89 100%
Associated companies
Umfahrung Zwettl Errichtungs- und Betriebsgesellschaft m.b.H.
AT Linz kEUR 35 50%
Eurailpool GmbH DE Ismaning kEUR 5,000 50%
Swietelsky-Faber GmbH Kanalsanierung DE Schlierschied kEUR 50 50%

0098 Financial Statements for 2017/18
31/3/2018
Other non-current equity investments - not consolidated Currency Registeredcapital
Group share
Baldauf Fliesen und Baustoffe Gesellschaft m.b.H. AT Linz kEUR 40 100%
BauQ Projekt GmbH in Liqu. AT Hart bei Graz kEUR 36 100%
Diks und Swiera Immobilientreuhand GmbH AT Feldkirch kEUR 36 100%
SRT GmbH AT Linz kEUR 35 90%
TB Betonwerk Zams GmbH AT Zams kEUR 35 52%
ASB Nörsach GmbH AT Linz kEUR 35 50%
Asphaltwerk Seibersdorf GmbH AT Linz kEUR 35 50%
ASW - Asphaltmischanlage Zams GmbH AT Zams kEUR 36 50%
ASW - Asphaltmischanlage Zams GmbH & Co. KG AT Zams kEUR 150 50%
AWM Asphaltwerk Mötschendorf Gesellschaft m.b.H. AT Graz-St.Peter kEUR 35 50%
AWM Asphaltwerk Mötschendorf Gesellschaft m.b.H. & Co. KG AT Graz-St.Peter kEUR 40 50%
Hausruck Baugesellschaft m.b.H. AT Schlüßlberg kEUR 240 50%
PAM-Pongauer Asphaltmischanlagen GmbH AT St. Johann im Pongau kEUR 36 50%
PAM-Pongauer Asphaltmischanlagen GmbH & Co KG AT St. Johann im
Pongau kEUR 36 50%
Asphaltmischwerk Weißbach GmbH & Co. Nfg. KG AT Weißbach bei Lofer kEUR 73 45%
AWB Asphaltmischwerk Weißbach Betriebs-GmbH AT Vienna kEUR 35 45%
Kieswerk-Betriebs-Gesellschaft m.b.H. AT Zams kEUR 40 38%
Pinzgau Beton GmbH AT Salzburg kEUR 40 37%
Pinzgau Beton GmbH & Co KG AT Salzburg kEUR 40 37%
Gaspix Beteiligungsverwaltungs GmbH AT Zirl kEUR 35 36%
RBA - Recycling- und Betonanlagen Ges.m.b.H. & Co. Nfg. KG AT Zirl kEUR 581 36%
AMS - Asphaltmischwerk Süd Gesellschaft m.b.H. AT Linz kEUR 36 35%
FMA Asphaltwerk GmbH AT Feldbach kEUR 35 35%
FMA Asphaltwerk GmbH & Co KG AT Feldbach kEUR 44 35%
AMW Asphaltwerk GmbH. AT Weitendorf kEUR 727 33%
AMG - Asphaltmischwerk Gunskirchen Gesellschaft m.b.H. AT Linz kEUR 44 33%
AMG - Asphaltmischwerk Gunskirchen Gesellschaft m.b.H. & Co. KG AT Linz kEUR 654 33%
Kieswerk - Betriebs - Gesellschaft m.b.H. & Co. Kommanditgesellschaft
AT Zams kEUR 80 29%

0099List of investments
31/3/2018
Currency Registeredcapital
Group share
TAM Traisental Asphaltmischwerk Ges.m.b.H. AT Nußdorf ob der Traisen kATS 600 33%
TAM Traisental Asphaltmischwerk Ges.m.b.H. & Co KG AT Nußdorf ob der
Traisen kATS 1,000 33%
TB Transportbeton GmbH AT Linz kEUR 36 33%
AMW Leopoldau GmbH & Co OG AT Vienna kEUR 70 33%
AWT Asphaltwerk GmbH AT Stadtschlaining kEUR 700 33%
AMA Linz GmbH AT Linz kEUR 35 30%
AHRENTAL ABBAU- UND AUFBEREITUNGSGESELLSCHAFT M.B.H. AT Hall in Tirol kEUR 35 30%
Petschl Frästechnik GmbH AT Arbing kEUR 450 29%
ASW - Asphaltmischanlage Innsbruck GmbH AT Innsbruck kEUR 36 26%
ASW - Asphaltmischanlage Innsbruck GmbH & Co KG AT Innsbruck kEUR 150 26%
Hemmelmair Frästechnik GmbH AT Linz kEUR 73 25%
VAM - Valentiner Asphaltmischwerk Gesellschaft m.b.H. AT Linz kEUR 36 25%
VAM-Valentiner Asphaltmischwerk Gesellschaft m.b.H. & Co. KG AT Linz kEUR 73 25%
Swietelsky d.o.o. BA Sarajevo kBAM 2 100%
Strakonická obalovna s.r.o. CZ Sousedovice kCZK 24,258 51%
Obalovna Lipník s.r.o. CZ České Budějovice kCZK 30,000 50%
Obalovna Ostrava s.r.o. CZ České Budějovice kCZK 17,930 50%
Obalovna Středokluky s.r.o. CZ Praha kCZK 5,000 50%
Obalovna Tábor s.r.o. CZ České Budějovice kCZK 5,000 50%
SČO s.r.o. CZ České Budějovice kCZK 10,000 50%
Západočeská obalovna s.r.o. CZ Plzeň - Koterov kCZK 40,000 50%
TBG SWIETELSKY s.r.o. CZ České Budějovice kCZK 10,000 49%
Obalovna Týniště s.r.o. CZ České Budějovice kCZK 30,000 33%
Chebská obalovna, spol. s r.o. CZ Štěnovice kCZK 17,744 33%
Obalovna Louny s.r.o. CZ České Budějovice kCZK 30,000 33%
Brněnská obalovna, s.r.o. CZ Brno kCZK 24,000 25%

0100 List of investments
31/3/2018
Currency Registeredcapital
Group share
Hrušecká obalovna, s.r.o. CZ Hrušky kCZK 1,540 20%
RPM Wiebe & Swietelsky & Co KG DE Achim kEUR 1,000 49%
RPM Wiebe & Swietelsky Beteiligungs-GmbH DE Achim kEUR 26 49%
SWIETELSKY TRAVAUX FERROVIAIRES FR Metz kEUR 5 100%
SICE LIMITED GB Edinburgh GBP 50 100%
FSP (2004) LIMITED GB Blantyre GBP 100 50%
BELVÁROS TETÖTÉR Kft. HU Budapest kHUF 3,000 100%
G.K.S. SWIETELSKY Kft. HU Dunakeszi kHUF 3,000 100%
Harmatház Kft. HU Budapest kHUF 3,000 100%
Mandarino Kft. HU Budapest kHUF 3,000 100%
MÁVÉPCELL Kft. "f.a." HU Celldömölk kHUF 30,000 100%
Rapid Tanács Kft. HU Celldömölk kHUF 3,000 100%
SWIETELSKY Iskolaprojekt Kft. v.a. HU Budapest kHUF 3,000 100%
SwO Metro 4 "Kálvin tér" Kkt. HU Budapest kHUF 1,000 100%
SwO Metro 4 "Rákóczi tér" Kkt. HU Budapest kHUF 1,000 100%
SwO Metro 4 Kkt. HU Budapest kHUF 10,700 100%
ZED-TBM Kft. HU Budapest kHUF 3,000 100%
Lajoskomárom-Dég Kft. HU Budapest kHUF 3,000 51%
EULAB Kft. HU Dunakeszi kHUF 80,000 50%
ZAK-Építö Kft. HU Budapest kHUF 20,000 50%
M6-Autópálya Kkt. HU Budapest kHUF 1,060 33%
HTB - Hoch-Tief-Bau Srl IT Nalles kEUR 10 100%
SWIERA SRL in Liquidazione IT Nalles kEUR 100 82%
SWIERALP SRL in Liquidazione IT Nalles kEUR 10 82%
Cosbau S.r.l. in Liquidazione IT Nalles kEUR 6,000 28%
Swietelsky Rail Luxembourg S.àr.l. LU Windhoff kEUR 13 100%
Swietelsky Rail MN d.o.o. ME Podgorica EUR 1 100%
S.C. AMFIBOSWIN SRL RO Sibiu kRON 11,757 57%
Swietelsky - Boegl S.R.L. RO Bucharest kRON 200 50%
Swietelsky gradbeno d.o.o. SI Laibach kEUR 9 100%
Športfinal s.r.o SK Bratislava kEUR 7 100%

Austria, Lermoos: viewpoint Tuftl Alm

0102 Financial Statements for 2017/18
I. Macroeconomic environment
The global economy is currently in a phase of strong growth. Both industrial nations and emerging nations are contributing to global expansion. In the most recently published forecasts by IMF in April 2018 and the Euro-pean Commission in May 2018, the predictions for global economic growth have been revised to be higher. These revisions were driven first and foremost by the increased growth predictions for the USA and global trade, which was a positive surprise in 2017 and will continue to grow significantly stronger this year than was expected in autumn.
Growth in the Eurozone for 2017 is at 2.4% according to IMF. The growth composition has recently changed, so the role of exports and investments has grown and private consumption has lost significance. These developments could, however, make growth in the Eurozone more vulnerable to trade restrictions and confidence effects and present a downside risk for the forecast. Inflation has varied between 1% and 1.5% for half a year and was 1.3% in March.
With the recovery of the labour market over the course of 2017, the unemployment rate declined by a percentage point to 8.6%. In the first quarter of 2018, however, the unemployment rate remained unchanged at 8.5%. In the fourth quarter of 2017 employment growth was 0.3%, slightly lower than the previous quarter (0.4%), which was due to a slowdown in growth of the industry and the service sector.
The economy of the Euroconstruct countries grew in 2017 by 2.3%, with the Eastern European countries Czech Republic, Hungary, Poland and Slovakia (EC-4 countries) contributing to this increase disproportionately by 4.4%. Most member nations had growth between 2% and 3%, Switzerland (1.0%) and Ireland (7.8%) provided the lower and upper limits of the range. This economic growth also positively impacted the situation on the labour market. With the exception of Denmark, unemployment fell again in all participating countries.
The construction sector gained further momentum. After a plus in 2016 of 2.5%, it managed to grow by a further 3.9% in 2017, reaching a total construction volume of EUR 1,521.4 billion. While the Western European coun-tries showed a continuous upward trend (2016: 3.0%, 2017: 3.6%), the Eastern European countries recorded a significant trend reversal (2016: -7.3%, 2017: 9.1%). However, construction output is still 20% below the peak year 2007. Since then, construction output grew the most in Poland, while Spain, Ireland and Portugal had the least growth.
This positive development was due in particular to new residential construction, which increased by 10.3%, with development being very varied but always positive in the individual countries. The rest of the building construction sector also developed positively, if at a lower level, with 3.1%. Altogether, building construction had a total volume of EUR 1,213.2 billion, which corresponds to an increase of 4.4% in 2017.
GROUP MANAGEMENT REPORT FOR THE FINANCIAL YEAR 2017/18OF SWIETELSKY BAUGESELLSCHAFT M.B.H., LINZ

0103Group management report
Markets
Core markets (Austria, Germany, Hungary, Czech Republic) and other countries
Austria
The Austrian economy grew by 2.9% in 2017, maintaining a high growth level. In particular, Austria benefits from the favourable development of the world economy and the resulting increase in demand for Austrian products. As a result of this, the situation on the labour market continues to be characterised by strong employment growth and a reduction in unemployment. Inflation has been decreasing since autumn 2017 and was at 2.1% in March. The increase in the value of the Euro and the re-cently halted increase in raw material prices are primarily responsible for this. The Austrian National Bank (OeNB) expects a growth in the real GDP of 0.7% and 0.6% as part of their quarterly short-term forecasts for the second and third quarter of 2018 (in relation to the previous quar-ter respectively). However, this means a slight reduction compared to the first quarter (0.8%), but with growth always remaining above the historical average growth.
The Austrian construction sector developed significantly better in 2017 with a growth of 2.6% than in previous years (2014: -0.1%, 2015: 1.1%, 2016: 1.1%). The total construction volume was EUR 40.7 billion. New resi-dential construction increased significantly in 2017 (plus 2.5%). After a decrease by 0.6% in 2016, the residential renovation construction sector grew by 2.1% in 2017, as well. The rest of building construction, which benefited from a positive economic climate, showed even better improvement. Industrial building construction grew by 4.2% and office building construction grew by 5.7%, due to large projects in Vienna, which are ending in 2018. The overall building construction volume in 2017 was EUR 32.5 billion.
The growth in civil engineering is primarily driven by investments in transport infrastructure (3.1%). Road construction grew by 6.2% in 2017, after it showed a decrease of 1.8% in 2016. Investments in railway systems (0.0%) and in other infrastructure projects (1.4%) show little momentum. Investments in energy and water supply
have also stayed at the previous year’s level, so the overall volume of Austrian civil engineering grew by 2.2% in 2017.
SWIETELSKY significantly increased output in Austria in the last financial year. Slight output decreases in railway construction are combined with significant increases in the other divisions. The output grew by EUR 157.0 million (12.3%) to EUR 1,434.9 million, which makes up 60.4% of the group’s construction output. The share of output provided by building construction is again around 50%. The share of road and railway construction was 23%, slightly below the previous year. The civil engineering share remained constant at 18%, that of tunnel construction increased to 9%.
Germany
The GDP grew by 2.2% in 2017 according to the Federal Statistical Office. This is the highest growth since 2011 when Germany recovered from the consequences of the global financial crisis, even higher than 2016, where GDP increased by 1.9%. According to the figures, the strong economic recovery was due to consumers’ propensity to buy, higher corporate spending and the strong global economy, which boosts the demand for products ‘Made in Germany’. Germany’s exporters are heading for the fourth record year in a row in 2017. In the first eleven months, machines, cars and other goods at the value of EUR 1.18 trillion (plus 6.5%) were shipped. The positive economic development is also reflected by the decreasing unemployment rate (2017: 5.7%), which has been steadily falling in the past years.
The German construction sector has the largest share of output of all the Euroconstruct countries with a total construction volume of EUR 329.3 billion and it grew in 2017 by 2.4% (2016: 2.6%). Growth driver was again new residential construction with 8.6% (EUR 64.1 billion), while residential renovation showed a slight declining trend (-0.2%, EUR 121.7 billion). Civil engineering incre-ased by 3.8% altogether in 2017 (EUR 58.6 billion), with road construction clearly standing out with 8.0%. Other areas of civil engineering (railway systems, other transport infrastructure, telecommunication, energy and water sup-ply) developed in a similarly positive way to the previous years. The rest of building construction again shows no

0104 Financial Statements for 2017/18
momentum but is developing positively with 1.0% (EUR 85.0 billion, 2016: 0.5%). SWIETELSKY increased their output in Germany by around 25%, or EUR 62.6 million to EUR 310.0 million. The growth was sustained primarily by the building construction, which increased its share of output to 27%. The share of road and railway construction was around 48% in the past financial year, that of civil engineering fell to 25% with no sector showing declining output.
Hungary
After GDP growth reached around 2.2% in 2016, it hit 4.0% growth in 2017, which means a solid performance on a relatively high level in the European context.
Consistently high economic growth over the last four years can definitely be associated with the grants from 2007 to 2013. Altogether, in this period, Hungary was awarded grants at the value of EUR 10.7 billion. With these grants, investments have most notably increased in the construction and infrastructure industries. In the funding period 2014-2020, total funding was raised again: over EUR 20 billion was budgeted in this seven-year period for Hungary. Grants over the last year correspond to almost 5% of the Hungarian GDP, which means no other member nation benefits more.
After shrinking by 18.3% in 2016, the construction sector made up for the decline in 2017 with a plus of 25.0%. Growth was primarily due to new residential construction (72.2%), which grew significantly more than the rest of building construction at 15.4%. Civil engineering, being largely dependent on public projects, grew by 34% in 2017, however, after a significant slump in 2016 (-34.0%). The total construction volume in Hungary, at EUR 10.7 billion, is actually significantly higher than that of the previous year (EUR 8.5 billion), but only slightly higher than 2015 (EUR 10.4 billion).
In Hungary, SWIETELSKY considerably made up for the previous year’s output decline. Due to building construc-tion and road and railway construction, output increased by around 39%, or EUR 76.1 million. The total construc-tion output of EUR 270.5 million consists mainly of road and railway construction (65%) and building construction (32%), civil engineering makes up the remaining 3% of our Hungarian operations.
Czech Republic
The momentum of the Czech economy increased even more in the fourth quarter of 2017: the GDP grew by 5.2% compared to the previous year or 0.5% compared to the previous quarter. So total GDP increased by 4.6% in 2017, which was among Europe’s top figures. Strong foreign demand and high domestic consumption in parti-cular contributed to the growth. All economic sectors are thriving – especially industry, but also the service sector.
Plant investments grew by 8% in the fourth quarter of 2017 in comparison to the previous year and remained unchanged in comparison to the third quarter of 2017. Companies have invested primarily in machinery and equipment. Industrial production (incl mining) increased by 5.7% in comparison to the previous year with output in the processing industry (excl mining) increasing by 6%. The highly export oriented carmakers and automotive industry remains the unchallenged driving force with a share of around 20% of industrial value creation and around 18% of total exports. In the previous year, production increased in this sector by 9%, other industrial branches with growth above-average were the chemical industry (20%), the production of data processors, electronic and optical products (10%), the pharmaceutical industry (10%), the plastic industry (8%), the production of electric facilities (10%) and mechanical engineering (7%). The construction sector in the Czech Republic developed positively with a plus of 3.4%; the development of the sectors has been varied. Building construction (6.5%) has developed significantly positive – further supported by prospering new residential construction (20.6%). Civil engineering, on the other hand, remains in the recession (-4.2%). In particular, the transport infrastructure sector suffered again from restrained public investment activities and showed a minus of 5.4%, after already declining in 2016 by 14.7%. The total construction volume in the Czech Republic increased to EUR 17.7 billion in 2017 but remains below that of 2015 (EUR 18.1 billion).
In the Czech Republic too, the reduction in output of the previous year was made up for. The total construction output of SWIETELSKY in the Czech Republic increased by 12.5% to EUR 210.7 million. The output share of road and railway construction was around 61% and that of building construction was 28%. Civil engineering increa-sed its share of output to around 11%.

0105Group management report
Other countries
SWIETELSKY also operates outside the above mentioned core markets, either via project-related production sites or subsidiaries. In addition to subsidiaries in Great Britain, the Netherlands, Denmark, Norway and Australia, this affects the CEE region in particular.
In Romania, Croatia, Norway, Poland, Great Britain, Slo-vakia, Italy, the Netherlands, Denmark and Australia the SWIETELSKY group generated EUR 150.4 million, around 6.3% of the total construction output.
Austria, Tyrol: indoor swimming pool, Telfs

0106 Financial Statements for 2017/18
Austria, Vienna: new villas XIX
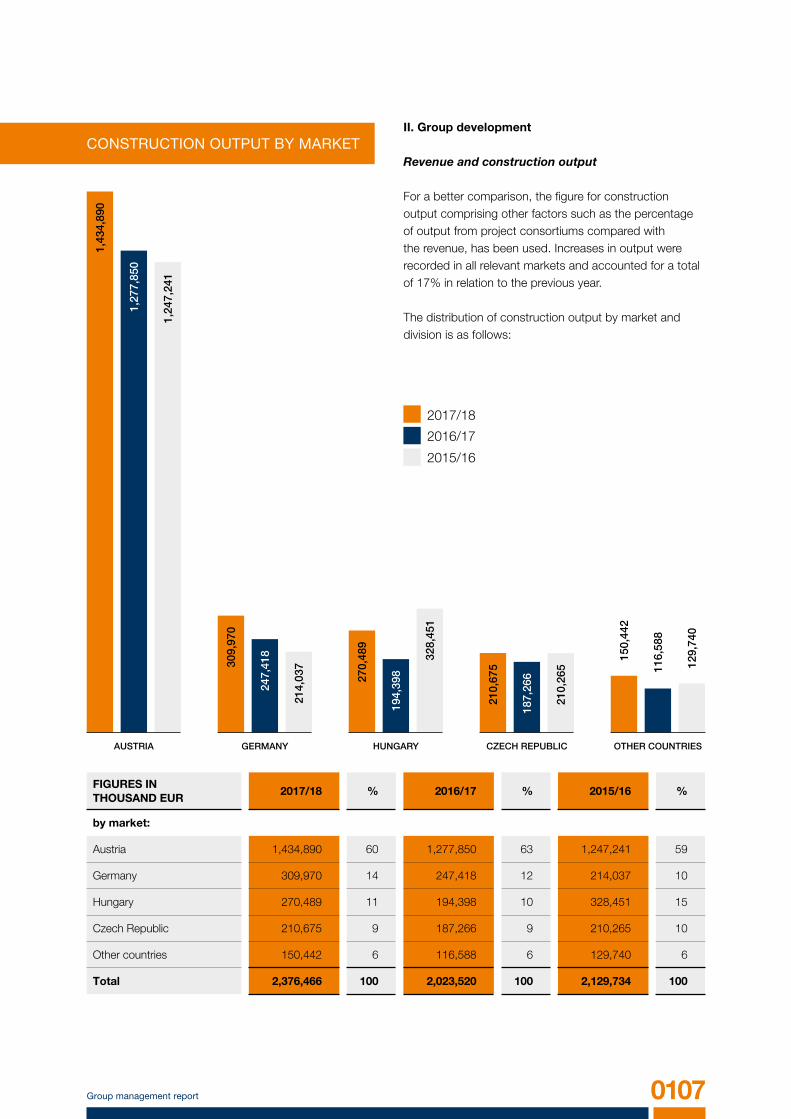
0107Group management report
1,27
7,85
0
1,24
7,24
1
1,43
4,89
0
309,
970
247,
418
214,
037
270,
489
194,
398
328,
451
210,
675
187,
266
210,
265 11
6,58
8
150,
442
129,
740
FIGURES IN THOUSAND EUR
2017/18 % 2016/17 % 2015/16 %
by market:
Austria 1,434,890 60 1,277,850 63 1,247,241 59
Germany 309,970 14 247,418 12 214,037 10
Hungary 270,489 11 194,398 10 328,451 15
Czech Republic 210,675 9 187,266 9 210,265 10
Other countries 150,442 6 116,588 6 129,740 6
Total 2,376,466 100 2,023,520 100 2,129,734 100
II. Group development
Revenue and construction output
For a better comparison, the figure for construction output comprising other factors such as the percentage of output from project consortiums compared with the revenue, has been used. Increases in output were recorded in all relevant markets and accounted for a total of 17% in relation to the previous year.
The distribution of construction output by market and division is as follows:
2016/17
2015/16
2017/18
CONSTRUCTION OUTPUT BY MARKET
AUSTRIA GERMANY HUNGARY CZECH REPUBLIC OTHER COUNTRIES

0108 Financial Statements for 2017/18
531,
847
471,
181
494,
066
373,
985
332,
850
360,
065
400,
930
332,
523
394,
108
946,
925
792,
925
775,
087
122,
779
94,0
41
106,
408
In line with performance, the revenue indicated in the IFRS financial statement are above that of the previous year by around EUR 308.4 million (16.2%) at EUR 2,213.4 million. However, this year there is a positive change in inventory (EUR 22.3 million) due to the construction of in-house building projects. The other operating income and the own work capitalised are at the level of the previous year (2017/18: EUR 15.6 or 5.7 million; 2016/17: EUR 17.2 or 6.2 million).
FIGURES IN THOUSAND EUR
2017/18 % 2016/17 % 2015/16 %
by division:
Road construction 531,847 22 471,181 24 494,066 23
Railway construction 400,930 17 332,523 16 394,108 19
Building construction 946,925 40 792,925 39 775,087 36
Civil engineering 373,985 16 332,850 16 360,065 17
Tunnel construction 122,779 5 94,041 5 106,408 5
Total 2,376,466 100 2,023,520 100 2,129,734 100
2016/17
2015/16
2017/18
CONSTRUCTION OUTPUT BY DIVISION
ROAD CONSTRUCTION
CIVIL ENGINEERING
RAILWAYCONSTRUCTION
BUILDING CONSTRUCTION
TUNNEL CONSTRUCTION

0109Group management report
705,
890
1,52
1,52
7
1,33
3,38
2
1,28
6,40
3
328,
224
204,
612
250,
022
135,
552
214,
091
84,2
91
284,
434
93,1
41
116,
620
117,
98527
6,79
9
Order backlog
The group’s order backlog has rapidly increased to EUR 3,116.9 million. The planned reduction in tunnel construction by processing large projects was significantly overcompensated for by growths in the remaining sec-tors. Acquisitions of large projects in the sector of railway construction have led to the highest order backlog ever.
FIGURES IN THOUSAND EUR
2017/18 % 2016/17 % 2015/16 %
by market:
Austria 1,521,527 49 1,333,382 67 1,286,403 70
Germany 328,224 11 204,612 10 135,552 7
Hungary 705,890 23 250,022 13 214,091 12
Czech Republic 276,799 9 117,985 6 116,620 6
Other countries 284,434 8 84,291 4 93,141 5
Total 3,116,874 100 1,990,292 100 1,845,807 100
Profit situation
The last financial year 2017/18 was again very satisfactory and it managed to exceed the already very good result of the previous year. The EBIT (earnings before interest and taxes) increased in relation to the previous year by EUR 8.0 million, with the contributions to profit from the core markets – especially from Hungary and Germany –
being again pleasing. With EUR 80.8 million, an EBIT was obtained, which was significantly above last year’s average. Due to the higher tax burden the earnings after tax were slightly below that of the previous year (EUR 56.1 million), at EUR 54.6 million.
ORDER BACKLOG BY MARKET
AUSTRIA GERMANY HUNGARY CZECH REPUBLIC OTHER COUNTRIES

0110 Financial Statements for 2017/18
Financial position
In the past financial year we invested heavily. The technical facilities and machinery have been substantially refur-bished, especially in Austrian and German, but also Czech companies. The investments in the amount of EUR 83.6 million contributed to the growth of total assets considering disposals, depreciation and amortisation of assets at EUR 32.2 million. The strong increase in cash and cash equivalents (EUR 190.5 million), the increase in receivables (EUR 77.1 million) and the increase in miscel-laneous assets (EUR 15.2 million) lead to a balance sheet extension by around 30% to EUR 1,345.1 million.
On the liabilities side, trade liabilities recorded the greatest increase by far (EUR 303.5 million), contingent on the development of advances from large projects. Financial liabilities fell by EUR 58.6 million, provisions increased by around EUR 17.4 million. Despite a dis-bursement of EUR 10.0 million, equity further increased to EUR 367.6 million. The equity ratio was held at 27.3%, a very pleasing value in the cross-sectoral comparison.
FIGURES IN THOUSAND EUR
2017/18 % 2016/17 % 2015/16 %
Non-current assets 351,578 26 319,646 31 280,896 29
Current assets 993,526 74 710,445 69 689,168 71
ASSETS 1,345,104 100 1,030,091 100 970,064 100
Equity 367,609 27 324,282 31 306,276 32
Non-current liabilities 156,014 12 202,918 20 194,743 20
Current liabilities 821,481 61 502,891 49 469,045 48
EQUITY and LIABILITIES 1,345,104 100 1,030,091 100 970,064 100
Net debt
Financial liabilities 81,419 140,024 145,528
Provision for severance payments
22,596 21,730 18,992
Pension provisions 279 276 256
Cash and cash equivalents -507,767 -317,251 -290,497
Net debt -403,473 -155,221 -125,721
Gearing -1.10 -0.48 -0.41
Net debt = interest-bearing debt + non-current provisions – cash and cash equivalentsGearing = net debt/equity

0111Group management report
FIGURES IN THOUSAND EUR 2017/18 2016/17 2015/16
Construction output 2,376,466 2,023,520 2,129,734
Revenue 2,213,417 1,904,973 2,155,766
Order backlog 3,116,874 1,990,292 1,845,807
Staff (annual average) 9,475 8,957 8,713
Construction output/Staff 251 226 244
Earnings before interest, taxes, depreciation and amortisation (EBITDA)
126,533 114,936 125,304
Earnings before interest and taxes (EBIT) 80,840 72,840 87,188
Interest income -2,773 -5,335 -8,505
Earnings before tax (EBT) 78,067 68,611 78,614
Earnings after tax 54,564 56,142 63,064
Operating Cash flow 107,102 100,947 92,433
Cash flow/Construction output 4.5% 5.0% 4.3%
Return on sales (ROS) 3.7% 3.8% 4.0%
Return on equity (ROE) 22.6% 21.8% 27.3%
Return on investment (ROI) 6.8% 7.3% 8.9%
Total assets 1,345,104 1,030,091 970,064
Equity 367,609 324,282 306,276
Equity ratio 27.3% 31.5% 31.6%
Selected key figures and financial performance indicators
Czech Republic, Pelhřimov: multifunctional playground with athletic track
ROS = EBIT/RevenueROE = EBT/Ø Equity ROI = EBIT/Ø Total capital

0112 Financial Statements for 2017/18
III. Risk management
Responsible handling of our risks serves the ultimate goal of a long-term increase in company value. In the course of our risk management it must be ensured that both external risks – in particular those in the entrepreneurial environment – and internal inherent in processes and procedures, are evaluated and minimised. Existing and anticipated risks are expertly evaluated through our total value added process and systematically handled from an income return perspective, according to the company principle of 'putting earnings before sales'.
We make a distinction between core risks, which we accept ourselves, and other risks, which we are able to insure against or transfer to others.
Market risk
The construction sector as a whole is, depending on markets and divisions, vulnerable to diverse fluctuations. Unemployment, consumer behaviour, conditions on the financial and capital markets as well as the political climate, have an effect on our development. However, changing framework conditions also offer opportunities which SWIETELSKY has often been able to exploit in the past through its flexible organisation.
SWIETELSKY offers a broad range of services and strives to further diversify its portfolio with respect to products, services and markets and to spread risks optimally. Thanks to our entrepreneurial staff, we regard ourselves as in a good position to actively tackle this risk.
Operational risks
Project and contract risks accrue from the SWIETELSKY Group's traditional building and project business. All pro-jects are audited and plausibility-checked throughout the tendering process up until the conclusion of contract for technical, commercial and legal risks. Guidelines and pro-cedures for auditing in compliance with ISO 9001 ensure uniform calculation of project costs. Clear competence standards for transactions requiring approval safeguard the technical and economic evaluation and analysis of tenders.
When taking on projects, costing guidelines and proce-dures regulate uniform calculation of project costs. Order processing is controlled via monthly variance analyses and constantly supervised by central controlling. In the performance phase there is a risk that tight completion schedules cannot be adhered to. Insofar as these missed deadlines affect our business, the threat of contractual penalties exists.
We manage warranty risks by conducting consistent quality management and, where necessary, demanding securities or guarantees from contractors.
SWIETELSKY strives to avoid legal disputes. However, as this aim is not always achievable, domestic and overseas entities may become involved in legal or arbitration procedures, the outcome of which is naturally difficult to predict. We operate on the assumption that, following due diligence for all pending litigation, appropriate financial provisions are established.
Austria, Innsbruck: residential building, Mariahilfstraße

0113
Human resource risk
Human resource risks arise from employee turnover, the resulting loss of knowhow and the lack of specialist and management staff and suitable trainees. SWIETELSKY therefore strives to further develop their employees’ qualifications and to support the internal career opportu-nities within the SWIETELSKY group. Monetary incentive systems make SWIETELSKY an attractive prospect, especially to business-minded employees. Additional initiatives for health promotion and the improvement of working conditions and employee satisfaction contribute to the company’s reputation.
Procurement risk
SWIETELSKY strives to cooperate on a long-term basis with its partners. In central procurement, framework contracts and framework price agreements are closed with selected suppliers. The operative units can reach these suppliers if needed using a central procurement portal. Through observation of the market for energy and raw materials and constant monitoring processes, we attempt to minimise the risk of possible losses due to price increases in this area, whereby primary measures (for example physical procurement and threshold agreements in construction contracts) provide a fundamental advan-tage over derivative instruments.
Financial risks
SWIETELSKY has robust, long-term financial structures and uses conservative financial instruments.
A liquidity risk arises if solvency and financial capability is impaired. Our financial resources contain appropriate growth and liquidity reserves and the corresponding lines of revenue are widely dispersed.
Overall, we ensure that all group companies have sufficient, long-term cash and guarantee credit capacities to successfully finance business operations and new projects. Due to a lack of need, however, cash credit facilities have been reduced to the operatively necessary amount (i.e. the facilities necessary for the implementation of transactions and for hedging FX risks), as it is rarely necessary to use cash facilities due to high liquidity levels. These are partially converted to guarantee facilities, further guarantee facilities
have been offered to us by several institutes (banks, insu-rance providers), however, only some of these have been implemented in a demand-orientated way.
High advances from – mostly public – clients have led to additional bank deposits. In Hungary in particular, high advances are currently standard business practice in the construction sector.
We are currently considering investing some fractions of the cash in short- and mid-term funds, denominated in EUR and HUF, to spread the risk. Trough diversification we managed to avoid negative interest for deposits.
To better meet treasury requirements in the group, we have begun to implement a group treasury system.
The monitoring of counterparty risks was refined this finan-cial year, they are now monitored on three levels throughout the group (individual bank, banking group, cross-guarantee system).
A central debtor management function constantly audits the creditworthiness of customers, oversees payment agreements and thus secures receipt of payments. The interest rate risk is constrained centrally by the group's financial management via hedging transactions. Foreign currency risks are minimised through forward exchange transactions. Adherence to internal guidelines is overseen by an appropriate control system.
IT risk
With regard to technical development and the growing significance of digitalisation, the protection and securing of our own and our customers’ entrusted information, as well as information about business processes and systems is of enormous importance. As part of the IT security strategy, strategic measures have been taken, which are continuously improved using an ongoing process due to the momentum of digitalisation. External audits support this process and are an important element for identifying risks early.
The significance of the ‘human’ element of IT security has been taken into account by introducing additional training and sensitising measures.
Group management report

0114 Financial Statements for 2017/18
Misconduct risk and compliance
In the future, just as in the past, SWIETELSKY wishes to be accepted as a reliable and competent partner to its customers and suppliers and to all its business partners in the public and private sectors. It is the responsibility of every individual to behave at all times fairly, respectfully, with integrity and in a law-abiding fashion towards colleagues, customers and contractors, but also towards competitors. To support this, our written code of conduct is in place, which reflects the guidelines and principles of our values and which is to be upheld by every SWIETELSKY employee, regardless of position. This code forms the basis of proper conduct from a moral, ethical and legal aspect and is available in our core markets in the respective national languages.
As part of the development of the compliance manage-ment system, SWIETELSKY builds above all on internal communication, instruction and training. These measures and the code of conduct should significantly contribute to embedding these moral concepts in the company. The executive board will promote the embedding of these values within the business even more vigorously and expresses a clear commitment to zero tolerance of misconduct in this area.
IV. Report on essential characteristics of the internal control and risk management system with regard to the financial reporting process
Introduction
The aim of the internal control system is to support management to be in the position to ensure effective and continuously improving internal controls with regard to financial reporting. It is aimed on one hand at adherence to guidelines and regulations and on the other hand at creation of advantageous conditions for specific control measures in key accounting procedures.
The accuracy and reliability of financial reporting is of prime importance both for management decisions and for provision of information to owners and all relevant stakeholders.
The internal control system comprises, in addition to assessment of operational risks, adherence to legal and proprietary standards and processes of the SWIETELSKY Group. Its aim is the uniform mapping of business tran-sactions, thereby supporting management via decision-relevant information. This is implemented through ensuring comparability of data via both relevant statutory provisions and internal guidelines. Relevant requirements for ensuring correctness of internal and external financial reporting are recorded in internal accounting and valuation regulations.
Control environment
The implementation of the internal control system with regard to the financial reporting process is stipulated in internal guidelines. Responsibilities for the internal control system are adapted to the corporate structure, in order to ensure a sa-tisfactory controlling environment which meets requirements.
Risk assessment
Risks relating to the financial reporting process are raised and monitored by management. The focus here is on significant risks.For preparation of financial statements, regular estimates must be made, whereby there is an intrinsic risk that future growth will deviate from these estimates. This particularly affects the following issues and items on the company financial statement: valuation of unfinished construction projects; valuation of provisions, including social capital provisions; outcomes of legal disputes; collectability of receivables and intrinsic value of investments and good-will. In individual cases external experts are consulted or delegation made to publicly available sources, in order to avoid the risk of misjudgement.
Control measures
All control measures are applied in the ongoing business process, in order to ensure that errors or discrepancies in financial reporting are avoided. Control measures range from reviews of interim results by management through to reconciliation of accounts and monitoring of cost centres.

0115Group management report
A clear separation of functions, various control and plausi-bility checks and a continuous application of the ‘four-eyes principle‘ ensure accurate and reliable accounting. The departments and areas involved in the financial reporting process are appropriately equipped both in terms of expertise and personnel. The staff deployed are carefully selected, trained and receive ongoing further training.
Since the SWIETELSKY Group comprises several decentralised units, the internal control system must also be decentralised, while the processes performed by the controlling department are overseen centrally. Respon-sibility for the organisation and practical application of control measures lies with the individual manager of the accountable area.
Due to legal and economic demands and the decentra-lised structure, particular attention is paid to the IT sys-tems used within the group. All business processes rely significantly on the secure functioning of information and communications technology. Support for business pro-cesses via integrated information and communications technology is an essential requirement for expanding the market position of the SWIETELSKY Group.
The security of data and information processed within the company against access by unauthorised persons is ensured.
Information and communication
Guidelines and regulations for financial reporting are regularly updated by management and communicated to all staff concerned.
Regular discussions regarding financial reporting and the associated guidelines and regulations take place in various committees. As well as management, departmental managers and leading employees from the accounting department also sit on these committees.
The staff involved are continously trained with regard to innovations in national and international accounting, in order that the risks of inadvertent misreporting can be recognised in good time.
V. Staff
SWIETELSKY employed on average 9,475 staff in the previous financial year (2016/17: 8,957). Of these, 6,151 were employed as blue-collar workers and 3,324 as white-collar workers (2016/17: 5,822 blue-collar and 3,135 white-collar workers). In the last financial year significantly more staff was hired compared to previous years. New staff admissions affect primarily Austria (329 individuals), Czech Republic (56 individuals), Germany (71 individuals) and Slovakia (23 individuals).
We see our staff as key to the success of the company. Entrepreneurial thinking and autonomous action have long been an essential part of our company culture. Many small units under a common roof have been and continue to be the key to our success. The transparent bonus model provides additional motivation and commitment. Loyalty to the company is rewarded with a graduated bonus scheme and a generous long-service provision.
Education and training is provided through relevant sustainable staff development, whether internal training activities or external courses.
Staying abreast of demographic changes, apprentice training in Austria continues to be paid special attention. The SWIETELSKY Group in Austria is currently training approximately 200 apprentices in ten professions. Our apprentice academy has proved especially popular. Here, in two training blocks of three weeks each, apprentices are taught not just theoretical knowledge, such as risk prevention on building sites, but also practical know-ledge. The modules are led by experienced foremen and encompass laying of paving stones and slabs, specific building techniques, formwork and basic carpentry skills. For the first time, this year two experience days were held as part of the apprentice academy in Königswiesen and Lachstatt for team building. Here, the focus was on communal exercises and a sense of achievement on the Giant’s ladder. This event made the participants and foremen on the training very happy. Camera supervision to produce an image film was also a new addition.

0116 Financial Statements for 2017/18
As part of staff development, education and training re-quirements are evaluated by a management committee at least once a year in order to maintain and further develop relevant qualifications.
The internal site manager apprenticeship has been very popular and is composed of six technical and two social modules, in-service over two years. In the previous year the focus was again on commercial training programmes, which are to take place at regular intervals in the future. This serves both to provide current awareness of increasing financial and fiscal requirements and to give new staff the opportunity to get to know the commercial organisation of SWIETELSKY.
The working environment of our staff is designed with occupational safety, health protection and environmental protection taken into account. The emphasis of occupa-tional health guidance is not only on risk assessment and avoidance of workplace accidents, but also on measures for early detection of possible work overload. In addition, regular training courses and activities are offered which not only aim to avoid accidents and illness, but are also aimed at actively promoting the health of employees.
The management thanks all staff, whose commitment and professional competence have contributed to our ability to reach most of our corporate goals, even in this difficult economic environment.
We would also like to express our thanks to our works council for their objective and constructive cooperation.
VI. Quality management
Within the construction industry, the demands of planning, preparation and implementation are becoming increasingly more complex and extensive, for reasons including the changing legal framework.
For this reason, a certified quality management system based on international standards has been in existence for nearly twenty years. The decision was made to develop and implement a user-friendly and efficient integrated management system. It is available to staff as a supporting toolkit to ensure that implementation conforms to contrac-tual and legal requirements.
As well as quality (ISO 9001), the integrated management system also encompasses occupational health and safety (OHSAS 18001) and environment (ISO 14001). Through internal and external audits and the annual executive management review, the application and implementation of standards is assured, assessed and, where necessary, adapted.
Mission statement and company policy
The mission statement is determined by management in accordance with the group strategy and geared to the type of service.
We plan the specific customer benefit in expert profes-sional consultation, before and during construction phase.
Germany, Munich: Oertelplatz
0117Group management report
The employees provide the customers with their long-term experience and their overall expertise. We aim to serve our customers even after completing the service and maintain customer contact.
We plan and operate in accordance with the principle: ‘quality over quantity’.
This is the prerequisite for the successful realisation of our projects. The responsible running and handling of con-struction sites and services, as we understand it, means ensuring a consistently high standard of quality. Aspects like environmental protection have a high significance for us, just as adhering to customer’s delivery dates does. For us, quality also means being able to offer the customer not just personnel with first class training but also a state of the art equipment fleet taking into account resource-saving environmental aspects.
Our company policy is ‘return before revenue’. For this reason, people in responsibility positions have a lot of freedom of choice in the acquisition and implementation of projects. With the aid of cost accounting, we can transpar-ently measure economic success and confirm this with the responsible people on a monthly basis.
It is a declared goal of management to implement the legal requirements in relation to preventative occupational safety and health protection. To fulfil the requirements, corre sponding programmes taking into account occu-pational physicians, safety officers and the responsible representatives are implemented.
All areas of organisation are involved in ensuring a robust environmental performance taking into account the client and the legal requirements. For this, there are set goals and environmental programmes derived from the mission state-ment to be implemented from an economic perspective.
There are further management goals and programmes to consider the relevant environmental aspects, as well as the legal conditions.
We see our suppliers and subcontractors as powerful partners. Our collective goal is optimal customer satisfac-tion. To achieve this, it is necessary to consider qualitative and economic aspects and those relevant to the environ-
ment in the selection of our suppliers and subcontractors and to evaluate these as part of the provision of services according to set criteria. Our mission statement is geared towards preventative error avoidance and a continuous improvement of operational and organisational structure.
VII. Environment and energy
The construction sector is a resource- and energy- intensive branch of industry and therefore impacts significantly and extensively on the environment. Aware of finite re sources and increasing environmental damage, SWIETELSKY strives to ensure the application of resource-saving processes and environmentally friendly equipment in all project phases.
We have our own waste management system, waste management plans and environmental officer, thus envi-ronmental protection, taking into account extensive legal requirements, is afforded great importance.
SWIETELSKY endeavours to the best of its ability to participate in reaching the EU target of recycling 70% of construction waste and thereby reducing landfill.
Because of these requirements, SWIETELSKY considers itself obliged to transform the mineral wastes from con-struction sites into CE-marked materials recycling products as far as possible. Certified in-house production controls serve to ensure the quality control of these products. In order to improve environmental performance, it is necessary to utilise these materials increasingly at the point of origin or to use them as substitutes in the production of building materials. Thus primary raw materials are conserved and the logistics outlay and resulting emissions reduced.
Non-reusable waste is sorted according to material and stored temporarily in an environmentally compatible fash-ion. Segregated collection means expenses are reduced and the recycling rate is increased. SWIETELSKY also ensures proper disposal via the operation of landfill sites.
Various energy and environmental protection projects are developed and implemented in branches and subsidiaries. Production facilities are regularly evaluated for energy efficiency and updated with regard to economic aspects.

0118 Financial Statements for 2017/18
On the basis of the opportunities for improving energy efficiency put together in the last energy audit report, smaller and larger projects are being developed and implemented. These begin with the ongoing switchover to LED lighting in office and production spaces and end with greater investment and the replacement of heating systems.
When investing in fleet and when new machinery and equipment is purchased, energy consumption is a signifi-cant decision criterion. Annual CO2 monitoring is provided for the significant vehicle types in the fleet.
The ongoing recording of the use of energy in the pro-duction process enables us to show savings potential by comparing production costs at different production sites. In many areas, particularly in mountainous regions, SWIETELSKY tackles erosion control with both technical and biological methods. In addition, innovative solutions, tailored to the specific site, are being developed. These developments have in some cases also resulted in patent applications.
In the environmental domain, the primary aim is to conserve resources such as air, water, energy and soil, to optimise materials and logistics outlay and to reduce emissions as far as possible. Continuous improvement of the quality awareness and environmental awareness of staff is therefore regarded by management as an executive function.
VIII. Technology and innovation
Advancements and new solutions are developed on various levels at SWIETELSKY. The IMS – ‘integrated management systems’ – department, ensures that our company is informed about the latest developments specific to the building materials and construction techniques sector. The commitment of highly qualified staff ensures that we are in a position to carry out our own developments as well as contributing to and arranging research projects.
In addition to specific research and development projects, a large percentage of innovations take place as part of ongoing construction projects in which new solutions are required due to scheduling, geological or technical framework requirements. Almost on a yearly basis, new technologies are developed in tunnel, alpine and railway construction or innovative methods are put to use and
continuously developed and improved. In the last financial year for the first time new construction methods were submitted as research and development projects in the field of civil engineering.
Rapid development in the area of environmental sustain-ability of building products and excavated soil necessitates developments in the area of testing methodology and adaptation of existing test methods in our accredited test and inspection centre. Here the organisation and evalua tion of round robin tests and comparative tests are essential tools. Our knowledge in this field is also used by external construction material manufacturers as part of studies and reports.
The findings obtained as part of materials testing help to develop sustainable applications.
IX. Forecast
In the current World Economic Outlook (WEO), IMF revises its forecast for 2018 for the Eurozone further upwards. The growth forecast for 2018 is now 2.4%, that for 2019 remains unchanged at 2.0%. The forecast for the Euroconstruct countries is at 2.3% (2018 and 2.0% for 2019). The upwards revision is caused by fiscal stimuli from the USA as well as the higher domestic and foreign demand and the expansive monetary policy envi-ronment. The risks are increasing around the world, with geopolitical risks in particular being considered dominant. The current forecast is therefore subject to a significantly increased forecast uncertainty. The volatility of the finan-cial markets has recently increased significantly and the consequences of the discussed introduction of punitive tariffs between the USA and major trading partners (European Union, China) are difficult to estimate. The growth of the construction sector will also advance in 2018 with a predicted 2.7%. It is worthy of note here that until now, a growth over two years has never before been seen in all of the Euroconstruct countries. The highest growth is expected in Hungary (24.6%), Ireland (11.1%) and Poland (9.9%). In Great Britain (0.1%) and Germany (0.8%) on the other hand, growth is at its lowest. New residential construction will grow further, however, with 5.1% only half as fast as in 2017. Civil engineering will continue to develop positively and its growth in 2018 will more than double to 4.4%. According to the forecast, the growth of the construction sector will halt in 2019 (1.9%) and 2020 (1.4%), whereas in some

0119Group management report
countries reverse development is expected (Germany and Sweden 2019: -0.2%).
The Austrian economy will again have strong growth ac-cording to the OeNB in the coming months. In relation to the economic peak at the end of 2017, a slight reduction is actually expected, but growth will remain above the long-standing average. According to the Austrian Institute for Economic Research (WIFO), economic growth of 3.2% is expected for the full year of 2018. As well as the domestic demand, foreign trade contributes positively to the growth of the Austrian economy. The persistent improvement in the labour market and optimal consumer confidence are reflected in domestic demand. Export growth will continue, although on a significantly lower level (2017: 6.7%, 2018: 1.1%).
There are uncertainties with regard to economic develop-ment in Austria, due to threatened import restrictions by the USA, which Austria may encounter both directly and indirectly – especially in the automotive industry. The EU budget, and thus that of Austria, is hampered by Great Britain’s departure from the European Union. Possible difficulties may also arise in economic relations with Great Britain due to their leaving the EU.
The positive economic development will also influence the growth of the construction sector, if in a somewhat toned-down way. A growth of 1.6% is forecast for 2018 and a further increase of 1.5% is expected for 2019 and 2020. Building construction (2018: 1.7%, 2019: 1.5%) is set to perform better than civil engineering over the next two years (2018: 1.1%, 2019: 1.3%). WIFO’s preview for 2020 shows civil engineering may increase by a further 2.3% and building construction may increase by 1.3%.
In Austria, SWIETELSKY expects a slight growth in con-struction output.
The German economy also grew in the first quarter of 2018. The GDP increased by 0.3% in relation to the previous quarter when adjusted for prices. As expected, growth was lower than the high quarterly average growth of the German economy of 0.7% in 2017. The demand for industrial production both domestically and from countries outside of the Eurozone fell below that from the previous quarter and thus reduced exports. There were also certain one-off effects, which had a temporarily reducing effect. But all in all, the upturn of the German economy remained intact. The global economy is also fundamentally in good shape and the German economy remains geared towards
growth, for example if you take the labour demand as a basis. The applicable business climate indicators are actually not quite as positive as at the turn of the year, but the above-average level significantly speaks for the con-tinuation of the upturn, if perhaps with a slightly adjusted momentum. After years of stable growth, it is expected that the momentum of the construction sector will level off (0.8%). New residential construction in particular will even out on a high level – after years of high growth rates (2018: 4.5%, 2019: 2.0% and 2020: -1.5%). The rest of building construction barely has an impact (2018: 0.9%, 2019: -0.8% and 2020: -1.1%). Despite the high budget surpluses, a slightly recessive development is expected in civil en gineering for the next few years (2018: -0.5%, 2019: -1.0% and 2020: -0.3%).
With its activities in Germany, SWIETELSKY anticipates – contrary to the general trend – a significant increase in construction output for the ongoing financial year.
The Hungarian economy’s prospects remain excellent. Further economic growth of 4.2% is expected for 2018 and 3.3% is expected for 2019. This development is primarily due to the increase in EU grants for the period 2014 to 2020 and the resulting public orders primarily in the construction sector. The economic development in Hungary is highly dependent on exports – particularly automobile exports to Germany. The economy may also be supported by the strengthening purchasing power of Hungarian households. Private consumption will increase further, though purchasing power in a European compari-son is still very low (GDP/capita EUR 19,735).
The construction sector will benefit from the positive de-velopment of the economy. A growth of 24.6% is forecast for 2018, in 2019 a further increase of 11.2% should be possible and then in 2020 it will stagnate on a high level (-0.4%). Building construction will grow disproportionately huge (2018: 28.2%, 2019: 10.4%) and dwindle in 2020 by 2.5%. The development of civil engineering reflects the expiry of EU grants (2018: 16.8%, 2019: 13.1% and 2020: 4.8%).
SWIETELSKY again forecasts an increase in construction output for Hungary.
The Czech economy remains on a growth trajectory, but the risks of a waning economy are increasing. An acute lack of staff – the unemployment rate is currently at just

0120 Financial Statements for 2017/18
Germany, Samerberg: motorway service area A8

0121Group management report
2.4% and will continue to fall – appreciation of the Czech crown and increasing interest costs lead to lower growth rates. According to Euroconstruct, a growth of 3.6% is expected in 2018, which will level off further in 2019 (3.2%) and 2020 (2.6%).
Contrary to the original forecast, the construction sector has developed significantly better than predicted in 2017 (Euroconstruct 6/2017 – forecast 2017: 0.0%; Euro-construct 6/2018: 3.4% for 2017) and will carry on this positive trend in the future. Further considerable increases in total construction output are expected for 2018 (5.0%) and 2019 (6.7%). The trend reversal in civil engineering, which should grow by 4.8% in 2018 and 13.4% in 2019, contributes significantly to this. The growth in building construction – particularly in new residential construction
– will probably level off but remain clearly positive (2018: 5.0%, 2019: 4.3%).
SWIETELSKY anticipates significant growth in construc-tion output in the Czech Republic.
In the other countries, SWIETELSKY is trying, depending on the division and market, to acquire promising projects.
In the ongoing 2018/19 financial year SWIETELSKY ex-pects a growth in construction output of around 10% and earnings at the level of previous periods – primarily due to the core markets of Germany, Hungary and the Czech Republic. This forecast is substantiated by the group’s highest order backlog ever, at EUR 3,117 million at the end of the economic year.
Linz, 13 July 2018
The Management
PETER GAL DIPL.-ING. WALTER PERTL ADOLF SCHEUCHENPFLUG DIPL.-ING. KARL WEIDLINGER

0122 Financial Statements for 2017/18
Audit Opinion
We have audited the consolidated financial statements of SWIETELSKY Baugesellschaft m.b.H.,Linz, Austriaand its subsidiaries (the Group), which comprise the Consolidated Balance Sheet as at 31 March 2018, and the Consolidated Income Statement and Statement of Comprehensive Income, Consolidated Statement of Cash Flows for the year then ended and Consolidated Statement of Changes in Equity, and the Notes to the Consolidated Financial Statements.
In our opinion, the consolidated financial statements present fairly, in all material respects, the consolidated financial position of the Group as of 31 March 2018, and its consolidated financial performance and consolidated cash flows for the year then ended in accordance with International Financial Reporting Standards (IFRSs) as adopted by the EU, and the additional requirements pur-suant to Section 245a UGB (Austrian Commercial Code).
Basis for our Opinion
We conducted our audit in accordance with Austrian Standards on Auditing. These standards require the audit to be conducted in accordance with International Stan-dards on Auditing (ISAs). Our responsibilities under those standards are described in the "Auditor's Responsibilities" section of our report. We are independent of the audited Group in accordance with Austrian Generally Accepted Accounting Principles and professional regulations, and we have fulfilled our other responsibilities under those relevant ethical requirements. We believe that the audit evidence we have obtained is sufficient and appropriate to provide a basis for our audit opinion.
Responsibilities of Management and Audit Commit-tee for the Consolidated Financial Statements
Management is responsible for the preparation and fair presentation of the consolidated financial statements in accordance with International Financial Reporting Standards (IFRSs) as adopted by the EU, and additional requirements pursuant to Section 245a UGB (Austrian Commercial Code) and for such internal control as management determines is necessary to enable the prepa ration of consolidated financial statements that are free from material misstatement, whether due to fraud or error.
Management is also responsible for assessing the Group's ability to continue as a going concern, disclosing, as applicable, matters related to going concern and using the going concern basis of accounting, unless manage-ment either intents to liquidate the Group or to cease operations, or has no realistic alternative but to do so.
The audit committee is responsible for overseeing the Group's financial reporting process.
Auditor's Responsibilities
Our objectives are to obtain reasonable assurance about whether the consolidated financial statements as a whole are free from material misstatement – whether due to fraud or error – and to issue an auditor's report that includes our audit opinion. Reasonable assurance represents a high level of assurance, but provides no guarantee that an audit conducted in accordance with Austrian Standards on
REPORT ON THE CONSOLIDATED FINANCIAL STATEMENTS
AUDITOR‘SREPORT

0123
Auditing (and therefore ISAs), will always detect a material misstatement, if any. Misstatements may result from fraud or error and are considered material if, individually or in the aggregate, they could reasonably be expected to influence the economic decisions of users taken on the basis of these consolidated financial statements.
As part of an audit in accordance with Austrian Standards on Auditing, we exercise professional judgment and main-tain professional skepticism throughout the audit.
Moreover:
We identify and assess the risks of material misstate-ment of the consolidated financial statements, whether due to fraud or error, we design and perform audit procedures responsive to those such risks and obtain sufficient and appropriate audit evidence to serve as a basis for our audit opinion. The risk of not detecting material misstatements resulting from fraud is higher than for one resulting from error, as fraud may involve collusion, forgery, intentional omissions, misrepresenta-tions or override of internal control.
We obtain an understanding of internal control relevant to the audit in order to design audit procedures that are appropriate in the circumstances, but not for the purpose of expressing an opinion on the effectiveness of the Group's internal control.
We evaluate the appropriateness of accounting policies used and the reasonableness of accounting estimates and related disclosures made by management.
We conclude on the appropriateness of management's use of the going concern basis of accounting and, based on the audit evidence obtained, whether a ma-terial uncertainty exists related to events or conditions that may cast significant doubt on the Group's ability to continue as a going concern. If we conclude that a material uncertainty about the entity's ability to continue as a going concern, we are required to draw attention in our audit report to the respective note in the conso-lidated financial statements. If such disclosures are not appropriate, we will modify our audit opinion.
Our conclusions are based up to the date of our auditor's report. However, future events or conditions may cause the Group to cease to continue as a going concern.
We evaluate the overall presentation, structure and content of the consolidated financial statements, including the notes, and whether the consolidated financial statements represent the underlying transactions and events in a manner that achieves fair presentation.
We obtain sufficient appropriate audit evidence regarding the financial information of the entities and business activities within the Group to express an opinion on the consolidated financial statements. We are responsible for the direction, supervision and performance of the group audit. We remain solely responsible for our audit opinion.
We communicate to the audit committee regarding, among other matters, the planned scope and timing of our audit as well as significant findings, including any significant deficiencies in internal control that we identify during our audit.
Auditor's report

0124 Financial Statements for 2017/18
Dr. Helge LöfflerAustrian Chartered Accountant
Linz, 13 July 2018
KPMG Austria GmbHWirtschaftsprüfungs- und Steuerberatungsgesellschaft
This report is a translation of the original report in German, which is solely valid.The consolidated financial statements together with our auditor's opinion may only be published if the consolidated financial statements and the group management report are identical with the audited version attached to this report. Section 281 Paragraph 2 UGB (Austrian Commercial Code) applies.
Group Management Report
In accordance with the Austrian Generally Accepted Accounting Principles, the group management report is to be audited as to whether it is consistent with the con solidated financial statements and prepared in accordance with legal requirements.
Management is responsible for the preparation of the group management report in accordance with Generally Accepted Accounting Principles.
We have conducted our audit in accordance with generally accepted standards on the audit of group management reports as applied in Austria.
Opinion
In our opinion, the group management report is consis-tent with the consolidated financial statements and has been prepared in accordance with legal requirements.
Statement
Based on our knowledge gained in the course of the audit of the consolidated financial statements and our understanding of the Group and its environment, we did not note any material misstatements in the group management report.
REPORT ON OTHER LEGAL REQUIREMENTS

CONTENTS
Core market
Other countries
FOREWORD BY THE MANAGEMENT
as of 31 March 2018 3
RANGE OF SERVICES
Road and bridge construction 6
Railway construction 10
Building construction 14
Civil engineering 18
Tunnel construction 22
Vision 26
FINANCIAL STATEMENTS FOR 2017/18
Consolidated income statement 32for the fi nancial year 2017/18
Statement of comprehensive income 33for the fi nancial year 2017/18
Consolidated balance sheet as of 31 March 2018 34
Consolidated cash fl ow statement 36for the fi nancial year 2017/18
Development of equity 2017/18 38
Notes for the fi nancial year 2017/18 40
Group management report 102for the fi nancial year 2017/18
AUDITOR‘S REPORT
Report on the consolidated fi nancial statements 122
IMPRINT
Media owner and publisher:Swietelsky Baugesellschaft m.b.H.Edlbacherstraße 10, 4020 LinzTelephone: +43 (0) 732 6971-0Telefax: +43 (0) 732 6971-7410E-Mail: offi [email protected]: www.swietelsky.comFN: 83175 t, ATU 232 40 400Commercial register Linz
Graphical concept and design:Fredmansky GmbH, Linz
Photos: Swietelsky, Getty Images
Technical conversion online: E-Conomix GmbH, Wels
Production Print: Estermann GmbH, Aurolzmünster
Publication:31 July 2018

swietelsky.comswietelsky.com
ww
w.fr
edm
ansk
y.at
SW
IET
EL
SK
Y C
ON
SO
LID
AT
ED
FIN
AN
CIA
L S
TAT
EM
EN
TS
FO
R 2
017/
18
Hungary, Szombathely: Haladás sports complex, soccer stadium
CONSOLIDATED FINANCIAL STATEMENTS FOR 2017/18
SWIETELSKY Baugesellschaft m.b.H.
Edlbacherstraße 104020 Linz · AustriaT: 0043 732 6971-0F: 0043 732 6971-7410E: offi [email protected]
IDEAS
BUILDING
ON