biosystems engineering: biofactories for food production...
TRANSCRIPT

Biosystems Engineering: Biofactories for FoodProduction in the Century XXI

Ramon Guevara-GonzalezIrineo Torres-PachecoEditors
Biosystems Engineering:Biofactories forFood Productionin the Century XXI
123

EditorsRamon Guevara-GonzalezIrineo Torres-PachecoCentro Universitario Cerro de las CampanasQueretaro Autonomous UniversityQuerétaroMexico
ISBN 978-3-319-03879-7 ISBN 978-3-319-03880-3 (eBook)DOI 10.1007/978-3-319-03880-3Springer Cham Heidelberg New York Dordrecht London
Library of Congress Control Number: 2014930152
� Springer International Publishing Switzerland 2014This work is subject to copyright. All rights are reserved by the Publisher, whether the whole or part ofthe material is concerned, specifically the rights of translation, reprinting, reuse of illustrations,recitation, broadcasting, reproduction on microfilms or in any other physical way, and transmission orinformation storage and retrieval, electronic adaptation, computer software, or by similar or dissimilarmethodology now known or hereafter developed. Exempted from this legal reservation are briefexcerpts in connection with reviews or scholarly analysis or material supplied specifically for thepurpose of being entered and executed on a computer system, for exclusive use by the purchaser of thework. Duplication of this publication or parts thereof is permitted only under the provisions ofthe Copyright Law of the Publisher’s location, in its current version, and permission for use mustalways be obtained from Springer. Permissions for use may be obtained through RightsLink at theCopyright Clearance Center. Violations are liable to prosecution under the respective Copyright Law.The use of general descriptive names, registered names, trademarks, service marks, etc. in thispublication does not imply, even in the absence of a specific statement, that such names are exemptfrom the relevant protective laws and regulations and therefore free for general use.While the advice and information in this book are believed to be true and accurate at the date ofpublication, neither the authors nor the editors nor the publisher can accept any legal responsibility forany errors or omissions that may be made. The publisher makes no warranty, express or implied, withrespect to the material contained herein.
Printed on acid-free paper
Springer is part of Springer Science+Business Media (www.springer.com)

Foreword
Today’s world is subject to important changes from the environmental point ofview. Based on this, it is valid to assume that the way we produce foods mustnecessarily evolve to the generation of systems that consider the aspect of‘‘sustainability.’’ Thus, for future production systems, food production with thesefeatures (Biosystems) should be the most suitable option to support the worldwidegrowth of the population in an environmentally friendly way. Biosystems, in orderto be a real alternative in food production, should consider including basic studiesof various disciplines with the production of plants, animals, microorganisms,among others. These efforts must be related to aspects of Production ControlEngineering as well as recycling systems and waste inputs.
The study of Biosystems Engineering is emerging worldwide focusing on issuessuch as agricultural production, livestock and aquaculture, amalgamating aspectsof basic biology, chemistry, mathematics, physics, and engineering in searchingfor strategies for sustainable food production in protected environments. Someimportant research fields regarding Biosystems Engineering for food productionare new production strategies of plants with high content of beneficial compoundsfor human health, development of electronic instrumentation for monitoringproduction at different levels, recycling agroindustry residues, environmentallyfriendly approaches for food production, among others.
As an example of the aforementioned, it is clearly a global trend (especially inEurope) toward ‘‘healthy eating,’’ rich in compounds with activity called ‘‘nutra-ceutical,’’ due to the presence of specific secondary metabolites. Agriculturalproduction systems that have documented significant nutraceutical compounds arecalled ‘‘organic.’’ While these systems produce functional (nutraceutical) food ofhigh quality and reduce pollution effects in the process, it cannot generate enoughyields to support the global growth and thus, are of high economic cost and hardlyaccessible for most of the population. On the other hand, conventional extensiveagriculture has produced the food needed to sustain the population growthworldwide. However, this achievement is reached using components given by theGreen Revolution and incorporates some elements of biotechnology. This type ofagriculture has the peculiarity that the food produced is not as high in nutraceu-ticals as organic products. Additionally, conventional systems are accused ofhaving associated environmental problems.
v
In this context, it is proposed to generate a Third Pathway for Agriculture, notonly organic and not only conventional. It will be necessary to pursue efforts todevelop new strategies for food production using the necessary knowledge accu-mulated from different disciplines. For instance, applications of metabolites-inducer factors (MIFs) to increase nutraceuticals, biological control strategies,greenhouses with appropriate climate control, recycling food production residues,etc. Taking into account all the aforementioned aspects this book, BiosystemsEngineering: Biofactories for Food Production in the Century XXI, is an attemptto depict researches from several experts in the proposed fields, in order to get avision related to this new proposal for food production.
Ramon Guevara-GonzalezIrineo Torres-Pacheco
vi Foreword

Contents
1 Strategies for Sustainable Plant Food Production:Facing the Current Agricultural Challenges—Agriculturefor Today and Tomorrow . . . . . . . . . . . . . . . . . . . . . . . . . . . . . . 1Lina Garcia-Mier, Sandra Neli Jimenez-Garcia,Angela María Chapa-Oliver, Laura Mejia-Teniente,Rosalía V. Ocampo-Velazquez, Enrique Rico-García,Ana A. Feregrino-Pérez, Ramon Guevara-Gonzalezand Irineo Torres-Pacheco
2 Mathematical Modeling of Biosystems . . . . . . . . . . . . . . . . . . . . . 51Moisés Alejandro Vázquez-Cruz, Alejandro Espinosa-Calderón,Angélica Rosario Jiménez-Sánchez and Rosario Guzmán-Cruz
3 Water Recycling in Biosystems for Food Production . . . . . . . . . . 77L. Pérez-Sánchez, A. Rodríguez-Méndez, I. Montufar-Reyes,R. Trejo-Hernández, M. Mayorga-Garay, A. C. Montoya-Lizarraga,L. M. Macías-Sámano, B. Reséndiz-Luján,J. Alberto Rodríguez-Morales, Eduardo A. Elizalde-Peñaand K. Esquivel-Escalante
4 Biosystems Engineering Applied to Greenhouse Pest Control . . . . 99Enric Vila and Tomas Cabello
5 Sugarcane as a Novel Biofactory: Potentialitiesand Challenges . . . . . . . . . . . . . . . . . . . . . . . . . . . . . . . . . . . . . . 129Fernando C. Gómez-Merino, Libia I. Trejo-Téllezand Héctor E. Sentíes-Herrera
6 Edible Ectomycorrhizal Mushrooms: Biofactoriesfor Sustainable Development . . . . . . . . . . . . . . . . . . . . . . . . . . . . 151Jesús Pérez-Moreno and Magdalena Martínez-Reyes
vii
7 Integral Management of Lignocellulosic Biomassby Biorefining . . . . . . . . . . . . . . . . . . . . . . . . . . . . . . . . . . . . . . 235Sergio de Jesús Romero-Gómez
8 Microalgae and Cyanobacteria Production for Feedand Food Supplements . . . . . . . . . . . . . . . . . . . . . . . . . . . . . . . . 253Marieke Vanthoor-Koopmans, Miguel V. Cordoba-Matson,Bertha O. Arredondo-Vega, Cruz Lozano-Ramírez,Juan F. Garcia-Trejo and Monica C. Rodriguez-Palacio
9 Aquatic Biosystems: Applications in Aquacultural Engineeringas a Sustainable Technology . . . . . . . . . . . . . . . . . . . . . . . . . . . . 277Genaro M. Soto-Zarazúa, J. Fernando García-Trejo,Manuel Toledano-Ayala and Edgar Rivas-Araiza
10 Natural Foods as Biosystems to Face NoncommunicableChronic Diseases: An Overview . . . . . . . . . . . . . . . . . . . . . . . . . 289Rocio Campos-Vega, Sandra Mendoza-Díaz,Rosalía Reynoso-Camacho, Minerva Ramos-Gómez,Marcela Gaytán-Martínez, B. Dave Oomahand Guadalupe Loarca-Piña
11 New Horizons for the Production of Industrial Enzymesby Solid-State Fermentation . . . . . . . . . . . . . . . . . . . . . . . . . . . . 319Gustavo Viniegra-González
12 Advances in Computational Fluid DynamicsApplied to Biosystems. . . . . . . . . . . . . . . . . . . . . . . . . . . . . . . . . 341Guillermo De la Torre-Gea, Cesar Irving Ortíz Vazquez,Enrique Rico-García and Ramon Guevara-Gonzalez
13 Instrumentation and Control to Improve the Crop Yield . . . . . . . 363Maria S. Acosta-Navarrete, José A. Padilla-Medina,José E. Botello-Alvarez, J. Prado-Olivarez, M. Perez-Rios M,José J. Díaz-Carmona, Luis M. Contreras-Medina,Carlos Duarte-Galvan, Jesus R. Millan-Almarazand Arturo A. Fernandez-Jaramillo
14 Control Strategies of Greenhouse Climatefor Vegetables Production. . . . . . . . . . . . . . . . . . . . . . . . . . . . . . 401Irineo L. López-Cruz, Efrén Fitz-Rodríguez,Juan Carlos Torres-Monsivais, Elmer Cesar Trejo-Zúñiga,Agustín Ruíz-García and Armando Ramírez-Arias
viii Contents
15 Plants as Bioreactors for Human Health Nutrients . . . . . . . . . . . 423Luis Alfredo Cruz-Ramírez, Jesús Agustín García-Ramírez,Felix Edgardo Rico-Resendiz, Alfonso Membrilla-Ochoa,Janette Alonso-Herrada, Tania Escobar-Feregrino,Irineo Torres-Pacheco, Ramon Guevara-Gonzalez,Juan Campos-Guillén, Maribel Valdez-Moralesand Andrés Cruz Hernández
16 When Modernity is Not Enough: Towards the Constructionof a Glocal Model of Agri-Food Production. . . . . . . . . . . . . . . . . 455Alejandro Vázquez-Estrada and Adriana Terven-Salinas
Contents ix
Chapter 13Instrumentation and Control to Improvethe Crop Yield
Maria S. Acosta-Navarrete, José A. Padilla-Medina,José E. Botello-Alvarez, J. Prado-Olivarez, M. Perez-Rios M,José J. Díaz-Carmona, Luis M. Contreras-Medina,Carlos Duarte-Galvan, Jesus R. Millan-Almarazand Arturo A. Fernandez-Jaramillo
Contents
13.1 Introduction................................................................................................................. 36413.2 Image Acquisition Process ......................................................................................... 365
13.2.1 Image Processing in Food Industry ........................................................... 36513.2.2 Artificial Vision Systems Applied Grains ................................................. 366
13.3 Materials and Methods ............................................................................................... 36913.3.1 Sample Preparation..................................................................................... 36913.3.2 Image Processing........................................................................................ 36913.3.3 Experiments Design and Statistics Analysis ............................................. 371
13.4 Results......................................................................................................................... 37213.5 Conclusions................................................................................................................. 37513.6 Gas Exchange and Photosynthesis Sensors ............................................................... 37613.7 Sap Flow Sensors ....................................................................................................... 37813.8 Plant Morphological Sensors ..................................................................................... 379
M. S. Acosta-Navarrete � M. Perez-Rios MUniversidad Tecnológica del Suroeste de Guanajuato, Carretera Valle deSantiago-Huamimaro Kilómetro 1.2 38400 Valle de Santiago GTO, Mexico
J. A. Padilla-Medina � J. E. Botello-Alvarez � J. Prado-Olivarez � J. J. Díaz-CarmonaInstituto Tecnológico de Celaya, Av. Tecnológico y García Cubas S/N, 38010 Celaya,GTO, Mexico
L. M. Contreras-Medina � C. Duarte-Galvan � A. A. Fernandez-Jaramillo (&)Ingeniería de Biosistemas CA, División de Estudios de Posgrado, Facultad de Ingeniería,Universidad Autónoma de Querétaro, Cerro de las Campanas S/N 76010 Querétaro, QRO,Mexicoe-mail: [email protected]
J. R. Millan-AlmarazFacultad de Ciencias Físico-Matemáticas, Universidad Autónoma de Sinaloa,Av. De las Americas y Blvd., Universitarios, Cd. Universitaria 80000 Culiacán,SIN, Mexico
R. Guevara-Gonzalez and I. Torres-Pacheco (eds.), Biosystems Engineering:Biofactories for Food Production in the Century XXI, DOI: 10.1007/978-3-319-03880-3_13,� Springer International Publishing Switzerland 2014
363

13.9 Chlorophyll Fluorescence........................................................................................... 38113.9.1 Types of Fluorometers ............................................................................... 38213.9.2 Applications of the Fluorometers to Detect Stress ................................... 384
13.10 Conclusion .................................................................................................................. 38513.11 Climate Control in the Twenty-First Century, the Reliable Way the Guarantee
the Food Supply ......................................................................................................... 38513.11.1 The Last Decade......................................................................................... 38613.11.2 Greenhouse ................................................................................................. 38613.11.3 Optimal Control.......................................................................................... 38913.11.4 Modeling ..................................................................................................... 38913.11.5 Controllers................................................................................................... 392
References................................................................................................................................ 394
13.1 Introduction
Nowadays, there exist several threats around the world that cause catastrophicdamages in the planet. One of the most important menaces is the lack of food thataffects the health of people around the world. Animals and plants need food tosurvive, the survival insurance of both will help to ensure the food production andby consequence the aliment for each person around the world, which is a priorityissue in all countries. At the present time, the food production has been affectedmore drastically by several biotic and abiotic factors that day by day diminish thequantity and quality of the worldwide food; this menaces the food security,principally in less developed countries. According to FAO on 2013, there exist 868millions of persons suffering malnutrition around the world and the most of themmillions are found in Asian and African countries; nonetheless, the highest per-centage is concentrated in Africa (FAO 2013), where exists countries that has65 % with nutrition problems. In order to battle this factors that decrease thequality and quantity of aliment around the world, the agriculture has incorporatedtechnology that goes from employing simple sensors such as temperature sensorsto sophisticated instruments such as phytomonitor. The use of technology inagriculture is commonly called precision agriculture and its goal is, by monitoringvariables affecting the final production and quality of the plants, to increase thequantity and quality of the food production and by consequence decrease theaffection provoked by the abiotic and biotic factors. The process going fromsowing to having a product ready to be sold, has several stages that must becarefully monitored to ensure a product of high quality ready to be consumed; toreach this, the plant need to be monitored during the sow-to-ripening and post-harvesting processes; to do this, several kinds of technology and techniques hasbeen used, one of them is the image processing by employing vision systems.
There exist several physiological phenomena which are manifested by visiblechanges in the plants such as: yellowing, deformation, darkness, or white-spottingof the plant leaves due to nutritional deficiencies or due to viral, bacterial of fungalpathogens principally (Contreras-Medina et al. 2012). Several physiologicalvariables of the plant could be monitored by image processing such as estomatic
364 M. S. Acosta-Navarrete et al.
conductance, photosynthesis, chlorophyll content, which could be related toNitrogen deficiencies and by consequence to photosynthetic rate (Jones 1999;Jones et al. 2002; Netto et al. 2005). In the food industry, the image processing hasbeen employed to determine the quality of a product based in several variablessuch as texture, size, shape, and color principally, these variables could be measureby experts but, the assessments will be subjective because of the judgments var-iation. Other application of image processing in the agriculture is the identificationof weeds, which is other factor that provoke looseness in cultivated crops, andseveral techniques have been developed with the objective of segmenting auto-matically the weed, soils, and plants. Visible phenomena in plants and fruit havethe possibility of being monitoring by using image processing.
13.2 Image Acquisition Process
There exists several algorithms to segment the image into a region of interest andregion of no interest; they could be simple or difficult depending of the complexitydegree of the image. The features of interest in agriculture and food industrygenerally are those related to texture, color, shape, and size (Jackman and Sun2013; Gomes and Leta 2012). In the agriculture, the techniques employed arefocused principally to physiological variables, symptoms detection and weedssegmentation, among others. In food industry, the objective is majorly focused tothe quality of product and analyzes several techniques.
13.2.1 Image Processing in Food Industry
In the last decade, the use of technology in food industry has been increasedgreatly, principally due to the high demanding market that day by day requires anddemand products of high quality. Also, the market restriction in the last few yearshas pursued the use of technology in food production (Gomes and Leta 2012). Thesystems of visual inspections normally consist of a light source, a camera, com-monly a couple charge device (CCD) for capturing the image and a computationalsystem for extracting features of images. Commonly, these kind of systems areused in production lines, where human activity is repetitive and the products needto be manufactured very rapidly, so that, decision making must be based on fastand accurate assessments during the overall process. The advantage of having thissystems is that they offers repeatability and accuracy by eliminating subjectivity,tiredness, slowness and the absorbance of the cost related to human inspection(Gomes and Leta 2012). The system captures the image by using a camera,scanner, videos, etc. Subsequently, it converts the image into digital format andafter this, a pre-processing stage is generally required to highlight the region ofinterest and to remove noise that could interfere at the time of extracting important
13 Instrumentation and Control to Improve the Crop Yield 365

features; the principal objective of a pre-processing stage is to segment the regionof interest to finally apply a processing stage that is in charge of recognizing andinterpreting the image, always seeking to make sense to the object of interest of theimages. In addition, having optimal conditions to acquire a good quality image,permit having a less complex pre-processing algorithm.
According to Davies (2009), several types of food products have been analyzedthrough computational vision techniques including cereals and particularly wheatthat has an important role in the food industry. The wheat (Triticum aestivum L.;Triticum durum), has been one of the main foods for thousands of years, and todayit has the most worldwide economical importance; European countries, India andChina are the main countries that contribute in more proportion to the world wheatproduction with 21.28, 17.62, and 12.36 %, respectively (Hawkesford et al. 2013).At following, a case of study of artificial vision system applied to grain inspectionsis presented.
13.2.2 Artificial Vision Systems Applied Grains
In Mexico, irrigated crops are mainly used for wheat growing, which 95 % of theannual harvest is produced in the autumn–winter season, such graminaceousrepresents the 21 % of the national basic grains consumption, second place justafter the corn grain, with a capita consumption per year of 52 kg and industrialsales volume that will be increasing between 1 and 2 %. The Mexican nationalproduction in 2009 was 4.01 MT with a total value of more than 15 billion USD(Agrosintesis 2013).
The proper conservation of stored grains and seeds in any worldwide location isaffected by various factors: regional ecology; barn, silo, or warehouse availability;type and conditions of grain or seed to be stored; storage climate conditions; andduration of storage, being the latter difficult to be controlled for high volume crops.A worldwide loss of stored wheat grain between 10 and 15 % is estimated byNeethirajan et al. (2007); where main causes are: harvesting machines, waterpermeability on grain gluten, bugs, spores, fungus among others. One of the mostimportant factors to be considered in wheat grain storage is the water permeationon the grain gluten when temperature gradients happen, encouraging the presenceof bugs, mainly Coleoptera, Lepidopterous and microorganisms like Penicillium,Aspergillus, Alternaria, Fusarium, Cladosporium, and Rhizopus. Serious types ofdamages on stored grains are caused by such bugs populations, from its devalu-ation up to the total loss, from an agricultural, economical, and nutritional point ofview (Oliveira et al. 2013).
Two kinds of grain damage are caused by bugs, being the grain destruction andconsumption by either adult bugs or bugs’ larval states through feeding and ovi-position of (Huang et al. 2013a, b). Besides, the economic and nutritional values,as well as the germination potential of the grain or seeds are decreased due to thecontamination caused by the bug’s excrements and dead bodies. On the other hand,
366 M. S. Acosta-Navarrete et al.

the acquisition between 3,000 and 57,000 spores, fungus and other microorgan-isms in the harvesting process, generate toxins and consequently with harmfulconsequences (Bodroza-Solarov et al. 2012). Among the most common funguslocated inside the grain are Helminthosporium spp.; Giberella spp.; Diplodia spp.;and Colletotrichum sp.
The objective of group algorithms in image processing is to find pixels groupshaving similar characteristics (intensity texture, shape, etc.), and that the groupsrepresent homogenous regions in the image, González andWoods (2008). This kindof image processing has been widely used in many image segmentation applica-tions in different areas such as medicine, food processing, chemistry, edaphologic,mechanics, among others (Quintanilla-Domínguez 2009, 2011; Ojeda-Magaña2010; Cortina-Januchs et al. 2011); being such group determinations important toachieve characterizations in different fields of study through the generation ofimportant data for calibrating predictive models and acquisition of morphologicaldata (Baptista et al. 2012). The use of digital tools in image processing algorithmshas many industrial applications in areas such as harvest, postharvest, and rawmaterial processing. In these areas, the morphological dimensions of the objects(such as fruits, grains, cereals, and oilseeds) with defined or atypical geometries arerequired to be known (Peregrina-Barreto et al. 2013). The descriptor determinationof a specie or genotype is an easy task; such descriptor makes reference to thestructure and shape of a surface (López et al. 2008; Baptista et al. 2012). The use ofthese tools in the food area allows to make technical processes and to have a morestrict control. However, there is little information available about implementationof monitoring systems based on image processing techniques for evaluating theeffect of grain storage systems and their behavior on the matrix of silos andwarehouses, where the general conditions of the grain may be affected and difficultto achieve a constant monitoring (Brosnan and Da-Wen 2002).
The study described in this chapter is based on the hypothesis that it is possibleto quantify the morphological characteristic of wheat grains in the postharvestprocessing, this is done by using a digital image processing system in monitoringfactors related with humidity that may have an effect in the grain quality during thestorage stage.
The research objectives are: (i) to monitor the behavior of different types ofwheat grains after different conditioning days have been applied, (ii) to evaluatethe possible relationship between variety and water diffusivity capacity in wheatgrains from its morphometry.
Our study is based on the fact that wheat grains humidity is a variable to betaken into account in the grain storage stage, and it is an important factor to becontrolled in a specific values range along the grain reception, storage, andconditioning stages. In the case of hard and soft wheat grains, the maximumrecommended humidity in storage stage is less than 14 %. The humidity variablecontrol is a determinant factor to keep the best conditions of the grain, for higherhumidity and temperatures above 25 �C a microbacterial proliferation may bepresent in the environment, since the grain has the capacity of water absorption,then it implies its combination with the solid and dry gluten material (Sokhansanj
13 Instrumentation and Control to Improve the Crop Yield 367
Tab
le13
.1Classification
ofwhe
atgrains
Variety
Cha
racteristics
Flour
yield(%
)Protein
(%)
Prope
rties
Uses
Group
a
Softredwinter(G
P),
Jal(JA),
Salam
anca
(SA)
Sem
i-long
grain,
brow
n-oran
geco
lor
69.7
10.2
Softwhe
at,soft
gluten
Coo
kies
III
Ray
ón(R
A)
Lon
ggrain,
redan
dbrow
nco
lorrang
e70
.210
.5Rob
ustflou
ran
dlittle
extensible,
shortan
drobu
stgluten
Bread
sIV
DarkNortheast
Spring,
Can
adian(R
C),
red
Slim
andshort,oscu
reco
lor
68.7
12Hardgluten
androbu
stBread
sI
Hardredwinter(H
R),
Arand
as(A
R)
Slim
andshort,co
pper
color
68.5
12.4–1
4Hardgluten
,robu
stan
dex
tensible
Bread
sII
aSo
urce
Mod
ified
from
www.sag
arpa
.gob
.mx/Prona
se/produ
ctos/trigo
2.html
368 M. S. Acosta-Navarrete et al.

and Lang 1996). However, once the conditioning process has been applied, wherethe grains humidity is increased in soft wheat grains up to 15–15.5 and 16.5 % forhard grains, the wheat grains are kept at rest for 12–36 h long with a controlledtemperature smaller than 45 �C to avoid microbacterial growth. This process stageis difficult to be monitored due to the silo or warehouse geometry.
The water contained inside the wheat grain acts as a hydration element on thetissues; the cells colloids take the form of an elastic gelatin allowing a higher speeddiffusion of oxygen and carbon dioxide (Petra Hogy and Fangmeier 2008). The gasdiffusion phenomenon is directly proportional to the elasticity of the jelly sub-stances Huang et al. (2013a, b), and since decreasing the water contents decreasessuch elasticity, then the respiration gas interchange is decreased, hence a smallervital activity of the organism is achieved. The biochemistry oxidation of carbo-hydrates, fat, and other nutritional materials allows that energy be released throughthe respiration (Bailey 1940).
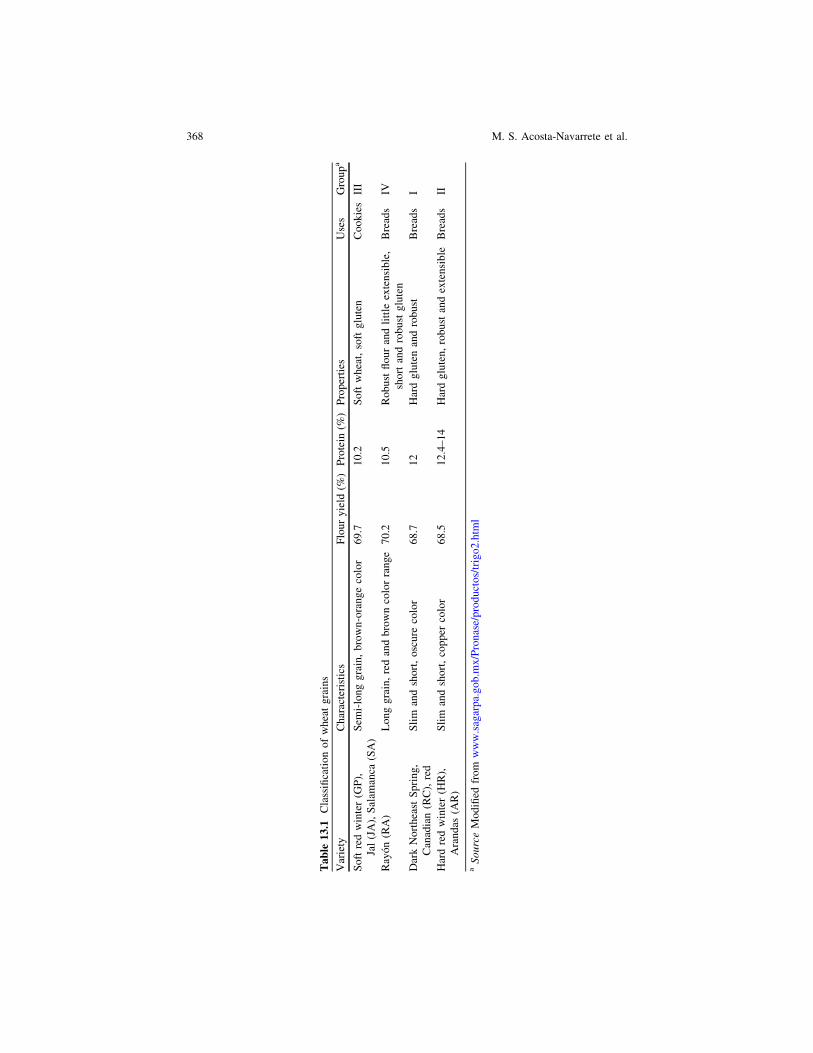
The groups of the wheat grain varieties based on their properties and charac-teristics are presented in Table 13.1, the characteristics of same variety may bedifferent; it is observed that those types of group IV have a higher flour yield(70.2 %) than the group II; but the last one has a higher protein content(12.4–14 %). There is another seeds report indicating that the production of certaincompounds is affected by the crop place, weather, maturity degree, planting sea-son, irrigation and production processes (Vinha et al. 2005; Kalua et al. 2005;Gómez-Alonso et al. 2002; Tovar et al. 2001).
13.3 Materials and Methods
13.3.1 Sample Preparation
The analyzed wheat grain varieties (SA, JA, HR, AR, RA, RC, GP) were donatedby the factory named Molinera de México S.A de C.V, before the application ofany grain treatment or processing. The wheat grains were weighted and condi-tioned to reach a humidity value of 15–15.5 and 16.5 % for soft and hard wheatgrains, respectively. The grain samples were sealed and monitored every 24 h forfirst 7 days long and later every third day to complete a whole monitoring period of21 days (504 h) days, and the environment temperature was controlled to\25 �C.
13.3.2 Image Processing
The block diagram of the vision system for capturing the sample images of allconsidered wheat grain varieties is depicted in Fig. 13.1. In order to have bettercontrasted images, a white background was used. The images of grains were
13 Instrumentation and Control to Improve the Crop Yield 369

Fig. 13.2 a Wheat grains image captured by microscope, b preprocessed image
Fig. 13.3 Ellipsoidal grainshapeapproximation; wherelargest and smallest axes, andthickness are represented bya, b and c, respectively
29 cm
Base
Camera
Computer
Fig. 13.1 Block diagram of vision system for image capturing of wheat grains
370 M. S. Acosta-Navarrete et al.

captured with a resolution of 640 9 480 pixels using the digital microscope Dino-lite with a USB port connection to a personal computer and located at a distance of29 cm.
The pixel/length and pixel/area ratios for the optical system were determinedconsidering a geometric object with known length and area, based on an areareference of 1 cm2 the ratios of 21/220 mm/pixel and 3.46/38013 cm2/pixel wereobtained.
The digital image processing and parameter computing algorithms weredeveloped in MATLAB 13.2a (R2011b). A captured image sample by the usedmicroscope is shown in Fig. 13.2b, as well as the pre-processed image inFig. 13.2b, which is used to evaluate the considered parameters for estimating themorphometric of the wheat grains varieties.
The grains sphericity parameter was computed assuming an ellipsoidal shapefor each wheat grain; this implies the computing of the largest and smallest axes,as well as the seed thickness, see Fig. 13.3.
13.3.3 Experiments Design and Statistics Analysis
The statistics analysis was done by setting two factors, the first was each one of thewheat grain varieties (SA, JA, HR, AR, RA, RC, and GP) and the second one theconditioning time (1–7, 9, 10, 13, 15, 18 and 21) with seven levels as it is given inTable 13.2.
The image resulting parameters were analyzed through media comparison bythe Tuckey-Kramer method (Montgomery 2006), using JMP v5.0 as statistics toolwith a reliability value of 99 % (a = 0.01).
Table 13.2 Description of each essayWheat grainvariety
Conditioning time (days)
1 2 3 4 5 6 7 9 10 13 15 18 21
JA JA-1 JA-2 JA-3 JA-4 JA-5 JA-6 JA-7 JA-9 JA-10 JA-13 JA-15 JA-18 JA-21
HR HR-1 HR-2 HR-3 HR-4 HR-5 HR-6 HR-7 HR-9 HR-10 HR-13 HR-15 HR-18 HR-21
AR AR-1 AR-2 AR-3 AR-4 AR-5 AR-6 AR-7 AR-9 AR-10 AR-13 AR-15 AR-18 AR-21
RA RA-1 RA-2 RA-3 RA-4 RA-5 RA-6 RA-7 RA-9 RA-10 RA-13 RA-15 RA-18 RA-21
RC RC-1 RC-2 RC-3 RC-4 RC-5 RC-6 RC-7 RC-9 RC-10 RC-13 RC-15 RC-18 RC-21
GP GP-1 GP-2 GP-3 GP-4 GP-5 GP-6 GP-7 GP-9 GP-10 GP-13 GP-15 GP-18 GP-21
SA SA-1 SA-2 SA-3 SA-4 SA-5 SA-6 SA-7 SA-9 SA-10 SA-13 SA-15 SA-18 AS-21
13 Instrumentation and Control to Improve the Crop Yield 371
13.4 Results
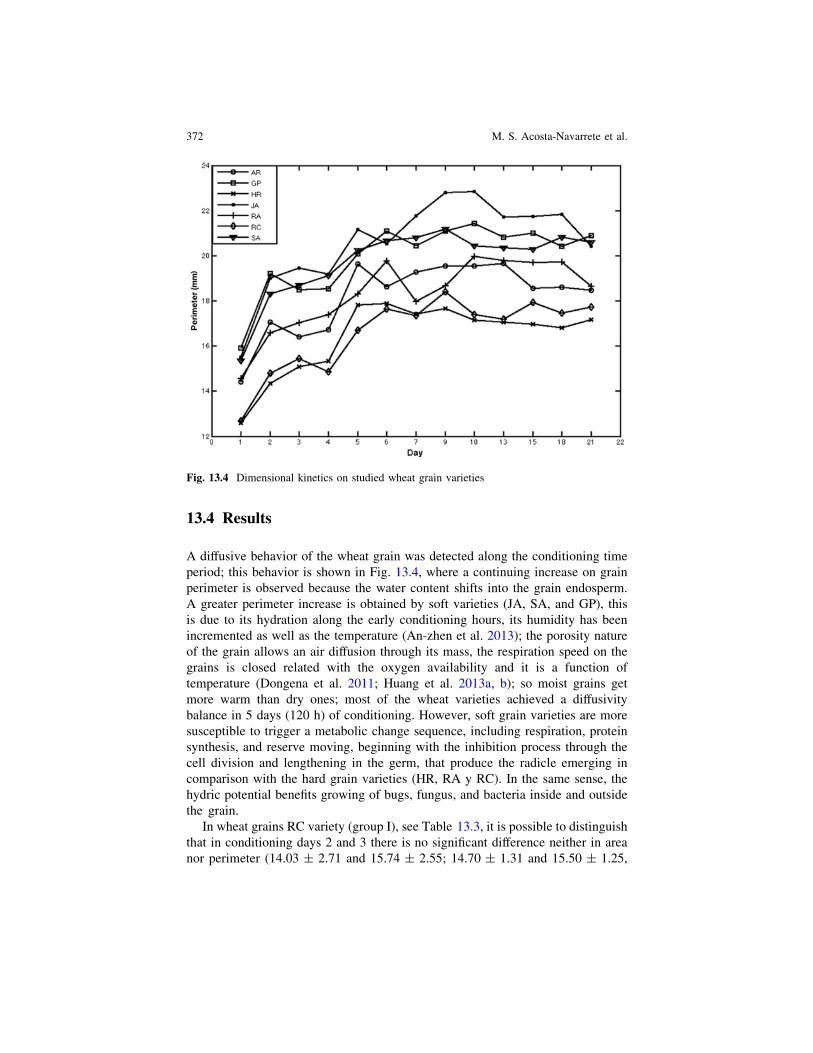
A diffusive behavior of the wheat grain was detected along the conditioning timeperiod; this behavior is shown in Fig. 13.4, where a continuing increase on grainperimeter is observed because the water content shifts into the grain endosperm.A greater perimeter increase is obtained by soft varieties (JA, SA, and GP), thisis due to its hydration along the early conditioning hours, its humidity has beenincremented as well as the temperature (An-zhen et al. 2013); the porosity natureof the grain allows an air diffusion through its mass, the respiration speed on thegrains is closed related with the oxygen availability and it is a function oftemperature (Dongena et al. 2011; Huang et al. 2013a, b); so moist grains getmore warm than dry ones; most of the wheat varieties achieved a diffusivitybalance in 5 days (120 h) of conditioning. However, soft grain varieties are moresusceptible to trigger a metabolic change sequence, including respiration, proteinsynthesis, and reserve moving, beginning with the inhibition process through thecell division and lengthening in the germ, that produce the radicle emerging incomparison with the hard grain varieties (HR, RA y RC). In the same sense, thehydric potential benefits growing of bugs, fungus, and bacteria inside and outsidethe grain.
In wheat grains RC variety (group I), see Table 13.3, it is possible to distinguishthat in conditioning days 2 and 3 there is no significant difference neither in areanor perimeter (14.03 ± 2.71 and 15.74 ± 2.55; 14.70 ± 1.31 and 15.50 ± 1.25,
Fig. 13.4 Dimensional kinetics on studied wheat grain varieties
372 M. S. Acosta-Navarrete et al.

respectively). However, there is statistics difference in area and perimeterdimensions in days 1, 2, 3 and 21, area and perimeter value vary from 10.55 to20.77 and 13.03 to 17.8, respectively. Concerning to the sphericity index, it ispossible to establish that grain hydration is not uniform because it is moving awayfrom the particle roundness as the conditioning days pass by.
A similar behavior for area and perimeter was obtained for wheat grain of groupII (AR and HR), see Table 13.4. Regarding to sphericity index for AR variety nosignificant difference was found neither in days 1, 2, and 3 nor between day 1 and21, from which we can deduce that the endosperm hydration is quite similar ineach one of the grain sides, keeping in this way its original shape.
For wheat grain of group III (GP, JA, and SA), significant statistics difference ingrain area and perimeter were observed between days 1 and 2, see Table 13.5.
Table 13.3 Wheat grain morphometrics for group I
Conditioning days RC
Area (mm2) Perimeter (mm) Sphericity index
1 10.55 ± 1.62c 13.03 ± 0.94c 0.82 ± 0.02a2 14.03 ± 2.71b 14.70 ± 1.31b 0.79 ± 0.04ab3 15.74 ± 2.55b 15.50 ± 1.25b 0.77 ± 0.05ab21 20.77 ± 2.98a 17.80 ± 1.32a 0.76 ± 0.05b
Average ± standard deviation with media comparison by Tukey (\0.01), for same letters nosignificant difference
Table 13.4 Wheat grain morphometrics for group II
Conditioning days AR
Area (mm2) Perimeter (mm) Sphericity index
1 12.32 ± 0.93c 14.76 ± 0.93c 0.80 ± 0.021ab2 18.24 ± 1.59b 17.18 ± 1.59ab 0.80 ± 0.05b3 18.19 ± 1.42b 16.70 ± 1.42b 0.78 ± 0.04b21 21.66 ± 1.19a 18.45 ± 1.19a 0.83 ± 0.04a
Average ± standard deviation with media comparison by Tukey (\0.01), for same letters nosignificant difference
Table 13.5 Wheat grain morphometrics for group III
Conditioning days SA
Area (mm2) Perimeter (mm) Sphericity index
1 15.50 ± 1.29c 0.85 ± 0.01a 0.83 ± 0.02ab2 21.22 ± 3.05b 18.34 ± 1.35b 0.82 ± 0.01ab3 21.91 ± 2.59b 18.65 ± 1.28b 0.81 ± 0.02b21 27.16 ± 4.20a 20.80 ± 1.47a 0.80 ± 0.03b
Average ± standard deviation with media comparison by Tukey (\0.01), for same letters nosignificant difference
13 Instrumentation and Control to Improve the Crop Yield 373

Regarding to sphericity index, no significant difference among the three evaluatedvarieties was found.
The obtained dimensions values for wheat grain variety RA classified in groupIV are presented in Table 13.6. Since the group characteristics and rheologicalqualities like extensibility, robustness and force, like the other groups statisticsdifferences in area, perimeter and sphericity were obtained between days 1 and 2.However, no significant difference was observed in any of the evaluated parametersbetween days 2 and 3. The grain shape was modified in day 21 because of thesignificant increment in area and perimeter parameters.
Data dispersion for sphericity index parameter is depicted in Fig. 13.5, wherefirst day is compared with the others (days 2, 3 and 21). As it is shown, a sphericityindex loss in the grain shape begins at day 2 for all varieties except for RC variety,which sphericity loss begins until day 3; the reason might be the gluten compositionon the endosperm and the behavior of the flour considered as an ideal flour with
Table 13.6 Wheat grain morphometrics for group III
Conditioning days RA
Area (mm2) Perimeter (mm) Sphericity index
1 12.34 ± 1.73c 14.56 ± 1.07c 0.85 ± 0.02a2 17.34 ± 2.10b 16.62 ± 0.98b 0.81 ± 0.02b3 17.64 ± 2.48b 16.75 ± 1.20b 0.80 ± 0.02b21 23.15 ± 3.42a 19.01 ± 1.31a 0.80 ± 0.02b
Average ± standard deviation with media comparison by Tukey (\0.01), for same letters nosignificant difference
Fig. 13.5 Averages of sphericity indexes with typical error
374 M. S. Acosta-Navarrete et al.

ratio of robustness/extensibility equal to one, which allows that flour from thiswheat variety may be used either for traditional or mechanical bakery products.
13.5 Conclusions
Even all wheat grains are composed of three main parts (germ, endosperm, andteguments), a significant difference in porosity and diffusivity on the pericarp ofthe evaluated wheat grains varieties was observed. According to the obtainedresults, the pericarp permeability allows a better diffusivity on soft grain varietiesthan on hard ones, and consequently an easier moisture flow to the endosperm.
The hydric potential for soft wheat grains varieties is lower than for the hardones, hence, it is an important issue to use all the required resources in order tokeep low wheat grain humidity, ensuring in this way the right environment con-ditions for grain storage (Ramirez 1984). The humidity parameter measurement isa difficult task due to the geometrical shapes of warehouses and silos.
The wheat grains of group II (HR) resulted in a more spherical geometrybecause their sphericity indexes were the greatest compared with other varietiesgroups grains.
The obtained sphericity index in first conditioning days was greater for grainvarieties SA, AR, HR, AR than for grain varieties GP, RC, and RA; this is becauseof the own characteristics of the grain. However, based on the grain area andperimeter values as conditioning days passed by, it was possible to identify that theadequate conditioning time could be between one and two days (24 and 48 h).
Even the given application advantages of the used artificial vision system limitswere observed, such as that grain group classification is based on just dimensionalparameters and it is not taking into account more grain specifications such as color,strength, and texture among others. Nevertheless, the obtained wheat grain data arehelpful to know the processing conditions in manufacturing wheat grain flour,because the flour obtained from soft wheat grains requires less water and smallerkneading time than hard wheat grains flour. Among the rheology properties ofwheat flours, it has been proved through farinograma that soft wheat grainsvarieties require four times less kneading time than hard wheat grains varieties likecrystalline. On the other hand, the behavior of the dough stability for soft and hardwheat grains flours is quite similar. However, the stability time for dough withrayon wheat grains flours is greater; this is because of the quality of gluten,which is composed by proteins giving the viscoelastic characteristics of wheat(Acosta-Navarrete 2003).
13 Instrumentation and Control to Improve the Crop Yield 375
13.6 Gas Exchange and Photosynthesis Sensors
The photosynthesis process is considered the most important biochemical reactionbecause it allows plants to transform sunlight energy into chemical energy (Millan-Almaraz et al. 2013). Because of this, plants fix carbon dioxide (CO2) and releaseoxygen (O2). This process is considered the most important biochemical reaction inthe world because it produces 90 % of the planet biomass (Taiz and Zeiger 2006).On the other hand, photo-inhibition is a term utilized to describe all the environ-mental conditions that can negatively affect the photosynthetic activity. The mostcommon stress factor is light. Consequently, accurate photosynthesis measure-ments are necessary to establish comparisons and understand plant productivity orbiomass accumulation at the leaf, plant, canopy, or community levels as well astheir interaction and response to environmental (Bakker et al. 2001), chemical(Marschner 1995), or biological (Stout et al. 1999) factors that generate stressconditions. Here, it can be inferred that it is very important the photosynthesismeasurement because it reflect the whole crop biomass production which where it isvery important to maintain high yields at the new generation plant factories.
There are many methods to perform photosynthesis measurements. However,the gas exchange method is currently the most commonly utilized technique toachieve this by measuring carbon dioxide exchange. Because of this, this methodis widely utilized in commercial equipment and experimental setups in order tomeasure individual leaves, whole plants, plant canopy, and even forests (Millan-Almaraz et al. 2009; Schulze 1972; Bassow and Bazzaz 1998). This methodologyis based on isolating the specimen or sample under analysis in a closed chamber tomeasure the initial gas concentration when the chamber is closed. After a fewminutes, the chamber has been closed, recording changes in the proportions ofgases from the air inside the chamber produced by the plant is also carried out.Consequently, it is possible to measure the gas exchange by analyzing O2 or CO2
concentration (Schulze 1972; Takahashi et al. 2001). There are two types of gasexchange designs: closed chambers where the sample is completely enclosed tomeasure the difference in gas without contact with outside air and the openchambers where air can freely enter and leave the chamber flowing through thesample (Hunt 2003).
Infrared sensors for gas analysis (IRGA) are the most utilized for CO2 mea-surement and are based on an infrared emitter-photo detector par whose light beamis used to measure the concentration of gas molecules in the air. This is based onthe absorption phenomenon of the light beam by molecules in a gaseous state(Hunt 2003). This phenomenon of absorption occurs because the heteroatomic gasmolecules with odd number of atoms such as CO2, CH4, NH3, to name a few,absorb a portion of the infrared light while the homoatomic gas molecules such asN2 and O2 do not. The CO2 has a maximum detection at a wavelength of 4.25 lm,with peaks side of 2.66, 2.77 and 14.99 lm (Hill and Powell 1968). The calibrationof these sensors to zero adjustment requires air free of CO2 and other heteroatomicgases; therefore N2 is most often used for calibration purposes. Also, the
376 M. S. Acosta-Navarrete et al.

adjustment requires a span of known concentration of CO2 to be carried out withprecision pumps (Hunt 2003). In Fig. 13.6, it can be observed a diagram thatshows the emitter-photo detector pair and the infrared beam which is partiallyabsorbed by CO2 molecules.
As was aforementioned, the CO2 exchange is the most commonly used methodfor building commercial and experimental photosynthesis monitoring systems. Thedesign of these kinds of systems should include several considerations, includingthe operating range of CO2 of the phenomenon being studied to ensure theselection of an appropriate IRGA according to the application. It has been reportedthat the range of physiological importance is 50–800 ppm (Hanstein et al. 2001).Electrochemical sensors for CO2 are not appropriate because of their poor sensi-tivity to low CO2 concentrations. Therefore, non-dispersive infrared sensors(NDIR) are the most appropriate. Another important aspect to consider is the airflow. It has previously been found that the range more appropriate for minorvariations in the accuracy of a photosynthetic rate is 0.3–1.0 m s-1 (Kitaya et al.2000). Another aspect to analyze is the design of the chamber seal. Earlier, dif-ferent systems were designed with a seal of black neoprene and a transparentsurface so that light falls on the leaf for photosynthesis process. This is problematicas the black surface of the seal obscures a portion of the road tested and causesdark respiration. This, in turn produces CO2 that seeps into the leaf chamber of theleaves and produces miscalculation of the photosynthetic rate based on the CO2
exchange in the chamber without taking into account the parasitic dark respiration(Pons and Welschen 2002; Long and Bernacchi 2003). The design of the shape ofthe leaf chamber should be selected according to the needs of the morphologicalspecies to be studied. There are chambers ranging from those used for small leavesall the way up to soil analysis chambers (LI-COR Corporation, Lincoln, NE,USA). Finally, the technological platform that allows electronic control for elec-trical and mechanical systems that are needed to make an entire photosynthesismonitoring system and the export and storage of data to a computer for futureoffline analysis on a personal computer (PC) or a microcontroller (lC) be carriedout. In Fig. 13.7, it can be observed the most common gas exchange configurationfor photosynthesis measurement.
This method provides an alternative to the CO2 exchange, which can be used asan additional tool combined with CO2 exchange in order to observe thesephenomena. The procedure utilized in this method is basically the same as usingCO2. Nevertheless, this method has serious disadvantages. The first is that the O2
Fig. 13.6 Infrared CO2
analyzer
13 Instrumentation and Control to Improve the Crop Yield 377

exchange technique is the difference between the initial and final concentrations,this is, it is smaller compared to CO2 exchange systems and by this reason, the O2
exchange systems require high precision sensors and expensive data acquisitiondevices (Hunt 2003). Another disadvantage is that the oxygen gas is more unstablethan CO2 and has to be maintained at a high and very stable temperature (around700 �C) to maintain a stable molar concentration.
13.7 Sap Flow Sensors
In plants, there are two main vascular tissues at stems which are responsible ofwater and nutrition transport in the sap. Xylem is the first one and the responsibleof water transport at the inner radius of a plant stem. In contrast, phloem is locatedin the outer radius of plant stem and is responsible of transporting photosynthesisproducts and other nutrients such as sugars (Taiz and Zeiger 2006). Sap flowmeasurement is an instrumentation technique which consists on introducingsensors in the plant xylem at stems or trunk to measure temperature differencesthat indicates sap flow information such as direction and density (Granier 1987).
Sap flow measurement has been utilized for many years to analyze differentkinds of plant and its relations to water, soil and atmosphere conditions (Herzog1995). In plants, sap flow has a specific trend to increase at middle day hours andstarts to decrease at evening to finally reach its minimum value during night(Herzog 1995). Transpiration is another useful variable which allows detectingwater related stress phenomena in plants (Millan-Almaraz et al. 2010). However, itresults complex and costly when it is compared to sap flow technique that only
Fig. 13.8 Most utilized sapflow measurement methods,a TDM and b HRM setups
Fig. 13.7 Basic CO2 gasexchange configuration forphotosynthesis measurement
378 M. S. Acosta-Navarrete et al.
requires temperature sensors and a heater element which are cheap and easy to beimplemented (Davis et al. 2012). In order to perform sap flow measurements, thereare three main methodologies: heat ratio method (HRM) (Burgess et al. 2001), heatbalance (Sakurtani 1981), and thermal dissipation method (TDM) (Granier 1985).
TDM consists on using continuous heating in the stem and measuring thethermal dissipation capability when the sensor and stem are in steady state orthermal equilibrium (Allen and Grime 1995; Granier 1985). The variations in theheat dissipation that occurs during day are in function of sap flow. First, a heaterelement with an attached thermocouple is introduced in the stem by drilling a fewmillimeters of depth and the stem is heated electrically at a constant ratio andanother thermocouple is introduced a few centimeters below the heater probeposition in order to measure the amount of heat taken by the sap flow stream atxylem (Allen and Grime 1995; Davis et al. 2012). As observed at Fig. 13.8.
The HRM consists on sending short heat pulses of 1–2 s of duration to the plantstem. Consequently, the mass flow of sap is obtained from the speed measurementof the heat pulses moving along the stem where two thermocouples are introducedat equal distance but one below the heater and the other one at an upper distancefrom the heater (Marshall 1958; Swanson and Whitfield 1981; Davis et al. 2012).The main difference between TDM and HRM in terms of hardware is that HRM donot use a thermocouple attached to the heater but uses two thermocouples tomeasure the heat movement across sap stream. Furthermore, both temperaturesensors return to same reading after 60 s of sending the heat pulse (Sakurtani 1981;Baker and van Bavel 1987).
13.8 Plant Morphological Sensors
As was aforementioned in the sap flow section, plants have a sap flow systemwhere the xylem transport water, phloem transport sugars, and other nutrients andtranspiration is a water loss mechanism which occurs during CO2 exchange pro-cess during photosynthesis. As a consequence of water and nutrient flow across theplant, stems, and trunks produce diameter variations which are completely relatedto sap flow. Therefore, during day hours occurs a steam diameter decrease while itincreases during nighttime (Berger and Selles 1993; Garnier and Berger 1986).Consequently, this stem diameter information result very useful for plant physi-ology research purposes and plant production systems where drought and otherwater-related stress conditions need to be monitored with accuracy (Morandi et al.2007).
There are two main types of sensing elements which are utilized for morpho-logical sensors: strain gauges and linear-variable-displacement-transducer (LVDT)(Morandi et al. 2007). Strain gauges consist in a variable resistor which appears indifferent shapes, this devices produces electrical resistance variations due tomechanical displacement. Strain gauge-based sensors are widely utilized as stem/trunk diameter sensors and fruit growth sensors (Ortuño et al. 2010). The theory of
13 Instrumentation and Control to Improve the Crop Yield 379

operation consists in designing a mechanical arrangement which be capable ofbeing attached to a trunk or a fruit and linked to the variable displacement sectionof the strain gauge. By this way, plant mechanical variations are converted toelectrical resistance variations and consequently to a voltage signal often through aWheatstone bridge circuit which is connected to a data logger (Morandi et al.2007). On the other hand, LVDT sensors are more utilized to build point dend-rometers which are a variable displacement bar connected to a transformernucleus. The LVDT variable displacement bar is installed on the side of the planttrunk. Hence, any variations produced by the plant trunk diameter are sensed byLVDT nucleus (Korpela et al. 2010). Also there are some less common technol-ogies to build stem diameter and other morphological sensors such as optical fibersto build point dendrometers for tree growth monitoring (Uchida et al. 2010).
The design of morphological sensors varies and depends on plant characteristicssuch as size, shape, or location. For example, there are fruit growth sensors whichare designed to measure microvariations on apples, tomato, or other fruits size.Also, there are stem diameter sensors for different types of plants stems or trunks(Korpela et al. 2010). In Fig. 13.9, it can be observed some examples of mor-phological sensors based on strain gauges or LVDT sensors for different appli-cations such as wine industry (Montoro et al. 2012), orchards (Bonet et al. 2010)among others.
Fig. 13.9 Stem diametersensor based on LVDTtransducer
Fig. 13.10 Light absorptionand chlorophyll fluorescenceemission (modified by Taizand Zeiger 2006)
380 M. S. Acosta-Navarrete et al.

13.9 Chlorophyll Fluorescence
As mentioned above, there are many ways to improve the agricultural production,chlorophyll fluorescence is a widely used technique with the aim to monitor thephysiological state of the plant, therefore strongly related with the photosyntheticprocess.
The photosynthesis is the main process in the plant, being of great interestbecause the carbon, hydrogen, and oxygen assimilated make up *96 % of drymatter of a typical plant (Taub 2010), and this is reflected on the crop yield.
First, in order to understand the chlorophyll fluorescence, it is necessary toknow that photosynthetic organisms majorly are green, because only the blue andthe red light are absorbed, as we can see in Fig. 13.10, resulting that the human eyeperceive as the photosynthetic organisms on green. Insomuch as the fluorescencein the plant is a re-emitting energy process with increased wavelength of thephotons previously absorbed. That is why in Fig. 13.10 the fluorescence responseis a little move to the right, because it is consequently of the loss of energy in there-emitting (Taiz and Zeiger 2006).
Photosystems (PS) are in charge of this re-emit of photons, there are twophotosystems: PSI and PSII that are containing in chloroplast with thylakoidmembranes. PSI has a very low fluorescence contribution under standard condi-tions, that is why can be neglected. On the other hand, the PSII is the largerfluorescence contributor, being the photosystem which the commercial chlorophyllfluorescence systems commonly perform (Johnson et al. 2009; Stirbet 2011).
The important of the PSII in order to improve the yield crop is constituted bypigments and proteins in the thylakoid membrane of chloroplast which is closelyrelated with the stress conditions of the plant (Kautsky and Hirsch 1931). Beingmodified the re-emitting of photons by plant in red and far-red of the electro-magnetic spectra varying comfort conditions of the plant (Lichtenthaler et al.2013).
The chlorophyll fluorescence produced by PSII and PSI (last one with a smallcontribution) can be used as analytical tool (Belyaeva et al. 2011). It is necessaryto use a fluorometer to measure and analyze the parameter that instrument provideus.
The fluorometers are constituted mainly by two stages. First stage is the way inwhich the photosynthetic sample is excited; this is reached by two differentmethods: passive and active methods. Passive methods are when the sample isexcited by sunlight; the main advantage of this technique is that you can saveelectronically light source devices but the acquisition of the chlorophyll responseis more complicated due to the environmental noise and lack of control of the lightsource (Fernandez-Jaramillo et al. 2012).
On the other hand, the active methods consists in the utilization of light emitterdevices, among which are the Light Emitter Diode (LED) (Faraloni et al. 2011;Johnson et al. 2009; Kissinger and Wilson 2011; Ji et al. 2010). Lamps such ashalogen (Van Gaalen et al. 2007), xenon that normally it is used on combine of
13 Instrumentation and Control to Improve the Crop Yield 381

another light sources (Lichtenthaler et al. 2013; Röttgers 2007) or even lasers andlaser diodes (Thoren and Schmidhalter 2009; Kolber et al. 2005; Schächtl et al.2005). In this stage, it is advisable to add an optical filter with the aim to avoidnoise that light source can emit in chlorophyll fluorescence area.
After the chlorophyll excitation on the second stage, it is necessary to acquirefluorescence response, there are different devices to apply in this stage accordingwith the applications, commonly it is used the photodiode, because it could beeasier to instrument and inexpensive option (Fedack et al. 2005; Kissinger andWilson 2011). Other option is the employment of photomultipliers for finer andmore sensitive applications (Bürling et al. 2011; Hunsche et al. 2011). In this stage,it is critical the use of optical filters in order to avoid the light source or envi-ronmental noise and have, as a result, a fluorometer capable of measuring thefluorescence lifetime of the sample.
13.9.1 Types of Fluorometers
There are many fluorometers in the market to meet the different needs andapplications. The Pump and Probe Fluorometer (P&P) (Falkowski et al. 1986)works with a methodology to obtain the main chlorophyll fluorescence valuescontained in Table 13.7. The P&P basically consists on a chamber with two xenonlamps that are related by Pump and Probe. First it is necessary a weak probe flashto measure Fo, then after a delay the actinic flash allows obtain the Fm value towith these two previous values estimate Fv as shown in Fig. 13.11.
The problem with the utilization of Xenon flashes is that they need delay periodto give a new flash again. The Fast Repetition Rate fluorometer (FRR) is rathersimilar than P&P. However, on FRR solve the delay problem, reaching even100 Hz with the utilization a second lamp, nevertheless even at this frequency theflash rate is too slow to effectively measure the faster photosynthetic process(Kolber and Falkowski 1995). The FRR that builds from a earlier P&P resulted ona rapid chain of flashes (*27,500 lmol photons m-2 s-1) over a period of150–400 ls with the aim to obtain Fm (Suggett et al. 2000).
Table 13.7 Summary of fluorescence parameters
Fo, F, Fm Minimum, steady state and maximum values of chlorophyll fluorescence in dark-adapted
Fv Variable fluorescence (Fm–Fo)Fv/Fm Maximum quantum yield of photochemistry in PSII (dark-adapted)Fo
0, F0,F0
m
Minimum, steady-state and maximum values of chlorophyll fluorescence in light-adapted
DF0/Fm0 Quantum yield of photochemistry in PSII (light-adapted)
Fv0/Fm
0 Quantum efficiency of photochemistry in open reaction center of PSII (light-adapted)Fq
0 Difference between Fm0 and F
Fq0/Fm
0 PSII operating efficiency
382 M. S. Acosta-Navarrete et al.

In awake of to improve the FRR and decrease the cost of fluorometer, it wascreated a new methodology named the Fluorescence Induction and Relaxation(FIRe). A multicolor excitation light source was implemented, and basically theprotocol consists on four phases: first, a short strong pulse of 100 ms of durationcalled Single Turnover Flash (STF) with the aim to cumulative saturate PSII andmeasure the Fo to Fm. Second, it is necessary to apply a weak modulate light toacquire the relaxation kinetic of chlorophyll fluorescence yield on the time scale of500 ms. Then, A strong long pulse with 50 ms duration, called Multiple TurnoverFlash (MTF) in order to saturate PSII and the PQ pool. Finally, a weak modulatelight is necessary to apply to record the kinetics of the PQ pool re-oxidation withduration of 1 s. Generating a sturdy fluorometer capable even to measure largetime lapses under the water (Gorbunov and Falkowski 2004).
One of the most utilized and complete chlorophyll fluorescence measurementsystem is the Pulse-Amplitude Modulation (PAM) fluorometer. This measurementsystem consists in stages of sample excitations even with different light source aswe can see in Fig. 13.12. First with this technique it is necessary to keep thephotosynthetic sample isolate in the dark, usually with a chamber in order to do notsubtract portability and do field measure. This dark-adapted time period can bebetween 10 and 20 min. Then a pulse measuring low red light ML is used todetermine Fo of dark-adapted sample, it is important that ML must be low enoughin order to avoid chlorophyll fluorescence emitting (Fig. 13.12). With the aim todetermine Fm is applying a white light saturation pulse SL (e.g., 3,000 lmol(photon) m-2s-1). When the fluorescence decrease again to Fo level a continuousnonsaturating red actinic light is started AL, this induces a maximum fluorescenceat level Fp and subsequent a slow decline between 3 and 4 min until reach F levelagain. Then in order to obtain Fm
0, a saturating flashes SL is necessary apply; thismust be during AL. After several minutes of AL, when the constant low F isreached with the aim to activating only PS1 during a few seconds, a SL is givenand then AL is turned off (Lichtenthaler et al. 2005).
Fig. 13.11 Pump and ProbeFluorometer light source andfluorescence response
13 Instrumentation and Control to Improve the Crop Yield 383

13.9.2 Applications of the Fluorometers to Detect Stress
Until now, the reader has been guided through the operation of fluorometers, in thissection we will make a brief the application of the fluorometers in the stressdetection. It is well known that the photosynthetic processes are quiet related withthe comfort status of the plant, because the photosystems are the major targets ofmany environmental stress modifying the crop yield, hence the chlorophyll fluo-rescence kinetics (Lin et al. 2007). However, there are stresses that are not directlyrelated with the chlorophyll fluorescence. For example, in drought stress, thedecrease of the relative water content of leaves results in a stomatal closure anddecreasing the supply of CO2 to the mesophyll cells and then decreasing the rate ofthe photosynthesis. Mentioned above, there is not a direct impact on the efficiencyof the primary photochemical events of the PSII or affect the chlorophyll fluores-cence parameters (Table 13.7), such as maximum quantum yield of photochemistryin PSII in dark-adapted (Fv/Fm) (Massacci and Jones 1990). On the case of thesalinity stress is very similar to drought, and it is provoke where large amounts offertilization and irrigation are employed in climates with high evaporation, whichresults in changes in Fq
0/Fm0.
In the case of the temperature, for example low temperatures, the metabolism isseverely affected and the damage of the PSII that is high affecting also the mea-surement of the maximum quantum yield of the photochemistry in PSII. On theother hand, with the high temperatures the inactivation of the PSII and the dis-organization of the thylakoid are taken into account causing a monitoring the riseof Fo as well as the Fv/Fm (Baker and Rosenqvist 2004).
The nutrition is critical in yield of the crops, being Nitrogen the main mineralnutrient needed for chlorophyll production (Muñoz-Huerta et al. 2013).
Fig. 13.12 PAM chlorophyllfluorescence kinetics,modified by Lichtenthaleret al. (2005)
384 M. S. Acosta-Navarrete et al.
Decreasing the Nitrogen content in the case of the apple leaves decrease Fq0/Fm
0,Fq
0/Fv0, and Fv
0/Fm0 (Cheng et al. 2000). However, the Fv/Fm is not clearly affected
unless the nutrition stress is critical (Baker and Rosenqvist 2004).
13.10 Conclusion
As has been noted in above-mentioned, some stresses have similar affectations onthe chlorophyll fluorescence kinetics. However, it is necessary to pay attention inthe modifications of the data produced by the fluorometers, because in the liter-ature there are many ranges of the plant comfort, but the plants are living beingsand such as us, are different in the thresholds of comfort at the moment of feel theenvironmental, nutrition, among others factors that can affect the photosyntheticprocess, and here lies the importance to apply a analytic tool such as the chlo-rophyll fluorescence measurement systems and benefit that is a noninvasive tool,being a good and remarkable attribute because its congruence to make a mea-surement without a stress such as measurement invasive do.
13.11 Climate Control in the Twenty-First Century,the Reliable Way the Guarantee the Food Supply
Food security is one of main global challenges in the current century. Wordpopulation will increase up, at least, the middle of the twenty-first century, anddemand food will rise. Moreover, problems such as climate change and pests havea profound impact on food production. Then, it is easy to notice that traditionalagricultural scheme cannot deal with these problems and an alternative solutionhas to be implemented (García-Mier et al. 2013).
Greenhouses are building structures that allow the creation of an indoormicroclimate for crop development, protecting plants from severe external climateconditions or pest invasion. The greenhouse microclimate can be manipulated bycontrol actions, such as heating, ventilation, CO2 enrichment to name a few; inorder to provide appropriate environmental conditions. These modifications implyadditional use of energy in the production process. Furthermore, it requires acontrol system that minimizes the energy consumption while keeping the statevariables as close as possible to the optimum crop physiological reference. Hor-ticulture in greenhouse conditions is a rapidly expanding interest and is conse-quently increasing in its economic and social importance (Kolokotsa et al. 2010).
The greenhouse climate control problem consists in the creation of a favorableenvironment for crop development, looking for high yield, quality and lowoperative costs. Along the time, researches have shown that this is a very difficulttask, due to the complexity of the greenhouse environment. Even small changes inthe structure or location could drastically redefine the problem. For example,
13 Instrumentation and Control to Improve the Crop Yield 385
microclimate variables such as temperature and relative humidity (RH) are highlynonlinear and strongly coupled, and the greenhouse is largely perturbed by theoutside weather. Also the aforementioned objectives (yield, quality, low cost)presents conflict of interest because generally, high control precision agriculturerequires extra energy consumption (Haigen et al. 2010).
13.11.1 The Last Decade
Despite many technological limitations, greenhouse engineering developmentsduring 1990s shows significant progress in different fields. There have been sig-nificant advances in the modeling of thermal behavior of the greenhouse and mucheffort was directed toward understanding ventilation. Analysis has shown thatdifferent sources exist (thermal and wind induced forces) and these have beenanalyzed. The existence of internal circulating air patterns has also been estab-lished. Considerable progress has been made in developing methods to provideCO2 setpoint trajectories that maximize the margin between the financial benefit ofenrichment and the cost of the CO2 used (Critten and Bailey 2002).
Notwithstanding the impressive progress in control theory and the under-standing about phenomena related with the greenhouse microclimate, conventionalcontrol techniques were almost exclusively used during last decade. Althoughreached solutions were barely reliable, attempts to use modern techniques toimprove the quality of the control was limited by the high complexity of thesetechniques and the low computational power available, making its application oncurrent hardware impossible (Sigrimis and King 2000).
13.11.2 Greenhouse
Different research has been conducted regarding climate control for protectedagriculture applications. The main objective of these investigations is to find anaccurate model that represents the greenhouse environmental dynamics and anefficient and a flexible controller that adjusts the microclimate variables of interest.This problem has been the focus of many re-searchers worldwide who haveanalyzed, experimented, and proposed many climate control systems in order tomanipulate variables such as temperature, RH, CO2 enrichment, radiation, andmany others that are necessary to generate the fundamental conditions for suc-cessful protected agriculture (Van Straten et al. 2000).
The greenhouse-crop system can be considered as a solar collector involvingsensible and latent heat exchanges. It is a complex system that can be divided intothree main components, which presents a high mutual interaction: internal atmo-sphere, the crop, and the soil. The behavior of the whole system not only dependson these interactions, but also on the outside weather and on the actions of
386 M. S. Acosta-Navarrete et al.

actuators via the control system. A simple model from the greenhouse system canbe formulated by energy and mass balance principle (Boulard and Wang 2000).Therefore, the simplest way to represent the greenhouse system, including externalperturbations, microclimate variables, and even possible control inputs are pre-sented in Fig. 13.13.
The output variables are: inside relative humidity HRi in (%), inside temper-ature Ti (�C) and CO2 concentration CO2-i (ppm). The input variables that can bemanipulated are ventilation Vr (m
3 s-1), heating control Qheat (W), water capacityof the fog system Qfog (gH2Os-1) and CO2 dosage flux CO2-s (ppm). Measurableperturbations are: solar radiation So (W m-2), outside temperature To (�C), outsiderelative humidity RHo (%) and wind speed and direction Vr (m s-1).
The importance of aforementioned greenhouse climate model lies in mostcontrol theories require the mathematical model of the system for tuning andsimulating the proposed algorithms. Then, different mathematical greenhousemodels have developed based on this scheme (Fig. 13.13). It includes from simplemodels that only describe air temperature or relative humidity to detailedmodels thateven involve crop response (Setiawan et al. 2000). A simple model of the temper-ature changes in a greenhouse can be described by the differential equation 13.1.
dTGdt
¼ 1C
Kout; air To � TGð Þ þ qh� � ð13:1Þ
where the TG is the greenhouse internal air temperature, C the greenhouse thermalcapacity, Kout, air is the heat loss coefficient from greenhouse air to outside air. To isthe external air temperature and qh is the heating power (Arvanitis et al. 2000).Despite easiness of the model, is widely accepted and provides a quick, inex-pensive, flexible and repeatable way to compare how the greenhouse temperatureresponses to certain control methodology. These characteristics are not achievableby using experiments.
However, model of Eq. 13.1 do not take into consideration other importantfactors and their interactions. Therefore, in an effort to reach a more accurate
Fig. 13.13 Greenhouse climate model
13 Instrumentation and Control to Improve the Crop Yield 387
model, variables such us absolute humidity, short-wave solar radiation, leaf areaindex, ventilation rate, and interaction rates between the main greenhouse com-ponents (crop, soil, internal atmosphere) were addressed in the greenhouse climatemodel by Castaneda-Miranda et al. (2006). Nevertheless, the performance ofdeveloped models is limited by the lack of crop response within the equation,because crops strongly influence the surrounding environment a in a dynamic way,according to their phonological development. This problematic have not beencompletely solved, but promising approaches that include greenhouse-crop inter-action and complex processes such us photosynthesis or transpiration have beendeveloped (Van Straten et al. 2000).
Is easy to notice how has evolved the way to addressed the problem, going frommodels which just describe the thermal behavior of the greenhouse by usingenergy and mass balance. To unconventional descriptions that consider the cropinfluence and also take account how this influence change over time. New ten-dencies move on this direction, giving the deserved importance on models andcontrol theories to the main factor in the greenhouse, ‘‘the plat’’.
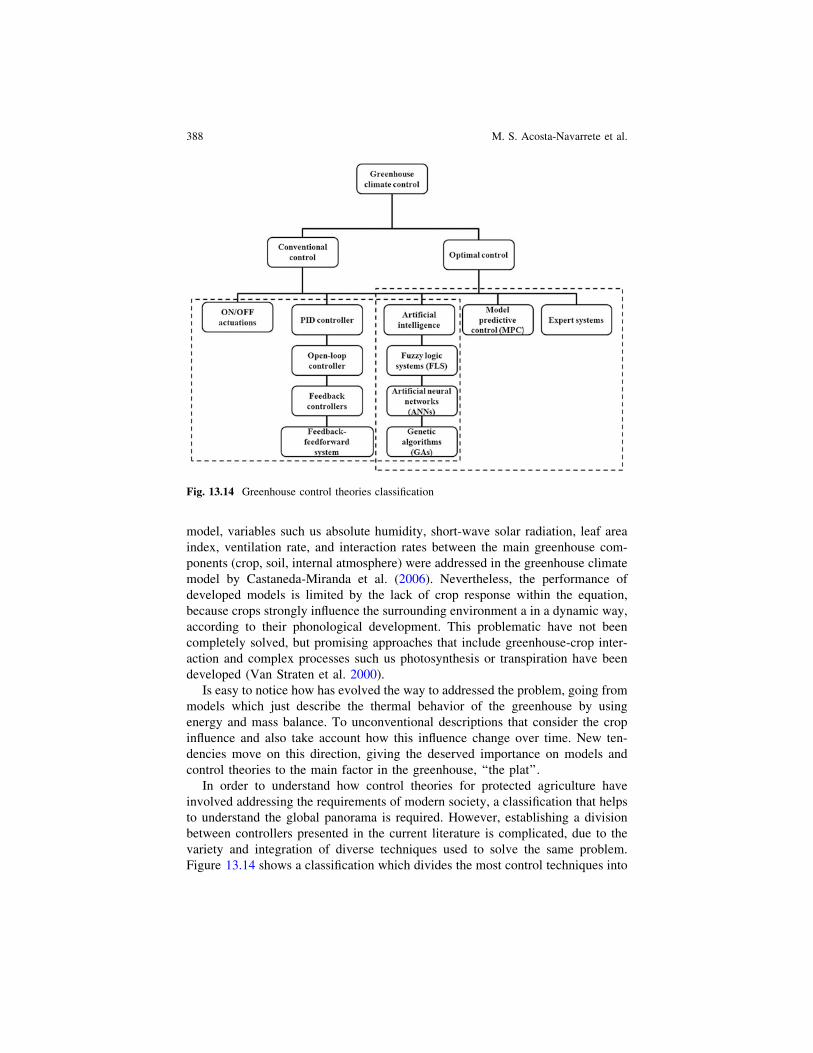
In order to understand how control theories for protected agriculture haveinvolved addressing the requirements of modern society, a classification that helpsto understand the global panorama is required. However, establishing a divisionbetween controllers presented in the current literature is complicated, due to thevariety and integration of diverse techniques used to solve the same problem.Figure 13.14 shows a classification which divides the most control techniques into
Fig. 13.14 Greenhouse control theories classification
388 M. S. Acosta-Navarrete et al.

two main fields (Duarte-Galvan et al. 2012). The first one is usually calledconventional control which consists on climate controllers which try to control thegreenhouse microclimate just by reducing the deviation between setpoint of theinterest variables and measured values to zero. As examples of conventionalcontrollers are ON/OFF, PID, other classical controllers and also artificial intel-ligent (AI) paradigms such as artificial neural networks (ANNs), fuzzy logicsystems (FLS), genetic algorithms (GAs), among others. The other field is optimalcontrol, in which factors such as greenhouse dynamic behavior, actuator capa-bilities, water and energy consumption and meanly the crop response are takeninto account. Expert systems and model predictive control (MPC) are widelyaccepted for optimal control purposes. However, aforementioned AI-based tech-niques can be also considered like optimal production controllers when theyreached objectives such us optimal crop growth, reduction of the associate costs,reduction of residues and the improvement of energy and water use efficiency(Ramírez-Arias et al. 2012).
Conventional controllers were widely used since computational tools wereintroduced in protected agriculture until the end of twentieth century. Neverthe-less, the increase in power computational capabilities with cost reductions in thenext decade allowed the application of more complex algorithms which deals withthe optimal control scheme. In the rest of this chapter, the review of protectedagriculture techniques will be focus on optimal control taking into considerationboth modeling and controllers.
13.11.3 Optimal Control
The objective of modern greenhouse industry is a sustainable crop productionsystem by reducing water and energy consumption and biocide use while main-taining a high crop quality and yield. In addition to new materials and advancebuilding methodologies, this can be achieved by modifying the microclimatecontrol strategy. However, the optimal control scheme is only slowly accepted inpractice due to the lack of reliable crop development models for the wide varietyof crops. Also, experimental probes that show advantages and clear assessment ofthe risks involved and the theoretical limitation is required. In order to effectivelyvalidate the performance of proposed optimal control algorithms, greenhousemodels which include parameters related with crop response are required.
13.11.4 Modeling
A good dynamic model of the process is essential in order to achieve a goodperformance of the controller. Two different methods for computing greenhousemodels can be found in the literature. One is based in terms of the physical laws
13 Instrumentation and Control to Improve the Crop Yield 389

involved in the process, and the other is based on an analysis of the input–outputdata of the process. In the first method, the process behavior is incompletelyknown, and physical modeling is not easy considering the complexity of thesystem that translates high order models with lot of parameters which are difficultto adjust due to the nonlinear behavior of the greenhouse model (Herrero et al.2008). The second method consists in approximate the behavior without a prioriinformation, for instance, polynomial fitting, ANNs, FLS, etc. However, they donot have physical meaning but are easier to obtain.
How was previously mentioned, modeling by physic laws is complicatedbecause in order to achieve a reliable model, lot of parameters have to be includedin the model. But, it has proved that physic-laws models had a better goodness-of-fitthat black-box models (Blasco et al. 2007). However, adjusting these parameters iscomplicated. An alternative was purposed by Guzmán-Cruz et al. (2009), whichused and compared different evolutionary algorithms (EA) such as GAs, Evolu-tionary Strategies (ES) and Evolutionary Programming (EP) to calibrate theparameters that defines the greenhouse inside temperature and relative humiditywithin a greenhouse with tomato crop. The calibration consisted in an optimizationproblem which works altering model parameters until getting a better fit betweenestimated and measured data. Results show a better performance of EP to predictthe air temperature and RH behavior; however, least squares (LSQ) and sequentialquadratic programming (SQP) methods slightly improve the estimation of tem-perature, but present lot of inaccuracy for RH. This assertion is supported by(Speetjens et al. 2010), which also indentified the key parameters of a physic-basedmodel using a controlled random search (CRS). The model is composed by alimited number of states, which keep the computational load in an acceptable level.This model enhances practical applicability for in situ purposes.
However, in all aforementioned works, important sets of data are required.Measurements in the greenhouse during 2 years or more were necessary to cali-brate the models; otherwise the risk to get trapped in a local minimum is highlyprobable. Other problematic relies in controlling greenhouses are stronglydependent on the geographical area; and solution that are valid in some regionsmust be adapted in order to fit others (Herrero et al. 2007). This problematic waspartially solved developing a reduced thermal and mass (water vapor) model of thegreenhouse by an on-line estimation of its parameters. This estimation was carryout using the particle swarm optimization (PSO), which present a better perfor-mance than GAs in some cases (Coelho et al. 2005; Hasni et al. 2011). Also,several advantages were reached, such as energy savings, soft optimal controleffort a low computational burden (El Ghoumari et al. 2005). Automatic, on-linedestimation and adaptation of parameters in physic-based models were proposed bySpeetjens et al. (2009) using Extended Kalman Filtering (EKF). This techniquecould deal with changing circumstances like plant growth, changes in materialproperties and modification in greenhouse design and layout. Then, EKF improvesthe model fit over a longer period. After tuning of the filter, the parameters wereautomatically adapted, so that changes in system were dealt with. The unique
390 M. S. Acosta-Navarrete et al.
restriction of this technique is that the number of parameters to be estimated has tobe not to large compared with available measurement data.
All the aforementioned models deal with the nonlinearities of the greenhousesystem by using unconventional techniques to adjust the parameters of the model.However, many researches choose linear model techniques, attempting to for-mulate an easier model, easily programmable in current greenhouse climatecontrollers. This choice deals with many problems, taking into considerationseveral restrictions have prove to work properly (Singh et al. 2006).
Many parametric models have been proposed, they usually are polynomialequations which involve the main variables of phenomena (temperature, humidity,among others) and many coefficients which are obtained by different identificationmethods. The well-known off-line least squares method was used by Bennis et al.(2008), input–output signals sampled every minute during a day were used to buildthe model. The model also involves perturbation such as external humidity andtemperature, radiation, and wind speed. Previous works opt for on-line identifi-cation, arguing that changing the operation conditions in the greenhouse requiresre-tuning of the controller parameters in order to achieve optimum performance.However, fewer variables are taking into account in this methodology because thecomputational power required increases according with the number of variables toestimate (Arvanitis et al. 2000).
Despite the favorable results obtained by the aforementioned models, manyauthors argue that a more detailed knowledge about phenomena is required inorder to increase the performance of controller and thus to meet objectives ofmodern agriculture (Katsoulas et al. 2007). Some works deal the problem of modelplant behavior and it influence on the greenhouse microclimate. These behaviorscould be related with plant growth, transpiration, or photosynthesis (Boulard andWang 2000).
Other works focus in order to understand de ventilation phenomena inside thegreenhouse by models with consider the heterogeneity of the system and how thedifferent segments of the atmosphere interact with plan canopy or external envi-ronment (Abdel-Ghany and Al-Helal 2011; Dayan et al. 2004). Computationalfluid dynamics (CFD) also serves to study ventilation, its effects on inside tem-perature and humidity, and how it is affected by external wind direction (Bournetand Boulard 2010; Kittas and Bartzanas 2007). Experimental work focused inunderstanding how the ventilation rate modifies the physiological state of the planwas conducted. Finally based on these studies, different methodologies werepurposed to design the greenhouse geometry, the correct orientation, and even therequired equipment in order to achieve a desirable yield and quality (Nebbali et al.2012; Vanthoor et al. 2011). Also, software which use all the aforementionedmodels were developed in order to provide a tool that could predict the greenhousebehavior under certain weather characteristics previously its installation, equip-ment available, and greenhouse materials could also be included in this web-baseapplication (Fitz-Rodríguez et al. 2010).
13 Instrumentation and Control to Improve the Crop Yield 391

13.11.5 Controllers
The advantages of using optimal instead of conventional greenhouse climatecontrol can be summarized as follows. An optimal control approach to greenhouseclimate control fully exploits scientific quantitative knowledge concerning thegreenhouse atmosphere, the soil, the equipment, the crop, and their interactions.All of them captured in a mathematical dynamic model that deals with the problemof maximizing the profit, achieving welfare of the crop through practices thatminimizes production costs (Van Straten et al. 2010).
Robust controllers were applied in protected agriculture because its ability todeal with uncertain parameters, disturbances, or modeling mistakes (Linker et al.2011). They were applied focusing on managing the high correlation between airtemperature and hygrometry (Bennis et al. 2008). This decoupling allows the useof two control loops, one for each variable. Despite the modeling uncertainties andstrong disturbances, the controller presented an acceptable performance.
Horticultural research has indicated that for the majority of plants, crop growthresponds to long-term average temperatures rather than specific day and nighttemperature profiles. This principle is used in the well-known temperature inte-gration technique (TI). Where is possible to adjust the setpoint temperature in aflexible way to obtain a desired average temperature instead at fixed value over thetime. Therefore, energy savings could be obtained decreasing flexibility to theheating set points when conditions are favorable and lowering it when they are not.This knowledge was applied by Sigrimis et al. (2000) in the design of a toolavailable to exploit the interaction between photosynthesis and growth accordingto empiric knowledge. The method is based on varying heating set points usingpreviously recorded information in order to achieve the desired average for anyuser-defined period. Meanwhile, (Körner and Challa 2003) decoupled process withfast temperature response (e.g., photosynthesis or stress) from a process with aslow response time. The objective was to improve the temperature integrationconcept by introducing dynamic temperature constrains; these flexible boundariesdepend on the underlying crop process while increasing the potential for energysaving in greenhouses. Despite the promising energy savings obtained with tem-perature integration, the potential of this technique is limited by humidity if usualset points are maintained, because the high relation between those variablescounteracts the TI. A promising solution is the use of a process-based humidityregimen. In this regimen, relative humidity set points can freely move within arange, avoiding affect the TI objectives. However, as humidity changes couldhighly affect the crop quality and yield, the set points its duration period werecalculated in order to avoid plant-affecting processes such as Ca-deficiency, plantwater stress, crop growth, crop development and airborne fungal diseases (Körnerand Challa 2004).
Another way to improved TI in cold lands was addressed by (Aaslyng et al.2003), which used mathematical models for estimating the absorption of irradi-ance, leaf photosynthesis and respiration. Then, the temperature which was
392 M. S. Acosta-Navarrete et al.

controlled according to natural irradiance was allowed to vary more than usual.When light conditions were no appropriate for crop development, heating energywas reduced. On the other hand, when irradiance rises, plants are able to utilizehigher temperatures and CO2 concentrations more efficiently. Applying this TImodified techniques; energy saving per season between 20 and 38 % wereachieved.
MPC is an advanced control technique commonly used for industrial applica-tion but recently applied in the field of protected agriculture. The objective ispredicting the greenhouse variables behavior. A contribution to this scheme wasoffered by Van Straten et al. (2000), where information about crop growth sim-plifies the design of greenhouse control strategies to obtain a truly economicalcontrol strategy. This approach leads to the concept of selecting processes by timeresponse where the short-term effects like photosynthesis and evapotranspirationare dealt with by an automated model predictive optimal controller, while thelong-term effects are left to the grower. Energy savings are also achieving with thismethodology, but in comparison with TI which offers flexible set points, thepredictions of MPC allow the use of a soft optimal control effort (Piñón et al.2005). Another important characteristic of MPC is its multivariable constrainthandling capacity and the ability to set cost for each prediction. These charac-teristics were exploited including restrictions to energy and water consumption.For example, error and control signals are weighted differently during the day andthe night, the errors weights are much higher during the day that at night and theconstrains are relaxed during the night (Blasco et al. 2007).
As was previously mentioned, the grower intervention had not been completelyavoided in the cropmanagement. Then, decision support tools that assists the growerto choose the most appropriate climate regimen was proposed (Gupta et al. 2010).These regimens choose the most appropriate climate for plants according with itsphonologic state in order to obtain the optimal gains of sustainability and plantquality. The greenhouse climate and crop model are studied separately and jointlyconsidering the effects of six different regimes with increasing degrees of freedomfor various climate variables which include: crop model, temperature integration,dynamic humidity control, and negative DIF regimes (DIF¼ the difference betweenaverage day temperature and average night temperature, and therefore reduces theuse of chemical growth regulators) (Körner and Van Straten 2008).
Phytocontrol is the new theory which proposes the use of the plant physio-logical responses as input signal to establish the set points in the climate controller(Ton et al. 2001). Also, this has not proved to be a stable and reliable method,because it is necessary to gather a lot of information to prove the reliability of thistheory (Linker and Seginer 2003). Nevertheless, different types of controllers haveemerged demonstrating advantages and disadvantages between them, better per-formance for some actions among other characteristics.
13 Instrumentation and Control to Improve the Crop Yield 393

References
Aaslyng JM, Lund JB, Ehler N, Rosenqvist E (2003) IntelliGrow: a greenhouse component-basedclimate control system. Environ Model Softw 18:657–666
Abdel-Ghany AM, Al-Helal IM (2011) Solar energy utilization by a greenhouse: generalrelations. Renew Energy 36:189–196
Acosta-Navarrete MS (2003) Efectos de la variedad de trigo, alfa amilasa y gluten vital para elproceso de panificación en la Molinera de México S.A de C.V. Dissertation, InstitutoTecnológico de Celaya
Agrosintesis (2013) Panorama del trigo en mexico. Available via Agrosintesis. http://www.agrosintesis.com/component/content/article/49-front-page/408-panorama-del-trigo-en-mexico.Accessed 6 Sep 2013
Allen SJ, Grime VL (1995) Measurements of transpiration from savannah shrubs using sap flowgauges. Agric For Meteorol 75:23–41
An-zhen Q, Gao-Bao H, Qiang C et al (2013) Grain yield and soil respiratory response tointercropping systems on arid land. Field Crops Res 144:1–10
Arvanitis K, Paraskevopoulos P, Vernardos A (2000) Multirate adaptive temperature control ofgreenhouses. Comput Electron Agric 26:303–320
Bailey CH (1940) Respiration of cereal grains and flaxseed. Plant Physiol 15:257–274Baker NR, Rosenqvist E (2004) Applications of chlorophyll fluorescence can improve crop
production strategies: an examination of future possibilities. J Exp Bot 55(403):1607–1621Baker JM, van Bavel CHM (1987) Measurement of mass flow of water in the stems of herbaceous
plants. Plant Cell Environ 10:777–782Bakker JC, Bot GPA, Challa H, Braak NJ (2001) Greenhouse climate control: An integrated
approach, 1st edn. Wageningen Academic Publishers, Wageningen, The NetherlandsBaptista P, Cunha TR, Gama C et al (2012) A new and practical method to obtain grain size
measurements in sandy shores based on digital image acquisition and processing. Sed Geol282:294–306
Bassow SL, Bazzaz FA (1998) How environmental conditions affect canopy leaf-levelphotosynthesis in four deciduous tree species. Ecology 79(8):2660–2675
Belyaeva N, Schmitt F-J, Paschenko V, Riznichenko GY, Rubin A, Renger G (2011) PS II modelbased analysis of transient fluorescence yield measured on whole leaves of Arabidopsisthaliana after excitation with light flashes of different energies. Bio Systems 103(2):188–195
Bennis N, Duplaix J, Enéa G, Haloua M, Youlal H (2008) Greenhouse climate modelling androbust control. Comput Electron Agric 61:96–107
Berger A, Selles G (1993) Diurnal fruit shrinkage: a model. In: Borghetti M, Grace J, Raschi A(eds) Water transport in plants under climatic stress. Cambridge University Press, Cambridge,pp 261–267
Blasco X, Martínez M, Herrero J, Ramos C, Sanchis J (2007) Model-based predictive control ofgreenhouse climate for reducing energy and water consumption. Comput Electron Agric55:49–70
Bodroza-Solarov M, Kljaji P, Andri G et al (2012) Quality parameters of wheat grain and flour asinfluenced by treatments with natural zeolite and diatomaceous earth formulations, graininfestation status and endosperm vitreousness. J Stored Prod Res 51:61–68
Bonet L, Ferrer P, Castel JR et al (2010) Soil capacitance sensors and stem dendrometers. Usefultools for irrigation scheduling of commercial orchards? Span J Agric Res 8(S2):S52–S65
Boulard T, Wang S (2000) Greenhouse crop transpiration simulation from external climateconditions. Agric Meteorol 100:25–34
Bournet P-E, Boulard T (2010) Effect of ventilator configuration on the distributed climate ofgreenhouses: a review of experimental and CFD studies. Comput Electron Agric 74:195–217
Brosnan T, Da-Wen S (2002) Inspection and grading of agricultural and food products bycomputer visión systems-a review. Comput Electron Agric 36:193–213
394 M. S. Acosta-Navarrete et al.

Burgess SO, Adams MA, Turner NC et al (2001) An improved heat pulse method to measure lowand reverse rates of sap flow in woody plants. Tree Physiol 21:589–598
Bürling K, Hunsche M, Noga G (2011) Use of blue–green and chlorophyll fluorescencemeasurements for differentiation between nitrogen deficiency and pathogen infection inwinter wheat. J Plant Physiol 168(14):1641–1648
Castaneda-Miranda R, Ventura-Ramos E, del Rocío Peniche-Vera R, Herrera-Ruiz G (2006)Fuzzy greenhouse climate control system based on a field programmable gate array. BiosystEng 94:165–177
Cheng L, Fuchigami LH, Breen PJ (2000) Light absorption and partitioning in relation to nitrogencontent in Fuji’ apple leaves. J Am Soc Hortic Sci 125(5):581–587
Coelho J, de Moura Oliveira P, Cunha JB (2005) Greenhouse air temperature predictive controlusing the particle swarm optimisation algorithm. Comput Electron Agric 49:330–344
Contreras-Medina LM, Osornio-Rios RA, Torres-Pacheco I, Romero-Troncoso RJ, Guevara-Gonzalez RG, Millan-Almaraz JR et al (2012) Smart sensor for real-time quantification ofcommon symptoms present in unhealthy plants. Sensors 12:784–805
Cortina-Januchs MG, Quintanilla-Dominguez J, Vega-Corona A, Tarquis Ana M, Andina D et al(2011) Detection of pore space in CT soil images using artificial neural networks. Modelingsoil system: complexity under your feet. Biogeosciences 8:279–288
Critten DL, Bailey BJ (2002) A review of greenhouse engineering developments during the1990s. Agric Meteorol 112:1–22
David TS, Pinto CA, Nadezhdina N (2013) Root functioning, tree water use and hydraulicredistribution in Quercus suber trees: A modeling approach based on root sap flow. For EcolManage 307:136–146
Davies ER (2009) The application of machine vision to food and agriculture: a review. ImagingSci J 57:197–217
Davis TW, Kuo C-M, Liang X (2012) Sap flow sensors: construction, quality control andcomparison. Sensors 12:954–971
Dayan J, Dayan E, Strassberg Y, Presnov E (2004) Simulation and control of ventilation rates ingreenhouses. Math Comput Simul 65:3–17
Dongena JT, Guptaa KJ, Ramírez-Aguilara SJ et al (2011) Regulation of respiration in plants: arole for alternative metabolic pathways. J Plant Physiol 168(2011):1434–1443
Duarte-Galvan C et al (2012) Review. Advantages and disadvantages of control theories appliedin greenhouse climate control systems. Spanish J Agric Res 10:926–938
El Ghoumari M, Tantau H-J, Serrano J (2005) Non-linear constrained MPC: real-timeimplementation of greenhouse air temperature control. Comput Electron Agric 49:345–356
Falkowski PG, Wyman K, Ley AC, Mauzerall DC (1986) Relationship of steady-statephotosynthesis to fluorescence in eucaryotic algae. Biochimica et Biophysica Acta (BBA)-Bioenergetics 849(2):183–192
Faraloni C, Cutino I, Petruccelli R, Leva A, Lazzeri S, Torzillo G (2011) Chlorophyllfluorescence technique as a rapid tool for in vitro screening of olive cultivars (Olea europaeaL.) tolerant to drought stress. Environ Exp Bot 73:49–56
Fedack V, Kytaev O, Klochan P, Romanov V, Voytovych I (2005) Portable chronofluoro meterfor express-diagnostics of photosynthesis. In: Intelligent data acquisition and advancedcomputing systems: technology and applications 2005 (IDAACS 2005). IEEE 2005. IEEE,pp 287–288
Fernandez-Jaramillo AA, Duarte-Galvan C, Contreras-Medina LM, Torres-Pacheco I, RDJRomero-Troncoso, Guevara-Gonzalez RG, Millan-Almaraz JR (2012) Instrumentation indeveloping chlorophyll fluorescence biosensing: a review. Sensors 12(9):11853–11869
Fitz-Rodríguez E et al (2010) Dynamic modeling and simulation of greenhouse environmentsunder several scenarios: a web-based application. Comput Electron Agric 70:105–116
Food and Agriculture Organization of the United Nations, Hunger portal (2013). http://www.fao.org/hunger/en/. Accesed 8 Sep 2013
13 Instrumentation and Control to Improve the Crop Yield 395

García-Mier L, Guevara-González RG, Mondragón-Olguín VM, del Rocío Verduzco-Cuellar B,Torres-Pacheco I (2013) Agriculture and bioactives: achieving both crop yield andphytochemicals. Int J Mol Sci 14:4203–4222
Garnier E, Berger A (1986) Effect of water stress on stem diameter changes of peach treesgrowing in the field. J Appl Ecol 23:193–209
Gomes JFS, Leta FR (2012) Applications of computer vision techniques in the agriculture andfood industry: a review. Eur Food Res Technol 235:989–1000
Gómez-Alonso S, Desamparados SM et al (2002) Phenolic compounds profile of Cornicabravirgin olive oil. J Agric Food Chem 50(23):6812–6817
Gorbunov MY, Falkowski PG (2004) Fluorescence induction and relaxation (FIRe) technique andinstrumentation for monitoring photosynthetic processes and primary production in aquaticecosystems. In: Photosynthesis: fundamental aspects to global perspectives—proceedings of13th international congress of photosynthesis, Montreal. pp 1029–1031
González RC, Woods RE (2008) Digital Image Processing, 3rd edn. Pearson Education, UpperSaddle River, New Jersey
Granier A (1985) Une nouvelle method pour la mesure du flux de sève brute dans le tronc desarbres. Ann Sci For Res 42:81–88
Granier A (1987) Evaluation of transpiration in a Douglas-fir stand by means of sap flowmeasurements. Tree Physiol 3:309–320
Gupta MK, Samuel DVK, Sirohi NPS (2010) Decision support system for greenhouse seedlingproduction. Comput Electron Agric 73:133–145
Guzmán-Cruz R et al (2009) Calibration of a greenhouse climate model using evolutionaryalgorithms. Biosyst Eng 104:135–142
Haigen H, Lihong X, Bingkun Z, Yuming L (2010) A compatible control algorithm forgreenhouse climate control based on MOCC strategy. In: 3rd IEEE international conferenceon computer science and information technology (ICCSIT), pp 63–67
Hanstein S, De Beer D, Felle HH (2001) Miniaturised carbon dioxide sensor for measurementswithin plant leaves. Sens Actuators B 81:107–114
Hasni A, Taibi R, Draoui B, Boulard T (2011) Optimization of greenhouse climate modelparameters using particle Swarm optimization and genetic algorithms. Energy Procedia6:371–380
Hawkesford MJ, Araus JL et al (2013) Prospects of doubling global wheat yields. Food EnergySecur 2(1):34–48
Herrero JM, Blasco X, Martínez M, Ramos C, Sanchis J (2007) Non-linear robust identificationof a greenhouse model using multi-objective evolutionary algorithms. Biosyst Eng98:335–346
Herrero JM, Blasco X, Martínez M, Ramos C, Sanchis J (2008) Robust identification of non-linear greenhouse model using evolutionary algorithms. Control Eng Pract 16:515–530
Herzog KM (1995) Diurnal changes in the radius of a subalpine Norway spruce stem: theirrelation to the sap flow and their use to estimate transpiration. Trees 10:94–101
Hill DW, Powell T (1968) Non-dispersive infrared gas analysis in science, medicine and industry.Adam Hilger Ltd, London
Huang H, Mary-Grace CD, Rausch KD et al (2013a) Diffusion and production of carbon dioxidein bulk corn at various temperatures and moisture contents. J Stored Prod Res 55:21–26
Huang M, Wana X, Zhang M et al (2013b) Detection of insect-damaged vegetable soybeansusing hyperspectral transmittance image. J Food Eng 116:45–49
Hunsche M, Bürling K, Noga G (2011) Spectral and time-resolved fluorescence signature of fourweed species as affected by selected herbicides. Pestic Biochem Physiol 101(1):39–47
Hunt S (2003) Measurements of photosynthesis and respiration in plants. Physiol Plant117:314–325
Jackman P, Sun D (2013) Recent advances in image processing using image texture features forfood quality assessment. Trends Food Sci Tech 29:35–43
Ji JW, Xu MH, Li ZM (2010) Research and application on chlorophyll fluorescence on-linemonitoring technology. Adv Mater Res 139:2550–2555
396 M. S. Acosta-Navarrete et al.

Johnson X, Vandystadt G, Bujaldon S, Wollman F-A, Dubois R, Roussel P, Alric J, Béal D(2009) A new setup for in vivo fluorescence imaging of photosynthetic activity. PhotosynthRes 102(1):85–93
Jones HG (1999) Use of thermography for quantitative studies of spatial and temporal of stomatalconductance over leaf surfaces. Plant Cell Environ 22:1043–1055
Jones HG, Stoll M, Santos T, de Souse C, Chaves MM, Grant OM et al (2002) Use of infraredthermography for monitoring stomatal closure in the field: application to grepevine. J Exp Bot53:2249–2260
Kalua CM, Allen MS, Bedgood DR et al (2005) Discrimination of olive oils and fruits intocultivars and maturity stages based on phenolic and volatile compounds. J Agric Food Chem53:8054–8062
Katsoulas N, Baille A, Kittas C (2007) Leaf boundary layer conductance in ventilatedgreenhouses: an experimental approach. Agric For Meteorol 144:180–192
Kautsky H, Hirsch A (1931) Neue versuche zur kohlensäureassimilation. Naturwissenschaften19(48):964–964
Kissinger J, Wilson D (2011) Portable fluorescence lifetime detection for chlorophyll analysis inmarine environments. IEEE Sens J 11(2):288–295
Kitaya Y, Tsuruyama J, Kawai M, Shibuya T, Kiyota M (2000) Effects of air current ontranspiration and net photosynthetic rates of plants in a closed plant production system.Transplant production in the 21st Century. Kluwer Academic Publishers, Boston
Kittas C, Bartzanas T (2007) Greenhouse microclimate and dehumidification effectiveness underdifferent ventilator configurations. Build Environ 42:3774–3784
Kolber Z, Falkowski P (1995) Fast repetition rate (FRR) fluorometer and method for measuringfluorescence and photosynthetic parameters. Google Patents
Kolber Z, Klimov D, Ananyev G, Rascher U, Berry J, Osmond B (2005) Measuringphotosynthetic parameters at a distance: laser induced fluorescence transient (LIFT) methodfor remote measurements of photosynthesis in terrestrial vegetation. Photosynth Res84(1–3):121–129
Kolokotsa D, Saridakis G, Dalamagkidis K, Dolianitis S, Kaliakatsos I (2010) Development of anintelligent indoor environment and energy management system for greenhouses. EnergyConvers Manage 51:155–168
Körner O, Challa H (2003) Design for an improved temperature integration concept ingreenhouse cultivation. Comput Electron Agric 39:39–59
Körner O, Challa H (2004) Temperature integration and process-based humidity control inchrysanthemum. Comput Electron Agric 43:1–21
Körner O, Van Straten G (2008) Decision support for dynamic greenhouse climate controlstrategies. Comput Electron Agric 60:18–30
Korpela M, Makinen H, Nojd P et al (2010) Automatic detection of onset and cessation of treestem radius increase using dendrometer data. Neurocomputing 73:2039–2046
Lichtenthaler H, Buschmann C, Knapp M (2005) How to correctly determine the differentchlorophyll fluorescence parameters and the chlorophyll fluorescence decrease ratio RFd ofleaves with the PAM fluorometer. Photosynthetica 43(3):379–393
Lichtenthaler HK, Langsdorf G, Buschmann C (2013) Uptake of diuron and concomitant loss ofphotosynthetic activity in leaves as visualized by imaging the red chlorophyll fluorescence.Photosynth Res:1–7
Lin Z-F, Liu N, Lin G-Z, Pan X-P, Peng C-L (2007) Stress-induced alteration of chlorophyllfluorescence polarization and spectrum in leaves of Alocasia macrorrhiza L Schott. J Fluoresc17(6):663–669
Linker R, Seginer I (2003) Water stress detection in a greenhouse by a step change of ventilation.Biosyst Eng 84:79–89
Linker R, Kacira M, Arbel A (2011) Robust climate control of a greenhouse equipped withvariable-speed fans and a variable-pressure fogging system. Biosyst Eng 110:153–167
13 Instrumentation and Control to Improve the Crop Yield 397

Long SP, Bernacchi CJ (2003) Gas exchange measurements, what can they tell us about theunderlying limitations to photosynthesis? Procedures and sources of error. J Exp Bot54(392):2393–2401
López SJ, Nieto AR, Barrientos PAF, Rodríguez PE. Colinas MT, Borys MW, González AF et al(2008) Selección de variables morfológicas para la caracterización del tejocote (Crataegusspp). Rev Chapingo Ser Hortic 14(2):97–111
Marshall DC (1958) Measurement of sap flow in conifers by heat transport. Plant Physiol33:385–396
Marschner H (1995) Mineral Nutrition of Higher Plants, 2nd edn. Academic Press: San Diego,CA, USA
Massacci A, Jones HG (1990) Use of simultaneous analysis of gas-exchange and chlorophyllfluorescence quenching for analysing the effects of water stress on photosynthesis in appleleaves. Trees 4(1):1–8
Millan-Almaraz JR, Guevara-Gonzalez RG, Romero-Troncoso RJ et al (2009) Advantages anddisadvantages on photosynthesis measurement techniques: a review. Afr J Biotechnol8(25):7340–7349
Millan-Almaraz JR, Romero-Troncoso RJ, Guevara-Gonzalez RG et al (2010) FPGA-based fusedsmart sensor for real-time plant-transpiration dynamic estimation. Sensors 10:8316–8331
Millan-Almaraz JR, Torres-Pacheco I, Duarte-Galvan C et al (2013) FPGA-based wireless smartsensor for real-time photosynthesis monitoring. Comput Electron Agric 95:58–69
Montoro A, Fereres E, López-Urrea R et al (2012) Sensitivity of trunk diameter fluctuations invitis vinifera L. Tempranillo and cabernet sauvignon cultivars. Am J Enol Vitic 63:1
Morandi B, Manfrini L, Zibordi M et al (2007) A low-cost device for accurate and continuousmeasurements of fruit diameter. HortScience 42(6):1380–1382
Muñoz-Huerta RF, Guevara-Gonzalez RG, Contreras-Medina LM, Torres-Pacheco I, Prado-Olivarez J, Ocampo-Velazquez RV (2013) A review of methods for sensing the Nitrogenstatus in plants: advantages disadvantages and recent advances. Sensors 13(8):10823–10843
Nebbali R, Roy JC, Boulard T (2012) Dynamic simulation of the distributed radiative andconvective climate within a cropped greenhouse. Renew Energy 43:111–129
Neethirajan S, Karunakaran C, Jayas DS, White NDG et al (2007) Detection techniques for storedproduct insects in grain. Food Control 18:157–162
Netto AT, Campostrini E, Oliveira JGD, Bressan-Smith RE et al (2005) Photosynthetic pigmentsnitrogen, chlophyll a fluorescence and SPAD-502 readings in coffee leaves. Sci Hort104:199–209
Ojeda-Magaña B, Ruelas R, Quintanilla-Dominguez J, Andina D (2010) Color imagesegmentation by partitional clustering algorithms. In: 36th annual conference of the IEEEindustrial electronics society IECON 2010, pp 2828–2833
Oliveira PM, Zannini E, Arendt EK et al (2013) Cereal fungal infection, mycotoxins, and lacticacid bacteria mediated bioprotection: from crop farming to cereal products. J Food Microbiol33(1):1–18
Ortuño MF, Conejero W, Moreno F et al (2010) Could trunk diameter sensors be used in woodycrops for irrigation scheduling? A review of current knowledge and future perspectives. AgricWater Manag 97:1–11
Peregrina-Barreto H, Terol-Villalobos IR, Rangel-Magdaleno JJ et al (2013) Automatic grain sizedetermination in microstructures using image processing. Measurement 46:249–258
Petra Hogy P, Fangmeier A (2008) Effects of elevated atmospheric CO2 on grain quality ofwheat. J Cereal Sci 48:580–591
Piñón S, Camacho E, Kuchen B, Peña M (2005) Constrained predictive control of a greenhouse.Comput Electron Agric 49:317–329
Pons TL, Welschen RAM (2002) Overestimation of respiration rates in commercially availablelamp-on leaf chambers. Complications with measurement of net photosynthesis. Plant CellEnviron 25:1367–1372
Ramírez G (1984) Almacenamiento y conservación de granos y semillas, 10th edn. CIA. EditorialContinental S.A de C.V, México
398 M. S. Acosta-Navarrete et al.

Ramírez-Arias A, Rodríguez F, Guzmán JL, Berenguel M (2012) Multiobjective hierarchicalcontrol architecture for greenhouse crop growth. Automatica 48:490–498
Röttgers R (2007) Comparison of different variable chlorophyll\ i[ a\/i[fluorescencetechniques to determine photosynthetic parameters of natural phytoplankton. Deep Sea ResPart I 54(3):437–451
Sakurtani TA (1981) Heat balance method for measuring water flux in the stem of intact plants.J Agric Meteorol 37:9–17
Schächtl J, Huber G, Maidl F-X, Sticksel E, Schulz J, Haschberger P (2005) Laser-inducedchlorophyll fluorescence measurements for detecting the nitrogen status of wheat (Triticumaestivum L.) canopies. Precision Agric 6(2):143–156
Schulze ED (1972) A new type of climatized gas exchange chamber for net photosynthesis andtranspiration measurements in the field. Oecologia 10(3):243–251
Setiawan A, Albright LD, Phelan RM (2000) Application of pseudo-derivative-feedbackalgorithm in greenhouse air temperature control. Comput Electron Agric 26:283–302
Sigrimis N, King RE (2000) Advances in greenhouse environment control. Comput ElectronAgric 26:217–219
Sigrimis N, Anastasiou A, Rerras N (2000) Energy saving in greenhouses using temperatureintegration: a simulation survey. Comput Electron Agric 26:321–341
Singh G, Singh PP, Lubana PPS, Singh KG (2006) Formulation and validation of a mathematicalmodel of the microclimate of a greenhouse. Renew Energy 31:1541–1560
Sokhansanj S, Lang W et al (1996) Prediction of kernel and bulk volume of wheat and canoladuring adsortion and desorption. J Agric Eng Res 63:129–136
Speetjens SL, Stigter JD, van Straten G (2009) Towards an adaptive model for greenhousecontrol. Comput Electron Agric 67:1–8
Speetjens SL, Stigter JD, van Straten G (2010) Physics-based model for a water-savinggreenhouse. Biosyst Eng 105:149–159
Stirbet A (2011) On the relation between the Kautsky effect (chlorophyll\ i[ a\/i[fluo-rescence induction) and photosystem II: basics and applications of the OJIP fluorescencetransient. J Photochem Photobiol B Biol 104(1):236–257
Stout MJ, Fidantsef AL, Duffey SS, Bostock RM (1999) Signal interactions in pathogen andinsect attack: systemic plant mediated interactions between pathogens and hervibores of thetomato lycopersicon esculentum. Physiol Mol Plant Pathol 54:115–130.
Suggett DJ, Moore CM, Oxborough K, Geider RJ (2000) Fast repetition rate (FRR) chlorophyll afluorescence induction measurements. CTG. http://www.chelsea.co.uk/Technical%20Papers/FRRFmethodsManualpdf
Swanson RH, Whitfield DWA (1981) A numerical-analysis of heat pulse velocity theory andpractice. J Exp Bot 32:221–239
Taiz L, Zeiger E (2006) Plant physiology, 5th edn. Sinauer Associates Inc, SunderlandTakahashi M, Ishiji T, Kawashima N (2001) Hand made oxygen and carbon dioxide sensors for
monitoring the photosynthesis process as instruction material for science education. SensActuators B 77:237–243
Taub D (2010) Effects of rising atmospheric concentrations of carbon dioxide on plants. Nat EducKnowl 1(8):21
Thoren D, Schmidhalter U (2009) Nitrogen status and biomass determination of oilseed rape bylaser-induced chlorophyll fluorescence. Eur J Agron 30(3):238–242
Ton Y, Nilov N, Kopyt M (2001) Phytomonitoring: the new information technology forimproving crop production. Acta Hortic 562:257–262
Tovar MJ, Motilva MJ, Romero MP et al (2001) Changes in the phenolic composition of virginolive oil from young trees (Olea europaea L. cv. Arbequina) grown under linear irrigationstrategies. J Agric Food Chem 49(11):5502–5508
Uchida H, Akita S, Kumekawa N et al (2010) A hetero-core optical fiber dendrometer formeasurement of a Tree growing condition. In: International conference on control, automationand systems. KINTEX, Gyeonggi-do, 27–30 Oct 2010
13 Instrumentation and Control to Improve the Crop Yield 399
Van Gaalen KE, Flanagan LB, Peddle DR (2007) Photosynthesis, chlorophyll fluorescence andspectral reflectance in Sphagnum moss at varying water contents. Oecologia 153(1):19–28
Van Straten G, Challa H, Buwalda F (2000) Towards user accepted optimal control of greenhouseclimate. Comput Electron Agric 26:221–238
Van Straten G, Henten E van, Willigenburg L van, Ooteghem R van (2010) Optimal control ofgreenhouse cultivation. CRC Press, New York
Vanthoor B, Stanghellini C, Van Henten E, De Visser P (2011) A methodology for model-basedgreenhouse design: part 1, a greenhouse climate model for a broad range of designs andclimates. Biosyst Eng 110:363–377
Vinha AF, Ferreres F, Silva BM et al (2005) Phenolic profiles of Portuquese olive fruits (Oleaeuropaea L.): influences of cultivar and geographical origin. Food Chem 89:561–568
Quintanilla-Domínguez J et al (2009) Detection of Microcalcifications Using Coordinate LogicFilters and Artificial Neural Networks. In Bioinspired Applications in Artificial and NaturalComputation, LNCS, Vol. 5602. Springer, Heidelberg, pp 179–187
Quintanilla-Dominguez J, Ojeda-Magaña B, Cortina-Januchs MG, Ruelas R, Vega-Corona A,Andina D (2011) Image segmentation by fuzzy and possiblistic clustering algorithms foridentification of microcalcifications. Sci Iran 18(3): 580–589
400 M. S. Acosta-Navarrete et al.