bioprocessing to improve oat bread quality ... · foundation, the raisio research foundation, and...
TRANSCRIPT

•VIS
ION
S•SCIENCE•TEC
HN
OL
OG
Y•RESEARCHHIGHLI
GH
TS
Dissertation
8
Bioprocessing to improve oat bread qualityLaura Flander


VTT SCIENCE 8
Bioprocessing to improve oat bread quality
Laura Flander
Thesis for the degree of Doctor of Food Sciences to be presented with due permission for public examination and criticism in Lecture Hall LS 2 (Raisio Oyj:n Tutkimussäätiön Sali), B-building, Latokartanonkaari 7, at Faculty of Agriculture and Forestry, University of Helsinki, on the 17th August 2012, at 12 noon.

ISBN 978-951-38-7463-6 (soft back ed.) ISSN 2242-119X (soft back ed.)
ISBN 978-951-38-7464-3 (URL: http://www.vtt.fi/publications/index.jsp) ISSN 2242-1203 (URL: http://www.vtt.fi/publications/index.jsp)
Copyright © VTT 2012
JULKAISIJA – UTGIVARE – PUBLISHER
VTT PL 1000 (Tekniikantie 4 A, Espoo) 02044 VTT Puh. 020 722 111, faksi 020 722 7001
VTT PB 1000 (Teknikvägen 4 A, Esbo) FI-02044 VTT Tfn. +358 20 722 111, telefax +358 20 722 7001
VTT Technical Research Centre of Finland P.O. Box 1000 (Tekniikantie 4 A, Espoo) FI-02044 VTT, Finland Tel. +358 20 722 111, fax + 358 20 722 7001
Kopijyvä Oy, Kuopio 2012

3
Bioprocessing to improve oat bread quality
[Bioprosessointi kauraleivän laadun parantajana]. Laura Flander. Espoo 2012. VTT Science 8. 91 p. + app. 45 p.
Abstract The health-promoting properties of whole grain oat have made it a desirable ingredient for use in breads. However, the absence of gluten-forming proteins and high fibre content pose technological challenges with respect to product texture. Fundamental understanding about the role of oat components on the structure formation of dough and bread is needed to facilitate the development of new healthy variants of oat breads with consumer appealing properties.
A concept was created for using whole grain oat flour as a base in an oat-wheat bread with high -glucan content and good textural and sensory quality. Ingredient and process parameters for optimised texture and taste of the oat-wheat bread were established without extensive degradation of -glucan. The potential of bioprocessing methods, such as the use of sourdough and enzymes, to modify the chemical and rheological properties of oat doughs, and to improve the texture and flavour of oat breads were also investigated.
The maximal specific volume 3.6 (cm3/g), minimal instrumental hardness (0.1 kg after 2 h, and 0.3 kg after 72 h storage), and optimised sensory properties were attained for an oat-wheat bread by adding 15.2 g gluten and 91.5 g water/100 g flour to the dough, which was proofed at 40 °C for 75 min and baked at 210 °C. The optimized recipe and processing parameters provided the baking conditions for preparing an oat-wheat bread containing 51% oat by weight of flour mixture with good taste and structure as well as long shelf life.
The use of an optimized wheat sourdough process in the production of oat-wheat bread provided a feasible method of producing a new type of bread with high -glucan content. The optimal sourdough conditions for enhanced crumb texture and flavour of the bread were achieved by a small addition of wheat sourdough (10 g/100 g dough) which had been fermented at 40 °C for 20 hours. The use of optimized sourdough resulted in a bread with similar specific volume and staling rate as the corresponding straight dough bread.
The use of wheat sourdough did not affect the content or molecular weight of -glucan as compared to straight dough bread. The amount of -glucan in both
breads was 1.5±0.1 g/100 g fresh weight. This means that a portion (2 slices, á 34 g) of the bread contained 1.0 g -glucan, which is the amount required for a cholesterol-lowering health claim in the EU. The molecular weight of the -glucan was reduced from 1.0 million in the oat flour to 0.55 million in both breads, showing that a slight degradation of -glucan occurred during the bread-making phase. This was most likely due to the endogenous -glucanase activity present in the wheat flour.

The potential of cross-linking enzymes, such as laccase (LAC) and tyrosinase (TYR), to modify oat macropolymers during oat bread making was studied either alone or together with xylanase (XYL). TYR was more effective than LAC in improving the specific volume and reducing the firmnesss of the gluten-free oat bread, especially in combination with XYL. The degradation of arabinoxylan by XYL together with slight degradation of -glucan by -glucanase side activity in LAC preparation was suggested to improve the specific volume of whole grain oat, gluten-free oat, and oat-wheat breads, and the softness of fresh oat-wheat bread. The polymerization of oat globulins by TYR together with degradation of arabinoxylan by XYL was suggested to be the main contributors to improved volume and softness of gluten-free oat bread.
In conclusion, the flavour and texture of oat bread was found to be effectively modified with the sourdough and enzyme bioprocessing treatments employed. Sourdough improved the intensity of flavour without excess acidity or pungency. Wheat sourdough did not reduce the content or molecular weight of -glucan in oat-wheat bread. Use of LAC and XYL was most effective in improving the texture of oat-wheat bread. It was shown in this work that TYR efficiently cross-linked oat globulins, which was suggested to improve the textural properties of gluten-free oat bread.
Keywords oat, baking, -glucan, bread, sourdough, wheat, gluten-free, dough, tyrosinase, laccase, xylanase, protein, cross-linking

5
Bioprosessointi kauraleivän laadun parantajana
Bioprocessing to improve oat bread quality. Laura Flander. Espoo 2012. VTT Science 8. 91 s. + liitt. 45 s.
Tiivistelmä Täysjyväkauran terveyttä edistävät ominaisuudet ovat tehneet siitä houkuttelevan raaka-aineen leipomotuotteisiin. Kaura on kuitenkin haasteellinen leivonnan raaka-aine, koska se sisältää paljon kuitua eikä kauraproteiineilla ole vehnälle ominaista sitkonmuodostuskykyä hiivataikinassa. Tarvitaankin lisää tietoa kaurakomponenttien vaikutuksista taikinan ja leivän rakenteeseen, jotta voidaan paremmin muokata kauratuotteille haluttu rakenne ja maku, ilman että kauratuotteiden terveyttä edistävät ominaisuudet menetetään.
Tässä työssä kehitettiin täysjyväkaurajauhoa pääraaka-aineenaan sisältävä kaura-vehnäleipä, jolla on hyvät rakenne- ja makuominaisuudet sekä suuri b-glukaani-pitoisuus. Lisäksi tutkittiin kahden bioprosessointimenetelmän, raskituksen ja entsyymien, mahdollisuuksia muokata kaura-vehnä- tai täyskaurataikinoiden kemiallisia ja reologisia ominaisuuksia sekä parantaa kauraleivän rakennetta ja makua.
Ensin selvitettiin, mitkä ovat tärkeimmät raaka-aine- ja prosessimuuttujat kaura-vehnäleivän maun ja rakenteen optimoimiseksi, ilman että b-glukaani pilkkoutuisi liikaa leivontaprosessin aikana. Paras ominaistilavuus (3,6 cm3/g) ja pehmeys (0,1 kg 2 tunnin ja 0,3 kg 3 vuorokauden säilytyksen jälkeen) oli kaura-vehnäleivällä, joka sisälsi 15,2 g gluteenia ja 91,5 g vettä / 100 g jauhoseosta ja jota oli nostatettu 75 minuuttia 40 °C:ssa ja paistettu 210 °C:ssa. Reseptin ja prosessimuuttujien optimointi mahdollisti 51 % täysjyväkaurajauhoa sisältävän leivän valmistamisen, jolla oli hyvä maku ja rakenne ja joka säilyi pitkään pehmeänä.
Vehnäraskitusprosessin optimointi osoittautui hyväksi keinoksi tuottaa uusia makuvaihtoehtoja runsaasti b-glukaania sisältävälle kaura-vehnäleivälle. Paras leivän rakenne ja maku saatiin fermentoimalla vehnäraskia 20 tuntia 40 °C:ssa ja lisäämällä sitä 10 % taikinan painosta. Tällä raskileivällä oli sama ominaistilavuus ja pehmeys kuin vastaavalla suoraleivotulla leivällä.
Vehnäraskin lisääminen ei vaikuttanut b-glukaanin määrään tai molekyyli-kokoon. b-glukaanin määrä kummassakin leivässä oli 1,5 g / 100 g leipää. Tämä tarkoittaa, että annos (2 viipaletta, á 34 g) leipää sisältää 1,0 g b-glukaania, mikä vaaditaan kolesterolia alentavan väittämän käyttöön EU:ssa. b-glukaanin keski-määräinen molekyylikoko pieneni kaurajauhon 1,0 miljoonasta 0,55 miljoonaan kummassakin leivässä osoittaen, että b-glukaani pilkkoutui leivontaprosessin aikana. Tämä johtui todennäköisesti vehnäjauhon sisältämästä b-glukanaasiaktii-visuudesta.
Ristisitovien entsyymien, kuten lakkaasin ja tyrosinaasin kykyä muokata kauran makropolymeerejä leivontaprosessin aikana tutkittiin joko erikseen tai ksylanaasin kanssa. Tyrosinaasi lisäsi tehokkaammin gluteenittoman kauraleivän ominais-

6
tilavuutta ja pehmeyttä kuin lakkaasi, erityisesti ksylanaasin kanssa. Lakkaasi ja ksylanaasi lisäsivät täysjyväkauraleivän, gluteenittoman kauraleivän sekä kaura-vehnäleivän ominaistilavuutta ja tuoreen kaura-vehnäleivän pehmeyttä. Niiden vaikutus johtui ilmeisesti pääosin ksylanaasin katalysoimasta arabinoksylaanin pilkkoutumisesta ja lakkaasin sisältämästä b-glukanaasisivuaktiivisuudesta, joka hieman pienensi b-glukaanin molekyylikokoa kaurataikinassa. Tyrosinaasin vaikutus perustui pääosin kauran globuliinien polymeroitumiseen, joka yhdistettynä ksylanaasin katalysoimaan arabinoksylaanin pilkkoutumiseen paransi gluteenittoman kauraleivän ominaistilavuutta ja pehmeyttä.
Tässä työssä osoitettiin, että kauraleivän makua ja rakennetta voidaan tehok-kaasti muokata bioprosessoinnin avulla. Raskituksella voitiin vahvistaa kauraleivän makua ilman hapanta tai pistävää sivumakua. Vehnäraski ei pienentänyt kaura-vehnäleivän b-glukaanin määrää tai molekyylikokoa. Lakkaasin ja ksylanaasin yhdistelmä oli tehokkain kaura-vehnäleivän rakenteen parantamisessa. Tyrosinaasi paransi gluteenittoman kauraleivän rakenneominaisuuksia, mikä johtui pääosin tyrosinaasin katalysoimasta kauran globuliinien polymeroitumisesta.
Avainsanat oat, baking, b-glucan, bread, sourdough, wheat, gluten-free, dough, tyrosinase, laccase, xylanase, protein, cross-linking

7
Preface This study was carried out at VTT Technical Research Centre of Finland within the Bio- and Chemical Processes focus area. The research was funded by the Ministry of Agriculture and Forestry, the Finnish Funding Agency for Technology and Innovation, VTT Technical Research Centre of Finland, the Emil Aaltonen Foundation, the Raisio Research Foundation, and the Finnish food industry; their financial support is greatly appreciated.
I am grateful to Professor Anu Kaukovirta-Norja and Dr. Raija Lantto for providing excellent working facilities and for the possibility to finalize this dissertation. I am greatly indebted to my supervisors, Docent Karin Autio and Dr. Marjatta Salmenkallio-Marttila who initiated this study, as well as Professor Kaisa Poutanen and Dr. Kati Katina, who took over my supervision in 2009 and have continued their support ever since. I thank Kaisa for her excellent advice, support and encouragement throughout the study. I am deeply grateful to Kati for trusting in me and for being an inspiring mentor. It has been a privilege to work with all of you.
I am thankful to Professor Hannu Salovaara for his support and valuable advice throughout my doctoral studies. My appreciation also to Docent Jussi Loponen and Professor Ann-Charlotte Eliasson for their pre-examination of this dissertation. Thank you for critically evaluating this work and for the comments and suggestions you provided.
I am grateful to my other co-authors: Professor Johanna Buchert, Professor Kristiina Kruus, Dr. Tapani Suortti, Dr. Tuulikki Seppänen-Laakso, Dr. Xavier Rouau, Dr. Marie-Hélène Morel and Ulla Holopainen. Thank you for making your invaluable expertise available, you contributed greatly to the success of this research. My warm thanks also to all of my colleagues at the Bioprocessing knowledge centre for creating such a friendly working atmosphere. I am deeply thankful also to my colleagues at the Technologies for health promoting foods team, with whom working on the many facets of food research has been an immense pleasure. I specifically wish to thank Leena Pulkki, Arja Viljamaa, Leila Kostamo, Eeva Manninen and Liisa Änäkäinen from VTT and Anna Surget and Joel Bonicel from INRA for their practical assistance with the laboratory work. My thanks also to Vesa Moate for language revision of this dissertation. I also wish to thank the Finnish food industry for their cooperation.
I extend my heartfelt gratitude to my family, relatives and friends. I am indebted to my parents Sirkka-Liisa and Erkki for their love and encouragement throughout my life. I thank my sister Katri, her son Verneri, and my brother Petri, for always believing in me and encouraging me. I warmly thank my parents-in-law Eva and

8
Maunu for so willingly helping as grandparents during these years. Special thanks to my fabulous friends Kati, Jutta, Leena, Tiina and Päivi, you have enlightened my days!
Finally, I owe my dearest thanks to my precious husband Jukka and our lovely son Sauli, to whom I dedicate this thesis. Life would be meaningless without you in my life. I am sincerely grateful for your love, enduring patience and for standing by me throughout this project .
Espoo, June 2012 Laura Flander

9
Academic dissertation Supervisors Professor Kaisa Poutanen Doctor Kati Katina
Bio- and Chemical Processes VTT Technical Research Centre of Finland Espoo, Finland
Pre-examiners Docent Jussi Loponen Fazer Group Vantaa, Finland
Professor Ann-Charlotte Eliasson Department of Food Technology, Engineering and Nutrition Division of Food Technology Lund University Lund, Sweden
Opponent Professor Elke Arendt Department of Food and Nutritional Sciences University College Cork Cork, Ireland
Custos Professor Hannu Salovaara Department of Food and Environmental Sciences Division of Food Technology University of Helsinki Helsinki, Finland

10
List of publications This thesis is based on the following original publications which are referred to in the text as I–IV. The publications are reproduced with kind permission from the publishers.
I Flander, L., Salmenkallio-Marttila, M., Suortti, T. & Autio, K. Optimization of ingredients and baking process for improved wholemeal oat bread quality. LWT – Food Science and Technology 2007; 40(5): 860–870. doi: 10.1016/j.lwt.2006.05.004.
II Flander, L., Suortti, T., Katina, K. & Poutanen, K. Effects of wheat sourdough process on the quality of mixed oat-wheat bread. LWT – Food Science and Technology 2011; 44(3): 656–664. doi: 10.1016/j.lwt.2010.11.007.
III Flander, L, Rouau, X., Morel, M.-H., Autio, K., Seppänen-Laakso, T., Kruus, K. & Buchert, J. Effects of laccase and xylanase on the chemical and rheological properties of oat and wheat doughs. Journal of Agricultural and Food Chemistry 2008; 56(14): 5732–5742. doi: 10.1021/jf800264a.
IV Flander, L., Holopainen, U., Kruus, K. & Buchert, J. Effects of tyrosinase and laccase on oat proteins and quality parameters of gluten-free oat breads. Journal of Agricultural and Food Chemistry 2011; 59(15): 8385–8390. doi: 10.1021/jf200872r.

11
Author’s contributions I The author was responsible for planning the work, interpretation of the
results and writing the publication under the supervision of Dr. Marjatta Salmenkallio-Marttila and Dr. Karin Autio. Dr. Marjatta Salmenkallio-Marttila had the main responsibility for microscopy analysis. Dr. Tapani Suortti had the main responsibility for the HP-SEC analysis of -glucan.
II The author had the main responsibility for planning the work together with Dr. Marjatta Salmenkallio-Marttila as well as the main responsibility for the experimental design and interpretation of the results. Dr. Tapani Suortti had the main responsibility for the HP-SEC analysis of -glucan. The author also had the main responsibility for writing the publication, which was finalised with the contribution of all the authors.
III The author was responsible for planning the work together with the other authors. The author also conducted the laboratory work for the study and interpreted the data. Dr. Xavier Rouau had the main responsibility for the analysis of arabinoxylans, Dr. Marie-Helene Morel had the main responsibility for the HP-SEC analysis of proteins, and Dr. Tuulikki Seppänen-Laakso had the main responsibility for the analysis of phenolic compounds. The author had the main responsibility for writing the publication.
IV The author was responsible for the experimental work and data interpretation. The author planned the work together with Dr. Kristiina Kruus. MSc. Ulla Holopainen had the main responsibility for microscopy analysis. The author had the main responsibility for writing the publication, which was finalised with the contribution of all the authors.

12
Contents Abstract ........................................................................................................... 3
Tiivistelmä ....................................................................................................... 5
Preface ............................................................................................................. 7
Academic dissertation ..................................................................................... 9
List of publications ........................................................................................ 10
Author’s contributions .................................................................................. 11
List of symbols .............................................................................................. 15
1. Introduction ............................................................................................. 16 1.1 Oats as raw material for baking ......................................................... 16
1.1.1 Structure of oat and wheat kernels ......................................... 16 1.1.2 Oat milling ............................................................................. 18 1.1.3 Chemical composition of oat and wheat flours ........................ 18 1.1.4 Nutritional properties of oats ................................................... 22
1.2 Effects of oats in bread baking .......................................................... 24 1.2.1 Dough properties ................................................................... 24 1.2.2 Bread quality ......................................................................... 25 1.2.3 Effects of bread baking on -glucan of oat .............................. 26
1.3 Methods for improving the quality of oat breads ................................. 29 1.3.1 Effects of ingredients and processing on oat bread quality ...... 29 1.3.2 Use of sourdough in baking .................................................... 29
1.3.2.1 Sourdough fermentation .......................................... 29 1.3.2.2 Effects of sourdough on bread quality ...................... 30
1.3.3 Use of enzymes in baking ...................................................... 31 1.3.3.1 Hydrolytic enzymes ................................................. 32 1.3.3.2 Oxidoreductases ..................................................... 33 1.3.3.3 Combination of hydrolytic and oxidative enzymes ..... 35
1.4 Aims of the study .............................................................................. 36

13
2. Materials and methods ............................................................................ 37 2.1 Raw materials and processing .......................................................... 37
2.1.1 Flours .................................................................................... 37 2.1.2 Enzymes ............................................................................... 38 2.1.3 Model doughs ........................................................................ 38 2.1.4 Breads .................................................................................. 38 2.1.5 Preparation of model doughs.................................................. 39 2.1.6 Preparation of breads ............................................................ 39
2.2 Chemical analysis ............................................................................. 40 2.2.1 Acidity of sourdoughs and breads ........................................... 40 2.2.2 Enzyme activity assays .......................................................... 40 2.2.3 Analysis of non-starch polysaccharides .................................. 40 2.2.4 Analysis of phenolic compounds............................................. 41 2.2.5 Analysis of proteins ................................................................ 41
2.3 Microstructure of the doughs and breads ........................................... 42 2.4 Rheology of the doughs .................................................................... 42 2.5 Quality attributes of the breads .......................................................... 43 2.6 Experimental design and data analysis .............................................. 43
2.6.1 Experimental design of the optimization trials .......................... 43 2.6.2 Data analyses for optimization trials ....................................... 44 2.6.3 Other statistical analysis......................................................... 44
3. Results and discussion........................................................................... 45 3.1 The effects of recipe and process parameters on the quality
attributes of oat-wheat bread (Publication I) ....................................... 45 3.1.1 Optimization of ingredients ..................................................... 45 3.1.2 Optimization of the baking process ......................................... 46 3.1.3 Optimized oat bread properties .............................................. 48
3.2 Effects of wheat sourdough process on the quality parameters of oat-wheat bread (Publication II) ..................................................... 49 3.2.1 Effects of sourdough parameters on the acidity of wheat
sourdoughs and breads ......................................................... 49 3.2.2 Effects of sourdough parameters on the bread characteristics ...... 49
3.3 The content and molecular weight of -glucan in straight dough and sourdough breads (Publications I and II) ..................................... 52
3.4 Comparison of chemical properties of oat and wheat flours and doughs (Publication III) ..................................................................... 54
3.5 Effects of laccase, tyrosinase and xylanase on the oat, wheat and oat-wheat doughs (Publications III and IV) .................................. 55 3.5.1 Effects of enzymes on the non-starch polysaccharides of
doughs .................................................................................. 55 3.5.2 Effects of enzymes on the proteins of doughs ......................... 58 3.5.3 Effects of enzymes on the rheological properties of the doughs .... 60
3.6 Effects of laccase, tyrosinase and xylanase on the quality attributes of oat and oat-wheat breads (Publications III and IV)........... 62

14
4. Conclusion and future outlook ............................................................... 65
References ..................................................................................................... 67
Appendices
Publications I–IV Appendices of this publication are not included in the PDF version. Please order the printed version to get the complete publication (http://www.vtt.fi/publications/index.jsp).

15
List of symbols
AX Arabinoxylan
DFA Dehydrodiferulic acid
Ex Extensibility
FA Ferulic acid
LAC Laccase (benzenediol: oxygen oxidoreductase, EC 1.10.3.2)
Mw Weight-average molecular weight
MW Molecular weigth
Rmax Resistance to stretching
TYR Tyrosinase (monophenols, o-diphenol/oxygen oxidoreductase, EC 1.14.18.1)
XYL Xylanase (endo-1,4- -xylanase, EC 3.2.1.8)
WEAX Water-extractable arabinoxylan
WSNSP Water-soluble non-starch polysaccharide
WUAX Water-unextractable arabinoxylan

1. Introduction
16
1. Introduction
1.1 Oats as raw material for baking
The research strategies to improve the healthiness of food both in Finland and other EU countries aim to promote the health of European citizens as well as to increase the competitiveness of the Finnish and European food industry sector in the global market. Oat (Avena sativa) is an important crop in Northern climates. Finland was the third largest producer of oats in the world in the year 2008 (FAO, 2010), and oats have been Finland’s second largest cereal crop, after barley, for decades ( 1.2 billion kg/year) (TIKE, 2010). The beneficial health effects of whole grains and oats have increased demand for tasty and healthy breads made from them. Whole grains used in baking applications have mainly been wheat or rye. However, whole grain oat flour could offer potential for a new variety of bread with high soluble fibre content. Better understanding of the role played by oat macropolymers in dough and bread structure and the possibilities of different bioprocessing methods, such as use of sourdough and enzymes, to modify oat macropolymers would create new knowledge that could be exploited in developing healthy oat breads with pleasant sensory properties.
1.1.1 Structure of oat and wheat kernels
The kernel of oat is composed of four parts: the hull, the bran, the endosperm and the germ (Figure 1). The hull is normally separated from the groat before use (Butt et al., 2008).

1. Introduction
17
Hull Bran Endosperm Germ
Figure 1. Composition of an oat kernel (micrographs by courtesy of MSc Ulla Holopainen, VTT Bio- and Chemical Processes, Espoo, Finland).
Figure 2 shows the tissue composition of oat in comparison to wheat grain. The outer layers of both grains consist of the pericarp, testa, nucellus and aleurone (Black et al., 2006). In wheat, the pericarp contains an intermediate layer, whereas in oat this layer is absent (Black et al., 2006). The proportions of different parts of oat groat are pericarp, testa and aleurone together 12%, endosperm 84% and germ 3.7% (Kent & Evers, 1994). The corresponding proportions for wheat grain are pericarp and testa together 2.9–9.5%, aleurone 6.4–7.0%, endosperm 81.4–84.1% and germ 2.5–3.6% (Kent & Evers, 1994).
Pericarp
Intermediate layer
Testa
Nucellus
Aleurone Endosperm
Figure 2. Microstructure of oat (left) and wheat (right) grains. The sections have been stained with Acid Fuchsin and Calcofluor: protein appears red, cell walls rich in -glucan appear light blue and lignified cell walls of the fruit coat appear yellowish-brown. (Micrographs by courtesy of MSc Ulla Holopainen, VTT Bio- and Chemical Processes, Espoo, Finland)

1. Introduction
18
1.1.2 Oat milling
The majority of milled oats are processed to produce oat flour, oat flakes, oat bran or endosperm flour for human consumption. The conventional oat milling processes include dehulling, kiln drying, cutting, steaming and flaking/milling to oat flour (Girardet & Webster, 2011). Oat flour can be milled from groats already after kiln drying or flaking. Oat bran can be separated from flour in one or several grinding and sieving operations to a coarse fraction (bran) and fine fraction (endosperm flour) (Paton & Lenz, 1993). During kiln drying, the groats are heated with steam to 100–102 °C, during which the moisture content of the groats increases from 12–14 to 17–20%. After this, the groats are dried to 8–10% moisture content by dry heating and lastly by cooling air (Ganssmann & Vorwerk, 1995). Kiln drying stabilizes the groat by inactivating all enzymes and prevents the development of oat rancidity during storage by lipase and peroxidase (Girardet & Webster, 2011). Oats develop a pleasant nutty and toasted flavour after kiln drying. Oat flaking can be performed immediately after kiln drying if the process involves a steaming period that is long enough for enzyme inactivation. Usually, an additional steaming stage is performed for kiln dried groats after storage to plasticise the groats (Girardet & Webster, 2011). Oats are flaked by rolling them between cast iron rolls.
1.1.3 Chemical composition of oat and wheat flours
Oat flour contains high amounts of valuable compounds such as soluble fibres, proteins, unsaturated fatty acids, vitamins, minerals and phytochemicals. The nutritional composition of whole grain and endosperm oat flours as well as endosperm wheat flour are presented in Table 1.
Table 1. Nutritional composition of oat and wheat flours.
Component Range (% of flour weight)
Whole grain oat flour
Endosperm oat flour
Endosperm wheat flour
Carbohydrate without dietary fibre 55.7–62.41,2 59.21 69.4–70.11,3
Dietary fibre 10.6–17.21,4 6.51 2.4–3.01,3
Protein, Nx5.83 for oat5, (Nx5.7 for endosperm wheat)
9.6–16.91,4 9.4–14.71,6 10.5–19.21,7
Fat 4.5–9.02,4 9.11 1.7–2.31,3
Ash 1.7–2.01,4 1.2–2.01,6 0.5–0.61,3
Moisture 8.2–14.11,4 8.6–10.81,6 13.4–13.81,3
1(U.S. Department of Agriculture, Agricultural Research Service, 2011) 2(Welch, 2006)
3(Health Canada, 2010)
4(Hüttner et al., 2010c)
5(FAO/WHO, 1973) 6(Hüttner et al., 2010a) 7(Rakszegi et al., 2008)

1. Introduction
19
Dietary fibres occur naturally in food and are defined as edible carbohydrate polymers with three or more monomeric units, which are neither digested nor absorbed in the human small intestine (European Commission, 2008a). If the dietary fibres are obtained from food raw material by physical, chemical, enzymatic or synthetic means, their beneficial physiological effects have to be demonstrated by generally accepted scientific evidence.
The main dietary fibre components of oats are (1 3), (1 4)- -D-glucan ( -glucan) and arabinoxylan (AX) (Table 2), whereas the fibre of endosperm wheat flour is composed mainly of AX and fructan, (1.3–2.9 and 1.7% of d.w., respectively) (Haskå et al., 2008, Ordaz-Ortiz & Saulnier, 2005, Shewry et al., 2010). Both -glucan and AX are concentrated more in the bran fraction than in the endosperm, but the solubility of AX is higher in endosperm than in bran (Westerlund et al., 1993).
Table 2. -glucan and arabinoxylan contents of oat and wheat flours.
Component Range (% of d.w.)
Whole grain oat flour
Endosperm oat flour
Endosperm wheat flour
-glucan 1.8–8.11,2 1.0–1.83,4 0.2–0.34,5
Total arabinoxylan 2.0–4.5 6,7 0.5–1.33,4 1.3–2.98,9
Water-extractable arabinoxylan 0.3–0.47,10 0.2–0.33,10 0.2–1.18,11
1(Miller et al., 1993) 2(Yao et al., 2007) 3(Shewry et al., 2008) 4(Henry, 1987) 5(Trogh et al., 2004) 6(Bhatty, 1992)
7(Westerlund et al., 1993) 8(Shewry et al., 2010) 9(Ordaz-Ortiz & Saulnier, 2005) 10(Frölich & Nyman, 1988) 11(Gebruers et al., 2008)
Oat -glucan is a linear polysaccharide, which is composed of -D-glucopyranose units. These units are linked by (1 4) and (1 3) linkages (70 and 30%, respectively) (Wood, 2011). About 90% of (1 4) linked -D-glucopyranoses exist in a group of three (cellotriose) or four (cellotetraose) units (Wood et al., 1994) separated by one (1 3) linkage (Wood, 2011) (Figure 3). The highest ratio of cellotriose to cellotetraose has been found in wheat (3.0–4.8) (Tosh et al., 2004, Miller & Fulcher, 1995), while an apparently lower ratio has been reported for oats (1.4–2.4) (Wood et al., 1991a, Papageorgiou et al., 2005). The -(1,3)-bonds of the -glucan make the chain more flexible and soluble in water (Buliga et al., 1986). It has also been proposed that a higher ratio of cellotriose/cellotetraose reduces the solubility of -glucan (Böhm & Kulicke, 1999). The proportion of water-extractable -glucan varies widely (from 28 to 100%) depending on the characteristics of the oat material e.g. structure and molecular weight (MW) of -glucan, bran, endosperm or concentrated -glucan, steamed or native oat) and the extraction method (temperature, time, enzymes, precipitation with ethanol, drying method) (Beer et

1. Introduction
20
al., 1997, Åman & Graham, 1987, Immerstrand et al., 2009, Doehlert et al., 1997, Colleoni-Sirghie et al., 2004). The proportion of water-extractable -glucan of whole wheat and wheat bran is lower than in oats (7 and 18%, respectively) (Rimsten et al., 2003). The average peak MW of oat -glucan varies between 1.0 and 3.1 x 10⁶ (Beer et al., 1997, Rimsten et al., 2003, Wood et al., 1991b, Ajithkumar et al., 2005) and between 0.3 and 2.1 x 10⁶ in wheat (Rimsten et al., 2003, Wood et al., 1991b, Lazaridou et al., 2004, Cui et al., 2000), based on the results from high-performance size-exclusion chromatography (HPSEC) and post-column addition of Calcofluor, employing calibration against pure -glucans.
Cellotriose Cellotetraose
Figure 3. Structure of (1 3), (1 4)- -D-glucan (modified from Wood, 2011).
Arabinoxylans (AX) have a basic backbone chain of -D-xylopyranosyl residues linked through (1 4)-glycosidic linkages (Figure 4) (Colleoni-Sirghie et al., 2004). Arabinofuranose may substitute at position 3, position 2, or both, of the same xylopyranosyl residue (Izydorczyk & Biliaderis, 1994). The hydroxycinnamic acids, ferulic (FA) (R = OCH3) and p-coumaric acid (R = H), are esterified at position 5 of the arabinofuranosyl substituents located at position 3 of the xylose residues (Smith & Hartley, 1983) (Figure 4). AX can be characterised as water unextractable (WUAX) or water extractable arabinoxylans (WEAX). The WEAX form highly viscous aqueous solutions, whereas the WUAX have strong water-binding capacity (Meuser & Suckow, 1986, Izydorczyk & Biliaderis, 1995, Rouau & Moreau, 1993). The degree of arabinosylation of AX varies widely depending on the cereal, wall type, cultivar and extraction method (Ordaz-Ortiz & Saulnier, 2005, Gebruers et al., 2008, Barron et al., 2007, Virkki et al., 2005). The arabinose/xylose ratio of total AX in endosperm wheat flour varies between 0.5 and 0.7 (Haskå et al., 2008, Gebruers et al., 2008) and of WEAX between 0.2 and 0.6 (Gebruers et al., 2008). The MWs of WEAX in wheat flour depend on the extraction and determination procedures. The MW of WEAX of wheat flour ranges between 55,000 and 408,000, when measured by gel filtration (Cleemput et al., 1995, Dervilly et al., 2000).

1. Introduction
21
(1 4)- -D-xylan
5- or 2-linked ferulic acid ester
Figure 4. (1 4) - -D-xylan chain with arabinofuranose substituted at position 3 of one xylopyranosyl residue, and esterified hydroxycinnamic acid at position 5 of the arabinofuranosyl residue.
Ferulic acid (FA) is the main phenolic compound of oats and wheat and is mainly linked to AX by ester linkage (Sosulski et al. 1982, Bunzel et al. 2001). The total monomeric FA content of whole grain oat varies between 10 and 274 g/g (Zielinski et al., 2001, Mattila et al., 2005), and endosperm wheat flour between 23 and 136 g/g d.w. (Sosulski et al., 1982, Mattila et al., 2005, Peyron et al., 2002). According to Adom & Liu (2002), 98% of FA present in whole grain oat was in bound form, 2% was soluble conjugate and 0.4% was free. In wheat flour, the corresponding values were 98, 1 and 0.1%, respectively (Adom & Liu, 2002). The dimerization of ferulate esters gives dehydrodiferulates contributing to cross-links between cell wall polysaccharides in soluble and insoluble dietary fibre (Bunzel et al., 2001). During chemical analysis these can be saponified to dehydrodiferulic acids (DFA) (Ralph et al., 1998). The dietary fibre of whole grain oat and wheat contains mainly 8-5’ coupled DFA (46 and 42% of total DFAs in oat and wheat, respectively) and 8-8’ coupled DFA (26 and 27% of total DFAs in oat and wheat, respectively) (Bunzel et al., 2001). According to Mattila et al. (2005), the most common phenolic compounds in whole grain oat were FA, DFAs, sinapic acid and avenanthramides (274, 121, 60, and 30 g/g of d.w., respectively), and in endosperm wheat flour FA, alkylresorcinols, DFAs, and sinapic acid (136, 53, 29, and 9 g/g of d.w., respectively).
As the highest concentration of oat proteins is in the subaleurone layer, the starchy endosperm provides 40–50% of the total grain protein (Youngs, 1972). The amino acid composition of the aleurone layer and starchy endosperm are nearly the same (Donhowe & Peterson, 1983). The major protein fraction of oat grain is globulins, which account for 70–80% of the total proteins (Peterson & Brinegar, 1986, Robert et al., 1983). Albumins account for 12% (Ma & Harwalkar, 1984) and prolamins (avenin) for 4–14% of the total proteins (Peterson & Brinegar, 1986, Ma & Harwalkar, 1984).
The globulins of oat can be classed as 4 types: 3S (20 kDa), 7S (40–70 kDa), 12S (322 kDa), and 18S (80 kDa) (Peterson, 1978, Burgess et al., 1983). The 18S
(1 3)- or (1 2)-linked- -L-arabinofuranose

1. Introduction
22
globulins can be divided in two smaller polypeptides under reducing conditions (Peterson, 1978). The 12S globulins account for 90% of the globulins of oat (Burgess et al., 1983). The primary structure of 12S globulin consists of an acidic chain of polypeptides followed by a basic chain of polypeptides (Shotwell et al., 1988). The separate chains of polypeptides in 12S globulins are linked together by disulphide linkages (Robert et al., 1985). The MW and isoelectric points of the acidic and basic polypeptides are 33–38 kDa and pI 5–7, and 20–25 kDa and pI 8–9, respectively (Burgess et al., 1983, Brinegar & Peterson, 1982). The quaternary structure (322 kDa) of globulin consists of six non-covalently linked subunits (53–58 kDa). Each subunit contains a basic and acidic polypeptide chain, which are linked together by disulphide and non-covalent linkages (Peterson & Brinegar, 1986, Shotwell et al., 1988, Shotwell, 1999). The oat globulins are heat-stable proteins and their denaturation temperature is approximately 110 °C (Ma & Harwalkar, 1987, Marcone et al., 1998).
Wheat flour contains approximately 3–5% albumins, 6–10% globulins, and 76–91% gluten proteins (Konzac, 1977). The gluten consists predominantly of monomeric gliadins (soluble in aqueous alcohol) and polymeric glutenins (insoluble in aqueous alcohol) in roughly equal weight fractions. The MWs measured by sodium dodecyl sulfate polyacrylamide gel electrophoresis (SDS-PAGE) of gliadin polypeptides ranges from approximately 32,000 up to approximately 74,000 ( -gliadin) (Shewry et al., 1986). Gliadin, excluding -gliadin, carries cysteine residues which are involved in intra-chain disulfide bonds (Shewry, 1995). Flour glutenin is partly insoluble in most common solvents due to its huge size, even in the presence of denaturing agents such as SDS. The wheat gluten solubility in SDS-phosphate buffer amounts to about 80–90% of the total protein mass. This glutenin fraction that is insoluble in 1.5% SDS is called glutenin macropolymer (GMP). GMP consists of discrete polypeptides (subunits), which are linked together by inter-chain disulfide bonds to form a high-molecular-weight glutenin subunit, HMW-GS (Mr 60000–90000) and low-molecular-weight glutenin subunit, LMW-GS (Mr 36000–44000). Glutenin polymers show a wide size distribution range, and their Mr may exceed several million (Wrigley, 1996, Southan & MacRitchie, 1999). The wheat protein size distribution is usually studied by size exclusion high-performance liquid chromatography (SE-HPLC), which allows good resolution of gliadin monomers and glutenin polymers (Preston & Stevenson, 2003).
1.1.4 Nutritional properties of oats
Oats, usually consumed as a whole grain cereal, are a valuable part of our daily diet and may even lower the risk of several chronic diseases. The lack of dietary fibre in Western diets may be associated with increased occurrence of obesity, type 2 diabetes and cardiovascular diseases. A prospective cohort study showed that a two-serving-per day increment in whole grain consumption was associated with a 21% decrease in risk of type 2 diabetes (de Munter et al., 2007), and a meta-analysis of Mellen et al. (2008) showed that greater whole grain intake (2.5

1. Introduction
23
servings/d vs. 0.2 servings/d) was associated with a 21% lower risk of cardiovascular disease (Mellen et al., 2008). Moreover, it has been reported recently that cereal fibre intake may lower the risk of death from cardiovascular, infectious, and respiratory diseases by 24–56% in men and by 34–59% in women (Park et al., 2011).
The components responsible for the beneficial effects of whole grain foods are still under investigation, However, substantial evidence indicates that consumption of oats can decrease high plasma cholesterol, which is a major risk factor for heart disease. The reductions in serum cholesterol and plasma insulin responses are attributable to the main water-soluble polysaccharide of oat, -glucan (Wood, 1993, Mälkki, 2001, Jenkins et al., 2002, Liatis et al., 2009, Juvonen et al., 2009). On the basis of numerous clinical studies, the European Commission has recently allowed the following health claim (Article 14(1)(a)) for foods which provide at least 1 g -glucan per quantified portion (3 g/day): “Oat beta-glucan has been shown to lower/reduce blood cholesterol. High cholesterol is a risk factor in the development of coronary heart disease.” (European Commission, 2011). In addition, the U.S. Food and Drug Administration allows a health claim for products containing whole oat flour and a minimum of 0.75 g of -glucan per portion: “Soluble fiber from foods such as whole oat flours in (name of product), as part of a diet low in saturated fat and cholesterol, may reduce the risk of heart disease” (FDA, U.S. Food and Drug Administration, 1997b). The lowest suggested daily intake of -glucan for achieving the health effects is 3 g per day, which requires four
portions with 0.75 g of -glucan (FDA, U.S. Food and Drug Administration, 1997a). Another authorised health claim (Art. 13(1)) was given by EC to foods
containing 4 g -glucans from oats or barley/30 g available carbohydrates in a quantified portion as part of the meal. These foods can bear a health claim "Consumption of -glucans from oats or barley as part of a meal contributes to the reduction of the blood glucose rise after that meal" (European Commission, 2012).
The lowering effects of -glucan on cholesterol and postprandial glucose levels in blood have been mostly related to its ability to increase the viscosity of digesta in the gut (Kerckhoffs et al., 2002, Theuwissen & Mensink, 2008, Battilana et al., 2001, Wolever et al., 2010). The MW of -glucan also affects the digestibility of starch in food products (Regand et al., 2011). In order to be physiologically active and form viscous solutions in the gut, -glucan must be soluble, and the concentration and MW must be sufficiently high (Wolever et al., 2010, Åman et al., 2004, Wood, 2007).
Oats have recently been approved by the EC as an ingredient in gluten-free labelled products (if cross-contamination from wheat, barley and rye can be avoided and the gluten content of the oat product remains below 20 mg/kg) (European Commission, 2009). The high content of beneficial fibres ((1 3)(1 4)-
-D-glucan), proteins, unsaturated fatty acids, vitamins, minerals and bioactive compounds makes oat flour a healthy alternative to starch-based ingredients in gluten-free breads. Celiac patients must adhere to a lifelong gluten-free diet by avoiding wheat gluten and similar prolamins of barley and rye, since these prolamins damage their small intestinal mucosa (Mäki & Collin, 1997, Facano & Catassi, 2001).
1. Introduction
24
1.2 Effects of oats in bread baking
1.2.1 Dough properties
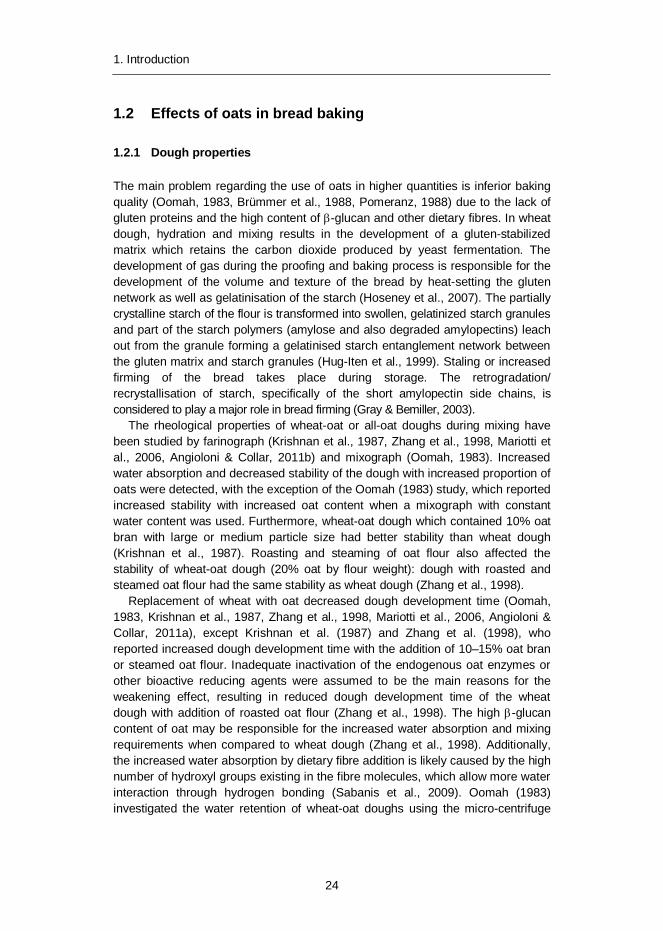
The main problem regarding the use of oats in higher quantities is inferior baking quality (Oomah, 1983, Brümmer et al., 1988, Pomeranz, 1988) due to the lack of gluten proteins and the high content of -glucan and other dietary fibres. In wheat dough, hydration and mixing results in the development of a gluten-stabilized matrix which retains the carbon dioxide produced by yeast fermentation. The development of gas during the proofing and baking process is responsible for the development of the volume and texture of the bread by heat-setting the gluten network as well as gelatinisation of the starch (Hoseney et al., 2007). The partially crystalline starch of the flour is transformed into swollen, gelatinized starch granules and part of the starch polymers (amylose and also degraded amylopectins) leach out from the granule forming a gelatinised starch entanglement network between the gluten matrix and starch granules (Hug-Iten et al., 1999). Staling or increased firming of the bread takes place during storage. The retrogradation/ recrystallisation of starch, specifically of the short amylopectin side chains, is considered to play a major role in bread firming (Gray & Bemiller, 2003).
The rheological properties of wheat-oat or all-oat doughs during mixing have been studied by farinograph (Krishnan et al., 1987, Zhang et al., 1998, Mariotti et al., 2006, Angioloni & Collar, 2011b) and mixograph (Oomah, 1983). Increased water absorption and decreased stability of the dough with increased proportion of oats were detected, with the exception of the Oomah (1983) study, which reported increased stability with increased oat content when a mixograph with constant water content was used. Furthermore, wheat-oat dough which contained 10% oat bran with large or medium particle size had better stability than wheat dough (Krishnan et al., 1987). Roasting and steaming of oat flour also affected the stability of wheat-oat dough (20% oat by flour weight): dough with roasted and steamed oat flour had the same stability as wheat dough (Zhang et al., 1998).
Replacement of wheat with oat decreased dough development time (Oomah, 1983, Krishnan et al., 1987, Zhang et al., 1998, Mariotti et al., 2006, Angioloni & Collar, 2011a), except Krishnan et al. (1987) and Zhang et al. (1998), who reported increased dough development time with the addition of 10–15% oat bran or steamed oat flour. Inadequate inactivation of the endogenous oat enzymes or other bioactive reducing agents were assumed to be the main reasons for the weakening effect, resulting in reduced dough development time of the wheat dough with addition of roasted oat flour (Zhang et al., 1998). The high -glucan content of oat may be responsible for the increased water absorption and mixing requirements when compared to wheat dough (Zhang et al., 1998). Additionally, the increased water absorption by dietary fibre addition is likely caused by the high number of hydroxyl groups existing in the fibre molecules, which allow more water interaction through hydrogen bonding (Sabanis et al., 2009). Oomah (1983) investigated the water retention of wheat-oat doughs using the micro-centrifuge

1. Introduction
25
method and found that water retention decreased with increasing amount of oats in the dough.
Both Oomah (1983) and Mariotti et al. (2006) observed higher CO2 production but lower gas retention capacity of the dough with 20–40% oat by flour weight when compared to wheat dough. Large deformation testing of the rheological properties of all-oat doughs showed increased hardness and decreased extensibility at break when compared to wheat dough (Angioloni & Collar, 2011b). The effect of different oat flours (Finnish, Irish and Swedish) on rheological properties of 100% oat doughs have been studied by Hüttner et al. (2010c). The higher protein content and smaller particle size of Finnish flour were assumed to be the main reasons for higher water hydration capacity and dough elasticity. In addition, hydrostatic pressure treatment of 100% oat dough at >350 MPa increased the elasticity of oat doughs (Hüttner et al., 2010a). Hüttner et al. (2010a) attributed the increased elasticity of oat doughs to the increased gelatinisation of oat starch and protein network formation.
1.2.2 Bread quality
Oat bread has a nutty, mild and pleasant flavour, and could compete successfully as a healthy alternative for consumers who are used to eating white wheat bread. In addition, oat’s excellent moisture retention properties keep oat breads fresher for longer (McKechnie, 1983, Prentice et al., 1954).
Addition of oats, oat starch or oat lecithin to wheat bread might also retard the staling rate (Doehlert et al., 1997, Zhang et al., 1998, Prentice et al., 1954, Forssell et al., 1998). An addition of 20 g oats/100 g wheat flour allows the bread to be labelled as “oat bread” in Germany (Brümmer et al., 1988). Exceeding this amount of oats leads easily to tight, moist and gummy breads with low specific volume. The effect of oats on bread quality has been studied with the addition of oat bran, flakes or flour from 5 g/100 g wheat flour to all-oat breads (Oomah, 1983, Krishnan et al., 1987, Zhang et al., 1998, Mariotti et al., 2006, Angioloni & Collar, 2011a, Gambu et al., 2011, Gormley & Morrissey, 1993, Kim & Yokoyama, 2011, Mandala et al., 2009). In most studies, increasing supplementation level of oat flour, bran or flakes reduced the specific volume of breads. However, Gormley & Morrissey (1993) obtained no difference in specific volumes of breads with or without 5% oats. The specific volume of oat breads ranged from 1.0 (100% whole grain oat) (Kim & Yokoyama, 2011) to 5.8 ml/g bread (10–20% oat by flour weight) (Zhang et al., 1998). In general, harder bread crumb was also observed in comparison with wheat bread, although Zhang et al. (1998) reported slower retrogradation of bread crumbs with 10–20% oat by flour weight than in wheat bread, and Gambu et al. (2011) observed no significant difference in hardness of wheat bread and oat bread with 20% oat by flour weight.
However, if oat bread is intended to meet the requirements of the -glucan content needed for a cholesterol-lowering claim (1 g/portion, 3 g/day) (European Commission, 2011) or reduction of the risk of heart disease claim (0.75 g/portion,

1. Introduction
26
3 g/day) (FDA, U.S. Food and Drug Administration, 1997a), addition of at least 50% whole grain oat flour of the weight of wheat flour in bread is needed. Another option would be to use oat bran or oat bran concentrate to meet the required level of beta-glucan in the final product.
1.2.3 Effects of bread baking on -glucan of oat
Raw material, oxidative reactions, endogenous -glucanase activity, processing and storage conditions affect the amount, solubility, MW, and structure of -glucan in the products (Beer et al., 1997, Doehlert et al., 1997, Åman et al., 2004, Degutyte-Fomins et al., 2002, Kivelä et al., 2009). These may lead to a significant reduction in the viscosity, solubility and/or MW of -glucan in oat products, impairing the cholesterol-lowering effects (Kerckhoffs et al., 2002, Wolever et al., 2010, Törrönen et al., 1992) or the ability to lower postprandial glycemia (Lan-Pidhainy et al., 2007, Tosh et al., 2008, Regand et al., 2009). The MW of -glucan in oat products has been reported to be lower than in the raw material (Beer et al., 1997, Åman et al., 2004, Regand et al., 2009, Sundberg et al., 1996, Kerckhoffs et al., 2003). The MW of -glucan in oat bread was reduced as compared with the MW of -glucan in oat bran, and no significant changes in LDL-cholesterol levels of mildly hypercholesterolemic subjects were detected (Törrönen et al., 1992, Kerckhoffs et al., 2003). Thus, understanding the influence of processing on -glucan and means to control the integrity of -glucan are extremely important for
the functionality of oats in different food applications. The content, weight-average molecular weight (Mw) and MW distribution of
different oat raw materials and oat products together with their physiological effects on humans are summarized in Table 3. All of the oat products presented in Table 3 are oat breads, with the exception of three that are oat bran muffins, (Beer et al., 1997, Lan-Pidhainy et al., 2007, Tosh et al., 2008) and one that is an oat crisp bread (Regand et al., 2009).

Table 3. Physicochemical properties of oat -glucan in raw materials and breads and their physiological effects in humans.
Type of oats
BG content
of oats %, as is basis
Mw of BG in oats, mill.
MW disribution of BG in oats, %
Wheat:oats in flour mix
BG content of product
%, as is basis
Mw of BG in
product, mill.
MW disribution of BG in product, %
Con-sumption
of BG/d
Physio-logical
effect in human
Reference
> 1.0 mill.
0.25–1.0 mill.
< 0.25 mill.
> 1.0 mill.
0.25–1.0 mill.
< 0.25 mill.
Debranned oat (General Mills Inc., USA)
1.3 nd. nd. 0:100 0.7 nd. nd. nd. nd. Kim & Yokoyama, 2011
Commercial whole oat flour (Spain)
nd. nd. nd. 0:100 2.3 nd. nd. nd. nd. Angioloni & Collar, 2011
Oat bran (Kungsörnen AB, Sweden)
9.0a 2.7b nd. 45:55 3.1 1.3b nd. 12.5 MW 0.7 in ileal excretab
Sundberg et al., 1996
Oat bran (Cerealia AB, Sweden)
8.3a 2.2 50 40–50 < 10 40:60 3.5–3.6c 1.2–1.7 10–50 40–80 10–50 nd. nd. Åman et al., 2004
Fine oat bran (Poul Dines, Denmark)
8.3 2.2 nd. 40:60 2.2–4.0c 0.2–0.8 10–50 40–80 10–50 nd. nd. Åman et al., 2004
Oat bran (Raisio plc, Finland):Oat bran concentrate (SOF Ab, Sweden), 70:30
12.2 nd. 23 49 28 45:55 3.3 nd. 15 30 55 5.9 LDL-C ns. Kerckhoffs et al., 2003
Oat bran concentrate (Raisio plc, Finland)
13.7 1.1 nd. 0:100 5.6 1.1 nd. 11.2 LDL-C ns. Törrönen et al., 1992
Commercial oat bran + flakes (Canada)
7.6–13.4a 1.1–1.9b nd. 0:100 or 30:70
2.6–4.6d 0.6–1.2b nd. nd. nd. Beer et al., 1997
Oat bran 11.4e nd. nd. 40 gf 4.9g nd. nd. 5.8h LDL-C ,
GR+IR ns. Kestin et al., 1990
Oat bran concentrate (OBC N15, Raisio plc, Finland)
15.0 nd. nd. 75:25 2.5 nd. nd. 3 LDL-C+IF Liatis et al., 2009
27
1. Introduction

Type of oats
BG content
of oats %, as is basis
Mw of BG in oats, mill.
MW disribution of BG in oats, %
Wheat:oats in flour mix
BG content of product
%, as is basis
Mw of BG in
product, mill.
MW disribution of BG in product, %
Con-sumption
of BG/d
Physio-logical
effect in human
Reference
> 1.0 mill.
0.25–1.0 mill.
< 0.25 mill.
> 1.0 mill.
0.25–1.0 mill.
< 0.25 mill.
Oat bran concentrated in pilot (bran: Raisio plc, Finland)
22.8 1.1 nd. i 1,14 g/serving
nd. nd. 9 LDL-C+GR+IR
Pick et al., 1996
Oat bran concentrate (Oatwell 22%, SOF, Sweden)
22.0 > 2.0b nd. 64:36 2.7 2.2 (0.1–0.8 with
betaglucanase)b
nd. 4 GR Tosh et al. 2008
Oat bran concentrate (Oatwell 22%, SOF, Sweden)
22.0 2.6b nd. j 3.1 0.2 nd. 3.6 GR ns. Regand et al. 2009
Oat bran concentrate (Oatwell, CreaNutrition, Switzerland)
22.0 nd. nd. 43:57 or
34:66
3.3–4.7 1.8–2.8b nd. 7.6–10.8 GR Lan Pidhainy et al., 2007
Abbreviations: BG, -glucan, nd., not detemined; LDL-C, low-density lipoprotein cholesterol; ns, not significant; GR, glycemic response; IR, insulin response; IF, fasting plasma insulin
a dry basis f bran/100 g wheat bread+muffin b peak MW g total nonstarch polysaccharide, 2.4% water-soluble hemicelluloses c the BG content of fresh bread was counted on the basis of the recipe and
assumption that the bake loss was 15%, 5.5–7.0% dry basis h water-soluble hemicelluloses
d the BG content of a muffin was counted on the basis of the recipe and assumption that the bake loss was 15%, 3.6–6.7% dry basis
I bread, muffin, cooked oat bran or oatmeal cereal
e total dietary fibre j whole wheat flour, oat bran, rye bran
28
1. Introduction

1. Introduction
29
1.3 Methods for improving the quality of oat breads
1.3.1 Effects of ingredients and processing on oats bread quality
The poor baking performance of oats can be compensated for by adding dry gluten into the dough, which strengthens the protein matrix and enhances the structure of oat bread (Gormley & Morrissey, 1993). If the amount of added fibre ingredient in the bread formula is higher than 10 g/100 g wheat flour, a gluten-rich flour with a protein content of about 16 g/100 g flour is recommended, and the amount of water used should be sufficient to properly hydrate both the added gluten and the fibre components (Stear, 1990). According to Oomah (1983), the loaf volume of wheat breads containing a 10 g oat flour/100 g wheat flour blend was higher when 65 g water instead of 60 g/100 g flour was used. Furthermore, the addition of 5% (of flour weight) hydroxypropyl methylcellulose (HPMC) has shown to be effective in increasing the specific volume and retarding the staling rate of oat breads (Kim & Yokoyama, 2011).
Mariotti et al. (2006) studied the effects of baking procedures on the quality of wheat bread with the addition of oats from 0 to 40% by weight of the flour mixture. Bread with 20% oat flour had a 13% higher specific volume (4.2 ml/g bread) than corresponding wheat bread (3.7 ml/g bread) when the doughs were mixed with a spiral mixer and a medium length procedure with two proofing periods (40 min on bulk dough and 60 min on rounded dough pieces at 30 °C and 80% RH) were used. The same baking procedure for bread with 30% oat flour resulted in the same specific volume (3.6 ml/g) than that of wheat bread (Mariotti et al., 2006).
1.3.2 Use of sourdough in baking
1.3.2.1 Sourdough fermentation
Sourdough is a mixture of flour and water that is acidified by lactic acid bacteria (LAB). Sourdough is an intermediate product and contains metabolically active yeast and LAB strains (De Vuyst & Neysen, 2005). These microbes can originate from previous sourdough/dough, commercial starters or they can be naturally present in flour. Although species from genera such as Leuconostoc, Weissella, Pediococcus, Lactococcus and Streptococcus have been found in sourdoughs, Lactobacillus strains are the most frequently isolated bacteria in these ecosystems (Corsetti & Settanni, 2007). Lactobacilli can be divided into obligately and facultatively heterofermentative, and obligately homofermentative species groups (Corsetti & Settanni, 2007). Homofermentative lactic acid bacteria (LAB) ferment hexoses mainly to lactic acid, whereas heterofermentative LAB ferment hexoses and also pentoses to lactic acid, CO2, acetic acid and/or ethanol (Corsetti & Settanni, 2007). Lactobacillus plantarum is a facultatively heterofermentative strain

1. Introduction
30
and Lactobacillus brevis is an obligately heterofermentative strain (Corsetti & Settanni, 2007). The most frequently reported yeasts in both wheat and rye sourdoughs belong to the genera Saccharomyces and Candida (De Vuyst & Neysen, 2005).
Wheat and rye are the most common cereals used in sourdoughs in bakeries. The chemical and microbial changes in sourdough depend on the flour type, amount of water, processing conditions, and microbe properties. The pH of a ripe wheat sourdough ranges typically from 3.5 to 4.3 (Clarke et al., 2002, Thiele et al., 2002). Acidification of the sourdough enhances the activity of endogenous enzymes of the flour, especially amylases and proteases (Boskov Hansen et al., 2002). The pH optima of carbohydrate degrading enzymes vary widely depending on the wheat variety and germination status. The pH optima have been reported to be 5.5 for endogenous wheat -amylase and 4.5 for malted barley -amylase (Rosell et al., 2001). The rapid drop in the pH level of sourdough may cause reduced amylolytic activity, whereas the more gradual fall in pH of spontaneously fermented sourdough permits further starch degradation. The acidification of the sourdough and the partial acidification of the bread dough improve the solubility and swelling of gluten and AX, and the water-binding capacity of starch granules (Arendt et al., 2007, Katina et al., 2007, Hammes & Gänzle, 1998). Gluten-associated proteinases of flour are usually active at pH levels 4 (Kawamura & Yonezawa, 1982). Lactic acid bacteria in wheat sourdough have been found to affect the gluten proteins (Di Cagno et al., 2002). The appearance of new protein fragments (20 and 27 kDA) from gliadins and the degradation of high MW glutenin subunits have also been detected (Zotta et al., 2006, Wieser et al., 2008). Sourdough may also produce a significant reduction in the MW of -glucan. Degutyte-Fomins et al. (2002) incubated oat bran-water slurry with rye sourdough, with rye flour or without rye, for 4 h at 30 °C. The rye in the oat slurry doubled the solubility of -glucan and increased the proportion of low MW -glucan without affecting the total -glucan content of the slurry (Degutyte-Fomins et al., 2002). It is thus evident that enzyme-induced changes, together with microbial metabolites, affect the technological and nutritional properties of sourdough bread (Poutanen et al., 2009).
1.3.2.2 Effects of sourdough on bread quality
The acidity and pH of sourdough bread depend on the bread type and the amount of sourdough in bread dough. At a typical addition level of approximately 20% sourdough of bread dough weight, the pH of bread ranges from 4.5 to 5.9 (Clarke et al., 2002, Hansen & Hansen, 1996). Sourdough is traditionally one of the key methods for enhancement of the flavour (Clarke et al., 2002) and texture of bread (Clarke et al., 2002, Thiele et al., 2002, Katina et al., 2006, Crowley et al., 2002). Ash content of flour and fermentation time of wheat sourdough were the main factors determining the intensity of flavour (Katina et al., 2006). Both empirical and fundamental rheological measurements of the wheat dough with addition of

1. Introduction
31
sourdough have revealed increased softness and reduced dough elasticity (Di Cagno et al., 2002, Clarke et al., 2004). Confocal laser-scanning showed that dough with added sourdough had greater areas of aggregated material composed of thicker proteinaceous strands than control dough without sourdough (Clarke et al., 2004). This study hypothesized that optimally applied sourdough was the principal reason for the presence of thicker proteinaceous strands in dough, which in turn could have improved the gas holding capacity of dough, as well as the better volume and softness of sourdough bread (Clarke et al., 2004). Sourdough has also been attributed to the degradation of total dietary fibre and increased WEAX in rye bread (Boskov Hansen et al., 2002). Hüttner et al. (2010b) showed that oat sourdough improved the specific volume of oat bread, but it did not affect the staling rate of the breads. Gas production by heterofermentative LAB, softening of the dough, and changes in starch pasting properties were assumed to be the main reasons for the observed improvement (Hüttner et al., 2010b).
The lower pH of sourdough bread retards the growth of microbial spoilage organisms such as moulds and rope-producing spores of Bacillus subtilis (Pepe et al., 2003, Katina et al., 2002, Lavermicocca et al., 2000). Sourdough fermentation can also modulate the nutritional properties of breads in a number of ways, such as increasing the levels or bioavailability of bioactive compounds, and retarding starch digestibility (Katina et al., 2005, Östman et al., 2002). De Angelis et al. (2007) attained significantly lower degrees of starch hydrolysis of wheat-oat breads with the addition of wheat sourdough than corresponding breads without sourdough. In addition, the glycemic index was reduced significantly as compared to control wheat bread (De Angelis et al., 2007). The sourdough process may also induce degradation of -glucan. Åman et al. (2004) reported reduced content and MW of -glucan when rye sourdough was fermented with oat bran and added to oat-wheat bread at the 10% level.
1.3.3 Use of enzymes in baking
Enzymes are nature’s tools for catalysing the chemical reactions occurring in all living organisms (Whitaker, 2003). Enzymes are also present in cereals, where they catalyse the formation or degradation of different compounds which are necessary for the life cycle of the plant. Enzymatic activity in dormant seed is low, but rises rapidly during germination. Nearly all main components of the seed, e.g., starch, proteins, lipids and polysaccharides, are degraded by enzymes to provide energy and building blocks for the growing shoot. The enzymatic activity of the grain depends on weather conditions, variety, storage and processing conditions.
Manufacturers of cereal products have utilised these activities for centuries by developing different cereal products with their characteristic taste and appearance as beer, bread etc. (van Oort, 2009b). Some enzymatic activities of flour are preferred in baking and some are not. For example, a slight amylolytic activity improves the quality of bread, whereas too high activity of lipase in oat products results in rancidity. Traditionally, millers and bakers have tailored the desired

1. Introduction
32
amylolytic activity of wheat flour by malt addition, but nowadays commercial enzymes are also used. Commercial enzymes are produced mainly by microbes in large fermentation tanks. Depending on the purification steps, the main enzymatic activity may be accompanied by other enzymatic side-activities. Hydrolytic enzymes such as -amylase, xylanase and lipase were first commercialized for the baking enzymes market. Nowadays, oxidative enzymes such as laccases and peroxidases and combinations of hydrolytic and oxidative enzymes are gaining increasing attention. During bread making, enzymes usually activate during mixing and inactivate when the temperature rise denatures them in the oven. Enzymes offer many advantages in baking applications, including serving as replacements for a wide range of additives, and reduced energy and water requirements during the baking process.
European Commission is harmonising the regulations for food enzymes in the member countries of EU (European Commission, 2008b). This regulation covers enzymes that are added to food to perform a technological function, including use as processing aids. All new and existing food enzymes must undergo an authorisation procedure, and only approved enzymes are listed on a Community list and allowed to be used in foods.
Enzymatic activity is expressed in katals (nkat refers to nanokatals) (Bureau International des Poids ets Mesures, 1999). One katal is the amount of enzyme that converts 1 mole of substrate per second. The activity of an enzyme depends, for example, on the temperature, pH, concentration and structure of the substrate as well as the presence of inhibitors or cofactors which regulate the reaction. The dosage of the enzyme is also important; too high or low activity may have unwanted effects on the quality of the product. It is therefore important to take these factors into account when enzymes are added to doughs with different recipes and processes to fully exploit their potential in baking applications.
1.3.3.1 Hydrolytic enzymes
Hydrolytic enzymes or hydrolases catalyse reactions in which a molecule of a target substance (e.g. polysaccharide) is split into two parts by the addition of a molecule of water. One part of the target substance has a hydroxyl group derived from a water molecule, and the other part gains the hydrogen ion. Hydrolases are classified as EC 3. EC numbering is a numerical classification scheme for enzymes, based on the chemical reactions they catalyse (Webb, 1992). Hydrolases in the group EC 3.1 act on ester bonds (e.g. lipases), group 3.2. are glycosylases (e.g. -amylase and xylanase), and group 3.4 proteases.
Lipases hydrolyse di- and triglycerides into mono- or diglycerides and lysolipids (Castello et al., 1998). Lipase has been reported to improve the volume and softness of bread (Si, 1997, Monfort et al., 1999, Purhagen et al., 2011). The glycosylase enzyme -amylase randomly hydrolyses the -(1,4) glycosidic bonds of damaged or gelatinized starch of the dough, resulting in low-molecular-weight dextrins (van Oort, 2009a). The degradation of starch weakens the recrystallised

1. Introduction
33
amylopectin network, and reduced firming rate of the bread during storage is observed (Goesaert et al., 2009). Amylases also promote yeast fermentation by increasing the level of fermentable sugars in the dough, which improves the volume of the bread (Goesaert et al., 2009).
Xylanases (endo-1,4- -xylanase, EC 3.2.1.8, XYL) cleave the xylan backbone of arabinoxylan (AX), subsequently increasing the solubility of water-unextractable arabinoxylan (WUAX). The water-unextractable nature of the AX is due to a combination of non-covalent interactions and covalent bonds with neighbouring AX molecules, proteins, cellulose and lignin (Iiyama et al., 1994). Concomitantly, XYL also reduces the MW of water-extractable arabinoxylan (WEAX) (Courtin & Delcour, 2002). WEAX consists mainly of linear molecules behaving as semi-flexible coils in solution (Adams et al., 2003). The solubilisation of WUAX, increased viscosity of the dough aqueous phase by WEAX, and the subsequent water redistribution from WUAX to gluten may improve the specific volume and softness of the bread crumb (Courtin & Delcour, 2002). The gluten macropolymer (GMP) extracted from XYL-treated dough has been found to contain less pentosans, but higher protein content and protein density than GMP of control dough (Primo-Martin et al., 2003). According to Veraverbeke et al. (1999), breakdown of AX by XYL could produce less viscous dough, resulting in increased mobility of protein fragments or facilitating hydrophobic interactions between proteins. This, in turn, could improve the aggregation of proteins (Veraverbeke et al., 1999) or the release of AX entrapped in the gluten network (Saulnier et al., 1997, Roels et al., 1998). However, in the study by Primo-Martin et al. (2001), XYL did not significantly affect the rheological properties of GMP as measured by the Kieffer microextensibility test and rheometer.
1.3.3.2 Oxidoreductases
This class (EC 1) comprises all enzymes catalysing oxido-reductions, for example, glucose oxidase, laccase, tyrosinase and sulphydryl oxidase. Laccase (benzene-diol:oxygen reductase, EC 1.10.3.2, LAC) and tyrosinase (EC 1.14.18.1., TYR) are oxidative enzymes that are capable of catalyzing cross-linking biopolymers via their phenolic moieties. The enzymes generating covalent bonds within or between cereal biopolymers are interesting, as the covalent linkages can contribute remarkably to the viscoelastic properties of dough and bread. Depending on the enzymes used, either carbohydrates or proteins, or both, can be cross-linked, as reviewed by Buchert et al. (2007).
LAC is a multicopper enzyme catalyzing the oxidation of a variety of organic substrates with concomitant reduction of molecular oxygen to water. LAC can oxidize various aromatic compounds such as substituted mono- and polyphenols and aromatic amines and thiols, producing reactive radicals. Further reactions of radicals may result in cross-linking of monomers, degradation of polymers and ring cleavage of aromatics (Claus, 2004). LAC can oxidize FA into a phenoxy radical that reacts non-enzymatically to produce di- and triFA. As a result, cross-links are

1. Introduction
34
formed between feruloylated AX of wheat (Carvajal-Millan et al., 2005a, Labat et al., 2000, Figueroa-Espinoza et al., 1999, Figueroa-Espinoza et al., 1998). The thiols of cysteine and glutathione may reduce the phenoxy radicals, formed by LAC, back to original FA with concomitant oxidation into disulfides (Labat et al., 2000, Figueroa-Espinoza et al., 1998). Furthermore, heteroconjugate formation between tyrosine and tyrosine-containing peptides or proteins and feruloylated AX have been reported by LAC (Mattinen et al., 2005) and peroxidase (Boeriu et al., 2004, Oudgenoeg et al., 2002, Oudgenoeg et al., 2001).
LAC decreased the AX extractability of wheat dough by increasing the oxidative gelation of AX through dimerization of feruloyl esters (Labat et al., 2000). With added FA, the sulfhydryl (SH) oxidation of wheat dough with LAC increased by 47%, when compared to control dough (Labat et al., 2000). In oat dough, LAC did not affect the WEAX content of the dough (Renzetti et al., 2010), but protein polymerization of oat dough was suggested on the basis of a significant decrease in the amount of extractable -amino nitrogen, the relative concentration of protein bands between 21–70 kDa, and the formation of large protein aggregates as visualized by confocal laser scanning microscopy (Renzetti et al., 2010). LAC at activity levels of 5–50 nkat/g flour have been reported to decrease extensibility, increase resistance to stretching (Selinheimo et al., 2006), and increase wheat dough consistency in comparison with the control (Labat et al., 2000). At high activity levels (50 nkat/g flour), resistance to stretching has been found to decrease as a function of wheat dough resting time, suggesting depolymerisation of AX (Selinheimo et al., 2006). LAC has been found to improve the specific volume of white wheat breads by 4–9% (Si, 2001, Primo-Martin & Martinez-Anaya, 2003, Selinheimo et al., 2007b). The softness of fresh white wheat bread has been improved by 17–19% by LAC (Primo-Martin & Martinez-Anaya, 2003, Selinheimo et al., 2007b) and by 25% after 4 days storage (Primo-Martin & Martinez-Anaya, 2003), whereas Selinheimo et al. (2007b) observed no significant difference between the softness of LAC-treated and control wheat bread after 3 days storage. In oat, the increased elasticity, softness and deformability of the dough was explained by protein polymerisation by LAC and -glucan depolymerisation by the side-activity of LAC (Renzetti et al., 2010). This improved the specific volume and softness of fresh oat bread (9% and 17%, respectively) when compared to control oat bread (Renzetti et al., 2010).
TYR can catalyse the hydroxylation of monophenols to o-diphenols, and subsequent oxidation of these to o-quinones (Lerch, 1983). Thus, TYR can accept both mono- and diphenols as substrates (e.g. p-coumaric and caffeic acid, but not FA) (Selinheimo et al., 2007a). Quinones may further react non-enzymatically to produce mixed melanins and heterogeneous polymers. Tyrosine side chains in proteins can be oxidized by TYR, and lysyl, tyrosyl, cysteinyl, and histidinyl moieties may react further with TYR-oxidized tyrosine residues (Buchert et al., 2007, Xu et al., 1997, Takasaki & Kawakishi, 1997).
TYR has been shown to cross-link wheat gliadin (Selinheimo et al., 2007b, Takasaki & Kawakishi, 1997, Takasaki et al., 2001), which was assumed to be the main reason for improved strength and decreased extensibility of the wheat dough

1. Introduction
35
(Selinheimo et al., 2007b). The specific volume of wheat bread increased by 9 and 14% when TYR was added at 5 and 10 nkat/g flour, respectively (Selinheimo et al., 2007b). The softness of fresh wheat breads also improved by 12%, but after 3 days storage bread with a higher dosage of TYR (10 nkat/g flour) was 13% harder than the control bread (Selinheimo et al., 2007b).
1.3.3.3 Combination of hydrolytic and oxidative enzymes
The combination of LAC and XYL has been found to decrease the wet weight of the SDS-insoluble gluten macropolymer (GMP)/freeze-dried dough weight, as well as the amount of AX in GMP, while the protein content of GMP remains affected (Primo-Martin et al., 2003). This indicates that XYL released the AX that was associated with proteins (Primo-Martin et al., 2003). The increased WEAX content of the doughs with both enzymes reflected the predominance of XYL over the oxidative activity of LAC (Primo-Martin & Martinez-Anaya, 2003). The elastic and viscous modulus of GMP were both decreased, showing weaker gel than GMP without enzymes (Primo-Martin et al., 2003). In wheat dough, the combination of enzymes (5 nkat LAC and 50 nkat XYL/g flour) did not affect dough strength, but decreased extensibility (Selinheimo et al., 2007b). The combination of enzymes increased the specific volume of wheat breads by 10–11% when compared to breads with XYL or LAC alone (Primo-Martin & Martinez-Anaya, 2003). This was related to a higher amount and MW of WEAX with a lower amount of arabinose side chains (Primo-Martin & Martinez-Anaya, 2003). A similar synergistic effect (5% increase) on the specific volume of whole wheat bread has been observed (Si, 2001). In addition, a combination of LAC and -amylase showed a synergistic effect in a 14–23% increase in specific volume of wheat bread in comparison to LAC or -amylase alone (Caballero et al., 2007). Conversely, Si (2001) and Selinheimo et al. (2007b) obtained the same specific volume for white wheat breads with a combination of LAC and XYL as with XYL alone (Si, 2001, Selinheimo et al., 2007b) or LAC alone (Selinheimo et al., 2007b). The combination of enzymes improved the softness of wheat breads more than LAC or XYL alone (Primo-Martin & Martinez-Anaya, 2003, Selinheimo et al., 2007b).
The combination of TYR and XYL improved the strength and reduced the extensibility of the wheat dough, and improved the specific volume and softness of wheat breads (Selinheimo et al., 2007b). Selinheimo et al. (2007b) proposed that, by hydrolysing AX, XYL could have diminished the possible TYR-mediated association of AX with gluten, which in turn could have the improved formation of the gluten network.

1. Introduction
36
1.4 Aims of the study
Oats are an excellent raw material for both health-promoting and gluten-free bread products. However, the lack of gluten proteins as well as the high fibre content of oats pose technological challenges with respect to the textural and flavour demands of consumers. In order to exploit the health-promoting effects of oats in breads, there is a need to develop methods of producing oat breads that have good texture, flavour and shelf-life, and contain -glucan in a physiologically favourable form. The aim was to study the effects of baking and bioprocessing methods, namely the use of sourdough and enzymes, on the chemical and rheological properties of oat doughs, the stability of -glucan, and the quality attributes of oat breads.
More specifically, the aims were to:
1. Study the effects of ingredients and processing parameters on texture, flavour and shelf-life of oat bread with a high content of whole grain oat (51% of flour) and -glucan (1.0 g/portion).
2. Characterize the effects of wheat sourdough parameters on texture, flavour and shelf-life of oat bread with a high content of whole grain oat (51% of flour) and -glucan (1.0 g/portion).
3. Compare the effects of laccase and xylanase on the chemical and rheological properties of oat, wheat and oat-wheat doughs and relate the textural properties of oat breads to the enzyme-induced changes in these dough matrices.
4. Compare the effect of laccase and tyrosinase on the chemical and rheological properties of gluten-free oat doughs and relate the textural properties of gluten-free oat breads to the enzyme-induced changes in the dough matrix.

2. Materials and methods
37
2. Materials and methods
The materials and methods used in this study are described in detail in the original publications I–IV. A general outline of the materials and methodology used is given below.
2.1 Raw materials and processing
2.1.1 Flours
The same endosperm wheat and whole grain oat flours were used for Publications I and II. New batches of these flours were used in Publication III, and endosperm oat flour was used in Publication IV. The properties of the oat and wheat flours are presented in Table 4. The analysis methods used are presented in Publications I–IV. All chemical analyses were made in duplicate.
Table 4. Quality attributes of flours used.
Analysis, (% dry basis) EWF1 EWF2 WOF1 WOF2 EOF
Moisture 12.1 12.4 10.6 9.1 8.6
Protein (Nx5.7 for wheat, Nx6.25 for oats) 12.9 13.2 19.0 18.2 12.3
Ash 0.7 0.7 2.8 2.4 1.1
Wet gluten 28.1 30.9 nd nd nd
Water absorption (farinograph 14% moisture basis) nd 59.8 nd 86.9 75.8
Dietary fibre nd nd nd nd 5.8
-glucan 0.3 0.2 6.0 5.3 1.3
Publication I–II III I–II III IV
Abbreviations: EWF, endosperm wheat flour, WOF, whole grain oat flour, EOF, endosperm oat flour, nd, not determined

2. Materials and methods
38
2.1.2 Enzymes
The effects of LAC, TYR or XYL alone and combinations of XYL with LAC or TYR were studied in this work. LAC was produced by the white rot fungus Trametes hirsuta and partially purified by anion exchange chromatography (Rittstieg et al., 2002). TYR was derived from the filamentous fungus Trichoderma reesei and overexpressed, produced, and purified as described by Selinheimo et al. (2007b). XYL was a commercial product (Pentopan mono BG, Novozymes A/S, Bagsvaerd, Denmark) originating from Thermomyces lanuginosus. LAC and/or XYL were used in Publications III and IV, and TYR in Publication IV.
2.1.3 Model doughs
Model doughs containing four different flours and water were prepared to study the effects of enzymes on the chemical and rheological properties as well as the microstructure of doughs. Detailed recipes of the doughs are presented in the respective Publications.
a) Wheat dough with and without LAC, XYL and with a combination of LAC and XYL (Publication III).
b) Whole grain oat dough with and without LAC, XYL and with a combination of LAC and XYL (Publication III).
c) Oat-wheat dough (51% whole grain oat flour and 49% wheat flour by flour weight) with and without LAC, XYL and with a combination of LAC and XYL (Publication III).
d) Endosperm oat dough with and without 10 or 30 nkat TYR/g flour (Publication IV).
2.1.4 Breads
Four different bread types were used in the study. Detailed recipes are presented in the publications referred to below:
a) Oat-wheat breads (Publications I–III). These breads contained 51% whole grain flour and 49% wheat flour by weight of the flour mixture.
b) Oat-wheat breads with sourdough (Publication II). These breads contained wheat sourdough. The wheat sourdough was prepared using a freeze-dried commercial starter, Florapan L-73, Lactobacillus plantarum (Lallemand Ltd., Blagnac, France). The breads contained 51% whole grain oat flour and 49% wheat flour by weight of the flour mixture.
c) Whole grain oat breads (Publication III). These breads contained whole grain oat flour.

2. Materials and methods
39
d) Endosperm oat breads (Publication IV). These breads contained endosperm oat flour.
2.1.5 Preparation of model doughs
The amount of water added to the doughs was determined according to farinograph water absorption at a consistency of 500 BU. LAC was added to the water immediately before mixing with the flours, and XYL was added prior to mixing of oat, wheat, and a combination of these flours. The mixing times were optimised with a plastograph (Plasti-Corder PL2100, Brabender, Duisburg, Germany) (Publication III). A 50 g farinograph bowl and z-blades were tempered to 26 °C and the doughs were mixed until the time to peak of the torque of duplicate doughs were reached. After mixing (oat doughs for 6 min, wheat doughs for 4 min, and oat-wheat doughs for 5 min), the doughs for chemical analysis were incubated at 30 °C (Panimatic PSF10, Souppes-Sur-Loin, France) for 60 min. The doughs (10 g) were then frozen immediately in liquid nitrogen and freeze-dried. The dried doughs were ground in a laboratory mill (Prolab no. 62130) for 1 min.
For the microscopic and rheological analyses performed in Publication IV, TYR (0, 10, and 30 nkat/g flour) was added to the water (amount determined by farinograph) immediately prior to mixing with the flours. The doughs were mixed with a farinograph (Brabender GmbH, Duisburg, Germany) at 25 °C for 4 min at slow speed (63 rpm).
2.1.6 Preparation of breads
The mixing time of the trials for optimization of ingredients was based on the results of previous screening tests. Other mixing times were based on the process optimization trials or farinograph and test bakings. With the oat-wheat bread doughs, the wheat dough was mixed first and the oat flour and the rest of the water or sourdough was then added before switching the mixing speed. After intermediate proofing at 28 °C, 80% RH for 12 min, the dough was divided into six 400 g pieces, rounded and moulded by hand and placed into tempered pans and proofed at 80% RH, 35 °C for 65 min. The breads were baked at 195 ºC for 30 min (Publication I). The trials for optimization of the baking process were performed according to the experimental design (Publication I). Details of the baking process for oat doughs with 100% whole grain or with endosperm oat flour with or without enzymes are presented in Publications II and IV, respectively.
Wheat sourdough was prepared by mixing a freeze-dried starter of Lactobacillus plantarum (0.1 g/100 g flour) thoroughly with the wheat flour. The amount of water added to the sourdough as well as fermenting time and temperature were according to the experimental design (Publication II). Samples of fermented sourdoughs were immediately added to the dough and part of it was frozen at -20 °C for chemical analysis.
2. Materials and methods
40
The amount of wheat sourdough added to the bread dough was according to the experimental design (Publication II). The dough contained the same ingredients as the straight dough bread recipe. The baking process is presented in more details in Publication II.
2.2 Chemical analysis
2.2.1 Acidity of sourdoughs and breads
Acidity (pH and total titratable acids, TTA) was analysed according to a standard method (Arbeitsgemeinschaft Getreideforschung e.V., 1994). Frozen samples were melted 30 minutes before analysis. Lactic acid (D+L-isomers) content was determined by using an enzyme kit (Boehringer-Mannheim GmBh, Mannheim, Germany). Filtered samples were stored at -20 °C and melted 30 minutes before determination.
2.2.2 Enzyme activity assays
The activity of LAC was measured using ABTS (2,2’azino-bis(3-ethylbenzthiazoline-6-sulphonic acid) substrate (Niku-Paavola et al., 1988). One nkat corresponds to the oxidation of 1 nmol of ABTS/sec at 25 °C and pH 4.3. The activity of TYR was measured using 15 mM l-dopa (3,4-dihydroxy-l-phenylalanine) substrate (Robb, 1984). The activity of XYL was determined using birch glucuronoxylan substrate (Bailey et al., 1992). -glucanase activity was measured using the method described by Zurbriggen et al. (1990) and a modified method of the Institute of Brewing Analysis, Committee (1982). The endoglucanase (Ghose, 1987), -amylase (Fisher & Stein, 1961), protease (Protazyme AK tablets, Megazyme International Ireland Ltd.) and glucoseoxidase (modified method of (Werner et al., 1970)) activities were also determined from the enzymes. The activities of the enzyme preparations are shown in Table 2 of Publication III.
2.2.3 Analysis of non-starch polysaccharides
The -glucan content of the doughs and breads were determined by a standard method 32-23.01 AACC International (2011) (Publications I–III). Mw of -glucan of the flours and breads was analysed after stirring 1 g of the sample overnight with a magnetic stirrer in 1 litre of 0.1 N NaOH containing 0.1% NaBH4. The samples were analysed by HPLC-SEC with Calcofluor staining using right-angle laser light scattering for detection (Suortti, 1993) (Publications I–III).
For the determination of WEAX content, aqueous extracts of non-starch polysaccharides (NSP) of the flour and dough samples were prepared according to Rouau & Surget (1994) with modifications (Publication III). The supernatant was frozen until further analysis. The carbohydrate content of the flour, dough and

2. Materials and methods
41
aqueous extracts thereof were estimated by gas-liquid chromatography (Blakeney et al., 1983). Alditol acetates were injected on a DB-225 capillary column (J6W Scientific, Folsom, CA) using inositol as the internal standard.
The apparent MW distribution of the aqueous extract components of the flour and dough samples was studied by size-exclusion chromatography (SE-HPLC) using a Waters (Millipore Co., Milford, MA) Ultrahydrogel 1000, 10 m, column (7.8 x 300 mm), with a pullulan limit exclusion 106 Da, and a Waters 410 differential refractometer was used for detection (Carvajal-Millan et al., 2005b) (Publication III).
2.2.4 Analysis of phenolic compounds
The contents of free and total monomeric caffeic, chlorogenic, p-coumaric, sinapic, and ferulic acids were analysed after alkaline hydrolysis by RP-HPLC with diode array detection with modifications (Bartolomé & Gómez-Gordovés, 1999) (Publication III). The total phenolic acids content was analysed using a 20 mg sample, which was first hydrolysed with 1.1 ml of 2 M NaOH at room temperature for 16 hours. Before extraction with ethyl acetate (3 × 2 ml), the sample was acidified with 0.7 ml of 5 M HCl. The combined ethyl acetate extract was evaporated to dryness and the residue was dissolved into 50% MeOH prior to RP-HPLC analysis on an Agilent Hypersil BDS-C18 column (4.6 × 150 mm, 5 m). The free phenolic compounds were analysed correspondingly but using water instead of NaOH and 50 l of 5 M HCl for acidification (Publication III). The linear gradient was from 5 to 95% MeOH in 1% acetic acid at a flow rate of 0.8 mL/min. Quantitation was based on calibration curves of reference substances at 324 nm. The 8-5’-coupled diferulate (benzofuran) was synthesized for use as standard for analysis of free and total DFAs.
2.2.5 Analysis of proteins
The contents of SDS-insoluble and SDS-soluble proteins of the flours were analysed using the Kjeldahl method 46-12.01 (AACC International, 2011) (Publication III). Extraction of protein and the molecular size distribution of SDS-soluble and insoluble proteins in the doughs were analysed by SE-HPLC (Dachkevitch & Autran, 1989) with modifications as described by Morel et al. (2000b) (Publication III).
The SH-content of the flours and doughs was determined using Ellman’s reagent (5,5’-dithiobis-2-nitrobenzoic acid or DTNB) as described by Morel et al. (2000a) (Publication III).
Oat protein fractions were extracted from the whole grain and endosperm oat flours. Albumin and globulin were isolated using sequential extraction as described by Mikola & Jones (2000), and prolamin was isolated according to the method of Mikola et al. (2001). The albumin was freeze-dried, and the globulin and prolamin were frozen at -20 °C. The protein content of the fractions were analysed using the Lowry method (DC protein assay, Bio-Rad, CA) with bovine serum albumin as

2. Materials and methods
42
standard. Albumin and prolamin (3 mg/ml) were suspended and treated in a 200 mM Na-citrate buffer of pH 6.0 (50 mM Na-acetate buffer, pH 5.0 was used in Publication III). 0.2 M NaCl was added to the globulin buffers. LAC and TYR (0, 100 and 500 nkat/g protein) were added to the protein suspensions and incubated. After incubation, the reaction was stopped. 12% Tris-HCl gel (Bio-Rad) was used for the albumin and globulin, and a 16–18% Tris-HCl gradient gel for the prolamin. The MW mass standard with a range of 21.5–113 kDa was used (Publications III–IV).
2.3 Microstructure of the doughs and breads
The dough cubes were prepared as described by Selinheimo et al. (2007b). Sections of 4 m were cut using a Leica rotary microtome (Heidelberg, Germany) and transferred to glass slides. The sections were stained either with protein-sensitive 0.2% Xylidine Ponceau or 0.1% Acid Fuchsin (Gurr, BDH Ltd, Poole, England) and 0.01% Calcofluor (Fluorescent brightener 28, Aldrich, Germany). Both Xylidine Ponceau and Acid Fuchsin stain proteinaceous structures red, whereas Calcofluor stains cell walls (mainly -glucan) blue. Starch remains unstained and appears black. The stained sections were examined using an Olympus BX-50 microscope connected to a PCO SensiCam CCD colour camera with Cell^P imaging software, which was also used for image analysis (Publication IV).
In order to validate the visual observations, the particle size distributions of structures stained with Xylidine Ponceau were analysed from 20 images/dough sample by classifying particles according to their area and number. A similar particle analysis of protein and cell wall structures was performed on the sections stained with Acid Fuchsin and Calcofluor (10 images/dough sample) (Publication IV).
Pieces of bread crumb were embedded in 1% agarose, fixed in 1% glutaraldehyde in a 0.1 M phosphate buffer of pH 7.0, dehydrated with ethanol, embedded in Historesin, and sectioned with a Leica microtome. For fluorescence microscopic examination, the bread sections were stained with specific fluorochromes (Fulcher & Wong, 1980, Parkkonen et al., 1994). Protein was stained with aqueous 0.1% (w/v) Acid Fuchsin, and -glucan was stained with aqueous 0.01% (w/v) Calcofluor White (Publication I).
2.4 Rheology of the doughs
The rheological properties of the doughs were measured by uniaxial extension measurements using a Kieffer dough extensibility rig fitted onto a TA.XT2 Texture Analyzer (Stable Micro Systems Ltd, Godalming, UK) and equipped with a 5 kg load cell (Publications III–IV). Kieffer tests were performed with a few modifications concerning resting times and temperatures (Kieffer et al., 1998). After mixing the doughs in a farinograph, the doughs were rounded in an extensograph (Brabender, Duisburg, Germany), divided into 4 pieces, and moulded to bars by hand to fit the press immediately after mixing. The press was transferred to a resealable polyethylene bag and was kept in an incubator at 30 °C for 20 and 60

2. Materials and methods
43
min (40 min in Publication IV) to allow stress relaxation before measurements. Large deformation rheological properties were measured for 14 replicate dough strings per enzyme dosage using a Kieffer dough extensibility rig. The crosshead speed was 3.3 mm/s. The rig’s measurement hook extends the dough string until its elastic limit is exceeded and it ruptures; thereby the maximum resistance (a peak force) and the extensibility (distance of the hook from the start point) of the dough string are recorded.
2.5 Quality attributes of the breads
After baking, the loaves were cooled for 2 h before being weighed. Specific volume was determined for six breads/bread type using a BreadVolScan scanner (Backaldrin, Aspen, Austria). Crumb hardness was measured at 2 h and 48 (Publication IV) or 72 h after baking, with a TA-XT2 Texture Analyser (Stable Micro Systems, Godalming, UK) using the Texture Profile Analysis (TPA) test. Six 25 mm thick slices were used for the analysis; two slices were taken from the middle of each of the three breads/bread type. The crust of the slices was removed so that only textural parameters from the crumb were measured. The slices were compressed by 10 mm (40%) at a speed of 1.7 mm/s. A trained descriptive sensory panel (n = 5) evaluated the characteristics of the breads (Publication I–II). Attribute intensities were rated on 5-unit, verbally anchored intensity scales. Altogether, 6–9 attributes were selected to describe the texture, mouthfeel, and flavour of the breads.
2.6 Experimental design and data analysis
2.6.1 Experimental design of the optimization trials
A fractional factorial design was used to screen the most important factors (ingredients and processing conditions) affecting the specific volume, instrumental crumb hardness and sensory properties of the breads and to choose the most significant ones and their appropriate range for optimization tests.
A central composite face-centred design (CCF) was used with two variables and four replicated experiments at the centre point, for a total of 12 experiments for optimization of ingredients. The two recipe variables optimized were gluten (G, g/100 g flour) and water content (W, g/100 g flour). A detailed description of the experimental conditions is presented in Publication I.
For optimization of process parameters, a CCF with five process variables and four replicates at the centre point was used, for a total of 30 experiments. The five process variables studied where mixing time (tm, min), intermediate proofing time (floor time) (ti, min), final proofing time (tf, min), final proofing temperature of the cabinet (Tf), and baking temperature (Tb). The experimental conditions are described in more detail in Publication I.

2. Materials and methods
44
For optimization of the sourdough process, a CCF with four variables and four replicated experiments at the centre point for a total of 24 experiments was used. The four sourdough variables studied included dough yield (DY, = (weight of sourdough/weight of flour in sourdough)*100), fermentation temperature (Tf, °C), fermentation time (tf, h), and amount of sourdough added (S, g/100 g dough). The experimental conditions are presented in detail in Publication II.
2.6.2 Data analyses for optimization trials
A CCF enabled approximation of the measured data (yobs) using a response surface model (RSM) expressed in variable equations comprising a constant, the main effect of each variable, interaction effects between variables, and square coefficients of a variable, to reveal whether any of the variables give a maximum or minimum within the experimental domain.
The results were examined by the computer program MODDE version 6.0 (Umetrics Ab, Umeå, Sweden). The RSM was estimated by partial least squares (PLS) for the 12 and 30 (Publication I) and 24 (Publication II) experiments in the CCF design. The centre point made it possible to estimate the pure error of the analyses, which was used to predict whether the models gave significant lack of fit (Carlsson, 1992). The reliability of the models was evaluated by calculating the R2 and Q2 values for each model, where R2 is the variation of the response explained by the model and Q2 is the fraction of the variation of the response that can be predicted by the model. Q2 should be > 0.5 if conclusions are to be drawn from the model (Lindgren, 1995). Generally, a model is considered excellent if R2 and Q2
exceed 0.9 (Lindgren, 1995). A verification experiment was performed to estimate the predictive capacity of the models. Optimization was first carried out on the recipe, and the optimized recipe was then used to carry out optimization of the process. The optimized recipe and process parameters were used for the sourdough optimization trials.
2.6.3 Other statistical analysis
One-way analysis of variance (ANOVA) and the Tukey test were performed to determine significant differences (p < 0.05) between different enzymatic treatments using the statistical program SPSS 17.0.1 for Windows (SPSS Inc., Chicago, IL) (Publications III–IV).

3. Results and discussion
45
3. Results and discussion
3.1 The effects of recipe and process parameters on the quality attributes of oat-wheat bread (Publication I)
Oat-wheat breads containing more than 20% oats tend to lose consumer appealing properties, such as good flavour, high volume and crumb softness. However, in the case of whole grain oat flour, at least 50% of the flour must be oat in order to obtain the required amount of -glucan in the bread for a health claim. In light of these challenges, the effects and interactions of ingredients and processing parameters on the specific volume, instrumental crumb hardness, and sensory properties of oat-wheat bread were studied using experimental design and mathematical modelling. Linear or quadratic models were obtained after estimation of RSM by PLS (Tables 5 & 6 of Publication I). A multiple response method called desirability was used for the reliable models to predict the levels of ingredients and processing parameters for optimized specific volume, softness and sensory quality of oat-wheat breads. There are no reported studies in which the quality attributes of oat-wheat bread in response to ingredients and baking process have been simultaneously studied.
3.1.1 Optimization of ingredients
The results of ingredient optimization showed that a water content of 91.5 g and a gluten content of 15.2 g per 100 g flour were required for maximal specific volume and minimal instrumental hardness (measured after 2 and 72 hours) (Table 5). The optimized sensory attributes of crust evenness and crumb moistness were also achieved with these gluten and water contents. Lower gluten content was needed for the softest bread crumb as well as lower water content for most elastic bread crumb.

3. Results and discussion
46
Table 5. Contents of gluten and water for optimized textural and sensory attributes of oat-wheat breads.
Attributes Measured min and max values
Target value Gluten, % of f.w.
Water, % of f.w.
Specific volume, ml/g 2.4–3.7 3.7 15.2 91.0–91.5
Hardness 2 h, kg 0.1–0.5 0.1 15.2 91.0–91.5
Hardness 72 h, kg 0.2–1.2 0.2 15.2 91.0–91.5
Evenness of the crust 3–4 5 (even crust) 8.3–15.2 88.0–98.0
Moistness of the crumb 3–4 3 (slightly moist) 9.0–15.2 88.0–91.5
Softness of the crumb 3–5 5 (very soft) 12.0 90.5–98.0
Elasticity of the crumb 4–5 5 (very elastic) 8.5–9.2 78.0–84.0
The results are in line with Oomah (1983), who achieved the highest bread volume by the addition of extra water to wheat-oat breads containing 10% oat flour by flour weight. Similarly, addition of gluten and water improved the volume and softness (measured after 1 and 2 days storage) of wheat-oat breads with 5–20% oat flakes by flour weight (Gormley & Morrissey, 1993). The decrease in loaf volume caused by oats or other sources of dietary fibre is probably related to the suppression of gluten development during mixing and proofing (Rudel, 1990). The suppressed gluten development may be due to the competition of water between dietary fibre and gluten (Wang et al., 2002, Saeed et al., 2011). Dietary fibre particles may also act as a physical barrier (Autio, 2006, Labat et al., 2002) and/or the interactions between fibre and gluten components may suppress gluten network formation (Wang et al., 2002, Noort et al., 2010). It is likely that a combined effect of both chemical and physical mechanisms lies behind the observed effects on gluten properties (Noort et al., 2010). If the gluten molecules remain insufficiently hydrated during mixing and proofing, the gluten bonding will be restricted. The presence of large dietary fibre molecules in the dough may also reduce the possibilities of gluten to depolymerize and re-aggregate. With optimal amounts of water and gluten, a proper gluten network may be formed. Solubilisation of -glucan and AX may also act as a hydrocolloid to strengthen gluten network and allow optimal gas expansion by the yeast action as well as gas retention in the dough during proofing and baking (Izydorczyk & Biliaderis, 2007, Wang et al., 1998).
3.1.2 Optimization of the baking process
The specific volumes of oat-wheat breads ranged from 2.6 to 3.7 ml/g, which shows the importance of processing conditions on bread quality. Final proofing of the dough at 40 °C for 75 min and baking at 210 °C resulted in the highest specific volume of oat-wheat bread (Table 6). The softest bread crumb (measured after 2 and 72 h) was obtained with the same proofing and baking conditions as for the

3. Results and discussion
47
maximal specific volume together with the shortest mixing time and intermediate proofing times.
Ingredients mainly affected the crumb properties, whereas processing affected the crust properties. Processing conditions had the most pronounced effect on the crispness and flavour of the crust. The thickness and colour of the crust as well as richness of the crumb flavour varied only slightly. Optimal flavour intensity and crust crispness were achieved with the same processing conditions as for bread volume and hardness. A long mixing time and intermediate proofing time together with shorter final proofing time resulted in well developed crust colour. Optimal crust thickness was achieved with the same processing conditions as for crust colour, although mixing time did not affect this property. A slightly lower proofing temperature was needed to obtain the richest crumb flavour. During proofing and fermentation, yeast converts sugars to carbon dioxide and alcohol. Baker’s yeast is most active at 35 to 40 °C (Cauvain, 2003). Proofing the dough at 40 °C for a slightly shorter time than is optimal for bread volume may, therefore, have resulted in more sugars being available for the Maillard reaction to develop optimal crust colour during baking. When the dough was proofed at 30 °C instead of 40 °C, more sugars remained in the dough due to lower fermentation rate, which may have contributed to the development of flavour precursors and richer flavour of the bread. During baking, the temperature inside the cooler dough rose more slowly, thus possibly extending the timeframe for formation of volatile compounds.
Table 6. Values of processing parameters for optimized textural and sensory attributes of oat-wheat breads.
Attributes Measured min and max values
Target value Mti Iti Pti Pte Bte
Specific volume, ml/g
2.6–3.7 3.7 ns ns 75 40 210
Hardness 2 h, kg
0.1–0.3 0.1 4 5 75 40 210
Hardness 72 h, kg
0.3–0.7 0.3 4 5 75 40 210
Colour of the crust
4–5 5 (not too light or dark)
7–8 20 56–71 40 210
Thickness of the crust
2–3 3 (3–4 mm) ns 16–19 68–72 40 207–210
Flavour of the crust
2–4 4 (quite intense flavour)
4–8 5–20 55–75 ns 208–210
Crispness of the crust
1–5 5 (very crisp) 4–5 5 75 40 210
Richness of crumb flavour
3–4 4 (rich flavour) 8 20 63 30 210
Abbreviations: Mti, mixing time; Iti, intermediate proofing time; Pti, proofing temperature; Bte, baking temperature.

3. Results and discussion
48
3.1.3 Optimized oat bread properties
A verification experiment was performed using an optimized regime to test the predictive potential of the PLS models. The proposed optimal conditions used for the bread are presented in Table 7. The final proofing time and temperature were slightly reduced (from 75 to 65 min and from 40 °C to 39 °C) in order to achieve optimum richness of crumb flavour and crust colour. When these proposed optimal conditions were used during a further baking test, the actual responses were found to compare quite well with the predicted responses (Table 7).
Table 7. Measured and predicted values for specific volume and hardness of the verification experiment*.
Measured value Predicted value
Specific volume (cm3/g) 3.60±0.07 3.40±0.1
Hardness (kg), 2 h 0.14±0.02 0.19±0.02
Hardness (kg), 72 h 0.29±0.04 0.44±0.04
*Gluten content 15.2 and water content 91.5 g per 100 g flour, mixing time 6 min, intermediate proofing 12 min, final proofing 65 min at 39 °C, baking temperature 210 °C.
Optimization of ingredients and processing both produced breads that were superior to the bread obtained after the preliminary screening test in terms of volume, instrumental softness and sensory properties (Figure 5). This knowledge of the effects and interactions of ingredients and processing parameters on bread quality was exploited later when oat bread with 51% oat content was developed on an industrial scale (Pielispakari Ltd., Pielisen kauraeväs). Flavour and quality are essential considerations when increasing the popularity of healthier breads among consumers.
A B C
Figure 5. Oat bread from the preliminary screening test (A), after optimization of the recipe (B) and after optimization of the process (C).

3. Results and discussion
49
3.2 Effects of wheat sourdough process on the quality parameters of oat-wheat bread (Publication II)
Wheat and rye sourdoughs are the most common sourdough types used by bakeries. The sourdough process is an additive-free bioprocessing method used to enhance the flavour, texture and nutritional properties as well as mould-free shelf-life of breads (Clarke et al., 2002, Thiele et al., 2002, Poutanen et al., 2009, Katina et al., 2006, Crowley et al., 2002, Lavermicocca et al., 2000). Rye sourdough has been shown to degrade the MW of oat -glucan (Åman et al., 2004, Degutyte-Fomins et al., 2002). As the endogenous cell wall degrading enzymes, such as -glucanase, are concentrated in the aleurone layer, the sourdough of endosperm wheat flour could provide lower -glucanase activity than whole grain rye flour. The objectives were to study whether wheat sourdough could be used to produce a new type of oat bread without compromising on taste, texture or -glucan properties.
3.2.1 Effects of sourdough parameters on the acidity of wheat sourdoughs and breads
The effects of sourdough parameters on the acidity of sourdoughs and breads are presented in Table 3 of Publication II. The pH of the sourdoughs varied from 3.8 to 4.2. The acidity range obtained by varying the DY, fermentation time, and fermentation temperature of the sourdough was in accordance with earlier studies of wheat sourdoughs started with Lb. plantarum (Clarke et al., 2002, Robert et al., 2006). Fermentation temperature had the largest effect on sourdough acidity. Increased fermentation temperature resulted in lower pH, higher TTA and lactic acid accumulation. Sourdough with lower DY and longer fermentation time also significantly increased the TTA and lactic acid concentration of the sourdoughs (p < 0.05). A positive correlation between fermentation time, temperature, and lactic acid formation of wheat sourdough with Lb. plantarum was also reported by Katina et al. (2004).
The pH and TTA of sourdough oat-wheat breads (7–39% of the total flour fermented) varied from 4.9 to 5.6 and from 4.8 to 8.1 ml (0.1 mol/l) NaOH per 10 g bread, respectively. Sourdough wheat bread had similar or slightly lower pH (4.5–5.2) when 5–20% of the total flour was fermented with Lb. plantarum, but the TTA was lower (4.1–4.6 ml (0.1 mol/l) NaOH/10 g bread) (Clarke et al., 2002, Hansen & Hansen, 1996). This reflects the higher ash content of oat-wheat bread. The typical value of TTA for white wheat bread is below 6, and for mixed wheat bread between 6–8 ml (0.1 mol/l) NaOH per 10 g bread (Arbeitsgemeinschaft Getreideforschung e.V., 1994). A positive correlation between sourdough content and bread acidity was observed, which is in agreement with the work by (Crowley et al., 2002).
3.2.2 Effects of sourdough parameters on the bread characteristics
The maximal specific volume and minimal instrumental hardness (measured after 2 and 72 hours) of sourdough oat-wheat bread was obtained when a slack

3. Results and discussion
50
sourdough was fermented at 40 °C for 18–20 h before addition to the bread dough (10 g sourdough/100 g dough) (Table 8). The acidities of these breads were lower than with other sourdough conditions studied. Furthermore, in wheat breads, a higher sourdough fermentation temperature and lower sourdough content enhanced the specific volume and softness of the breads (Katina et al., 2006, Crowley et al., 2002). A long fermentation time of sourdough improved the softness of oat-wheat bread after 3 days storage, as also observed in sourdough wheat breads (Katina et al., 2006). The specific volume and hardness of the optimized sourdough bread corresponded to the values obtained for straight dough breads (Figure 4 of Publication II). This is in accordance with Dal Bello et al. (2007), Hansen & Hansen (1996), and Robert et al. (2006), who compared the volumes of white wheat breads fermented with Lb. plantarum to corresponding straight dough breads, and De Angelis et al. (2007), who compared the volume of wheat bread that contained oat fibre and wheat sourdough to corresponding straight dough bread. On the other hand, Clarke et al. (2002) reported increased volume of white wheat bread that was fermented with Lb. plantarum when compared to corresponding straight dough bread. The same instrumental hardness of wheat breads with or without sourdough was also reported by Corsetti et al. (1998, 2000) whereas Dal Bello et al. (2007) obtained significantly softer wheat breads with than without sourdough.
Table 8. Values of sourdough processing parameters for optimized textural and sensory attributes of oat-wheat breads.
Attributes Measured min and max values
Target value DY* Tf tf S
Specific volume, ml/g 2.9–3.5 3.5 300 40 18 10
Hardness 2 h, kg 0.1–0.3 0.1 228 40 ns 12
Hardness 72 h, kg 0.3–0.7 0.3 258 40 20 10
Crumbliness 2–3 2 (only a few crumbs) 300 40 ns 36
Intensity of the crumb flavour
3–4 4 (quite strong flavour)
ns 38 ns 36
Sourness of the crumb
1–3 3 (quite sour) 300 26 20 36
Pungent flavour 1–2 1 (not at all pungent) 200 ns 20 15
Intensity of the aftertaste
1–3 1 (no aftertaste) 200 37 20 10
*Abbreviations: DY, dough yield; Tf, fermentation temperature; tf, fermentation time; S, amount of sourdough in dough; ns, not significant
During sourdough fermentation, lactic acid bacteria produce organic acids from different sugars. This acidification improves the swelling and solubility of gluten, solubility of AX, and water-binding capacity of starch granules. At least part of

3. Results and discussion
51
these changes are due to the acidity-induced activation of enzymes present in wheat flour (Arendt et al., 2007, Katina et al., 2007, Hammes & Gänzle, 1998). Clarke et al. (2002) showed that acidity and proteases solubilise gluten, thus increasing the softness of the dough. This may have positive or negative effects on the volume and staling rate of the sourdough bread, depending on the degree of acidity and degradation of gluten (Gänzle et al., 2008). Additionally, sourdough may affect the water distribution and modify the physicochemical properties of gluten, starch and polysaccharides during mixing, proofing and baking of the dough. It may be hypothesized that the high acidity of sourdough increased proteolysis, which, in turn, significantly decreased the volume and softness of the bread, while no detrimental effects on the texture of oat-wheat bread were detected when optimized sourdough producing mild acidity in the dough was used.
The sourdough conditions for highest perceived sourness (Table 8) correlated positively with the highest acidity of the bread (Figure 2 of Publication II). In both cases, the amount of sourdough was the main factor determining sourness and acidity. A high fermentation temperature and long fermentation time clearly increased the proteolysis and acidification of sourdough. Use of a high amount of wheat sourdough in baking increased the acidity and formation of aromatic compounds due to acidification, proteolysis and formation of volatile compounds in sourdough, and resulted in strong perceived acidity of the subsequent wheat bread (Katina et al., 2006). All of the sourdough parameters produced satisfactory sensory qualities in the oat-wheat bread, which had an intense crumb flavour without excessive sourness, pungent flavour, aftertaste or crumbliness (Table 8). The sourdough content of the dough was the most important parameter affecting these taste attributes, whereas the crumbliness of bread was affected most by DY. The sourdough conditions for most optimal specific volume and hardness (DY300, fermented at 40 °C for 20 h, 10 g sourdough/100 g dough) were used to predict the sensory attributes at this point. The most optimal sensory values for crumbliness and intensity of flavour (2 and 4, respectively) were obtained also with these sourdough parameters. The sourness was slightly lower (2 instead of most optimal 3), and pungent flavour as well as aftertaste intensity were slightly higher (2 instead of 1). This means that the sourdough conditions that produced oat-wheat bread with highest specific volume and softness had a strong crumb flavour without excessive sensory sourness. The sensory scores of the optimised sourdough oat-wheat bread were compared to the earlier results obtained by Katina et al. (2006) and Hansen & Hansen (1996) for optimised sourdough wheat bread started with Lb. plantarum. The intensity of flavour of oat-wheat bread was perceived as 74%, pungent flavour as 28% and aftertaste 28% of the maximal score, while the corresponding values for wheat bread were 70, 36, and 32% of the maximal score of the sensory scale (Katina et al., 2006). The perceived sourness of the oat-wheat breads was slightly lower (24–56%) than in the wheat breads reported by Hansen & Hansen (1996) (16–81% of the maximal score), although the sourdough content of the oat-wheat breads was higher than that of the wheat breads (7–39% of the total flour in our oat-wheat breads was used in

3. Results and discussion
52
the sourdough, whereas 5–20% of the flour in the wheat breads of Hansen & Hansen (1996) was used in the sourdough).
Comparison of the sourdough and straight dough oat-wheat bread demonstrated that optimized sourdough bread could be developed without detrimental effects on the quality of the oat-wheat bread (Figure 4 of Publication II). Mathematical modelling of the parameters affecting the sensory properties of oat-wheat bread showed that ingredients had the biggest effect on the textural properties of the crumb, while processing had the biggest effect on the crust, and sourdough had the biggest effect on the intensity of bread flavour (Tables 5 and 6 of Publication I and Table 4 of Publication II).
Additionally, the combination of wheat sourdough and oat ingredient could be a potential means to reduce the GI of wheat bread (De Angelis et al., 2007), providing an additional health-promoting factor for this bread type.
3.3 The content and molecular weight of -glucan in straight dough and sourdough breads (Publications I and II)
Wheat sourdough parameters did not significantly affect the content of -glucan in oat breads (Table 3 of Publication II). The -glucan of optimized sourdough oat-wheat bread was compared to the corresponding straight dough bread. The -glucan content was 2.4–2.7 g per 100 g bread (d.w.), and the Mw of the -glucan was 0.5 million for both sourdough and straight dough oat breads, while the Mw of the oat flour was 1.0 million (Table 5 of Publication II). This indicates that wheat sourdough fermented with Lb. plantarum L-73 did not cause further -glucan degradation. The -glucan degraded only during the proofing and baking phase, with no effect of sourdough acidity on the -glucan, which explains the same content and Mw of -glucan in both straight and sourdough oat-wheat breads.
The amount of -glucan in fresh bread was 1.5±0.1 g per 100 g. This means that a portion (2 slices, á 34 g) of the bread contains 1.0 g -glucan. This fulfils the requirements for a cholesterol-lowering health claim authorised by the European Commission if consumers are also informed that the beneficial effect is obtained with a daily intake of 3 g of oat beta-glucan (European Commission, 2011).
In addition, the physicochemical properties of oat -glucan should also be considered when assessing the cholesterol-lowering ability of oat products (Wolever et al., 2010, Åman et al., 2004, Wood, 2007). The LDL-cholesterol-lowering effect of -glucan was shown to depend on viscosity, which is controlled by the MW and amount of oat -glucan solubilized (Wolever et al., 2010). The subjects received ready-to-eat wheat-bran cereal or oat bran cereal providing a total of 3 or 4 g -glucan per day with high, medium or low MW -glucan. LDL-cholesterol was significantly less with oat bran cereal (3 g -glucan with peak MW of 500,000) than with wheat-bran cereal (0.5 g -glucan with peak MW of 40,000). No significant effect on LDL-cholesterol was observed with oat bran cereal when 4 g of -glucan with a peak MW of 200,000 was consumed (Wolever et al., 2010).

3. Results and discussion
53
The MW of -glucan in oat breads and muffins has been shown to be smaller than in oat flour or bran (Beer et al., 1997, Kerckhoffs et al., 2002, Åman et al., 2004, Kerckhoffs et al., 2003). Degutyte-Fomins et al. (2002) observed a decreased Mw of -glucan in oat slurry with rye or rye sourdough when compared to oat slurry alone. This was assumed to be due to the endogenous enzyme activity of rye, which degraded part of the -glucan into smaller molecules. Åman et al. (2004) also reported both a decreased Mw and amount of -glucan in oat-wheat bread with oat-rye sourdough when compared to corresponding straight dough bread without rye. Regand et al. (2009) also observed significantly decreased MW of -glucan in oat crisp bread containing rye bran and whole grain wheat.
It may be postulated that the endogenous enzyme activity of whole grain rye or wheat is higher than the enzyme activity of endosperm wheat flour. Additionally, the incorporation of oats together with rye in the sourdough could provide a twofold potential for oat -glucan to be degraded – during sourdough fermentation by rye enzymes, and during the proofing and baking phase by wheat enzymes.
Törrönen et al. (1992) prepared oat breads without wheat for clinical studies. They did not detect any changes in Mw of -glucan during baking or storage. This indicates that -glucanase from wheat could be the main reason for degradation of high MW -glucan during baking (Åman et al., 2004) and/or depolymerization of -glucan by ascorbic acid-induced oxygen radicals present in the wheat flour (Kivelä et al., 2009). Kerckhoffs et al. (2003) did not gain a LDL-cholesterol-lowering effect in mildly hypercholesterolemic subjects even though the daily dose of -glucan from oat bread and biscuits was 5.9 g. The Mw or peak MW of -glucan in their oat bran-wheat bread was not reported, but the MW distribution was 15% high-MW (> 1 mill.), 30% medium-MW (0.25–1.0 mill.), and 55% low-MW (< 0.25 mill.). If all of the -glucan in the medium-MW proportion was near to 250,000, then the daily dose of -glucan of MW > 500,000 could have been only 0.9 g, thus reducing the ability of bread to produce enough viscosity in the gut.
Microstructural analysis of the oat breads showed that the -glucan was located mainly in insoluble form in the cell walls of large bran particles (Figure 3 of Publication I). It appears that the use of coarse flour is advantageous for protection of -glucan from enzymatic degradation. Hydration of large particles is slower than hydration of small particles, and the complex structure and thickness of the cell walls slow the solubilisation of -glucan and other cell wall polymers. Åman et al. (2004) found that large particle size of oat bran and short fermentation time limited -glucan degradation during baking.
The mixing method probably affects the distribution of water between wheat and oat flour components. This may have had a protective effect against degradation of high molecular level -glucans, because the oat flour was incorporated into the dough with slow mixing speed after formation of a proper gluten network with fast mixing speed. The degrading effect of -glucanase and mixing might have been stronger if all of the ingredients had been mixed at the same time at fast speed. Long fermentation of the dough at high temperature could have activated the -glucanase of the wheat flour and degraded part of the -glucan. The incorporation of oat groat or grain instead of oat flour into the bread dough or inactivation of the

3. Results and discussion
54
-glucanase of wheat flour are potential solutions for further reducing the degradation of -glucan during the processing of oat bread.
3.4 Comparison of chemical properties of oat and wheat flours and doughs (Publication III)
The chemical properties of whole grain oat flour, endosperm oat flour and endosperm wheat flour were compared first to study the amount and type of most probable substrates of these flours for xylanase, laccase and tyrosinase. These enzymes mainly affect water-soluble non-starch polysaccharides (WSNSPs), phenolic acids and proteins of wheat and oats. Firstly, changes in these compounds during the flour-to-dough stage were monitored to understand their role in dough formation. Secondly, the influence of enzymes on the dough matrix was studied. This approach clarified the overall alterations in the chemical profile from flour to dough and enzyme-modified dough.
The AX and WEAX contents of whole grain oat and endosperm wheat flours are presented in Table 4 of Publication III. The WEAX content of oat flour was lower (0.1% of d.w.) than obtained by Frölich & Nyman (1988) and Westerlund et al. (1993) (0.3–0.4% of d.w.); otherwise the values were similar to those presented in Table 2. Mixing and incubation of the oat dough increased the relative amount of WEAX significantly when compared to the WEAX content of the corresponding flour. Disaggregation of weakly bound AX chains in the cell walls by a temperature increase or mechanical action is proposed to increase the hydrolysis of AX (Trogh et al., 2004, Rouau et al., 1994, Cleemput et al., 1997, Dornez et al., 2007).
The MW distributions of WSNSPs of flours and doughs are presented in Figures 1 A–D of Publication III. The changes in MW of oat WSNSPs were due to changes in both AX and (1 3,1 4)- -D-glucan populations. The peak MW of WSNSPs of oat flour increased and shifted from 300,000–500,000 to 500,000–800,000 in dough, indicating an increase in the size and amount of WEAX and water-soluble -glucan during mixing and incubation. The significant increase in WEAX content from oat flour to incubated dough was in accordance with these results. Because of the low (1 3,1 4)- -glucan content in wheat flour, variations in HPSEC profiles can be attributed to AX. Preparation and incubation of wheat dough increased the proportion of WSNSPs with MW < 20,000 (Figure 1 C, black line of Publication III) when compared to the MW curve of wheat flour (Figure 1 A, red line of Publication III), thus also suggesting a slight increase in WEAX content. The total -glucan contents (about half of it water-soluble) of oat, wheat, and oat-wheat doughs were 5.2, 0.2 and 2.9% of d.w., respectively (Table 4 of Publication III).
The most abundant phenolic acids both in the whole grain oat and the endosperm wheat flours were FA (250 and 97 mg/kg d.w.), sinapic acid (36 and 22 mg/kg d.w.), and 8-5’ DFA (benzofuran) (23 and 5 mg/kg d.w.). The results are in line with Mattila et al. (2005), except that their study obtained a higher content of DFAs than sinapic acid, because DFAs were determined semiquantitatively. Only the contents of free and total FA were significantly affected by the enzymes, and

3. Results and discussion
55
are thus presented in Figures 2 A and B of Publication III. The values obtained correspond with those previously reported (Zielinski et al., 2001, Mattila et al., 2005, Peyron et al., 2002). However, Zielinski et al. (2001) and Sosulski et al. (1982) determined lower levels of free FA in oat flour (1.5–2.4 mg/kg) than was obtained in the present study (9 mg/kg) (Sosulski et al., 1982, Zielinski et al., 2001). Hydrothermal processing by means of steaming the grain may liberate phenolic acids and their derivatives from the wall cells (Zielinski et al., 2001). The amount of total 8-5’ DFA (benzofuran) in oat flour was significantly (p < 0.05) higher than in wheat flour (23 and 5 mg/kg d.w., respectively). The amount of free 8-5’ DFA did not differ significantly between the flours.
Mixing and incubation did not significantly affect the content of SH-groups in oat dough (0.53 mol SH/g flour), thus 92% of the initial flour SH remained in the dough (Table 5 of Publication III). The behaviour of oat proteins during baking is poorly studied, but it is known that 70–85% of oat proteins consist of globulins, which do not form a protein network comparable to gluten, which, in turn, are the main proteins (70–80%) of wheat. Furthermore, heat treatment (kilning and steaming of oat before milling in order to inactivate lipase) may affect the behaviour of oat proteins and endogenous oxidases present in oat grain. The amount of SH-groups in wheat dough was only 14% of the original content of SH-groups in flour (0.77 mol/g) (Table 5 of Publication III), indicating a strong thiol-oxidising mechanism during dough mixing and incubation, probably also due to ascorbic acid present in commercial wheat flour. The amount of SH-groups in oat and wheat flour did not differ significantly. The SH-groups in the mixture of oat-wheat flour decreased to the same level as in wheat when mixed with the dough. It may be hypothesized that the ascorbic acid and/or endogenous oxidative enzymes present in wheat flour could also oxidize the SH groups present in oat flour during mixing and incubation.
3.5 Effects of laccase, tyrosinase and xylanase on the oat, wheat and oat-wheat doughs (Publications III and IV)
3.5.1 Effects of enzymes on the non-starch polysaccharides of doughs
The impact of LAC (dosage 14 nkat/g flour) and XYL (dosage 46 nkat/g flour) treatments on the chemical composition of oat dough was first investigated. A significant decrease in the amount of WEAX (14%) and increase in the ratio of arabinose/xylose in WEAX (12%) was detected in oat dough treated with LAC (Table 4 of Publication III). LAC alone and together with XYL significantly decreased the amount of total and free FA of oat dough (Figure 2 A, B of Publication III). This was apparently due to cross-linking of WEAX and concomitant decrease in the water-extractability of the AX to WUAX. However, LAC alone or together with XYL did not increase the amount of free or total 8-5’-DFA (benzofuran). This could indicate the formation of other FA dimerisation products that were not detectable by the assay. The size of WSNSPs decreased (from MW 400,000–800 000 to

3. Results and discussion
56
100,000–200,000) and the amount of WSNPs slightly increased when compared to control dough (Figure 1 B of Publication III). Because the -glucan content of oat dough was higher than the AX content, it may be postulated that more -glucan than WEAX was present in the WSNSPs of oat dough. Because LAC decreased the amount of WEAX, the higher peak MW of WSNSPs in LAC-treated dough is probably caused by -glucan (Figure 1 B of Publication III). A minor side activity of -glucanase in LAC preparation (2.3 nkat/ml, corresponding to 0.08 nkat/g -glucan in oat dough) may be the reason for a small but significant (p < 0.01) decrease in the Mw of total -glucans of oat dough from 1 million in untreated oat dough to 0.9 million in LAC-treated oat dough (Figure 6). The -glucanase activity might have mainly changed the MW distribution of easily water soluble -glucans and thus affected a decrease in molecular size and slight increase in the amount of water soluble -glucans (Figure 1 B of Publication III). It may also be possible that the formation of free radicals by laccase may have undergone further non-enzymatic reactions with -glucan resulting in slight degradation of -glucan (Kivelä et al., 2012, Flurkey, 2003).
Figure 6. The weight-average molecular weight of -glucan in oat doughs with or without LAC (n = 14).
Surprisingly, XYL alone decreased the total FA content of oat dough by 18%, without a concomitant increase in free FA (Figure 2 B of Publication III) or free or total 8-5’-DFA (benzofuran form). The reason for this remains to be studied, but one explanation could be non-enzymatic oxidation reactions. Despite heat-treatment of whole grain oats to inactivate lipase-degrading enzymes, some autoxidation of lipids may still occur during storage of whole grain oat flour (Molteberg et al., 1996). Phenolics of oats have an antioxidative capacity against rancidity (Peterson, 2001). The degradation of oat AX by XYL during mixing and incubation may have enhanced the susceptibility of FA to antioxidant reaction with lipid peroxyl radicals, resulting in ferulate radicals. Two ferulate radicals may have
800000
840000
880000
920000
960000
1000000
1040000
1080000
Oat dough Oat dough+lac
Mw

3. Results and discussion
57
then been coupled to form a diferulate (Masuda et al., 2006), which was not detectable by the assay used in this study. Although XYL treatment increased the WEAX content of oat dough by 45%, it increased the amount of WSNSPs only slightly (Figure 1 B of Publication III). This may indicate that WSNSPs consisted mostly of -glucan, which was not affected by XYL. When LAC and XYL were added together, the WSNSP content decreased more than with LAC alone. By degrading AX from insoluble cell walls to WEAX, XYL may have enhanced the accessibility of -glucanase from LAC preparation to -glucan molecules resulting in a higher amount and smaller molecular size of water soluble -glucans.
LAC did not affect the WEAX content of wheat dough after 60 min of incubation (Table 4 of Publication III). Labat et al. (2000) observed an increase in WEAX content (from 26 to 28% of total AX) of LAC-treated wheat dough at peak mixing time, i.e. when maximum consistency of the dough was reached, followed by a decrease to 23.5% of total AX after 30 min mixing (Labat et al., 2000). The higher dosage of LAC (30 nkat) and longer mixing time used by Labat et al. (2000) may have favoured the formation of a higher proportion of cross-linked AX and reduced WEAX content, while in our case, a lower dosage of LAC (14 nkat/g flour) was not sufficient to oxidize WEAX completely. However, an increased amount of high molecular size WEAX (MW > 800,000) of wheat dough was obtained, as can be seen from the elution peak between 7 and 8 minutes (Figure 1 C of Publication III). This could be cross-linked WEAX formed by LAC. However, no significant effects of LAC on free or total FA or 8-5’-DFA (benzofuran) contents were detected, indicating that only a limited amount of DFA cross-linking was formed (e.g. 8-5’-(decarboxylated), 8-8’-, and/or 8-O-4’- DFA).
XYL treatment increased the amount of WEAX significantly in wheat dough (Table 4 of Publication III), as has been reported also by (Rouau et al., 1994, Courtin et al., 2001). Degradation of WEAX and WUAX resulted in a higher proportion of smaller WEAX with MW up to 200,000 in wheat dough (eluted after 13 min) (Figure 1 C of Publication III). This was also observed when LAC and XYL were added together in the wheat dough as well as a small peak of high molecular size WEAX at MW 800,000 (Figure 1 C of Publication III).
As expected, the WEAX contents of oat-wheat doughs with LAC, XYL and combination of the enzymes were lower than in wheat but higher than in oat doughs. The molecular weight distribution of WSNSPs of mixed oat-wheat doughs (Figure 1 D of Publication III) resembled more the elution profile of wheat than oat dough, because the content of WEAX originating from wheat was higher than that of oat in this dough. LAC increased the content of WSNSPs with molecular weight between 600,000 and 10,000 when compared to the control (Figure 1D of Publication III). Because the WEAX content did not change significantly (Table 4 of Publication III), the observed increase in WSNSPs was possibly caused by degradation of insoluble -glucan of oat to water-soluble -glucan by -glucanase side-activity present in LAC preparation. In contrast to wheat dough, the formation of high MW WEAX was not detected by LAC in this dough. It is likely that the high content of other WSNSPs than wheat WEAX in the oat-wheat dough hindered the cross-linking of wheat WEAX. When LAC and XYL were added together to the

3. Results and discussion
58
dough, degradation of WUAX of wheat and oat to doubled content of WEAX enabled more -glucan to be degraded by the side-activity of -glucanase in LAC preparation. The combined effects of these enzymes resulted in the highest amount of WSNSPs with MW 400,000.
The effects of the TYR treatment on different flour components, i.e. protein, cell wall (e.g. -glucan) and starch, were studied by microscopy. Acid Fuchsin stains proteinaceous structures red, whereas Calcofluor stains cell walls (mainly -glucan) blue. Starch remains unstained and appears black. TYR affected the cell walls, which consist mainly of -glucan in oat. The count and area of particles (of diameter 10–1000 m2) dyed with Calcofluor decreased significantly (p < 0.05) as the dosage of TYR increased (slides 3 A–C, Figure 2 of Publication IV). This may reflect a slight degradation of cell walls by the side-activities of XYL and -glucanase in the TYR preparation.
3.5.2 Effects of enzymes on the proteins of doughs
In oat dough, the ratio of SDS-insoluble proteins/total proteins was not affected by LAC (Table 5 of Publication III). The amount of middle-size SDS-soluble proteins (630–65 kDa) increased and small-size SDS-soluble proteins (< 65 kDa) decreased as a result of LAC treatment in oat dough (HPSEC, unpublished results). LAC decreased 55% of the SH-groups (and increased middle-size soluble proteins) present in oat dough. It is likely that the oat dough contained sufficient amounts of free FA for LAC to form phenoxy radicals, which in turn led to disulfide bonds between proteins and low Mr thiols, as proposed in wheat dough with added LAC and FA (Labat et al., 2000, Labat et al., 2002). These disulfide bonds were not formed in control dough. No novel subunits of proteins could be detected on reduced SDS-PAGE (Figure 3 of Publication III). The decreased amount of SH-groups, increase in middle size SDS-soluble proteins and absence of novel subunits in reduced SDS-PAGE indicated that polymerization of globulins by LAC was mainly caused by disulfide linkage formation. The use of non-reducing conditions in SDS-PAGE may have confirmed these results. As XYL did not affect the thiol content of the dough, the reduced thiol content of the oat dough with a combination of enzymes was therefore caused by LAC.
LAC alone and together with XYL significantly decreased the ratio of SDS-insoluble proteins/total proteins (mainly GMP) of wheat doughs (Table 5 of Publication III). The decrease in the ratio of insoluble proteins to total proteins was 27% for LAC and 34% for the enzyme combination. This result is in agreement with the observations of Labat et al. (2000, 2001) and could be due to the acceleration of thiol-disulfide interchange during mixing, leading to an earlier depolymerisation of the GMP during mixing than in the control wheat dough. LAC treatment did not affect the SH-groups present in wheat dough (Table 5 of Publication III). When wheat flour and water are mixed together, formation of the gluten network starts after hydration of the gluten proteins. Different mechanisms have been proposed to explain the depolymerization of the dough proteins during

3. Results and discussion
59
mixing. Don et al. (2005) have shown that mixing shear stress disrupts the GMP particles, which then reassemble during dough rest (Don et al., 2005). Shear stress would disrupt disulfide bonds, which could further form inter-chain disulfide bonds by oxidation of their thiol groups during mixing and incubation. Thus, only 13% of the free SH-groups were left in the control wheat and oat-wheat doughs when compared to the original content of free SH-groups in wheat flour (Table 5 of Publication III). Formation of the gluten network is affected by the properties of wheat, mixing shear stress, addition of oxidants, and endogenous oxidases naturally present in wheat flour. The reaction of phenoxy radicals resulting from LAC activity is limited due to a lack of mobile phenolic acids in endosperm wheat flour. Thus, there may be less opportunity for phenoxy radicals to oxidise the remaining protein thiol groups into disulfides. According to Figueroa-Espinoza et al. (1998) and Labat et al. (2000) LAC did not affect SH oxidation of wheat dough without added FA. With added FA the SH oxidation increased 47% when compared with control dough (Labat et al., 2000). This was probably due to the production of mobile thiol radicals through displacement reaction from phenoxy radicals to SH groups. Thiol radicals could have partially blocked the reformation of protein inter-chain disulfide bonds in favour of disulfide between proteins and low Mr thiols. Therefore, the depolymerization of glutenin polymers associated with mixing was not compensated by reformation of the disulfide bonds between protein chains (Labat et al., 2000). This proposed mechanism could also explain why the ratio of SDS-insoluble proteins/total proteins in LAC-treated wheat dough was reduced in our study.
As in wheat dough, LAC alone and in combination with XYL decreased the ratio of SDS-insoluble proteins/total proteins also in oat-wheat dough by 11% and 8%. Unexpectedly, XYL also decreased the content of SDS-insoluble proteins/total proteins of oat-wheat dough by 16%. Either XYL degraded WUAX entrapped in the protein network, or the degradation of WUAX in the dough increased the accessibility of solvent to SDS-soluble proteins.
The ability of TYR to cross-link isolated oat protein fractions was studied by SDS-PAGE analysis and compared to the LAC-treated oat proteins. TYR was able to cross-link the globulins of oat effectively, as visualized by the formation of higher MW products in the gel (Figure 1 of Publication IV). The efficiency of cross-linking increased as a function of the TYR dosage (Figure 1, lanes 5 and 6 of Publication IV). Reduced SDS-PAGE did not show any effect of LAC on globulins. Neither TYR nor LAC affected the subunits of albumins or prolamins in reduced SDS-PAGE (data not shown). Similar results with LAC- and TYR-treated wheat proteins have been reported (Selinheimo et al., 2007b). TYR (100 nkat/g protein) was clearly more effective in cross-linking wheat gliadins than LAC (cross-linking was detected only at a dosage of 10,000 nkat/g protein) (Selinheimo et al., 2007b). Oat globulin contains 2.4% tyrosine residues for potential enzyme oxidation (Lasztity, 1998). One explanation could be that the quinones produced by TYR might react non-enzymatically with tyrosyl, cysteinyl and lysyl residues of proteins, resulting in the formation of covalent tyrosine-tyrosine, tyrosine-cysteine or tyrosine-lysine cross-links (Takasaki et al., 2001, Burzio et al., 2000, Bittner,

3. Results and discussion
60
2006). On the other hand, TYR has been reported to be a poor substrate for LAC (Mattinen et al., 2005), which may explain the differences observed in reduced SDS-PAGE gels of LAC or TYR-treated oat globulins.
The effects of TYR treatment on different flour components, i.e. protein, cell wall (e.g. -glucan) and starch, were studied by microscopy using two different staining procedures. The proteins were stained red with 0.2% Xylidine Ponceau (slides 1 A-C, Figure 2 of Publication IV). Comparison of control dough with TYR-treated dough (30 nkat TYR/G flour) showed that the dough proteins were predominantly affected by the TYR, visualised as the formation of larger red areas (slide 1 C, Figure 2 of Publication IV). The count and area of protein particles with sizes between 100 and 1000 m2 (false-coloured blue in slides 2 A-C) of the dough with 30 nkat TYR/g flour were significantly (p < 0.05) higher than in the control dough (Figure 3 of Publication IV). On the basis of the results of SDS-PAGE and microscopic analysis, it is suggested that these blue areas are probably aggregated globulins formed by TYR-induced cross-linking between the oat proteins.
3.5.3 Effects of enzymes on the rheological properties of the doughs
Prolonged incubation (from 20 to 60 min) significantly decreased (p < 0.05) the resistance to stretching (Rmax) of all doughs except doughs with XYL or oat dough with a combination of enzymes (Figure 4 A–C). Incubation of doughs from 20 to 60 min also increased the extensibility of the control wheat dough, whereas the extensibility of other doughs was not affected by incubation time. This is in accordance with Selinheimo et al. (2006), who observed softening of LAC-treated wheat dough during incubation from 15 to 45 min (Selinheimo et al., 2006). However, the degree of softening of the control wheat dough during incubation was minimal (Selinheimo et al., 2006). Different wheat flour, incubation temperature (21 °C instead of our 30 °C), and incubation time (45 min instead of 60 min) may be possible reasons for the observed differences in control doughs. Besides hydration and relaxation of the macromolecular network of dough after mixing and during incubation, also the endogenous enzymes of wheat, for example XYL, start to solubilize AX during resting (Dornez et al., 2007), which could cause softening of the dough.
Oat dough has very poor viscoelastic properties, as can be seen from small changes in resistance to extension and its very low extensibility, and thus the effects of enzymes on dough rheology remained very small (Figure 4 A). Because endogenous enzymes are inactivated in flour milled from kiln-dried oats, the softening of oat dough during incubation may be mainly due to hydration of dough components, as can be seen from the slight increase in WEAX content of dough when compared to the WEAX content of flour (Table 4 of Publication III). Higher resistance to extension was observed with XYL-treated oat dough than control oat dough after 60 min incubation. Because XYL doubled the WEAX content with slightly increased content of WSNSPs, it may have increased the viscosity and

3. Results and discussion
61
tightened the dough. When XYL and LAC were added together in the oat dough, it was softer after 20 min incubation than other oat doughs, but after 60 min higher softness and extensibility were observed than with XYL-treated oat dough. By degradation of WUAX, XYL enabled more -glucan to be degraded from the cell walls by the small amount of -glucanase side activity present in LAC preparation, leaving the dough softer and more extensible than XYL-treated oat dough.
LAC significantly increased the resistance to stretching (Rmax) of wheat dough when compared to other wheat doughs, and reduced extensibility (Ex) when compared to control or XYL-treated wheat doughs (Figure 4 B of Publication III). As LAC decreased the ratio of SDS-insoluble proteins/total proteins, and no effect on free SH groups could be detected in wheat doughs, cross-linking of WEAX to a small amount of WUAX and high MW WEAX could provide an explanation for the rheological changes observed. High MW WEAX formed in LAC-treated dough has a higher viscosity and could have tightened the structure of the dough and thus increased the Rmax and reduced Ex of the dough. The reduction in Rmax between 20 and 60 min incubation times was more pronounced in LAC-treated dough than in control dough. It can be postulated that LAC cross-links WEAX and forms high MW WEAX and a small amount of WEAX-derived WUAX. This increases the initial Rmax. During incubation, endogenous xylanases also depolymerize part of these large WEAX polymers. This could cause a greater drop in Rmax of LAC-treated dough incubated for 20 to 60 min than depolymerisation of smaller WEAX polymers in control dough incubated for 20 to 60 min. XYL softened wheat dough only after 20 min incubation, but after 60 min incubation, the Rmax was the same as for control dough (Figure 4 B of Publication III). Similar results have been previously reported with a dosage of 50 nkat/g flour of the same XYL, while higher dosages softened the dough significantly (Selinheimo et al., 2007b). Primo-Martin et al. (2003) also detected no significant effects of LAC or XYL or their combination on the Rmax or Ex of wheat dough, when compared to the control after 60 min incubation. This could indicate higher activity of added XYL already at mixing stage of dough preparation, while endogenous xylanases hydrolyse AX mainly during incubation of the wheat dough (Dornez et al., 2007). When LAC and XYL were added together in the wheat dough, the role of LAC seemed to dominate the rheological properties, as the Ex of the dough was reduced.
LAC did not affect Rmax in oat-wheat dough when compared to control dough. No such changes in MW distribution as in wheat dough by LAC were recognized, and the amount of WEAX was smaller than in wheat dough. XYL increased the softness of the dough also after 60 min incubation when compared to the control dough, while in wheat dough the effect was significant only after 20 min incubation. Besides doubled WEAX content, this can be explained by smaller endogenous XYL activity of the oat-wheat control dough than of wheat dough. A combination of the enzymes in oat-wheat dough resulted in the softest dough. XYL catalysed the hydrolysis of WUAX in the wheat and oat of oat-wheat dough, and resulted in a doubled amount of WEAX. Thus, more -glucan was degraded from insoluble cell walls by the side-activity of -glucanase in LAC preparation,

3. Results and discussion
62
improving the softness of the dough. The Ex of the oat-wheat dough was affected by neither of the enzymes used.
TYR increased the hardness of the oat dough, as indicated by an increase in Rmax (Figure 4 A of Publication IV). A similar result has been reported in wheat dough with TYR (Selinheimo et al., 2007b). The SDS-PAGE assay showed that the oat globulins were significantly affected by TYR, which could explain the hardening of the oat dough by TYR. LAC neither affected oat globulins nor the Rmax (Figure 1 of Publication IV and Figure 4 of Publication III). Microscopic examination confirmed an aggregation of the oat proteins caused by TYR (Figure 3 of Publication IV). Addition of 30 nkat TYR/g flour resulted in a softer oat dough than the dough with 10 nkat TYR/g four, but harder than the control dough (Figure 4 A of Publication IV). Such an effect has not been detected with TYR-treated wheat dough or with LAC-treated oat dough (Renzetti et al., 2010, Selinheimo et al., 2007b). The higher aggregation of proteins with higher dosage of TYR may have increased the redistribution of water from proteins to -glucan. The increased mobility of -glucan may have increased the softness of the oat dough. Renzetti et al. (2010) observed increased softening of oat dough with increasing dosage of LAC, which was assumed to be due to the -glucanase side activity of the LAC preparation. TYR with a dosage of 30 nkat/g flour contained low side activities of XYL and -glucanase corresponding to 1.26 and 0.24 nkat/g flour, respectively. It is possible that the softening of oat dough at higher TYR dosage was due to the side activity of -glucanase, but that this did not overcome the effect of protein cross-linking, since the dough was still significantly harder than the control dough. Similarly to LAC, the TYR did not affect the Ex of the dough. By contrast, TYR has been reported to decrease the Ex of wheat dough (Selinheimo et al., 2007b). Oat dough has very limited Ex when compared to wheat dough.
3.6 Effects of laccase, tyrosinase and xylanase on the quality attributes of oat and oat-wheat breads (Publications III and IV)
In 100% oat bread, LAC or XYL increased the hardness of fresh oat breads, but after 2 days storage all of the breads had the same hardness. The combination of the enzymes increased the specific volume of 100% oat bread significantly (Table 6 of Publication III). LAC, XYL and especially their combination increased the specific volume of oat-wheat bread significantly (Table 6 of Publication III). Similarly, an increase in the volume of wheat bread by LAC, XYL, and their combination has been reported in previous studies (Si, 2001, Primo-Martin & Martinez-Anaya, 2003, Selinheimo et al., 2007b). Fresh oat-wheat breads with XYL and with a combination of LAC and XYL enzymes were significantly softer than control bread, but after 3 days storage only bread with XYL remained significantly softer than the control bread. Similarly, XYL and a combination of XYL and LAC were reported to be most effective in retaining the softness of wheat bread after 3 days of storage (Primo-Martin & Martinez-Anaya, 2003, Selinheimo et al., 2007b).

3. Results and discussion
63
By combining the enzyme-induced changes in molecular structure with the rheological properties of doughs, and with the quality attributes of oat and oat-wheat breads, it can be concluded that LAC decreased the contents of WEAX, and total and free monomeric FA in oat doughs. The increased content of WSNSPs with smaller MW was detected as well, which was proposed to be water-soluble -glucan and WEAX. A slight -glucanase side activity in LAC preparation could have hydrolysed part of the insoluble -glucan to water-soluble -glucan, and thus increased the proportion of WSNSPs with smaller molecular size. This, in turn, could have enhanced the possibilities of LAC to form phenoxy radicals as well as formation of cross-links between FA moieties of WEAX molecules resulting in WUAX. LAC also decreased the content of SH groups and increased the molecular size of SDS-soluble proteins without concomitant effects on the subunits of oat protein fractions, as shown by reduced SDS-PAGE. LAC did not affect the rheological properties of the oat dough, probably due to its high -glucan content and lack of gluten. It is suggested that formation of WUAX by LAC as well as increased middle-size SDS-soluble proteins by formation of disulfide bonds between proteins and/or low Mr thiols increased the hardness of fresh oat bread. XYL doubled the content of WEAX in oat dough and slightly increased the amount of WSNSPs. This increased the resistance to extension of the dough after 60 min incubation as well as the hardness of the fresh bread, due most likely to a reduction in the amount of water available for -glucan by WEAX, and/or higher dough viscosity. When LAC and XYL were added together, the slight degradation of AX by XYL enhanced the degradation of -glucan by LAC. The synergistic effect of the enzymes reduced the amount and size of WSNSPs, which decreased the resistance to extension in the beginning of proofing phase (20 min, Figure 4A). The lower viscosity of the dough may have enabled the development of larger gas bubbles than in control dough. At the end of the proofing phase (60 min, Figure 4A), the formation of WUAX as well as disulfides between proteins due to LAC-induced cross-linking hardened the dough and resulted in the same bread crumb hardness as the control bread, despite the larger volume.
In wheat dough, LAC slightly increased the proportion of high MW WEAX and decreased the ratio of SDS-insoluble/total proteins, resulting in increased resistance to stretching and decreased extensibility of the dough. The cross-linking of WEAX to high MW was proposed to produce tighter dough due to increased water absorption of WEAX.
In oat-wheat dough, LAC slightly increased the amount of WSNSPs with MW between 600,000 and 10,000 when compared to the control. The increased content of water-soluble -glucan in the WSNSPs extract due to -glucanase side activity in LAC preparation may have increased the WSNSPs and thus the specific volume of the bread. XYL increased the contents of WEAX and WSNSPs of oat-wheat doughs, which increased the softness of the dough and, thus, also the specific volume and softness of the bread. When LAC and XYL were added together to this dough, degradation of WUAX of wheat and oats to double content of WEAX enabled more -glucan to be degraded by the side-activity of -glucanase in LAC preparation. The combined effects of these enzymes resulted in

3. Results and discussion
64
the highest amount of WSNSPs with MW below 400,000, which was assumed to be the main reason for softest dough and highest specific volume of oat-wheat bread.
Effects of TYR, LAC and XYL, either alone or in combination, on the quality parameters of gluten-free oat bread were studied by measuring the specific volume and instrumental hardness of the breads. TYR, alone and together with XYL, significantly (p < 0.05) increased the specific volume of oat breads (Table 3 of Publication IV). After two days of storage, the bread with a combination of TYR and XYL was significantly softer than other breads (p < 0.05) (Table 3 of Publication IV). This is in accordance with the effects of TYR alone and in combination with XYL on wheat bread (Selinheimo et al., 2007b), except that fresh wheat breads prepared with a combination of TYR and XYL were also softer than control bread. The cross-linking of oat globulins by TYR may have strengthened the protein network of oat dough, resulting in increased specific volume of the oat bread. XYL alone did not affect the specific volume or softness of the gluten-free oat bread. When XYL was added together with TYR, the degradation of AX by XYL, together with polymerization of oat globulins, may have contributed to the softer bread crumb after 2 days of storage. Furthermore, slight -glucanase activity of the TYR preparation may have contributed to the improved volume of this bread.
As with whole grain oat bread, LAC did not affect the specific volume of gluten-free oat bread (Table 4 of Publication IV). Similar results have been obtained with LAC-treated oat bread (0.01% LAC by flour weight, corresponding to a dosage of 1.7 nkat/g flour), although with 0.1% addition LAC has been found to increase the specific volume of oat bread (Renzetti et al., 2010). The increased depolymerisation of -glucan by -glucanase side activity (corresponding to 0.2 nkat/g flour) of the
LAC preparation was assumed to be the main reason for the increased softness of the oat doughs and increased specific volume and softness of the oat breads (Renzetti et al., 2010). The -glucanase side activity in our LAC preparation corresponded to 0.08 nkat/g flour, which may have been too low to affect alone the specific volume or rheology of the oat dough. Only when LAC was combined with XYL did the specific volume of whole grain or gluten-free oat bread increase significantly (Table 6 of Publication III and Table 4 of Publication IV), and the combined degradation of -glucan by LAC and AX by XYL was assumed to be the main reason for the improved volumes of these breads.

4. Conclusion and future outlook
65
4. Conclusion and future outlook
This thesis studied the effects of baking and bioprocessing methods, such as the use of sourdough and enzymes, on the chemical and rheological properties of oat doughs, the stability of -glucan, and the quality attributes of oat breads.
The concentration of gluten and water in oat breads were first optimized, and these concentrations were then used in the optimization of process conditions. Maximal specific volume and instrumental softness with even crust and without excessive crumb moistness were attained by adding gluten (15.2 g/100 g flour) and water (91.5 g/100 g flour) to the dough. Of the five processing conditions, baking temperature, proofing time and temperature exhibited the greatest effects on bread quality. The maximal specific volume 3.6 (cm3/g) and minimal hardness (0.1 kg after 2 h, and 0.3 kg after 72 h) were attained by proofing the bread at 40 °C for 75 min and baking at 210 °C. Of the sensory attributes evaluated, the processing conditions significantly affected the crust properties and richness of the crumb flavour. Optimal thickness, flavour and crispness of the crust were attained with the same conditions for maximal volume and minimal hardness of the bread. From the data presented, it is evident that bread with 51 g whole grain oat flour per 100 g flour can be baked and that good taste and structure as well as long shelf life can be obtained by optimizing the recipe and processing parameters. The results of this work have been applied for commercial production of oat breads with high -glucan content.
The use of an optimized sourdough process in the production of oat bread provided a feasible technique for producing new tasty variants of oat bread with high -glucan content. The amount and fermentation temperature of the sourdough added had significant effects on the texture and crumb characteristics of the oat-wheat bread. The most favourable sourdough condition for enhanced crumb texture and flavour of the bread was a small addition of wheat sourdough (10 g/100 g dough) that was fermented at 40 °C for 20 hours. The use of optimized sourdough resulted in bread with similar specific volume and staling rate as the corresponding straight dough bread.
Wheat sourdough did not affect the content or Mw of the -glucan when compared to straight dough bread. The amount of -glucan in both breads was 1.5±0.1 g per 100 g. This means that a portion (2 slices, á 34 g) of the bread contains 1.0 g -glucan. This fulfils the requirements for a cholesterol-lowering

4. Conclusion and future outlook
66
health claim if the consumers are also informed that the beneficial effect is obtained with a daily intake of 3 g of oat beta-glucan. The Mw of the -glucan decreased slightly, and to the same extent in both breads when compared to the oat flour. The degradation of -glucan occurred during the bread-making phase, and was most likely due to the endogenous -glucanase activity present in the wheat flour.
The effects of XYL, TYR, or a combination of XYL and LAC or TYR on the properties of oat dough and bread quality were studied for the first time. TYR was more effective than LAC in improving specific volume and reducing the firmnesss of the gluten-free oat bread, especially in combination with XYL. The degradation of AX by XYL together with a slight degradation of -glucan by side activity of -glucanase in LAC preparation was suggested to improve the specific volume of whole grain oat, gluten-free oat, and oat-wheat breads, and the softness of fresh oat-wheat bread. The polymerization of oat globulins by TYR together with degradation of AX by XYL was suggested to be the main contributors to improved volume and softness of gluten-free oat bread. Future structural studies with purified LAC and TYR will address the specific reactions between the enzymes and selected oat substrates as phenolic compounds, AX and protein fractions. Furthermore, the effects of dosage and bread making conditions on optimal activity of these enzymes requires further investigation. The results for TYR show promising possibilities for commercialization of this enzyme for different food uses, such as for improving the texture of different bakery products.
Of the bioprocesses applied in this study, wheat sourdough proved an effective method of boosting the flavour intensity of oat-wheat bread without excessive acidity or pungency. Additionally, wheat sourdough did not have a deleterious effect on the Mw of -glucan in this bread. Addition of enzymes improved the texture of oat-wheat bread more efficiently than wheat sourdough, as the combination of LAC and XYL resulted in higher specific volume (4.0 vs. 3.7 ml/g) than with the optimised wheat sourdough process. XYL was most efficient in retaining the softness of oat-wheat bread (0.2 and 0.3 kg after 3 days storage). The identified positive effects of TYR on the baking quality of gluten-free oat bread encourage further development of cross-linking enzymes as powerful tools for modification of biopolymers in healthy food matrices.

67
References
AACC International 2011. Approved methods of analysis. 11th. ed. AACC International. St. Paul, MN.
Adams, E.L., Kroon, P.A., Williamson, G. & Morris, V.J. 2003. Characterisation of heterogenous arabinoxylans by direct imaging of individual molecules by atomic force microscopy. Carbohydrate Research, Vol. 338, No. 8, pp. 771–780.
Adom, K.K. & Liu, R.H. 2002. Antioxidant activity of grains. Journal of Agricultural and Food Chemistry, Vol. 50, No. 21, pp. 6182–6187.
Ajithkumar, A., Andersson, R. & Åman, P. 2005. Content and molecular weight of extractable beta-glucan in American and Swedish oat samples. Journal of Agricultural and Food Chemistry, Vol. 53, No. 4, pp. 1205–1209.
Åman, P. & Graham, H. 1987. Analysis of total and insoluble mixed-linked (1-3), (1-4)- -D-glucans in barley and oats. Journal of Agricultural and Food Chemistry, Vol. 35, No. 5, pp. 704–709.
Åman, P., Rimsten, L. & Andersson, R. 2004. Molecular weight distribution of -glucan in oat based foods. Cereal Chemistry, Vol. 81, No. 3, pp. 356–360.
Angioloni, A. & Collar, C. 2011a. Nutritional and functional added value of oat, Kamut®, spelt, rye and buckwheat versus common wheat in breadmaking. Journal of the Science of Food and Agriculture, Vol. 91, No. 7, pp. 1283–1292.
Angioloni, A. & Collar, C. 2011b. Significance of lipid binding on the functional and nutritional profiles of single and multigrain matrices. European Food Research and Technology, Vol. 233, No. 1, pp. 141–150.
Arbeitsgemeinschaft Getreideforschung e.V. 1994. Säuregrad – Brot und Sauerteig. In: Standard-methoden für Getreide, Mehl und Brot. Anonymous (eds.). 7. ed. Verlag Moritz Schäfer. Detmold, Germany. Pp. 283–288.
Arendt, E.K., Ryan, L.A. & Dal Bello, F. 2007. Impact of sourdough on the texture of bread. Food Microbiology, Vol. 24, No. 2, pp. 165–174.
Autio, K. 2006. Effects of cell wall components on the functionality of wheat gluten. Biotechnology Advances, Vol. 24, No. 6, pp. 633–635.
Bailey, M.J., Biely, P. & Poutanen, K. 1992. Interlaboratory testing methods for assay of xylanase activity. Journal of Biotechnolgy, Vol. 23, No. 3, pp. 257–270.

68
Barron, C., Surget, A. & Rouau, X. 2007. Relative amounts of tissues in mature wheat (Triticum aestivum L.) grain and their carbohydrate and phenolic acid composition. Journal of Cereal Science, Vol. 45, No. 1, pp. 88–96.
Bartolomé, B. & Gómez-Gordovés, C. 1999. Barley spent grain: release of hydroxycinnamic acids (ferulic and p-coumaric acids) by commercial enzyme preparations. Journal of the Science of Food and Agriculture, Vol. 79, No. 3, pp. 435–439.
Battilana, P., Ornstein, K., Minehira, K., Schwarz, J.M., Acheson, V., Schneiter, P., Burri, J., Jéquier, E. & Tappy, L. 2001. Mechanisms of action of bold beta-glucan in postprandial glucose metabolism in healthy men. European Journal of Clinical Nutrition, Vol. 55, No. 5, pp. 327–333.
Beer, M.U., Wood, P.J. & Weisz, J. 1997. Molecular weight distribution and (1->3)(1->4)- -D-glucan content of consecutive extracts of various oat and barley cultivars. Cereal Chemistry, Vol. 74, No. 4, pp. 476–480.
Bhatty, R.S. 1992. Total and extractable ß-glucan contents of oats and their relationship to viscosity. Journal of Cereal Science, Vol. 15, No. 2, pp. 185–192.
Bittner, S. 2006. When quinones meet amino acids: chemical, physical and biological consequences. Amino Acids, Vol. 30, No. 3, pp. 205–224.
Black, M., Bewley, J.D. & Halmer, P. 2006. The encyclopedia of seeds science, technology and uses. CAB International. Oxfordshire, UK.
Blakeney, A.B., Harris, P.J., Henry, R.J. & Stone, B.A. 1983. A simple and rapid preparation of alditol acetates for monosaccharide analysis. Carbohydrate Research, Vol. 113, No. 2, pp. 291–299.
Boeriu, C., Oudgenoeg, G., Spekking, W., Berendsen, L., Vancon, L., Boumans, H., Gruppen, H., Berkel, W., Laane, C. & Voragen, A. 2004. Horseradish peroxidase-catalyzed cross-linking of feruloylated arabinoxylans with -casein. Journal of Agricultural and Food Chemistry, Vol. 52, No. 21, pp. 6633–6639.
Böhm, N. & Kulicke, W.M. 1999. Rheological studies of barley (1 3)(1 4)- -glucan in concentrated solution: investigation of the viscoelastic flow behaviour in the sol-state. Carbohydrate Research, Vol. 315, No. 3–4, pp. 293–301.

69
Boskov Hansen, H., Andreasen, M.F., Nielsen, M.M., Larsen, L.M., Bach Knudsen, K.E., Meyer, A.S., Christensen, L.P. & Hansen, Å. 2002. Changes in dietary fibre, phenolic acids and activity of endogenous enzymes during rye bread-making. European Food Research and Technology, Vol. 214, No. 1, pp. 33–42.
Brinegar, A.C. & Peterson, D.M. 1982. Separation and characterization of oat globulin polypeptides. Archives of Biochemistry and Biophysics, Vol. 219, No. 1, pp. 71–79.
Brümmer, J.M., Morgenstern, G. & Neumann, H. 1988. Herstellung von Hafer-, Gerste-, Mais-, Reis-, Hirse- und Buchweizenbrot. Getreide, Mehl und Brot, Vol. 5, pp. 153–158.
Buchert, J., Selinheimo, E., Kruus, K., Mattinen, M.L., Lantto, R. & Autio, K. 2007. Using crosslinking enzymes to improve textural and other properties of food. In: Novel enzyme technology for food applications. Rastall, R. (eds.). Woodhead Publishing Ltd. Cambridge, England. Pp. 101–139.
Buliga, G.S., Brant, D.A. & Fincher, G.B. 1986. The sequence statistics and solution conformation of a barley (1 3, 1 4)- -D-glucan. Carbohydrate Research, Vol. 157, pp. 139–156.
Bunzel, M., Ralph, J., Marita, J.M., Hatfield, R.D. & Steinhart, H. 2001. Diferulates as structural components in soluble and insoluble cereal dietary fibre. Journal of the Science of Food and Agriculture, Vol. 81, No. 7, pp. 653–660.
Bureau International des Poids ets Mesures 1999. Special name for the SI derived unit mole per second, the katal, for the expression of catalytic activity [Homepage of 21st Meeting, resolution 12], [Online]. http://www.bipm. org/en/CGP/db/21/12 [2011, 9/30].
Burgess, S.R., Shewry, P.R., Matlashewski, G.J., Altosaar, I. & Miflin, B.J. 1983. Characteristics of oat (Avena sativa L.) seed globulins. Journal of Experimental Botany, Vol. 34, No. 10, pp. 1320–1332.
Burzio, L.A., Burzio, V.A., Pardo, J. & Burzio, L.O. 2000. In vitro polymerization of mussel polyphenolic proteins catalyzed by mushroom tyrosinase. Comparative Biochemistry and Physiology Part B: Biochemistry and Molecular Biology, Vol. 126, No. 3, pp. 383–389.
Butt, M.S., Tahir-Nadeem, M., Iqbal K., M.K., Shabir, R. & Butt, M.S. 2008. Oat: unique among the cereals. European Journal of Nutrition, Vol. 47, No. 2, pp. 68–79.

70
Caballero, P.A., Gómez, M. & Rosell, C.M. 2007. Bread quality and dough rheology of enzyme-supplemented wheat flour. European Food Research and Technology, Vol. 224, No. 5, pp. 525–534.
Carlsson, R. 1992. Design and optimization in organic synthesis. Anonymous (eds.). Elsevier Science. Amsterdam, Netherlands. Pp. 249–324.
Carvajal-Millan, E., Guigliarelli, B., Belle, V., Rouau, X. & Micard, V. 2005a. Storage stability of laccase induced arabinoxylan gels. Carbohydrate Polymers, Vol. 59, No. 2, pp. 181–188.
Carvajal-Millan, E., Landillon, V., Morel, M.H., Rouau, X., Doublier, J.L. & Micard, V. 2005b. Arabinoxylan gels: impact of feruloylation degree on their structure and properties. Biomacromolecules, Vol. 6, No. 1, pp. 309–317.
Castello, P., Jollet, S., Potus, J., Baret, J.L. & Nicolas, J. 1998. Effect of exogenous lipase on dough lipids during mixing of wheat flours. Cereal Chemistry, Vol. 75, No. 5, pp. 595–601.
Cauvain, S.P. 2003. Breadmaking: an overview. In: Bread making. Cauvain, S.P. (eds.). Wodhead Publishing Ltd. Cambridge, England. Pp. 8–28.
Clarke, C., Schober, T. & Arendt, E. 2002. Effect of single strain and traditional mixed strain starter cultures on rheological properties of wheat dough and on bread quality. Cereal Chemistry, Vol. 79, No. 5, pp. 640–647.
Clarke, C., Schober, T., Dockery, P., O’Sullivan, K. & Arendt, E. 2004. Wheat sourdough fermentation: effects of time and acidification on fundamental rheological properties. Cereal Chemistry, Vol. 81, No. 3, pp. 409–417.
Claus, H. 2004. Laccases: structure, reactions, distribution. Micron, Vol. 35, No. 1–2, pp. 93–96.
Cleemput, G., Booij, C., Hessing, M., Gruppen, H. & Delcour, J.A. 1997. Solubilisation and changes in molecular weight distribution of arabinoxylan and protein in wheat flours during bread-making, and the effects of endogenous arabinoxylan hydrolysing enzymes. Journal of Cereal Science, Vol. 26, No. 1, pp. 55–66.
Cleemput, G., van Oort, M., Hessing, M., Bergmans, M.E.F., Gruppen, H., Grobe, P.J. & Delcour, J.A. 1995. Variation in the degree of D-xylose substitution in arabinoxylans extracted from a European wheat flour. Journal of Cereal Science, Vol. 22, No. 1, pp. 73–84.

71
Colleoni-Sirghie, M., Jannink, J.L., Kovalenko, I.V., Briggs, J.L. & White, P.J. 2004. Prediction of -glucan concentration based on viscosity evaluations of raw oat flours from high -glucan and traditional oat lines. Cereal Chemistry, Vol. 81, No. 4, pp. 434–443.
Corsetti, A., Gobbetti, M., Balestrieri, F., Paoletti, F., Russi, L. & Rossi, J. 1998. Sourdough lactic acid bacteria effects on bread firmness and staling. Journal of Food Science, Vol. 63, No. 2, pp. 347–351.
Corsetti, A., Gobbetti, M., De Marco, B., Balestrieri, F., Paoletti, F., Russi, L. & Rossi, J. 2000. Combined effect of sourdough lactic acid bacteria and additives on bread firmness and staling. Journal of Agricultural and Food Chemistry, Vol. 48, No. 7, pp. 3044–3051.
Corsetti, A. & Settanni, L. 2007. Lactobacilli in sourdough fermentation. Food Research International, Vol. 40, No. 5, pp. 539–558.
Courtin, C.M. & Delcour, J.A. 2002. Arabinoxylans and endoxylanases in wheat flour bread-making. Journal of Cereal Science, Vol. 35, No. 3, pp. 225–243.
Courtin, C.M., Gelders, G.G. & Delcour, J.A. 2001. Use of two endoxylanases with different substrate selectivity for understanding arabinoxylan functionality in wheat flour breadmaking. Cereal Chemistry, Vol. 78, No. 5, pp. 564–571.
Crowley, P., Schober, T.J., Clarke, C.I. & Arendt, E.K. 2002. The effect of storage time on textural and crumb grain characteristics of sourdough wheat bread. European Food Research and Technology, Vol. 214, No. 6, pp. 489–496.
Cui, W., Wood, P.J., Blackwell, B. & Nikiforuk, J. 2000. Physicochemical properties and structural characterization by two-dimensional NMR spectroscopy of wheat -D-glucan – comparison with other cereal -D-glucans. Carbohydrate Polymers, Vol. 41, No. 3, pp. 249–258.
Dachkevitch, T. & Autran, J.C. 1989. Prediction of baking quality of bread wheats in breeding programs by size exclusion high performance liquid chromatography. Cereal Chemistry, Vol. 66, No. 6, pp. 448–456.
Dal Bello, F., Clarke, C.I., Ryan, L.A.M., Ulmer, H., Schober, T.J., Ström, K., Sjögren, J., van Sinderen, D., Schnürer, J. & Arendt, E.K. 2007. Improvement of the quality and shelf life of wheat bread by fermentation with the antifungal strain Lactobacillus plantarum FST 1.7. Journal of Cereal Science, Vol. 45, No. 3, pp. 309–318.

72
De Angelis, M., Rizzello, C., Alfonsi, G., Arnault, P., Cappelle, S., Di Cagno, R. & Gobbetti, M. 2007. Use of sourdough lactobacilli and oat fibre to decrease the glycaemic index of white wheat bread. British Journal of Nutrition, Vol. 98, No. 6, pp. 1196–1205.
de Munter, J.S., Hu, F.B., Spiegelman, D., Franz, M. & van Dam, R.M. 2007. Whole grain, bran, and germ intake and risk of type 2 diabetes: a prospective cohort study and systematic review. PLoS Medicine, Vol. 4, No. 8, pp. 1385–1395.
De Vuyst, L. & Neysen, P. 2005. The sourdough microflora: biodiversity and metabolic interactions. Trends in Food Science & Technology, Vol. 16, No. 1–3, pp. 43–56.
Degutyte-Fomins, L., Sontag-Strohm, T. & Salovaara, H. 2002. Oat bran fermentation by rye sourdough. Cereal Chemistry, Vol. 79, No. 3, pp. 345–348.
Dervilly, G., Saulnier, L., Roger, P. & Thibault, J.F. 2000. Isolation of homogeneous fractions from wheat water-soluble arabinoxylans. Influence of the structure on their macromolecular characteristics. Journal of Agricultural and Food Chemistry, Vol. 48, No. 2, pp. 270–278.
Di Cagno, R., De Angelis, M., Lavermicocca, P., De Vincenzi, M., Giovannini, C., Faccia, M. & Gobbetti, M. 2002. Proteolysis by sourdough lactic acid bacteria: effects on wheat flour protein fractions and gliadin peptides involved in human cereal intolerance. Applied and Environmental Microbiology, Vol. 68, No. 2, pp. 623–633.
Doehlert, D.C., Zhang, D. & Moore, W.R. 1997. Influence of heat pretreatments of oat grain on the viscosity of flour slurries. Journal of the Science of Food and Agriculture, Vol. 74, No. 1, pp. 125–131.
Don, C., Lichtendonk, W.J., Plijter, J.J., van Vliet, T. & Hamer, R.J. 2005. The effect of mixing on glutenin particle properties: aggregation factors that affect gluten function in dough. Journal of Cereal Science, Vol. 41, No. 1, pp. 69–83.
Donhowe, E.T. & Peterson, D.M. 1983. Isolation and characterization of oat aleurone and starchy endosperm protein bodies. Plant Physiology, Vol. 71, No. 3, pp. 519–523.
Dornez, E., Gebruers, K., Cuyvers, S., Delcour, J.A. & Courtin, C.M. 2007. Impact of wheat flour-associated endoxylanases on arabinoxylan in dough after

73
mixing and resting. Journal of Agricultural and Food Chemistry, Vol. 55, No. 17, pp. 7149–7155.
European Commission 2008a. Commission Directive 2008/100/EC of October 28 2008 amending Council Directive 90/496/EEC on nutrition labelling for foodstuffs as regards recommended daily allowances, energy conversion factors and definitions. Official Journal of the European Union, Vol. 51, No. L285, pp. 9–12.
European Commission 2008b. Regulation (EC) 1332/2008 of the European Parliament and of the Council of 16 December 2008 on food enzymes and amending Council Directive 83/417/EEC, Council Regulation (EC) No 1493/1999, Directive 2000/13/EC, Council Directive 2001/112/EC and Regulation (EC) No258/97. Official Journal of the European Union, Vol. 51, No. L354, pp. 7–15.
European Commission 2009. Commission regulation (EC) No 41/2009 of 20 January 2009 concerning the composition and labelling of foodstuffs suitable for people intolerant to gluten. Official Journal of the European Union, Vol. 52, No. L16, pp. 3–5.
European Commission 2011. Commission Regulation (EU) 1160/2011 of 14 November 2011 on the authorisation and refusal of authorisation of certain health claims made on foods and referring to the reduction of disease risk. Official Journal of the European Union, Vol. 54, No. L296, pp. 26–28.
European Commission 2012. Comission Regulation (EU) 432/2012 of 16 May 2012 establishing a list of permitted health claims made on foods, other than those referring to the reduction of a disease risk and to children's development and health. official Journal of the European union, Vol. 55, No. L136, pp. 1–40.
Facano, A. & Catassi, C. 2001. Current approaches to diagnosis and treatment of celiac disease: an evolving spectrum. Gastoenterology, Vol. 120, No. 3, pp. 636–651.
FAO 2010. FAOSTAT Prodstat (September 2010) [Homepage of Food and Agriculture Organization of the United Nations], [Online]. http://faostat. fao.org/site/339/default.aspx [2011, 3/29].
FAO/WHO 1973. Energy and protein requirements: report of a joint FAO/WHO ad hoc expert committee. FAO Nutrition Meetings rep. Ser., No 52; WHO Tech. Rep. Ser. No. 522. Food and Agriculture Organization of the United Nations, Rome; World Health Organization, Geneva.

74
FDA, U.S. Food and Drug Administration 1997a. Food Labeling: Health claims; Oats and Coronary Hearth Disease; Final rule. Federal Register, Vol. 62, No. 15, pp. 3583–3601.
FDA, U.S. Food and Drug Administration 1997b. Food labelling: Health Claims; Soluble Fiber from whole oats and risk of coronary heart disease; Final rule. Federal Register, Vol. 62, No. 61, pp. 15343–15344.
Figueroa-Espinoza, M.C., Morel, M.H. & Rouau, X. 1998. Effect of lysine, tyrosine, cysteine, and glutathione on the oxidative cross-linking of feruloylated arabinoxylans by a fungal laccase. Journal of Agricultural and Food Chemistry, Vol. 46, No. 7, pp. 2583–2589.
Figueroa-Espinoza, M.C., Morel, M.H., Surget, A., Asther, M., Moukha, S., Sigoillot, J.C. & Rouau, X. 1999. Attempt to cross-link feruloylated arabinoxylans and proteins with a fungal laccase. Food Hydrocolloids, Vol. 13, No. 1, pp. 65–71.
Fisher, E.H. & Stein, E.A. 1961. Alfa-amylase from human saliva. In: Biochemical preparations. Meister, A. (eds.). 1st ed. John Wiley & Sons Inc. New York, NY. Pp. 27–33.
Flurkey, W.H. 2003. Laccase. In: Handbook of Food Enzymology. Whitaker, J.R., Voragen, A.G.J. & Wong, D.W.S. (eds.). Marcel Dekker, Inc. New York, NY. Pp. 525–537.
Forssell, P., Shamekh, S., Härkönen, H. & Poutanen, K. 1998. Effects of native and enzymatically hydrolysed soya and oat lecithins in starch phase transitions and bread baking. Journal of the Science of Food and Agriculture, Vol. 76, No. 1, pp. 31–38.
Frölich, W. & Nyman, M. 1988. Minerals, phytate and dietary fibre in different fractions of oat-grain. Journal of Cereal Science, Vol. 7, No. 1, pp. 73–82.
Fulcher, R.G. & Wong, S. 1980. Inside cereals – a fluorescence microchemical view. In: Cereals for food and beverages. Inglett, G.E. & Munck, L. (eds.). Academic Press Inc. New York, NY. Pp. 1–26.
Gambu , H., Gibi ski, M., Pastuszka, D., Mickowska, B., Ziobro, R. & Witkowicz, R. 2011. The application of residual oats flour in bread production in order to improve its quality and biological value of protein. Acta Scientiarum Polonorum Technologia Alimentaria, Vol. 10, No. 3, pp. 313–325.

75
Ganssmann, W. & Vorwerk, K. 1995. Oat milling, processing and storage. In: The Oat Crop: production and utilization. Welch, R.W. (eds.). 1st ed. Chapmann & Hall. London, UK. Pp. 369–408.
Gänzle, M., Loponen, J. & Gobbetti, M. 2008. Proteolysis in sourdough fermentations: mechanisms and potential for improved bread quality. Trends in Food Science & Technology, Vol. 19, No. 10, pp. 513–521.
Gebruers, K., Dornez, E., Boros, D., Frás, A., Dynkowska, W., Bed , Z., Rakszegi, M., Delcour, J.A. & Courtin, C.M. 2008. Variation in the content of dietary fiber and components thereof in wheats in the HEALTHGRAIN diversity screen. Journal of Agricultural and Food Chemistry, Vol. 56, No. 21, pp. 9740–9749.
Girardet, N. & Webster, F.H. 2011. Oat milling: specifications, storage, and processing. In: Oats Chemistry and Technology. Webster, F.H. & Wood, P.J. (eds.). 2nd ed. AACC International, Inc. St. Paul, MN. Pp. 305–316.
Goesaert, H., Slade, L., Levine, H. & Delcour, J.A. 2009. Amylases and bread firming – an integrated view. Journal of Cereal Science, Vol. 50, No. 3, pp. 345–352.
Gormley, T.R. & Morrissey, A. 1993. A note on the evaluation of wheaten breads containing oat flour or oat flakes. Irish Journal of Agricultural and Food Research, Vol. 32, No. 2, pp. 205–209.
Gray, J.A. & Bemiller, J.N. 2003. Bread staling: molecular basis and control. Comprehensive Reviews in Food Science and Food Safety, Vol. 2, No. 1, pp. 1–21.
Hammes, W. & Gänzle, M. 1998. Sourdough breads and related products. In: Microbiology of fermented foods. Wood, B.J. (eds.). 2nd ed. Thomson Science. London, UK. Pp. 199–216.
Hansen, Å. & Hansen, B. 1996. Flavour of sourdough wheat bread crumb. Zeitschrift für Lebensmittel-Untersuchung und -Forschung, Vol. 202, No. 3, pp. 244–249.
Haskå, L., Nyman, M. & Andersson, R. 2008. Distribution and characterisation of fructan in wheat milling fractions. Journal of Cereal Science, Vol. 48, No. 3, pp. 768–774.

76
Health Canada 2010. Food and Nutrition. The Canadian Nutrient File [Homepage of Health Canada, Ottawa, Canada], [Online]. http://webprod3.hc-sc.gc. ca/cnf-fce/index-eng.jsp [2011, 6/9].
Henry, R.J. 1987. Pentosan and (1 3),(1 4)- -glucan concentrations in endosperm and wholegrain of wheat, barley, oats and rye. Journal of Cereal Science, Vol. 6, No. 3, pp. 253–258.
Hoseney, R.C., Sievert, D. & Delcour, J.A. 2007. Bread and oher baked products. In: Ullmann's Encyclopedia of Industrial Chemistry. Anonymous (eds.). Wiley-VHC Verlag. Weinheim, Germany.
Hug-Iten, S., Handschin, S., Conde-Petit, B. & Escher, F. 1999. Changes in starch microstructure on baking and staling of wheat bread. LWT – Food Science and Technology, Vol. 32, No. 5, pp. 255–260.
Hüttner, E.K., Dal Bello, F. & Arendt, E.K. 2010a. Fundamental study on the effect of hydrostatic pressure treatment on the bread-making performance of oat flour. European Food Research and Technology, Vol. 230, No. 6, pp. 827–835.
Hüttner, E.K., Dal Bello, F. & Arendt, E.K. 2010b. Identification of lactic acid bacteria isolated from oat sourdoughs and investigation into their potential for the improvement of oat bread quality. European Food Research and Technology, Vol. 230, No. 6, pp. 849–857.
Hüttner, E.K., Dal Bello, F. & Arendt, E.K. 2010c. Rheological properties and bread making performance of commercial wholegrain oat flours. Journal of Cereal Science, Vol. 52, No. 1, pp. 65–71.
Iiyama, K., Lam, T.B.T. & Stone, B.A. 1994. Covalent crosslinks in the cell wall. Plant Physiology, Vol. 104, No. 2, pp. 315–320.
Immerstrand, T., Bergenståhl, B., Trägårdh, C., Nyman, M., Cui, S. & Öste, R. 2009. Extraction of -glucan from oat bran in laboratory scale. Cereal Chemistry, Vol. 86, No. 6, pp. 601–608.
Institute of Brewing Analysis, Committee 1982. Method 2.11 Endo- -glucanase. In: Recommended Methods of Analysis. Anonymous (eds.). London, UK. Pp. 165–166.
Izydorczyk, M.S. & Biliaderis, C.G. 2007. Arabinoxylans: technologically and nutritionally functional plant polysaccharides. In: Functional Food

77
Carbohydrates. Biliaderis, C.G. & Izydorczyk, M.S. (eds.). CRC Press. Boca Raton, FL. Pp. 249–290.
Izydorczyk, M.S. & Biliaderis, C.G. 1995. Cereal arabinoxylans: advances in structure and physicochemical properties. Carbohydrate Polymers, Vol. 28, No. 1, pp. 33–48.
Izydorczyk, M.S. & Biliaderis, C.G. 1994. Studies on the structure of wheat-endosperm arabinoxylans. Carbohydrate Polymers, Vol. 24, No. 1, pp. 61–71.
Jenkins, D.J., Kendall, C.W., Vuksan, V., Vidgen, E., Parker, T., Faulkner, D., Mehling, C.C., Garsetti, M., Testolin, G., Cunnane, S.C., Ryan, M.A. & Corey, P.N. 2002. Soluble fiber intake at a dose approved by the US Food and Drug Administration for a claim of health benefits: serum lipid risk factors for cardiovascular disease assessed in a randomized controlled crossover trial. American Journal of Clinical Nutrition, Vol. 75, No. 5, pp. 834–839.
Juvonen, K., Purhonen, A.K., Salmenkallio-Marttila, M., Lähteenmaki, L., Laaksonen, D., Herzig, K.H., Uusitupa, M., Poutanen, K. & Karhunen, L. 2009. Viscosity of oat bran-enriched beverages influences gastrointestinal hormonal responses in healthy humans. The Journal of Nutrition, Vol. 139, No. 3, pp. 461–466.
Katina, K., Arendt, E., Liukkonen, K.H., Autio, K., Flander, L. & Poutanen, K. 2005. Potential of sourdough for healthier cereal products. Trends in Food Science & Technology, Vol. 16, pp. 104–112.
Katina, K., Heiniö, R.L., Autio, K. & Poutanen, K. 2006. Optimization of sourdough process for improved sensory profile and texture of wheat bread. LWT – Food Science and Technology, Vol. 39, No. 10, pp. 1189–1202.
Katina, K., Laitila, A., Juvonen, R., Liukkonen, K.H., Kariluoto, S., Piironen, V., Landberg, R., Åman, P. & Poutanen, K. 2007. Bran fermentation as a means to enhance technological properties and bioactivity of rye. Food Microbiology, Vol. 24, No. 2, pp. 175–186.
Katina, K., Poutanen, K. & Autio, K. 2004. Influence and interactions of processing conditions and starter culture on formation of acids, volatile compounds, and amino acids in wheat sourdoughs. Cereal Chemistry, Vol. 81, No. 5, pp. 598–610.

78
Katina, K., Sauri, M., Alakomi, H.L. & Mattila-Sandholm, T. 2002. Potential of lactic acid bacteria to inhibit rope spoilage in wheat sourdough bread. LWT – Food Science and Technology, Vol. 35, No. 1, pp. 38–45.
Kawamura, Y. & Yonezawa, D. 1982. Wheat flour proteases and their action on gluten proteins in dilute acetic acid Agricultural and Biological Chemistry, Vol. 46, No. 3, pp. 175–186.
Kent, N.L. & Evers, A.D. 1994. Technology of cereals: an introduction for students of food science and agriculture. 4th ed. Elsevier Science Ltd. Oxford, U.K.
Kerckhoffs, D.A., Brouns, F., Hornstra, G. & Mensink, R.P. 2002. Effects on the human serum lipoprotein profile of ß-glucan, soy protein and isoflavones, plant sterols and stanols, garlic and tocotrienols. The Journal of Nutrition, Vol. 132, No. 9, pp. 2494–2505.
Kerckhoffs, D.A., Hornstra, G. & Mensink, R.P. 2003. Cholesterol-lowering effect of beta-glucan from oat bran in mildly hypercholesterolemic subjects may decrease when beta-glucan is incorporated into bread and cookies. American Journal of Clinical Nutrition, Vol. 78, No. 2, pp. 221–227.
Kieffer, R., Wieser, H., Henderson, M.H. & Graveland, A. 1998. Correlations of the breadmaking performance of wheat flour with rheological measurements on a micro-scale. Journal of Cereal Science, Vol. 27, No. 1, pp. 53–60.
Kim, Y. & Yokoyama, W.H. 2011. Physical and sensory properties of all-barley and all-oat breads with additional hydroxypropyl methylcellulose (HPMC) -glucan. Journal of Agricultural and Food Chemistry, Vol. 59, No. 2, pp. 741–746.
Kivelä, R., Gates, F. & Sontag-Strohm, T. 2009. Degradation of cereal beta-glucan by ascorbic acid induced oxygen radicals. Journal of Cereal Science, Vol. 49, No. 1, pp. 1–3.
Kivelä, R., Henniges, U., Sontag-Strohm, T. & Potthast, A. 2012. Oxidation of oat -glucan in aqueous solutions during processing. Carbohydrate
Polymers, Vol. 87, No. 1, pp. 589–597.
Konzac, C.F. 1977. Genetic control of the content, amino acid compositions and processing properties of proteins in wheat. Advances in Genetics, Vol. 19, pp. 407–482.

79
Krishnan, P.G., Chang, K.C. & Brown, G. 1987. Effect of commercial oat bran on the characteristics and composition of bread. Cereal Chemistry, Vol. 64, No. 1, pp. 55–58.
Labat, E., Morel, M.H. & Rouau, X. 2001. Effect of laccase and manganese peroxidase on wheat gluten and pentosans during mixing. Food Hydrocolloids, Vol. 15, No. 1, pp. 47–52.
Labat, E., Morel, M.H. & Rouau, X. 2000. Effects of laccase and ferulic acid on wheat flour doughs. Cereal Chemistry, Vol. 77, No. 6, pp. 823–828.
Labat, E., Rouau, X. & Morel, M.H. 2002. Effect of flour water-extractable pentosans on molecular associations in gluten during mixing. LWT – Food Science and Technology, Vol. 35, No. 2, pp. 185–189.
Lan-Pidhainy, X., Brummer, Y., Tosh, S.M., Wolever, T.M. & Wood, P. 2007. Reducing beta-glucan solubility in oat bran muffins by freeze-thaw treatment attenuates its hypoglycemic effect. Cereal Chemistry, Vol. 84, No. 5, pp. 512–517.
Lasztity, R. 1998. Oat grain—a wonderful reservoir of natural nutrients and biologically active substances. Food Reviews International, Vol. 14, No. 1, pp. 99–119.
Lavermicocca, P., Valerio, F., Evidente, A., Lazzaroni, S., Corsetti, A. & Gobbetti, M. 2000. Purification and characterization of novel antifungal compounds from the sourdough Lactobacillus plantarum strain 21B. Applied and Environmental Microbiology, Vol. 66, No. 9, pp. 4084–4090.
Lazaridou, A., Biliaderis, C.G., Micha-Screttas, M. & Steele, B.R. 2004. A comparative study on structure–function relations of mixed-linkage (1 3), (1 4) linear
-D-glucans. Food Hydrocolloids, Vol. 18, No. 5, pp. 837–855.
Lerch, K. 1983. Neurospora tyrosinase: structural, spectroscopic and catalytic properties. Molecular and Cellular Biochemistry, Vol. 52, No. 2, pp. 125–138.
Liatis, S., Tsapogas, P., Chala, E., Dimosthenopoulos, C., Kyriakopoulos, K., Kapantais, E. & Katsilambros, N. 2009. The consumption of bread enriched with betaglucan reduces LDL-cholesterol and improves insulin resistance in patients with type 2 diabetes. Diabetes & Metabolism, Vol. 35, No. 2, pp. 115–120.
Lindgren, Å. 1995. Multivariate structure-property-relationships of non-ionic surfactants. PhD thesis ed. Umeå University, Sweden.

80
Ma, C.Y. & Harwalkar, V.R. 1987. Thermal coagulation of oat globulin. Cereal Chemistry, Vol. 64, No. 4, pp. 212–218.
Ma, C.Y. & Harwalkar, V.R. 1984. Chemical characterization and functionality assessment of oat protein fractions. Journal of Agricultural and Food Chemistry, Vol. 32, No. 1, pp. 144–149.
Mäki, M. & Collin, P. 1997. Coeliac disease. The Lancet, Vol. 349, No. 9067, pp. 1755–1759.
Mälkki, Y. 2001. Physical properties of dietary fiber as keys to physiological functions. Cereal Foods World, Vol. 46, No. 5, pp. 196–199.
Mandala, I., Polaki, A. & Yanniotis, S. 2009. Influence of frozen storage on bread enriched with different ingredients. Journal of Food Engineering, Vol. 92, No. 2, pp. 137–145.
Marcone, M.F., Kakuda, Y. & Yada, R.Y. 1998. Salt-soluble seed globulins of dicotyledonous and monocotyledonous plants II. Structural characterization. Food Chemistry, Vol. 63, No. 2, pp. 265–274.
Mariotti, M., Lucisano, M. & Pagani, M.A. 2006. Development of a baking procedure for the production of oat-supplemented wheat bread. International Journal of Food Science & Technology, Vol. 41, No. Supplement 2, pp. 151–157.
Masuda, T., Yamada, K., Maekawa, T., Takeda, Y. & Yamaguchi, H. 2006. Antioxidant mechanism studieson ferulic acid: isolation, and structure identification of the main antioxidant product from methyl ferulate. Food Science and Technology Research, Vol. 12, No. 3, pp. 173–177.
Mattila, P., Hellström, J. & Pihlava, J.M. 2005. Contents of phenolic acids, alkyl- and alkenylresorcinols, and avenanthramides in commercial grain products. Journal of Agricultural and Food Chemistry, Vol. 53, No. 21, pp. 8290–8295.
Mattinen, M.L., Kruus, K., Buchert, J., Nielsen, J.H., Andersen, H.J. & Steffensen, C.L. 2005. Laccase-catalyzed polymerization of tyrosine-containing peptides. FEBS Journal, Vol. 272, No. 14, pp. 3640–3650.
McKechnie, R. 1983. Oat products in bakery foods. Cereal Foods World, Vol. 28, No. 10, pp. 635–637.

81
Mellen, P.B., Walsch, T.F. & Herrington, D.M. 2008. Whole grain intake and cardiovascular disease: a meta-analysis. Nutrition, Metabolism & Cardiovascular Diseases, Vol. 18, No. 4, pp. 283–290.
Meuser, F. & Suckow, P. 1986. Chemistry and physics of baking. The Royal Society of Chemistry. London, UK.
Mikola, M., Brinck, O. & Jones, B. 2001. Characterization of oat endoproteinases that hydrolyze oat avenins. Cereal Chemistry, Vol. 78, No. 1, pp. 55–58.
Mikola, M. & Jones, B. 2000. Characterization of oat endoproteinases that hydrolyze oat globulins. Cereal Chemistry, Vol. 77, No. 5, pp. 572–577.
Miller, S.S. & Fulcher, R.G. 1995. Oat endosperm cell walls: II. Hot-water solubilization and enzymatic digestion of the wall. Cereal Chemistry, Vol. 72, No. 5, pp. 428–432.
Miller, S.S., Wood, P.J., Pietrzak, L.N. & Fulcher, R.G. 1993. Mixed linkage beta-glucan, protein content, and kernel weight in Avena species. Cereal Chemistry, Vol. 70, No. 2, pp. 231–233.
Molteberg, E.L., Magnus, E.M., Björge, J.M. & Nilsson, A. 1996. Sensory and chemical studies of lipid oxidation in raw and heat-treated oat flours. Cereal Chemistry, Vol. 73, No. 5, pp. 579–587.
Monfort, A., Blasco, A., Sanz, P. & Prieto, J.A. 1999. Expression of LIP1 and LIP2 genes from Geotrichum species in baker's yeast strains and their application to the bread-making process. Journal of Agricultural and Food Chemistry, Vol. 47, No. 2, pp. 803–808.
Morel, M.H., Bonicel, J., Micard, V. & Guilbert, S. 2000a. Protein insolubilization and thiol oxidation in sulfite-treated wheat gluten films during aging at various temperatures and relative humidities. Journal of Agricultural and Food Chemistry, Vol. 48, No. 2, pp. 186–192.
Morel, M.H., Dehlon, P., Autran, J., Leygue, J. & Bar-L’Helgouach, C. 2000b. Effects of temperature, sonication time, and power settins on size distribution and extractability of total wheat flour proteins as determined by size-exclusion high-performance liquid chromatography. Cereal Chemistry, Vol. 77, No. 5, pp. 685–691.
Niku-Paavola, M.L., Karhunen, E., Salola, P. & Raunio, V. 1988. Ligninolytic enzymes of the white-rot-fungus Phlebia radiata. Biochemical Journal, Vol. 254, No. 3, pp. 877–884.

82
Noort, M.W.J., van Haaster, D., Hemery, Y., Schols, H.A. & Hamer, R.J. 2010. The effect of particle size of wheat bran fractions on bread quality – Evidence for fibre–protein interactions. Journal of Cereal Science, Vol. 52, No. 1, pp. 59–64.
Oomah, B.D. 1983. Baking and related properties of wheat-oat composite flours. Cereal Chemistry, Vol. 60, No. 3, pp. 220–225.
Ordaz-Ortiz, J.J. & Saulnier, L. 2005. Structural variability of arabinoxylans from wheat flour. Comparison of water-extractable and xylanase-extractable arabinoxylans. Journal of Cereal Science, Vol. 42, No. 1, pp. 119–125.
Östman, E.M., Nilsson, M., Liljeberg-Elmståhl, H.G., Molin, G. & Björck, I.M. 2002. On the effect of lactic acid on blood glucose and insulin responses to cereal products: mechanistic studies in healthy subjects and in vitro. Journal of Cereal Science, Vol. 36, No. 3, pp. 339–346.
Oudgenoeg, G., Dirksen, E., Ingemann, S., Hilhorst, R., Gruppen, H., Boeriu, C., Piersma, S., Berkel, W., Laane, C. & Voragen, A. 2002. Horseradish peroxidase-catalyzed oligomerization of ferulic acid on a template of a tyrosine-containing tripeptide. The Journal of Biological Chemistry, Vol. 277, No. 24, pp. 21332–21340.
Oudgenoeg, G., Hilhorst, R., Piersma, S., Boeriu, C., Gruppen, H., Hessing, M., Voragen, A. & Laane, C. 2001. Peroxidase-mediated cross-linking of a tyrosine-contaning peptide with ferulic acid. Journal of Agricultural and Food Chemistry, Vol. 49, No. 5, pp. 2503–2510.
Papageorgiou, M., Lakhdara, N., Lazaridou, A., Biliaderis, C.G. & Izydorczyk, M.S. 2005. Water extractable (1 3,1 4)- -D-glucans from barley and oats: an intervarietal study on their structural features and rheological behaviour. Journal of Cereal Science, Vol. 42, No. 2, pp. 213–224.
Park, Y., Subar, A.F., Hollenbeck, A. & Schatzkin, A. 2011. Dietary fiber in-take and mortality in the NIH-AARP Diet and Health Study. Journal of the American Medical Association, [Online], doi: 10.1001/archinternmed.2011.18.
Parkkonen, T., Härkönen, H. & Autio, K. 1994. The effect of baking on microstructure of rye cell walls and proteins. Cereal Chemistry, Vol. 71, No. 1, pp. 58–63.
Paton, D. & Lenz, M.K. 1993. Current practice and novel processes. In: Oat Bran. Wood, P.J. (eds.). American Association of Cereal Chemists. St. Paul, MN. Pp. 25–47.

83
Pepe, O., Blaiotta, G., Moschetti, G., Greco, T. & Villani, F. 2003. Rope-producing strains of Bacillus spp. from wheat bread and strategy for their control by lactic acid bacteria Applied and Environmental Microbiology, Vol. 69, No. 4, pp. 2321–2329.
Peterson, D.M. 2001. Oat antioxidants. Journal of Cereal Science, Vol. 33, No. 2, pp. 115–129.
Peterson, D.M. 1978. Subunit structure and composition of oat seed globulin. Plant Physiology, Vol. 62, No. 4, pp. 506–509.
Peterson, D.M. & Brinegar, C. 1986. Oat storage proteins. In: Oats: Chemistry and Technology. Webster, F. (eds.). 1st ed. American Association of Cereal Chemists. St. Paul, MN. Pp. 153–203.
Peyron, S., Surget, A., Mabille, F., Autran, J.C., Rouau, X. & Abecassis, J. 2002. Evaluation of tissue dissociation of durum wheat grain (Triticum durum Desf.) generated by the milling process. Journal of Cereal Science, Vol. 36, No. 2, pp. 199–208.
Pomeranz, Y. 1988. Chemical composition of kernel structures. In: Wheat: Chemistry and Technology. Pomeranz, Y. (eds.). 3rd ed. American Association of Cereal Chemists, Inc. St. Paul, MN. Pp. 97–158.
Poutanen, K., Flander, L. & Katina, K. 2009. Sourdough and cereal fermentation in a nutritional perspective. Food Microbiology, Vol. 26, No. 7, pp. 693–699.
Prentice, N., Cuendet, L.S. & Geddes, W.F. 1954. Studies on bread staling. V. Effect of flour fractions and various starches on the firming of bread crumb. Cereal Chemistry, Vol. 31, No. 3, pp. 188–206.
Preston, K.R. & Stevenson, S.G. 2003. Size exclusion chromatography and flow field-flow fractionation of wheat proteins. In: Wheat gluten protein analysis. Shewry, P.R. & Lookhart, G.l. (eds.). American Association of Cereal Chemists. St. Paul, MN. Pp. 115–136.
Primo-Martin, C. & Martinez-Anaya, M. 2003. Influence of pentosanase and oxidases on water-extractable pentosans during a straight breadmaking process. Journal of Food Science, Vol. 68, No. 1, pp. 31–39.
Primo-Martin, C., Valera, R. & Martinez-Anaya, M.A. 2003. Effect of pentosanase and oxidases on the characteristics of doughs and the glutenin macropolymer (GMP). Journal of Agricultural and Food Chemistry, Vol. 51, No. 16, pp. 4673–4679.
84
Purhagen, J.K., Sjöö, M.E. & Eliasson, A.C. 2011. Starch affecting anti-staling agents and their function in freestanding and pan-baked bread. Food Hydrocolloids, Vol. 25, No. 7, pp. 1656–1666.
Rakszegi, M., Boros, D., Kuti, C.L., L., Bedo, Z. & Shewry, P.R. 2008. Composition and end-use quality of 150 wheat lines selected for the HEALTHGRAIN diversity screen. Journal of Agricultural and Food Chemistry, Vol. 56, No. 21, pp. 9750–9757.
Ralph, J., Hatfield, R.D., Grabber, J.H., Jung, H.J., Quideau, S. & Helm, R.F. 1998. Cell wall cross-linking in grasses by ferulates and diferulates. In: Lignin and Lignan Biosynthesis. Lewis, N.G. & Sarkanen, S. (eds.). American Chemical Society. Washington, DC. Pp. 209–236.
Regand, A., Chowdhury, Z., Tosh, S.M., Wolever, T.M. & Wood, P.J. 2011. The molecular weight, solubility and viscosity of oat beta-glucan affect human glycemic response by modifying starch digestibility. Food Chemistry, Vol. 129, No. 2, pp. 297–304.
Regand, A., Tosh, S.M., Wolever, T.M. & Wood, P.J. 2009. Physicochemical properties of -glucan in differently processed oat foods influence glycemic response. Journal of Agricultural and Food Chemistry, Vol. 57, No. 19, pp. 8831–8838.
Renzetti, S., Courtin, C.M., Delcour, J.A. & Arendt, E.K. 2010. Oxidative and proteolytic enzyme preparations as promising improvers for oat bread formulations: Rheological, biochemical and microstructural background. Food Chemistry, Vol. 119, No. 4, pp. 1465–1473.
Rimsten, L., Stenberg, T., Andersson, R., Andersson, A. & Åman, P. 2003. Determination of -glucan molecular weight using SEC with Calcofluor detection in cereal extracts. Cereal Chemistry, Vol. 80, No. 4, pp. 485–490.
Rittstieg, K., Suurnäkki, A., Suortti, T., Kruus, K., Guebitz, G. & Buchert, J. 2002. Investigations on the laccase-catalyzed polymerization of lignin model compounds using size-exclusion HPLC. Enzyme and Microbial Technology, Vol. 31, No. 4, pp. 403–410.
Robb, D.A. 1984. Tyrosinase. In: Copper proteins and copper enzymes. Lontie, R. (eds.). CRC Press Inc. Boca Raton, FL. Pp. 207–240.
Robert, H., Gabriel, V., Lefebvre, D., Rabier, P., Vayssier, Y. & Fontagné-Faucher, C. 2006. Study of the behaviour of Lactobacillus plantarum and Leuconostoc

85
starters during a complete wheat sourdough breadmaking process. LWT – Food Science and Technology, Vol. 39, No. 3, pp. 256–265.
Robert, L.S., Nozzolillo, C. & Altosaar, I. 1985. Homology between rice glutelin and oat 12 S globulin. Biochimica et Biophysica Acta (BBA) – Protein Structure and Molecular Enzymology, Vol. 829, No. 1, pp. 19–26.
Robert, L.S., Nozzolillo, C., Cudjoe, A. & Altosaar, I. 1983. Total solubilization of groat proteins in high protein oat (Avena sativa L. cv. Hinoat): Evidence that glutelins are a minor component. Canadian Institute of Food Science and Technology Journal, Vol. 16, No. 3, pp. 196–200.
Roels, S.P., Grobet, P.J. & Delcour, J.A. 1998. Distribution of carbohydrates in gluten fractions isolated from European wheats (Triticum aestivum L.) in a batter system. Journal of Agricultural and Food Chemistry, Vol. 46, No. 4, pp. 1334–1343.
Rosell, C.M., Haros, M., Escrivá, C. & Benedito de Barber, C. 2001. Experimental approach to optimize the use of -amylases in breadmaking. Journal of Agricultural and Food Chemistry, Vol. 49, No. 6, pp. 2973–2977.
Rouau, X., El-Hayek, M.L. & Moreau, D. 1994. Effect of an enzyme preparation containing pentosanases on the bread making quality of flours in relation to changes in pentosan properties. Journal of Cereal Science, Vol. 19, No. 3, pp. 259–272.
Rouau, X. & Moreau, D. 1993. Modification of some physicochemical properties of wheat flour pentosans by an enzyme complex recommended for baking. Cereal Chemistry, Vol. 70, No. 6, pp. 626–632.
Rouau, X. & Surget, A. 1994. A rapid semi-automated method for the determination of total and water-extractable pentosans in wheat flours. Carbohydrate Polymers, Vol. 24, No. 2, pp. 123–132.
Rudel, H.W. 1990. A composition of flours containing vital gluten and soluble oat dietary fiber and a baked product produced therefrom. United States Patent 4961937.
Sabanis, D., Lebesi, D. & Tzia, C. 2009. Effect of dietary fibre enrichment on selected properties of gluten-free bread. LWT – Food Science and Technology, Vol. 42, No. 8, pp. 1380–1389.

86
Saeed, F., Pasha, I., Anjum, F.M. & Sultan, M.T. 2011. Arabinoxylans and arabinogalactans: a comprehensive treatise. Critical Reviews in Food Science and Nutrition, Vol. 51, No. 5, pp. 467–476.
Saulnier, L., Andersson, R. & Åman, P. 1997. A study of the polysaccharide components in gluten. Journal of Cereal Science, Vol. 25, No. 2, pp. 121–127.
Selinheimo, E., Kruus, K., Buchert, J., Hopia, A. & Autio, K. 2006. Effects of laccase, xylanase and their combination on the rheological properties of wheat doughs. Journal of Cereal Science, Vol. 43, No. 2, pp. 152–159.
Selinheimo, E., NiEidhin, D., Steffensen, C., Nielsen, J., Lomascolo, A., Halaouli, S., Record, E., O’Beirne, D., Buchert, J. & Kruus, K. 2007a. Comparison of the characteristics of fungal and plant tyrosinases. Journal of Biotechnology, Vol. 130, No. 4, pp. 471–480.
Selinheimo, E., Autio, K., Kruus, K. & Buchert, J. 2007b. Elucidating the mechanism of laccase and tyrosinase in wheat bread making. Journal of Agricultural and Food Chemistry, Vol. 55, No. 15, pp. 6357–6365.
Shewry, P.R. 1995. Plant storage proteins. Biological Reviews, Vol. 70, No. 3, pp. 375–426.
Shewry, P.R., Piironen, V., Lampi, A.M., Nyström, L., Li, L., Rakszegi, M., Fras, A., Boros, D., Gebruers, K., Courtin, C.M., Delcour, J.A., Andersson, A.A., Dimberg, L., Bed , Z. & Ward, J.L. 2008. Phytochemical and fiber components in oat varieties in the HEALTHGRAIN diversity screen. Journal of Agricultural and Food Chemistry, Vol. 56, No. 21, pp. 9777–9784.
Shewry, P.R., Tatham, A.S., Forde, J., Kreis, M. & Miflin, B.J. 1986. The classification and nomenclature of wheat gluten proteins: A reassessment. Journal of Cereal Science, Vol. 4, No. 2, pp. 97–106.
Shewry, P.R., Piironen, V., Lampi, A.M., Edelmann, M., Kariluoto, S., Nurmi, T., Fernandez-Orozco, R., Ravel, C., Charmet, G., Andersson, A.A., Åman, P., Boros, D., Gebruers, K., Dornez, E., Courtin, C.M., Delcour, J.A., Rakszegi, M., Bedo, Z. & Ward, J.L. 2010. The HEALTHGRAIN wheat diversity screen: effects of genotype and environment on phytochemicals and dietary fiber components. Journal of Agricultural and Food Chemistry, Vol. 58, No. 17, pp. 9291–9298.
Shotwell, M. 1999. Oat globulins. In: Seed Proteins. Shewry, P.R. & Casey, R. (eds.). Kluwer Academic Publishers. Dordrecht, The Netherlands. Pp. 389–400.

87
Shotwell, M., Afonso, C., Davies, E., Chesnut, R. & Larkins, B. 1988. Molecular characterization of oat seed globulins. Plant Physiology, Vol. 87, No. 3, pp. 698–704.
Si, J.Q. 2001. Use of laccase in baking. United States Patent 6296883 B1.
Si, J.Q. 1997. Synergistic effect of enzymes for breadbaking. Cereal Foods World, Vol. 42, No. 10, pp. 802–807.
Smith, M.M. & Hartley, R.D. 1983. Occurrence and nature of ferulic acid substitution of cell-wall polysaccharides in graminaceous plants. Carbohydrate Research, Vol. 118, pp. 65–80.
Sosulski, F., Krzysztof, K. & Hogge, L. 1982. Free, esterified, and insoluble-bound phenolic acids. 3. Composition of phenolic acids in cereal and potato flours. Journal of Agricultural and Food Chemistry, Vol. 30, No. 2, pp. 337–340.
Southan, M. & MacRitchie, F. 1999. Molecular weight distribution of wheat proteins. Cereal Chemistry, Vol. 76, No. 6, pp. 827–836.
Stear, C.A. 1990. High-fibre breads. In: Handbook of breadmaking technology. Stear, C.A. (eds.). Elsevier Science Publishers Ltd. London, UK. Pp. 524–525.
Sundberg, B., Wood, P., Ågot, L., Andersson, H., Sandberg, A.S., Hallmans, G. & Åman, P. 1996. Mixed-linked -glucan from breads of different cereals is partly degraded in the human ileostomy model. American Journal of Clinical Nutrition, Vol. 64, No. 6, pp. 878–885.
Suortti, T. 1993. Size-exclusion chromatographic determination of betaglucan with post-column reaction detection. Journal of Chromatography, Vol. 632, No. 1–-2, pp. 105–110.
Takasaki, S. & Kawakishi, S. 1997. Formation of protein-bound 3,4-dihydroxyphenylalanine and 5-S-cysteinyl-3,4-dihydroxyphenylalanine as new cross-linkers in gluten. Journal of Agricultural and Food Chemistry, Vol. 45, No. 9, pp. 3472–3475.
Takasaki, S., Kawakishi, S., Murata, M. & Homma, S. 2001. Polymerisation of gliadin mediated by mushroom tyrosinase. LWT – Food Science and Technology, Vol. 34, No. 8, pp. 507–512.
Theuwissen, E. & Mensink, R.P. 2008. Water-soluble dietary fibers and cardiovascular disease. Physiology & Behavior, Vol. 94, No. 2, pp. 285–292.

88
Thiele, C., Gänzle, M.G. & Vogel, R.F. 2002. Contribution of sourdough lactobacilli, yeast, and cereal enzymes to the generation of amino acids in dough relevant for bread flavor. Cereal Chemistry, Vol. 79, No. 1, pp. 45–51.
TIKE 2010. Crop production statistics. Yield of the grain crops and potatoes 1920–2010. [Homepage of Information Centre of the Ministry of Agriculture and Forestry of Finland], [Online]. http://www.maataloustilastot.fi/en/crop-production-statistics [2011, 3/29].
Törrönen, R., Kansanen, L., Uusitupa, M., Hänninen, O., Myllymäki, O., Härkönen, H. & Mälkki, Y. 1992. Effects of oat bran concentrate on serum lipids in free-living men with mild to moderate hypercholesterolaemia. European Journal of Clinical Nutrition, Vol. 46, No. 3, pp. 621–627.
Tosh, S.M., Brümmer, Y., Wolever, T.M. & Wood, P.J. 2008. Glycemic response to oat bran muffins treated to vary molecular weight of beta-glucan. Cereal Chemistry, Vol. 85, No. 2, pp. 211–217.
Tosh, S.M., Brümmer, Y., Wood, P.J., Wang, Q. & Weisz, J. 2004. Evaluation of structure in the formation of gels by structurally diverse (1 3)(1 4)- --glucans from four cereal and one lichen species. Carbohydrate Polymers, Vol. 57, No. 3, pp. 249–259.
Trogh, I., Courtin, C.M., Andersson, A.A., Åman, P., Sörensen, J.F. & Delcour, J.A. 2004. The combined use of hull-less barley flour and xylanase as a strategy for wheat/hull-less barley flour breads with increased arabinoxylan and (1->3,1->4)-ß-D-glucan levels. Journal of Cereal Science, Vol. 40, No. 1, pp. 1–11.
U.S. Department of Agriculture, Agricultural Research Service 2011, October, 28, 2011-last update, USDA National Nutrient Database for Standard Reference, Release 24 [Homepage of USDA], [Online]. Available: http://www.ars.usda.gov/ba/bhnrc/ndl [2012, 2/3].
van Oort, M. 2009a. Enzymes in bread making. In: Enzymes in Food Technology. Whitehurst, R.J. & van Oort, M. (eds.). 2nd. ed. Wiley-Blackwell. Chichester, UK. Pp. 103–143.
van Oort, M. 2009b. Enzymes in food technology – introduction. In: Enzymes in Food Technology. Whitehurst, R.J. & van Oort, M. (eds.). 2nd ed. Wiley-Blackwell. Chichester, UK. Pp. 1–17.
Veraverbeke, W.S., Courtin, C.M., Verbruggen, I.M. & Delcour, J.A. 1999. Factors governing levels and composition of the sodium dodecyl sulphate-

89
unextractable glutenin polymers during straight dough breadmaking. Journal of Cereal Science, Vol. 29, No. 2, pp. 129–138.
Virkki, L., Johansson, L., Ylinen, M., Maunu, S. & Ekholm, P. 2005. Structural characterization of water-insoluble nonstarchy polysaccharides of oats and barley. Carbohydrate Polymers, Vol. 59, No. 3, pp. 357–366.
Wang, L., Miller, R.A. & Hoseney, R.C. 1998. Effects of (1 3)(1 4)- -D-glucans of wheat flour on breadmaking. Cereal Chemistry, Vol. 75, No. 5, pp. 629–633.
Wang, M., Hamer, R.J., van Vliet, T. & Oudgenoeg, G. 2002. Interaction of water extractable pentosans with gluten protein: effect on dough properties and gluten quality. Journal of Cereal Science, Vol. 36, No. 1, pp. 25–37.
Webb, E.C. 1992. Enzyme nomenclature 1992: recommendations of the Nomenclature Committee of the International Union of Biochemistry and Molecular Biology on the nomenclature and classification of enzymes. Academic Press ed. San Diego, CA.
Welch, R.W. 2006. Cereal grains. In: The encyclopedia of human nutrition. Caballero, B., Allen, L. & Prentice, A. (eds.). 2nd ed. Academic press. New York, NY. Pp. 346–357.
Werner, W., Rey, H.G. & Wielinger, H. 1970. Über die Eigenschaften eines neuen Chromogens für die Blutzuckerbestimmung nach der GOD/GOP-Methode. Fresenius Zeitschrift für Analytische Chemie, Vol. 252, No. 2–3, pp. 224–228.
Westerlund, E., Andersson, R. & Åman, P. 1993. Isolation and chemical characterization of water-soluble mixed-linked ß-glucans and arabinoxylans in oat milling fractions. Carbohydrate Polymers, Vol. 20, No. 2, pp. 115–123.
Whitaker, J.R. 2003. What enzymes do and why they are highly specific and efficient catalysts. In: Handbook of Food Enzymology. Whitaker, J.R., Voragen, A.G.J. & Wong, D.W.S. (eds.). Marcel Dekker, Inc. New York, NY. Pp. 21–30.
Wieser, H., Vermeulen, N., Gaertner, F. & Vogel, R.F. 2008. Effects of different Lactobacillus and Enterococcus strains and chemical acidification regarding degradation of gluten proteins during sourdough fermentation. European Food Research and Technology, Vol. 226, No. 6, pp. 1495–1502.
Wolever, T.M., Tosh, S.M., Gibbs, A.L., Brand-Miller, J., Duncan, A.M., Hart, V., Lamarche, B., Thomson, B.A., Duss, R. & Wood, P.J. 2010. Physicochemical properties of oat -glucan influence its ability to reduce

90
serum LDL cholesterol in humans: A randomized clinical trial. American Journal of Clinical Nutrition, Vol. 92, No. 4, pp. 723–732.
Wood, P.J. 2011. Oat -glucan: properties and function. In: Oats chemistry and technology. Webster, F.H. & Wood, P.J. (eds.). 2nd ed. AACC International, Inc. St. Paul, MN. Pp. 219–254.
Wood, P.J. 2007. Cereal -glucans in diet and health. Journal of Cereal Science, Vol. 46, No. 3, pp. 230–238.
Wood, P.J. 1993. Physicochemical characteristics and physiological properties of oat (1->3) (1->4) -ß-D-glucan. In: Oat Bran. Wood, P.J. (eds.). AACC Inc. St. Paul, MN. Pp. 83–112.
Wood, P.J., Weisz, J. & Blackwell, B.A. 1994. Structural studies of (1->3),(1->4)-B-D-glucans by 13C-nuclear magnetic resonance spectroscopy and by rapid analysis of cellulose-like regions using high-performance anion-exchange chromatography of oligosaccharides released by lichenase. Cereal Chemistry, Vol. 71, No. 3, pp. 301–307.
Wood, P.J., Weisz, J. & Blackwell, B.A. 1991a. Molecular characterization of cereal -D-Glucans. Structural analysis of oat -D-Glucan and rapid structural evaluation of -D-Glucans from different sources by high-performance liquid chromatography of oligosaccharides released by lichenase. Cereal Chemistry, Vol. 68, No. 1, pp. 31–39.
Wood, P.J., Weisz, J. & Mahn, W. 1991b. Molecular characterization of cereal -glucans. II. Size-exclusion chromatography for comparison of molecular weight. Cereal Chemistry, Vol. 68, No. 5, pp. 530–536.
Wrigley, C.W. 1996. Giant proteins with flour power. Nature, Vol. 381, No. 6585, pp. 738–738.
Xu, R., Huang, X., Hopkins, T.L. & Kramer, K.J. 1997. Catecholamine and histidyl protein cross-linked structures in sclerotized insect cuticle. Insect Biochemistry and Molecular Biology, Vol. 27, No. 2, pp. 101–108.
Yao, N., Jannink, J.L. & White, P.J. 2007. Molecular weight distribution of (1 3)(1 4)- -glucan affects pasting properties of flour from oat lines with high and typical amounts of -glucan. Cereal Chemistry, Vol. 84, No. 5, pp. 471–479.
Youngs, V.L. 1972. Protein distribution in the oat kernel. Cereal Chemistry, Vol. 49, No. 4, pp. 407–411.

91
Zhang, D.C., Moore, W.R. & Doehlert, D.C. 1998. Effects of oat grain hydrothermal treatments on wheat-oat flour dough properties and breadbaking quality. Cereal Chemistry, Vol. 75, No. 5, pp. 602–605.
Zielinski, H., Kozlowska, H. & Lewczuk, B. 2001. Bioactive compounds in cereal grains before and after hydrothermal processing. Innovative Food Science & Emerging Technologies, Vol. 2, No. 3, pp. 159–169.
Zotta, T., Piraino, P., Ricciardi, A., McSweeney, P.L. & Parente, E. 2006. Proteolysis in model sourdough fermentations. Journal of Agricultural and Food Chemistry, Vol. 54, No. 7, pp. 2567–2574.
Zurbriggen, B.Z., Bailey, M.J., Poutanen, K. & Linko, M. 1990. Pilot scale production of a heterologous Trichoderma reesei cellulase in Saccharomyces cerevisiae. Journal of Biotechnology, Vol. 13, No. 4, pp. 267–278.
Appendices of this publication are not included in the PDF version. Please order the printed version to get the complete publication (http://www.vtt.fi/publications/index.jsp)


Series title and number VTT Science 8
Title Bioprocessing to improve oat bread quality Author(s) Laura Flander
Abstract The health-promoting properties of whole grain oat have made it a desirable ingredient for use in breads. However, the absence of gluten-forming proteins and high fibre content pose technological challenges with respect to product texture. Fundamental understanding about the role of oat components on the structure formation of dough and bread is needed to facilitate the development of new healthy variants of oat breads with consumer appealing properties.
A concept was created for using whole grain oat flour as a base in an oat-wheat bread with high β-glucan content and good textural and sensory quality. Ingredient and process parameters for optimised texture and taste of the oat-wheat bread were established without extensive degradation of β-glucan. The potential of bioprocessing methods, such as the use of sourdough and enzymes, to modify the chemical and rheological properties of oat doughs, and to improve the texture and flavour of oat breads were also investigated.
The maximal specific volume 3.6 (cm3/g), minimal instrumental hardness (0.1 kg after 2 h, and 0.3 kg after 72 h storage), and optimised sensory properties were attained for an oat-wheat bread by adding 15.2 g gluten and 91.5 g water/100 g flour to the dough, which was proofed at 40 °C for 75 min and baked at 210 °C. The optimized recipe and processing parameters provided the baking conditions for preparing an oat-wheat bread containing 51% oat by weight of flour mixture with good taste and structure as well as long shelf life.
The use of an optimized wheat sourdough process in the production of oat-wheat bread provided a feasible method of producing a new type of bread with high β-glucan content. The optimal sourdough conditions for enhanced crumb texture and flavour of the bread were achieved by a small addition of wheat sourdough (10 g/100 g dough) which had been fermented at 40 °C for 20 hours. The use of optimized sourdough resulted in a bread with similar specific volume and staling rate as the corresponding straight dough bread.
The use of wheat sourdough did not affect the content or molecular weight of β-glucan as compared to straight dough bread. The amount of β-glucan in both breads was 1.5±0.1 g/100 g fresh weight. This means that a portion (2 slices, á 34 g) of the bread contained 1.0 g β-glucan, which is the amount required for a cholesterol-lowering health claim in the EU. The molecular weight of the β-glucan was reduced from 1.0 million in the oat flour to 0.55 million in both breads, showing that a slight degradation of β-glucan occurred during the bread-making phase. This was most likely due to the endogenous β-glucanase activity present in the wheat flour.
The potential of cross-linking enzymes, such as laccase (LAC) and tyrosinase (TYR), to modify oat macropolymers during oat bread making was studied either alone or together with xylanase (XYL). TYR was more effective than LAC in improving the specific volume and reducing the firmnesss of the gluten-free oat bread, especially in combination with XYL. The degradation of arabinoxylan by XYL together with slight degradation of β-glucan by β-glucanase side activity in LAC preparation was suggested to improve the specific volume of whole grain oat, gluten-free oat, and oat-wheat breads, and the softness of fresh oat-wheat bread. The polymerization of oat globulins by TYR together with degradation of arabinoxylan by XYL was suggested to be the main contributors to improved volume and softness of gluten-free oat bread.
In conclusion, the flavour and texture of oat bread was found to be effectively modified with the sourdough and enzyme bioprocessing treatments employed. Sourdough improved the intensity of flavour without excess acidity or pungency. Wheat sourdough did not reduce the content or molecular weight of β-glucan in oat-wheat bread. Use of LAC and XYL was most effective in improving the texture of oat-wheat bread. It was shown in this work that TYR efficiently cross-linked oat globulins, which was suggested to improve the textural properties of gluten-free oat bread.
ISBN, ISSN ISBN 978-951-38-7463-6 (soft back ed.) ISSN 2242-119X (soft back ed.) ISBN 978-951-38-7464-3 (URL: http://www.vtt.fi/publications/index.jsp) ISSN 2242-1203 (URL: http://www.vtt.fi/publications/index.jsp)
Date August 2012
Language English, Finnish abstract
Pages 91 p. + app. 45 p.
Keywords oat, baking, β-glucan, bread, sourdough, wheat, gluten-free, dough, tyrosinase, laccase, xylanase, protein, cross-linking
Publisher VTT Technical Research Centre of Finland P.O. Box 1000, FI-02044 VTT, Finland, Tel. 020 722 111


Julkaisun sarja ja numero VTT Science 8
Nimeke Bioprosessointi kauraleivän laadun parantajana Tekijä(t) Laura Flander
Tiivistelmä Täysjyväkauran terveyttä edistävät ominaisuudet ovat tehneet siitä houkuttelevan raaka-aineen leipomotuotteisiin. Kaura on kuitenkin haasteellinen leivonnan raaka-aine, koska se sisältää paljon kuitua eikä kauraproteiineilla ole vehnälle ominaista sitkonmuodostuskykyä hiivataikinassa. Tarvitaankin lisää tietoa kaurakomponenttien vaikutuksista taikinan ja leivän rakenteeseen, jotta voidaan paremmin muokata kauratuotteille haluttu rakenne ja maku, ilman että kauratuotteiden terveyttä edistävät ominaisuudet menetetään.
Tässä työssä kehitettiin täysjyväkaurajauhoa pääraaka-aineenaan sisältävä kaura-vehnä-leipä, jolla on hyvät rakenne- ja makuominaisuudet sekä suuri β-glukaanipitoisuus. Lisäksi tutkittiin kahden bioprosessointimenetelmän, raskituksen ja entsyymien, mahdollisuuksia muokata kaura-vehnä- tai täyskaurataikinoiden kemiallisia ja reologisia ominaisuuksia sekä parantaa kauraleivän rakennetta ja makua.
Ensin selvitettiin, mitkä ovat tärkeimmät raaka-aine- ja prosessimuuttujat kaura-vehnäleivän maun ja rakenteen optimoimiseksi, ilman että β-glukaani pilkkoutuisi liikaa leivontaprosessin aikana. Paras ominaistilavuus (3,6 cm3/g) ja pehmeys (0,1 kg 2 tunnin ja 0,3 kg 3 vuorokauden säilytyksen jälkeen) oli kaura-vehnäleivällä, joka sisälsi 15,2 g gluteenia ja 91,5 g vettä / 100 g jauhoseosta ja jota oli nostatettu 75 minuuttia 40 °C:ssa ja paistettu 210 °C:ssa. Reseptin ja prosessimuuttujien optimointi mahdollisti 51 % täysjyväkaurajauhoa sisältävän leivän valmista-misen, jolla oli hyvä maku ja rakenne ja joka säilyi pitkään pehmeänä.
Vehnäraskitusprosessin optimointi osoittautui hyväksi keinoksi tuottaa uusia makuvaihto-ehtoja runsaasti β-glukaania sisältävälle kaura-vehnäleivälle. Paras leivän rakenne ja maku saatiin fermentoimalla vehnäraskia 20 tuntia 40 °C:ssa ja lisäämällä sitä 10 % taikinan painosta. Tällä raskileivällä oli sama ominaistilavuus ja pehmeys kuin vastaavalla suoraleivotulla leivällä.
Vehnäraskin lisääminen ei vaikuttanut β-glukaanin määrään tai molekyylikokoon. β-glukaanin määrä kummassakin leivässä oli 1,5 g / 100 g leipää. Tämä tarkoittaa, että annos (2 viipaletta, á 34 g) leipää sisältää 1,0 g β-glukaania, mikä vaaditaan kolesterolia alentavan väittämän käyttöön EU:ssa. β-glukaanin keskimääräinen molekyylikoko pieneni kaurajauhon 1,0 miljoonasta 0,55 miljoonaan kummassakin leivässä osoittaen, että β-glukaani pilkkoutui leivontaprosessin aikana. Tämä johtui todennäköisesti vehnäjauhon sisältämästä β-glukanaasiaktiivisuudesta.
Ristisitovien entsyymien, kuten lakkaasin ja tyrosinaasin kykyä muokata kauran makropoly-meerejä leivontaprosessin aikana tutkittiin joko erikseen tai ksylanaasin kanssa. Tyrosinaasi lisäsi tehokkaammin gluteenittoman kauraleivän ominaistilavuutta ja pehmeyttä kuin lakkaasi, erityisesti ksylanaasin kanssa. Lakkaasi ja ksylanaasi lisäsivät täysjyväkauraleivän, gluteenittoman kauraleivän sekä kaura-vehnäleivän ominaistilavuutta ja tuoreen kaura-vehnäleivän pehmeyttä. Niiden vaikutus johtui ilmeisesti pääosin ksylanaasin katalysoimasta arabinoksylaanin pilkkoutumisesta ja lakkaasin sisältämästä β-glukanaasisivuaktiivisuudesta, joka hieman pienensi β-glukaanin molekyylikokoa kaurataikinassa. Tyrosinaasin vaikutus perustui pääosin kauran globuliinien polymeroitumiseen, joka yhdistettynä ksylanaasin katalysoimaan arabinoksylaanin pilkkoutumiseen paransi gluteenittoman kauraleivän ominaistilavuutta ja pehmeyttä.
Tässä työssä osoitettiin, että kauraleivän makua ja rakennetta voidaan tehokkaasti muokata bioprosessoinnin avulla. Raskituksella voitiin vahvistaa kauraleivän makua ilman hapanta tai pistävää sivumakua. Vehnäraski ei pienentänyt kaura-vehnäleivän β-glukaanin määrää tai molekyylikokoa. Lakkaasin ja ksylanaasin yhdistelmä oli tehokkain kaura-vehnäleivän rakenteen parantamisessa. Tyrosinaasi paransi gluteenittoman kauraleivän rakenneominaisuuksia, mikä johtui pääosin tyrosinaasin katalysoimasta kauran globuliinien polymeroitumisesta.
ISBN, ISSN ISBN 978-951-38-7463-6 (nid.) ISSN 2242-119X (nid.) ISBN 978-951-38-7464-3 (URL: http://www.vtt.fi/publications/index.jsp) ISSN 2242-1203 (URL: http://www.vtt.fi/publications/index.jsp)
Julkaisuaika Elokuu 2012
Kieli Englanti, suomenkielinen tiivistelmä
Sivumäärä 91 s. + liitt. 45 s.
Avainsanat oat, baking, β -glucan, bread, sourdough, wheat, gluten-free, dough, tyrosinase, laccase, xylanase, protein, cross-linking
Julkaisija VTT PL 1000, 02044 VTT, Puh. 020 722 111

VT
T S
CIE
NC
E 8
B
iop
rocessin
g to
imp
rove
oat b
read
qu
ality
ISBN 978-951-38-7463-6 (soft back ed.) ISBN 978-951-38-7464-3 (URL: http://www.vtt.fi/publications/index.jsp)ISSN 2242-119X (soft back ed.) ISSN 2242-1203 (URL: http://www.vtt.fi/publications/index.jsp)
Bioprocessing to improve oat bread quality
Oats contain a considerable amount of the soluble fibre β-glucan, which has recently received an authorised cholesterol lowering health claim in all member states of the EU. The healthy and natural image of whole grain oats has made them a desirable ingredient for use in breads. However, the absence of gluten-forming proteins and high fibre content pose technological challenges with respect to product texture. Fundamental understanding of the role of oat components on the structure formation of dough and bread is needed to facilitate the development of new healthy variants of oat breads with consumer-appealing properties. This thesis studied the effects of baking and bioprocessing methods, such as the use of sourdough and enzymes, on the chemical and rheological properties of oat doughs, the stability of β-glucan, and the quality attributes of oat breads.
A concept was created for using whole grain oat flour as a base in an oat-wheat bread with good textural and sensory quality and high β-glucan content. Ingredient and process parameters for optimised texture and taste of the oat-wheat bread were established without extensive degradation of β-glucan. The use of an optimized sourdough process in the production of oat bread provided a feasible technique for producing a new tasty variant of oat bread with high β-glucan content. The use of enzymes, such as laccase and xylanase, proved highly effective in improving the texture of oat-wheat bread. It was shown in this work that tyrosinase efficiently cross-linked oat protein, which was suggested to improve the textural properties of gluten-free oat bread. The identified positive effects on the baking quality of oat bread encourage the food ingredient and baking industry to apply bioprocessing as a powerful tool for improving the flavour and texture of healthy bakery products.