biomass yield and nitrogen content of annual energy/forage crops preceded by cover crops
TRANSCRIPT

Bp
DD
a
ARRA
KCNAFE
1
ep1cu2e
BM
h0
Field Crops Research 167 (2014) 31–39
Contents lists available at ScienceDirect
Field Crops Research
jou rn al hom epage: www.elsev ier .com/ locate / fc r
iomass yield and nitrogen content of annual energy/forage cropsreceded by cover crops
.P. Samarappuli, B.L. Johnson, H. Kandel, M.T. Berti ∗
epartment of Plant Sciences, North Dakota State University, PO Box 6050, Fargo, ND 58108, USA
r t i c l e i n f o
rticle history:eceived 24 April 2014eceived in revised form 5 July 2014ccepted 8 July 2014
eywords:over cropso-tillnnual energy/forage cropsorage qualitythanol yield
a b s t r a c t
In order to reduce input costs and improve sustainability of energy/forage crops in the northern GreatPlains (NGP), preceding cover crops can be included into existing annual crop systems. The objective ofthe study was to determine biomass yield and quality of five annual energy/forage crops, grown aftersix different, leguminous and non-leguminous cover crop species. The experiment was conducted attwo locations, Fargo and Prosper, ND, from 2010 to 2012. The experimental design was a randomizedcomplete block with three replicates, in a split-plot arrangement where the preceding season’s covercrop was the main plot and the forage crop was the sub-plot. Six cover crops, forage pea (Pisum sativumL.) cv. Arvika, Austrian winter pea (Pisum sativum ssp. arvense (L.) Poir), hairy vetch (Vicia villosa Roth.)forage radish (Raphanus sativus var. niger) cv. Daikon, turnip (Brassica rapa var. rapa) cv. Purple Top, andforage turnip (Brassica campestris x napus) cv. Pasja, were planted no-till on 8 to 9 August in 2010 and2011 into oat (Avena sativa L.) residue. In the following spring, five energy/forage crops, maize (Zea maysL.), forage sorghum and sweet sorghum (Sorghum bicolor L.), oat, and barley (Hordeum vulgare L.) wereplanted no-till onto the winter-killed cover crops residue. Results across locations and years indicatedforage pea and forage radish, produced the highest dry matter yield (3.3 Mg ha−1) in the fall. Total plantN content was 116 kg N ha−1 in forage peas and 76 kg N ha−1 in forage radish, respectively. Results acrosslocations and years indicated all energy/forage crops had greater biomass yield, and total N content whenpreceded by a legume cover crop compared with a non-legume or the check, in the previous year. Forage
−1
sorghum had the highest average biomass yield among the five energy/forage crops, with 17.8 Mg ha ,followed by sweet sorghum with 15.3 Mg ha−1. In conclusion, forage pea was the most suitable covercrop to provide additional N for the subsequent crops in the NGP. Forage sorghum and sweet sorghumcan be considered as the most productive energy/forage crops, especially when preceded by a legumecover crop.© 2014 Elsevier B.V. All rights reserved.
. Introduction
In order to meet the future demand for energy and to improvenergy security in the USA, the Biofuels Security Act of 2007 pro-osed a requirement of 37.9 Hm3 of renewable fuels by 2010,13.6 Hm3 by 2020, and 227.1 Hm3 by 2030. Also, a recent USongressional mandate requires that 79.5 Hm3 of renewable liq-
id fuel must come from feedstock other than maize (Ugarte et al.,010). Such a mandate would require the use of crop and for-st residues and dedicated-energy crops as potential sources of∗ Corresponding author. Tel.: +1 701 231 6110; fax: +1 701 231 8474.E-mail addresses: [email protected] (D.P. Samarappuli),
[email protected] (B.L. Johnson), [email protected] (H. Kandel),[email protected] (M.T. Berti).
ttp://dx.doi.org/10.1016/j.fcr.2014.07.005378-4290/© 2014 Elsevier B.V. All rights reserved.
biomass. To develop an economically viable feedstock productionsystem, inputs must be optimized to reduce the cost of productionof biofuels below the level of fossil-fuel based energy. Further, a sus-tainable feedstock production system should be able to maintain orenhance soil fertility, productivity, and control soil erosion.
Annual cropping systems used in energy production, they allhave a substantial requirement for N, P, and K fertilizer for opti-mum crop growth. Therefore, finding alternatives to substitute foror minimize these fertilizer inputs is needed to reduce the costof production and greenhouse gases emissions (GHG). Nitrogenfertilizer is the most energy intensive input and accounts for 41to 64% of the energy inputs in annual grain crops and 17 to 45%
of inputs in perennials (Sanderson and Adler, 2008). According toTonitto et al. (2006), humans are introducing 170 Tg of reactive Ninto agrosystems annually of which synthetic fertilizers contribute80 Tg. Synthesis of fertilizers also requires significant amounts of
3 Crops
fHrt2
srawep
rfatt(abS
kfNta9ic
ppeta2pD
iTtcratiu(w
vtirmttc
ofiie
sissippi State University (Jackson, MS), and forage oat and foragebarley seeds from the NDSU Seed Stocks project (Fargo, ND). Seed-
2 D.P. Samarappuli et al. / Field
ossil fuel energy and produces related hydrocarbon emissions.owever, only 45 to 55% of the reactive N entering agrosystems is
ecovered in the crop biomass (Smil, 1999). The remaining N is losthrough denitrification, leaching, runoff, and erosion (Anex et al.,007; Sanderson and Adler, 2008).
Cropping systems including combinations of cool- and warm-eason annuals as dedicated bioenergy crops have been evaluatedecently. Double-cropping cool-season cereals with warm-seasonnnuals, such as maize and sorghum, was reported in the Mid-estern USA, where the winter-cereal crop was removed as forage
arly in the spring to allow early planting of maize for grain ethanolroduction (Sanderson and Adler, 2008).
Inputs must be optimized in biomass cropping systems toeduce biofuel production costs below the costs associated withossil-fuel based fertilizer systems. Due to their inherent symbioticbility, leguminous cover crops can fix atmospheric N and reducehe use of N fertilizer and production costs. Nitrogen accumula-ion by leguminous cover crops can range from 60 to 200 kg N ha−1
Hargrove, 1986; Newman et al., 2007). The amount of N avail-ble from legumes depends on the species of legume grown, totaliomass produced, and N content in the plant tissue (Fageria, 2007;ullivan, 2003).
Non-leguminous cover crops in the Brassicaceae family arenown for their potential to scavenge excess N and other nutrientsrom deep in the soil thus minimizing nitrate losses from leaching.utrients released from the biomass will be available for the crops
he following season (Sundermeier, 2008). According to Sainjund Singh (1997), non-legumes can reduce nitrate leaching up to4%. This could reduce ground water contamination and fertilizer
nputs, which would improve the energy balance of energy/foragerops.
Cover crops also provide a range of additional benefits to a crop-ing system. Accumulation of soil organic matter can increase theopulation of soil microbes and earthworms, which contribute tofficient nutrient cycling (Tiessen et al., 1994). Soil organic mat-er influences soil compaction, friability, water holding capacity,ir and water exchange, and permeability and erodibility (Carter,002). Deep tap-rooted cover crops also help alleviate soil com-action and improve water infiltration (Newman et al., 2007; Northakota State Univ. Ext. Serv., 2010; Williams and Weil, 2004).
Studies have demonstrated the benefits of including cover cropsn food crop rotations (Holderbaum et al., 1990; Ort et al., 2013;onitto et al., 2006), but not in energy/forage systems where theotal biomass of the crop is harvested. Tonitto et al. (2006), afteronducting a meta-analysis of crop grain yield and N dynamics,eported that legume cover crops, incorporated as green manurend providing ≥110 kg N ha−1, resulted in crop yields similar tohose obtained by applying recommended rates of inorganic fertil-zer. Also, there were no differences between sorghum grain yieldnder conventional and legume N management systems. Ort et al.2013), reported cereal cover crops accumulated 18 to 29 kg N ha−1,hen seeded after silage maize.
In forage and dedicated-energy crops the total biomass is har-ested for feed or feedstock for lignocellulosic-derived biofuels. Inhese crops, removal of nutrients off the field is much greater thann grain crops where the nutrients in the remaining residue areeturned to the soil. Thus in annual crops, for forage or energy,anagement and recycling of nutrients is even more impor-
ant than in grain crops and there is limited information abouthe use of cover crops preceding an annual forage or bioenergyrop.
This study, therefore, was carried out to determine the effectf six different cover crops and a non-cover crop control precedingve different energy/forage crops in biomass yield and forage qual-
ty of the energy/forage crops with the objective of identifying anfficient system to produce biomass for feed or fuel.
Research 167 (2014) 31–39
2. Materials and methods
2.1. Field establishment and experimental design
The experiment was conducted at two North Dakota State Uni-versity research (NDSU) sites at Fargo, ND, (−96◦812′W, 46◦897′N,274 m elevation) and Prosper, ND, (−97◦115 W, 47◦002′N, elevation284 m). The soil type in Fargo is a Fargo silty clay soil (fine, mont-morillonitic, frigid, Vertic Haplaquoll, with a leached and degradednitric horizon), while the soil in Prosper has a Kindred–Bearden siltyclay loam (Perella: fine-silty, mixed, superactive Typic Endoaquoll;Bearden: fine-silty, mixed, superactive, frigid Aeric Calciaquoll)(Web Soil Survey, 2009). Daily temperature and rainfall wererecorded by the NDAWN, 2012 system at both sites. Soil sampleswere taken at both locations for analysis in the fall of 2010 and2011, and in spring 2011 and 2012 before the forage crops wereplanted. Soil samples were taken at a 0- to 15-cm depth and testedfor pH, organic matter, P, and K (Franzen, 2010). The N–NO3 analy-sis was done from the soil samples taken at 0- to 15-cm and 15- to60-cm depth. The previous crop was oat at both locations in 2010and 2011. Oat was harvested for hay in late June in 2010 and earlyJuly in 2011.
The experimental design was a randomized complete block withthree replicates, in a split-plot arrangement where the cover croptreatment was the main plot and the energy/forage crop was thesub-plot. Experimental units were 9.1 m long and 1.5 m wide.
Cover crops treatments included; forage pea cv. Arvika, Austrianwinter pea, hairy vetch, forage turnip cv. Pasja, turnip cv. PurpleTop, forage radish cv. Daikon, and a check with no cover crop.
All cover crop seeds, except forage pea were purchased fromAgassiz Seed (West Fargo, ND), while forage pea seeds wereobtained from Stock Seed Farms (Murdock, NE). Seeding rates werecalculated based on the percentage of pure live seed (Table 1). Allcover crops were seeded with an 8-cone plot planter with eightrows spaced 15 cm apart. The seeding depth for all the cover cropswas 13 mm. Planting date for both Fargo and Prosper in 2010 was9 August, and in 2011 the experiment was planted on 11 August atboth locations.
Except for a pre-plant burn down application of glyphosate (N-(phosphonomethyl) glycine) (1.4 kg a.i. ha−1) in both locations andyears, cover crops were grown without any post-emergence herbi-cides or fertilizers containing N, P, or K. Fertilization with sulfurat a rate of 20 kg of S ha−1 was necessary to correct symptoms ofsulfur deficiency in all cover crops, in Fargo, in 2010. Symptomswere characterized by bright yellowing of older and newer leavesand stunting. The source of S was ZnSO4 and each replicate wasfertilized by hand-broadcasting without incorporation. Soil testsindicated S levels of 3 to 14 mg kg−1 before fertilizer application.Yellowing and stunting disappeared after the application.
In the spring of 2011 and 2012, five energy/forage crops wereplanted directly (no-till) into the dead overwintered cover cropresidues. In the spring of 2011, hairy vetch, the only cover crop thatover-wintered, was terminated at both locations with glyphosate(N-(phosphonomethyl) glycine) (1.4 kg a.i. ha−1), before seedingthe spring energy/forage crops, on 16 May 2011. In 2012, all covercrops were winter-killed at both locations, thus glyphosate was notapplied.
The energy/forage crops included forage barley (cv. Hayes), for-age oat (cv. Paul), maize (hybrid 56J86VT3), forage sorghum (cv.FS-5), and sweet sorghum (cv. Theis). Maize seeds were obtainedfrom Peterson Farms Seeds (Harwood, ND), forage sorghum seedsfrom WinField Solutions (Grant, NE), sweet sorghum from Mis-
ing rates were calculated based on the percentage of pure liveseed (Table 1). In 2011, all five forage crops were planted using an

D.P. Samarappuli et al. / Field Crops Research 167 (2014) 31–39 33
Table 1Seed purity, germination percentage, and seeding rate of six different cover crops and five energy/forage crops grown in Fargo and Prosper, ND, in 2010, 2011, and 2012.
Crop/cultivar Crop use Seed purity (%) Seed germination(%)
Seeding rate(PLS)† (kg ha−1)
Forage pea/Arvika Cover crop 99 95 67Austrian winter pea Cover crop 99 90 67Hairy vetch/ Cover crop 99 85 41Forage radish/Daikon Cover crop/grazing 99 90 14Turnip/purple top Cover crop/grazing 99 94 4Forage turnip/Pasja Cover crop/grazing 99 91 4Forage oat/Paul Hay/silage 90 90 112Forage barley/Hayes Hay/silage 90 91 112Maize/56J86VT3 Energy/hay/silage 90 90 25Sweet sorghum/Theis Energy/hay/silage 90 95 7
8rpssww
nb1[vsysflb
2
athitnawgsaa1
tpaelfl
1olmbbe
Forage sorghum/FS-5 Energy/hay/silage 90
† PLS: Seeding rates were calculated as Pure Live Seed (PLS).
-row-cone plot seeder on 26 May and 06 June in Prosper and Fargo,espectively. In 2012, forage barley, forage oat, and maize werelanted on 01 May at both locations, while forage sorghum andweet sorghum were planted on 15 May at both locations. The rowpacing for maize, forage sorghum, and sweet sorghum was 30 cmith four rows per plot. For forage oat and barley the row spacingas 15 cm with eight rows per plot.
All plots containing the energy/forage crops, including theo-cover crop (check) plot, were fertilized with 50 kg N ha−1,roadcasted on top of the crop in both locations in 01 July and1 June, in 2011 and 2012, respectively. The source of N was ureaCO (NH2)2] and each plot was fertilized individually. Nitrogenolatilization in check plots was likely to be minimal since it rainedoon after the application. Plots were hand weeded as needed bothears, however in 2012 weed control included a post-emergencepraying of bromoxynil + fluroxypyr [((4-amino-3,5-dichloro-6-uoro-2-pyridinyl)oxy) acetic acid] (0.26 kg a.i. ha−1) to controlroadleaf weeds, followed by hand weeding as needed.
.2. Plant sampling and analysis
The dependent variables evaluated for cover crops were biomassnd forage quality at the end of the growing season. Shortly beforehe expected first hard frost, biomass samples were collected byand clipping 1-m2 from each cover crop plot in each replicate
n 14 October at both locations in 2010 and 2011. Radish andurnip enlarged hypocotyls, hereafter referred to as roots, wereot removed from the ground and only the portion of the rootbove ground was harvested by cutting with a hand-clipper. Thisas done in order to not disturb the soil and keep intact the in-
round root portion hoping the subsequent crop would follow thatame root path the following season. In the legume cover crops, allbove ground biomass was harvested. Biomass samples were driedt 70 ◦C until constant weight. Dried samples were then ground to-mm size particles with a mill.
For energy/forage crops, plant height (from soil surface to theop most leaf) was measured for all the energy/forage crops in alllots before harvesting. Both forage barley and oat were harvested,t both locations, at the soft-dough stage or Zadoks 85 (Zadokst al., 1974). Harvest was 10 August 2011 and 11 July 2012 at bothocations. The six-center rows of each plot were harvested with aail-forage harvester leaving a stubble height of 10 cm.
Maize, sweet sorghum, and forage sorghum were harvested on7 September in both 2011 and 2012, at both locations. At the timef harvest, maize seeds were in the process of forming the black-ayer and forage sorghum and sweet sorghum grains were at the
ilk to soft-dough stage (Zadoks et al., 1974). Harvesting was doney hand-cutting all the plants in the two-center rows leaving a stub-le height of approximately 10 cm. Biomass yield was calculated forach plot and a sample was also taken for water content and quality
98 23
analysis. Quality analysis was conducted only on samples from tworeplicates. Approximately 10 to 12 days prior to the final harvest,tissue samples were taken from all energy/forage crops, in eachplot, to analyze for foliar N–NO3 content. In each plot the fourthtopmost leaf, on 10 plants, from the two-center rows, was takenfor N–NO3 content analysis. Harvested biomass and tissue sampleswere dried to measure and record dry weight and then ground to1-mm size particles with a mill.
Total plant tissue N–NO3 content for both cover crops and for-age crops was determined by salicylic acid colorimetric method(Cataldo et al., 1975). The determination of plant tissue quality anal-ysis was conducted to determine dry matter (DM) (AOAC Method934.01). The total N content was measured by the Kjeldahl method,percentage of ash with the AOAC Method 942.05, and crude protein(CP) with the AOAC Method 2001.11. Quality analysis was con-ducted to determine acid detergent fiber (ADF) (ANKOM, 2011,A200 Method 5), neutral detergent fiber (NDF) (ANKOM, 2011A200 Method 6), acid detergent lignin (ADL), in vitro dry mat-ter digestibility (IVDMD), and neutral detergent fiber digestibility(NDFD) (Tilley and Terry, 1963). Forage quality was compared basedon the relative feed value (RFV), which does not take CP in toaccount.
Plant N content of each cover crop was calculated by multiplyingthe dry matter biomass yield by the total N content (CP/6.25). The Nin the plant coming from N2 fixation in the legume crops was esti-mated by subtracting the average N content of non-legume cropsfrom that of each legume, although we are aware the N scavengingabilities of these crops are different from each other.
The potential ethanol yield for all energy crops in the study wascalculated with the following equation.
L ha−1 ethanol = 0.098×1000×Mg ha−1 biomass yield0.78943 (Dien et al.,
2009).Growing degree days (GDD), or heat units, were calculated
based on the base temperatures for each crop. The base temper-ature for the cool-season crops (oat and barley) was 0 ◦C (Enz andVasey, 2005) and for the warm-season crops (sorghum and maize)was 10 ◦C (McMaster and Wilhelm, 1997). Maximum temperatureswere not used for GDD calculations. These values were used whencalculating the monthly accumulated GGD (AGGD) and total AGGDfor each environment.
2.3. Statistical analysis
Statistical analysis was conducted using standard proceduresfor a randomized complete-block design with a split-plot arrange-
ment. Biomass yield, potential ethanol yield, and forage quality datawere analyzed using analysis of variance with the MIXED proce-dure of SAS (SAS Institute, 2012). Each location-year combinationwas considered an “environment” and a random effect, while both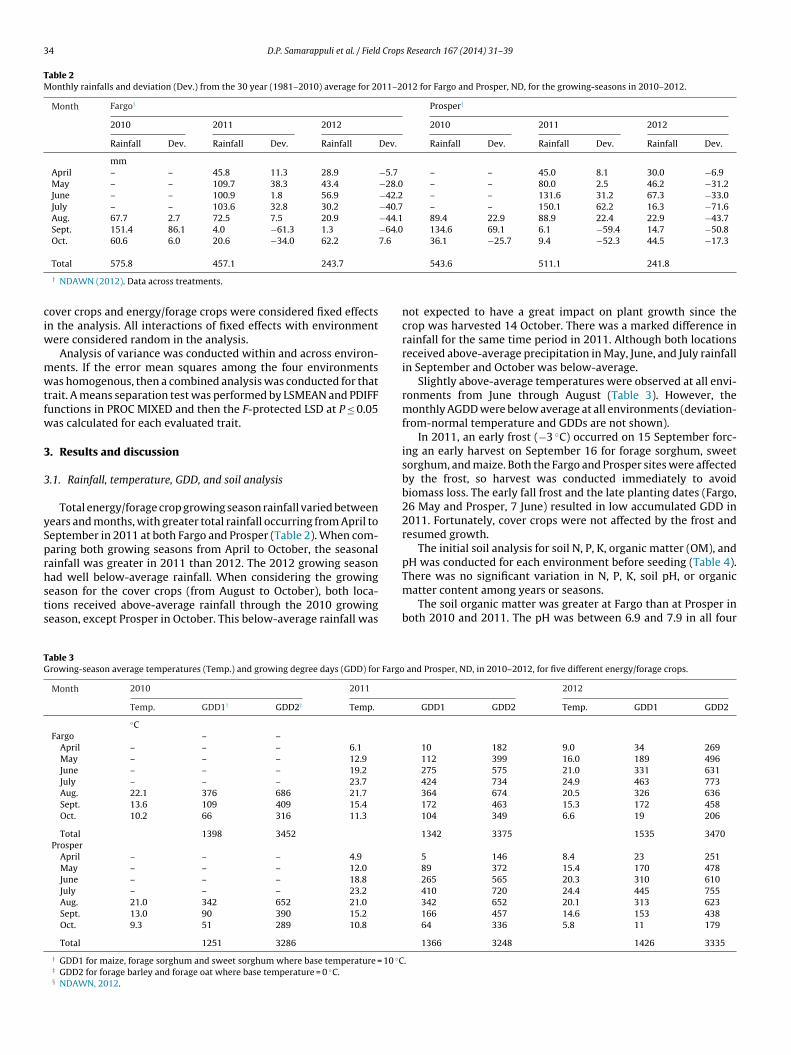
34 D.P. Samarappuli et al. / Field Crops Research 167 (2014) 31–39
Table 2Monthly rainfalls and deviation (Dev.) from the 30 year (1981–2010) average for 2011–2012 for Fargo and Prosper, ND, for the growing-seasons in 2010–2012.
Month Fargo† Prosper†
2010 2011 2012 2010 2011 2012
Rainfall Dev. Rainfall Dev. Rainfall Dev. Rainfall Dev. Rainfall Dev. Rainfall Dev.
mmApril – – 45.8 11.3 28.9 −5.7 – – 45.0 8.1 30.0 −6.9May – – 109.7 38.3 43.4 −28.0 – – 80.0 2.5 46.2 −31.2June – – 100.9 1.8 56.9 −42.2 – – 131.6 31.2 67.3 −33.0July – – 103.6 32.8 30.2 −40.7 – – 150.1 62.2 16.3 −71.6Aug. 67.7 2.7 72.5 7.5 20.9 −44.1 89.4 22.9 88.9 22.4 22.9 −43.7Sept. 151.4 86.1 4.0 −61.3 1.3 −64.0 134.6 69.1 6.1 −59.4 14.7 −50.8Oct. 60.6 6.0 20.6 −34.0 62.2 7.6 36.1 −25.7 9.4 −52.3 44.5 −17.3
ciw
mwtfw
3
3
ySprhsts
TG
Total 575.8 457.1 243.7
† NDAWN (2012). Data across treatments.
over crops and energy/forage crops were considered fixed effectsn the analysis. All interactions of fixed effects with environment
ere considered random in the analysis.Analysis of variance was conducted within and across environ-
ents. If the error mean squares among the four environmentsas homogenous, then a combined analysis was conducted for that
rait. A means separation test was performed by LSMEAN and PDIFFunctions in PROC MIXED and then the F-protected LSD at P ≤ 0.05as calculated for each evaluated trait.
. Results and discussion
.1. Rainfall, temperature, GDD, and soil analysis
Total energy/forage crop growing season rainfall varied betweenears and months, with greater total rainfall occurring from April toeptember in 2011 at both Fargo and Prosper (Table 2). When com-aring both growing seasons from April to October, the seasonalainfall was greater in 2011 than 2012. The 2012 growing season
ad well below-average rainfall. When considering the growingeason for the cover crops (from August to October), both loca-ions received above-average rainfall through the 2010 growingeason, except Prosper in October. This below-average rainfall wasable 3rowing-season average temperatures (Temp.) and growing degree days (GDD) for Fargo
Month 2010 2011
Temp. GDD1† GDD2‡ Temp.
◦CFargo – –
April – – – 6.1
May – – – 12.9
June – – – 19.2
July – – – 23.7
Aug. 22.1 376 686 21.7
Sept. 13.6 109 409 15.4
Oct. 10.2 66 316 11.3
Total 1398 3452
ProsperApril – – – 4.9
May – – – 12.0
June – – – 18.8
July – – – 23.2
Aug. 21.0 342 652 21.0
Sept. 13.0 90 390 15.2
Oct. 9.3 51 289 10.8
Total 1251 3286
† GDD1 for maize, forage sorghum and sweet sorghum where base temperature = 10 ◦C‡ GDD2 for forage barley and forage oat where base temperature = 0 ◦C.§ NDAWN, 2012.
543.6 511.1 241.8
not expected to have a great impact on plant growth since thecrop was harvested 14 October. There was a marked difference inrainfall for the same time period in 2011. Although both locationsreceived above-average precipitation in May, June, and July rainfallin September and October was below-average.
Slightly above-average temperatures were observed at all envi-ronments from June through August (Table 3). However, themonthly AGDD were below average at all environments (deviation-from-normal temperature and GDDs are not shown).
In 2011, an early frost (−3 ◦C) occurred on 15 September forc-ing an early harvest on September 16 for forage sorghum, sweetsorghum, and maize. Both the Fargo and Prosper sites were affectedby the frost, so harvest was conducted immediately to avoidbiomass loss. The early fall frost and the late planting dates (Fargo,26 May and Prosper, 7 June) resulted in low accumulated GDD in2011. Fortunately, cover crops were not affected by the frost andresumed growth.
The initial soil analysis for soil N, P, K, organic matter (OM), andpH was conducted for each environment before seeding (Table 4).
There was no significant variation in N, P, K, soil pH, or organicmatter content among years or seasons.The soil organic matter was greater at Fargo than at Prosper inboth 2010 and 2011. The pH was between 6.9 and 7.9 in all four
and Prosper, ND, in 2010–2012, for five different energy/forage crops.
2012
GDD1 GDD2 Temp. GDD1 GDD2
10 182 9.0 34 269112 399 16.0 189 496275 575 21.0 331 631424 734 24.9 463 773364 674 20.5 326 636172 463 15.3 172 458104 349 6.6 19 206
1342 3375 1535 3470
5 146 8.4 23 25189 372 15.4 170 478265 565 20.3 310 610410 720 24.4 445 755342 652 20.1 313 623166 457 14.6 153 43864 336 5.8 11 179
1366 3248 1426 3335
.

D.P. Samarappuli et al. / Field Crops Research 167 (2014) 31–39 35
Table 4Soil analysis results before and after each growth season at soil depths of 0 to 60 cm in Fargo and Prosper, ND, in 2010 to 2012.
Environment pH OM† P K N–NO3
mg kg−1 kg N–NO3 ha−1
FargoFall 2010 7.9 5.6 15 323 17Spring 2011 7.0 6.2 18 318 15Fall 2011 7.2 5.8 18 318 15Spring 2012 7.1 6.4 18 316 15Fall 2012 7.3 6.4 18 318 15
ProsperFall 2010 7.0 3.9 20 293 12Spring 2011 6.9 3.9 38 246 18Fall 2011 7.1 3.9 33 241 18Spring 2012 7.1 3.8 30 231 18
e(rar
3
yTa
3
m
Fis
TNi
m
Fall 2012 7.0 3.9
† OM: organic matter.
nvironments and considered adequate for all crops in this studyMengel and Kirkby, 1982). No additional P or K fertilization wasequired for any environment. Average soil N ranged between 15nd 17 kg N–NO3 ha−1 in both 2010 and 2011 in Fargo while, theange was 12 to 18 kg N–NO3 ha−1 at Prosper.
.2. Cover crops preceding energy/forage crops yield and quality
The cover crop main effect was significant (P ≤ 0.05) for biomassield, plant nitrogen content, CP, Ash, NDF, ADF, NDFD, and IVDMD.he environment by cover crop interaction was significant for CPnd ash content.
.2.1. Cover crop biomass yield and total plant nitrogen contentMean cover crops biomass yield averaged across four environ-
ents varied between 2.0 and 3.3 Mg ha−1 (Fig. 1). Forage pea,
ig. 1. Mean biomass yield of six different cover crops across four environmentsn Fargo and Prosper, ND, in 2010 and 2011. (Columns with same letter are notignificantly different at P = 0.05).
able 5itrogen content in the plant, estimated N2 fixation in legumes, and plant tissue quality p
n Fargo and Prosper, ND, in 2010 and 2011.
Cover crop N content N2† CP‡
kg ha−1 g kg−1
Forage pea 116 45 240
Austrian winter pea 85 14 264
Hairy vetch 87 16 270
Forage turnip (Pasja) 69 – 136
Purple top turnip 67 – 161
Forage radish (Daikon) 76 – 148
LSD (P = 0.05) 39 – 37
† Estimated N2 from fixation in legumes was calculated by subtracting the average N co‡ Quality parameters: crude protein (CP), neutral detergent fiber (NDF), acid detergenatter digestibility (IVDMD).
31 230 18
forage radish, forage turnip, and purple top turnip had greater(P ≤ 0.05) dry matter yield than hairy vetch and Austrian win-ter pea. The lower dry matter biomass yield of Austrian winterpea and hairy vetch was influenced by the slower stand estab-lishment and subsequent later leaf development than the othercover crops tested in this study. It was expected that hairy vetchand Austrian winter peas would produce lower biomass thanother cover crops since both of these have a prostrate growthcompared with the upright growth of forage pea, turnip, andradish.
Legume cover crops had greater (P ≤ 0.05) N content comparedwith non-legume cover crops, with the exception of forage radishcv. Daikon which had N content similar to Austrian winter pea andhairy vetch (Table 5). Nitrogen content was 116 kg N ha−1 in foragepea while both, Austrian winter pea and hairy vetch had similarN content. There was no difference (P > 0.05) observed among thetwo turnips in N content. In order to have a rough estimate of howmuch of the N in the legumes was from N2 fixation, the average Ncontent in legumes was subtracted from the average N content innon-legumes (Table 5) (Unkovich and Pate, 2000). It was estimatedthat forage pea had approximately 45 kg N ha−1 from biological N-fixation during the 60-day growing period.
Legume cover crops N credit is estimated to be approximately72 kg N ha−1 (Hargrove, 1986), which will be slightly lower than theaverage N content of the three legumes in the study (96 kg N ha−1).As is known, not all N in the cover crop is mineralized, thus usuallythe N credit from the cover crop is 50% or less than the total N con-tent in the plant (Dabney et al., 2001). In hairy vetch, N content wasestimated 88 kg N ha−1, but according Bollero and Bullock (1994)
only about 20 kg N ha−1 of the N in the plant is available to the sub-sequent crop. The subsequent crop in this study was planted no-tillon top of the dead cover crop residue which might have reducedthe amount mineralized to the energy/forage crop.arameters at harvest for six cover crop species averaged across four environments
NDF ADF Ash NDFD IVDMD
320 253 107 780 657228 164 133 849 718269 210 145 828 763173 135 188 901 857167 129 184 906 861192 159 196 910 875
51 42 30 25 106
ntent of legumes from the non-legume crops.t fiber (ADF), ash content, neutral detergent fiber digestibility (NDFD), in vitro dry

3 Crops Research 167 (2014) 31–39
acatscn
3
pid
bn1
pcldtnaq2h
gp(clnidol
twgf
3a
cpt
TBa
6 D.P. Samarappuli et al. / Field
Forage radish N content was 76 kg N ha−1. The soil test taken atll environments was below 18 kg N–NO3 ha−1 before planting theover crop (Table 4). The difference between the soil test and theverage N content in forage radish was 58 kg N ha−1, which suggesthat forage radish roots were able to scavenge N from deep in theoil. This concurs with previous published information that indi-ates forage radish can scavenge N from deep in the soil reducingitrate leaching (Isse et al., 1999; Tonitto et al., 2006).
.2.2. Cover crop forage quality componentsAlthough the objective of this study was not to suggest the
otential of cover crops as forage for grazing, forage yield and qual-ty was analyzed as an indicator of a possible future research in thisirection.
The crude protein content in legume cover crops fluctuatedetween 240 and 270 g kg−1 and was greater (P ≤ 0.05) than inon-legumes cover crop species which fluctuated between 136 and61 g kg−1 (Table 5).
Forage pea had the highest NDF content at 319 g kg−1, while pur-le top turnip the lowest content at 167 g kg−1. Interestingly, NDFontent of forage radish was greater (P ≤ 0.05) than the other non-egumes, but similar to the content of Austrian winter pea. Neutraletergent fiber is negatively correlated to the animal intake poten-ial of that forage. High quality dry forage from legumes wouldormally have less than 390 g kg−1 of NDF (Buxton, 1996). Thusll the cover crops evaluated in this study fell in the high forageuality category. Good quality forage should have an ADF less than90 g kg−1 (Buxton, 1996). All cover crops evaluated in this studyad an ADF less than 290 g kg−1.
The ash, NDFD, and IVDMD of non-leguminous cover crops werereater (P ≤ 0.05) than those of legumes. Forage radish and forageea had highest and lowest ash, NDFD, and IVDMD, respectivelyTable 5). As expected, legumes have excellent forage quality indi-ated by the high CP content and digestibility. Forage Brassicas haveow protein content but are highly digestible and have high mineralutrient content, which is reflected in the higher ash content. Also,
t is important to mention that the high moisture content and lowry matter may limit the usefulness of forage Brassicas as grazingption. Usually, grazing of forage Brassicas requires of a high fiber,ow moisture supplement such as wheat straw or similar.
All the cover crops in this study were frost tolerant and are likelyo provide an excellent late-fall grazing forage resource. Cover cropsere not grazed in this study, but these results indicate there is a
reat potential to use cover crops as late-fall grazing forage, buturther research would be needed.
.3. Effect of cover crops on subsequent energy/forage crop yieldnd quality
The combined analysis of variance indicated the main effect ofover crop was significant for biomass and ethanol yield, cruderotein, N plant content, and plant height. The main effect ofhe energy/forage crop was significant for biomass yield, but only
able 6iomass yield, ethanol yield, nitrogen uptake, crude protein (CP), and plant height of five
nd a check, averaged across four environments, in Fargo and Prosper, ND, in 2010 to 201
Cover crop Biomass yield (Mg ha−1) Ethanol yield (m3 ha−1
Forage pea 12.8 1.6
Austrian winter pea 14.0 1.7
Hairy vetch 13.0 1.6
Forage turnip (Pasja) 11.1 1.4
Purple top turnip 11.7 1.4
Forage radish (Daikon) 11.4 1.4
No cover crop (check) 10.9 1.3
LSD (P = 0.05) 1.5 0.2
Fig. 2. Mean biomass yields of five different forage crops across four environmentsin Fargo and Prosper, ND, in 2011 and 2012. (Columns with same letters are notsignificantly different at P = 0.06).
at P < 0.06, Crude protein, ADF, ash content, and plant heightwere significant (P < 0.05) (data not shown). The environment byenergy/forage crop interaction was significant for all variablesexcept for plant height. The interaction with environment is notdiscussed because environment was considered a random effect.The cover crop by energy/forage crop interaction was significantonly for ash and plant tissue nitrate (P < 0.05).
3.3.1. Energy/forage and cover crops main effect in biomass yield,ethanol yield, N plant content, CP, and plant height
The mean plant biomass yield of forage sorghum and sweetsorghum were greater and different than forage barley, and for-age oat; but not different from maize (Fig. 2). Oat and barley wereexpected to have lower biomass yield than maize and sorghumbecause these crops are cool-season C3 plants with a life cycle muchshorter than those of maize and sorghum, both C4 crops. Further-more, the lack of precipitation in the 2012 growing season may alsohave affected plant growth, thus resulting in less biomass yield inmaize and sorghum. However in this situation, sorghum performedbetter than maize which has been reported before by Shoemakerand Bransby (2011) which explains the greater average biomassyield of sorghum in this study.
Cover crop main effects across forage crops were significant(P ≤ 0.05) for biomass yield, ethanol yield, CP, nitrogen plant con-tent, and plant height (Table 6).
Forage crops planted after plots with forage pea and Austrianwinter pea in the previous fall were taller compared with foragecrops grown on check plots (no cover crop). This result indi-cates that the presence of a leguminous cover crop preceding theenergy/forage crop had a clear effect on plant height when com-pared with the check.
Forage crops planted on leguminous cover crops had approx-imately 2 Mg ha−1 greater biomass yield compared with foragecrops planted on non-leguminous cover crops or no cover cropcheck. Forage crops following Austrian winter pea had the
energy/forage crops (averaged across crops) and preceded by six cover crop species2.
) Nitrogen uptake (kg ha−1) CP (g kg−1) Plant height (m)
118.8 65.6 1.9116.1 61.8 1.9107.8 62.7 1.8
87.1 57.8 1.892.1 59.7 1.887.3 56.1 1.891.2 63.0 1.716.7 4.0 0.1
D.P. Samarappuli et al. / Field Crops Research 167 (2014) 31–39 37
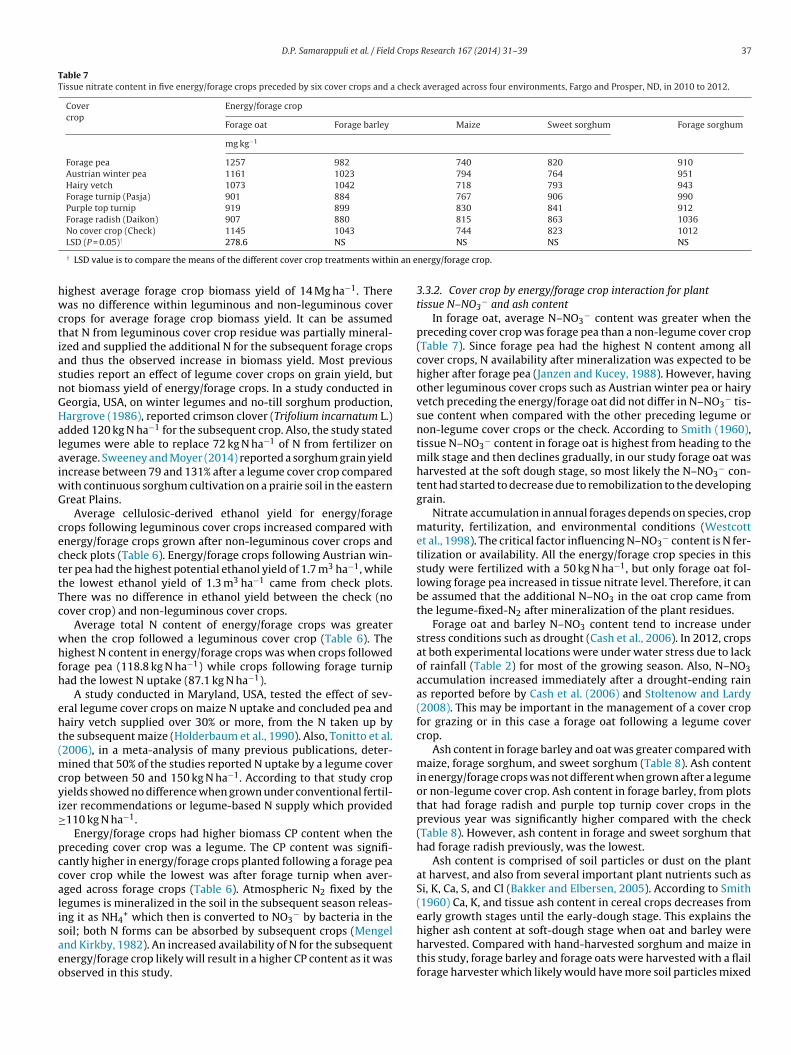
Table 7Tissue nitrate content in five energy/forage crops preceded by six cover crops and a check averaged across four environments, Fargo and Prosper, ND, in 2010 to 2012.
Covercrop
Energy/forage crop
Forage oat Forage barley Maize Sweet sorghum Forage sorghum
mg kg−1
Forage pea 1257 982 740 820 910Austrian winter pea 1161 1023 794 764 951Hairy vetch 1073 1042 718 793 943Forage turnip (Pasja) 901 884 767 906 990Purple top turnip 919 899 830 841 912Forage radish (Daikon) 907 880 815 863 1036No cover crop (Check) 1145 1043 744 823 1012
n an e
hwctiasnGHalaiwG
cecttTc
whfh
eht(mcyi≥
pccalisaeo
LSD (P = 0.05)† 278.6 NS
† LSD value is to compare the means of the different cover crop treatments withi
ighest average forage crop biomass yield of 14 Mg ha−1. Thereas no difference within leguminous and non-leguminous cover
rops for average forage crop biomass yield. It can be assumedhat N from leguminous cover crop residue was partially mineral-zed and supplied the additional N for the subsequent forage cropsnd thus the observed increase in biomass yield. Most previoustudies report an effect of legume cover crops on grain yield, butot biomass yield of energy/forage crops. In a study conducted ineorgia, USA, on winter legumes and no-till sorghum production,argrove (1986), reported crimson clover (Trifolium incarnatum L.)dded 120 kg N ha−1 for the subsequent crop. Also, the study statedegumes were able to replace 72 kg N ha−1 of N from fertilizer onverage. Sweeney and Moyer (2014) reported a sorghum grain yieldncrease between 79 and 131% after a legume cover crop compared
ith continuous sorghum cultivation on a prairie soil in the easternreat Plains.
Average cellulosic-derived ethanol yield for energy/foragerops following leguminous cover crops increased compared withnergy/forage crops grown after non-leguminous cover crops andheck plots (Table 6). Energy/forage crops following Austrian win-er pea had the highest potential ethanol yield of 1.7 m3 ha−1, whilehe lowest ethanol yield of 1.3 m3 ha−1 came from check plots.here was no difference in ethanol yield between the check (noover crop) and non-leguminous cover crops.
Average total N content of energy/forage crops was greaterhen the crop followed a leguminous cover crop (Table 6). Theighest N content in energy/forage crops was when crops followed
orage pea (118.8 kg N ha−1) while crops following forage turnipad the lowest N uptake (87.1 kg N ha−1).
A study conducted in Maryland, USA, tested the effect of sev-ral legume cover crops on maize N uptake and concluded pea andairy vetch supplied over 30% or more, from the N taken up byhe subsequent maize (Holderbaum et al., 1990). Also, Tonitto et al.2006), in a meta-analysis of many previous publications, deter-
ined that 50% of the studies reported N uptake by a legume coverrop between 50 and 150 kg N ha−1. According to that study cropields showed no difference when grown under conventional fertil-zer recommendations or legume-based N supply which provided110 kg N ha−1.
Energy/forage crops had higher biomass CP content when thereceding cover crop was a legume. The CP content was signifi-antly higher in energy/forage crops planted following a forage peaover crop while the lowest was after forage turnip when aver-ged across forage crops (Table 6). Atmospheric N2 fixed by theegumes is mineralized in the soil in the subsequent season releas-ng it as NH4
+ which then is converted to NO3− by bacteria in the
oil; both N forms can be absorbed by subsequent crops (Mengelnd Kirkby, 1982). An increased availability of N for the subsequentnergy/forage crop likely will result in a higher CP content as it wasbserved in this study.
NS NS NS
nergy/forage crop.
3.3.2. Cover crop by energy/forage crop interaction for planttissue N–NO3
− and ash contentIn forage oat, average N–NO3
− content was greater when thepreceding cover crop was forage pea than a non-legume cover crop(Table 7). Since forage pea had the highest N content among allcover crops, N availability after mineralization was expected to behigher after forage pea (Janzen and Kucey, 1988). However, havingother leguminous cover crops such as Austrian winter pea or hairyvetch preceding the energy/forage oat did not differ in N–NO3
− tis-sue content when compared with the other preceding legume ornon-legume cover crops or the check. According to Smith (1960),tissue N–NO3
− content in forage oat is highest from heading to themilk stage and then declines gradually, in our study forage oat washarvested at the soft dough stage, so most likely the N–NO3
− con-tent had started to decrease due to remobilization to the developinggrain.
Nitrate accumulation in annual forages depends on species, cropmaturity, fertilization, and environmental conditions (Westcottet al., 1998). The critical factor influencing N–NO3
− content is N fer-tilization or availability. All the energy/forage crop species in thisstudy were fertilized with a 50 kg N ha−1, but only forage oat fol-lowing forage pea increased in tissue nitrate level. Therefore, it canbe assumed that the additional N–NO3 in the oat crop came fromthe legume-fixed-N2 after mineralization of the plant residues.
Forage oat and barley N–NO3 content tend to increase understress conditions such as drought (Cash et al., 2006). In 2012, cropsat both experimental locations were under water stress due to lackof rainfall (Table 2) for most of the growing season. Also, N–NO3accumulation increased immediately after a drought-ending rainas reported before by Cash et al. (2006) and Stoltenow and Lardy(2008). This may be important in the management of a cover cropfor grazing or in this case a forage oat following a legume covercrop.
Ash content in forage barley and oat was greater compared withmaize, forage sorghum, and sweet sorghum (Table 8). Ash contentin energy/forage crops was not different when grown after a legumeor non-legume cover crop. Ash content in forage barley, from plotsthat had forage radish and purple top turnip cover crops in theprevious year was significantly higher compared with the check(Table 8). However, ash content in forage and sweet sorghum thathad forage radish previously, was the lowest.
Ash content is comprised of soil particles or dust on the plantat harvest, and also from several important plant nutrients such asSi, K, Ca, S, and Cl (Bakker and Elbersen, 2005). According to Smith(1960) Ca, K, and tissue ash content in cereal crops decreases fromearly growth stages until the early-dough stage. This explains thehigher ash content at soft-dough stage when oat and barley were
harvested. Compared with hand-harvested sorghum and maize inthis study, forage barley and forage oats were harvested with a flailforage harvester which likely would have more soil particles mixed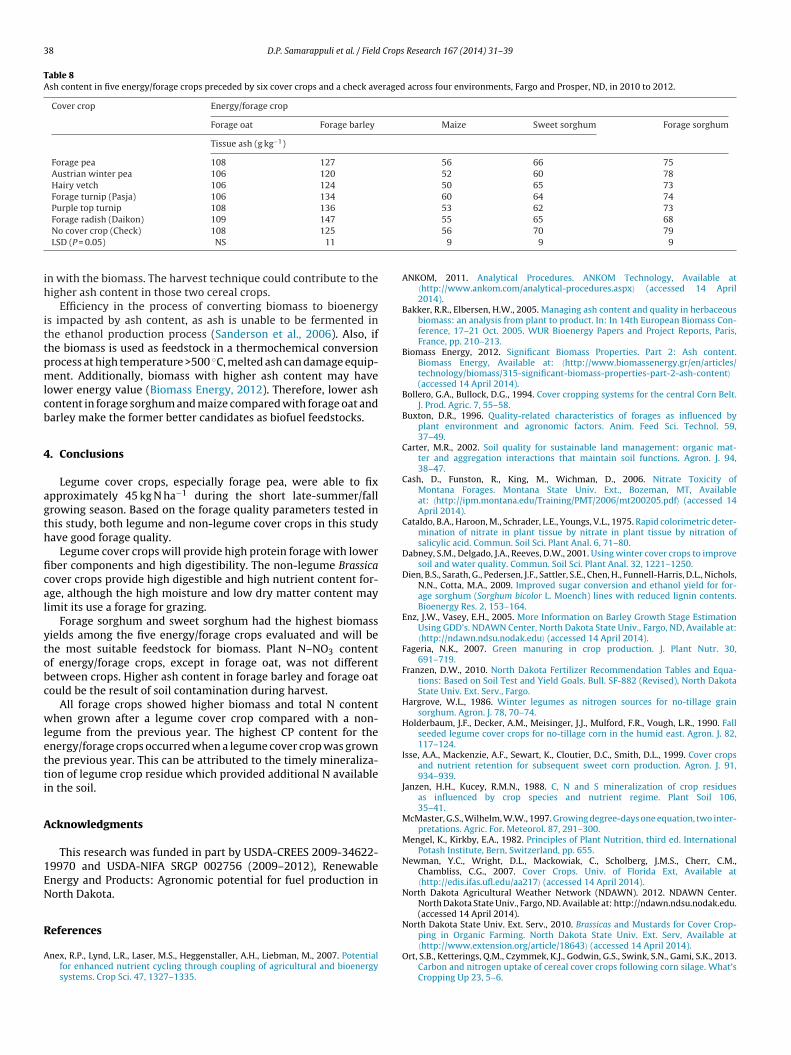
38 D.P. Samarappuli et al. / Field Crops Research 167 (2014) 31–39
Table 8Ash content in five energy/forage crops preceded by six cover crops and a check averaged across four environments, Fargo and Prosper, ND, in 2010 to 2012.
Cover crop Energy/forage crop
Forage oat Forage barley Maize Sweet sorghum Forage sorghum
Tissue ash (g kg−1)
Forage pea 108 127 56 66 75Austrian winter pea 106 120 52 60 78Hairy vetch 106 124 50 65 73Forage turnip (Pasja) 106 134 60 64 74Purple top turnip 108 136 53 62 73
ih
ittpmlcb
4
agth
fical
ytobc
wletti
A
1EN
R
A
Forage radish (Daikon) 109 147
No cover crop (Check) 108 125
LSD (P = 0.05) NS 11
n with the biomass. The harvest technique could contribute to theigher ash content in those two cereal crops.
Efficiency in the process of converting biomass to bioenergys impacted by ash content, as ash is unable to be fermented inhe ethanol production process (Sanderson et al., 2006). Also, ifhe biomass is used as feedstock in a thermochemical conversionrocess at high temperature >500 ◦C, melted ash can damage equip-ent. Additionally, biomass with higher ash content may have
ower energy value (Biomass Energy, 2012). Therefore, lower ashontent in forage sorghum and maize compared with forage oat andarley make the former better candidates as biofuel feedstocks.
. Conclusions
Legume cover crops, especially forage pea, were able to fixpproximately 45 kg N ha−1 during the short late-summer/fallrowing season. Based on the forage quality parameters tested inhis study, both legume and non-legume cover crops in this studyave good forage quality.
Legume cover crops will provide high protein forage with lowerber components and high digestibility. The non-legume Brassicaover crops provide high digestible and high nutrient content for-ge, although the high moisture and low dry matter content mayimit its use a forage for grazing.
Forage sorghum and sweet sorghum had the highest biomassields among the five energy/forage crops evaluated and will behe most suitable feedstock for biomass. Plant N–NO3 contentf energy/forage crops, except in forage oat, was not differentetween crops. Higher ash content in forage barley and forage oatould be the result of soil contamination during harvest.
All forage crops showed higher biomass and total N contenthen grown after a legume cover crop compared with a non-
egume from the previous year. The highest CP content for thenergy/forage crops occurred when a legume cover crop was grownhe previous year. This can be attributed to the timely mineraliza-ion of legume crop residue which provided additional N availablen the soil.
cknowledgments
This research was funded in part by USDA-CREES 2009-34622-9970 and USDA-NIFA SRGP 002756 (2009–2012), Renewablenergy and Products: Agronomic potential for fuel production inorth Dakota.
eferences
nex, R.P., Lynd, L.R., Laser, M.S., Heggenstaller, A.H., Liebman, M., 2007. Potentialfor enhanced nutrient cycling through coupling of agricultural and bioenergysystems. Crop Sci. 47, 1327–1335.
55 65 6856 70 79
9 9 9
ANKOM, 2011. Analytical Procedures. ANKOM Technology, Available at〈http://www.ankom.com/analytical-procedures.aspx〉 (accessed 14 April2014).
Bakker, R.R., Elbersen, H.W., 2005. Managing ash content and quality in herbaceousbiomass: an analysis from plant to product. In: In 14th European Biomass Con-ference, 17–21 Oct. 2005. WUR Bioenergy Papers and Project Reports, Paris,France, pp. 210–213.
Biomass Energy, 2012. Significant Biomass Properties. Part 2: Ash content.Biomass Energy, Available at: 〈http://www.biomassenergy.gr/en/articles/technology/biomass/315-significant-biomass-properties-part-2-ash-content〉(accessed 14 April 2014).
Bollero, G.A., Bullock, D.G., 1994. Cover cropping systems for the central Corn Belt.J. Prod. Agric. 7, 55–58.
Buxton, D.R., 1996. Quality-related characteristics of forages as influenced byplant environment and agronomic factors. Anim. Feed Sci. Technol. 59,37–49.
Carter, M.R., 2002. Soil quality for sustainable land management: organic mat-ter and aggregation interactions that maintain soil functions. Agron. J. 94,38–47.
Cash, D., Funston, R., King, M., Wichman, D., 2006. Nitrate Toxicity ofMontana Forages. Montana State Univ. Ext., Bozeman, MT, Availableat: 〈http://ipm.montana.edu/Training/PMT/2006/mt200205.pdf〉 (accessed 14April 2014).
Cataldo, B.A., Haroon, M., Schrader, L.E., Youngs, V.L., 1975. Rapid colorimetric deter-mination of nitrate in plant tissue by nitrate in plant tissue by nitration ofsalicylic acid. Commun. Soil Sci. Plant Anal. 6, 71–80.
Dabney, S.M., Delgado, J.A., Reeves, D.W., 2001. Using winter cover crops to improvesoil and water quality. Commun. Soil Sci. Plant Anal. 32, 1221–1250.
Dien, B.S., Sarath, G., Pedersen, J.F., Sattler, S.E., Chen, H., Funnell-Harris, D.L., Nichols,N.N., Cotta, M.A., 2009. Improved sugar conversion and ethanol yield for for-age sorghum (Sorghum bicolor L. Moench) lines with reduced lignin contents.Bioenergy Res. 2, 153–164.
Enz, J.W., Vasey, E.H., 2005. More Information on Barley Growth Stage EstimationUsing GDD’s. NDAWN Center, North Dakota State Univ., Fargo, ND, Available at:〈http://ndawn.ndsu.nodak.edu〉 (accessed 14 April 2014).
Fageria, N.K., 2007. Green manuring in crop production. J. Plant Nutr. 30,691–719.
Franzen, D.W., 2010. North Dakota Fertilizer Recommendation Tables and Equa-tions: Based on Soil Test and Yield Goals. Bull. SF-882 (Revised), North DakotaState Univ. Ext. Serv., Fargo.
Hargrove, W.L., 1986. Winter legumes as nitrogen sources for no-tillage grainsorghum. Agron. J. 78, 70–74.
Holderbaum, J.F., Decker, A.M., Meisinger, J.J., Mulford, F.R., Vough, L.R., 1990. Fallseeded legume cover crops for no-tillage corn in the humid east. Agron. J. 82,117–124.
Isse, A.A., Mackenzie, A.F., Sewart, K., Cloutier, D.C., Smith, D.L., 1999. Cover cropsand nutrient retention for subsequent sweet corn production. Agron. J. 91,934–939.
Janzen, H.H., Kucey, R.M.N., 1988. C, N and S mineralization of crop residuesas influenced by crop species and nutrient regime. Plant Soil 106,35–41.
McMaster, G.S., Wilhelm, W.W., 1997. Growing degree-days one equation, two inter-pretations. Agric. For. Meteorol. 87, 291–300.
Mengel, K., Kirkby, E.A., 1982. Principles of Plant Nutrition, third ed. InternationalPotash Institute, Bern, Switzerland, pp. 655.
Newman, Y.C., Wright, D.L., Mackowiak, C., Scholberg, J.M.S., Cherr, C.M.,Chambliss, C.G., 2007. Cover Crops. Univ. of Florida Ext, Available at〈http://edis.ifas.ufl.edu/aa217〉 (accessed 14 April 2014).
North Dakota Agricultural Weather Network (NDAWN). 2012. NDAWN Center.North Dakota State Univ., Fargo, ND. Available at: http://ndawn.ndsu.nodak.edu.(accessed 14 April 2014).
North Dakota State Univ. Ext. Serv., 2010. Brassicas and Mustards for Cover Crop-
ping in Organic Farming. North Dakota State Univ. Ext. Serv, Available at〈http://www.extension.org/article/18643〉 (accessed 14 April 2014).Ort, S.B., Ketterings, Q.M., Czymmek, K.J., Godwin, G.S., Swink, S.N., Gami, S.K., 2013.Carbon and nitrogen uptake of cereal cover crops following corn silage. What’sCropping Up 23, 5–6.

Crops
S
S
S
SS
S
S
S
S
S
D.P. Samarappuli et al. / Field
ainju, U.M., Singh, B.P., 1997. Winter cover crops for sustainable agricultural sys-tems: influence on soil properties, water quality and crop yields. HortSci 2,21–28.
anderson, M.A., Adler, P.R., 2008. Perennial forages as second generation bioenergycrops. Int. J. Mol. Sci. 9, 768–788.
anderson, M.A., Martin, N.P., Adler, P., et al., 2006. Biomass, energy, and indus-trial uses of forages. In: Moore, K.J. (Ed.), Forages: The Science of GrasslandAgriculture. , sixth ed. Blackwell Inc., Ames, IA, pp. 635–647.
AS Institute, 2012. SAS User’s Guide: Statistics. SAS Inst., Cary, NC.hoemaker, C.E., Bransby, D.I., 2011. The Role of Sorghum as a Bioenergy
Feedstock, Available at: 〈http://www.swcs.org/documents/resources/Chapter9 Shoemaker Sorghum C07AF2168027B.pdf〉 (accessed 14 April 2014).
mil, V., 1999. Nitrogen in crop production: an account of global flows. Global Bio-geochem. Cycles 13, 647–662.
mith, D., 1960. Yield and chemical composition of oats as forage with advance inmaturity. Agron. J. 52, 637–639.
toltenow, C., Lardy, G., 2008. Nitrate Poisoning in Livestock. North DakotaState Univ. Ext. Serv., Fargo, ND, Available at 〈http://www.ag.ndsu.edu/pubs/ansci/livestoc/v839.pdf〉 (accessed 15 Aug. 2013).
ullivan, P., 2003. Overview of cover crops and green manures. In: Appropriate
Technology Transfer for Rural Areas (ATTRA), Available at 〈http://www.attra.ncat.org/attra-pub/covercrop.html〉 (accessed 14 April 2014).undermeier, A., 2008. Oilseed Radish Cover Crop. Ohio State Univ. Ext, Availableat 〈http://ohioline.osu.edu/sag-fact/pdf/Oilseed Radish.pdf〉 (accessed 14 April2014).
Research 167 (2014) 31–39 39
Sweeney, D.W., Moyer, J.L., 2014. In-season nitrogen uptake by grain sorghum fol-lowing legume green manures in conservation tillage systems. Agronomy J. 96(2), 510–515.
Tiessen, H., Cuevas, E., Chacon, P., 1994. The role of soil organic matter in sustainingsoil fertility. Nature 371, 783–785.
Tilley, J.M.A., Terry, R.A., 1963. A two stage technique for the in vitro digestion offorage crops. J. Br. Grassl. Soc. 18, 104–111.
Tonitto, C., David, M.B., Drinkwater, L.E., 2006. Replacing bare fallows with covercrops in fertilizer-intensive cropping systems: a meta-analysis of crop yield andN dynamics. Agric. Ecosyst. Environ. 112, 58–72.
Ugarte, G.T.D., He, L., Jensen, K.L., English, B.C., 2010. Expanded ethanol produc-tion: implications for agriculture, water demand, and water quality. BiomassBioenergy 34, 586–596.
Unkovich, M.J., Pate, J.S., 2000. An appraisal of recent field measurements of symbi-otic N2 fixation by annual legumes. Field Crops Res. 65, 211–228.
Web Soil Survey, 2009. National Resources Conservation Service. United States Dep.of Agric., Washington, DC, Available at 〈http://websoilsurvey.nrcs.usda.gov/app/WebSoilSurvey.aspx〉 (accessed 14 April 2014).
Westcott, M.P.W., Cash, S.D., Jacobsen, J.S., Carlson, G.R., Welty, L.E., 1998. Sap anal-ysis for diagnosis of nitrate accumulation in cereal forages. Commun. Soil Sci.
Plant Anal. 29, 1355–1363.Williams, S.M., Weil, R.R., 2004. Crop cover root channels may alleviate soil com-paction effects on soybean crop. Soil Sci. Soc. Am. J. 68, 1403–1409.
Zadoks, J.C., Chang, T.T., Konzak, C.F., 1974. A decimal code for the growth stages ofcereals. Weed Res. 14, 415–421.